Embed Size (px)
Citation preview

1
IMPACT OF REGULATOR NOISE ON ULTRSONIC
FLOW METERS IN NATURAL GAS
MR. IDRIZ KRAJCIN, E.ON Ruhrgas AG
MR. MARTIN UHRIG, E.ON Ruhrgas AG
MR. ANDREW WRATH, SICK (UK) Ltd.
MR. TORALF DIETZ, SICKMAIHAK GmbH
DR: VOLKER HERRMANN, SICKMAIHAK GmbH
ABSTRACT
The impact of pressure regulator noise on the performance of ultrasonic meters has been
discussed for several years now. This is one of the problems still to be solved in ultrasonic
flow metering technology. Engineers have so far attempted to solve the problem by installing
complex spatial pipe arrangements at high costs to reduce interfering noise levels.
The issue has been examined systematically both in field tests in the measuring station of a
transportation pipeline and on the E.ON Ruhrgas high-pressure test facility in Lintorf to
determine the limits of use and potential applications of an ultrasonic gas meter with chordal
path layout in combination with a regulator. The tests made on a 16-inch meter in the
measuring station confirmed that proper functioning of the meter with respect to pressure
differential and flow rate can be guaranteed even under the most extreme conditions.
For further systematic testing on the Lintorf high-pressure test facility, an 8-inch ultrasonic
meter was equipped with two four-path systems working independently of each other. This
approach made it possible to directly compare a system with 210 kHz ultrasonic sensors with
the latest technology of 350 kHz sensors. It was found that the 350 kHz sensors are clearly
less sensitive to interfering noise signals and therefore improve measurement reliability under
worst case conditions. Based on auto-diagnosis parameters such as signal-to-noise ratio and
performance, the meter was confirmed to be capable of clearly detecting and rejecting
disturbed signals.
The paper describes the test results and the information derived with respect to an expanded
use of ultrasonic technology.
1. INTRODUCTION
Pressure regulators are a major source of noise in gas pipelines. In recent years, continuous
optimization of the regulator design has led to a noticeable noise reduction, in particular in
the audible range. However, the amount of noise generated at frequencies above the audible
range may be problematic for ultrasonic gas flow meters. The reliability and accuracy of the
signal transit time detected and thus the quality of the measured value provided by an
ultrasonic gas meter are defined by the minimum signal level differential required between
the sensor sound pulse to be analyzed and the signal interfering with the sound pulse (the
signal-to-noise ratio). The spectral distribution of noise and its dependence on the pressure
difference and flow rate at the regulator are of particular interest in this paper. Fig. 1 is a
general presentation of the situation.
2
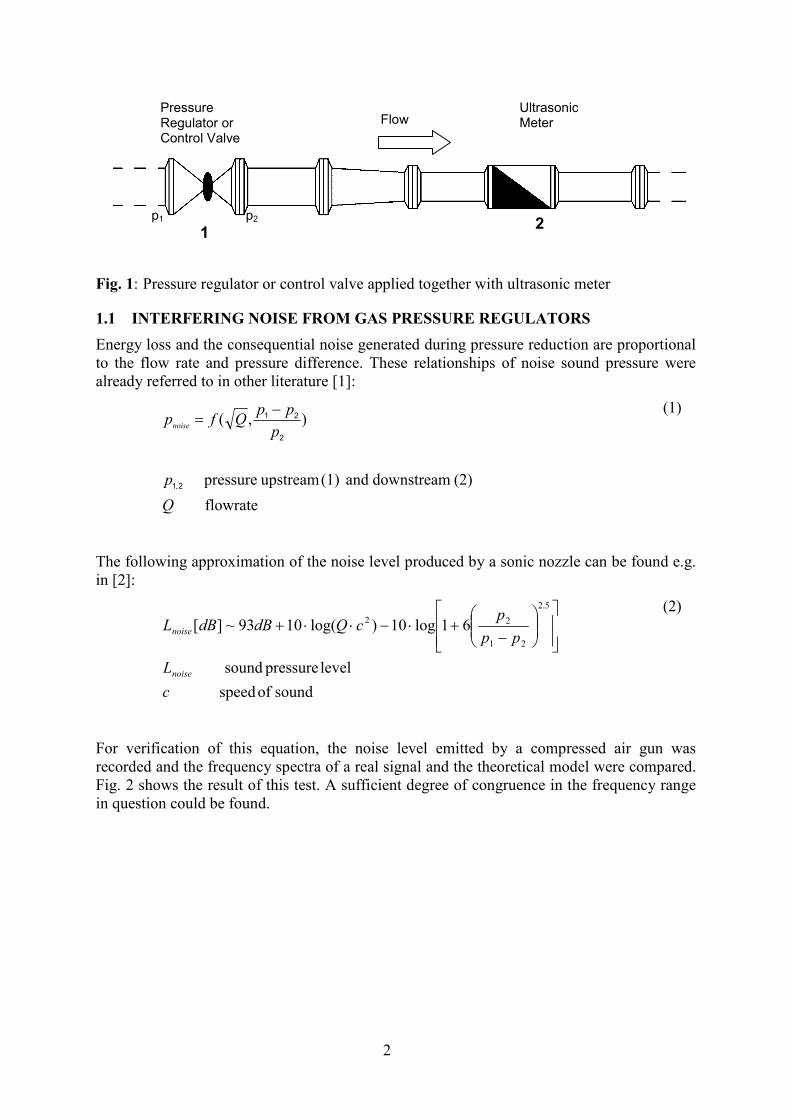
Fig. 1: Pressure regulator or control valve applied together with ultrasonic meter
1.1 INTERFERING NOISE FROM GAS PRESSURE REGULATORS
Energy loss and the consequential noise generated during pressure reduction are proportional
to the flow rate and pressure difference. These relationships of noise sound pressure were
already referred to in other literature [1]:
flowrate
(2)downstreamand(1)upstreampressure
),(
,
Q
p
p
ppQfp
noise
21
2
21−
=
(1)
The following approximation of the noise level produced by a sonic nozzle can be found e.g.
in [2]:
soundofspeed
levelpressuresound
61log10)log(1093~][
5.2
21
22
c
L
pp
pcQdBdBL
noise
noise
−
+⋅−⋅⋅+
(2)
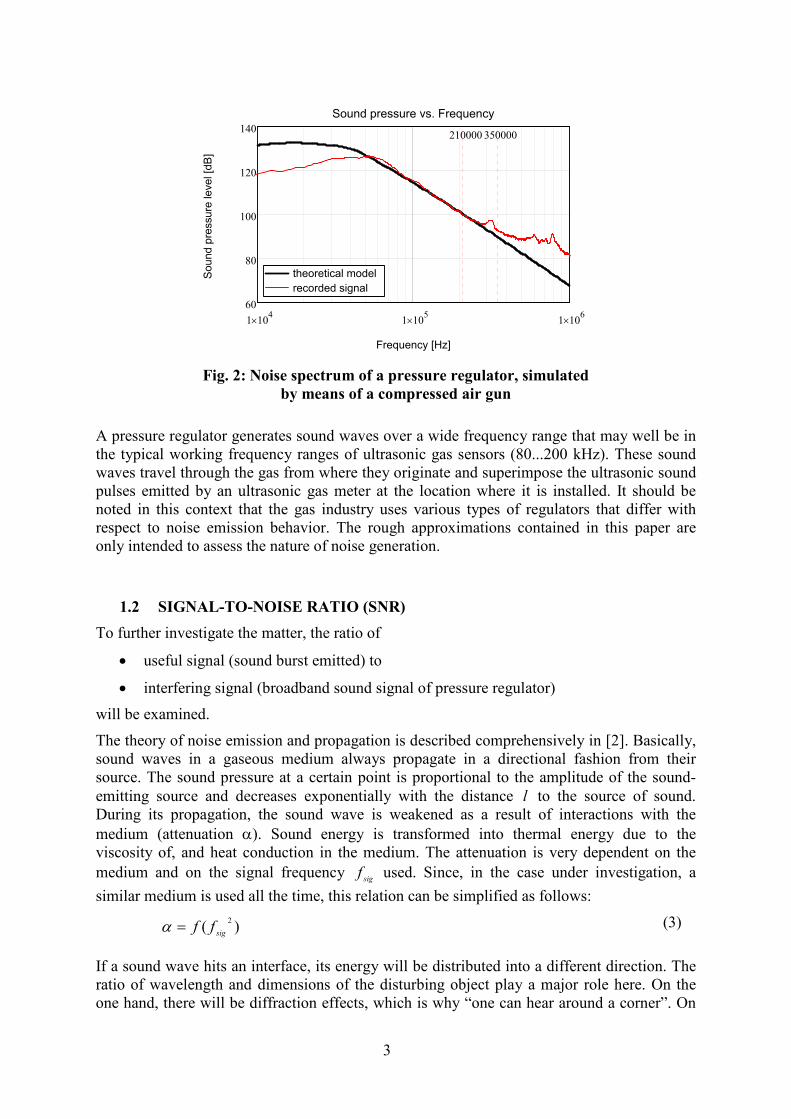
For verification of this equation, the noise level emitted by a compressed air gun was
recorded and the frequency spectra of a real signal and the theoretical model were compared.
Fig. 2 shows the result of this test. A sufficient degree of congruence in the frequency range
in question could be found.
Pressure Regulator or Control Valve
p1 p2
1
Ultrasonic Meter
2
Flow
3
1 104× 1 10
5× 1 106×
60
80
100
120
140
theoretical model
recorded signal
Sound pressure vs. Frequency
Frequency [Hz]
Sound pressure level [dB]
210000 350000
Fig. 2: Noise spectrum of a pressure regulator, simulated
by means of a compressed air gun
A pressure regulator generates sound waves over a wide frequency range that may well be in
the typical working frequency ranges of ultrasonic gas sensors (80...200 kHz). These sound
waves travel through the gas from where they originate and superimpose the ultrasonic sound
pulses emitted by an ultrasonic gas meter at the location where it is installed. It should be
noted in this context that the gas industry uses various types of regulators that differ with
respect to noise emission behavior. The rough approximations contained in this paper are
only intended to assess the nature of noise generation.
1.2 SIGNAL-TO-NOISE RATIO (SNR)
To further investigate the matter, the ratio of
• useful signal (sound burst emitted) to
• interfering signal (broadband sound signal of pressure regulator)
will be examined.
The theory of noise emission and propagation is described comprehensively in [2]. Basically,
sound waves in a gaseous medium always propagate in a directional fashion from their
source. The sound pressure at a certain point is proportional to the amplitude of the sound-
emitting source and decreases exponentially with the distance l to the source of sound.
During its propagation, the sound wave is weakened as a result of interactions with the
medium (attenuation α). Sound energy is transformed into thermal energy due to the
viscosity of, and heat conduction in the medium. The attenuation is very dependent on the
medium and on the signal frequency sigf used. Since, in the case under investigation, a
similar medium is used all the time, this relation can be simplified as follows:
)(2
sigff=α (3)
If a sound wave hits an interface, its energy will be distributed into a different direction. The
ratio of wavelength and dimensions of the disturbing object play a major role here. On the
one hand, there will be diffraction effects, which is why “one can hear around a corner”. On
4
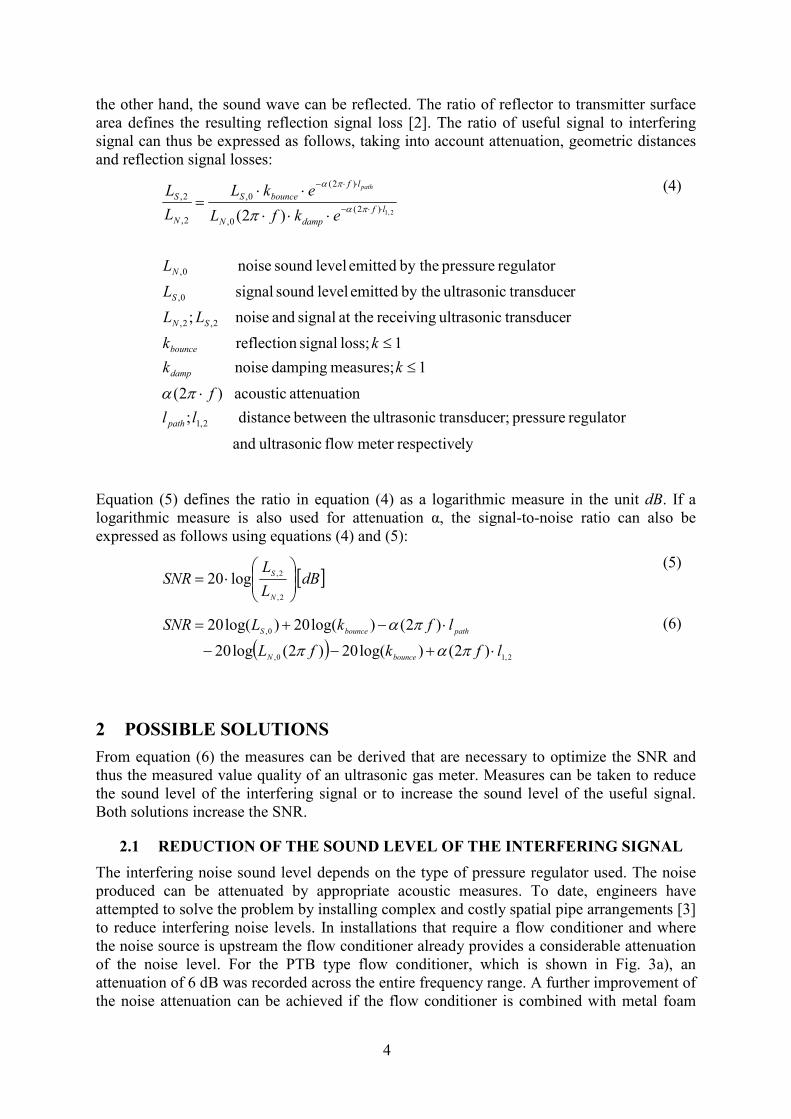
the other hand, the sound wave can be reflected. The ratio of reflector to transmitter surface
area defines the resulting reflection signal loss [2]. The ratio of useful signal to interfering
signal can thus be expressed as follows, taking into account attenuation, geometric distances
and reflection signal losses:
lyrespectivemeter flow ultrasonic and
regulator pressure r; transduceultrasonic ebetween th distance;
nattenuatio acoustic)2(
1measures; damping noise
1loss; signal reflection
r transduceultrasonic receiving at the signal and noise;
r transduceultrasonic by the emitted level sound signal
regulator pressure by the emitted level sound noise
)2(
2,1
2,2,
0,
0,
)2(
0,
)2(
0,
2,
2,
2,1
ll
f
kk
kk
LL
L
L
ekfL
ekL
L
L
path
damp
bounce
SN
S
N
lf
dampN
lf
bounceS
N
Spath
⋅
≤≤
⋅⋅⋅
⋅⋅= ⋅⋅−
⋅⋅−
πα
π πα
πα
(4)
Equation (5) defines the ratio in equation (4) as a logarithmic measure in the unit dB. If a
logarithmic measure is also used for attenuation α, the signal-to-noise ratio can also be
expressed as follows using equations (4) and (5):
[ ]dBL
LSNR
N
S
⋅=
2,
2,log20
(5)
( )2,10,
0,
)2()log(20)2(log20
)2()log(20)log(20
lfkfL
lfkLSNR
bounceN
pathbounceS
⋅+−−
⋅−+=
παπ
πα
(6)
2 POSSIBLE SOLUTIONS
From equation (6) the measures can be derived that are necessary to optimize the SNR and
thus the measured value quality of an ultrasonic gas meter. Measures can be taken to reduce
the sound level of the interfering signal or to increase the sound level of the useful signal.
Both solutions increase the SNR.
2.1 REDUCTION OF THE SOUND LEVEL OF THE INTERFERING SIGNAL
The interfering noise sound level depends on the type of pressure regulator used. The noise
produced can be attenuated by appropriate acoustic measures. To date, engineers have
attempted to solve the problem by installing complex and costly spatial pipe arrangements [3]
to reduce interfering noise levels. In installations that require a flow conditioner and where
the noise source is upstream the flow conditioner already provides a considerable attenuation
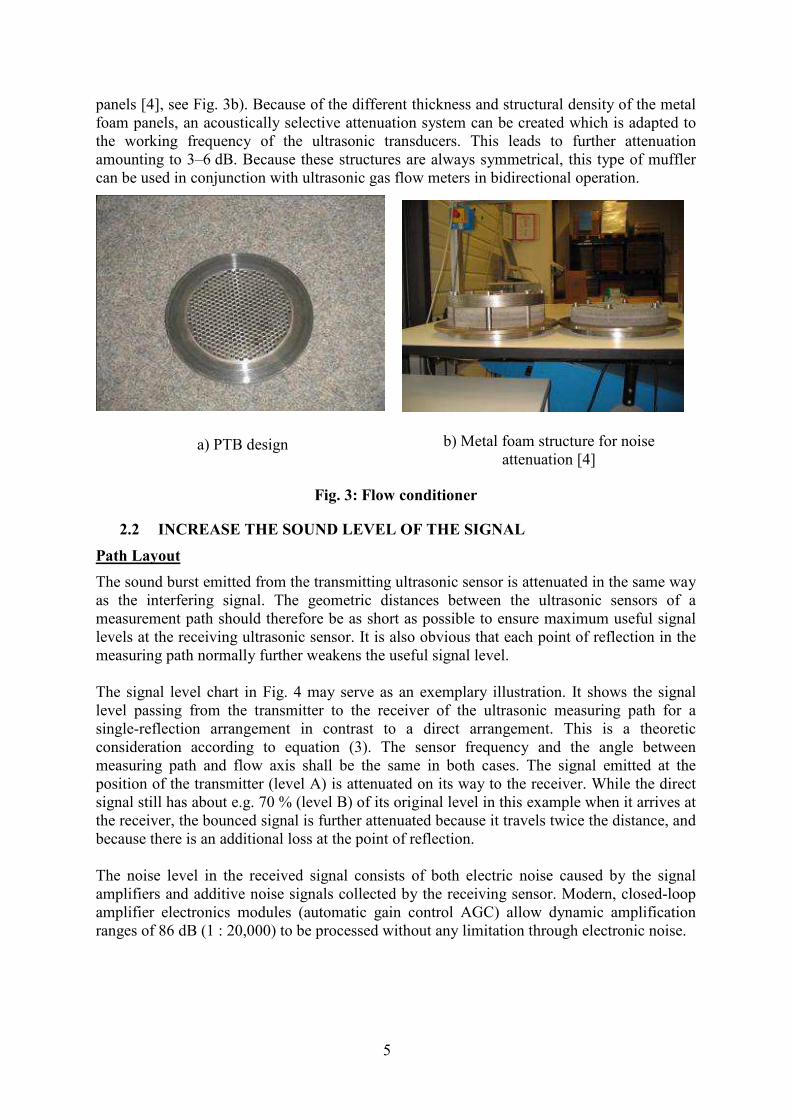
of the noise level. For the PTB type flow conditioner, which is shown in Fig. 3a), an
attenuation of 6 dB was recorded across the entire frequency range. A further improvement of
the noise attenuation can be achieved if the flow conditioner is combined with metal foam
5
panels [4], see Fig. 3b). Because of the different thickness and structural density of the metal
foam panels, an acoustically selective attenuation system can be created which is adapted to
the working frequency of the ultrasonic transducers. This leads to further attenuation
amounting to 3–6 dB. Because these structures are always symmetrical, this type of muffler
can be used in conjunction with ultrasonic gas flow meters in bidirectional operation.
a) PTB design
b) Metal foam structure for noise
attenuation [4]
Fig. 3: Flow conditioner
2.2 INCREASE THE SOUND LEVEL OF THE SIGNAL
Path Layout
The sound burst emitted from the transmitting ultrasonic sensor is attenuated in the same way
as the interfering signal. The geometric distances between the ultrasonic sensors of a
measurement path should therefore be as short as possible to ensure maximum useful signal
levels at the receiving ultrasonic sensor. It is also obvious that each point of reflection in the
measuring path normally further weakens the useful signal level.
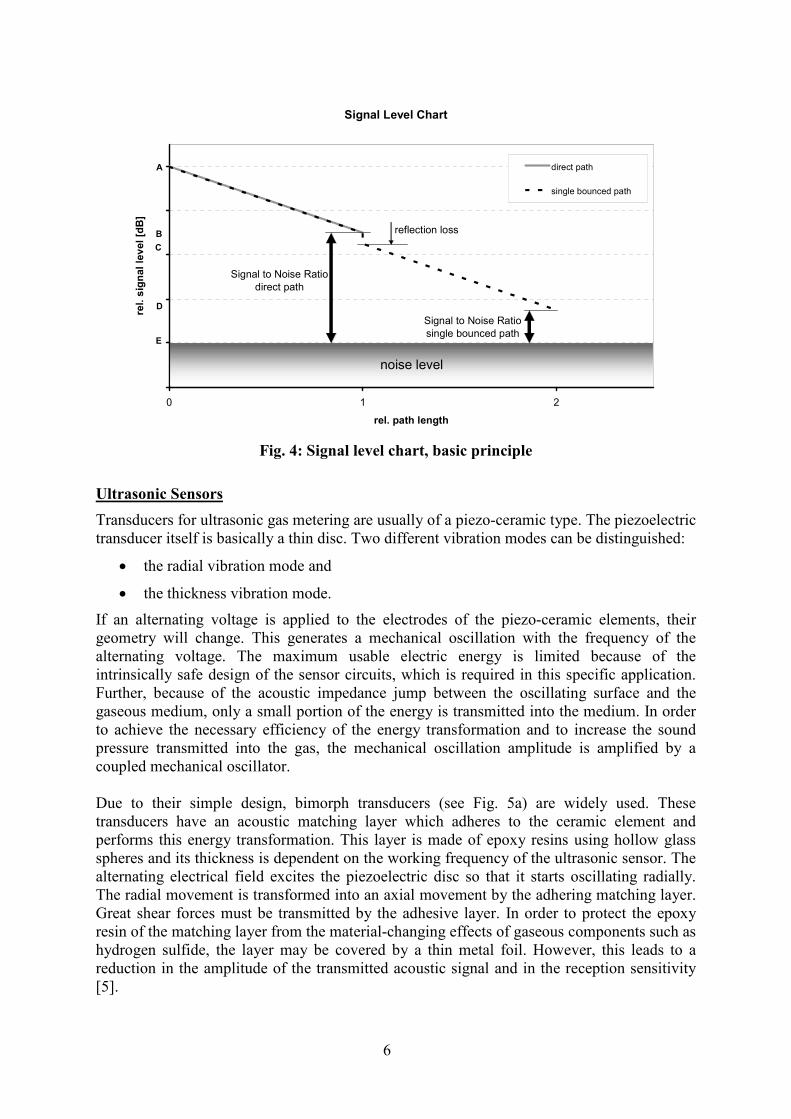
The signal level chart in Fig. 4 may serve as an exemplary illustration. It shows the signal
level passing from the transmitter to the receiver of the ultrasonic measuring path for a
single-reflection arrangement in contrast to a direct arrangement. This is a theoretic
consideration according to equation (3). The sensor frequency and the angle between
measuring path and flow axis shall be the same in both cases. The signal emitted at the
position of the transmitter (level A) is attenuated on its way to the receiver. While the direct
signal still has about e.g. 70 % (level B) of its original level in this example when it arrives at
the receiver, the bounced signal is further attenuated because it travels twice the distance, and
because there is an additional loss at the point of reflection.
The noise level in the received signal consists of both electric noise caused by the signal
amplifiers and additive noise signals collected by the receiving sensor. Modern, closed-loop
amplifier electronics modules (automatic gain control AGC) allow dynamic amplification
ranges of 86 dB (1 : 20,000) to be processed without any limitation through electronic noise.
6
Signal Level Chart
0
0.2
0.4
0.6
0.8
1
0 1 2
rel. path length
rel.
sig
nal
lev
el
[dB
]
direct path
single bounced path
noise level
Signal to Noise Ratio
direct path
Signal to Noise Ratio
single bounced path
reflection loss
A
B
C
D
E
Fig. 4: Signal level chart, basic principle
Ultrasonic Sensors
Transducers for ultrasonic gas metering are usually of a piezo-ceramic type. The piezoelectric
transducer itself is basically a thin disc. Two different vibration modes can be distinguished:
• the radial vibration mode and
• the thickness vibration mode.
If an alternating voltage is applied to the electrodes of the piezo-ceramic elements, their
geometry will change. This generates a mechanical oscillation with the frequency of the
alternating voltage. The maximum usable electric energy is limited because of the
intrinsically safe design of the sensor circuits, which is required in this specific application.
Further, because of the acoustic impedance jump between the oscillating surface and the
gaseous medium, only a small portion of the energy is transmitted into the medium. In order
to achieve the necessary efficiency of the energy transformation and to increase the sound
pressure transmitted into the gas, the mechanical oscillation amplitude is amplified by a
coupled mechanical oscillator.
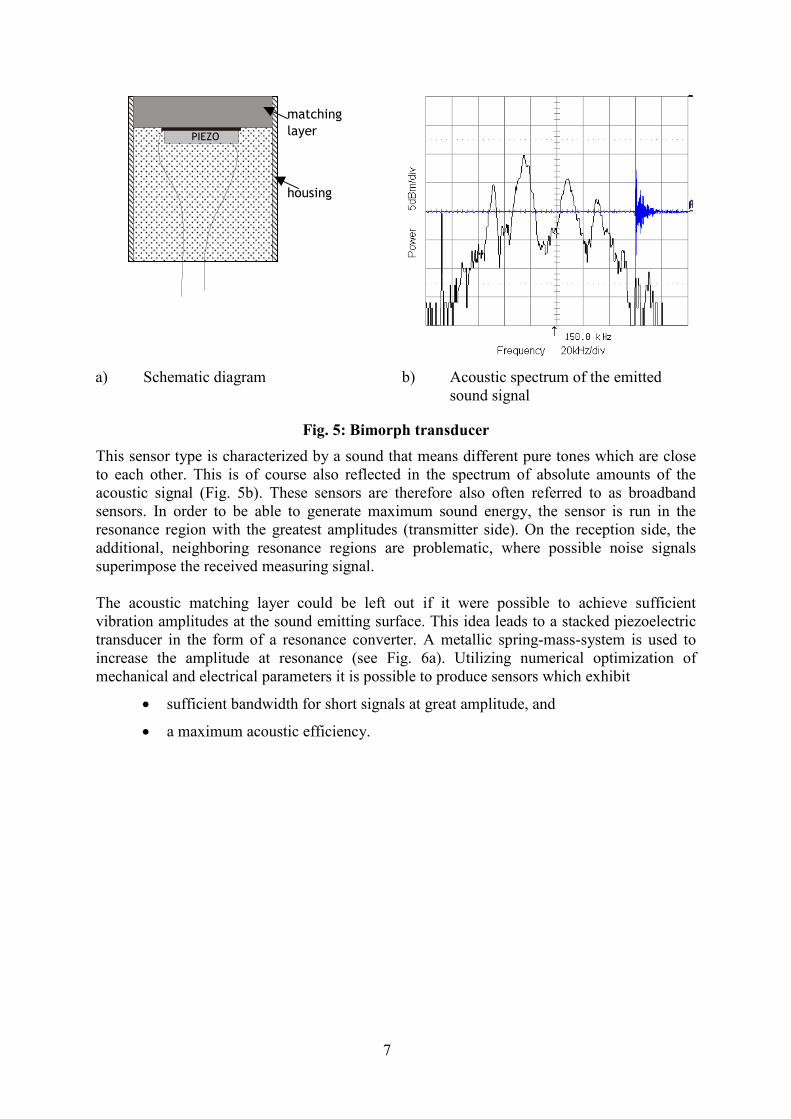
Due to their simple design, bimorph transducers (see Fig. 5a) are widely used. These
transducers have an acoustic matching layer which adheres to the ceramic element and
performs this energy transformation. This layer is made of epoxy resins using hollow glass
spheres and its thickness is dependent on the working frequency of the ultrasonic sensor. The
alternating electrical field excites the piezoelectric disc so that it starts oscillating radially.
The radial movement is transformed into an axial movement by the adhering matching layer.
Great shear forces must be transmitted by the adhesive layer. In order to protect the epoxy
resin of the matching layer from the material-changing effects of gaseous components such as
hydrogen sulfide, the layer may be covered by a thin metal foil. However, this leads to a
reduction in the amplitude of the transmitted acoustic signal and in the reception sensitivity
[5].
7
a) Schematic diagram b) Acoustic spectrum of the emitted
sound signal
Fig. 5: Bimorph transducer
This sensor type is characterized by a sound that means different pure tones which are close
to each other. This is of course also reflected in the spectrum of absolute amounts of the
acoustic signal (Fig. 5b). These sensors are therefore also often referred to as broadband
sensors. In order to be able to generate maximum sound energy, the sensor is run in the
resonance region with the greatest amplitudes (transmitter side). On the reception side, the
additional, neighboring resonance regions are problematic, where possible noise signals
superimpose the received measuring signal.
The acoustic matching layer could be left out if it were possible to achieve sufficient
vibration amplitudes at the sound emitting surface. This idea leads to a stacked piezoelectric
transducer in the form of a resonance converter. A metallic spring-mass-system is used to
increase the amplitude at resonance (see Fig. 6a). Utilizing numerical optimization of
mechanical and electrical parameters it is possible to produce sensors which exhibit
• sufficient bandwidth for short signals at great amplitude, and
• a maximum acoustic efficiency.
PIEZO
matching
layer
housing

8
a) Schematic diagram b) Acoustic spectrum of the emitted
sound signal
Fig. 6: Stacked ultrasonic transducer
This sensor concept is characterized by pure tone resonance mode and a well-defined
working range (see Fig. 6b). There are several advantages:
• the energy is efficiently transformed into acoustic energy,
• the transducer is hermetically sealed and has a full metal housing and
• the bandwidth allows relatively short pulse signals.
Fig. 7: Examples of the two different transducer designs
a) without and b) with the matching layer
Signal Processing
Generally, the SNR may be improved with the help of signal averaging methods or signal
coding. However, specifically in gas flow metering applications the problem is that the signal
path is modulated due to turbulence in the flowing gas. This limits the efficiency of the
averaging and encoding methods. According to the signal theory, correlation methods
provide optimum results in signal transit time measurements, but they cause great
computational load during the digital signal processing.
bolt
resonator
piezo-rings
housing
a) b)
9
If the SNR falls below a minimum threshold defined by the signal processing algorithm,
faulty measurements of the signal transit time may occur. This must be prevented through
adequate monitoring and analysis of the received signal quality, otherwise significant
measuring errors of the gas velocity would occur.
3 NOISE-INSENSITIVE DESIGN OF ULTRASONIC GAS FLOW
METERS
Based on the previous general explanations, optimization criteria applicable to ultrasonic gas
flow meters near pressure regulators can easily be derived:
1. Selection of ultrasonic sensors with a working frequency which is as high as possible
because
• the noise signals emitted by the pressure regulator are significantly weakened at
frequencies greater than 100 kHz;
• the frequency-dependent attenuation of the noise signals at a given distance to the
pressure regulator causes lower noise levels compared with lower frequencies.
2. Selection of ultrasonic sensors which work within a very defined frequency range which
minimizes the collection of undesired noise signal components.
3. Selection of a suitable path layout in order to ensure a maximum ultrasonic burst signal
level.
4. Selection of a signal processing method which
• makes only minimum demands on the required SNR;
• securely avoids faulty triggering and thus prevents biased measuring results.
The aforementioned requirements have been considered in the development of a noise-
insensitive ultrasonic gas flow meter (FLOWSIC600) tested in this paper. The ultrasonic
transducers mounted in the meter are stacked type transducers, which work according to the
thickness vibration principle, and are available with working frequencies of 210 kHz and
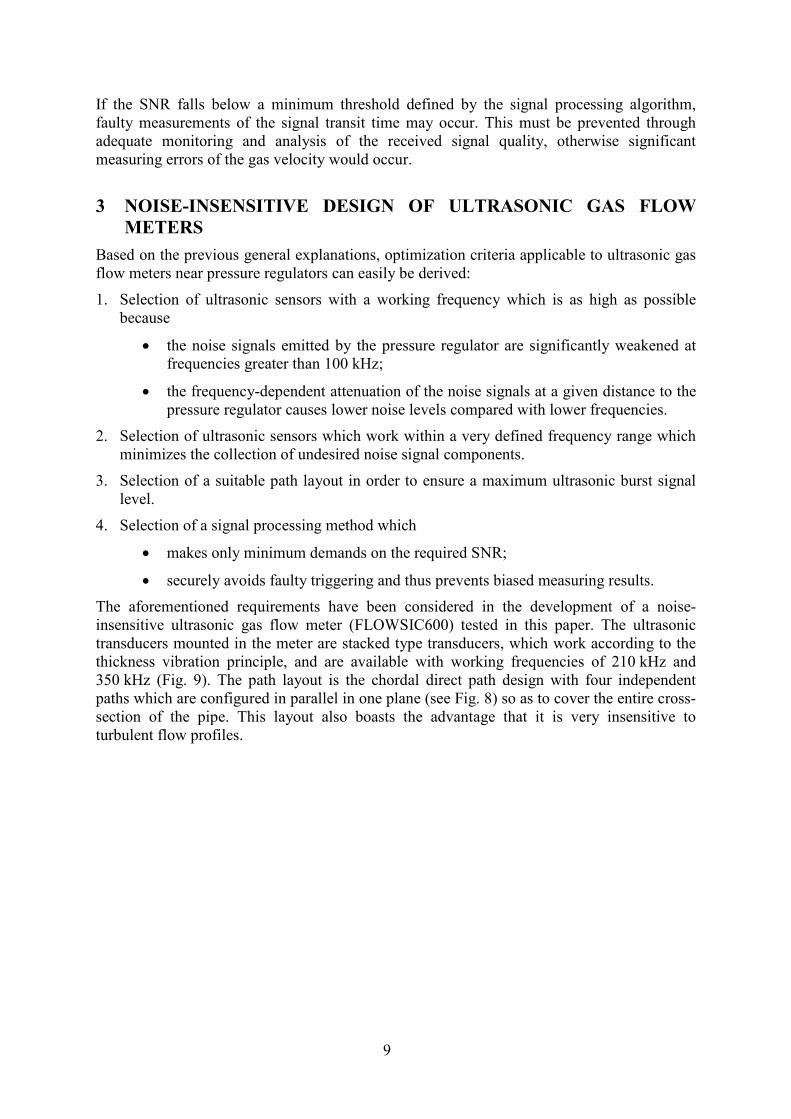
350 kHz (Fig. 9). The path layout is the chordal direct path design with four independent
paths which are configured in parallel in one plane (see Fig. 8) so as to cover the entire cross-
section of the pipe. This layout also boasts the advantage that it is very insensitive to
turbulent flow profiles.
10
Fig. 8: Chordal 4-path layout of the
FLOWSIC600
Fig. 9: High performance ultrasonic transducer,
a)210 kHz and b) 350 kHz
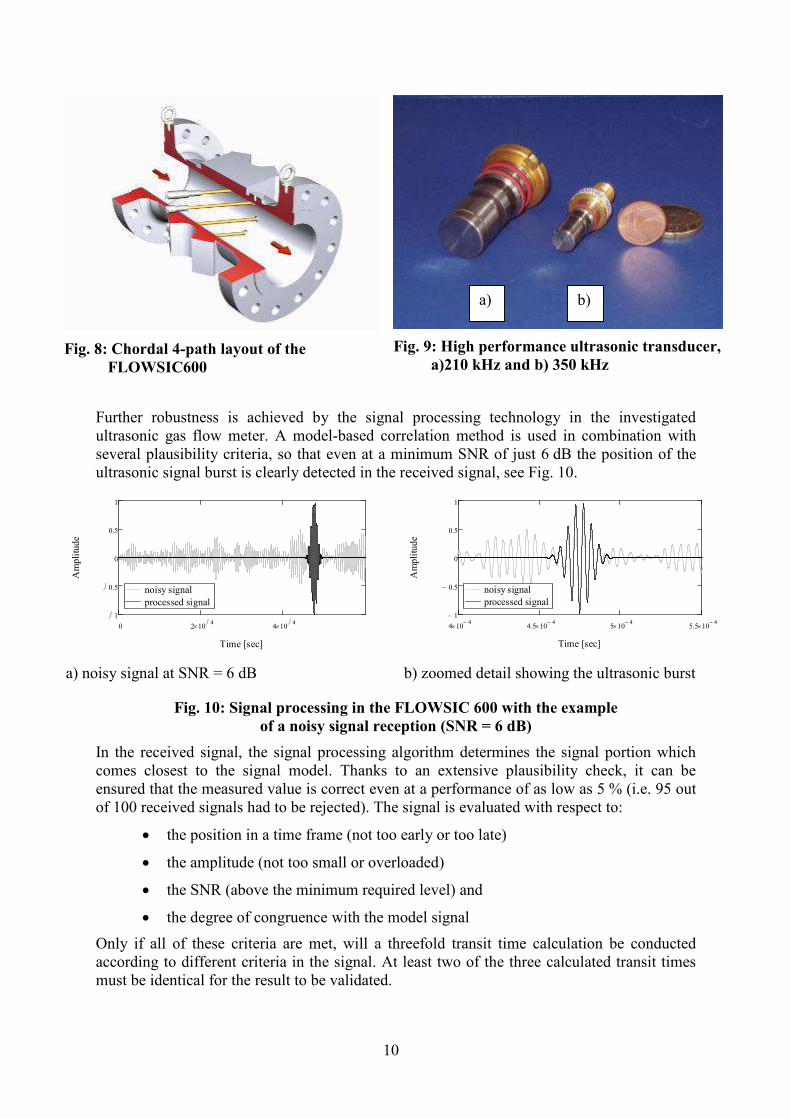
Further robustness is achieved by the signal processing technology in the investigated
ultrasonic gas flow meter. A model-based correlation method is used in combination with
several plausibility criteria, so that even at a minimum SNR of just 6 dB the position of the
ultrasonic signal burst is clearly detected in the received signal, see Fig. 10.
0 2 104× 4 10
4×1
0.5
0
0.5
1
noisy signal
processed signal
Time [sec]
Am
pli
tude
4 104−× 4.5 10
4−× 5 104−× 5.5 10
4−×1−
0.5−
0
0.5
1
noisy signal
processed signal
Time [sec]
Am
pli
tude
a) noisy signal at SNR = 6 dB b) zoomed detail showing the ultrasonic burst
Fig. 10: Signal processing in the FLOWSIC 600 with the example
of a noisy signal reception (SNR = 6 dB)
In the received signal, the signal processing algorithm determines the signal portion which
comes closest to the signal model. Thanks to an extensive plausibility check, it can be
ensured that the measured value is correct even at a performance of as low as 5 % (i.e. 95 out
of 100 received signals had to be rejected). The signal is evaluated with respect to:
• the position in a time frame (not too early or too late)
• the amplitude (not too small or overloaded)
• the SNR (above the minimum required level) and
• the degree of congruence with the model signal
Only if all of these criteria are met, will a threefold transit time calculation be conducted
according to different criteria in the signal. At least two of the three calculated transit times
must be identical for the result to be validated.
a) b)
11
4 RESULTS
This chapter presents results obtained from tests on the high-pressure test rig of E.ON
Ruhrgas in Lintorf and at an M&R station. On the high-pressure test rig, the already proven
210 kHz sensors were directly compared with the newly developed 350 kHz sensors under
near-field conditions. At an M&R station, a FLOWSIC600 fitted with 210 kHz sensors was
tested under most extreme conditions for a regulator installed downstream of a flow meter.
4.1 210 KHZ SENSORS VS. 350 KHZ SENSORS TESTED AT THE LINTORF
FACILITY
E.ON Ruhrgas operates a high-pressure test facility used for testing and optimizing bulk gas
metering instruments. While the pigsarTM
test rig [6] of E.ON Ruhrgas is used for high-
precision calibration and verification of meters with natural gas under high pressure, the
Lintorf facility [7] serves to
• test new measurement instruments under near-field conditions,
• investigate special factors influencing measurement behavior,
• optimize measurement instruments and other components,
• solve operational problems,
• examine new measurement technologies.
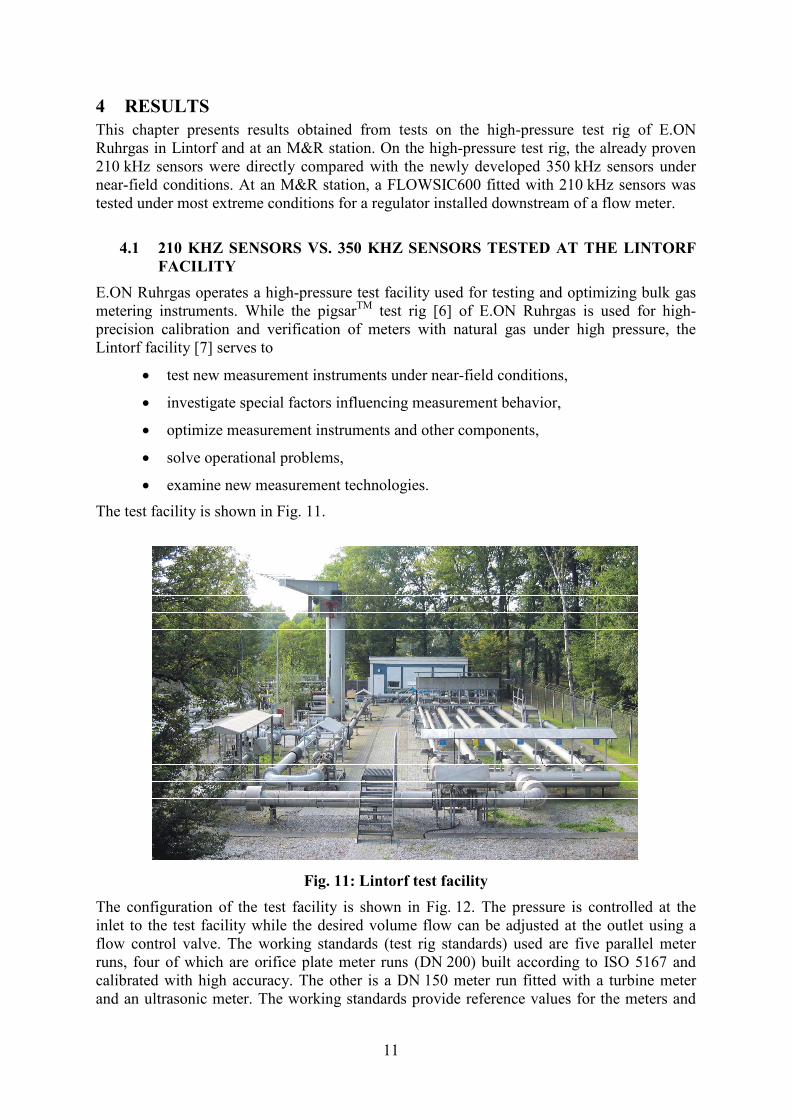
The test facility is shown in Fig. 11.
Fig. 11: Lintorf test facility
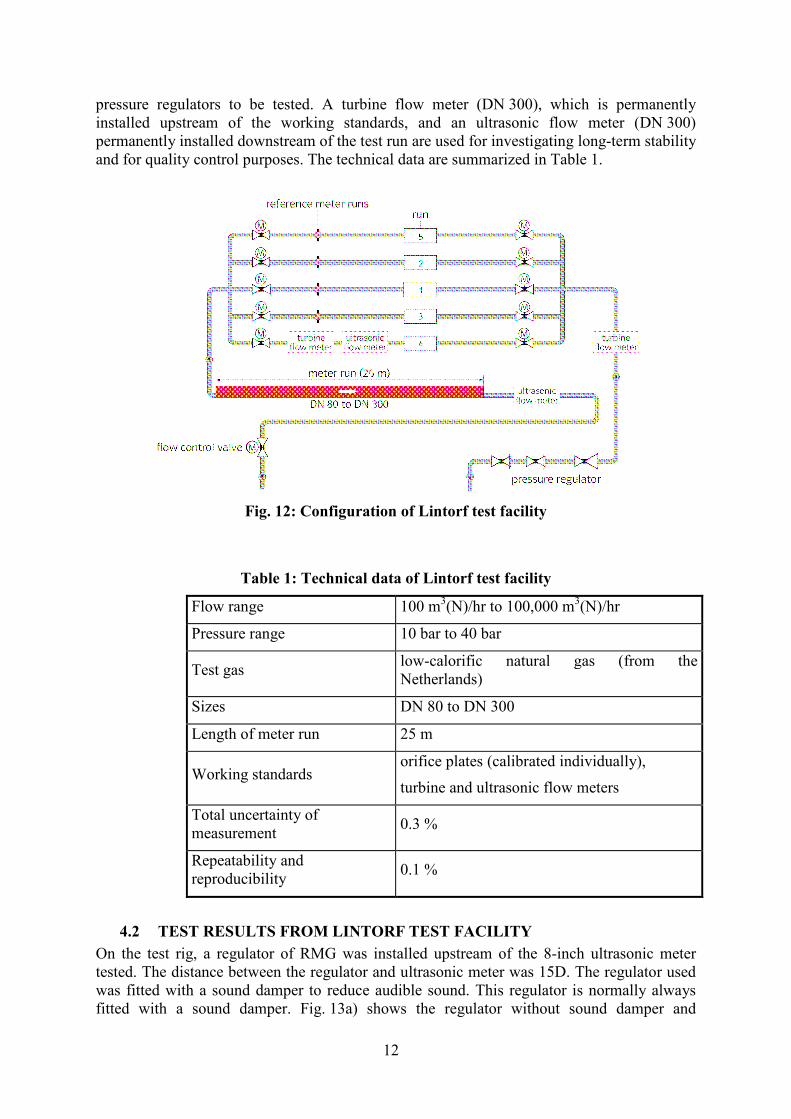
The configuration of the test facility is shown in Fig. 12. The pressure is controlled at the
inlet to the test facility while the desired volume flow can be adjusted at the outlet using a
flow control valve. The working standards (test rig standards) used are five parallel meter
runs, four of which are orifice plate meter runs (DN 200) built according to ISO 5167 and
calibrated with high accuracy. The other is a DN 150 meter run fitted with a turbine meter
and an ultrasonic meter. The working standards provide reference values for the meters and
12
pressure regulators to be tested. A turbine flow meter (DN 300), which is permanently
installed upstream of the working standards, and an ultrasonic flow meter (DN 300)
permanently installed downstream of the test run are used for investigating long-term stability
and for quality control purposes. The technical data are summarized in Table 1.
Fig. 12: Configuration of Lintorf test facility
4.2 TEST RESULTS FROM LINTORF TEST FACILITY
On the test rig, a regulator of RMG was installed upstream of the 8-inch ultrasonic meter
tested. The distance between the regulator and ultrasonic meter was 15D. The regulator used
was fitted with a sound damper to reduce audible sound. This regulator is normally always
fitted with a sound damper. Fig. 13a) shows the regulator without sound damper and
Table 1: Technical data of Lintorf test facility
Flow range 100 m3(N)/hr to 100,000 m
3(N)/hr
Pressure range 10 bar to 40 bar
Test gas low-calorific natural gas (from the
Netherlands)
Sizes DN 80 to DN 300
Length of meter run 25 m
Working standards orifice plates (calibrated individually),
turbine and ultrasonic flow meters
Total uncertainty of
measurement 0.3 %
Repeatability and
reproducibility 0.1 %
13
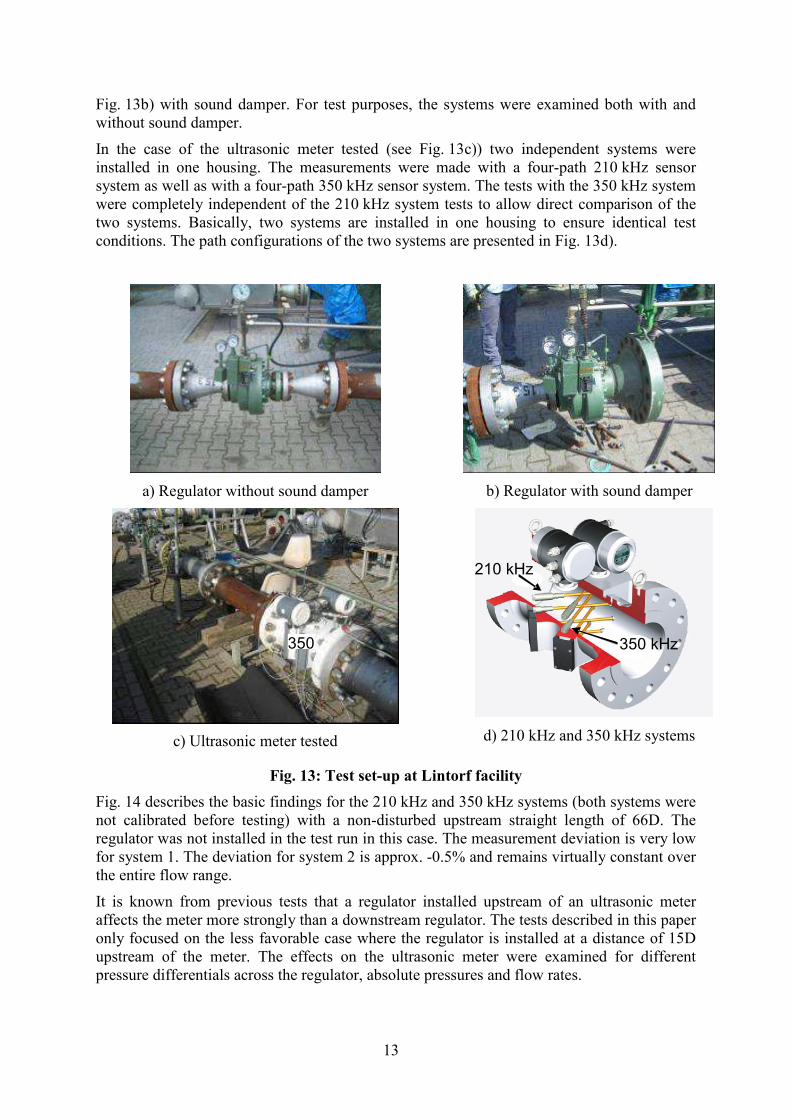
Fig. 13b) with sound damper. For test purposes, the systems were examined both with and
without sound damper.
In the case of the ultrasonic meter tested (see Fig. 13c)) two independent systems were
installed in one housing. The measurements were made with a four-path 210 kHz sensor
system as well as with a four-path 350 kHz sensor system. The tests with the 350 kHz system
were completely independent of the 210 kHz system tests to allow direct comparison of the
two systems. Basically, two systems are installed in one housing to ensure identical test
conditions. The path configurations of the two systems are presented in Fig. 13d).
a) Regulator without sound damper
b) Regulator with sound damper
c) Ultrasonic meter tested
210 kHz
350 kHz
d) 210 kHz and 350 kHz systems
Fig. 13: Test set-up at Lintorf facility
Fig. 14 describes the basic findings for the 210 kHz and 350 kHz systems (both systems were
not calibrated before testing) with a non-disturbed upstream straight length of 66D. The
regulator was not installed in the test run in this case. The measurement deviation is very low
for system 1. The deviation for system 2 is approx. -0.5% and remains virtually constant over
the entire flow range.
It is known from previous tests that a regulator installed upstream of an ultrasonic meter
affects the meter more strongly than a downstream regulator. The tests described in this paper
only focused on the less favorable case where the regulator is installed at a distance of 15D
upstream of the meter. The effects on the ultrasonic meter were examined for different
pressure differentials across the regulator, absolute pressures and flow rates.
350

14
-1,5
-1,0
-0,5
0,0
0,5
1,0
1,5
0 500 1000 1500 2000 2500 3000 3500
Flow [m³/h]
Devia
tio
n [
%]
System 1, 13 bar System 2, 13bar
System 1, 25 bar System 2, 25 bar
System 1, 40 bar System 2, 40 bar
Fig. 14: Basic findings with 60D undisturbed upstream straight length
(system 1: 210 kHz sensors, system 2: 350 kHz sensors)
In a first step, the regulator was installed together with the associated sound damper. The
interfering effects can be very well evaluated based on the SNR. Fig. 15 directly compares
the SNRs of the two systems for a pressure reduction from 40 bar to 10 bar across the
regulator. It is obvious that the 350 kHz sensors are significantly less sensitive to the
interfering sound emitted by the regulator than the 210 kHz sensors. With this high decrease
in pressure and the extreme flow velocities (> 25 m/s), the conventional sensor system
(210 kHz) is already at its stability limits. The meter did not fail but operation of the
configuration tested in a situation where the pressure loss is so extreme should be limited to
maximum flow velocities of 20 .. 25 m/s.
0
10
20
30
40
50
0 15 30 45
Velocity [m/s]
SN
R [
dB
]
outer path up outer path dow n
inner path up inner path dow n
0
10
20
30
40
50
0 15 30 45
Velocity [m/s]
SN
R [
dB
]
outer path up outer path dow n
inner path up inner path dow n
a) 210 kHz system b) 350 kHz system
Fig. 15: SNR as a function of velocity for a pressure reduction from 40 bar to 10 bar
across a regulator with sound damper
While they are influenced by the noise emitted by the regulator, the 350 kHz sensor signals
are still sufficiently strong with respect to the SNR. It would be possible to use the meter for
this extreme pressure reduction and the high flow rates in the configuration tested without
15
further measures such as sound attenuation being required. The measurement error was
within + 0.5 % for both systems. As the 350 kHz sensors were prototypes, the tests focused
on sensitivity to interfering noise rather than on measurement accuracy at this stage of
development.
The results plotted in Fig. 15 were obtained for the greatest pressure differential across the
regulator that was feasible on the test rig (10 bar to 40 bar test pressure). No further tests
were made for this configuration as the results obtained were good and the 350 kHz sensor
system proved robust to interfering noise and was sufficiently strong under most extreme
conditions.
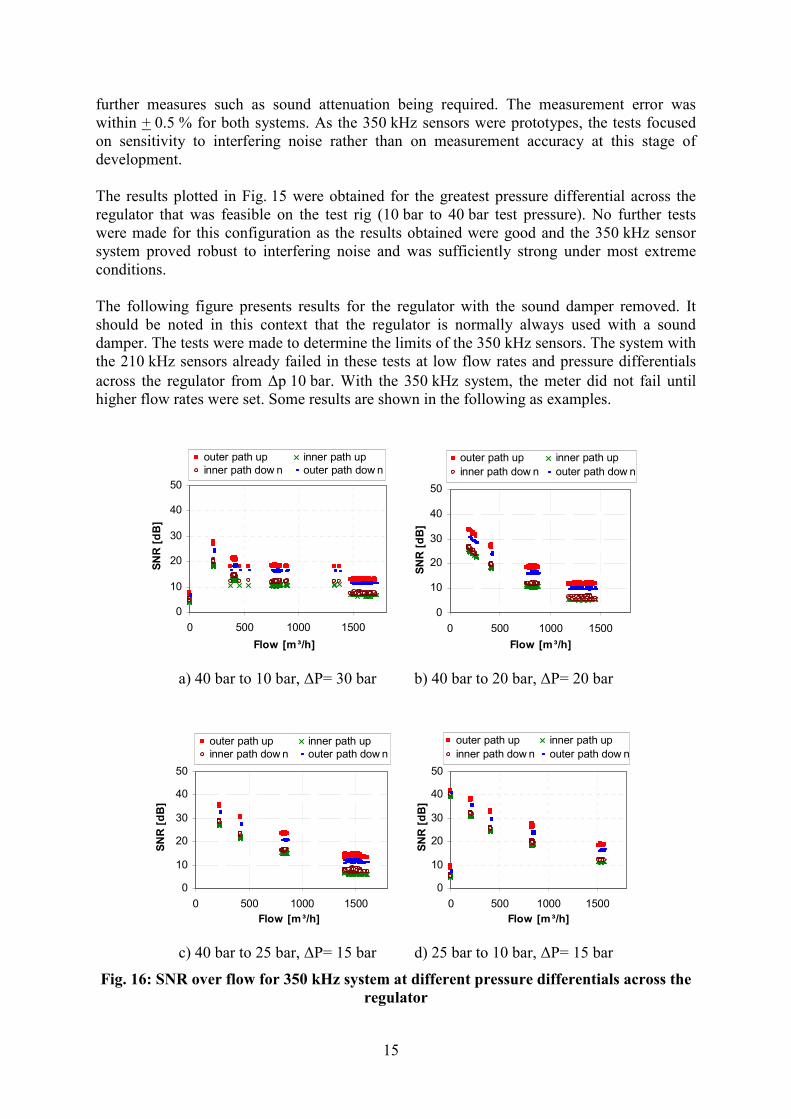
The following figure presents results for the regulator with the sound damper removed. It
should be noted in this context that the regulator is normally always used with a sound
damper. The tests were made to determine the limits of the 350 kHz sensors. The system with
the 210 kHz sensors already failed in these tests at low flow rates and pressure differentials
across the regulator from ∆p 10 bar. With the 350 kHz system, the meter did not fail until
higher flow rates were set. Some results are shown in the following as examples.
0
10
20
30
40
50
0 500 1000 1500
Flow [m³/h]
SN
R [
dB
]
outer path up inner path up
inner path dow n outer path dow n
0
10
20
30
40
50
0 500 1000 1500
Flow [m³/h]
SN
R [
dB
]
outer path up inner path up
inner path dow n outer path dow n
a) 40 bar to 10 bar, ∆P= 30 bar b) 40 bar to 20 bar, ∆P= 20 bar
0
10
20
30
40
50
0 500 1000 1500
Flow [m³/h]
SN
R [
dB
]
outer path up inner path up
inner path dow n outer path dow n
0
10
20
30
40
50
0 500 1000 1500
Flow [m³/h]
SN
R [
dB
]
outer path up inner path up
inner path dow n outer path dow n
c) 40 bar to 25 bar, ∆P= 15 bar d) 25 bar to 10 bar, ∆P= 15 bar
Fig. 16: SNR over flow for 350 kHz system at different pressure differentials across the
regulator
16
It would not be possible to use the meter in this configuration without sound damper for the
operating parameters tested here. It is also obvious that the 350 kHz sensors are a significant
improvement compared to the 210 kHz sensors. Fig. 16 shows how the ultrasonic meter is
influenced by flow rate, pressure differential and absolute pressure. The SNR falls, though
with a decreasing gradient, as flow rate increases. It is also clear from Fig. 16a), Fig. 16b) and
Fig. 16c) that the influencing effect is only slightly stronger for higher pressure differentials.
Fig. 16c) and Fig. 16d) plot the results for a constant pressure differential of 15 bar and
different absolute pressures. The influencing effect is stronger in this case for higher
pressures (40 bar to 25 bar) than for lower pressures (25 bar to 10 bar) at the same pressure
differential of ∆P=15 bar. Testing at low absolute pressures and extrapolation of the results to
higher pressures is considered critical.
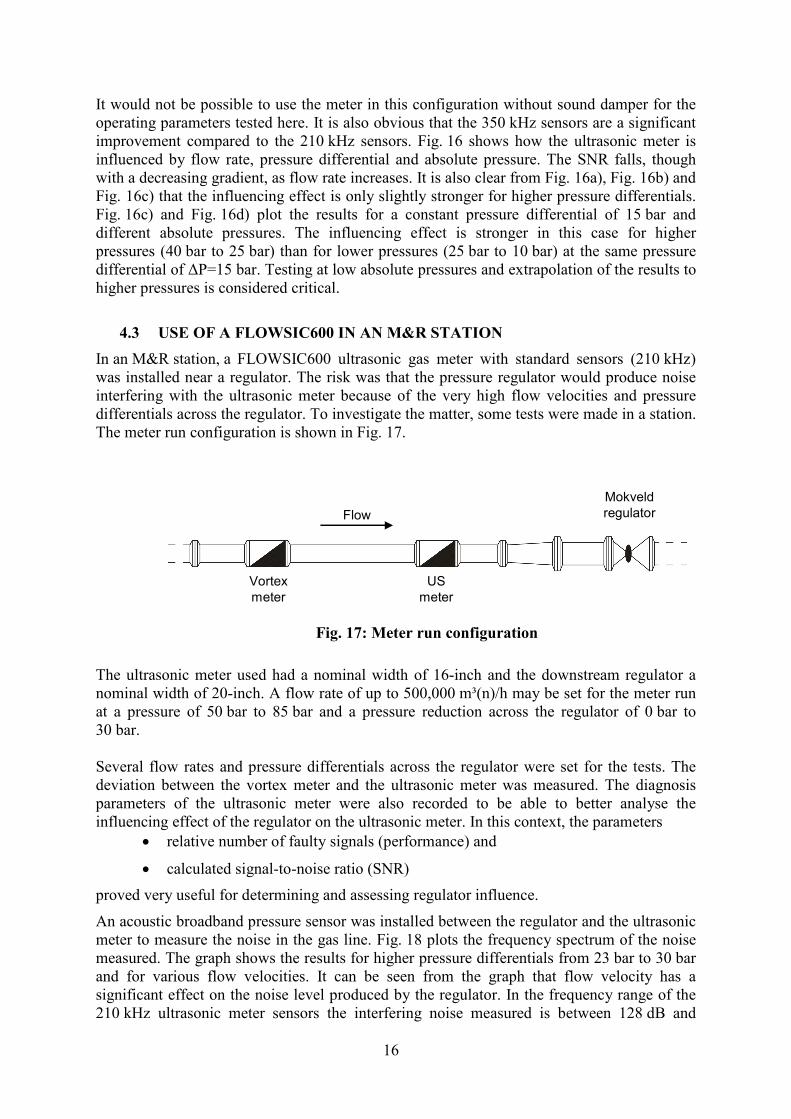
4.3 USE OF A FLOWSIC600 IN AN M&R STATION
In an M&R station, a FLOWSIC600 ultrasonic gas meter with standard sensors (210 kHz)
was installed near a regulator. The risk was that the pressure regulator would produce noise
interfering with the ultrasonic meter because of the very high flow velocities and pressure
differentials across the regulator. To investigate the matter, some tests were made in a station.
The meter run configuration is shown in Fig. 17.
The ultrasonic meter used had a nominal width of 16-inch and the downstream regulator a
nominal width of 20-inch. A flow rate of up to 500,000 m³(n)/h may be set for the meter run
at a pressure of 50 bar to 85 bar and a pressure reduction across the regulator of 0 bar to
30 bar.
Several flow rates and pressure differentials across the regulator were set for the tests. The
deviation between the vortex meter and the ultrasonic meter was measured. The diagnosis
parameters of the ultrasonic meter were also recorded to be able to better analyse the
influencing effect of the regulator on the ultrasonic meter. In this context, the parameters
• relative number of faulty signals (performance) and
• calculated signal-to-noise ratio (SNR)
proved very useful for determining and assessing regulator influence.
An acoustic broadband pressure sensor was installed between the regulator and the ultrasonic
meter to measure the noise in the gas line. Fig. 18 plots the frequency spectrum of the noise
measured. The graph shows the results for higher pressure differentials from 23 bar to 30 bar
and for various flow velocities. It can be seen from the graph that flow velocity has a
significant effect on the noise level produced by the regulator. In the frequency range of the
210 kHz ultrasonic meter sensors the interfering noise measured is between 128 dB and
Flow
Vortex
meter
US
meter
Mokveld
regulator
Fig. 17: Meter run configuration
17
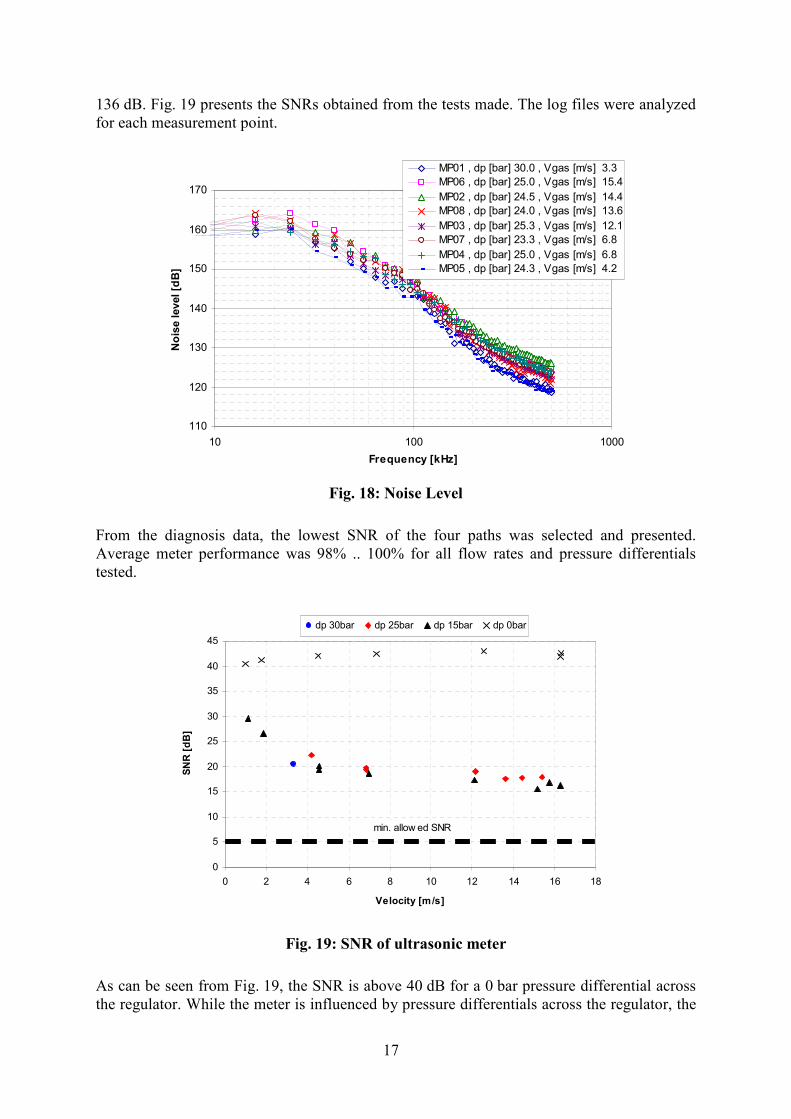
136 dB. Fig. 19 presents the SNRs obtained from the tests made. The log files were analyzed
for each measurement point.
110
120
130
140
150
160
170
10 100 1000
Frequency [kHz]
No
ise level [d
B]
MP01 , dp [bar] 30.0 , Vgas [m/s] 3.3
MP06 , dp [bar] 25.0 , Vgas [m/s] 15.4
MP02 , dp [bar] 24.5 , Vgas [m/s] 14.4
MP08 , dp [bar] 24.0 , Vgas [m/s] 13.6
MP03 , dp [bar] 25.3 , Vgas [m/s] 12.1
MP07 , dp [bar] 23.3 , Vgas [m/s] 6.8
MP04 , dp [bar] 25.0 , Vgas [m/s] 6.8
MP05 , dp [bar] 24.3 , Vgas [m/s] 4.2
Fig. 18: Noise Level
From the diagnosis data, the lowest SNR of the four paths was selected and presented.
Average meter performance was 98% .. 100% for all flow rates and pressure differentials
tested.
0
5
10
15
20
25
30
35
40
45
0 2 4 6 8 10 12 14 16 18
Velocity [m/s]
SN
R [
dB
]
dp 30bar dp 25bar dp 15bar dp 0bar
min. allow ed SNR
Fig. 19: SNR of ultrasonic meter
As can be seen from Fig. 19, the SNR is above 40 dB for a 0 bar pressure differential across
the regulator. While the meter is influenced by pressure differentials across the regulator, the
18
distance to the critical 5 dB level is still sufficient to ensure reliable measurements even for
the extreme conditions tested here. It is also obvious that the effect of flow velocity at
constant pressure differentials on the SNR and thus on meter performance increases, though
with a decreasing curve gradient, as velocity increases.
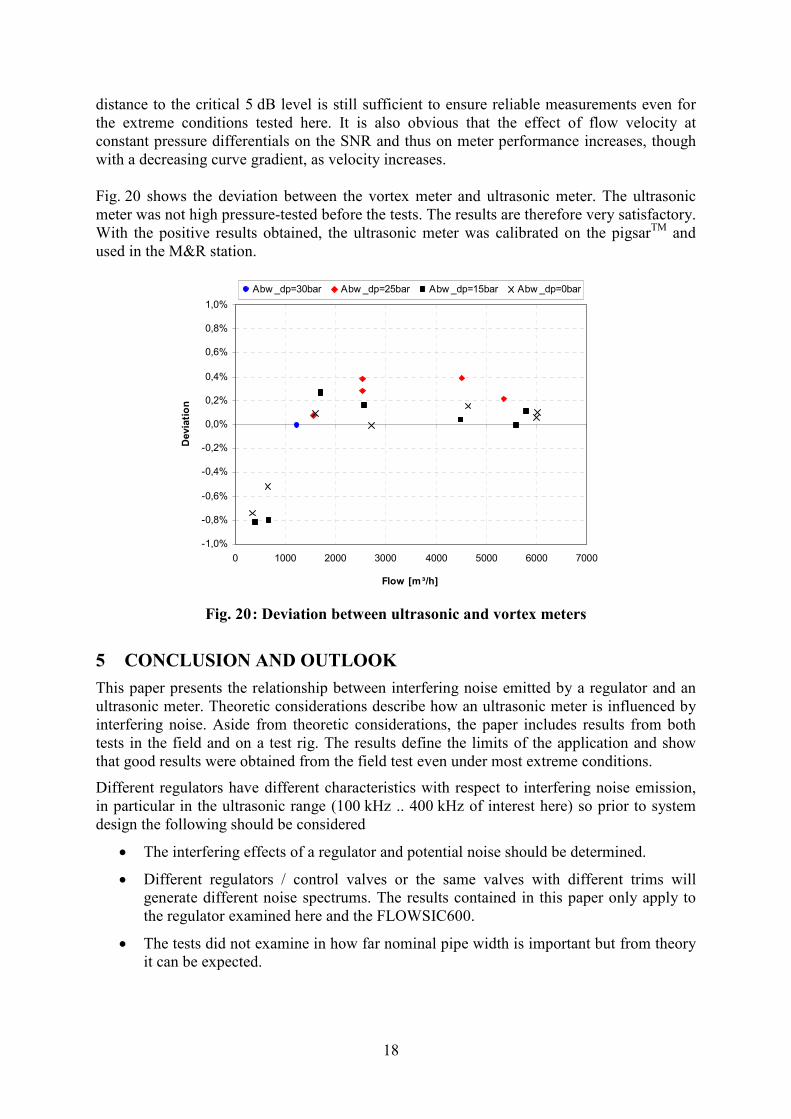
Fig. 20 shows the deviation between the vortex meter and ultrasonic meter. The ultrasonic
meter was not high pressure-tested before the tests. The results are therefore very satisfactory.
With the positive results obtained, the ultrasonic meter was calibrated on the pigsarTM
and
used in the M&R station.
-1,0%
-0,8%
-0,6%
-0,4%
-0,2%
0,0%
0,2%
0,4%
0,6%
0,8%
1,0%
0 1000 2000 3000 4000 5000 6000 7000
Flow [m³/h]
Devia
tio
n
Abw _dp=30bar Abw _dp=25bar Abw _dp=15bar Abw _dp=0bar
Fig. 20 : Deviation between ultrasonic and vortex meters
5 CONCLUSION AND OUTLOOK
This paper presents the relationship between interfering noise emitted by a regulator and an
ultrasonic meter. Theoretic considerations describe how an ultrasonic meter is influenced by
interfering noise. Aside from theoretic considerations, the paper includes results from both
tests in the field and on a test rig. The results define the limits of the application and show
that good results were obtained from the field test even under most extreme conditions.
Different regulators have different characteristics with respect to interfering noise emission,
in particular in the ultrasonic range (100 kHz .. 400 kHz of interest here) so prior to system
design the following should be considered
• The interfering effects of a regulator and potential noise should be determined.
• Different regulators / control valves or the same valves with different trims will
generate different noise spectrums. The results contained in this paper only apply to
the regulator examined here and the FLOWSIC600.
• The tests did not examine in how far nominal pipe width is important but from theory
it can be expected.
19
The tests focused on the more critical application where the regulator is installed upstream of
the meter. Under these conditions, the meter reached its limits. But, compared to the proven
210 kHz sensors, the newly developed 350 kHz sensors again considerably improved the
meter's robustness to interfering noise in the pipelines and good results were obtained under
the extreme conditions tested. The 350 kHz system did not reach its limits until it was
installed and tested with the modified regulator. For this the built-in sound damper was
removed. But this situation is not to be expected for practical operations as the regulator is
normally always used in standard configuration. The tests show that the FLOWIC600 may be
used in installation configurations that have not been possible using traditional ultrasonic
technology.
The 350 kHz sensors will be optimized further and again tested on the Lintorf test rig. The
solution with the 350 kHz sensors is an attractive alternative to the use of noise-reducing
devices such as sound dampers, flow straighteners or complex piping. Development work
will therefore be continued.
6 REFERENCES
[1] Warner K., Zanker K., “Noise Reduction in Ultrasonic Gas Flow Measurement”, 4th
International Symposium on Fluid Flow Measurement, Denver, Colorado USA, 1999
[2] Müller G., Möser M., “Taschenbuch der Technischen Akustik“, published by
Springer, 2003
[3] ISO/CD 17089, “Measurement of flow in closed conduits – ultrasonic meters for gas;
meters for custody transfer and allocation measurement”
[4] www.koetter-consulting.com
[5] Smørgrav et al., “Developments Of Transducer Technology And Reciprocity In
Ultrasonic Flow Meters”, 5th International South East Asia Hydrocarbon Flow
Measurement Workshop, 2006
[6] pigsarTM
, high-pressure test facility and national standard for natural gas in Germany,
www.pigsar.de
[7] High-pressure test facility of E.ON Ruhrgas in Lintorf, www.eon-ruhrgas.com