Embed Size (px)
Citation preview

WP-2014-049
Impact of Public Spending on Health and Education of Children inIndia: A Panel Data Simultaneous Equation Model
Runu Bhakta
Indira Gandhi Institute of Development Research, MumbaiDecember 2014
http://www.igidr.ac.in/pdf/publication/WP-2014-049.pdf

Impact of Public Spending on Health and Education of Children inIndia: A Panel Data Simultaneous Equation Model
Runu BhaktaIndira Gandhi Institute of Development Research (IGIDR)
General Arun Kumar Vaidya Marg Goregaon (E), Mumbai- 400065, INDIA
Email(corresponding author): [email protected]
AbstractThe basic objective of the study is to examine the impact of public expenditure on health and education
after incorporating the linkages between health status of children and their educational achievements in
India. This study has developed a simultaneous equation model among health and education of children,
and public expenditure on these sectors. Three stage least squares technique is applied to get consistent
and efficient estimates of the system. The results show that bad health status among children, captured
by high IMR, is responsible to have lower enrolment rates and high dropout rates in primary level. In
addition, public expenditure on Supplementary Nutritional Program has indirect positive impact on
education through the improvements in health status of children whereas additional expenditure on
elementary education has positive impact on enrolment rates, but at diminishing rate. Moreover, public
expenditure on elementary education has greater impact on enrolment as compared to dropout rates.
Keywords: Public Expenditure, Education, Health, SEM, 3SLS, IMR, GER, NER, Dropout Rates
JEL Code: H51, H52, I18, I28, C33
Acknowledgements:
This paper is a part of my Ph.D. thesis. I would like to express my special gratitude to Prof. A. Ganesh Kumar for his guidance,
invaluable advice and for sparing his precious time for discussions. The comments and suggestions provided by him were
extremely helpful.

1
Impact of Public Spending on Health and Education of Children in India:
A Panel Data Simultaneous Equation Model
Runu Bhakta
Indira Gandhi Institute of Development Research (IGIDR)
General Arun Kumar Vaidya Marg
Goregaon (E), Mumbai- 400065, INDIA
Email(corresponding author): [email protected]
Abstract
The basic objective of the study is to examine the impact of public expenditure on health and education after
incorporating the linkages between health status of children and their educational achievements in India. This
study has developed a simultaneous equation model among health and education of children, and public
expenditure on these sectors. Three stage least squares technique is applied to get consistent and efficient
estimates of the system. The results show that bad health status among children, captured by high IMR, is
responsible to have lower enrolment rates and high dropout rates in primary level. In addition, public
expenditure on Supplementary Nutritional Program has indirect positive impact on education through the
improvements in health status of children whereas additional expenditure on elementary education has positive
impact on enrolment rates, but at diminishing rate. Moreover, public expenditure on elementary education has
greater impact on enrolment as compared to dropout rates.
Keywords: Public Expenditure, Education, Health, SEM, 3SLS, IMR, GER, NER, Dropout Rates
JEL Code: H51, H52, I18, I28, C33
Acknowledgements: This paper is a part of my Ph.D. thesis. I would like to express my special gratitude to
Prof. A. Ganesh Kumar for his guidance, invaluable advice and for sparing his precious time for discussions.
The comments and suggestions provided by him were extremely helpful.

2
Impact of Public Spending on Health and Education of Children in India: A Panel Data
Simultaneous Equation Model
Runu Bhakta
1. Introduction
“Investing fully in children today will ensure the well-being and productivity of future generations for
decades to come.”
-- Carol Bellamy
India is far behind several developing countries in terms of both educational attainment and health
status of children. In terms of educational attainment, the net enrolment rate (NER) reached 94% in
2010 (table 1) which was satisfactory according to the international standard (The World Bank,
2010)1. But the dropout rate of primary schooling is only 34% in the cohort 2002-11 (table 1) which is
considerably higher than the Millennium Development Goals (MDG) in 2015. Notably, the primary
dropout rate in India is higher in India as compared to Bangladesh. Despite the gradual progress in
enrolment rates, high dropout rate in the elementary level remains an important concern in the way to
achieve 100% completion rate in primary education.
Table 1: Education and health status of children
While concerning the health status of children, child mortality rates are considerably high in India as
compared to other developing countries like Sri Lanka, China and Bangladesh (table 1). In 2010, both
infant mortality rate (IMR) and under-5 mortality rate (U5MR) was three times higher in India than
its‟ neighbouring countries Sri Lanka and China. In addition, Bangladesh is doing much better than
India in terms of both IMR and U5MR. In 2010, IMR was 48 per thousand live births in India which
is likely to be 44 against the MDG target of 27 in 2015. The U5MR has declined to 63 in 2010 and
expected to decline further to 52 in 2015 which is 10 points greater than the MDG target (Planning
Commission of India, 2010)2.
Both education and health are considered as priority sectors in almost all five year plans in India.
Although total public expenditure in these sectors has increased significantly over time, per capita
expenditure in real terms has stagnated for several states, which may have been responsible for such
slow progress in these sectors. In 2010, the share of public expenditure on education and health are
1 http://data.worldbank.org/indicator/SE.PRM.NENR
2 http://planningcommission.gov.in/data/datatable/index.php?data=datatab
CountriesPrimary GER
(%) 2011
Primary NER
(%) 2010
Primary
Dropout Rate
(%) 2002-11
IMR 2010 U5MR 2010 MMR 2012
Norway 99 99 - 3 3 7
Sri Lanka 99 94 1.4 14 17 35
China 111 - - 16 18 37
India 118 94 34.2 48 63 200
Bangladesh - 92 33.8 38 48 240
Source: World Health Statistics 2012, WHO, Human Development Report 2013, UNDP and The World Bank
3
3.1 and 1.2 per cent of GDP respectively (The World Bank, 2013)3 which are significantly lower than
in developed countries. In addition, there prevail wide disparities in per capita real public
expenditures in both health and educational sectors across states (as shown in figure 1) which may
have led to the existing regional disparities in India.
Figure 1: Per capita real public expenditure on health and education across states in 2011
In this regard, several studies have estimated the impact of public expenditure on health and education
for India and other countries. They present contradictory results in terms of the effectiveness of such
public expenditures on these social sectors. For the health sector, Filmer and Pritchett (1999) and
Deolalikar (2005) find no significant impact of current health expenditure on child mortality rates. In
contrary, Mayer and Sarin (2005), Bhalotra (2007) and Farahani et al. (2009) argue in favour of
increasing public spending on health care to achieve lower child mortality rates. For the education
sector, Gupta et al. (2002) find that both the total public expenditure and composition of public
expenditure in different level of education play important role in determining the enrolment rate,
persistence rate and dropout rates whereas De and Endow (2008) conclude that changes in education
expenditure improve access, but retention and learning achievements remain very low in less
developed states.
These studies are typically undertaken in isolation for health and education separately using macro
level data. They ignore the inter-relationship that exists between health and education of children.
Micro-level studies show that child health status affects child education outcomes (Moock and Lestie,
1986; Chutikul, 1986; Jamison, 1986; Bouis, 1992; Behrman and Lavy, 1994; Glewwe and Jacoby,
1995; Behrman, 1996), which may have a significant role in determining the relationship while
estimating the impact of public spending of education. Thus existing studies give biased estimates by
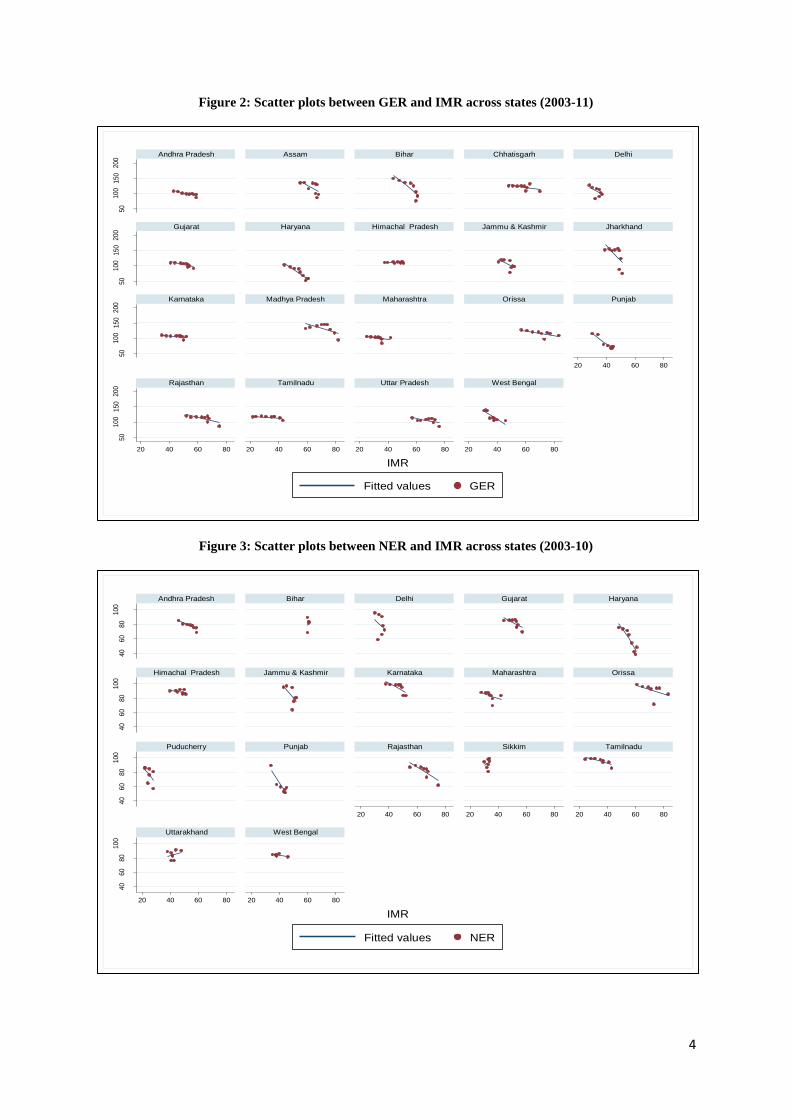
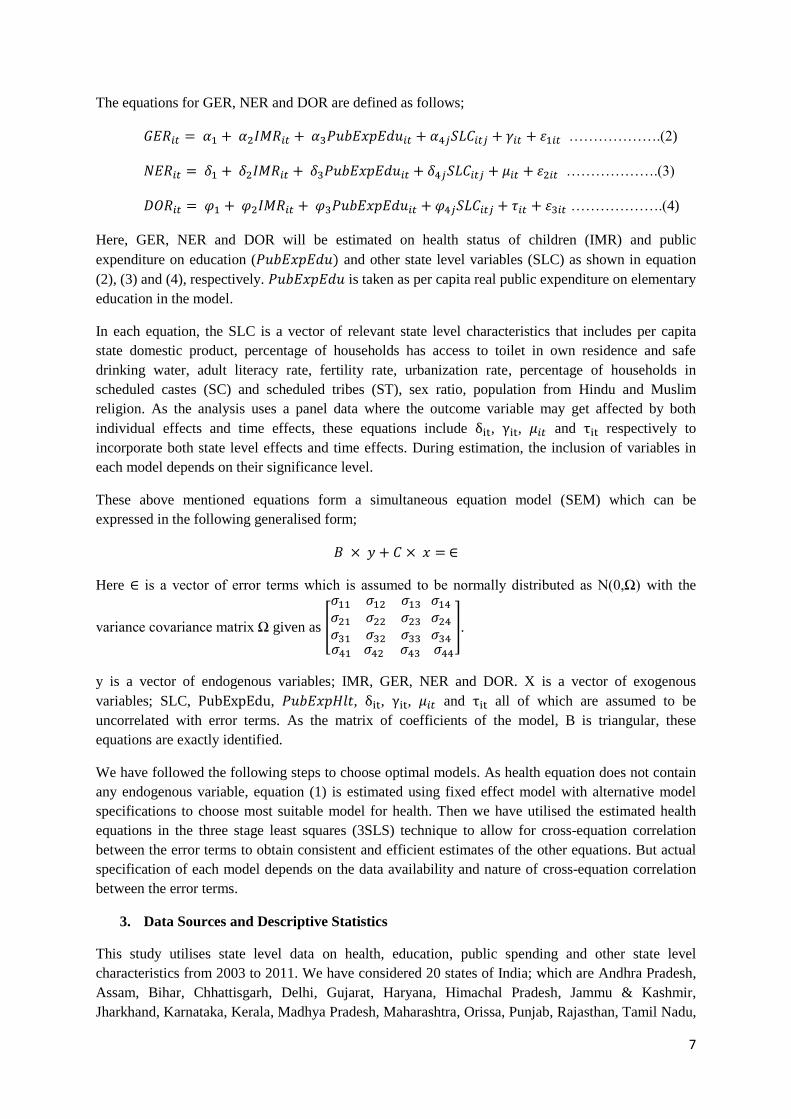
ignoring this impact of health status on the educational attainment of children. Moreover, empirical
data suggests that enrolment rates (GER and NER) are negatively associated with IMR in India
(figure 2 and 3) whereas dropout rates and IMR are positively correlated (figure 4). These plots
indicate that total enrolment rates could improve and dropout rate is likely to decline with an
improvement in child health status.
3 http://data.worldbank.org/indicator/GC.TAX.TOTL.GD.ZS
0
1000
2000
3000
4000
5000
6000
7000
Go
a
Sikk
im
Miz
ora
n
Nag
alan
d
Him
ach
al P
rad
esh
Pu
du
cher
ry
Meg
hal
aya
Trip
ura
Man
ipu
r
Utt
arak
han
d
Del
hi
Jam
mu
& K
ash
mir
Ker
ala
Mah
aras
htr
a
Har
yan
a
Ch
hat
isga
rh
Ass
am
Tam
ilnad
u
Gu
jara
t
Pu
nja
b
Kar
nat
aka
An
dh
ra P
rad
esh
Wes
t B
en
gal
Jhar
khan
d
Ori
ssa
Raj
asth
an
Mad
hya
Pra
des
h
Utt
ar P
rad
esh
Bih
ar
Aru
nac
hal
Pra
des
h
Per
Cap
ita
Rea
l Pu
blic
Exp
end
itu
re
(Rs.
)
Per Capita Real Public Expenditure on Health Per Capita Real Public Expenditure on Education
4
Figure 2: Scatter plots between GER and IMR across states (2003-11)
Figure 3: Scatter plots between NER and IMR across states (2003-10)
50
100
150
200
50
100
150
200
50
100
150
200
50
100
150
200
20 40 60 80
20 40 60 80 20 40 60 80 20 40 60 80 20 40 60 80
Andhra Pradesh Assam Bihar Chhatisgarh Delhi
Gujarat Haryana Himachal Pradesh Jammu & Kashmir Jharkhand
Karnataka Madhya Pradesh Maharashtra Orissa Punjab
Rajasthan Tamilnadu Uttar Pradesh West Bengal
Fitted values GER
IMR
40
60
80
100
40
60
80
100
40
60
80
100
40
60
80
100
20 40 60 80 20 40 60 80 20 40 60 80
20 40 60 80 20 40 60 80
Andhra Pradesh Bihar Delhi Gujarat Haryana
Himachal Pradesh Jammu & Kashmir Karnataka Maharashtra Orissa
Puducherry Punjab Rajasthan Sikkim Tamilnadu
Uttarakhand West Bengal
Fitted values NER
IMR

5
Figure 4: Scatter plot between dropout rates and IMR (2003-11)
Thus, the estimates of the impact of public expenditure on health and education need to factor the
inter-relation between these outcome variables. The objective of the paper is to overcome the
shortcoming of existing studies and to examine the impact of public spending in health and education
sectors after incorporating the linkages between children health status and their educational
achievements. This enables us to measure both direct and indirect impact of public expenditure on
these social sectors and thereby facilitates the estimation of level of public expenditure required to
achieve the desired level of these social indicators. Here, we hypothesise that gross enrolment
increases at diminishing rate with an increase in public expenditure at the initial level of development.
Initially GER may increase far beyond 100 to enrol those children who did not complete their primary
education at the age of 6-11 years. Then gradually GER is likely to reach towards 100 with further
increase in public expenditure after significant improvement in education level. Thus we are
expecting to have an inverted U-shaped relation with per capita expenditure on education. At the same
time NER should increase monotonically at a decreasing rate with an increase in public expenditure.
In addition, the paper examines the relational pattern of dropout rates over time with an expansion of
public spending in education sector. Thus the essential conditions of attaining 100% completion rate
in elementary level of education are; (i) NER should reach 100, (ii) initially GER should increase far
greater than 100 to educate those children who could not complete primary schooling in 6-11 years of
their age and then gradually decreases towards 100 where GER should converge to NER and (iii) the
dropout rate should decline to zero.
Towards this, a simultaneous equation model (SEM) of educational attainment and health status of
children and the public expenditure on health and education sector is developed here. The health
status of children is captured by IMR which is found to be a good proxy for several other indicators of
child health status (see appendix). Educational outcome of children is captured by GER, NER and
drop-out rates.
Existing studies have mostly considered cross section data which may suffer from the effect of
unobservable state level variables. Thus panel data for the period 2003-11 is utilised in this analysis to
05
1015
2025
20 40 60 80IMR
Fitted values Drop_Out_Rate

6
incorporate the state level unobservable effects in the specified model. To the best of our knowledge,
hardly any study exists that attempts a state level analysis in a SEM framework incorporating the
linkage effect between health and education to measure the impact of public spending on these social
sectors.
On the basis of these estimated models, we have estimated percentage changes in per capita public
expenditure on both health and education sectors required to accelerate the prevailing rate of growth
in each of these indicators. The results show that the required changes in public spending vary
considerably across indicators. Achieving IMR at the standard of developed nations would be much
more difficult as compared to educational indictors. More interestingly, required increase in public
expenditure is substantially high for declining dropout rate in comparison to improving enrolment
rates.
The rest of the paper is organised as follows. Section 2 discusses about the model specification of the
SEM and its‟ estimation procedure, then section 3 explains the data sources of relevant variables with
their descriptive statistics. This section also discusses about the trends and interrelationships among
the underlying variables. The results are presented in section 4 and followed by the conclusions and
policy implications.
2. Model Specification and Estimation Procedure
To estimate the impact of public spending on child education and health; we have designed a
structural model where the impact of health of children on their educational attainment is
incorporated. A few studies exist which employed system equations to account for health status and
educational achievements (Poças and Soukiazis, 2012; Cai, 2010; Andrei, et al., 2009) but none of
them has studied the impact of public spending on these sectors. This paper aims to fill the gap and
provide consistent estimates for the impact of public expenditure in these concerning sectors in India.
The health status of children of a particular state in India is captured by the IMR (see appendix) which
is defined as the number of deaths of children less than one year of age per 1000 live births. The
equation for IMR in state „i' at time „t‟, is specified as follows;
………………. (1)
This equation will estimate the impact of public spending in health sector ( ) on IMR after
controlling other state level control factors (SLC), indexed by subscript „j‟. The per capita expenditure
on health is deflated by GSDP (Gross State Domestic Product) deflator to examine its‟ impact on
IMR. Additionally, per capita real expenditure on Supplementary Nutrition Programme (SNP) is
included in an alternative model to analyse the effectiveness of this programme in particular, as this
programme is a part of the Integrated Child Development Scheme (ICDS). Here, the expenditure on
SNP plays a crucial role to improve their nutritional status as nutritional supplementary food is
provided to pregnant women and children below 5 years of ages. The SLCs appearing in Equation (1)
are described below.
Educational attainment of children is captured by gross enrolment ratio (GER), net enrolment ratio
(NER) and dropout rate (DOR) for the primary level because mere increase in enrolment rate is not
sufficient enough to improve educational status of children. DOR has to decline significantly to have
a 100 per cent completion of basic primary education. Thus GER, NER and DOR are analysed in this
study to have a better picture about the educational attainment in India.
7
The equations for GER, NER and DOR are defined as follows;
……………….(2)
……………….(3)
……………….(4)
Here, GER, NER and DOR will be estimated on health status of children (IMR) and public
expenditure on education ( and other state level variables (SLC) as shown in equation
(2), (3) and (4), respectively. is taken as per capita real public expenditure on elementary
education in the model.
In each equation, the SLC is a vector of relevant state level characteristics that includes per capita
state domestic product, percentage of households has access to toilet in own residence and safe
drinking water, adult literacy rate, fertility rate, urbanization rate, percentage of households in
scheduled castes (SC) and scheduled tribes (ST), sex ratio, population from Hindu and Muslim
religion. As the analysis uses a panel data where the outcome variable may get affected by both
individual effects and time effects, these equations include , , and respectively to
incorporate both state level effects and time effects. During estimation, the inclusion of variables in
each model depends on their significance level.
These above mentioned equations form a simultaneous equation model (SEM) which can be
expressed in the following generalised form;
Here is a vector of error terms which is assumed to be normally distributed as N(0,Ω) with the
variance covariance matrix Ω given as [
].
y is a vector of endogenous variables; IMR, GER, NER and DOR. X is a vector of exogenous
variables; SLC, , , , , and all of which are assumed to be
uncorrelated with error terms. As the matrix of coefficients of the model, B is triangular, these
equations are exactly identified.
We have followed the following steps to choose optimal models. As health equation does not contain
any endogenous variable, equation (1) is estimated using fixed effect model with alternative model
specifications to choose most suitable model for health. Then we have utilised the estimated health
equations in the three stage least squares (3SLS) technique to allow for cross-equation correlation
between the error terms to obtain consistent and efficient estimates of the other equations. But actual
specification of each model depends on the data availability and nature of cross-equation correlation
between the error terms.
3. Data Sources and Descriptive Statistics
This study utilises state level data on health, education, public spending and other state level
characteristics from 2003 to 2011. We have considered 20 states of India; which are Andhra Pradesh,
Assam, Bihar, Chhattisgarh, Delhi, Gujarat, Haryana, Himachal Pradesh, Jammu & Kashmir,
Jharkhand, Karnataka, Kerala, Madhya Pradesh, Maharashtra, Orissa, Punjab, Rajasthan, Tamil Nadu,

8
Uttar Pradesh and West Bengal; due to the fact that the required information for all the relevant
variables for a given time period are available only for these states. The dataset contains information
for selected indicators of health, education, public spending and other socio-economic variables
capturing different state level characteristics. The definitions of all underlying indicators are given in
table 2 along with their data sources.
Table 2: Definitions and data sources of relevant variables
Variable Definition Data Source
Gross Enrolment Rate
of Primary Education
(GER)
The number of pupils enrolled in the primary level, regardless
of age, expressed as a percentage of the population in the 6-11
years of age group.
District Information System
for Education (DISE)
Net Enrolment Rate of
Primary Education
(NER)
The number of pupils of 6-11 years of age who got enrolled in
the primary level, expressed as a percentage of the population
in the 6-11 years of age group.
DISE
Dropout Rate (DOR)
Children withdraw prematurely before completion of
primary/elementary level as a percentage of those students who
got enrolled in first grade.
DISE
Infant Mortality Rate
(IMR)
The number of deaths of children less than one year of age per
1000 live births Sample Registration System
Public Spending on
Education
Expenditure incurred by Govt. of India (GOI) on education in
both revenue and capital account EPW database
Public Spending on
Health
Expenditure incurred by GOI on health in both revenue and
capital account EPW database
Public Spending on
Family Welfare
Expenditure incurred by GOI on family welfare in both
revenue and capital account EPW database
Public Spending on
Elementary Education Public expenditure on elementary education
Ministry of Human Resource
Development
Public Spending on
ICDS Program
Government Expenditure on the Integrated Child Development
Scheme IndiaStat Website
Public Spending on
SNP
Government Expenditure on the Supplementary Nutrition
Program under the ICDS IndiaStat Website
Per Capita NSDP
(current and Constant)
Per capita net state domestic product both in current prices and
constant prices EPW database
GSDP Deflator Calculated as (GSDP Current/GSDP Constant)*100 EPW database
Safe Drinking Water Percentage of households have access to safe drinking water Census of India
Sanitation Facility in
own residence Percentage of households have toilet facility in own residence Census of India
Total Fertility Rate The average number of children that would be born per woman Sample Registration System
Scheduled Caste (SC)
and Scheduled Tribe
(ST)
Percentage of households belongs to SC or ST Census of India
Urbanisation Percentage of population belongs to urban areas Census of India
Villages have electricity Percentage of villages have electricity EPW database
Literacy Rate Percentage of population aged seven years and above who can
both read and write Census of India, NSS
Sex Ratio Total number of female population per 100 male population Census of India
Among the explanatory variables, public spending on health, education and family welfare are
collected from the EPW website. Here per capita expenditure for each sector is calculated as total
expenditure divided by total population for each state. The GSDP deflator, calculated as the GSDP
current divided by the GSDP constant, is used to measure real per capita public spending for each
sector. In addition, variables, collected from the Census of India, are only available once in each
decade. Thus we have interpolated those variables for the required years applying compound rate of
growth for each year.
The descriptive statistics of these undertaken variables are given in table 3. The dataset exhibits
considerable variations in undertaken variables. The sample consists of 180 data points where 20

9
states have data for at least 5 consecutive years for all relevant variables. Indian states are
experiencing slow but monotonous progress in health and education in recent years except Mizoram,
Meghalaya and Nagaland. Although the pattern of change in each sector is different across states,
overall there is progress over last decade. For health status, IMR varies widely from 11 in Goa to the
maximum of 83 in Orissa.
In some states GER becomes greater than 100 as it is calculated as the number of pupils enrolled in
the primary level, regardless of age, expressed as a percentage of the population in the 6-11 years of
age group. Thus pupils not in the age group can get enrolled in the primary level. But NER is strictly
less than 100 as it considers only those children who get enrolled in 6-11 years of their age. Notably,
NER data is available for 2003-10 where most states experience gradual improvement over time with
significant variation across states.
Table 3: Descriptive statistics of relevant variables, 2003-11
While concerning the exogenous variables, public spending on both health and education sectors are
expressed in real terms. Per person real public spending in primary education is calculated by dividing
total number of children in 6-11 years of age group of the state and deflated by GSDP deflator. In
average, states are spending about 38% of total public expenditure per person on education. As seen
earlier, the per capita real public expenditure on education varies widely across states (figure 1). For
instance, Goa spends more than Rs.6000 whereas Bihar placed at last with less than Rs.1000 per
capita public expenditure on education in 2011. Figure 5 shows the nature of relationship between
GER and per capita real public expenditure on elementary education which does not show any clear
pattern of trend. We hypothesise that gross enrolment should increase with an increase in public
expenditure at the initial level of development. Initially GER may increase far beyond 100 to enrol
those children who did not complete their primary education at the age of 6-11 years. But gradually
GER will decrease towards 100 with further increase in public expenditure where GER will merge to
Variables Obs Mean Std. Dev. Min Max
Endogenous Variables
GER 177 108.31 20.23 51.81 157.37
NER 139 80.16 14.28 38.08 99.85
Dropout rate 162 7.22 4.68 0.08 22.43
IMR 180 49.04 15.51 11.00 83.00
Exogenous Variables
Public Expenditure on Health and Education (Rs.)
Per capita real expenditure on education 180 999.63 466.83 355.70 3056.38
Per child real expenditure on elementary education 162 388.31 229.66 67.81 1630.75
Per capita real expenditure on health 180 266.00 190.00 59.30 1072.00
Per capita real expenditure on health and welfare 180 297.00 192.00 70.90 1085.00
Per child real expenditure on SNP 138 265.00 150.00 32.00 771.00
State Level Characteristics
Literacy rate (Male) 180 79.97 6.83 62.35 96.11
Literacy rate (Female) 180 59.73 12.22 35.81 100.76
Literacy rate 180 71.11 8.95 49.65 94.00
Safe drinking water 180 79.95 16.36 25.14 97.60
Sanitation facil ity 180 48.42 20.96 15.85 97.80
TFR 180 2.57 0.73 1.60 4.40
Sex Ratio 180 941.03 49.85 830.19 1084.00
Households have electricity 180 67.95 25.28 11.30 99.10
Village with electricity 178 87.99 18.33 30.40 100.00
SC 180 16.05 6.10 6.70 31.90
ST 153 11.16 9.08 0.14 31.56
Urbanization 180 31.31 18.13 9.84 97.50
Source: Author’s estimates

10
NER after a significant improvement in education level. Thus we are expecting to have an inverted U-
shaped relation of GER with per capita public expenditure on education.
As NER is the number of children of 6-11 years of age-group who get enrolled in the primary level as
a percentage of total population in that age group, it cannot increase beyond 100. This paper analyses
whether there is any significant improvement in NER with an increment in public spending in primary
level. But at the same time, we hypothesise that the rate of improvement in NER decreases gradually
as it becomes difficult to enhance total coverage all over India after significant expansion in
government facilities. Moreover, the scatter plot between NER and public expenditure (figure 6) on
elementary education show a positive relation but actual impact of public spending is estimated with
the help of 3SLS technique in the following section.
Similarly, the scatter plot between drop-out rates and per child expenditure on elementary education
(figure 7) shows a strong negative relationship. Here, we test whether the rate of decrease in drop-out
rates changes with an increase in per capita level of expenditure on education in elementary level after
controlling other determining factors.
Figure 5: Scatter plot between GER and per capita public expenditure on elementary education
(2003-11)
6080
100
120
140
160
-1 0 1 2 3Log Per child Expenditure on Elementary Education
Fitted values GER

11
Figure 6: Scatter plot between NER and per capita public expenditure on elementary education
(2003-10)
Figure 7: Scatter plot between dropout rate and per capita public expenditure on elementary
education (2003-11)
In case of per capita real expenditure on health, total public spending is divided by total population of
the particular state and GSDP deflator. States are investing by lesser amount in health as compared to
education. Health sector is primarily the responsibility of state governments. Public expenditure on
health in each state is often compromised in several states due to financial shortages. The World
40
60
80
10
0
0 1 2 3
Log per child real expenditure on elementary education
Fitted values NER
05
1015
2025
-1 0 1 2 3
Log Per Child Expenditure on Elementary Education
Fitted values Drop_Out_Rate
12
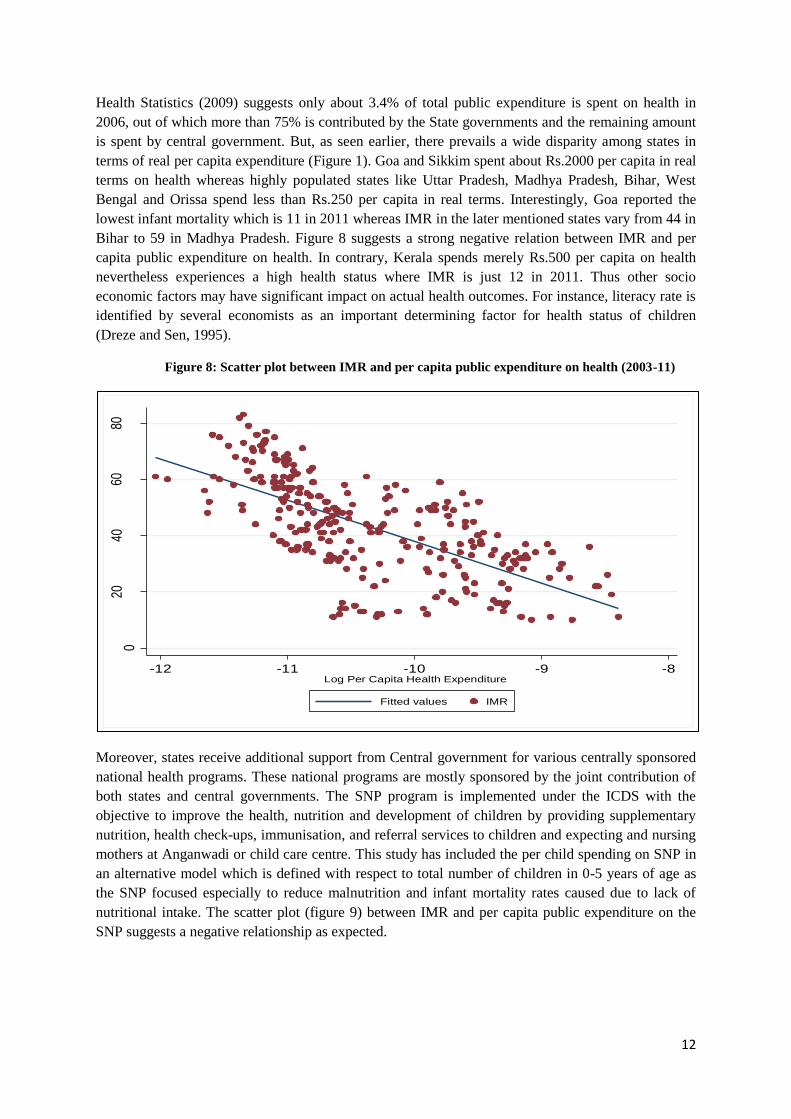
Health Statistics (2009) suggests only about 3.4% of total public expenditure is spent on health in
2006, out of which more than 75% is contributed by the State governments and the remaining amount
is spent by central government. But, as seen earlier, there prevails a wide disparity among states in
terms of real per capita expenditure (Figure 1). Goa and Sikkim spent about Rs.2000 per capita in real
terms on health whereas highly populated states like Uttar Pradesh, Madhya Pradesh, Bihar, West
Bengal and Orissa spend less than Rs.250 per capita in real terms. Interestingly, Goa reported the
lowest infant mortality which is 11 in 2011 whereas IMR in the later mentioned states vary from 44 in
Bihar to 59 in Madhya Pradesh. Figure 8 suggests a strong negative relation between IMR and per
capita public expenditure on health. In contrary, Kerala spends merely Rs.500 per capita on health
nevertheless experiences a high health status where IMR is just 12 in 2011. Thus other socio
economic factors may have significant impact on actual health outcomes. For instance, literacy rate is
identified by several economists as an important determining factor for health status of children
(Dreze and Sen, 1995).
Figure 8: Scatter plot between IMR and per capita public expenditure on health (2003-11)
Moreover, states receive additional support from Central government for various centrally sponsored
national health programs. These national programs are mostly sponsored by the joint contribution of
both states and central governments. The SNP program is implemented under the ICDS with the
objective to improve the health, nutrition and development of children by providing supplementary
nutrition, health check-ups, immunisation, and referral services to children and expecting and nursing
mothers at Anganwadi or child care centre. This study has included the per child spending on SNP in
an alternative model which is defined with respect to total number of children in 0-5 years of age as
the SNP focused especially to reduce malnutrition and infant mortality rates caused due to lack of
nutritional intake. The scatter plot (figure 9) between IMR and per capita public expenditure on the
SNP suggests a negative relationship as expected.
020
4060
80
-12 -11 -10 -9 -8Log Per Capita Health Expenditure
Fitted values IMR

13
Figure 9: Scatter plot between IMR and per capita public expenditure on SNP (2003-11)
Among other exogenous variables literacy rates are expected to have a significant effect on both
education and health (Dreze and Sen, 1995). We find considerable variation in literacy rates across
states and female literacy rates are consistently lower than male literacy rates over time. About 31%
population live in urban areas, 80% households have access to safe drinking water and only 48% have
sanitation facility in their own residence. In recent years, total fertility rate has come down to 2.57 in
average but low sex ratio remains a concerning factor in India. Population from scheduled caste and
scheduled tribes are about 16% and 11% respectively.
4. Results
We have estimated alternative health equations including per capita real public expenditure on health,
family welfare and the SNP. Table 4 presents estimated models for IMR which are most suitable for
different kinds of public expenditure related to health. Here per capita real public spending on health
and welfare do not have significant impact on IMR after controlling other state level effects and time
effects (model 1 and model 2). Log per capita real expenditure on SNP turn out to be highly
significant in model 3 and 4 where IMR decreases significantly with one percentage increase in per
child real public expenditure in the SNP.
Access to safe drinking water and sanitation facilities in own residence are significant in both
equations and their coefficients remain similar irrespective of the model specification. One percentage
increase in the access to safe water reduced the level of IMR by 0.3 whereas sanitation facilities
improve the health condition by 0.1. In addition, different sets of control variables were included in
each model on the basis of their significance level. The fertility rate (TFR) has positive impact on
IMR whereas increase in per capita gross state domestic product (GSDP) and literacy rate improves
the health status of children by decreasing IMR. Notably, the level of coefficient of log per capita real
expenditure on SNP changes from 2.17 in model 3 to 1.20 in model 4 especially after the inclusion of
020
4060
80
-13 -12 -11 -10 -9Log Per Child Exp on Supplementary Nutrition
Fitted values IMR

14
adult literacy rate and per capita GSDP in the model which explains the importance of these variables
in explaining the child health status of a state.
Table 4: The estimated results for the health equations using fixed effect model
Moreover, increase in percentage of population live in urban areas has positive effect on IMR. This
may be due to the fact that total population in slum areas increases by 25 percentage from 2001 to
2011 which may cause a negative impact on the health status of child due to lower vaccination rates,
lack of education among parents, improved health facilities, safe drinking water and access to toilet
facilities in slum areas (Ghosh and Shah, 2004; Agarwal and Taneja, 2005; Jorgenson and Rice, 2012;
Unger, 2013). After comparing adjusted R-squares of estimated models, we have selected 4th model
for the rest of the analysis because this model has significantly higher R-square than other models.
To get consistent and efficient estimates for GER and DOR equations we have applied 3SLS
techniques utilising most appropriate health equation of IMR. The SEM comprises four separate
equations of IMR, GER, NER and DOR. But empirical analysis suggests that the error terms of GER,
NER and DOR equations are not significantly correlated. Thus we have estimated three sets of SEMs
separately. First GER & IMR equations are estimated applying 3SLS technique then same technique
is used to estimate the SEM for NER & IMR and DOR & IMR to get efficient and consistent
estimates for each equation. In this way we are able to maintain maximum possible degrees of
freedom for each model due to the fact that the pattern of data availability is different for each
variable.
The estimated results for the SEM of GER and IMR are given in table 5. In the selected health
equation (model 4 in table 4), per child real expenditure on SNP program and percentage of
population have sanitation and water are taken as the base variables and other state level factors are
included as control variables. We can observe that IMR has negative impact on gross enrolment rate
Variable model1 model2 model3 model4
Log per child real expenditure on SNP -2.168*** -1.200**
Log per capita real expenditure on health -1.19
Log per capita real expenditure on health & welfare -0.461
Safe drinking water -.375** -0.265 -.388** -.302*
Sanitation facil ity -.145*** -.117** -.097** -.063*
TFR 10.876*** 9.083*** 7.750***
Literacy rate -0.134 -.622**
Ln per capita GSDP -4.069 -10.699**
Urbanization .576***
Year 2010 -2.944*** -2.662*** -2.804*** -2.420***
Year 2011 -4.148*** -3.917*** -4.553*** -4.003***
State dummies Yes Yes Yes Yes
Interceprt 46.147* 100.215* 42.319** 201.645***
Observations 180 180 138 138
"R-sq Adj" 0.8 0.8 0.88 0.9
Source: Author's estimates
Note: * p<0.05; ** p<0.01; *** p<0.001

15
(table 5) whereas per child real expenditure on elementary education improves the enrolment rate
significantly as expected. But an increase in per capita real expenditure in primary level improves
gross enrolment at a decreasing rate. Thus there exist diminishing returns of public expenditure on
education. The significant negative coefficient of the quadratic term for public expenditure suggests
an inverted U-shaped relation of GER on per capita public spending. This explicitly explains that
initially GER will increase far beyond 100 with an increase in public expenditure to enrol those
children who are not in the age of primary education then it declines gradually towards 100 and
converges to NER.
Table 5: The estimated results for the SEM of GER and IMR using 3SLS technique
In addition, decrease in IMR will have positive impact on GER by 0.5 per cent. We have incorporated
trend variable and state dummies to control for both time and state level effects. Other state level
Variable Model
GER
IMR -.502***
Per child real expenditure on elementary education 3.430*
Per child real expenditure on elementary education^2 -.189*
Time 1.424**
State dummies Yes
Intercept 100.757***
IMR
Log per child real expenditure on SNP -0.486*
Safe drinking water -.744***
Sanitation facil ity -.110***
Literacy rate -13.957***
Log per capita GSDP -.396***
Urbanization .845***
Year 2010 -2.189***
Year 2011 -3.483***
State dummies Yes
Intercept 263.509***
GER
Observations 124
RMSE 7.86
"R-sq" 0.81
Chi2 544.65***
IMR
Observations 124
RMSE 1.16
"R-sq" 0.99
Chi2 22182.77***
Source: Author's estimates
Note: The IMR equation in model 4 is the model in table 3
* p<0.05; ** p<0.01; *** p<0.001

16
factors do not have any additional effect on GER because IMR has already taken care of the impact of
adult literacy and other state level characteristics.
The estimated result for NER is given in the following table which shows a significant decrease in net
enrolment with an increase in mortality rates. Thus health status of a child is important to achieve 100
per cent enrolment in primary level. In addition, per child real public expenditure on elementary
education improves net enrolment significantly but at a decreasing rate.
Table 6: The estimated results for the SEM of NER and IMR using 3SLS technique
Table 7 shows the estimated results for the structural model of DOR and IMR using 3SLS technique
to incorporate the correlation between error terms of these equations. This model provides efficient
and consistent estimates of the coefficients. An increase in IMR represents deterioration of health
status of children which magnifies dropout rates significantly across states at the rate of 0.2 per cent.
Further an additional real expenditure per child on elementary education decreases dropout rates by
around 0.18 per cent. State dummies capture significant variation across states. This model does not
include other state level factors as they are suffering with multicollinearity problem as IMR already
captures the impact of other state level characteristics in the model.
Variable Model
NER
IMR -.643***
Log per child real expenditure on elementary education 12.502***
State dummies Yes
Intercept 99.086***
IMR
Log per child real expenditure on SNP -2.091***
Safe drinking water -.667***
Sanitation facil ity -.143***
Literacy rate -.724***
Urbanization .771***
Year 2010 -3.016***
State dummies Yes
Intercept 117.584***
NER
Observations 93
RMSE 5.05
"R-sq" 0.88
Chi2 702.36***
IMR
Observations 93
RMSE 1.39
"R-sq" 0.99
Chi2 11912.45***
Source: Author's estimates
Note: * p<0.05; ** p<0.01; *** p<0.001

17
Table 7: The estimated results for the SEM of DOR and IMR using 3SLS technique
Moreover, these estimated models are satisfactory in terms of goodness of fit and level of significance
of the coefficients. The chi-square values and the corresponding significance level represents that
these models are overall significant at .01% level. If we compare the impact of public expenditure on
primary education, it is more effective to increase gross enrolment rates i.e. 3.4% which is
significantly higher than the effect on dropout rates (0.18%).
Public expenditure requirement
To achieve 100 per cent completion in primary education, NER and GER should be 100 and DOR
should decline to 0. Given the influence of IMR on the education attainment of children, it is
important to ensure IMR also declines to acceptable levels. A target value of 10 for IMR may be
considered reasonable on the basis of the current levels in developed countries. Assuming that public
expenditure in health and education grows at the prevailing rates, in a business as usual (BAU)
scenario, at the existing rate of growth in health and education sectors it would take 20 years to
Variable Model
Dropout rate
IMR .201***
Per child real expenditure on elementary education -.186*
year 2011 1.059*
State Dummies Yes
Intercept -4.588**
IMR
Log per child real expenditure on SNP -.547*
Safe drinking water -.746***
Sanitation facil ity -.110***
Literacy rate -.383***
Log per capita GSDP -14.332***
Urbanization .858***
Year 2010 -2.068***
Year 2011 -3.288***
State dummies Yes
Intercept 265.548***
Dropout rate
Observations 109
RMSE 2.20
"R-sq" 0.76
Chi2 344.02***
IMR
Observations 109
RMSE 1.14
"R-sq" 0.99
Chi2 17154.57***
Source: Author's estimates
Note: The IMR equation in model 4 is the model in table 3
* p<0.05; ** p<0.01; *** p<0.001

18
achieve the targeted rate of IMR whereas 6 and 10 years for NER and DOR respectively. By how
much should public expenditure increase to accelerate these trends?
On the basis of these estimated models, we have estimated percentage changes in per capita public
expenditure on both health and education sectors required to accelerate the prevailing rate of growth
in each of these indicators. Table 8 shows required changes in per capita public expenditure for each
sector in different scenario. For instance, if we want to increase the growth rate of IMR by 1.25 times
then public spending has to be increased by 95% in health sector. The required changes are gradually
increasing if we want to achieve the target at a lesser time period. Similarly, it holds for educational
indicators. Moreover, the required rate of change in public expenditure is notably high for declining
dropout rates as compared to enrolment rates at the same rate.
Table 8: Required changes in per capita public expenditure to accelerate current trend
5. Conclusions and Policy Implications
The basic objective of the study is to estimate the impact of public spending on health and education
of children after incorporating the linkages between health status and educational attainment. Thus the
analysis examines both direct and indirect impact of public spending on these social sectors. Here the
health status of children is captured with IMR which represents a good proxy for several indicators of
child health status as shown in appendix. The educational attainment is captured with both enrolment
rates and dropout rates in elementary level of education. To capture primary enrolment of each state
we have considered GER which is calculated as total enrolment in the primary level divided by total
children in the age group of 6-11 years. In India, many children cannot complete their primary
education in that age group due to late enrolment which results in GER to exceed the limit 100. Thus
we hypothesise that in the early stage of development GER increases with an increase in public
expenditure on education where GER can exceed the limit 100 and then it comes down gradually to
Indicator IMR NER DOR
Current value of indicator* 40 86.93 5.71
Target value of indicator** 10 100 0
Observed growth rate (BAU)*** -0.037 0.027 -0.105
Years to reach the target value (BAU) 20 6 10
Accelerated growth scenario FAST-1 = 1.25 times BAU growth rate
Targeted growth rate -0.05 0.03 -0.13
Years require to reach the target 16 5 8
Required change in per capita public expenditure 95% 23% 75%
Accelerated growth scenario FAST-2 = 1.50 times BAU growth rate
Targeted growth rate -0.06 0.04 -0.16
Years require to reach the target 14 4 6
Required change in per capita public expenditure 115% 28% 89%
Accelerated growth scenario FAST-3 = 1.75 times BAU growth rate
Targeted growth rate -0.06 0.05 -0.18
Years require to reach the target 12 3 5
Required change in per capita public expenditure 134% 32% 104%
Accelerated growth scenario FAST-4 = 2 times BAU growth rate
Targeted growth rate -0.07 0.05 -0.21
Years require to reach the target 10 3 5
Required change in per capita public expenditure 153% 37% 119%
** We have assumed target value of each indicator at the standard of developed countries
*** Exponential growth rate
Notes: * Current value of each indicator is estimated using simple average across states. Current year is 2011 for
IMR and DOR, and 2010 for NER.

19
100 with further development in education. In addition the paper has examined the nature of impact of
public spending on NER and dropout rate.
Here we have formulated a suitable structural model for health and educational outcomes with basic
assumptions. The SEM comprises four separate equations of IMR, GER, NER and DOR. But
empirical analysis suggests that the error terms of GER, NER and DOR equations are not inter-
correlated. Thus we have estimated three sets of SEMs separately. First GER & IMR equations are
estimated applying 3SLS technique then same technique is used to estimate the SEM for NER & IMR
and DOR & IMR to get efficient and consistent estimates for each equation.
The results suggest that per capita real expenditure on health by state governments does not have a
significant impact on IMR but additional expenditure on SNP improves the health status significantly
but at diminishing rate. These results reinforce the idea that government should expand total
expenditure on the SNP program through anganwadis4 (courtyard shelter). An expansion of nutritional
intake of children under 5 years of age improves their health status and it significantly declines infant
mortality rate across states. Further increase in percentage of households with access to safe water and
sanitation facility in their own residence, literacy rate and per capita GSDP improve health status at
significant rate. At the same time fertility rate and urbanisation increase IMR.
In addition, the results show that bad health status among children, captured by high IMR, is
responsible to have lower enrolment and high dropout rates in primary level of education. In the GER
equation, the IMR is turn out to be significant and it has negative impact on enrolment rates. Thus
public expenditure on SNP has indirect impact on education through the improvements in health
status of children whereas per capita expenditure on elementary education has direct impact on the
enrolment rate. But the impact of public expenditure on education has diminishing returns on GER.
We have similar results for NER as well. The estimated result for NER shows a significant decrease
in net enrolment with an increase in mortality rates. Thus health status of a child is important to
achieve 100 per cent enrolment in primary level and per capita real public expenditure on elementary
education improves net enrolment monotonically but at a decreasing rate.
On the other hand, dropout rate declines with a decrease in IMR and additional spending on education
in primary level. Thus public spending has to be increased in the nutritional program and education
sector at primary level to have a better future in terms of health status and educational attainments of
children. Notably, the impact of public expenditure on elementary education is considerably lower on
dropout rates as compared to gross enrolment of children. Thus relatively more public spending is
required in the education sector to reduce dropout rates as compared to enrolment rates.
To achieve 100 per cent completion in primary education, NER and GER should be 100 and DOR
should decline to 0. Given the influence of IMR on the education attainment of children, it is
important to ensure IMR also declines to acceptable levels. A target value of 10 for IMR may be
considered reasonable on the basis of the current levels in developed countries. In the business as
usual (BAU) scenario with current public expenditure on each sector, we require 20 years to achieve
the targeted rate of IMR whereas 6 and 10 years for NER and DOR respectively.
4 Anganwadi is a government sponsored child-care and mother-care centre in India. They were started in 1975
as a part of the ICDS programme to provide basic health care facilities and supplementary food to the children in 0-6 years of age group.

20
In this situation, we have to increase total public spending at a significant rate to accelerate the trend.
Our results show how the required changes in public spending vary considerably across indicators.
Achieving IMR at the standard of developed nations would be much more difficult as compared to
educational indictors. More interestingly, required increase in public expenditure is substantially high
for declining dropout rate in comparison to improving enrolment rates. For instance, if we want to
increase the growth rate of IMR by 1.25 times then public spending has to be increased by 95% in
health sector whereas merely 23% increase in per capita real public expenditure in education sector
would accelerate the growth in NER by equal rate. But the public spending in education has to be
increased further to 75% in each year to achieve zero dropout rate.
It must be noted that we have only estimated the additional expenditure requirement to accelerate the
trends in child health and education attainment. Most importantly, we have not examined the fiscal
feasibility / sustainability of increasing public expenditure. Further, several other conditions need to
be ensured in order to accelerate the trends in child health and education attainment. For instance, the
human capital requirement in the health and education sectors may be a severe constraint, at least in
the short to medium-run. Further, our estimation shows the importance of clean water supply and
sanitation, which affects IMR and through that education attainment. A more holistic approach may
hence essential to improve child health and education status. This, however, is beyond the scope of
the present paper.
References
Agarwal, S. and Taneja, S. 2004. Situational Analysis for Guiding USAID/India and EHP/India: Technical
Assistance Efforts in Indore, Madhya Pradesh, India. Arlington VA: Environmental Health Project.
Andrei, T., Matei, A. and Oancea, B. 2009. Simultaneous Equations Models Used in the Study of Some Issues
Related to the Coruption and Performance of Services in the Public Health System”, Theoretical and Applied
Economies, Vol. XVI, No. 1(530), pp. 3 – 18, Available at SSRN: http://ssrn.com/abstract = 1 333 528.
Behrman, J. R. and Lavy, V. 1994. Children's Health arid Achievement in School. LSMS Working Paper 104.
Washington, D.C: World Bank
Behrman, J. R. 1996. The Impact of Health and Nutrition on Education. The World Bank Research Observer,
vol. 11, no. 1 (February 1996), pp. 23-37
Bhalotra, S. 2007. Spending to save? State health expenditure and infant mortality in India. Health Economics,
16, 911-928.
Bouis, H. E. 1992. Adolescents in Farm Households: Their Nutrition, Education, and Contributions to Family
Welfare. International Food Policy Research Institute, Washington, D.C. Processed
Cai, L. 2010. The relationship between health and labour force participation: evidence from a panel data
simultaneous equation model. Labour Economics, 17, pp. 77–90
Chutikul, S. 1986. Malnourished Children: An Economic Approach to the Causes and Consequences in Rural
Thailand. Number 102. East-West Population Institute, East-West Center, Honolulu, Hawaii.
De, A. and Endow, T. 2008. Public Expenditure on Education in India: Recent Trends and Outcomes. Research
Consortium on Educational Outcomes and Poverty, WP08/18.
Deolalikar, A. 2005. Attaining the Millennium Development Goals in India: How Likely and What Will it Take
to Reduce Infant Mortality, Child Malnutrition, Gender Disparities and Hunger-Poverty and to Increase School
Enrolment and Completion? New Delhi, Oxford University Press.
Dreze, J. and Sen, A. 1995. India: Economic Development and Social Opportunity. New Delhi: Oxford
University Press.
21
Farahani, M.; Subramanian, S. V. and Canning, D. 2009.Effects of state-level public spending on health on the
mortality probability in India.Health Economics. 2010 November; 19(11): 1361–1376. doi: 10.1002/hec.1557
Filmer, D. and Pritchett, L. H. 2001. Estimating Wealth Effects without Expenditure Data-or Tears: An
Application to Educational Enrolments in States of India. Demography, 38, 115-132.
Ghosh, S. and Shah, D. 2004. Nutritional Problems in Urban Slum Children. Indian Pediatrics 41: 682-696
Glewwe, P. and Jacoby, H. 1995. An Economic Analysis of Delayed Primary School Enrollment and Childhood
Malnutrition in a Low Income Country. Review of Economics and Statistics 77(l):156-69.
Gupta, S.; Verhoven, M. and Tiongson, E. 2002. The effectiveness of government spending on education and
health care in developing and transition economies. European Journal of Political Economy. Vol. 18. Issue. 4.
717-737
Jamison, D. T. 1986. Child Malnutrition and School Performance in China. Journal of Development Economics
20(2):299-310
Jorgenson, K. A. and Rice, J. 2012. Urban slums and children's health in less developed countries. American
Sociological Association 18 (1): 103–116
Mayer, S. E. and Sarin, A. 2005. Some mechanisms linking economic inequality and infant mortality. Social
Science & Medicine, Elsevier, vol. 60(3), pages 439-455, February.
Moock, P. R. and Leslie, J. 1986. Childhood Malnutrition and Schooling in the Terai Region of Nepal. Journal
of Development Economics 20(l):33-52
Poças, A and Soukiazis, E. 2012. Explaining the interrelations between health, education and standards of
living in Portugal. A simultaneous equation approach. http://gemf.fe.uc.pt/workingpapers/pdf/2012/ gemf_2012-
06.pdf
Unger A. 2013. Children‟s health in slums settings. Arch Dis Child, 98: 799–805
Appendix
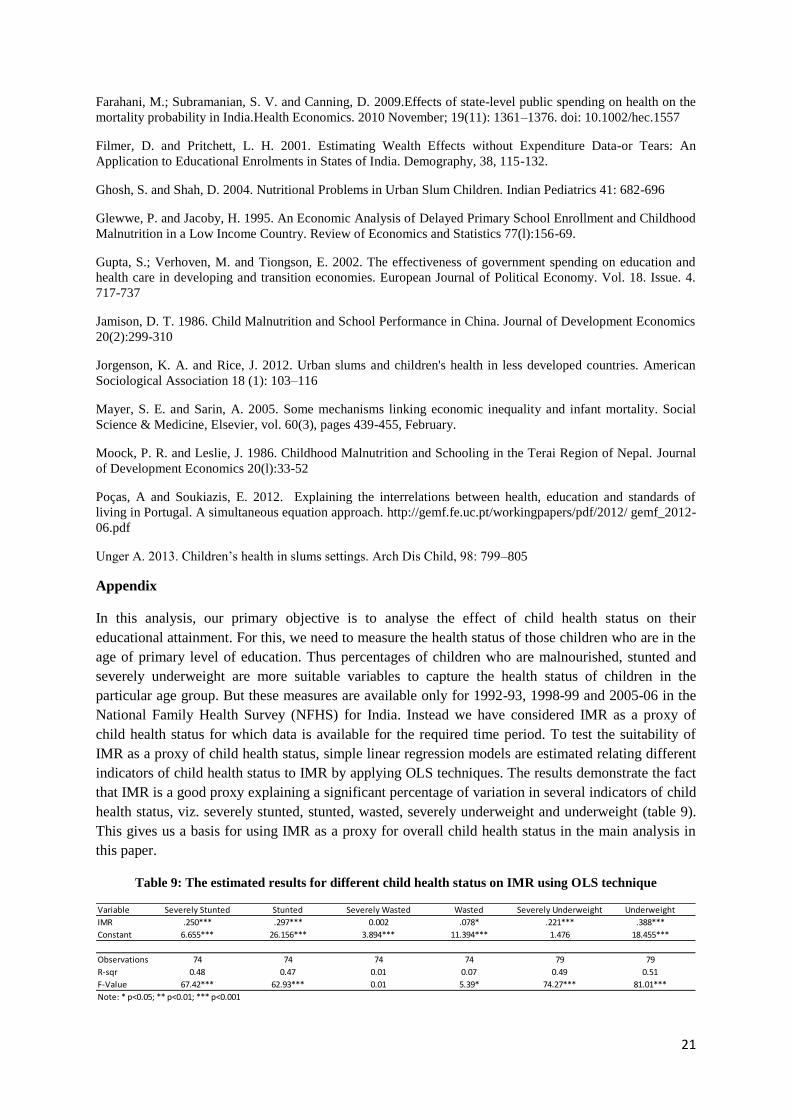
In this analysis, our primary objective is to analyse the effect of child health status on their
educational attainment. For this, we need to measure the health status of those children who are in the
age of primary level of education. Thus percentages of children who are malnourished, stunted and
severely underweight are more suitable variables to capture the health status of children in the
particular age group. But these measures are available only for 1992-93, 1998-99 and 2005-06 in the
National Family Health Survey (NFHS) for India. Instead we have considered IMR as a proxy of
child health status for which data is available for the required time period. To test the suitability of
IMR as a proxy of child health status, simple linear regression models are estimated relating different
indicators of child health status to IMR by applying OLS techniques. The results demonstrate the fact
that IMR is a good proxy explaining a significant percentage of variation in several indicators of child
health status, viz. severely stunted, stunted, wasted, severely underweight and underweight (table 9).
This gives us a basis for using IMR as a proxy for overall child health status in the main analysis in
this paper.
Table 9: The estimated results for different child health status on IMR using OLS technique
Variable Severely Stunted Stunted Severely Wasted Wasted Severely Underweight Underweight
IMR .250*** .297*** 0.002 .078* .221*** .388***
Constant 6.655*** 26.156*** 3.894*** 11.394*** 1.476 18.455***
Observations 74 74 74 74 79 79
R-sqr 0.48 0.47 0.01 0.07 0.49 0.51
F-Value 67.42*** 62.93*** 0.01 5.39* 74.27*** 81.01***
Note: * p<0.05; ** p<0.01; *** p<0.001