Embed Size (px)
Citation preview
Clemson UniversityTigerPrints
All Theses Theses
8-2018
Impact of Pouch Dimensions on RelationshipBetween Burst Pressure and Seal Peel Strength inFlexible PouchesFranklin Harmon CheeksClemson University, [email protected]
Follow this and additional works at: https://tigerprints.clemson.edu/all_theses
This Thesis is brought to you for free and open access by the Theses at TigerPrints. It has been accepted for inclusion in All Theses by an authorizedadministrator of TigerPrints. For more information, please contact [email protected].
Recommended CitationCheeks, Franklin Harmon, "Impact of Pouch Dimensions on Relationship Between Burst Pressure and Seal Peel Strength in FlexiblePouches" (2018). All Theses. 2955.https://tigerprints.clemson.edu/all_theses/2955
IMPACT OF POUCH DIMENSIONS ON RELATIONSHIP BETWEEN BURST
PRESSURE AND SEAL PEEL STRENGTH IN FLEXIBLE POUCHES
A Thesis
Presented to
the Graduate School of
Clemson University
In Partial Fulfillment
of the Requirements for the Degree
Master of Science
Packaging Science
by
Franklin Harmon Cheeks
August 2018
Accepted by:
Dr. Duncan O. Darby, Committee Chair
Dr. Edward J. Rhodehamel
Dr. Robert M. Kimmel
ii
ABSTRACT
A known model relating seal peel strength to burst pressure was studied to determine if
altering pouch size had an impact on the model. The model tested was S=(D/2)P, where
the seal peel strength is equal to the burst pressure multiplied by half of the plate gap.
Past researchers, such as Yam (1993), have tested this model with varying results (Yam,
Rossen, & Wu, 1993). It was hypothesized that data from a pouch with a higher length to
width ratio would fit the model better given a more cylindrical geometry when inflated.
Two pouches of different length to width ratios were produced, where length was kept
constant. The conjectured model was tested by changing seal dwell time to produce seals
of varying seal peel strengths. Pouches were burst tested using a closed-package inflation
burst tester at each chosen dwell time. Resultant seal peel tests were conducted using a
tensile tester on seals produced with the same dwell times. These data were treated using
naïve regression analysis with a moment-based correction to estimate the slope
coefficients. The slope coefficients attained from the experimental data were then
compared to the theoretical slopes (D/2) to determine if there was a statistical difference.
Results showed that the model functioned for the pouch with the larger length to width
ratio when tested at a plate gap of 1.0 inch.
iii
DEDICATION
I dedicate this manuscript to my wife, Rachel, my family, and my in-laws. Rachel
has encouraged me throughout this work, loved me throughout, and has been my pillar to
stand on during the tough times of the research. My parents supplied me both the wisdom
to pursue a graduate degree, and the support to attain it. My sisters and grandparents were
steadfast in their reassurances, and my in-laws always showed me a positive perspective.
Finally, I dedicate this work to Jesus Christ, whose steadfastness allowed me to persevere
through my entire college career.
iv
ACKNOWLEDGMENTS
Firstly, I would like to thank my friend and graduate advisor Dr. Duncan Darby
for his utmost support and wisdom throughout the research. His theories are what drove
the research, and his ability to instruct is what allowed me to complete it. His friendship
was not needed for the research, but one for which I am very thankful.
Secondly, I would like to thank my committee members, Dr. Jeffrey Rhodehamel
and Dr. Robert Kimmel. Thank you both for being positive and supportive throughout. I
also want to thank Pat Marcondes and Bob Bennett. Both of you have shown me great
support.
Finally, I would like to thank Louis Dolmon of Dow Chemical for supplying
adhesive, and Amy Presher of Mistubishi Polyester Film for supplying PET for the
research.
v
TABLE OF CONTENTS
Page
TITLE PAGE .................................................................................................................... i
ABSTRACT ..................................................................................................................... ii
DEDICATION ................................................................................................................ iii
ACKNOWLEDGMENTS .............................................................................................. iv
LIST OF TABLES ......................................................................................................... vii
LIST OF FIGURES ...................................................................................................... viii
CHAPTER
I. INTRODUCTION ......................................................................................... 1
II. REVIEW OF LITERATURE ........................................................................ 5
Field of Packaging ................................................................................... 5
Flexible Packaging ................................................................................... 6
Converting Operations in Flexible Packaging ......................................... 8
Heat Sealing ............................................................................................. 8
Types of Heat Sealing .............................................................................. 9
Types of Heat Seals ............................................................................... 11
Flexible Pouches .................................................................................... 15
Pouch Making ........................................................................................ 18
Seal Hazards and Integrity Issues .......................................................... 20
Quantifying Seal Strength in Pouches ................................................... 22
Need for a Relationship Between Burst Pressure
and Seal Peel Strength in Pouches ................................................... 26
Past Research ......................................................................................... 28
Scope of Research .................................................................................. 44
III. JOURNAL ARTICLE ................................................................................. 46
Title Page ............................................................................................... 47
Abstract .................................................................................................. 48
Introduction ............................................................................................ 49
Materials and Methods ........................................................................... 51
vi
Table of Contents (Continued)
Page
Results and Discussion .......................................................................... 57
Conclusions ............................................................................................ 64
References .............................................................................................. 66
IV. CONCLUSIONS AND RECOMMENDATIONS ...................................... 67
APPENDICES ............................................................................................................... 69
A: Factors Affecting Seal Strength ................................................................... 70
B: Statistical Approach ..................................................................................... 72
C: Preliminary Data .......................................................................................... 77
REFERENCES .............................................................................................................. 80
vii
LIST OF TABLES
Table Page
2.1 Test Factors that Could Impact Burst Pressure Studied by
Franks and Barcan.................................................................................. 35
3.1 Equipment .................................................................................................... 51
3.2 Test Groupings ............................................................................................. 56
3.3 Results from Two-Tailed T-Test for Slope Difference
from Zero ............................................................................................... 58
3.4 Theoretical Slope Estimates ......................................................................... 61
3.5 Test Statistics for Each Test Grouping ........................................................ 62
viii
LIST OF FIGURES
Figure Page
2.1 Material Break Failure ................................................................................. 12
2.2 Material Break (Remote) Failure ................................................................. 12
2.3 Material Elongation Failure ......................................................................... 12
2.4 Peel with Elongation Failure ........................................................................ 13
2.5 Adhesive Peel Failure .................................................................................. 14
2.6 Delamination Failure ................................................................................... 14
2.7 Cohesive Peel Failure .................................................................................. 14
2.8 Pillow Pouch ................................................................................................ 16
2.9 Three-side Seal Pouch.................................................................................. 16
2.10 Four-side Seal Pouch ................................................................................... 17
2.11 Stand-up Pouch ............................................................................................ 18
2.12 Gusset on Stand-up Pouch ........................................................................... 18
2.13 VFFS Process ............................................................................................... 19
2.14 HFFS Process ............................................................................................... 20
2.15 Open Pouch Burst Tester ............................................................................. 24
2.16 Closed Pouch Burst Tester ........................................................................... 24
2.17 Product Life Cycle of Pouch ........................................................................ 27
2.18 Force Diagram of Pouch During Restrained Burst Test .............................. 33
2.19 Resultant Stresses from Internal Pressure in Thin-Walled
Pressure Vessel ...................................................................................... 42
ix
List of Figures (Continued)
Figure Page
3.1 Pouch Sizes Tested ...................................................................................... 54
3.2 Mean Burst Pressure vs. Dwell Time for Each Test
Grouping ................................................................................................ 60
3.3 Mean Seal Peel Strength vs. Dwell Time .................................................... 61
3.4 Comparison of Observed vs. Predicted Seal Peel Strengths
Using Empirical Equations .................................................................... 64
C-1 Temperature Based Seal Curves for Various Sealants ................................ 77
C-2 Time Based Seal Curves for Various Sealants ............................................ 78
C-3 Time Based Seal Curves for One Side Sealer .............................................. 79
1
CHAPTER ONE
INTRODUCTION
The packaging industry is a complex and multifaceted field that is essential to
modern society. Lockhart (1997) defines the term packaging as “a socio-scientific
discipline which operates in society to ensure delivery of goods to the ultimate consumer
of those goods in the best condition intended for their use” (p. 237).
Packaging is not a new function of society nor is it an unchanging one, and
Soroka (2009) logically argues that “a study of packaging’s changing roles and forms
over the centuries is, in a very real sense, a study of the growth of civilizations” (p. 3).
Primitive packaging most likely consisted of natural items such as leaves and hollow
gourds, and was used primarily to contain items (Selke, 1997). Modern day packaging
requires additional functions; to protect, inform, and provide a utility of use. The global
packaging market is continually growing and according to Robertson (1993), “represents
about 2% of the gross national product (GNP) in developed countries” (p. 10).
Packaging can be sub-divided into two primary groups known as “rigid” and
“flexible.” These group names provide a physical descriptor of certain aspects of a
package, but are not fully indicative of the geometry or materials used to construct a
package. Flexible packaging offers many advantages to other types of packaging
including low weight, cost effectiveness, ease of use, and ease of storage (Flexible
Packaging Association, 2018).
Often, flexible two-dimensional structures (assuming thickness is negligible) such
as films or foils must be converted to three-dimensional structures to contain a product
2
and provide a utility of use to consumers. These three-dimensional structures have many
industrial names such as bags, sacks, and envelopes, but are most commonly categorized
as pouches (Selke, 1997). Pouches are used to contain products spanning numerous
industries including food, cosmetic, medical, and automotive.
In order for a pouch to ideally function, certain criteria must be met. Most of, it
not all of these criteria, are accomplished through material selection and sealing. Sealing
substrates together forms a pouch, giving it a three dimensional geometry, and it encloses
the product. Moreover, sealing helps maintain the environment inside of a pouch by
preventing the bulk flow of atmosphere to and away from the product. Proper seals
ensure that gas and water vapor must permeate through the pouch material, which lends a
certain degree of protection to the packaged product.
The seals must be of a certain strength to withstand hazards presented in the
handling and transportation of the pouch. These hazards can be due to compression of the
pouch, but also can be due to pressure changes as in the case of high altitude flights.
Additionally, seals must be strong enough to support the load of the product throughout.
In some applications, the balance between containment strength and ease of opening is
the primary focus, as is the case of the peelable seal. Peelable seals must be strong
enough to contain the product, but must fail properly when the consumer applies a load.
Quantifying the containment strength of a pouch is achieved through a seal peel
test and a burst test. Both tests measure the strength of the seals, with the primary
difference being that a burst test encompasses the entire geometry and structure of a
pouch while a seal peel test does not. Burst testing can be accomplished through an
3
inflation or compression mechanism. Inflation burst testing involves the flow of gas
through a needle to inflate a pouch until failure, and can be conducted using either an
unrestrained or restrained mechanism. Additionally, there are both open-package and
closed-package burst testing machines. Compression burst testing utilizes a compression
table to impart a load on the face of a pouch until failure. In seal peel testing, an isolated
section of seal is tested using a tensile tester.
Each of the tests to quantify containment strength of a pouch is used and viable in
industry. An issue arises when the results from a seal peel test are compared against the
results of a burst test. Primarily, the two types of tests yield different units. A burst test
has units of pressure (force/unit area), while a seal peel test has units of force over width
of seal (force/unit width). The difference in units makes it impossible to compare the
given results without some form of mathematical manipulation. Ideally, this manipulation
should be accomplished through an equation based on sound theories.
Supplying a theoretical equation would afford the means for pouch makers to
communicate data to film suppliers and vice versa. As the industry currently stands,
pouch makers utilize burst tests while film suppliers utilize seal peel tests. The reasoning
for this is based on equipment. Pouch makers may or may not have access to tensile
testers but often have some form of burst tester because the test can quantify the
vulnerability of the entire pouch. A film supplier will likely have access to a tensile tester
due to the need to verify mechanical properties, but might not have access to proper
pouch making equipment or a burst tester. The result is often that the two parties attempt
to communicate data without a relationship between the two. This work is intended to
4
investigate the theoretical relationship between burst pressure and seal peel strength and
determine if pouch size has an impact on the relationship.
5
CHAPTER TWO
REVIEW OF LITERATURE
The Field of Packaging
Packaging is a complex field that deals with many types of materials, and one that
spans many different industries including food, healthcare, and automotive. In modern
industries, the product and package are viewed as one system, where product decisions
should be made in conjunction with a packaging department or expert. The term
‘packaging’ is different from the word ‘package’, which only describes a physical entity
(Robertson, 1993). According to Selke (1997), “the basic purpose of packaging is to
enable the right goods to get to the right place at the right time” (p. 1).
In primitive times, the primary requirement of packaging was to contain, thus
supplying a mechanism for which man could carry objects (Osborn & Jenkins, 1992).
Modernized societies require more of packaging such as to preserve the energy used in
the manufacturing and processing of a product (Robertson, 1993). Most, if not all of
package requirements can be summarized with the four basic functions of a package: to
contain, protect, communicate, and provide a utility of usage (Selke, 1997).
Packaging can be classified in a number of ways. Perhaps the most obvious is to
categorize packaging by the type of materials used in its construction. Glass, metal,
plastic, and paper are considered the four classical packaging materials. Each has its own
advantages and disadvantages, though the use of plastic packaging has grown rapidly in
the last century.
6
Hanlon, Kelsey, and Forcinio (1998) presented a more end use oriented method to
divide packaging when they said it could be categorized as consumer, institutional,
industrial, and military packaging (Hanlon, Kelsey, & Forcinio, 1998). Their divisions
are established largely on product quantity, except for military packaging, which is
subjected to more governmental regulations and inspections than the others.
Perhaps a more encompassing way to divide packaging is to base the division on
physical descriptions of an actual package and packaging materials. To accomplish this,
the industry can be divided into ‘rigid’ packaging, and ‘flexible’ packaging. Rigid
packaging is normally constructed from glass, metal, or plastic and is considered to be
brittle and stiff. Rigid packages include bottles, jars, tubs, buckets, pails, and cans
(Hannay, 2002). Corrugated shipping containers could also be categorized as rigid
packages, given they are self-supporting and free standing. Flexible packaging utilizes
plastic films, metal foils, and papers and is expected to exhibit a certain degree of
elasticity and pliability.
Flexible Packaging
The field of flexible packaging has no definite date of birth, but most believe the
market began with the invention of cellulose film in 1911 (Miller, 1994). Ebnesajjad
(2012) accurately defines flexible packaging as “…bags, envelopes, pouches, sachets,
and wraps made of easily yielding materials such as film, foil, or paper sheeting which,
when filled and sealed, acquires pliable shape” (p. 1). The many benefits to flexible
packaging largely center around its advantage in economy (Selke, Culter, & Hernandez,
2004). Flexible packaging is efficient in terms of material input to finished product yield,
7
as well as usage of cubic space in transportation. Also, forming a flexible packaging
structure, according to Selke et al. (2004), is “rapid and simple” (p. 237). The flexible
packaging industry has seen a steady growth over the past few decades. In 1970, the
world market for flexible packaging was around 1.4 billion dollars (Brody, 1970).
Concerning Europe alone in 2001, the flexible packaging industry produced 7.5 billion
euros of material (Durston, 2006).
Although the terms ‘flexible packaging’ and ‘plastics packaging’ aren’t entirely
synonymous, a large majority of the flexible packaging industry is comprised of plastics.
In 2009, 76.2 percent of the total tons of flexible packaging produced were attributed to
plastics, while the remaining 23.8 percent of tons produced were for paper, foils, and
cellulosics (Ebnesajjad, 2012). A low density, combined with relatively low melting
temperatures, offers savings in terms of both transportation and processing costs.
Flexible packaging is produced in many forms, all ranging in complexity and the
amount of needed inputs to produce. The simplest form of all flexible packaging is a
wrap, which Selke et al. (2004) describes as “a flat piece of material designed to be
folded around a product in some way” (p. 238). The word ‘flat’ constitutes an essentially
two-dimensional structure, where the thickness, according to Miller (1994) “may be as
little as one thirty-thousandth of the width and is miniscule compared to the length, which
is all but infinite” (p. 2). Wrap is the only form of finished flexible packaging that can be
utilized as a flat piece of material. Other flexible packages, such as a pouch, must
undergo converting processes to transform a two-dimensional roll of film into a finished
flexible package capable of containing a product.
8
Converting Operations in Flexible Packaging
Converting in flexible packaging involves the preparation of a final package (and
often product-package system) from rolls of flexible materials. Miller (1994) states that
the technology in the industry “is concerned with the unwinding and windings of rolls of
substrate through machines where inks, adhesives, or coatings are applied in patterns or
over the entire surface” (p. 2). Converting also involves combining materials into
multilayered structures, and creating three dimensional packages from the multilayered
structures. Pertinent unit operations in the flexible converting industry include: surface
treatment, coating, printing, laminating, and heat sealing. Given that this research dealt
primarily with heat sealing and thus pouch making, only these two will be reviewed in
detail.
Heat Sealing
Heat sealing is a converting method used to weld together two layers of material,
where at least one layer is a thermoplastic polymer. These thermoplastic polymers can be
films, such as a monolayer film, or a layer, such as in a lamination or co-extrusion.
Additionally, the thermoplastic polymer can be applied as a heat seal coating. Every
thermoplastic polymer used in flexible packaging does not have ideal heat sealable
properties, such as the case with nylon and polyethylene terephthalate (which melt, but at
a high temperature). Thus, these polymers are not normally utilized as a heat seal layer
and are often laminated, coated, or co-extruded with lower melting temperature materials
if they are used in a heat seal application. Heat sealing is the most common way to seal in
9
flexible packaging, but other non-heat sealing methods exist such as cold, adhesive, and
solvent sealing (Selke et al., 2004).
The three input seal process variables utilized to create a proper heat seal are
energy, pressure, and dwell time. Heat is the most common form of energy used. The
heat source is applied to the external surface of the structure to be sealed, and should be
sufficient enough to allow the seal layer to become fully melted or semi-melted (Selke et
al., 2004). Conductive heating is the most common method in flexible packaging, but
radiative heating does exist. External pressure is also needed to bring the two layers into
intimate contact with one another, which according to Selke (2004) is “around a distance
of 5 Å” (p. 181). Dwell time is the time period for which the two layers are held together
by external pressure. Any of the three seal variables can be used to control heat seal
strength, process efficiency, and cost.
Converters heat seal to close packages, but also to create packages, as in the case
of a form-fill-and-seal machine. The importance of heat sealing in pouch formation
cannot be overstated. Without proper seals, pouches could not maintain their shape or
hold a constant inner atmosphere. Thus, according to Kirwan and Strawbridge (2003),
“Product protection and hence effective shelf life are a function of the quality of sealing
of the package” (p. 175).
Types of Heat Sealing
The most common heat sealing method in flexible packaging is bar sealing, where
heated bars are used to compress the two layers together at some set pressure (Selke et
al., 2004). Heat from the bars is conducted to the interface of the sealant layer(s) and the
10
length of time that pressure is maintained is determined by the set dwell time. There are
many variations of bar geometry used in bar sealing.
The surface profile of the bar (or jaw) can be modified depending on the type of
product being packaged and the material to be sealed (Dudbridge, 2016). Horizontal
patterns are often used in the snack food industry where there is a risk for seal
contamination by crisps and crumbles that break off from the product. Essentially, there
are separate seals made for each raised platform on the bar, with assurance that at least
one of them will produce a proper seal.
Vertical patterns are often used in confectionary packaging, where the package
can be torn open from the top (Dudbridge, 2016). Flat seal bars are used on thicker
sealant materials, where heat transfer is maximized by a larger contact area between the
surface of the bar and the surface to be sealed. A milled, or hatched sealing pattern is a
very fine pattern engraved onto the surface of the bar that helps to increase the rate of
heat transfer through deformation of the surface layers. This allows for faster line speeds
while running thicker materials.
This research utilized bar sealing; however, there are many other types of heat
sealing methods. Impulse sealing, band sealing, and hot wire sealing are all similar to bar
sealing in that a heated tool is used to create a seal. Ultrasonic, hot gas, radiant, dielectric,
magnetic, and induction sealing all utilize a different heating mechanism. Each has their
function in flexible packaging applications. For example, radiant sealing is a heat sealing
method used for substrates that deform under external pressure, such as oriented and
spun-bonded high density polyethylene (Selke et al., 2004).
11
Types of Heat Seals
As there exists multiple ways to heat seal a flexible package, there also exist
multiple types of heat seals. In modern flexible packaging two forms of seals exist with
regards to geometry, a fin seal and a lap seal (Selke et al., 2004). A fin seal is made when
the inside of a substrate is sealed to itself, or to the inside of the same substrate on a
different roll. A lap seal is made when the inside of the substrate is sealed to the exterior
side of the substrate, producing a seal that is flat. Generally, fin seals are stronger while
lap seals are weaker and require heat sealable layers on the interior and exterior of the
substrate.
The failure mechanism, or seal separation mode can also be used to categorize a
heat seal. These mechanisms are attained when the seal is subjected to some sort of load,
be it through a tensile test for isolated seals, or a burst test for sealed flexible packages.
If the seal is stronger than the inherent strength of the material, the seal is deemed
a fusion seal, or a welded seal (Selke et al., 2004). These seals are designed to maximize
seal strength and are used in applications where the package must be destroyed or cut
open to gain access to the product, given that the seal does not peel (Selke et al., 2004).
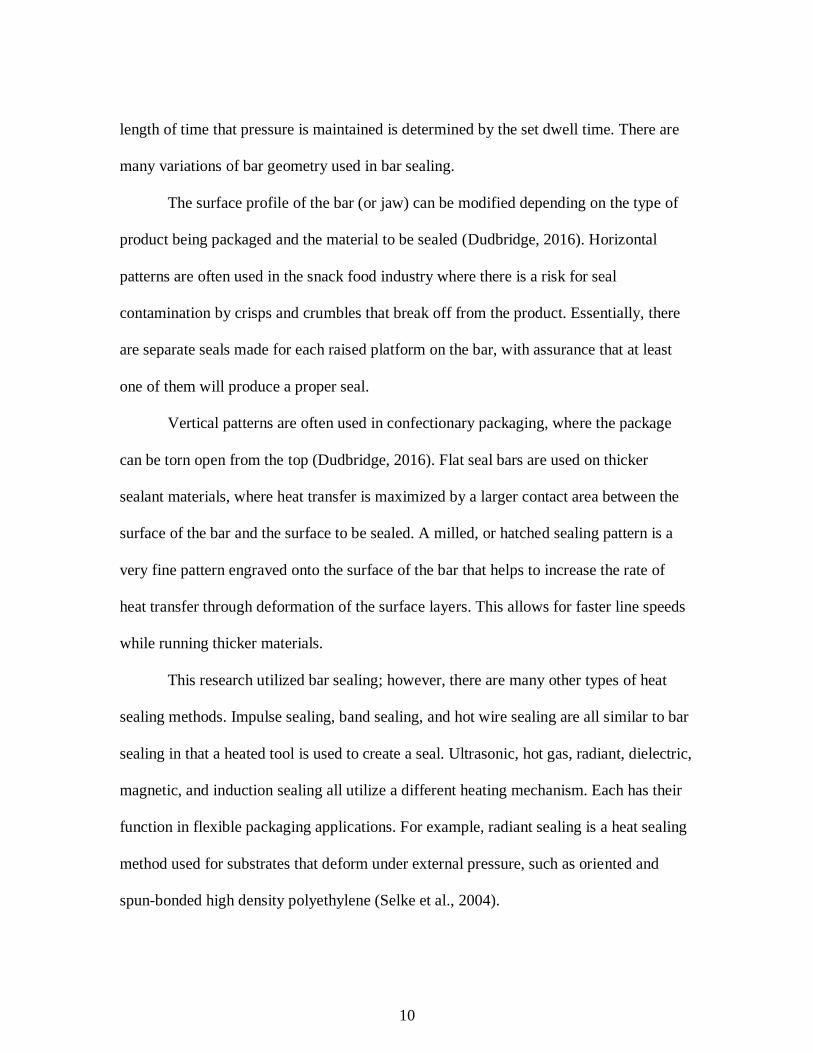
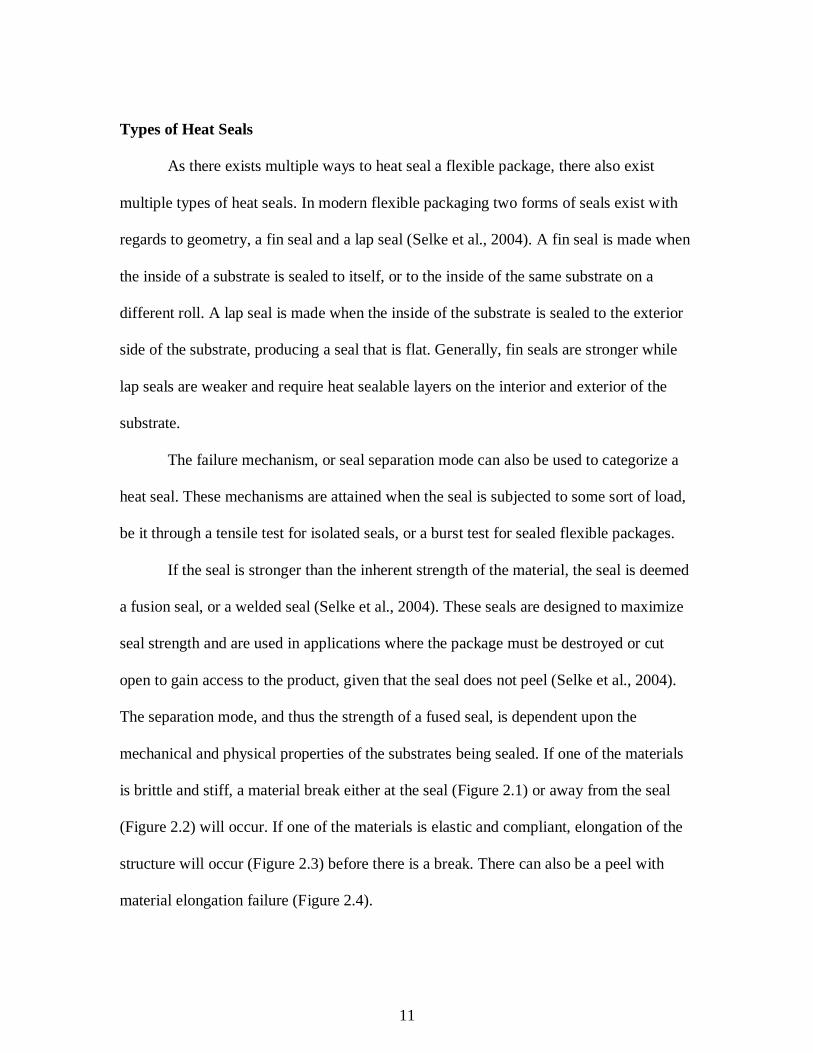
The separation mode, and thus the strength of a fused seal, is dependent upon the
mechanical and physical properties of the substrates being sealed. If one of the materials
is brittle and stiff, a material break either at the seal (Figure 2.1) or away from the seal
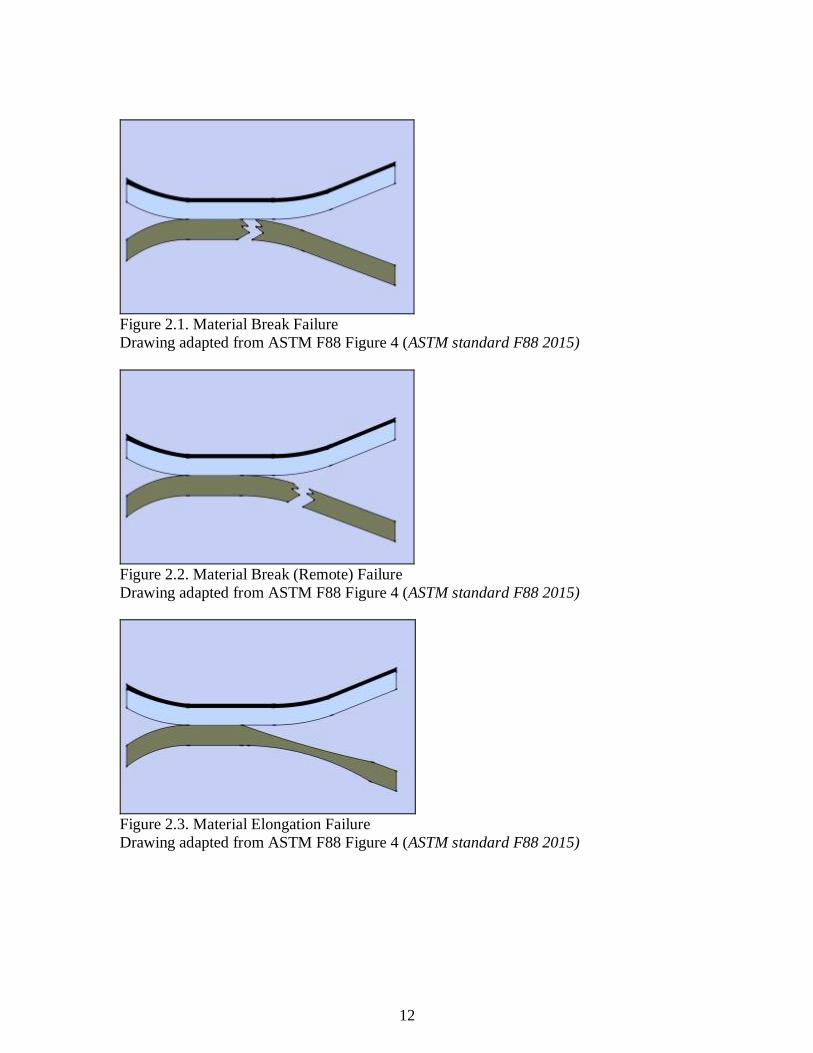
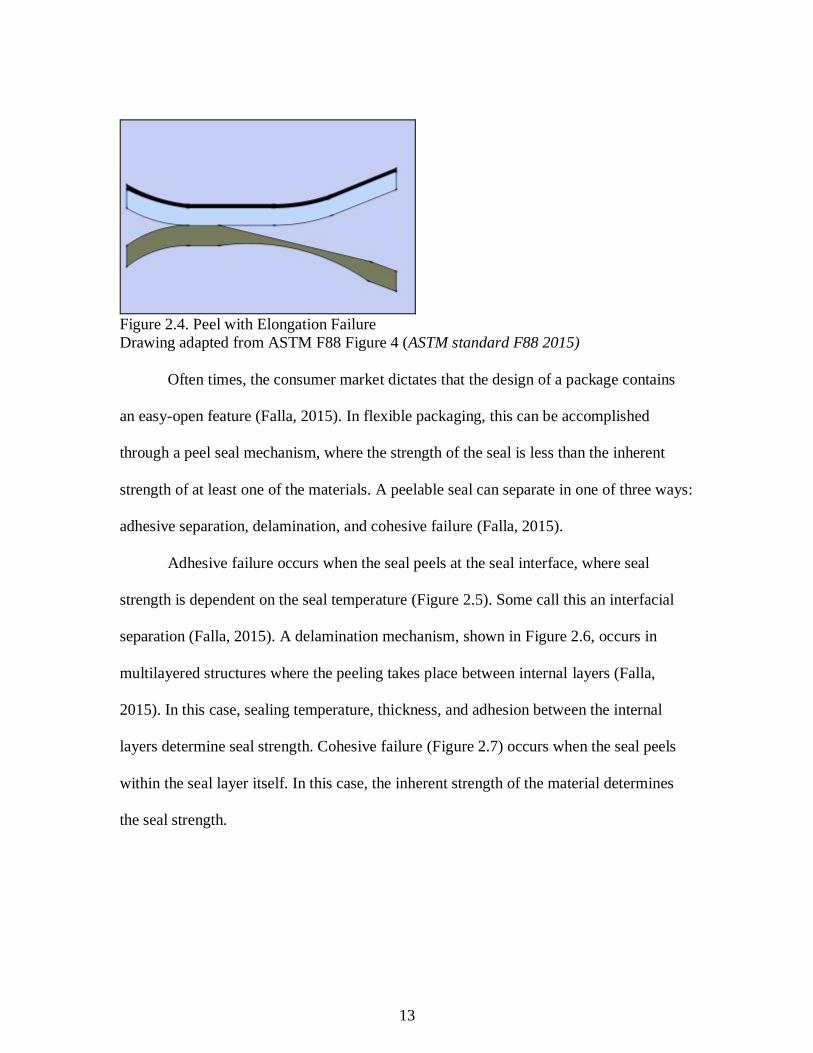
(Figure 2.2) will occur. If one of the materials is elastic and compliant, elongation of the
structure will occur (Figure 2.3) before there is a break. There can also be a peel with
material elongation failure (Figure 2.4).
12
Figure 2.1. Material Break Failure
Drawing adapted from ASTM F88 Figure 4 (ASTM standard F88 2015)
Figure 2.2. Material Break (Remote) Failure
Drawing adapted from ASTM F88 Figure 4 (ASTM standard F88 2015)
Figure 2.3. Material Elongation Failure
Drawing adapted from ASTM F88 Figure 4 (ASTM standard F88 2015)
13
Figure 2.4. Peel with Elongation Failure
Drawing adapted from ASTM F88 Figure 4 (ASTM standard F88 2015)
Often times, the consumer market dictates that the design of a package contains
an easy-open feature (Falla, 2015). In flexible packaging, this can be accomplished
through a peel seal mechanism, where the strength of the seal is less than the inherent
strength of at least one of the materials. A peelable seal can separate in one of three ways:
adhesive separation, delamination, and cohesive failure (Falla, 2015).
Adhesive failure occurs when the seal peels at the seal interface, where seal
strength is dependent on the seal temperature (Figure 2.5). Some call this an interfacial
separation (Falla, 2015). A delamination mechanism, shown in Figure 2.6, occurs in
multilayered structures where the peeling takes place between internal layers (Falla,
2015). In this case, sealing temperature, thickness, and adhesion between the internal
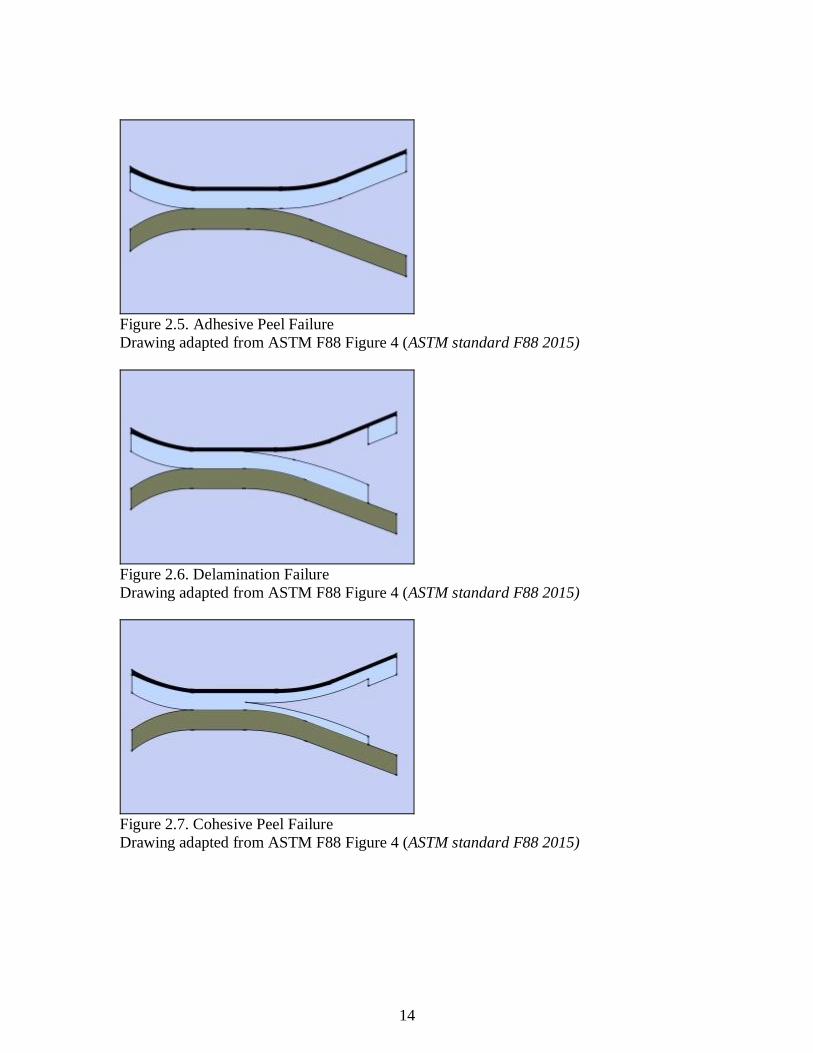
layers determine seal strength. Cohesive failure (Figure 2.7) occurs when the seal peels
within the seal layer itself. In this case, the inherent strength of the material determines
the seal strength.
14
Figure 2.5. Adhesive Peel Failure
Drawing adapted from ASTM F88 Figure 4 (ASTM standard F88 2015)
Figure 2.6. Delamination Failure
Drawing adapted from ASTM F88 Figure 4 (ASTM standard F88 2015)
Figure 2.7. Cohesive Peel Failure
Drawing adapted from ASTM F88 Figure 4 (ASTM standard F88 2015)
15
Peelable seals can be attained through control of sealing variables, but there are
also certain types of polymers that create peel naturally. Polybutene-1 (PB-1) acts as a
“seal contaminant” dispersed in a polyethylene matrix (Falla, 2015). The usage of PB-1
in the sealant layer causes a cohesive peel failure where the seal itself whitens when
pulled apart. Ethylene propylene peel polymers are copolymers that separates at the seal
interface at low temperatures and delaminate at high temperatures. Ionomers can be
blended with PB-1 to help initiate cohesive peel failure, or can be used as a sealant to
initiate a delamination failure.
Flexible Pouches
A flexible pouch is a type of package manufactured from a roll of material that
has been previously converted. In most cases, pouch making and subsequent filling is the
last converting step in the construction of a primary flexible package. A pouch, compared
to a wrap, has a geometric form that is constructed through sealing or folding of the
substrate.
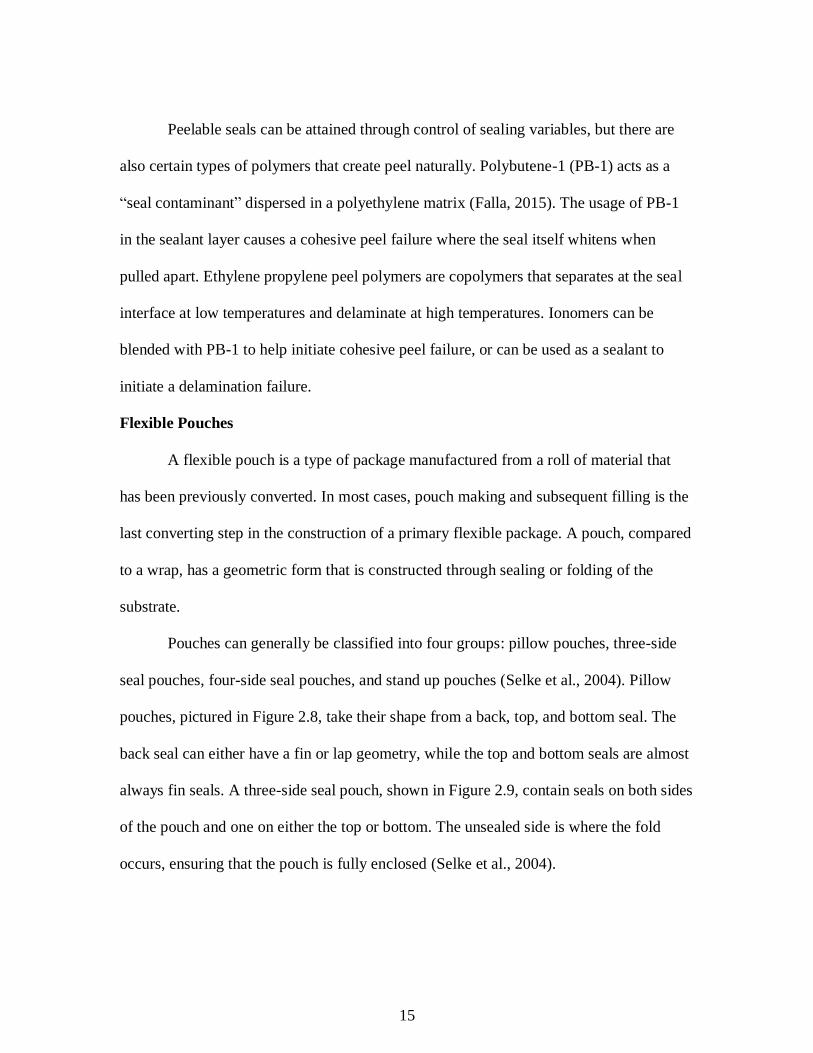
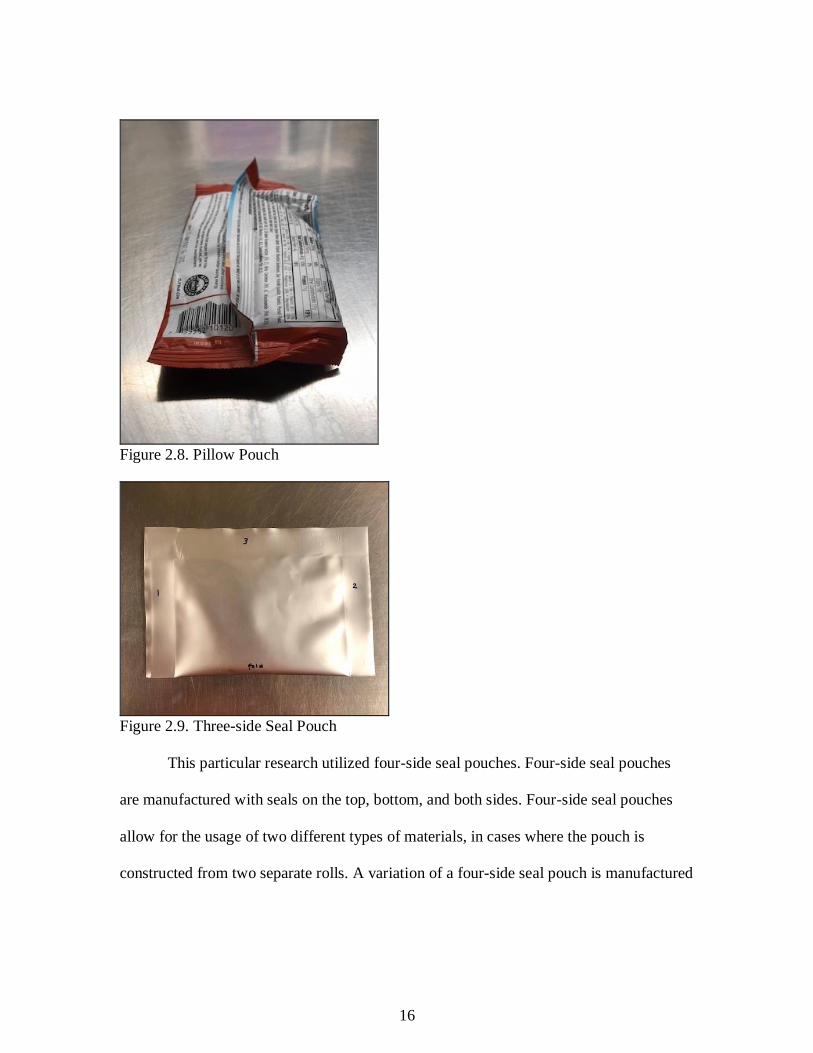
Pouches can generally be classified into four groups: pillow pouches, three-side
seal pouches, four-side seal pouches, and stand up pouches (Selke et al., 2004). Pillow
pouches, pictured in Figure 2.8, take their shape from a back, top, and bottom seal. The
back seal can either have a fin or lap geometry, while the top and bottom seals are almost
always fin seals. A three-side seal pouch, shown in Figure 2.9, contain seals on both sides
of the pouch and one on either the top or bottom. The unsealed side is where the fold
occurs, ensuring that the pouch is fully enclosed (Selke et al., 2004).
16
Figure 2.8. Pillow Pouch
Figure 2.9. Three-side Seal Pouch
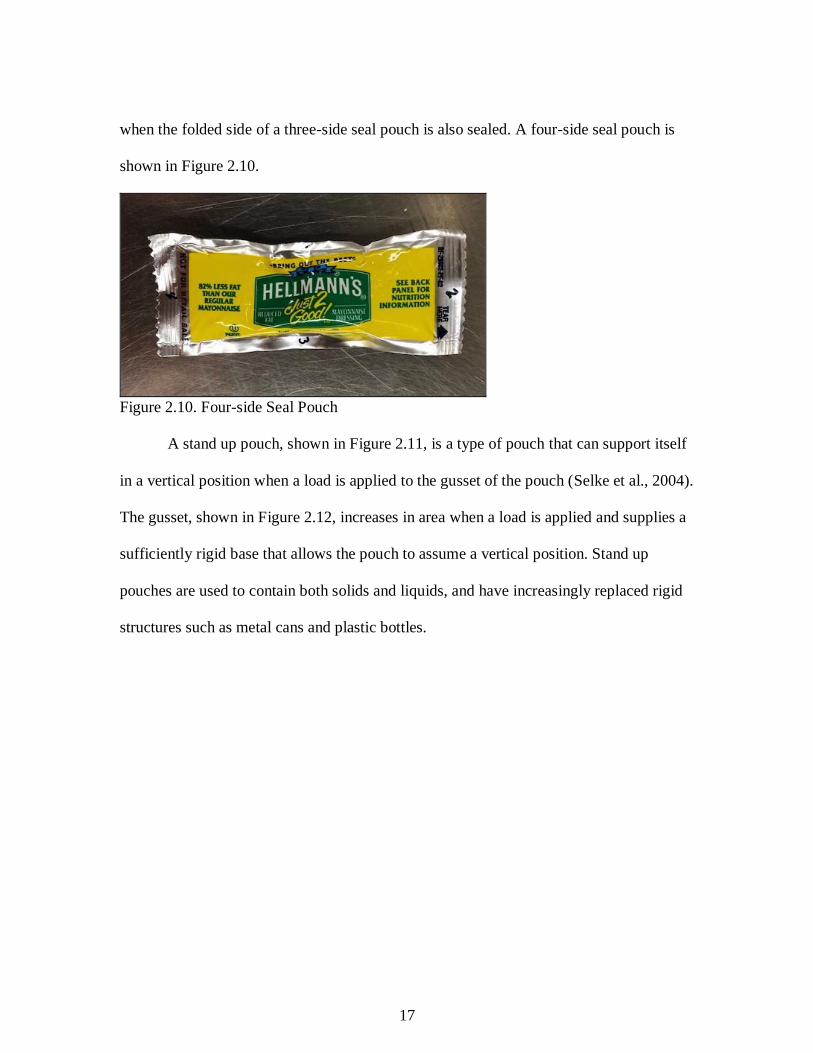
This particular research utilized four-side seal pouches. Four-side seal pouches
are manufactured with seals on the top, bottom, and both sides. Four-side seal pouches
allow for the usage of two different types of materials, in cases where the pouch is
constructed from two separate rolls. A variation of a four-side seal pouch is manufactured
17
when the folded side of a three-side seal pouch is also sealed. A four-side seal pouch is
shown in Figure 2.10.
Figure 2.10. Four-side Seal Pouch
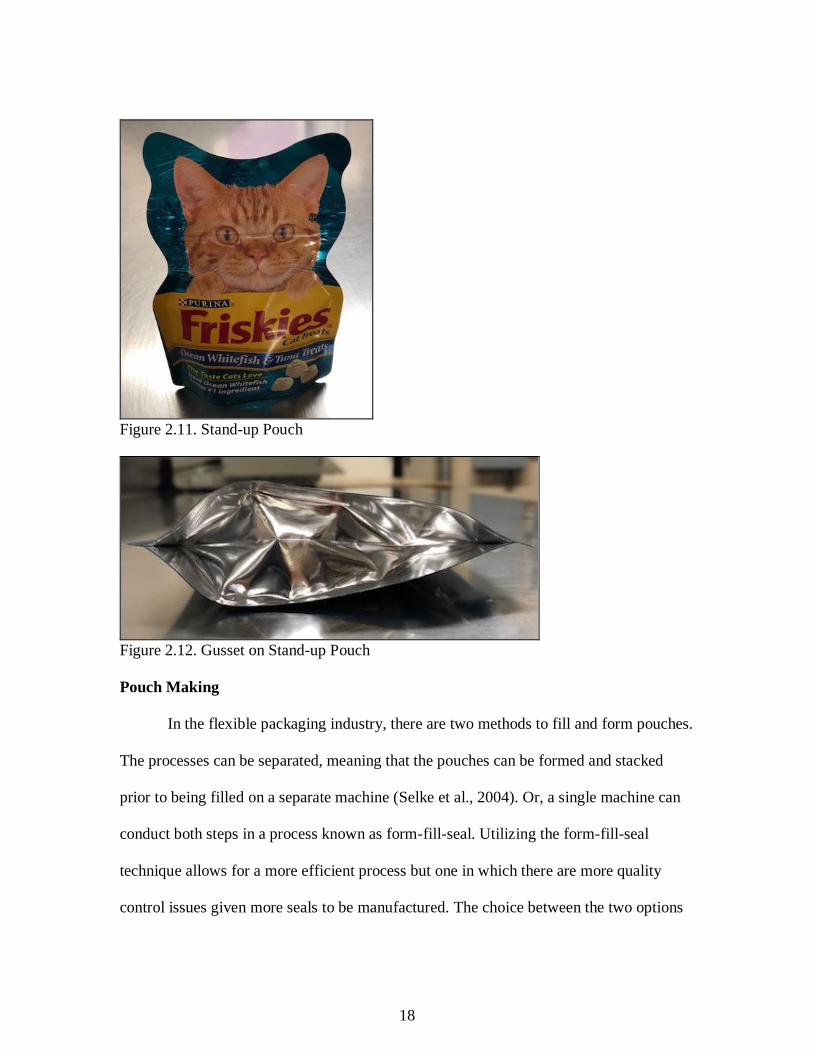
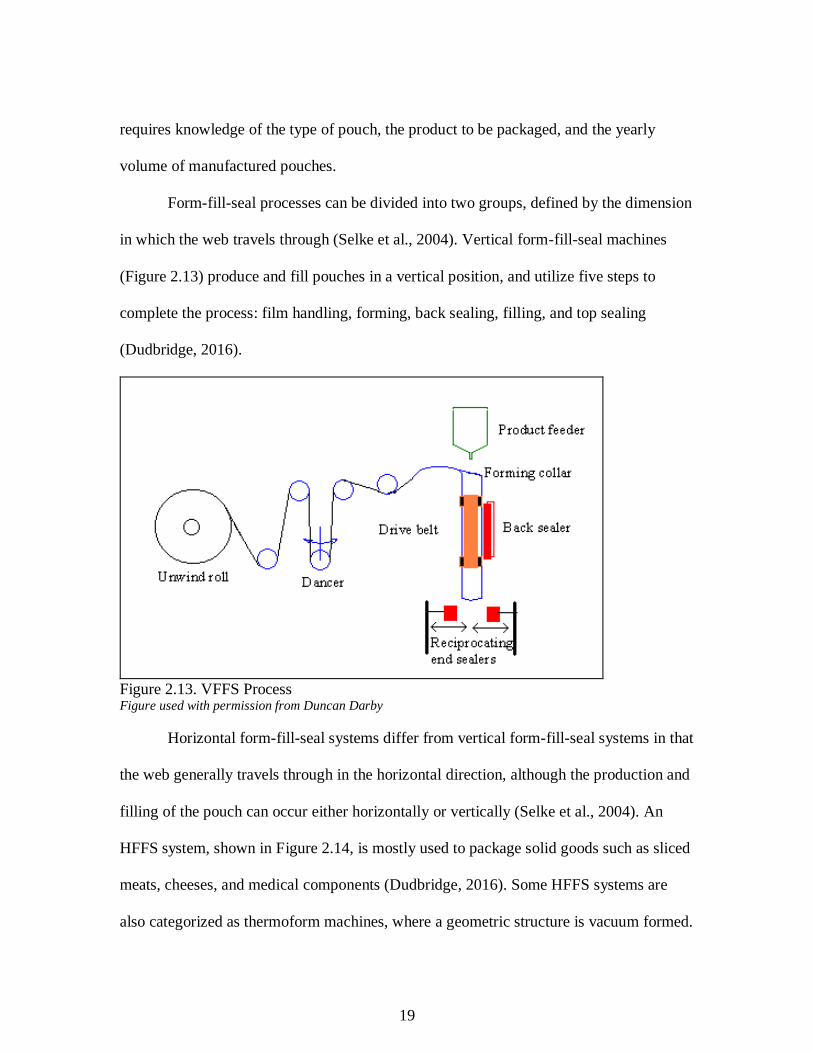
A stand up pouch, shown in Figure 2.11, is a type of pouch that can support itself
in a vertical position when a load is applied to the gusset of the pouch (Selke et al., 2004).
The gusset, shown in Figure 2.12, increases in area when a load is applied and supplies a
sufficiently rigid base that allows the pouch to assume a vertical position. Stand up
pouches are used to contain both solids and liquids, and have increasingly replaced rigid
structures such as metal cans and plastic bottles.
18
Figure 2.11. Stand-up Pouch
Figure 2.12. Gusset on Stand-up Pouch
Pouch Making
In the flexible packaging industry, there are two methods to fill and form pouches.
The processes can be separated, meaning that the pouches can be formed and stacked
prior to being filled on a separate machine (Selke et al., 2004). Or, a single machine can
conduct both steps in a process known as form-fill-seal. Utilizing the form-fill-seal
technique allows for a more efficient process but one in which there are more quality
control issues given more seals to be manufactured. The choice between the two options
19
requires knowledge of the type of pouch, the product to be packaged, and the yearly
volume of manufactured pouches.
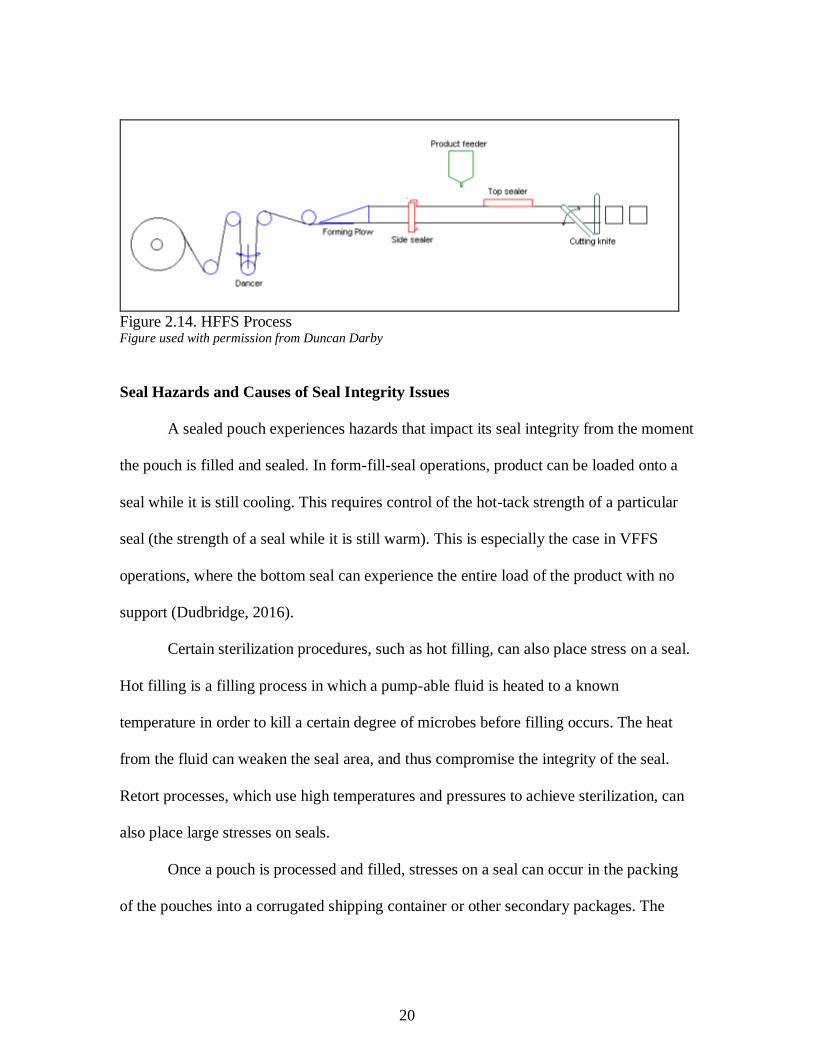
Form-fill-seal processes can be divided into two groups, defined by the dimension
in which the web travels through (Selke et al., 2004). Vertical form-fill-seal machines
(Figure 2.13) produce and fill pouches in a vertical position, and utilize five steps to
complete the process: film handling, forming, back sealing, filling, and top sealing
(Dudbridge, 2016).
Figure 2.13. VFFS Process Figure used with permission from Duncan Darby
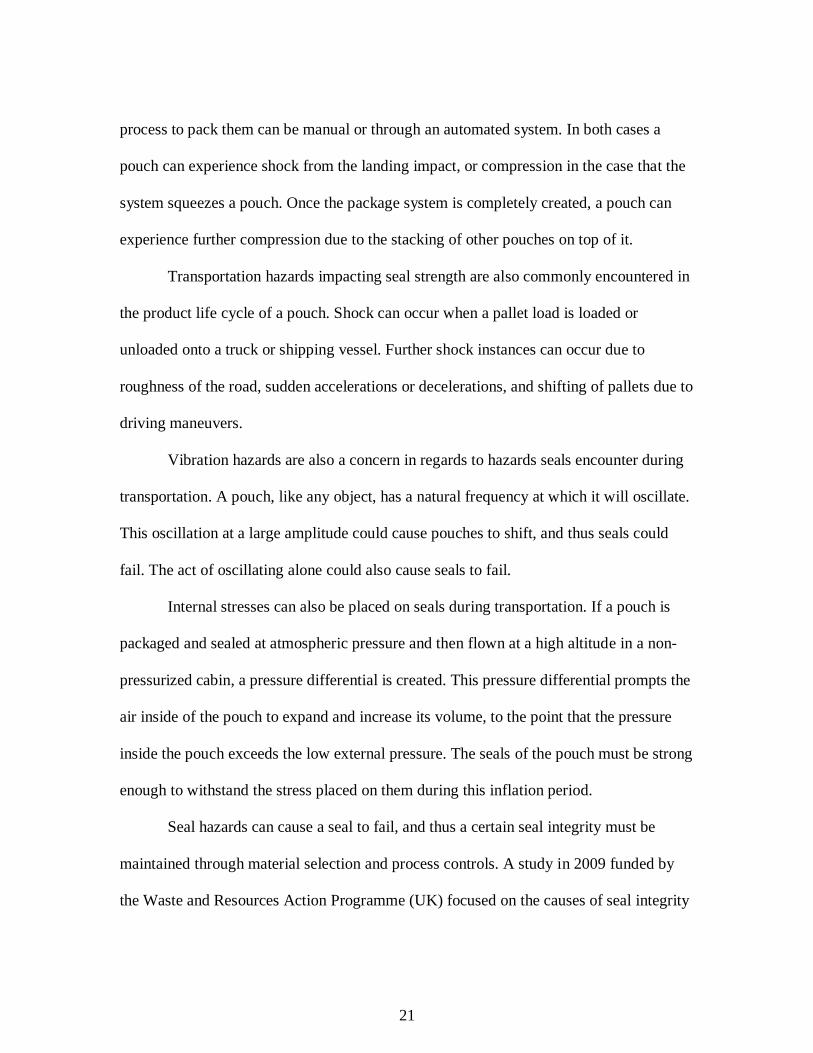
Horizontal form-fill-seal systems differ from vertical form-fill-seal systems in that
the web generally travels through in the horizontal direction, although the production and
filling of the pouch can occur either horizontally or vertically (Selke et al., 2004). An
HFFS system, shown in Figure 2.14, is mostly used to package solid goods such as sliced
meats, cheeses, and medical components (Dudbridge, 2016). Some HFFS systems are
also categorized as thermoform machines, where a geometric structure is vacuum formed.
20
Figure 2.14. HFFS Process Figure used with permission from Duncan Darby
Seal Hazards and Causes of Seal Integrity Issues
A sealed pouch experiences hazards that impact its seal integrity from the moment
the pouch is filled and sealed. In form-fill-seal operations, product can be loaded onto a
seal while it is still cooling. This requires control of the hot-tack strength of a particular
seal (the strength of a seal while it is still warm). This is especially the case in VFFS
operations, where the bottom seal can experience the entire load of the product with no
support (Dudbridge, 2016).
Certain sterilization procedures, such as hot filling, can also place stress on a seal.
Hot filling is a filling process in which a pump-able fluid is heated to a known
temperature in order to kill a certain degree of microbes before filling occurs. The heat
from the fluid can weaken the seal area, and thus compromise the integrity of the seal.
Retort processes, which use high temperatures and pressures to achieve sterilization, can
also place large stresses on seals.
Once a pouch is processed and filled, stresses on a seal can occur in the packing
of the pouches into a corrugated shipping container or other secondary packages. The
21
process to pack them can be manual or through an automated system. In both cases a
pouch can experience shock from the landing impact, or compression in the case that the
system squeezes a pouch. Once the package system is completely created, a pouch can
experience further compression due to the stacking of other pouches on top of it.
Transportation hazards impacting seal strength are also commonly encountered in
the product life cycle of a pouch. Shock can occur when a pallet load is loaded or
unloaded onto a truck or shipping vessel. Further shock instances can occur due to
roughness of the road, sudden accelerations or decelerations, and shifting of pallets due to
driving maneuvers.
Vibration hazards are also a concern in regards to hazards seals encounter during
transportation. A pouch, like any object, has a natural frequency at which it will oscillate.
This oscillation at a large amplitude could cause pouches to shift, and thus seals could
fail. The act of oscillating alone could also cause seals to fail.
Internal stresses can also be placed on seals during transportation. If a pouch is
packaged and sealed at atmospheric pressure and then flown at a high altitude in a non-
pressurized cabin, a pressure differential is created. This pressure differential prompts the
air inside of the pouch to expand and increase its volume, to the point that the pressure
inside the pouch exceeds the low external pressure. The seals of the pouch must be strong
enough to withstand the stress placed on them during this inflation period.
Seal hazards can cause a seal to fail, and thus a certain seal integrity must be
maintained through material selection and process controls. A study in 2009 funded by
the Waste and Resources Action Programme (UK) focused on the causes of seal integrity
22
issues and their impact on food waste (Dudbridge & Turner, 2009). The researchers
found that seal integrity issues in food production plants are primarily impacted by food
contaminates in the sealing area. The second largest cause of seal integrity issues was
seal parameter settings, where the packages were not sealed at the correct temperature,
time, and/or pressure. Other seal integrity instances, in minor quantities, were due to
operator interference.
Quantifying Seal Strength in Pouches
There are multiple ways to quantify the seal strength in a flexible pouch. The
different tests can be split up into two groups, non-destructive testing and destructive
testing (Dudbridge, 2016). Non-destructive testing is an approach that is normally
accomplished inline, and is utilized as a quality check system. These tests include
mechanical squeeze tests, vacuum decay tests, and computer vision systems.
Destructive tests occur when a quality technician tests a single pouch to obtain a
single quantity. Destructive tests are categorized as either burst tests or seal peel tests.
The tests are destructive in nature because they require the technician to either cut the
pouch, or pressurize the pouch until failure. Tensile tests require an isolated seal area to
be tested, while burst tests pressurize a pouch until failure by utilizing a pressure
differential.
ASTM F88/F88M, “Standard Test Method for Seal Strength of Flexible Barrier
Materials”, is a method used to quantify the seal strength of a flexible film sealed to
another flexible film, or a flexible film sealed to a rigid structure (ASTM standard F88
2015). To complete the test, a testing specimen must first be cut to the dimensions of one-
23
inch-wide (25.4 mm) by at least three inches (76.2 mm) long. The specimen is then
loaded into an approved tensile tester. From there, the operator has the option to support
the tail at 90° or 180°, or run the test unsupported. The crosshead speed should be
between 8 and 12 inches/minute (203.2 and 304.8 mm/minute), and the output of the test
is a graph of extension versus force. After the test, the standard calls for the operator to
determine the failure mechanism (Figures 2.1-2.7), and the determining measurement.
The determining measurement can be either an average load (peelable seal), or a peak
force (fusion seal).
ASTM F1140/F1140M, “Standard Test Methods for Internal Pressurization
Failure Resistance of Unrestrained Packages”, is a single standard that offers three
options to quantify containment strength of a pouch (ASTM standard F1140 2013). Test
Method A is a traditional unrestrained burst test, while Test Method B and C are a creep
test and creep to failure test, respectively.
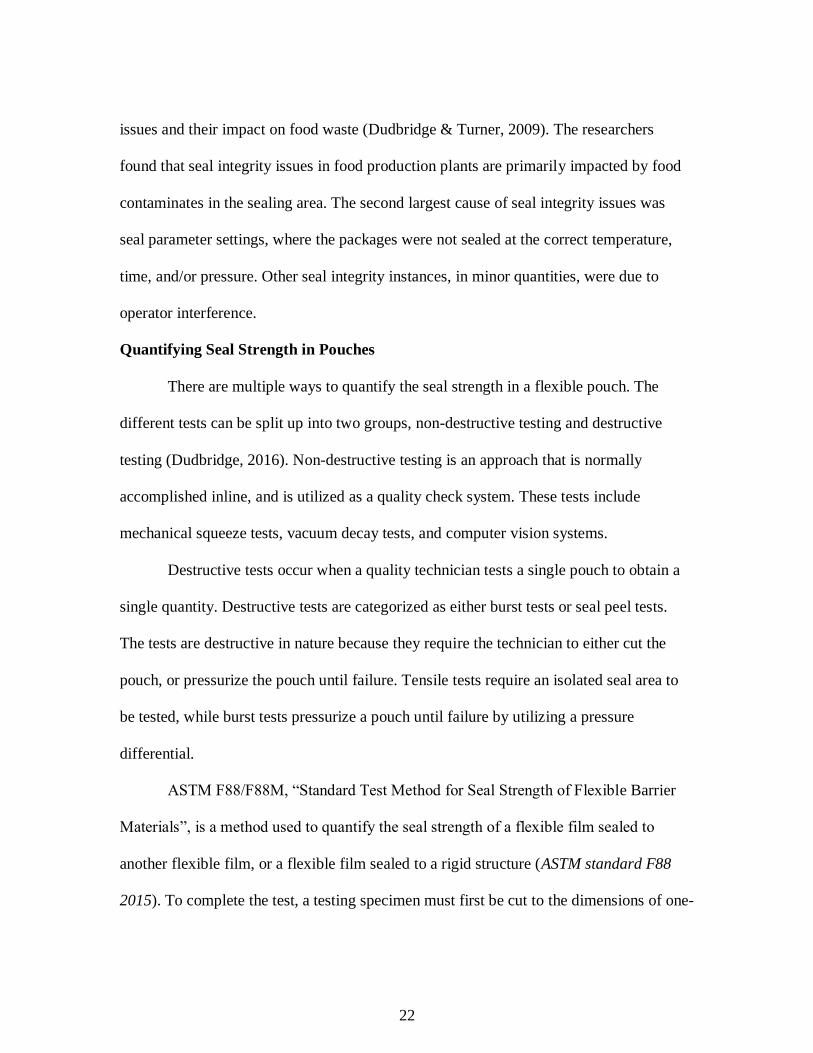
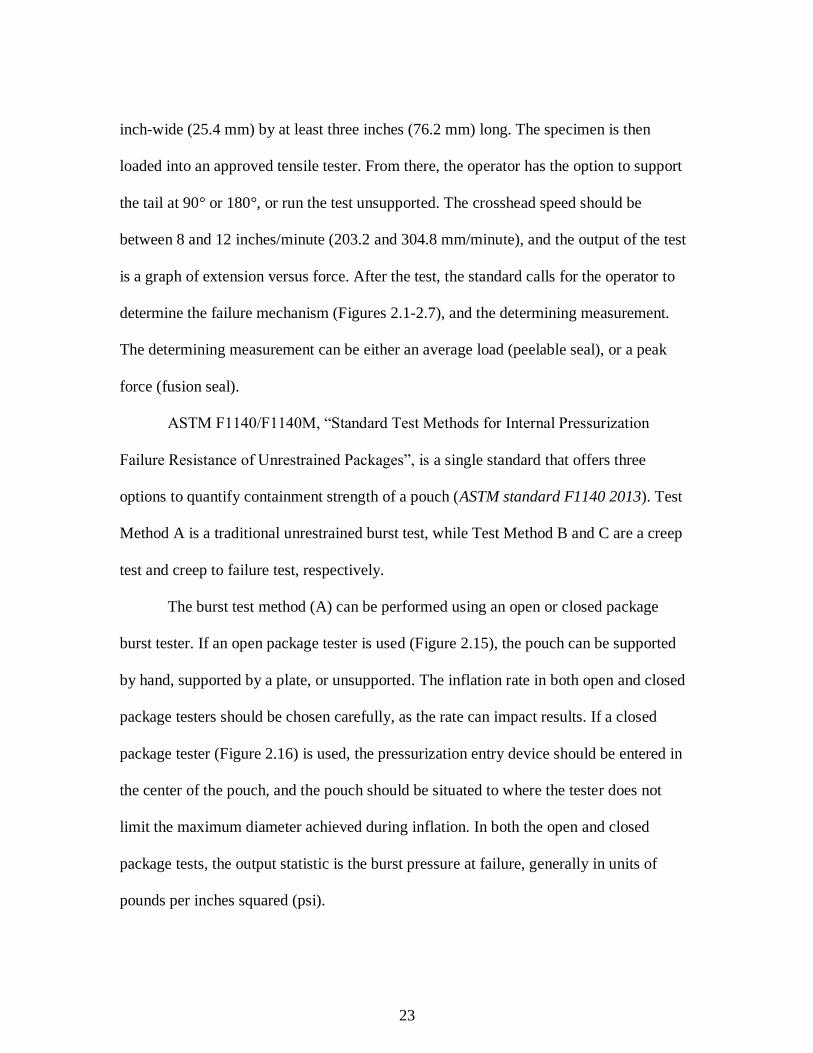
The burst test method (A) can be performed using an open or closed package
burst tester. If an open package tester is used (Figure 2.15), the pouch can be supported
by hand, supported by a plate, or unsupported. The inflation rate in both open and closed
package testers should be chosen carefully, as the rate can impact results. If a closed
package tester (Figure 2.16) is used, the pressurization entry device should be entered in
the center of the pouch, and the pouch should be situated to where the tester does not
limit the maximum diameter achieved during inflation. In both the open and closed
package tests, the output statistic is the burst pressure at failure, generally in units of
pounds per inches squared (psi).
24
Figure 2.15. Open Pouch Burst Tester
Figure 2.16. Closed Pouch Burst Tester
25
ASTM F2054/2054M, “Standard Test Method for Burst Testing of Flexible
Package Seals Using Internal Air Pressurization Within Restraining Plates”, is similar to
ASTM F1140 but uses restraining plates that focus the stress along the perimeter of the
pouch (ASTM standard F2054 2013). Because of the uniform stress distribution, ASTM
suggests that method 2054 might be a more efficient way to isolate the weakest sealing
area. ASTM also suggests that method 2054 is directed at testing seals with a peelable
failure mechanism.
As is the case with ASTM F1140, both an open-package tester and a closed-
package tester can be used in ASTM F2054. The test should be run until failure, and the
rate of inflation should be selected to allow the result to be repeatable. A plate gap, or gap
between the base of the tester and top of the plate should be selected to assure that 60%
of the inflated package surface area fully contacts the plate surface. The plate gap can
either be 25.5, 12.7, or 6.5 mm. To calculate the inflated package surface area in contact
with the plate surface at a specific plate gap, ASTM F2054 offers Equation 1 below
(1)
where:
𝑍 = Percentage of package structure in contact with
restraining plates
𝑊 = Package width (inner dimension from seal to seal)
𝐿 = Package Length (inner dimension from seal to seal)
𝐷 = Plate gap dimension selected
26
𝑥 = Lesser value of W or L, and
𝜋 = 3.141593
If the resultant value of Z is greater than 60%, then the inputted plate gap dimension can
be used for testing. Anything less than 60% of surface area contact risks the pouch not
being fully restrained during testing.
ASTM D 642, “Standard Test Method for Determining Compressive Resistance
of Shipping Containers, Components, and Unit Loads”, is a test standard that is normally
utilized for shipping containers or components (ASTM Standard D642 2015). However,
the fixed platen compression tester required for the test can be used to compress flexible
pouches. Essentially, a package is placed onto the compression tester, loaded with an
initial pressure, and then compressed until failure. If used with flexible pouches, care
should be taken when correlating with inflation burst testers given that a compression
tester utilizes an external pressure.
Need for a Relationship Between Burst Pressure and Peel Strength in Pouches
Seal peel tests and burst tests both result in quantities used to measure the
containment strength of a pouch, but each has their own place in industry. One could
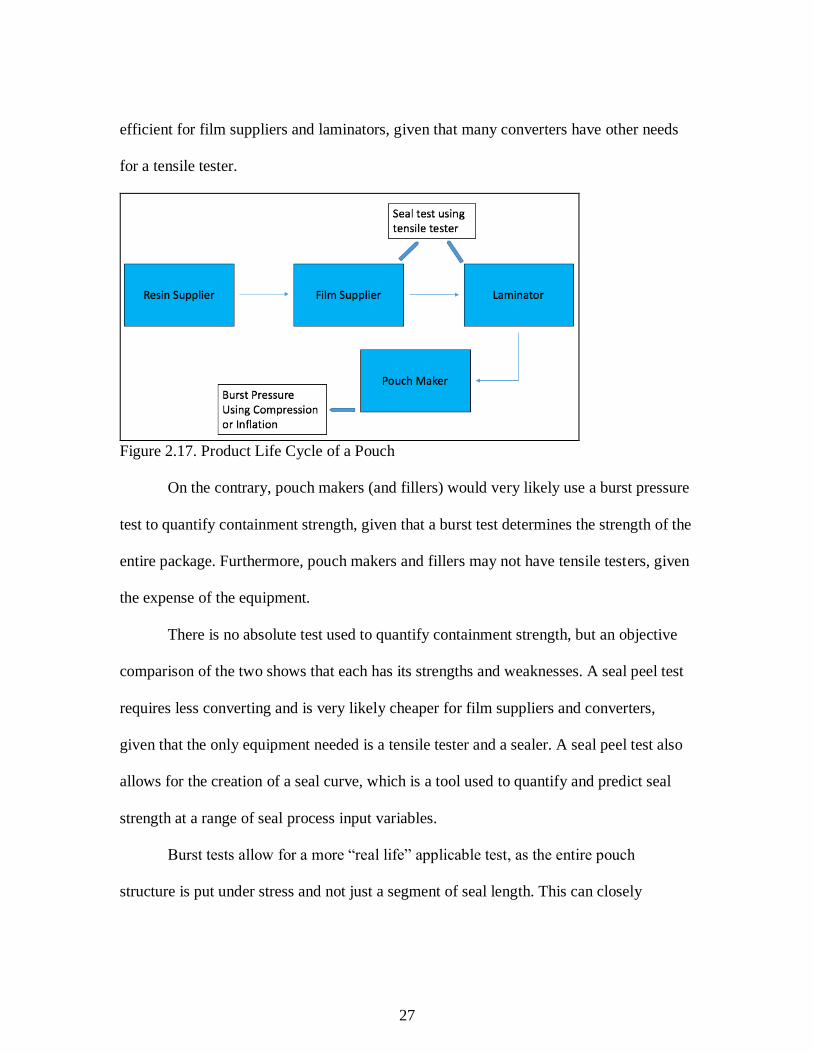
illustrate the use of each test using the product life cycle of a pouch, shown in Figure
2.17. It is common for material converters such as film suppliers and laminators to use a
seal peel test due to the lack of equipment or time available to produce a pouch.
Furthermore, many film suppliers and laminators do not have burst testers, making the
inability to produce a pouch a moot point. Utilizing the seal peel method is also more
27
efficient for film suppliers and laminators, given that many converters have other needs
for a tensile tester.
Figure 2.17. Product Life Cycle of a Pouch
On the contrary, pouch makers (and fillers) would very likely use a burst pressure
test to quantify containment strength, given that a burst test determines the strength of the
entire package. Furthermore, pouch makers and fillers may not have tensile testers, given
the expense of the equipment.
There is no absolute test used to quantify containment strength, but an objective
comparison of the two shows that each has its strengths and weaknesses. A seal peel test
requires less converting and is very likely cheaper for film suppliers and converters,
given that the only equipment needed is a tensile tester and a sealer. A seal peel test also
allows for the creation of a seal curve, which is a tool used to quantify and predict seal
strength at a range of seal process input variables.
Burst tests allow for a more “real life” applicable test, as the entire pouch
structure is put under stress and not just a segment of seal length. This can closely
28
simulate real life hazards such as compression forces and atmospheric changes that a
pouch may experience during transportation. Burst tests also can simultaneously
determine the weakest seal area of the pouch, and can help pinpoint quality control issues
due to sealing. The downside to burst tests is that there is much more converting
involved, given the need to create an actual pouch.
Both tests are useful in industry, but a problem arises when material converters
and pouch makers attempt to communicate using the two different tests. The differences
in the test are obvious, but the two tests also yield different units. A seal peel test yield
units of force divided by width of seal while a burst test gives units of force divided by
area. It can be reasonably assumed that as peel strength increases, so does burst strength,
but the simple correlation of the two lends little importance. An actual established
relationship between the two would allow for effective communication between pouch
makers and material converters.
Past Research
To quantify the relationship between seal peel strength and burst pressure in a
flexible pouch, one must equate a force acting on a line to a force acting on an area. The
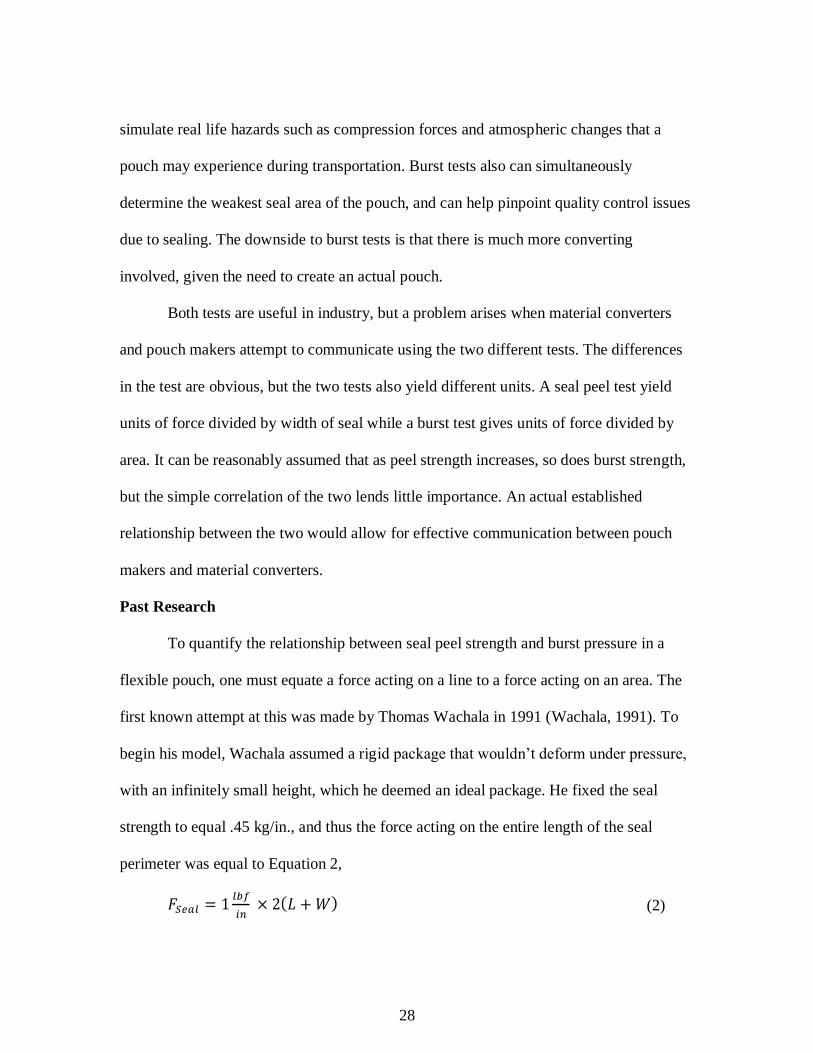
first known attempt at this was made by Thomas Wachala in 1991 (Wachala, 1991). To
begin his model, Wachala assumed a rigid package that wouldn’t deform under pressure,
with an infinitely small height, which he deemed an ideal package. He fixed the seal
strength to equal .45 kg/in., and thus the force acting on the entire length of the seal
perimeter was equal to Equation 2,
(2)
29
where:
FSeal = Force Acting on Entire Perimeter of Seal (lbf)
L = Length (in)
W = Width (in)
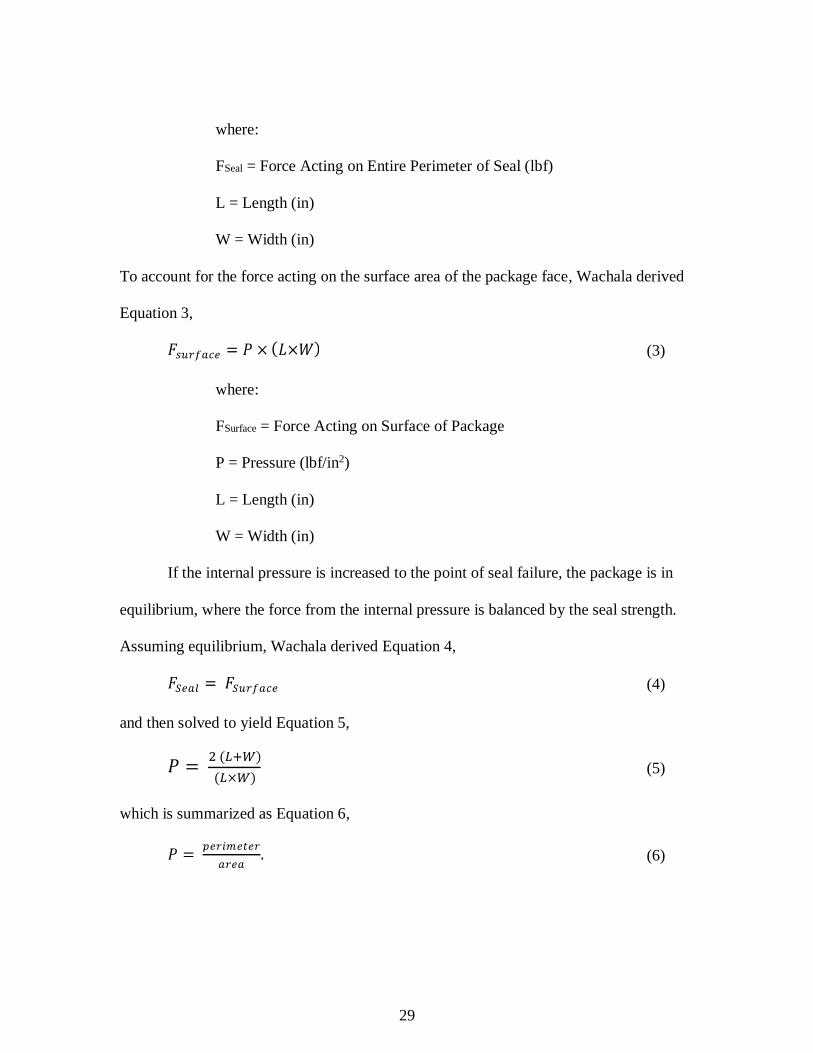
To account for the force acting on the surface area of the package face, Wachala derived
Equation 3,
(3)
where:
FSurface = Force Acting on Surface of Package
P = Pressure (lbf/in2)
L = Length (in)
W = Width (in)
If the internal pressure is increased to the point of seal failure, the package is in
equilibrium, where the force from the internal pressure is balanced by the seal strength.
Assuming equilibrium, Wachala derived Equation 4,
(4)
and then solved to yield Equation 5,
(5)
which is summarized as Equation 6,
(6)
30
Given that pouches are not innately rectangular when inflated and do have a
certain height, Wachala attempted to account for the height of the pouch as well as the
actual shape a pouch takes when inflated. At this point, Wachala redefines a circular
package that will behave as the ideal one, where a perfectly circular cross section is
attained, and the tangent angle at the seal surface is equal to 90°. From there, Wachala
equated the circumference of the circular cross section (inflated) to the total width
(uninflated) and solved for the diameter to yield Equation 7,
(7)
where:
D = Diameter
W = Width
To account for the cylindrical shape, the depth, or length of the shape must be
brought in to the model. Thus, the total force on the seal is equal to the internal pressure
multiplied by the area of the cylindrical shape, shown in Equation 8 below
(8)
where:
FSeal= Force Acting on Entire Perimeter of Seal (lbf)
P = Pressure (lbf/in2)
W= Width of Uninflated Package (in)
L= Length Along Seal Surface (in)
However, Wachala then states that the tangent angle to the seal surface is not
exactly 90°, indicating that the cross sectional shape is elliptical and not circular. At this
31
point in the study, Wachala (1991) states, “the direct correlation between burst and peel is
beginning to deteriorate” (p. 56). Furthermore, end effects caused by the clamping device
in an open package burst tester must be taken into account, as should the length to width
ratio. All of these actual conditions combine to indicate that a pouch during inflation is
not truly the “ideal package” as theorized by Wachala.
Wachala then explains that his model is only designed for a rough approximation,
given that his model is for an ideal package and does not account for deformation during
inflation. If the margin of error is to be reduced below the 20-30% range, a hybrid
correlation is to be used.
Wachala derived a hybrid equation by plotting actual burst test values versus
increasing package length to obtain a pressure-versus-length graph. On the same graph,
the theoretical values were plotted (from Equation 5), and a mathematical formula was
derived to provide a correlation. In the case of Wachala’s data, the best correction factor
curve was in the form of a quadratic equation. From there, a general correlation equation
was derived, shown in Equation 9
(9)
where:
L= Package Length (in)
W=Package Width (in)
A,B,C= Coefficients from Quadratic Equation
32
Applying the correlation factor to the ideal equation yields Equation 10, and
through this method, Wachala was able to devise a correlation table that could be
industrially applied.
(10)
Kit L. Yam, Jack Rossen, and Xuan-Fei Wu derived an equation that related peel
seal strength and burst pressure, when the burst pressure is attained with a restrained plate
closed package burst tester (Yam, Rossen, & Wu, 1993). The authors theorized that,
during a restrained burst test, the internal force from inflation is balanced by the
reactionary force from the plates. Given that a pouch is flexible, the force from the air
pressure triggers a tensile force at the seal interface. This tensile force causes the pouch to
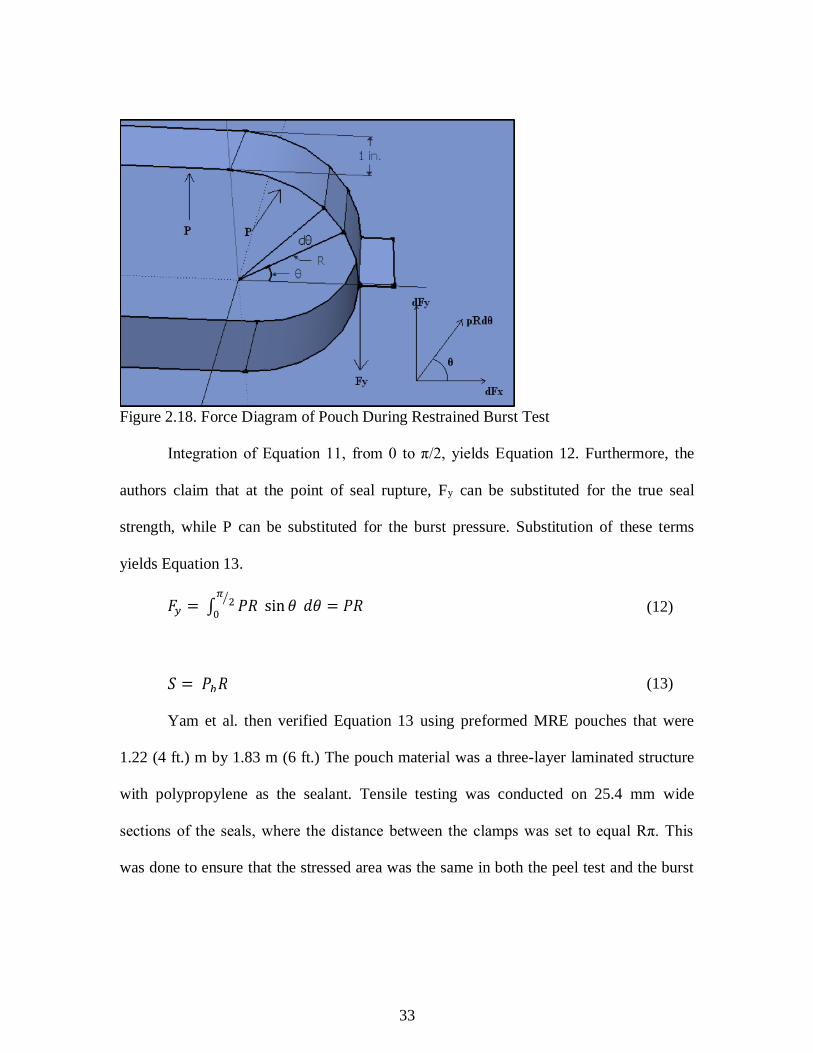
take on an approximate semi-circular shape at the point of seal, as shown in Figure 2.18.
Thus, the force in the y-direction can be expressed as Equation 11
(11)
where:
Fy = Force Peeling 1 Inch Width of Seal
P = Internal Pressure
R = Half of Set Plate Gap Distance
𝜽 = Angle Shown in Figure 2.18
33
Figure 2.18. Force Diagram of Pouch During Restrained Burst Test
Integration of Equation 11, from 0 to π/2, yields Equation 12. Furthermore, the
authors claim that at the point of seal rupture, Fy can be substituted for the true seal
strength, while P can be substituted for the burst pressure. Substitution of these terms
yields Equation 13.
(12)
(13)
Yam et al. then verified Equation 13 using preformed MRE pouches that were
1.22 (4 ft.) m by 1.83 m (6 ft.) The pouch material was a three-layer laminated structure
with polypropylene as the sealant. Tensile testing was conducted on 25.4 mm wide
sections of the seals, where the distance between the clamps was set to equal Rπ. This
was done to ensure that the stressed area was the same in both the peel test and the burst
34
test. The authors tested several crosshead speeds and attained the peak force for each test,
while also calculating the actual peel time using Equation 14
(14)
where:
tp= Tensile Peeling Time
ΔL= Elongation at Seal Strength (in.)
v= Crosshead Speed (in./min)
The unsealed side of each pouch was then sealed and the burst testing was
conducted at different plate gaps. After each test, the burst pressure was attained and the
burst peeling time was found, which was the time between initial pressurization and
failure. In terms of the failure mechanism, the authors stated that “all pouches tested were
found to rupture at the seals, indicating that the seals were the weakest part” (Yam et al.,
1993).
Yam et al. then analyzed different aspects of the data. They found that seal peel
strength is proportional to crosshead speed and inversely proportional to seal peel time.
The burst pressure data was also related similarly, where burst pressure was inversely
related to burst peeling time.
The validity of the model was then analyzed by plotting the observed burst
pressures versus the predicted burst pressures for data at each plate gap. Furthermore, the
observed burst values at each plate gap were plotted versus the plate separation, and the
theoretical curve (P=S/R) was superimposed onto the same graph. Overall, the observed
burst values were indicated to be in “good agreement” with the predicted burst values
35
(Yam et al., 1993). It should be noted that the seal strengths presented in the article
indicate that fusion seals were tested.
The authors conclude that when using their conjectured model, close attention
should be paid to make sure the burst peeling and seal peeling times are controlled, given
that both impact their respective strength values.
In 1999, a broad study was conducted by Stephen Franks and Donald Barcan to
determine the impacts of different variables on the relationship between seal peel and
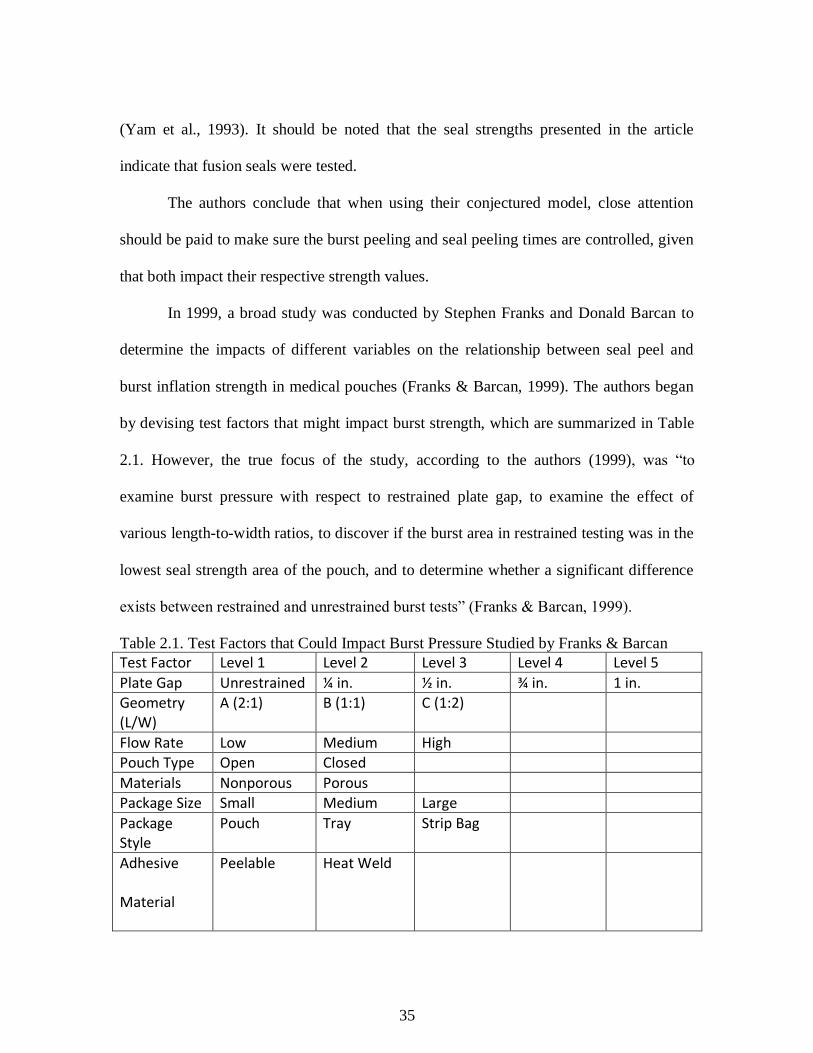
burst inflation strength in medical pouches (Franks & Barcan, 1999). The authors began
by devising test factors that might impact burst strength, which are summarized in Table
2.1. However, the true focus of the study, according to the authors (1999), was “to
examine burst pressure with respect to restrained plate gap, to examine the effect of
various length-to-width ratios, to discover if the burst area in restrained testing was in the
lowest seal strength area of the pouch, and to determine whether a significant difference
exists between restrained and unrestrained burst tests” (Franks & Barcan, 1999).
Table 2.1. Test Factors that Could Impact Burst Pressure Studied by Franks & Barcan
Test Factor Level 1 Level 2 Level 3 Level 4 Level 5
Plate Gap Unrestrained ¼ in. ½ in. ¾ in. 1 in.
Geometry (L/W)
A (2:1) B (1:1) C (1:2)
Flow Rate Low Medium High Pouch Type Open Closed
Materials Nonporous Porous
Package Size Small Medium Large
Package Style
Pouch Tray Strip Bag
Adhesive
Material
Peelable Heat Weld
36
The results from the study showed that burst pressure was inversely proportional
to plate gap, as was the case in the data attained by Yam et al. (1993). The pouch length
to width ratio also had some impact, as the burst pressure for each pouch length to width
ratio were significantly different. This was the case at each plate gap tested. Statistical
analysis was not done to confirm if the burst pressures were statistically higher or lower
than one another for particular ratios, but observation of the data shows that geometry A
(Table 2.1) yielded the highest burst pressure on average.
To correlate the data from the seal peel tests and the burst tests, the two were
plotted against each other with an increase in seal jaw temperature. No model was
defined or presented in the study to determine a true relationship. Instead, a correlation
coefficient value of greater than 0.94 (R>0.94) was presented, indicating that the two are
proportionally related.
Qualitative correlation of the two tests was also done, where the authors
determined if the burst failure location was in the lowest seal strength area. The results
from this portion of the study indicate that, depending on the length to width ratio, the
plate gap might need to be lowered to attain a consistent burst failure location.
Furthermore, the authors concluded that seal input process variables (temperature, time,
pressure) can be varied to attain more consistent control of the burst location.
Rosamari Feliú-Báez, from the Michigan State School of Packaging, has done
much work to understand factors impacting burst pressure, as well as work to quantify a
mathematical relationship between burst pressure and seal peel strength. Her Master of
37
Science thesis, “Analysis and Evaluation of Burst Test Methods Using Restraining
Fixtures”, consisted of three sections (Feliú-Báez, 1998). The first section focused on the
burst testing of blister packages, while the second and third sections focused on the burst
testing of chevron seal pouches and the correlation of seal peel and burst tests,
respectively.
Prior to testing, Feliú-Báez developed force analysis models for unrestrained and
restrained burst tests. The unrestrained force analysis yielded Equation 15, shown below
(l5)
where:
P=Burst Pressure (lbf/in2)
S=Seal Peel Strength (lbf/in)
W=Package Width
This allowed Feliú-Báez to predict that, for unrestrained burst tests, burst pressure is
inversely proportional to package width. Also, it was predicted that burst pressure is
independent of the package length in unrestrained burst tests.
The restrained force analysis yielded Equation 16, which is the same as the
equation Yam et al. (1993) derived, except for differences in expression.
(16)
where:
P=Burst Pressure (lbf/in2)
S=Seal Peel Strength (lbf/in)
D=Plate Gap Length
38
There were several significant results from part two of the thesis (pouch testing
portion). Feliú-Báez found that restrained burst test values, for every plate gap, were
higher than the unrestrained burst test values. Also, burst values were inversely correlated
with plate gap size. In both the case for the restrained and unrestrained burst tests, burst
pressure values decreased as the pouch perimeter (size) increased. Lastly, Baez suggested
that a smaller plate gap (0.25 in) might contribute to more variance in burst pressure,
although no statistical difference of variances was observed between unrestrained and
restrained burst testing.
The third part of the thesis was seemingly formulated into a journal article,
“Correlation of Peel and Burst Tests for Pouches” (Feliú-Báez, Lockhart, & Burgess,
2001). In the paper, the authors evaluated Equation 16 as a possible model to relate
restrained plate burst pressure and seal strength.
The authors used “Tyvek/plastic” chevron seal pouches, and controlled the burst
peeling times and the tensile peeling times. For the burst testing, plate gaps of 0.25, 0.50,
and 1.0 inches were tested, as were different inflation flow rates at each plate gap. The
burst peeling time was recorded for each test, which was calculated as the time between
initial pressurization and pouch failure.
For the seal peel testing, the gauge length (length between clamps) was set to
πD/2, so that the length of the peel specimen was the same as the unrestrained portion of
the pouch in burst testing. The equivalent crosshead speed for the seal peel test was
calculated by rearranging Equation 14. This ensured the seal peel time was the same as
the burst peel time.
39
The authors conducted unsupported seal peel tests on eight total pouches, in four
seal locations each. The peak value was taken as the measurement quantity, but the
authors do note that the average seal strength might be a more impactful measurement.
Two seal strength values were used to determine the validity of the model. The total seal
strength value, STotal, was calculated as the average for all 32 tests (n=32). The minimum
seal strength value, SMin, was the average of the lowest value for each pouch (n=8).
Both seal peel strength values were substituted into the conjectured equation to
obtain predicted burst pressures. The results from the study indicated that the predicted
values were closer to the observed when SMin was used, although both overestimated the
observed values. The authors also found that the overestimation had an inversely
proportional relationship with the plate gap i.e. burst pressures were higher at smaller
plate gaps.
Feliú-Báez’s PhD dissertation built off of her previous findings that package size
might have some impact on burst pressure (Feliú-Báez 2001). Seemingly summarized in
the article, “Correlating Peel and Burst Tests for Sterile Medical Device Packages”, the
work provided a new proposed model for the relationship (Feliú-Báez, Lockhart, &
Burgess, 2003). In the theorized model, an attempt was made to account for the package
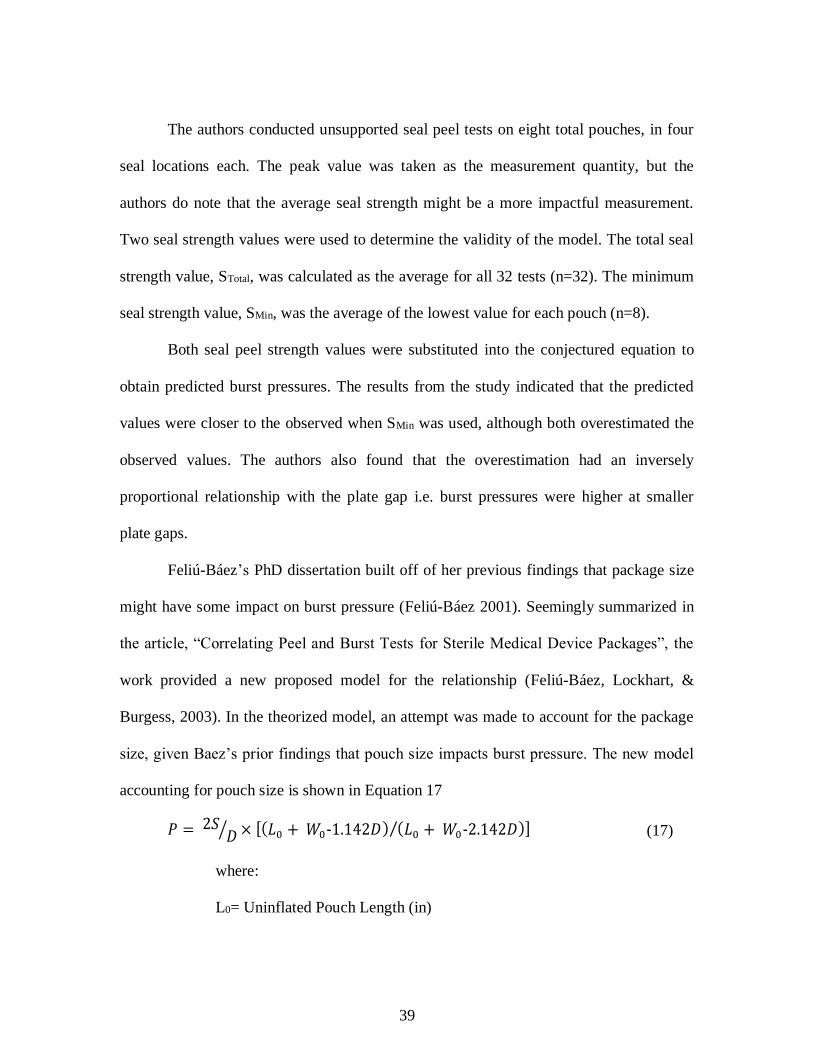
size, given Baez’s prior findings that pouch size impacts burst pressure. The new model
accounting for pouch size is shown in Equation 17
(17)
where:
L0= Uninflated Pouch Length (in)
40
W0= Uninflated Pouch Width (in)
D= Restraining Plate Gap (in)
S= Seal Peel Strength (lbf/in)
P=Burst Pressure (psi)
The bracketed term was deemed the “correction factor”, and because it equates to
a number larger than 1, the authors presumed that the burst pressure would be even more
overestimated than Equation 16 alone. Because of the increased overestimation of the
new model, an empirical approach was used as well. Multiple regression analysis of
experimental data was used to fit a power law model.
The authors tested three different empirical models, as well as Equations 16 and
17. Pertinent findings were that the average peel force yielded lower percent errors
compared to the peak seal force. Also, all three empirical models contained lower
average percent error than the theoretical models. The average percent errors between
actual and predicted burst pressure values were between 1% and 7%.
Alex Bernal, a graduate student in the Packaging Science Department at Clemson
University, wrote a thesis titled “Relating Burst Pressure to Seal Peel Strength in
Pouches” (Bernal, 2012). The work done by Bernal was possibly the first study to
account for measurement error in the statistics of the relationship between burst pressure
and seal peel strength. Also, a large sample size was used for both the burst testing and
the seal peel testing.
Bernal tested the validity of the equation developed by Yam et al. (Equation 13),
where if the conjectured model is true, a plot of burst pressure versus seal strength would
41
yield a slope of the actual plate gap. Regression analysis was used to obtain the slope
coefficient estimates.
Furthermore, Bernal observed that both tests are destructive, meaning that a burst
pressure value and seal peel strength value cannot be taken off of the same pouch. To
account for this error, Bernal substituted a ‘proxy’ burst pressure in place of the
unobtainable true burst pressure (given such pouch was destroyed by seal peel test). An
instrument variable, seal dwell time, was regressed onto the proxy to develop consistent
estimators for the slope and y-intercept coefficients in the regression analysis (Bernal,
2012). Without this statistical treatment, the quality of the relationship between seal
strength and burst pressure may be overstated.
Bernal’s research design was based on obtaining five sealing conditions that
yielded peelable seals that were statistically different. Dwell time was chosen as the
changing variable, while pressure and temperature were kept constant. After obtaining
the five dwell times that yielded peelable seals, Bernal randomized an experiment that
tested fifteen bursts and fifteen seal peel tests at different plate gaps. Bursts were tested
first, so that seal peel pull rate could be calculated based on the burst peel time.
Results from Bernal’s study indicated that Equation 13 only worked for the 0.25-
inch plate gap. The model did not work for the compression burst test, the unrestrained
burst test, and the 0.5- inch and 1.0-inch plate gaps. He then derived empirical equations
based on the actual slope estimates attained from the regression analysis. Comparison of
predicted versus actual burst pressures using the empirical equations yielded percent
errors ranging between 0% and 28%.
42
Perhaps a determining factor in the relationship between burst pressure and seal
peel strength is hoop stress. Hoop stress is a term used in thin-walled pressure vessel
theory. A thin walled pressure vessel is described as a perfectly cylindrical vessel where
the walls are assumed to be very thin. A rule of thumb for the wall thickness is that R/t >
10, where R equals the radius of the vessel and t equals the wall thickness (Ibrahim, Ryu,
& Saidpour, 2015).
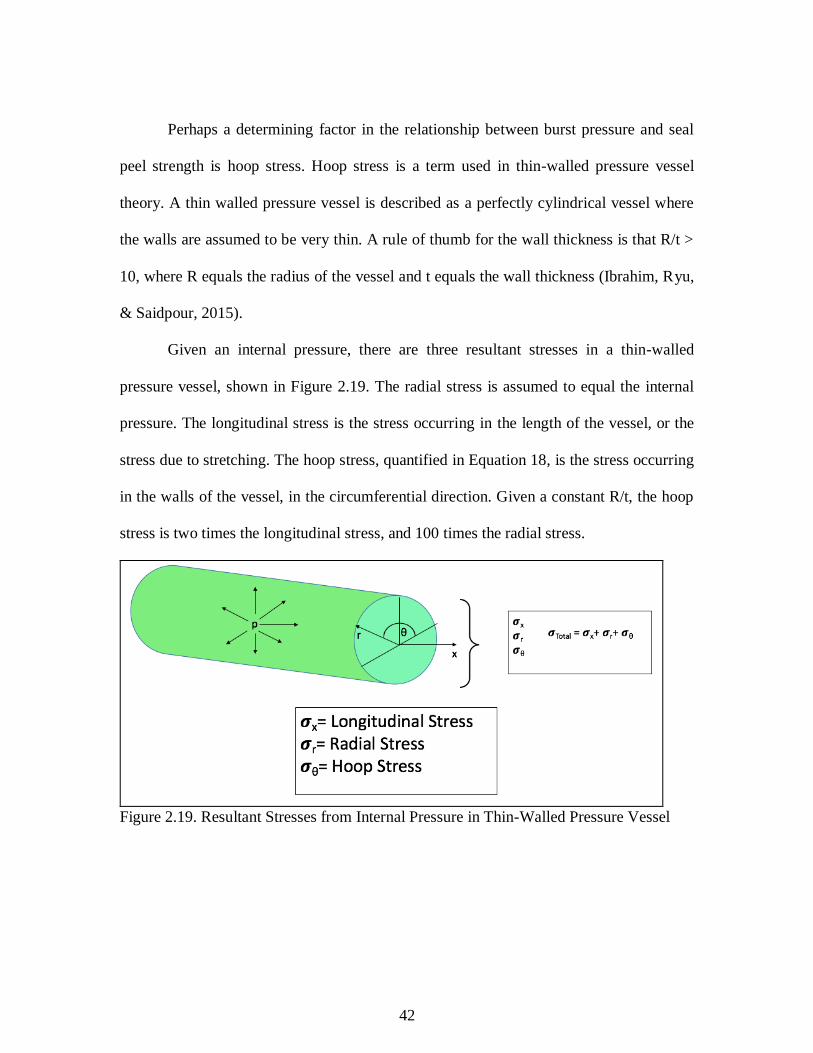
Given an internal pressure, there are three resultant stresses in a thin-walled
pressure vessel, shown in Figure 2.19. The radial stress is assumed to equal the internal
pressure. The longitudinal stress is the stress occurring in the length of the vessel, or the
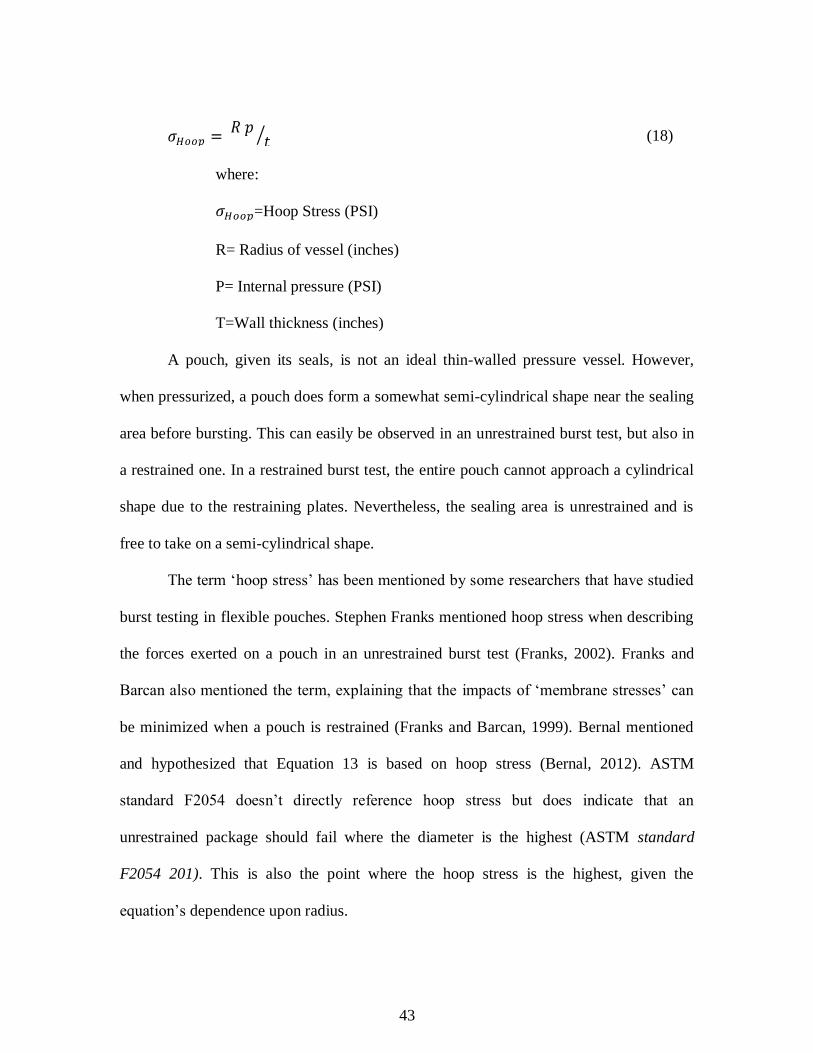
stress due to stretching. The hoop stress, quantified in Equation 18, is the stress occurring
in the walls of the vessel, in the circumferential direction. Given a constant R/t, the hoop
stress is two times the longitudinal stress, and 100 times the radial stress.
Figure 2.19. Resultant Stresses from Internal Pressure in Thin-Walled Pressure Vessel
43
(18)
where:
=Hoop Stress (PSI)
R= Radius of vessel (inches)
P= Internal pressure (PSI)
T=Wall thickness (inches)
A pouch, given its seals, is not an ideal thin-walled pressure vessel. However,
when pressurized, a pouch does form a somewhat semi-cylindrical shape near the sealing
area before bursting. This can easily be observed in an unrestrained burst test, but also in
a restrained one. In a restrained burst test, the entire pouch cannot approach a cylindrical
shape due to the restraining plates. Nevertheless, the sealing area is unrestrained and is
free to take on a semi-cylindrical shape.
The term ‘hoop stress’ has been mentioned by some researchers that have studied
burst testing in flexible pouches. Stephen Franks mentioned hoop stress when describing
the forces exerted on a pouch in an unrestrained burst test (Franks, 2002). Franks and
Barcan also mentioned the term, explaining that the impacts of ‘membrane stresses’ can
be minimized when a pouch is restrained (Franks and Barcan, 1999). Bernal mentioned
and hypothesized that Equation 13 is based on hoop stress (Bernal, 2012). ASTM
standard F2054 doesn’t directly reference hoop stress but does indicate that an
unrestrained package should fail where the diameter is the highest (ASTM standard
F2054 201). This is also the point where the hoop stress is the highest, given the
equation’s dependence upon radius.
44
Scope of Research
From the literature, some observations can be made on factors impacting burst
pressure, and thus, the relationship between seal peel and burst pressure strength. For
one, it can be reasonably concluded that burst pressure has an inversely proportional
relationship with the plate gap height in a restrained bust test. This was proven to be the
case in the results of Yam (1993), Franks and Barcan (1999), Feliú-Báez (2001), and
Bernal (2012). Furthermore, Bernal found that Yam’s equation (Equation 13) only
functioned at a plate gap of 0.25 inches for a single pouch size. Also, Feliú-Báez and
Franks and Barcan observed that unrestrained burst values are much lower than restrained
ones.
Secondly, it can be concluded that the peel time and burst time have some impact
on their respective strength values given the observations made by Yam and Feliú-Báez.
Of further note is that every researcher has not used the same type of burst testing device.
Yam (1993), Bernal (2012), Franks and Barcan (1999) used a closed-package burst tester.
Feliú-Báez (2001) used both types of burst testers while Wachala (1991) used an open-
package one.
One aspect that has not been studied thoroughly and with statistical significance is
the impact that pouch size has on the relationship between seal peel and burst pressure
strength. Bernal only tested one pouch size, as did Yam. Franks and Barcan tested
multiple pouch sizes, but only to determine the impact on burst pressure, not on the
45
relationship itself. Similarly, Feliú-Báez (2001), in her PhD, tested a multitude of
chevron pouch sizes but did not quantify the impact on the relationship, only noting how
burst pressure changes with size.
In this research, it was hypothesized that pouch size could have some impact on
the relationship, given that burst is known to change with pouch size. Two pouch sizes
were used of different length to width ratios, where length was kept constant between the
two. Though the hypothesized (Equation 13) model does not truly account for hoop
stress, it was thought that a more cylindrically shaped pouch (higher length/width ratio)
would provide a better fit than a ‘pillow’ shaped pouch (smaller length/width ratio).
To quantify this potential impact, an approach similar to the work of Bernal was
implemented. Dwell time was used to vary seal strength, and thus the selected dwell
times that produced peelable seals were used to seal the pouches. The pouches were then
burst tested and correspondingly seal peel tested. Burst tests were done at a plate gap of
1.0 inch and unrestrained height. Although Yam et al. (1993) suggested that burst peeling
time and seal peeling time should be controlled to the same value, that was not done in
this research. Instead, ASTM standards were used for both the burst and seal peel tests.
This was done to provide more industrial significance.
After obtaining the needed results, the data was compiled and analyzed using
regression analysis. Measurement error, given the destructive nature of both tests, was
accounted for and is explained in detail in Appendix B of this thesis. For each pouch size
and plate gap combination, a slope estimate was attained and compared to the theoretical
slope given by Equation 13.
46
CHAPTER THREE
JOURNAL ARTICLE
This Article is to be submitted to the
Journal of Packaging Science and Technology
and, therefore, has a different format from that of Chapters 1,2, and 4
47
IMPACT OF POUCH DIMENSIONS ON RELATIONSHIP BETWEEN BURST
PRESSURE AND SEAL PEEL STRENGTH IN FLEXIBLE POUCHES
Franklin Cheeks, Duncan Darby, Edward Rhodehamel, Robert Kimmel
48
Abstract
A known model relating seal peel strength to burst pressure was studied to determine if
altering pouch size had an impact on the model. The model tested was S=(D/2)P, where
the seal peel strength is equal to the burst pressure multiplied by half of the plate gap.
Past researchers, such as Yam1, have tested this model with varying results. It was
hypothesized that data from a pouch with a higher length to width ratio would fit the
model better given a more cylindrical geometry when inflated. Two pouches of different
length to width ratios were produced, where length was kept constant. The conjectured
model was tested by changing seal dwell time to produce seals of varying seal peel
strengths. Pouches were burst tested using a closed-package inflation burst tester at each
chosen dwell time. Resultant seal peel tests were conducted using a tensile tester on seals
produced with the same dwell times. These data were treated using naïve regression
analysis with a moment-based correction to estimate the slope coefficients. The slope
coefficients attained from the experimental data were then compared to the theoretical
slopes (D/2) to determine if there was a statistical difference. Results showed that the
model functioned for the pouch with the larger length to width ratio when tested at a plate
gap of 1.0 inch.
49
Introduction
For any flexible pouch to function properly, the pouch itself must be able to
withstand hazards presented in the production, transportation, and retail environments.
The total containment strength of a pouch is a function of the inherent strength of the
materials used, and the strengths of the seals. There are two methods currently used in
industry to quantify the strength of seals: the seal peel test and the burst test.
The seal peel test is a destructive test that can be time intensive for converters. A
strip of an exact dimension must be cut from a portion of the seal area, following which
the strip is then loaded into a tensile tester and pulled apart. The force to pull the seal
apart is quantified either as an average seal strength (force/width) or a peak seal strength
(force/width). The test is effective in that it is reproducible and can produce separate seal
strength values across the length of a seal. Conversely, the test requires much preparatory
time when there is a large sample size, and the seal strength value is dependent on where
the strip is cut.
The burst test, also destructive, requires that a pouch be inflated until it fails.
Failure can occur either in the pouch walls or at the seals. Burst tests can be conducted
using open-package or closed-package burst testers, and either with or without restraining
plates. Restraining plates are set to a certain gap and focus the stress onto the seals by
limiting the radius reached during inflation. The strength is quantified as maximum burst
at failure (force/area). Burst tests provide a more encompassing test than seal peel tests,
as they test the entire pouch and can simulate common pouch hazards. However,
50
implementing a burst test requires that an entire pouch be fabricated. In this way, the test
is less useful for film and laminate converters.
Since the tests are different, there is a need to define a quantitative relationship
between the two. A mathematical relationship would provide pouch makers and film
converters an effective way to communicate results. This would reduce quality control
issues as well as improve process efficiency.
Prior literature indicates mixed results in regards to quantifying a relationship.
Two separate force analyses conducted produced the same relationship, shown in
Equation 1, where the seal peel strength is equal to half the plate gap multiplied by the
burst pressure1,2.
(1)
Yam1 tested this model and found that observed and predicted bust pressures were
in good agreement when peel time and burst time were controlled to be the same. Feliú-
Báez2 found that the model overestimates the true burst pressure. Bernal3, using
regression analysis, observed that the model only functioned at a 0.25-inch plate gap.
One rarely studied conjecture is the impact that pouch size has on the relationship.
Franks and Barcan4 found that burst pressure varied at different pouch length to width
ratios, but did not determine the impact of varying ratio on the correlation between seal
peel and burst strength. Similarly, Feliú-Báez5 observed that pouch size has some impact
on burst pressure, but did not determine if pouch size affected the correlation model.
Bernal3 and Yam1 only tested one package size, albeit at different plate gaps.
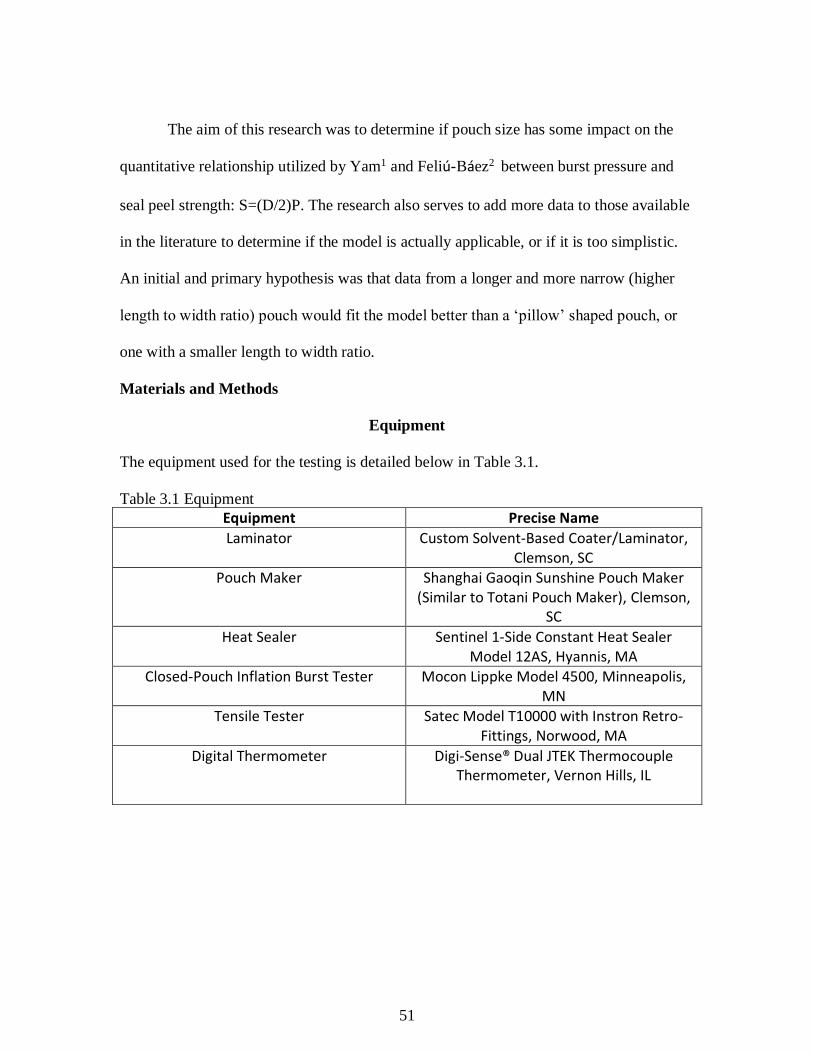
51
The aim of this research was to determine if pouch size has some impact on the
quantitative relationship utilized by Yam1 and Feliú-Báez2 between burst pressure and
seal peel strength: S=(D/2)P. The research also serves to add more data to those available
in the literature to determine if the model is actually applicable, or if it is too simplistic.
An initial and primary hypothesis was that data from a longer and more narrow (higher
length to width ratio) pouch would fit the model better than a ‘pillow’ shaped pouch, or
one with a smaller length to width ratio.
Materials and Methods
Equipment
The equipment used for the testing is detailed below in Table 3.1.
Table 3.1 Equipment
Equipment Precise Name
Laminator Custom Solvent-Based Coater/Laminator, Clemson, SC
Pouch Maker Shanghai Gaoqin Sunshine Pouch Maker (Similar to Totani Pouch Maker), Clemson,
SC
Heat Sealer Sentinel 1-Side Constant Heat Sealer Model 12AS, Hyannis, MA
Closed-Pouch Inflation Burst Tester Mocon Lippke Model 4500, Minneapolis, MN
Tensile Tester Satec Model T10000 with Instron Retro-Fittings, Norwood, MA
Digital Thermometer Digi-Sense® Dual JTEK Thermocouple Thermometer, Vernon Hills, IL
52
Materials
The substrate used to produce the pouches was a laminated structure of 29.5
micron (118 gage) PET/50 micron (2 mil) LLDPE. PET was chosen to provide a degree
of stiffness, while LLDPE was chosen due to a reasonably large peelable sealing window.
The PET was provided by Mitsubishi Polyester Film (Greer, SC), while the LLDPE was
available from lab inventory. The adhesive used was Adcote 577 with co-reactant L87-
124, provided by Dow Chemical (Freeport, TX). During the burst testing, 3M
(Maplewood, MN) tape and a 1mm Mocon (Minneapolis, MN) septum was placed onto
each pouch to prevent leaking at the point of puncture.
Procedure
The research was split into two sections. The preliminary phase allowed for
selection of the correct sealant, as well as an understanding of seal peel strength and burst
pressure strength with the selected sealant. The final testing phase was done after some
observation and statistical treatment of the preliminary data.
Preliminary Test Procedure
Much work was put forth to find a sealant that met the needs of the research. The
primary requirement of the sealant was to exhibit a reasonably large peelable seal
window, where the attained peelable seal strengths increased in a linear fashion with an
increase in some seal process input (i.e. temperature, dwell time, or pressure). For each
tested sealant, a seal curve was first plotted where the independent variable was
temperature and the dependent variable was seal peel strength (grams/inch). The seal peel
strengths were measured using the Satec tensile tester. A crosshead speed of 254 mm (10
53
inches)/minute was used, which fell within the range recommended by ASTM
F88/F88M-156.
After it was found that changing temperature did not yield a large peelable seal
window for any of the tested sealants, altering dwell time at a constant temperature and
pressure was chosen. Altering dwell time led to the selection of LLDPE as the sealant,
because LLDPE resulted in the largest peelable seal window of all the sealants tested. For
LLDPE, the sealing temperature and pressure were held constant at 129 °C (265 °F) and
275,790 pascals (40 PSI), respectively.
After selecting LLDPE, the sealant film was laminated to PET. The laminate was
then converted to three-side seal pouches on the Shanghai Sunshine pouch making
machine, where each of the three seals was a fusion seal. The fourth seal (Figure 3.1) was
left unsealed so that it could be controlled to be peelable with dwell time, and thus be the
seal that failed during burst testing.
Pouch sizes were also chosen during the preliminary phase. Two pouch sizes were
chosen with varying length to width ratios (Figure 3.1), where length was kept constant.
The sizes of the pouches were: ‘large’ pouch with dimensions 263.5 mm (10 3/8 in.) x
152.4 mm (6 in.), and ‘small’ pouch with dimensions 263.5 mm (10 3/8 in.) x 63.5 mm
(2.5 in.). Pouch seal widths were 12.7 mm (½ in.) for seals 1 and 3, and 25.4 mm (1 in.)
for seals 2 and 4 (Figure 3.1).
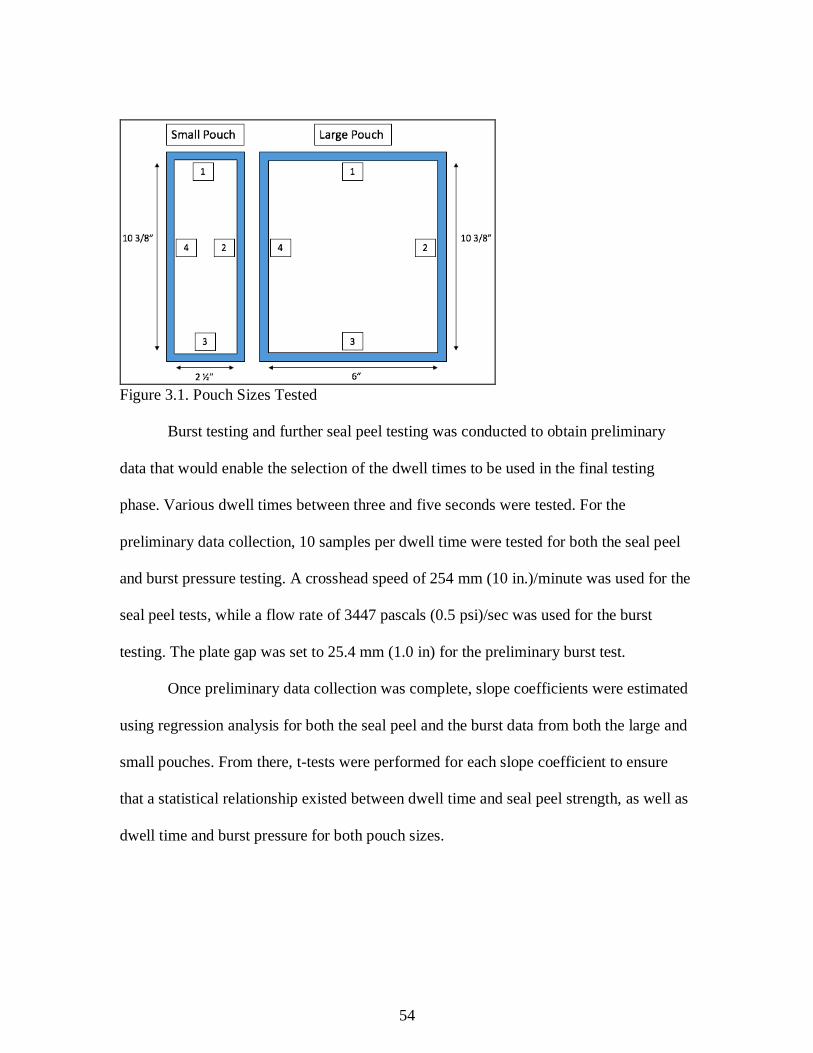
54
Figure 3.1. Pouch Sizes Tested
Burst testing and further seal peel testing was conducted to obtain preliminary
data that would enable the selection of the dwell times to be used in the final testing
phase. Various dwell times between three and five seconds were tested. For the
preliminary data collection, 10 samples per dwell time were tested for both the seal peel
and burst pressure testing. A crosshead speed of 254 mm (10 in.)/minute was used for the
seal peel tests, while a flow rate of 3447 pascals (0.5 psi)/sec was used for the burst
testing. The plate gap was set to 25.4 mm (1.0 in) for the preliminary burst test.
Once preliminary data collection was complete, slope coefficients were estimated
using regression analysis for both the seal peel and the burst data from both the large and
small pouches. From there, t-tests were performed for each slope coefficient to ensure
that a statistical relationship existed between dwell time and seal peel strength, as well as
dwell time and burst pressure for both pouch sizes.
55
Dwell times for the final testing phase were chosen to be 3.0, 3.5, 4.0, and 5.0
seconds. This gave a range of peelable seal strengths, where 3.0 seconds yielded a ‘weak’
peelable seal and 5.0 seconds yielded a ‘strong’ peelable seal.
Final Test Procedure
For the final testing procedure, it was determined that both a restrained burst test
and an unrestrained burst test would be performed. For the restrained burst test, a 25.4
mm (1 inch) plate gap was chosen. For each dwell time, a sample size of 15 bursts and 15
seal peel tests were conducted. The burst tests were categorized into groups based on
burst type (restrained vs. unrestrained) and pouch size (small vs. large), as seen in Table
3.2. The seal peel strength tests only had one categorization, since it was deemed that seal
peel strength would not be dependent upon pouch size or plate gap. Thus, 240 pouches
were burst and 60 pouches were tested for their seal peel strength. Furthermore, it should
be noted that seal peel time and burst time were not controlled to be the same. This
differs from the work conducted by Yam1 and Bernal3. The decision was made to follow
ASTM standards, and thus simulate the procedures used in industry.
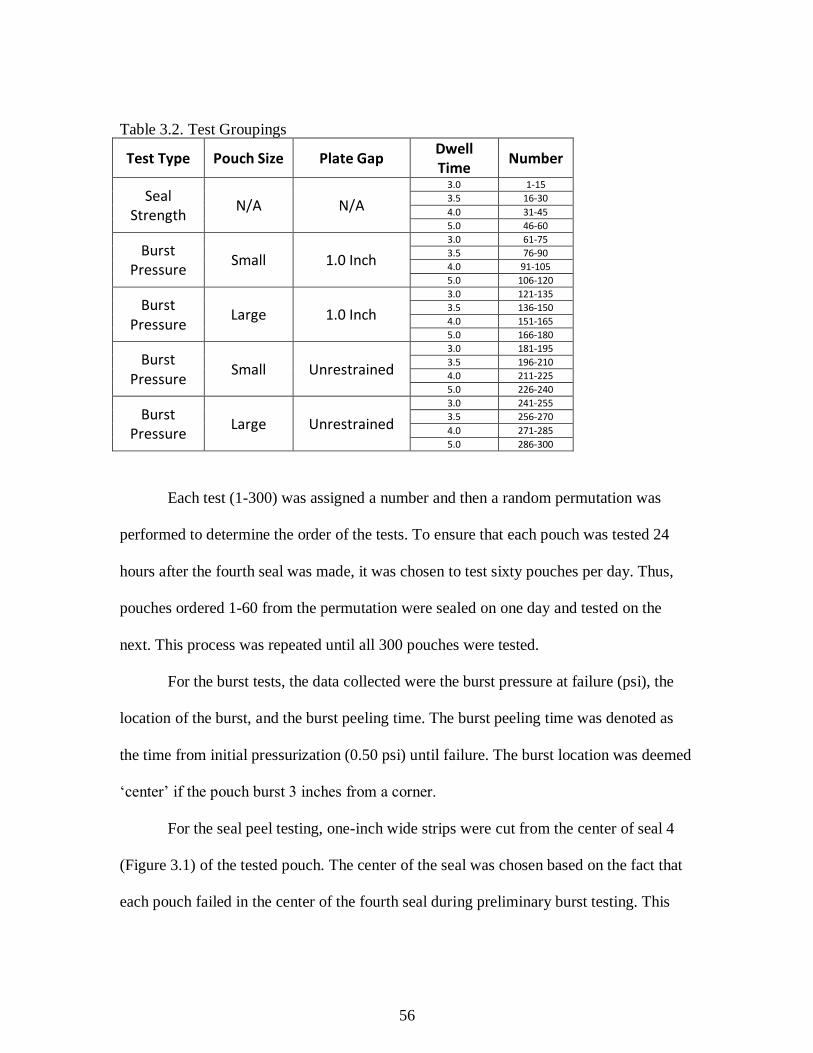
56
Table 3.2. Test Groupings
Test Type Pouch Size Plate Gap Dwell Time
Number
Seal Strength
N/A N/A
3.0 1-15
3.5 16-30
4.0 31-45
5.0 46-60
Burst Pressure
Small 1.0 Inch
3.0 61-75
3.5 76-90
4.0 91-105
5.0 106-120
Burst Pressure
Large 1.0 Inch
3.0 121-135
3.5 136-150
4.0 151-165
5.0 166-180
Burst Pressure
Small Unrestrained
3.0 181-195
3.5 196-210
4.0 211-225
5.0 226-240
Burst Pressure
Large Unrestrained
3.0 241-255
3.5 256-270
4.0 271-285
5.0 286-300
Each test (1-300) was assigned a number and then a random permutation was
performed to determine the order of the tests. To ensure that each pouch was tested 24
hours after the fourth seal was made, it was chosen to test sixty pouches per day. Thus,
pouches ordered 1-60 from the permutation were sealed on one day and tested on the
next. This process was repeated until all 300 pouches were tested.
For the burst tests, the data collected were the burst pressure at failure (psi), the
location of the burst, and the burst peeling time. The burst peeling time was denoted as
the time from initial pressurization (0.50 psi) until failure. The burst location was deemed
‘center’ if the pouch burst 3 inches from a corner.
For the seal peel testing, one-inch wide strips were cut from the center of seal 4
(Figure 3.1) of the tested pouch. The center of the seal was chosen based on the fact that
each pouch failed in the center of the fourth seal during preliminary burst testing. This
57
ensured more consistency in the evaluation. The data collected for the seal peel tests were
the average load per width (grams force/25.4 mm) and the failure mechanism.
After every pouch was tested, the units for the burst pressure values were
converted from psi to grams force/inches2. Also, the data from each dwell time for each
test had to be averaged. The hypothesized model for the relationship between seal peel
strength and burst pressure, S=(D/2)P, was then tested using the experimental data.
Regression analysis was employed where the seal peel strength was the dependent
variable and the burst pressure was the independent variable.
Given that both strength tests were destructive, a burst pressure value and seal
peel strength value could not be taken from the same pouch. To account for this error,
naïve regression analysis with a moment-based correction was used. Each burst grouping
was regressed with the seal peel data. Thus, there were four slope coefficient estimates. A
two-tailed t-test with a level of significance of 0.05 was used to determine if the slope
coefficient estimates were different from the theoretical slopes (D/2).
Results and Discussion
Preliminary Results and Discussion
After choosing the correct sealant and forming the pouches, the peelable seal
strength of seal 4 (Figure 3.1) was varied with dwell time. Seal peel tests and burst tests
(for large and small pouch) were then conducted. The preliminary test results indicated
that there was a statistically notable relationship between both dwell time/burst pressure
and dwell time/seal peel strength. This was determined by estimating the slope
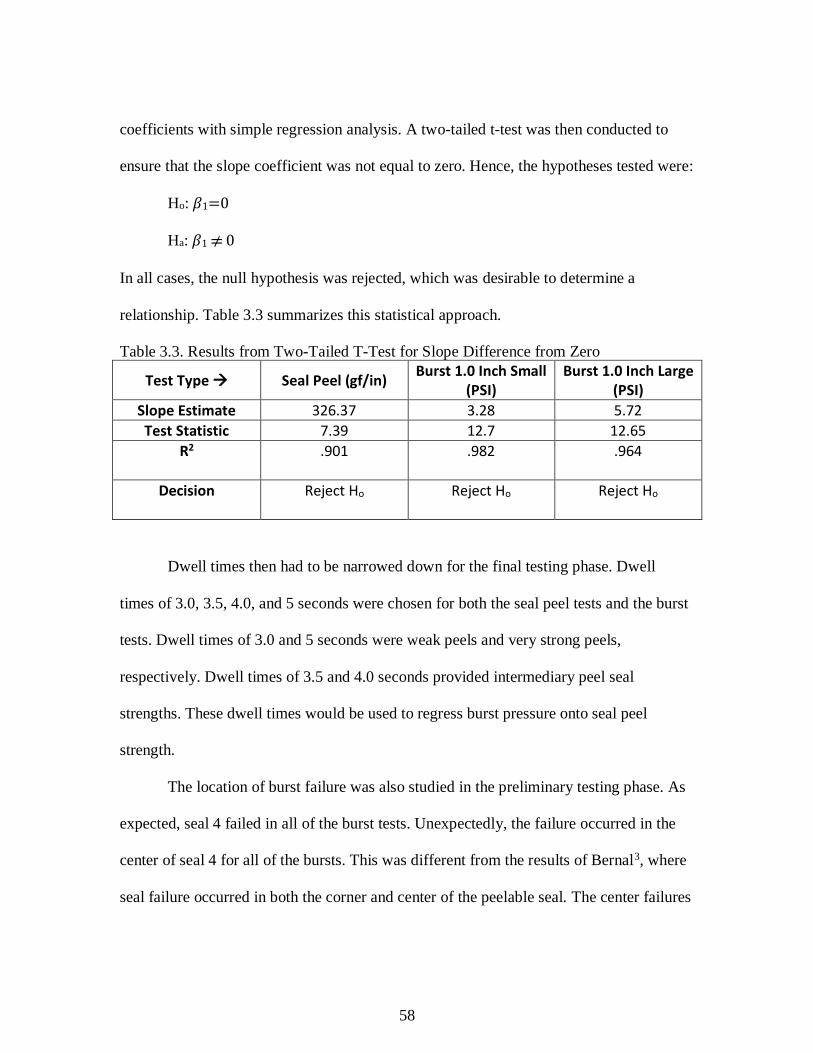
58
coefficients with simple regression analysis. A two-tailed t-test was then conducted to
ensure that the slope coefficient was not equal to zero. Hence, the hypotheses tested were:
Ho: 𝛽1=0
Ha: 𝛽1 0
In all cases, the null hypothesis was rejected, which was desirable to determine a
relationship. Table 3.3 summarizes this statistical approach.
Table 3.3. Results from Two-Tailed T-Test for Slope Difference from Zero
Test Type → Seal Peel (gf/in) Burst 1.0 Inch Small
(PSI) Burst 1.0 Inch Large
(PSI)
Slope Estimate 326.37 3.28 5.72
Test Statistic 7.39 12.7 12.65
R2 .901 .982 .964
Decision Reject Ho Reject Ho Reject Ho
Dwell times then had to be narrowed down for the final testing phase. Dwell
times of 3.0, 3.5, 4.0, and 5 seconds were chosen for both the seal peel tests and the burst
tests. Dwell times of 3.0 and 5 seconds were weak peels and very strong peels,
respectively. Dwell times of 3.5 and 4.0 seconds provided intermediary peel seal
strengths. These dwell times would be used to regress burst pressure onto seal peel
strength.
The location of burst failure was also studied in the preliminary testing phase. As
expected, seal 4 failed in all of the burst tests. Unexpectedly, the failure occurred in the
center of seal 4 for all of the bursts. This was different from the results of Bernal3, where
seal failure occurred in both the corner and center of the peelable seal. The center failures
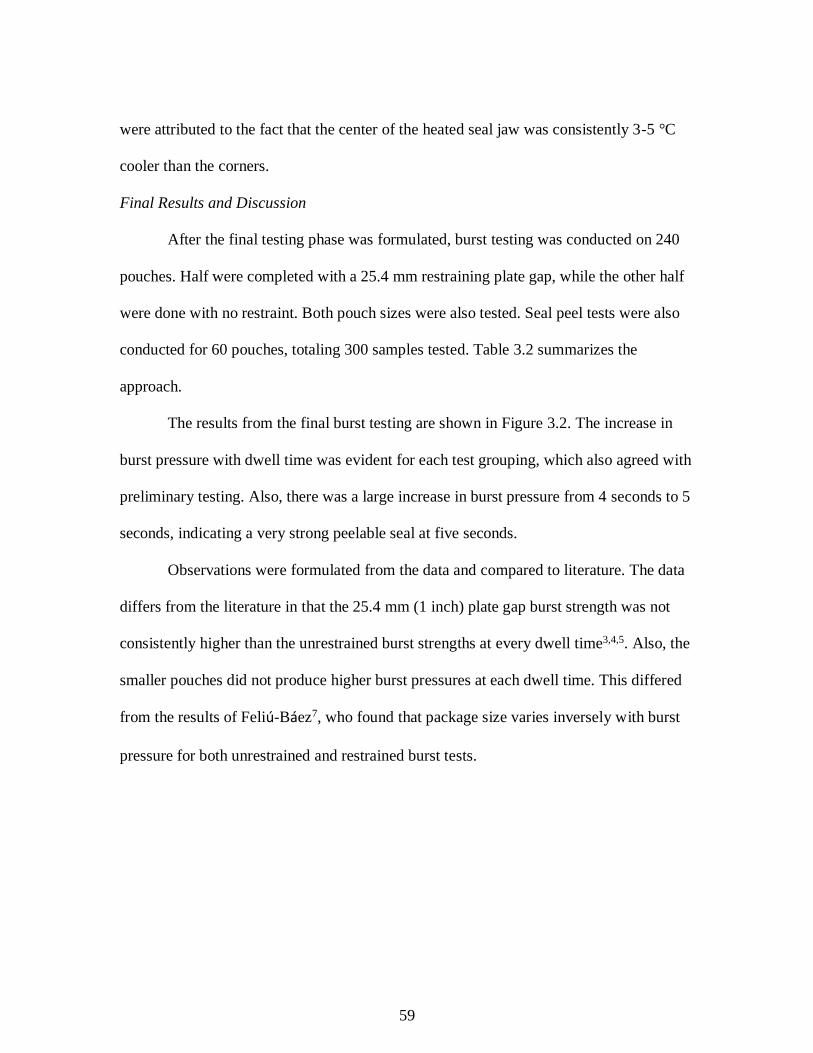
59
were attributed to the fact that the center of the heated seal jaw was consistently 3-5 °C
cooler than the corners.
Final Results and Discussion
After the final testing phase was formulated, burst testing was conducted on 240
pouches. Half were completed with a 25.4 mm restraining plate gap, while the other half
were done with no restraint. Both pouch sizes were also tested. Seal peel tests were also
conducted for 60 pouches, totaling 300 samples tested. Table 3.2 summarizes the
approach.
The results from the final burst testing are shown in Figure 3.2. The increase in
burst pressure with dwell time was evident for each test grouping, which also agreed with
preliminary testing. Also, there was a large increase in burst pressure from 4 seconds to 5
seconds, indicating a very strong peelable seal at five seconds.
Observations were formulated from the data and compared to literature. The data
differs from the literature in that the 25.4 mm (1 inch) plate gap burst strength was not
consistently higher than the unrestrained burst strengths at every dwell time3,4,5. Also, the
smaller pouches did not produce higher burst pressures at each dwell time. This differed
from the results of Feliú-Báez7, who found that package size varies inversely with burst
pressure for both unrestrained and restrained burst tests.
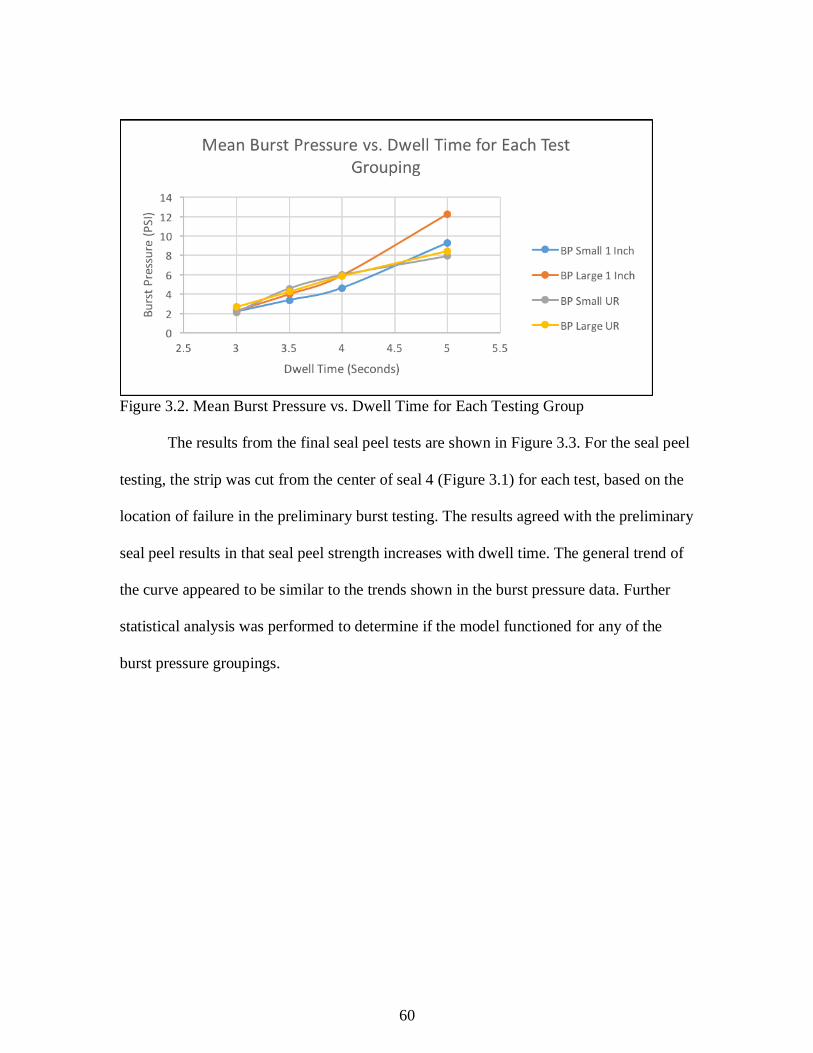
60
Figure 3.2. Mean Burst Pressure vs. Dwell Time for Each Testing Group
The results from the final seal peel tests are shown in Figure 3.3. For the seal peel
testing, the strip was cut from the center of seal 4 (Figure 3.1) for each test, based on the
location of failure in the preliminary burst testing. The results agreed with the preliminary
seal peel results in that seal peel strength increases with dwell time. The general trend of
the curve appeared to be similar to the trends shown in the burst pressure data. Further
statistical analysis was performed to determine if the model functioned for any of the
burst pressure groupings.
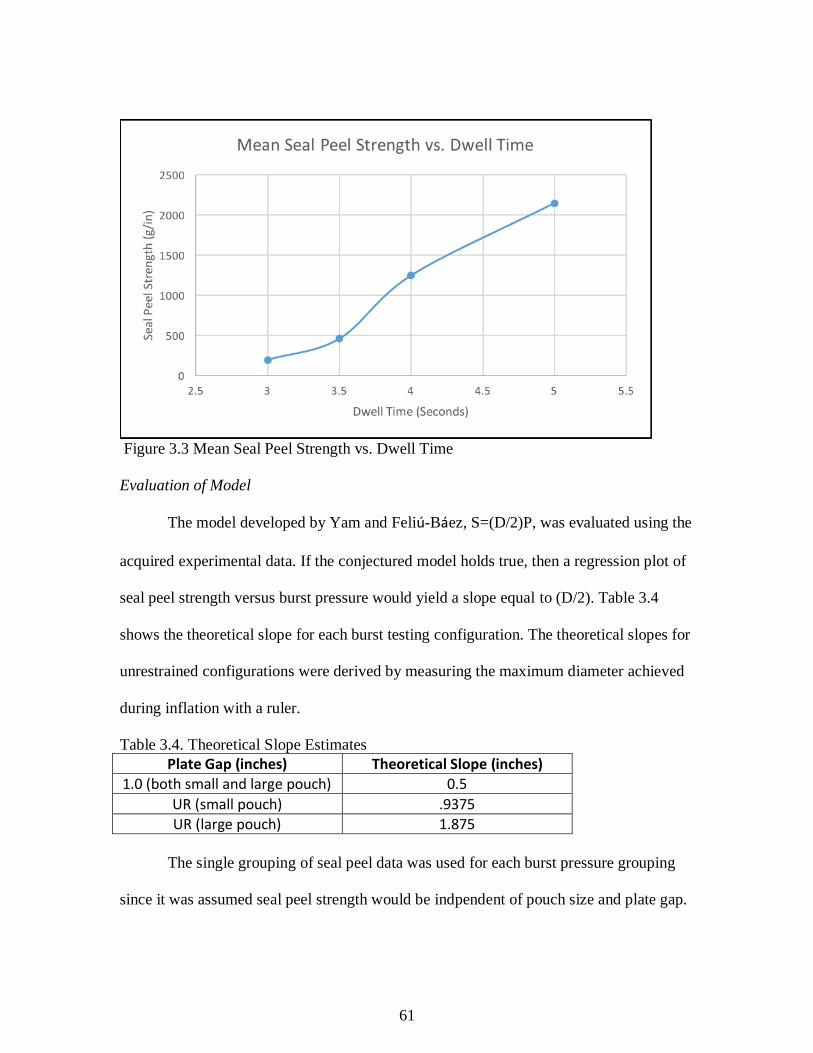
61
Figure 3.3 Mean Seal Peel Strength vs. Dwell Time
Evaluation of Model
The model developed by Yam and Feliú-Báez, S=(D/2)P, was evaluated using the
acquired experimental data. If the conjectured model holds true, then a regression plot of
seal peel strength versus burst pressure would yield a slope equal to (D/2). Table 3.4
shows the theoretical slope for each burst testing configuration. The theoretical slopes for
unrestrained configurations were derived by measuring the maximum diameter achieved
during inflation with a ruler.
Table 3.4. Theoretical Slope Estimates
Plate Gap (inches) Theoretical Slope (inches) 1.0 (both small and large pouch) 0.5
UR (small pouch) .9375 UR (large pouch) 1.875
The single grouping of seal peel data was used for each burst pressure grouping
since it was assumed seal peel strength would be indpendent of pouch size and plate gap.
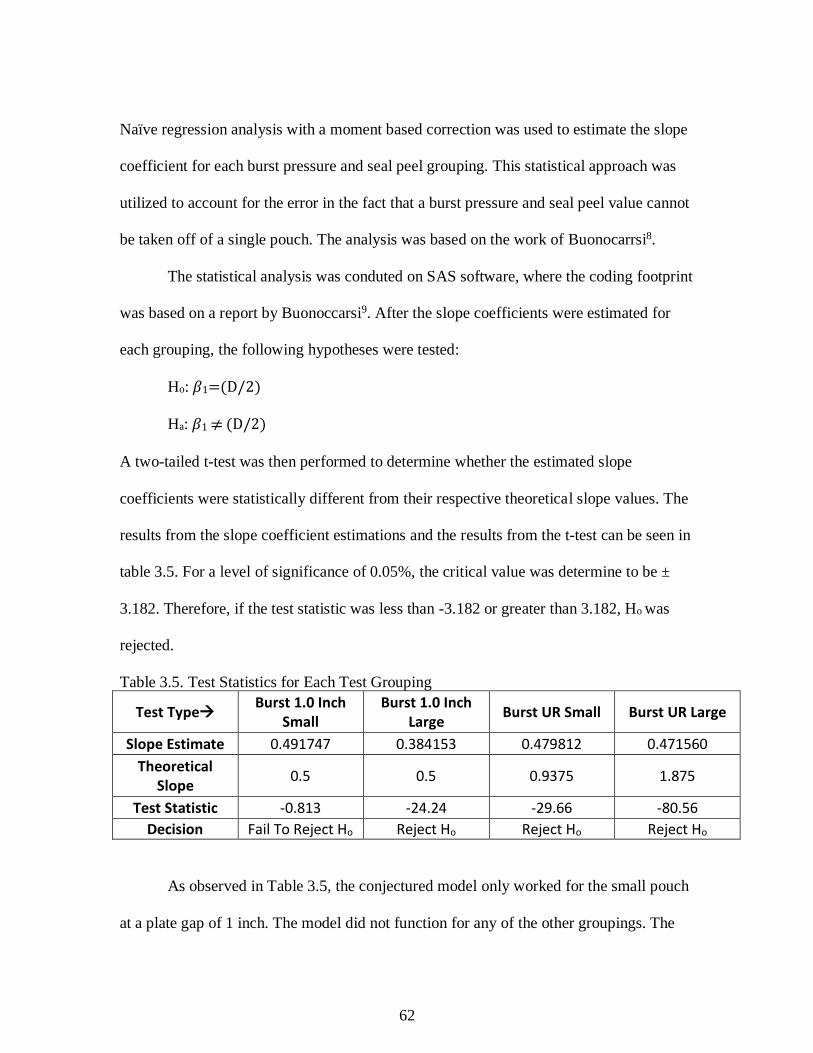
62
Naïve regression analysis with a moment based correction was used to estimate the slope
coefficient for each burst pressure and seal peel grouping. This statistical approach was
utilized to account for the error in the fact that a burst pressure and seal peel value cannot
be taken off of a single pouch. The analysis was based on the work of Buonocarrsi8.
The statistical analysis was conduted on SAS software, where the coding footprint
was based on a report by Buonoccarsi9. After the slope coefficients were estimated for
each grouping, the following hypotheses were tested:
Ho: 𝛽1=(D/2)
Ha: 𝛽1 (D/2)
A two-tailed t-test was then performed to determine whether the estimated slope
coefficients were statistically different from their respective theoretical slope values. The
results from the slope coefficient estimations and the results from the t-test can be seen in
table 3.5. For a level of significance of 0.05%, the critical value was determine to be ±
3.182. Therefore, if the test statistic was less than -3.182 or greater than 3.182, Ho was
rejected.
Table 3.5. Test Statistics for Each Test Grouping
Test Type→ Burst 1.0 Inch
Small Burst 1.0 Inch
Large Burst UR Small Burst UR Large
Slope Estimate 0.491747 0.384153 0.479812 0.471560
Theoretical Slope
0.5 0.5 0.9375 1.875
Test Statistic -0.813 -24.24 -29.66 -80.56
Decision Fail To Reject Ho Reject Ho Reject Ho Reject Ho
As observed in Table 3.5, the conjectured model only worked for the small pouch
at a plate gap of 1 inch. The model did not function for any of the other groupings. The
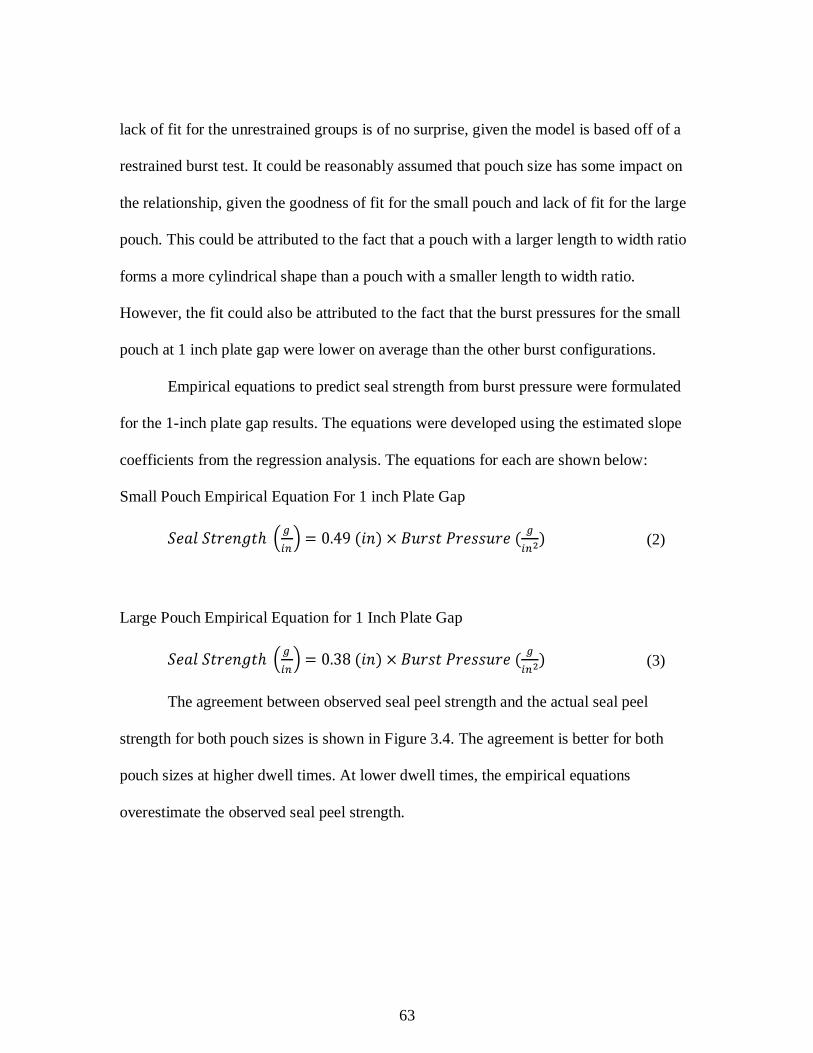
63
lack of fit for the unrestrained groups is of no surprise, given the model is based off of a
restrained burst test. It could be reasonably assumed that pouch size has some impact on
the relationship, given the goodness of fit for the small pouch and lack of fit for the large
pouch. This could be attributed to the fact that a pouch with a larger length to width ratio
forms a more cylindrical shape than a pouch with a smaller length to width ratio.
However, the fit could also be attributed to the fact that the burst pressures for the small
pouch at 1 inch plate gap were lower on average than the other burst configurations.
Empirical equations to predict seal strength from burst pressure were formulated
for the 1-inch plate gap results. The equations were developed using the estimated slope
coefficients from the regression analysis. The equations for each are shown below:
Small Pouch Empirical Equation For 1 inch Plate Gap
(2)
Large Pouch Empirical Equation for 1 Inch Plate Gap
(3)
The agreement between observed seal peel strength and the actual seal peel
strength for both pouch sizes is shown in Figure 3.4. The agreement is better for both
pouch sizes at higher dwell times. At lower dwell times, the empirical equations
overestimate the observed seal peel strength.
64
Figure 3.4. Comparison of Observed vs. Predicted Seal Peel Strenghs Using Empirical
Equations
Conclusions
The conjectured model only worked for the burst pressure data from the small
pouch at a plate gap of 1.0 inch. It did not function for any of the other burst pressure
groupings. This was agreeable with the initial hypothesis that a pouch with a larger
length to width ratio (like that of the small pouch) would provide data that fit the model
better than a square-like pouch, given that the model assumes a cylindrical shape during
inflation. From the results, it can be assumed that pouch size has some impact on the
model. However, more research would need to be conducted to prove this.
The succesful results for the small pouch at a 1.0 inch plate gap could have been
solely due to lower burst pressures attained for the grouping. Interesting research moving
forward would be to hold the length to width ratio constant while changing the perimeter.
65
This could prove whether or not more cylindrical pouches truly fit the model better.
However, the entire validity of the model could be questioned at this point given the
results of this study and past studies2,3,5,7. Future approaches could be to derive a model
using finite element analysis, or derive one for which hoop stress is considered.
66
References
1. Yam KL, Rossen J, Wu X-F. Relationship between seal strength and burst pressure for pouches. Packag. Technol. Sci. 1993; 6; 239-244
2. Feliú-Báez R, Lockhart HE, Burgess G. Correlation of peel and burst tests for pouches. Packag. Technol. Sci. 2001; 14; 63-69
3. Bernal W. Relating burst pressure to seal peel strength in pouches. MS Thesis, Clemson University, July 2012; 70-95
4. Barcan DS, Franks SH. Med Device Diagn. Indust. 1999; August: 60-67 5. Feliú-Báez R. Analysis of the relationship between peel and burst results for
peelable flexible packages. PhD Dissertation, Michigan State University, 2001; 15-20, 43-74
6. ASTM Standard F88/F88M-15. Standard test method for seal strength of flexible barrier materials.
7. Feliú-Báez R. Analysis and Evaluation of Burst Test Methods Using Restraining Fixtures. MS Thesis, Michigan State University, 1998;
8. Buonaccorsi, JP. Measurement Error: Models, Methods, and Applications. Boca Raton, FL: CRC Press; 2010.
9. Buonaccorsi, JP. Measurement Error Software/Programs with Examples. Technical Report: Dept. of Math and Statistics, University of Massachusetts- Amherst, 2013.
67
CHAPTER FOUR
CONCLUSIONS AND RECOMMENDATIONS
The work in this study was conducted to determine if pouch size has an impact on
a known mathematical relationship between burst pressure and seal peel strength in
pouches. The results showed that the conjectured model only functioned for the pouch
size with a larger length to width ratio, at a plate gap of 1.0 inches. The model did not
function for any of the other pouch size-plate gap combinations.
The model agreement for the pouch with the higher length to width ratio fit the
initial hypothesis of the research, which stated that a more cylindrical shaped pouch
would produce better results. However, it could not be absolutely concluded that pouch
size has an impact on the relationship. The model could’ve worked better for the more
cylindrical pouch at a 1.0-inch plate gap simply due to lower attained burst pressures at
that combination (on average). To determine a statistical impact of pouch size on the
relationship, more work should be done. Perhaps the most efficient way to do this would
be to hold the length to width ratio constant and test different pouch areas. This would
allow one to test the model using cylindrical shaped pouches that produce different burst
pressure results.
The results of this study and the work of Bernal (2012) lead to the conclusion that
the conjectured model should only be used for pouches that are burst tested with a
restraining plate. To date, Yam (1993) is the only researcher who has observed good
model agreement at multiple plate gaps. This could be attributed to the fact that Yam
tested fusion seals. When a fusion seal is stressed during a burst test, the angle of peel
68
remains near 90°, which correlates well with a seal peel test. When a peelable seal is
stressed during a burst test, the angle of peel begins at 90° and then presumably changes
as the pressure increases. This could indicate that the model functions best for fusion
seals. An interesting study would be to vary pouch size while testing fusion seals.
Future work should also be done to understand the impacts of hoop stress on seal
failure in inflation burst tests. Understanding and/or quantifying hoop stress in flexible
pouches could be the first step in deriving a model that accounts for the stresses that
occur in the walls of the pouch. Finite element analysis could be an effective tool in
understanding stress in pouches, or in helping derive a new model.

69
APPENDICES
70
Appendix A
Mechanism and Factors Impacting Seal Strength
At the molecular level, there are multiple processes that take place when heat
sealing a semi-crystalline film. At the surface interface, with no heat or external pressure,
Van der Waals forces is the only bonding mechanism that exist between the two surfaces
to be sealed (Stehling and Meka, 1994). As heat is applied to either the external surface
or the interface itself, the crystalline regions begin to melt and flow. External pressure
forces an increase in molecular contact at the interface, and if an adequate dwell time is
used, polymer chains will diffuse across the interface and form chain entanglements.
After the heat source is removed, the interface cools and recrystallization occurs, creating
a strong seal.
Much literature has been written on the factors that impact seal strength. Meka
and Stehling devised a method to determine the interfacial temperature of a seal during
the sealing process and also created a model to predict the interfacial temperature as a
function of time (Meka and Stehling, 1994). They sealed LDPE and LLDPE, and found
that seal properties are determined mostly by the maximum interfacial temperature
reached during the sealing process.
Yuan et al., in a study done on the heat sealability of LLDPE and LDPE, also
attained results that agreed with Meka and Stehling (Yuan et al., 1994). Yuan found that
the bar temperature was the primary influence in determining heat seal strength, while
pressure had very little impact above the needed value to bring the materials in contact.
71
Yuan also determined that the dwell time must be long enough to allow the interfacial
temperature to reach a desired value.
Mueller, Hiltner, and Baer sealed LLDPE at a range of temperatures and dwell
times, extending as far out as 100,000 seconds (Mueller, Hiltner, & Baer, 1998). The
authors found that the bar temperature had a strong impact on seal strength, and that the
relationship between the two could be related to the heterogeneous composition of
LLDPE. The authors concluded that at 115 C°, only highly branched and low molecular
weight chains diffuse across the seal interface. At higher temperatures, the higher
molecular weight and linear chains begin to melt and diffuse across the interface, creating
a stronger seal.
Another work by Stehling and Meka relates seal strength dependence on
temperature to the melt distribution of a polymer (Stehling and Meka, 1994). The authors
studied 42 different grades of polymers and determined that, for polyethylene, the seal
initiation temperature can be correlated to the temperature at which the fraction of
amorphous phase equals around 77%. They also observed that an increase in the
fractional amorphous phase from 77% with temperature corresponds to an increase in the
heat seal strength as a function of temperature. They concluded, they found that the heat
seal curve for polyethylene can be partially-predicted from the melt distribution and yield
stress of the polymer.
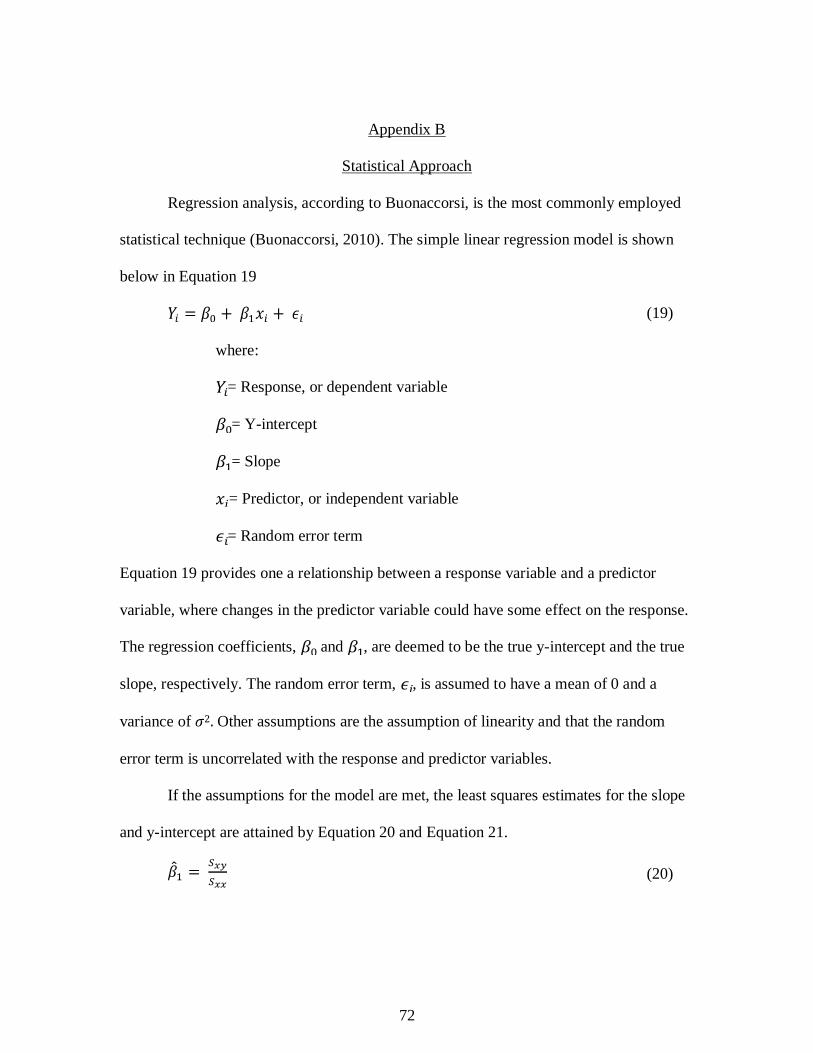
72
Appendix B
Statistical Approach
Regression analysis, according to Buonaccorsi, is the most commonly employed
statistical technique (Buonaccorsi, 2010). The simple linear regression model is shown
below in Equation 19
(19)
where:
= Response, or dependent variable
= Y-intercept
= Slope
= Predictor, or independent variable
= Random error term
Equation 19 provides one a relationship between a response variable and a predictor
variable, where changes in the predictor variable could have some effect on the response.
The regression coefficients, and , are deemed to be the true y-intercept and the true
slope, respectively. The random error term, , is assumed to have a mean of 0 and a
variance of 𝜎2. Other assumptions are the assumption of linearity and that the random
error term is uncorrelated with the response and predictor variables.
If the assumptions for the model are met, the least squares estimates for the slope
and y-intercept are attained by Equation 20 and Equation 21.
(20)
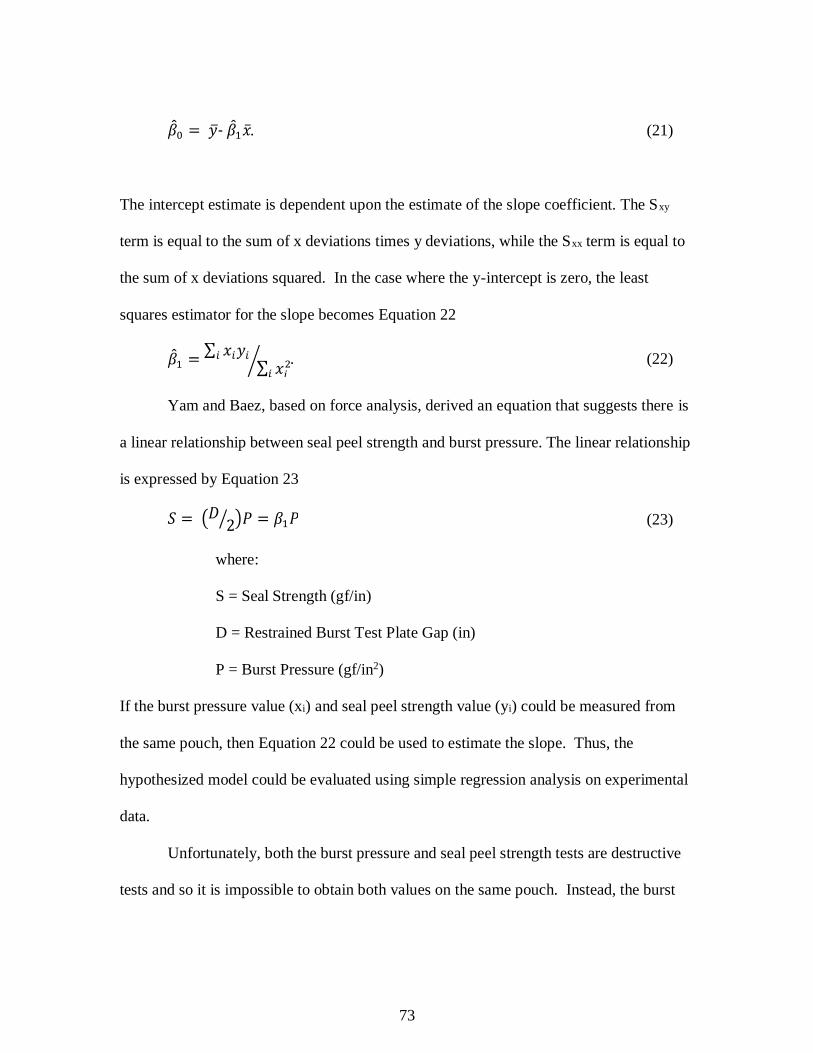
73
. (21)
The intercept estimate is dependent upon the estimate of the slope coefficient. The Sxy
term is equal to the sum of x deviations times y deviations, while the Sxx term is equal to
the sum of x deviations squared. In the case where the y-intercept is zero, the least
squares estimator for the slope becomes Equation 22
. (22)
Yam and Baez, based on force analysis, derived an equation that suggests there is
a linear relationship between seal peel strength and burst pressure. The linear relationship
is expressed by Equation 23
(23)
where:
S = Seal Strength (gf/in)
D = Restrained Burst Test Plate Gap (in)
P = Burst Pressure (gf/in2)
If the burst pressure value (xi) and seal peel strength value (yi) could be measured from
the same pouch, then Equation 22 could be used to estimate the slope. Thus, the
hypothesized model could be evaluated using simple regression analysis on experimental
data.
Unfortunately, both the burst pressure and seal peel strength tests are destructive
tests and so it is impossible to obtain both values on the same pouch. Instead, the burst
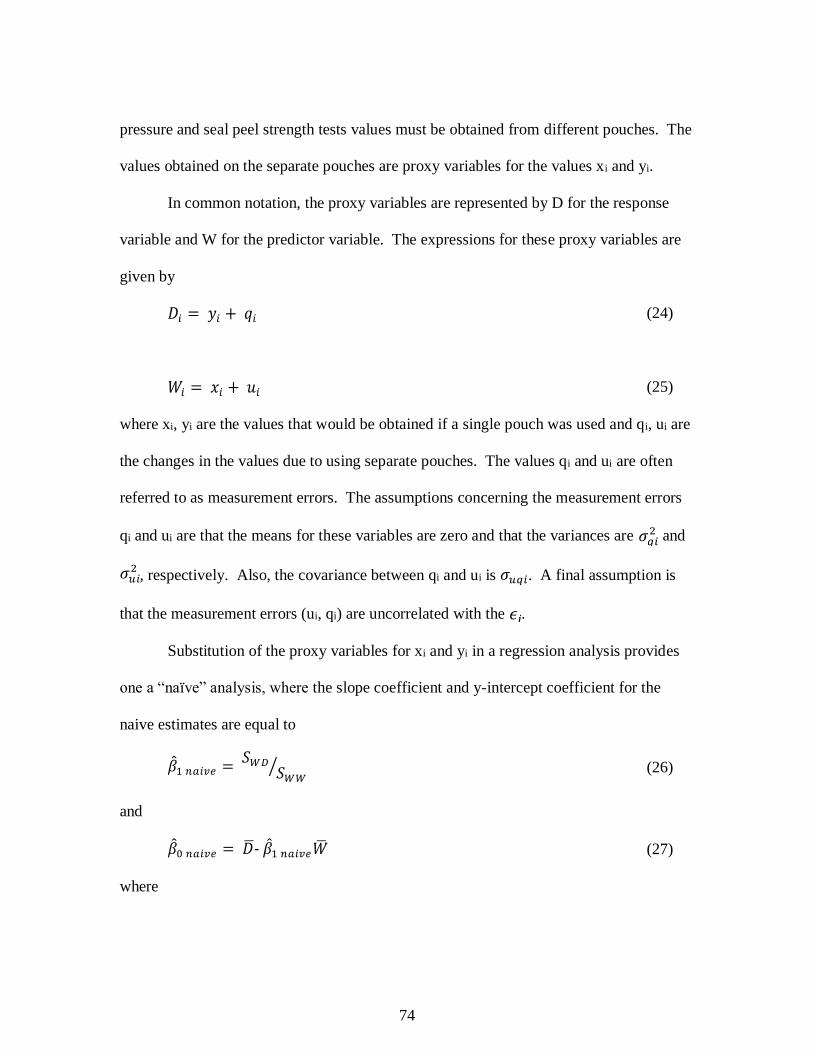
74
pressure and seal peel strength tests values must be obtained from different pouches. The
values obtained on the separate pouches are proxy variables for the values xi and yi.
In common notation, the proxy variables are represented by D for the response
variable and W for the predictor variable. The expressions for these proxy variables are
given by
(24)
(25)
where xi, yi are the values that would be obtained if a single pouch was used and qi, ui are
the changes in the values due to using separate pouches. The values qi and ui are often
referred to as measurement errors. The assumptions concerning the measurement errors
qi and ui are that the means for these variables are zero and that the variances are and
, respectively. Also, the covariance between qi and ui is . A final assumption is
that the measurement errors (ui, qi) are uncorrelated with the .
Substitution of the proxy variables for xi and yi in a regression analysis provides
one a “naïve” analysis, where the slope coefficient and y-intercept coefficient for the
naive estimates are equal to
(26)
and
(27)
where
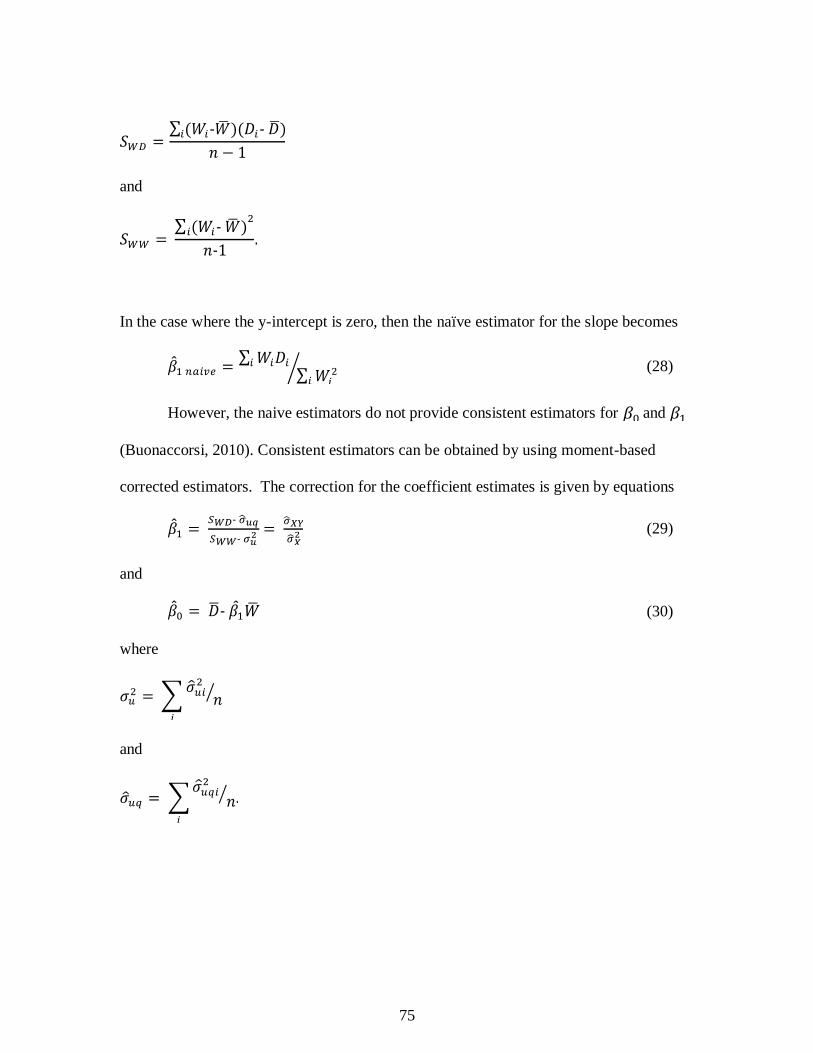
75
and
In the case where the y-intercept is zero, then the naïve estimator for the slope becomes
(28)
However, the naive estimators do not provide consistent estimators for and
(Buonaccorsi, 2010). Consistent estimators can be obtained by using moment-based
corrected estimators. The correction for the coefficient estimates is given by equations
(29)
and
(30)
where
and
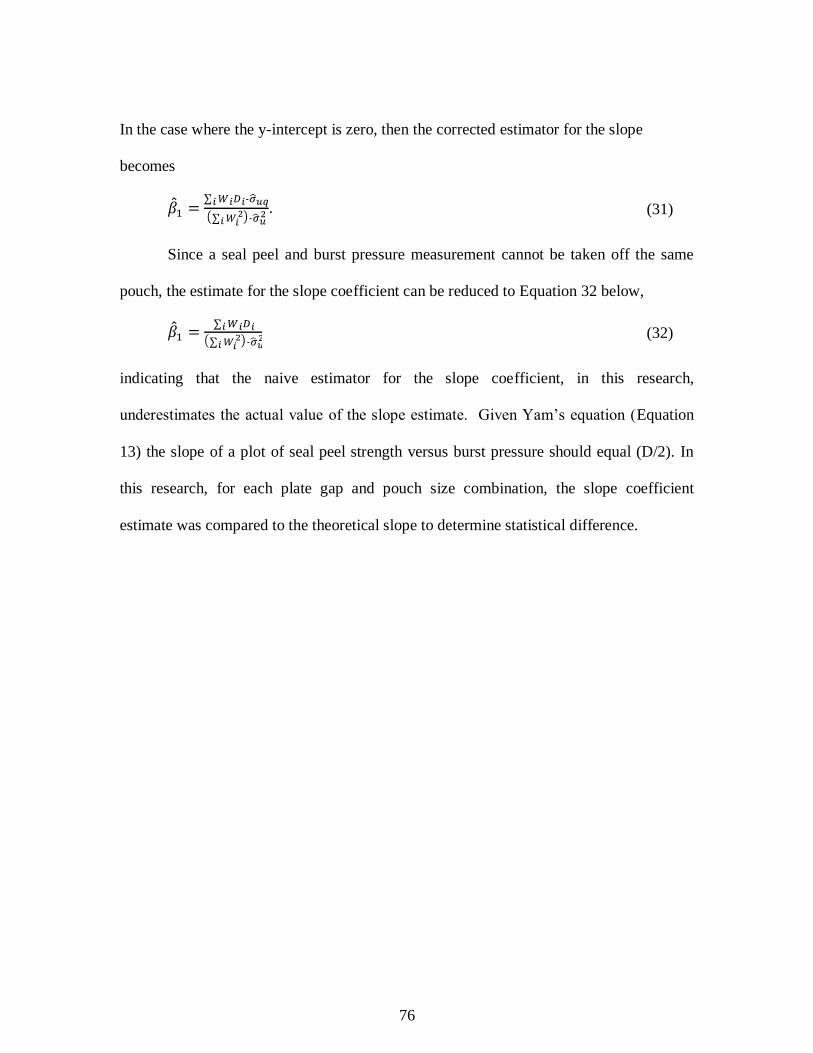
76
In the case where the y-intercept is zero, then the corrected estimator for the slope
becomes
(31)
Since a seal peel and burst pressure measurement cannot be taken off the same
pouch, the estimate for the slope coefficient can be reduced to Equation 32 below,
(32)
indicating that the naive estimator for the slope coefficient, in this research,
underestimates the actual value of the slope estimate. Given Yam’s equation (Equation
13) the slope of a plot of seal peel strength versus burst pressure should equal (D/2). In
this research, for each plate gap and pouch size combination, the slope coefficient
estimate was compared to the theoretical slope to determine statistical difference.
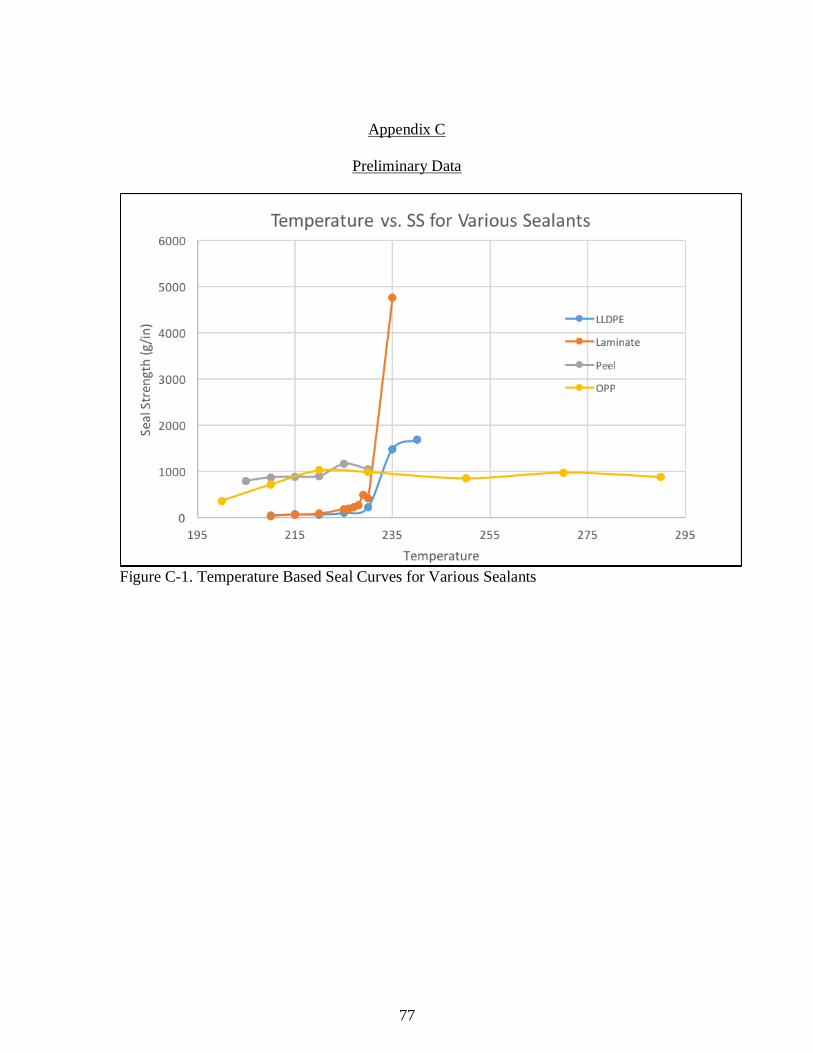
77
Appendix C
Preliminary Data
Figure C-1. Temperature Based Seal Curves for Various Sealants
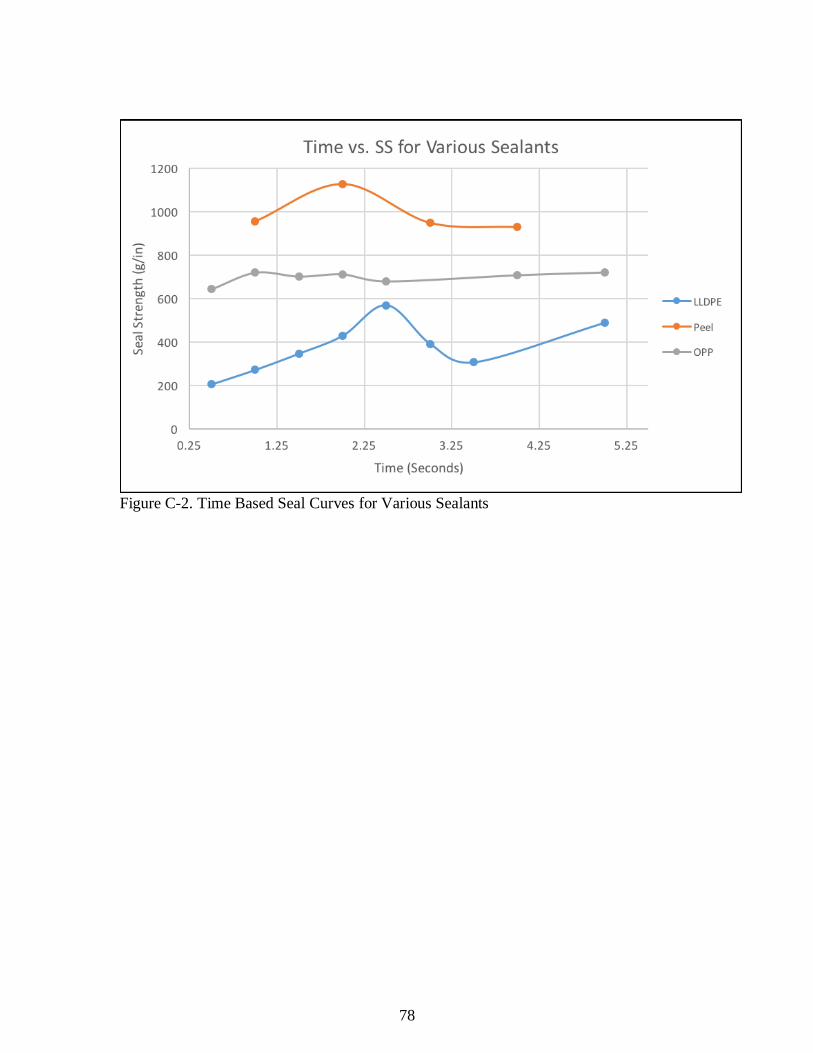
78
Figure C-2. Time Based Seal Curves for Various Sealants
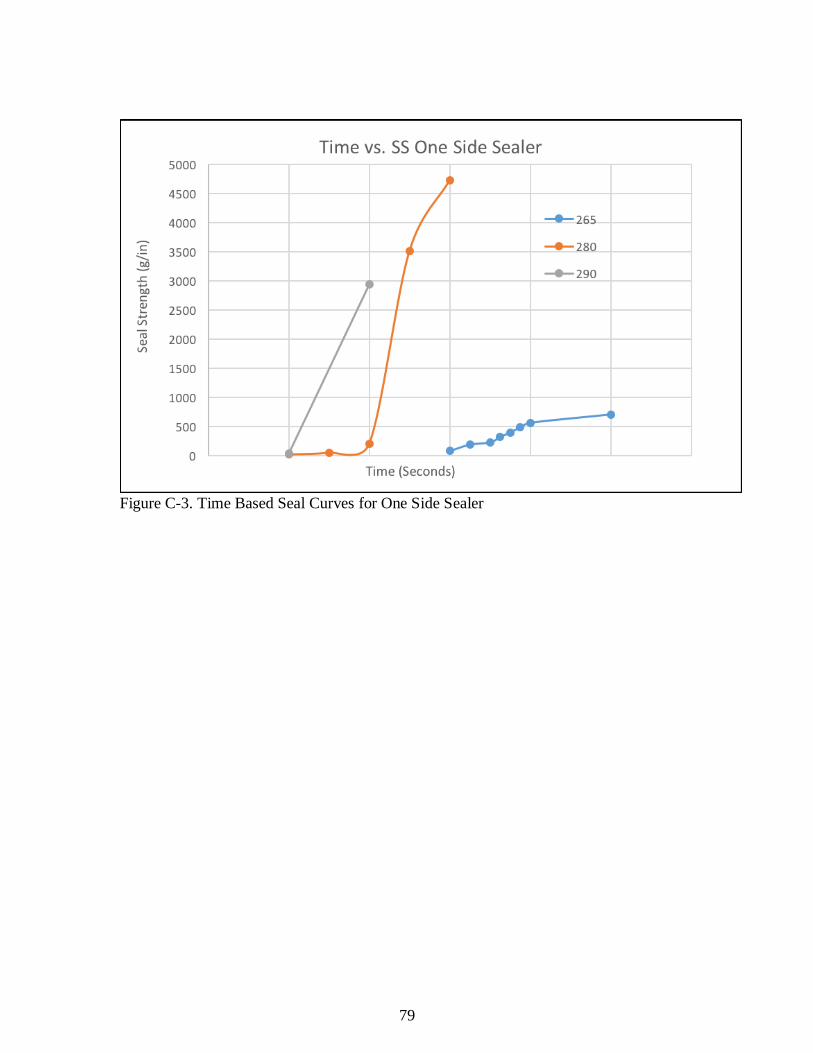
79
Figure C-3. Time Based Seal Curves for One Side Sealer
80
REFERENCES
ASTM standard D642 (2015). West Conshohocken, PA: ASTM International. doi:
3/27/2018
ASTM standard F1140 (2013). West Conshohocken, PA: ASTM International. doi:
3/27/2018
ASTM standard F2054 (2013). West Conshohocken, PA: ASTM International. doi:
3/27/2018
ASTM standard F88 (2015). West Conshohocken, PA: ASTM International. doi:
3/27/2018
Bernal, W. (2012). Relating Burst Pressure to Seal Peel Strength in Pouches. (Master of
Science Thesis).
Brody, A. (1970). Flexible Packaging of Foods. London, UK: Butterworths.
Buonaccorsi, John P. (2010). Measurement Error: Models, Methods, and Applications.
Boca Raton, FL: CRC Press
Dudbridge, M., & Turner, R. (2009). Seal Integrity and the Impact on Food Waste.
Retrieved from http://www.wrap.org.uk/sites/files/wrap/Report%20-
%20Seal%20integrity%20and%20the%20impact%20on%20food%20waste%20(
Mar%2009).pdf
Dudbridge, M. (2016). Handbook of Seal Integrity in the Food Industry. Chichester, West
Sussex: John Wiley & Sons, Ltd.
Durston, J. (2006). Flexible Packaging Closures and Sealing Systems. In N. Theobald, &
B. Winder (Eds.), Packaging Closures and Sealing Systems (pp. 205). Oxford,
UK: Blackwell Publishing Ltd.
Ebnesajjad, S. (2012). Plastic Films in Food Packaging: Materials, Technology and
Applications. Waltham, MA: Elsevier Inc.
Falla, D. (2015). New Study Helps Improve Peelable Seal in Film Packaging. Retrieved
from
http://read.nxtbook.com/wiley/plasticsengineering/novemberdecember2015/techni
calpaper_newstudyhelps.html
81
Feliú-Báez, R. (1998). Analysis and evaluation of burst test methods using restraining
fixtures. (Master of Science Thesis). Retrieved from ProQuest Dissertations and
Theses Global. (UMI Number: 1390446)
Feliú-Báez, R. (2001). Analysis of the relationship between peel and burst test results for
peelable flexible packages. (Doctoral Dissertation). Retrieved from ProQuest
Dissertations and Theses Global. Michigan State University. (UMI Number:
3021768)
Feliú-Báez, R., Lockhart, H. E., & Burgess, G. (2001). Correlation of peel and burst tests
for pouches. Packaging Technology and Science, 14, 63-69.
Feliú-Báez, R., Lockhart, H. E., & Burgess, G. (2003). Correlating peel and burst tests for
sterile medical device packages. MDDI Medical Device and Diagnostic Industry
News Products and Suppliers, doi: June 17, 2018
Flexible Packaging Association. (2018). Advantages of Flexible Packaging. Retrieved
from https://www.flexpack.org/advantages/
Franks, S. (2002, June 17). Strength and integrity, part two: Basics of seal-strength
testing. Retrieved from http://www.packagingdigest.com/testing/pmp-strength-
and-integrity-part-two-basics-seal-strength-testing-020617
Franks, S., & Barcan, D. (1999). Comparing tensile and inflation seal-strength tests for
medical pouches. Medical Device and Diagnostic Industry, (August 1999), 60-67.
Hanlon, J. F., Kelsey, R. J., & Forcinio, H. E. (1998). Handbook of Package Engineering
(3rd ed.). Boca Raton, FL: CRC Press LLC.
Hannay, F. (2002). Rigid Plastics Packaging: Materials, Processes and Applications.
Shrewsbury, U.K.: Rapra Technology Ltd.
Ibrahim, A., Ryu, Y., & Saidpour, M. (2015). Stress Analysis of Thin-Walled Pressure
Vessels. Modern Mechanical Engineering, 5, 1-9
Kirwan, M. J., & Strawbridge, J. W. (2003). Plastics in food packaging. In R. Coles, D.
McDowell, & M. Kirwan (Eds.), Food Packaging Technology (pp. 174-222).
Boca Raton, FL: CRC Press LLC
Lockhart, H. (1997). A Paradigm for Packaging. Packaging Technology and Science, 10,
237-252
Meka, P., & Stehling, F. C. (1994). Heat Sealing of Semicrystalline Polymer Films. I.
Calculation and Measurement of Interfacial Temperatures: Effect of Process
Variables on Seal Properties. Journal of Applied Polymer Science, 51, 89-103.
82
Miller, A. (1994). Converting for Flexible Packaging. Lancaster, PA: Technomic
Publishing Company, Inc.
Mueller, C., Capaccio, G., Hiltner, A., & Baer, E. (1998). Heat Sealing of LLDPE:
Relationships to Melting and Interdiffusion. Journal of Applied Polymer Science,
70, 2021-2030.
Osborn, K. R., & Jenkins, W. A. (1992). Plastic Films Technology and Packaging
Applications. Lancaster, PA: Technomic Publishing Company, Inc.
Robertson, G. (1993). Food Packaging Principles and Practice (3rd ed.). Boca Raton, FL:
CRC Press
Selke, S. (1997). Understanding Plastics Packaging Technology. Cincinnati, OH:
Hanser/Gardner Publications, Inc.
Selke, S., Cutler, J., & Hernandez, R. (2004). Plastics Packaging (2nd ed.). Cincinnati,
Ohio: Hanser Gardner Publications, Inc.
Soroka, W. (2009). Fundamentals of Packaging Technology (4th ed.). Naperville, IL:
Institute of Packaging Professionals.
Stehling, F. C., & Meka, P. (1994). Heat Sealing of Semicrystalline Polymer Films. II.
Effect of Melting Distribution on Heat-Sealing Behavior of Polyolefins. Journal
of Applied Polymer Science, 51, 105-119.
Wachala, T. (1991). Correlating tensile and burst tests in pouches. Medical Device and
Diagnostic Industry, (February 1991), 54-58
Yam, K., Rossen, J., & Wu, X. (1993). Relationship between seal strength and burst
pressure for pouches. Packaging Technology and Science, 6, 239-244.
Yuan, C. S., Hassan, A., Ghazali, M. I. H., & Ismail, A. F. (2006). Heat Sealability of
Laminated Films with LLDPE and LDPE as the Sealant Materials in Bar Sealing
Applications. Journal of Applied Polymer Science, 104, 3736-3745.