Embed Size (px)
Citation preview
Impact of non-uniform surface flows on fire suppression of an idealized commodity
Y. Xin FM Global, Norwood MA, USA
Abstract
Sprinkler protection is currently the most widely used and reliable technology to mitigate fire hazards for combustible commodities. The basic mechanism of sprinkler protection relies on water transport on solid fuel surfaces to control and suppress the fire. In previous studies water surface flows were characterized for an idealized commodity consisting of corrugated cardboard boxes. The results showed that local surface flows are highly non-uniform on commodity surfaces even with uniform water fluxes applied directly on top of the commodity. In the present work, an experimental study was conducted to investigate fire suppression behaviours of the same commodity using uniform water fluxes. The objective is to examine the impact of non-uniform water surface flows on fire suppression behaviour. All fire tests were carried out using a rack storage configuration. The overall fire suppression behaviour was quantified using the chemical heat release rates measured by a 20-MW calorimeter, with the uniform water fluxes generated by a water application apparatus. The experimental results show that the measured heat release rates under various experimental conditions are reasonably repeatable. Therefore, local surface flows on the commodity, although highly non-uniform, do not have a significant impact on the overall fire suppression behaviour. This suggests that more global or averaged quantities related to water transport control the fire suppression, which should be investigated in future work. Keywords: fire suppression, surface flow, fire growth, heat release rate.
1 Introduction
For fire safety and property protection, sprinkler systems have long been recognized as one of the most cost-effective and reliable technologies available.
www.witpress.com, ISSN 1743-3533 (on-line) WIT Transactions on Engineering Sciences, Vol 79, © 2013 WIT Press
doi:10.2495/MPF130181
Computational Methods in Multiphase Flow VII 207

When adequate sprinkler protection is provided, property losses in commercial and industrial facilities due to fires can often be greatly reduced. Given its importance to fire safety and property loss prevention, research and development of sprinkler technology has been carried out for more than half a century. However, the physics associated with sprinkler protection are very complex, so requirements and standards have mostly been developed by conducting large-scale tests. These tests are usually expensive and the test results are difficult to generalize. In order to overcome the limitations of large-scale testing for sprinkler protection research, FM Global initiated collaborative efforts to develop predictive numerical models for industrial fires with sprinkler protection [1]. As part of this modelling effort, FM Global also initiated a sprinkler technology program, aimed at guiding model development and providing validation data for fire protection using sprinklers [2]. A more detailed description of the sprinkler technology program can be found in Ref. [3]. As part of the sprinkler technology program, previous work [4] showed that
water transport on corrugated cartoned commodities in double-row open frame rack storage generates significantly non-uniform water distributions on the fuel surfaces. When uniform water fluxes were applied on top of a 2 pallet load long × 2 pallet load wide, 3-tier high fuel array of the corrugated cartoned commodity, the water flows measured along the lateral width on the vertical fuel surfaces exhibited standard deviations of the same order of magnitude as the mean value. Such highly non-uniform water distribution on the fuel surfaces raises a number of questions. Is this phenomenon important to overall fire suppression? How can a numerical model account for this phenomenon if it is important? And if not, then what is the key quantity that needs to be simulated correctly so that overall suppression behaviour can be captured? In order to answer these questions, there is a need to determine whether the non-uniform water distribution has a significant impact on the overall fire suppression behaviour. As the first step, the present work focuses on studying the impact of the non-uniform water distribution on fire suppression using an idealized commodity described in detail in the next section.
2 Experimental method
2.1 Fire suppression tests
Fire suppression tests using a water application apparatus (WAA) were selected in the present work to investigate the impact of water surface flows on fuel surfaces. In a WAA test, the fire is allowed to grow after ignition until a predetermined condition is met, e.g., a fixed fire size or a sprinkler activation temperature. A uniform water flux is then applied on top of the fuel array. The water flux is kept constant until the end of the test upon which the fire is either out of control, controlled without further development, or suppressed. Based on a previous study [5], this type of test can help classify representative fuels under different applied water fluxes.
www.witpress.com, ISSN 1743-3533 (on-line) WIT Transactions on Engineering Sciences, Vol 79, © 2013 WIT Press
208 Computational Methods in Multiphase Flow VII
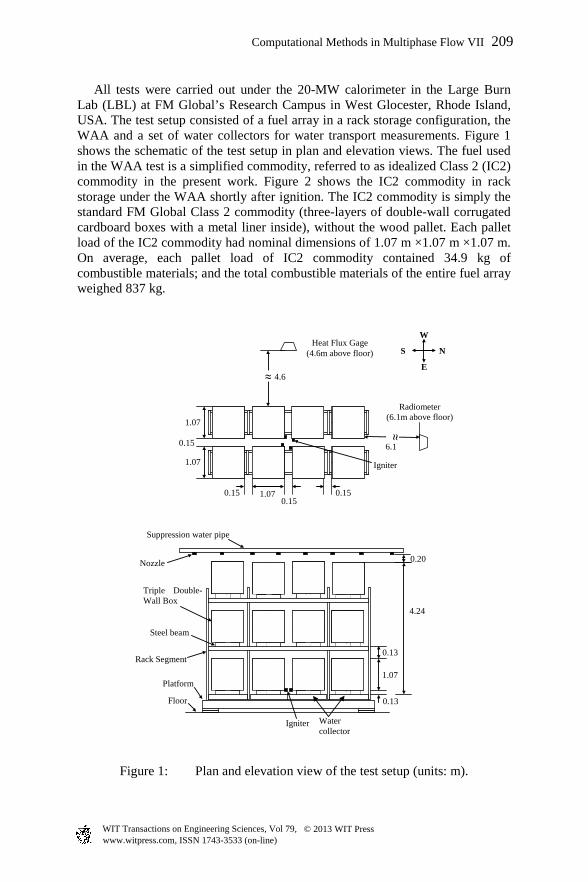
All tests were carried out under the 20-MW calorimeter in the Large Burn Lab (LBL) at FM Global’s Research Campus in West Glocester, Rhode Island, USA. The test setup consisted of a fuel array in a rack storage configuration, the WAA and a set of water collectors for water transport measurements. Figure 1 shows the schematic of the test setup in plan and elevation views. The fuel used in the WAA test is a simplified commodity, referred to as idealized Class 2 (IC2) commodity in the present work. Figure 2 shows the IC2 commodity in rack storage under the WAA shortly after ignition. The IC2 commodity is simply the standard FM Global Class 2 commodity (three-layers of double-wall corrugated cardboard boxes with a metal liner inside), without the wood pallet. Each pallet load of the IC2 commodity had nominal dimensions of 1.07 m ×1.07 m ×1.07 m. On average, each pallet load of IC2 commodity contained 34.9 kg of combustible materials; and the total combustible materials of the entire fuel array weighed 837 kg.
Figure 1: Plan and elevation view of the test setup (units: m).
N
1.07
0.15
1.07 0.15
Igniter
Floor
Rack Segment
1.07
0.13
0.13
4.24
Nozzle 0.20
Suppression water pipe
Platform
0.15 0.15
Triple Double-Wall Box
Steel beam
S
E
W
4.6
Heat Flux Gage (4.6m above floor)
Radiometer (6.1m above floor)
6.1
Igniter
1.07
Water collector
≈
≈
www.witpress.com, ISSN 1743-3533 (on-line) WIT Transactions on Engineering Sciences, Vol 79, © 2013 WIT Press
Computational Methods in Multiphase Flow VII 209
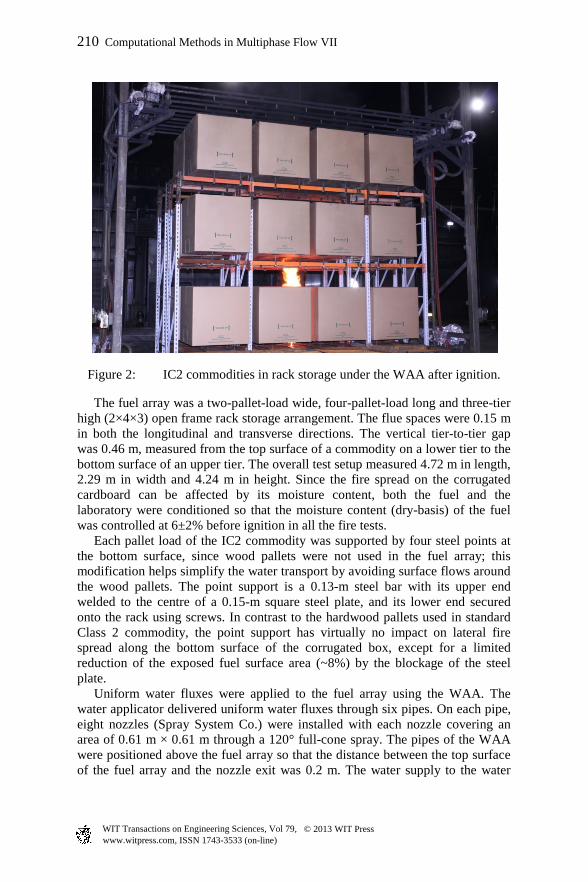
Figure 2: IC2 commodities in rack storage under the WAA after ignition.
The fuel array was a two-pallet-load wide, four-pallet-load long and three-tier high (2×4×3) open frame rack storage arrangement. The flue spaces were 0.15 m in both the longitudinal and transverse directions. The vertical tier-to-tier gap was 0.46 m, measured from the top surface of a commodity on a lower tier to the bottom surface of an upper tier. The overall test setup measured 4.72 m in length, 2.29 m in width and 4.24 m in height. Since the fire spread on the corrugated cardboard can be affected by its moisture content, both the fuel and the laboratory were conditioned so that the moisture content (dry-basis) of the fuel was controlled at 6±2% before ignition in all the fire tests. Each pallet load of the IC2 commodity was supported by four steel points at the bottom surface, since wood pallets were not used in the fuel array; this modification helps simplify the water transport by avoiding surface flows around the wood pallets. The point support is a 0.13-m steel bar with its upper end welded to the centre of a 0.15-m square steel plate, and its lower end secured onto the rack using screws. In contrast to the hardwood pallets used in standard Class 2 commodity, the point support has virtually no impact on lateral fire spread along the bottom surface of the corrugated box, except for a limited reduction of the exposed fuel surface area (~8%) by the blockage of the steel plate. Uniform water fluxes were applied to the fuel array using the WAA. The water applicator delivered uniform water fluxes through six pipes. On each pipe, eight nozzles (Spray System Co.) were installed with each nozzle covering an area of 0.61 m × 0.61 m through a 120° full-cone spray. The pipes of the WAA were positioned above the fuel array so that the distance between the top surface of the fuel array and the nozzle exit was 0.2 m. The water supply to the water
www.witpress.com, ISSN 1743-3533 (on-line) WIT Transactions on Engineering Sciences, Vol 79, © 2013 WIT Press
210 Computational Methods in Multiphase Flow VII
applicator was controlled by a system of valves, pressure regulators and air relievers. More details of the WAA can be found in Ref. [5].
2.2 Instrumentation and measurements
As mentioned earlier, the fuel array and the WAA were setup under a 20-MW calorimeter. The 20 MW calorimeter consists of an inlet hood (10.7 m diameter, 3.81 m high and 11.28 m above the floor), and an exhaust duct (3.05 m diameter) and an instrumentation station approximately 10 diameter downstream from the inlet hood. The instrumentation used in this work included all calorimeter probes (pressure, temperature and gas concentration); on the floor near the test array was a heat flux gage and a radiometer, and water collectors were placed beneath the fuel array (Figure 1). These instruments were intended to quantify the overall fire development in terms of heat release rate and a global water balance.
2.2.1 Heat release rate The existing calorimeter probes provide measurements of exhaust flows in terms of temperatures, pressures, velocities and combustion product concentrations. The heat release rate can be calculated based on CO2/CO generation or O2 consumption; for this study the CO2/CO generation method was selected, rather than oxygen consumption method, due to its better accuracy. In this work, the exhaust flow rate of the 20-MW calorimeter was maintained nominally at 135 kg/s under ambient conditions of 20°C and 1 atm. Given this exhaust flow rate, the pressure and temperature measurements at the calorimeter station were delayed by about 9 seconds compared to the fire source. This delay time includes the transport time of combustion products from the fire to the calorimeter inlet and the transport time from the calorimeter inlet to the instrumentation station. The gas concentrations including O2, CO2, CO were further delayed by approximately 25 seconds due to transport time from the instrumentation station to the gas analyzers which were located in a separate room. Since the mass flow in the calorimeter exhaust duct was maintained largely constant, the HRR values were adjusted by 34 seconds in post-processing to account for the delays due to combustion product transport and gas analysis. It should be pointed out that the overall delay times were affected by the transport of the combustion products into the duct flow. In general, the delay times tend to be shorter in the freeburn stage when the fire size is large compared to when the fire size is small or the fire is significantly suppressed. During suppression, the cooling power of the water is so strong that the combustion products are often driven down to the floor level migrating horizontally, before eventually entering into the calorimeter hood though entrainment.
2.2.2 Water collection measurements Water collectors were used in this work to quantify the amount of water that could reach the bottom of the fuel array. Figure 1 shows the water collectors
positioned below the bottom tier of the fuel array. Figure 3 shows the layout of the water collection pans. Eight water collectors (Pan#01-08) were placed
directly below each fuel stack. The collectors located below the four fuel stacks in the middle of the fuel array (Pan # 02, 03, 06 and 07) were 1.22 m × 1.21 m
www.witpress.com, ISSN 1743-3533 (on-line) WIT Transactions on Engineering Sciences, Vol 79, © 2013 WIT Press
Computational Methods in Multiphase Flow VII 211

Figure 3: Layout of water collectors in the WAA tests.
and 0.3-m tall, while the other four collectors (Pan # 01, 04, 05 and 08) were 1.22 m × 1.17 m and 0.3-m tall due to limited space to fit them into the racks. Additional eight water collectors (Pan#09-16) were placed adjacent to the collectors below the fuel stacks: four to the east (Pan#09-12) and four to the west (Pan#13-16). These collectors were added to characterize water that is delivered and splashes beyond the floor area covered by the fuel array. All water collectors were joined together, with the small gaps between adjacent collectors being covered by steel angles. This design was aimed at collecting all water delivered to the bottom of the commodities as well as the water in the flue spaces. The top surfaces of the water collectors were covered by a metal mesh to prevent large debris from falling into the collector and distorting the measurements. A pressure transducer was connected to the bottom drain of each collector through stainless steel tubes. The pressure signals were calibrated to measure transient water mass collected below each fuel stack. This set of water collection data is expected to help characterize water transport under different suppression conditions in the rack storage configuration.
2.3 Test matrix
Table 1 lists the experimental conditions related to this work. Tests 1–4, 7 and 10 are fire tests where the water was applied when the convective HRR, �̇�𝑐𝑜𝑛𝑣, reached a predetermined value. Different water fluxes were used in these tests to observe the effects on fire development. That is, the fire was suppressed when the higher water flux of 12 mm/min was applied, while the fire was out of control when the lower flux of 4 mm/min was applied. In addition, water collection tests under no fire conditions were also carried out to obtain baseline data to examine water transport. Note that some tests, e.g., Test No. 5, 6, 8, 9, 11 and 14–17 were not reported in this work since they were conducted for different purposes.
www.witpress.com, ISSN 1743-3533 (on-line) WIT Transactions on Engineering Sciences, Vol 79, © 2013 WIT Press
212 Computational Methods in Multiphase Flow VII

Table 1: Matrix of WAA Tests.
Test No.
Fuel Test array Water flux (mm/min)
Water Application Condition
1 Idealized Class 2 2×4, 3-tier 12 �̇�𝑐𝑜𝑛𝑣 = 3.5 MW 2 Idealized Class 2 2×4, 3-tier 12 �̇�𝑐𝑜𝑛𝑣 = 3.5 MW 3 Idealized Class 2 2×4, 3-tier 4 �̇�𝑐𝑜𝑛𝑣 = 3.5 MW 4 Idealized Class 2 2×4, 3-tier 4 �̇�𝑐𝑜𝑛𝑣 = 3.5 MW 7 Idealized Class 2 2×4, 3-tier 12 �̇�𝑐𝑜𝑛𝑣 = 3.5 MW 10 Idealized Class 2 2×4, 3-tier 4 �̇�𝑐𝑜𝑛𝑣 = 3.5 MW 12 Idealized Class 2 2×4, 3-tier 4 Water collection only 13 Idealized Class 2 2×4, 3-tier 4 Water collection only 18 Idealized Class 2 2×4, 3-tier 4 Water collection only 19 Idealized Class 2 2×4, 3-tier 4 Water collection only
3 Experimental results and discussions
3.1 Test repeatability
Figure 4 shows the comparisons of measured HRRs of repeated tests in the 2×4×3 arrays. The vertical axis is the chemical HRR and the horizontal axis the time after ignition. Clearly with the higher water flux (12 mm/min) applied, the fires were suppressed, while with the lower water flux (4 mm/min) applied, the HRRs continue to grow even after water application. When the fires were out of control at ~ 6 min after ignition, the tests had to be terminated. In order to examine the test repeatability, a simple measure of test repeatability, 𝑅𝑉𝑇𝑀, is defined as the variation-to-mean ratio for a quantity of interest,
𝑅𝑉𝑇𝑀 = |𝑞𝑚𝑎𝑥 − 𝑞𝑚𝑖𝑛|/2∑ 𝑞𝑖/𝑁𝑁𝑖=1 .
In this equation, 𝑞𝑚𝑎𝑥 and 𝑞𝑚𝑖𝑛 are the maximum and minimum values of any quantity of interest, respectively, such as HRR and total integrated chemical energy; the denominator is the averaged value of all tests conducted. Note that this simple definition of test repeatability, instead of the traditional standard deviation over mean ratio, was adopted in the present work because each test condition was only repeated one or two times. Based on the above definition, the variation-to-mean ratios, RVTM, for the 2×4×3 arrays were calculated for the chemical energy at different stages of the fire tests and the measured maximum HRR and �̇�𝑏𝑒. The results are shown in Table 2 for two different water fluxes. The fire growth period was defined as the period 50 seconds prior to the water application. For the higher water flux tests, the RVTM values for chemical energy during suppression and for the total test were calculated for 500 s and 600 s, respectively, after water application. Similar calculations were carried out for 200 s and 300 s, respectively, for the lower water flux cases. The shorter time periods were used in the lower water flux cases since the fires were quickly out of control. The maximum HRR, �̇�𝑚𝑎𝑥, was
www.witpress.com, ISSN 1743-3533 (on-line) WIT Transactions on Engineering Sciences, Vol 79, © 2013 WIT Press
Computational Methods in Multiphase Flow VII 213
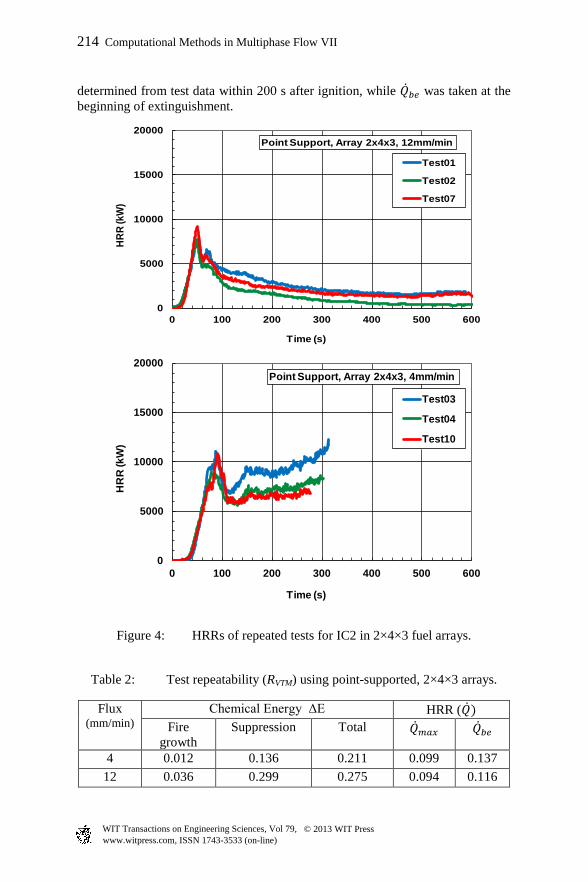
determined from test data within 200 s after ignition, while �̇�𝑏𝑒 was taken at the beginning of extinguishment.
Figure 4: HRRs of repeated tests for IC2 in 2×4×3 fuel arrays.
Table 2: Test repeatability (RVTM) using point-supported, 2×4×3 arrays.
Flux (mm/min)
Chemical Energy ΔE HRR (�̇�) Fire
growth Suppression Total �̇�𝑚𝑎𝑥 �̇�𝑏𝑒
4 0.012 0.136 0.211 0.099 0.137 12 0.036 0.299 0.275 0.094 0.116
0
5000
10000
15000
20000
0 100 200 300 400 500 600
HRR
(kW
)
Time (s)
Point Support, Array 2x4x3, 12mm/min
Test01
Test02
Test07
0
5000
10000
15000
20000
0 100 200 300 400 500 600
HR
R (k
W)
Time (s)
Point Support, Array 2x4x3, 4mm/min
Test03
Test04
Test10
www.witpress.com, ISSN 1743-3533 (on-line) WIT Transactions on Engineering Sciences, Vol 79, © 2013 WIT Press
214 Computational Methods in Multiphase Flow VII

From Table 2, the repeatability in terms of chemical energy during fire growth is very high (RVTM < 5%) for the two fuel arrays and the two applied water fluxes. The variations are larger in the fire suppression stage (RVTM < 30%) than the growth stage. This also results in higher RVTM for the total test performance (RVTM < 28%). As for the HRRs including �̇�𝑚𝑎𝑥 and �̇�𝑏𝑒, the RVTM values are less than 10% and 14%, respectively for both water application rates. Taking all these values together, it is clear that the variation of overall fire suppression performance is much less variable than those of the surface water flows on the vertical fuel surfaces given in Ref. [4]. As reported in Ref. [4], the variations (standard deviation to mean ratios) of water flow rates on the vertical walls are on the order of 100%, while the values decrease to 10-15% if averaged over the commodity (four side walls together). These comparisons appear to suggest that the overall fire suppression is more related to the water transport over the entire commodity on a pallet-load level than that on each fuel surface with uniform water application, under the uniform water conditions employed in the present work. Extrapolation of this result to sprinkler protection requires further investigation.
3.2 Water collection tests
The results of water collection measurements in WAA tests are shown in Figures 5 and 6. The quantity obtained directly from the water collection pans is the accumulated mass of water, Δm(t), as a function of time. However, considering the accumulated water mass also varies as a function of the applied water flux, all data in Figures 5 and 6 are normalized using a value of accumulated mass at a given time under the no-fire condition (Δmnofire). The normalization was carried out using water collection at 500s after water application in Figure 5, while in Figure 6, the normalization was performed with total water collection at 300s after water application. This helps to remove the variations caused by the use of different water fluxes and nozzles. Note that some pressure probes were not functioning correctly in fire tests due to excessive heat. As a result, only physically-reasonable data were included in the two figures. The upper and lower plots in Figures 5 and 6 represent water collection results from the center (Pan # 2, 3, 6 and 7) and end (Pan # 1, 4, 5 and 8) stacks, respectively (see Figures 1 and 3). It can be seen from Figures 5 and 6 that for the 2×4×3 fuel arrays, less water is transported to the bottom of the center stacks than at the end stacks. When the fire is suppressed, the water collected at 500s after ignition under the center and end stacks is ~60% and ~100%, respectively, of the amount under the no fire condition. When the fire is not suppressed, these two values become ~20% and ~40% at 200s after water application, which are significantly less than those for suppressed fires. Similar trends were also observed from collection pans (Pan # 9 - 16) located on the floor outside the fuel array footprint, i.e., water collection fractions are higher when the fire was suppressed than those when the fire was out of control. Furthermore, if the 𝑅𝑉𝑇𝑀 definition is applied to measurements shown in
www.witpress.com, ISSN 1743-3533 (on-line) WIT Transactions on Engineering Sciences, Vol 79, © 2013 WIT Press
Computational Methods in Multiphase Flow VII 215

Figures 5 and 6 (except upper panel in Figure 6), the results are all < 30%, which are in similar magnitude to those of the HRR variations (Figure 4 and Table 2). These levels of variation are much less than the water flow rates measured along individual fuel surfaces given in Ref. [4], which also suggests that the overall fire suppression performance is likely controlled by some averaged water flow quantities over a commodity pallet load, instead of on each fuel surface.
Figure 5: Normalized water collection below the fuel array in suppressed IC2 fires using point support under water flux of 12 mm/min. Upper panel – central columns of the fuel array; lower panel – end columns of the fuel array.
0
0.2
0.4
0.6
0.8
1
0 100 200 300 400 500
Δm
(t) / Δ
mno
fire
Time (s)
Test02_centerTest02_centerTest07_centerTest07_centerTest07_center
0
0.2
0.4
0.6
0.8
1
0 100 200 300 400 500
Δm
(t) / Δ
mno
fire
Time (s)
Test01_end Test01_end
Test01_end Test02_end
Test02_end Test02_end
Test02_end Test07_end
Test07_end Test07_end
www.witpress.com, ISSN 1743-3533 (on-line) WIT Transactions on Engineering Sciences, Vol 79, © 2013 WIT Press
216 Computational Methods in Multiphase Flow VII
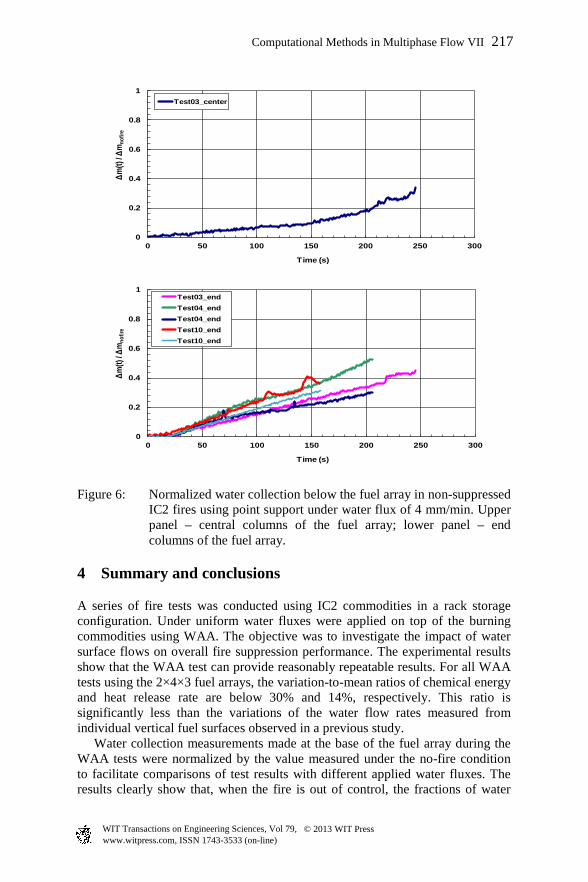
Figure 6: Normalized water collection below the fuel array in non-suppressed IC2 fires using point support under water flux of 4 mm/min. Upper panel – central columns of the fuel array; lower panel – end columns of the fuel array.
4 Summary and conclusions
A series of fire tests was conducted using IC2 commodities in a rack storage configuration. Under uniform water fluxes were applied on top of the burning commodities using WAA. The objective was to investigate the impact of water surface flows on overall fire suppression performance. The experimental results show that the WAA test can provide reasonably repeatable results. For all WAA tests using the 2×4×3 fuel arrays, the variation-to-mean ratios of chemical energy and heat release rate are below 30% and 14%, respectively. This ratio is significantly less than the variations of the water flow rates measured from individual vertical fuel surfaces observed in a previous study. Water collection measurements made at the base of the fuel array during the WAA tests were normalized by the value measured under the no-fire condition to facilitate comparisons of test results with different applied water fluxes. The results clearly show that, when the fire is out of control, the fractions of water
0
0.2
0.4
0.6
0.8
1
0 50 100 150 200 250 300
Δm(t)
/ Δm
nofir
e
Time (s)
Test03_center
0
0.2
0.4
0.6
0.8
1
0 50 100 150 200 250 300
Δm(t)
/ Δm
nofir
e
Time (s)
Test03_endTest04_endTest04_endTest10_endTest10_end
www.witpress.com, ISSN 1743-3533 (on-line) WIT Transactions on Engineering Sciences, Vol 79, © 2013 WIT Press
Computational Methods in Multiphase Flow VII 217
collected are significantly less than those when the fire is suppressed. Furthermore, the water collected directly below the center fuel stacks where ignition occurred was less than that below the adjacent (end) fuel stacks. The reasonable repeatability of the HRRs obtained under different water fluxes shows that the overall suppression behavior of the IC2 commodity is not sensitive to local water flow distribution on the fuel surface, which has been shown to be highly non-uniform and, presumably, non-repeatable. Water collection data from repeated tests exhibited a similar level of variation compared to the HRR measurements, which also suggests that the overall fire suppression results are likely controlled by some averaged quantities related to water transport on the commodity pallet load level, rather than individual fuel surface, under the condition of uniform water application.
References
[1] Dorofeev, S.B., “Overview of FM Global Fire Modeling Program,” FM Global Open Source CFD Fire Modeling Workshop, Norwood MA, 2009 (http://sites.google.com/site/firemodelingworkshop).
[2] Xin, Y., “Modeling Water-based Fire Suppression” FM Global Open Source CFD Fire Modeling Workshop, Norwood MA, 2009 (http://sites.google.com/site/firemodelingworkshop).
[3] Xin, Y., de Vries, J., Meredith, K., Zhou, X., Thumuluru, S., and Yu, H-Z., “Fire Suppression Physics for Sprinkler Protection,” Proceedings of FIRESEAT Symposium, Edinburgh, UK, 2011 pp. 23-36.
[4] de Vries, J., Meredith K., Xin Y., “An Experimental Study of Fire Suppression Physics for Sprinkler Protection” Fire Safety Science – Proceedings of the Tenth International Symposium, International Association for Fire Safety Science, pp. 429-442, 2011.
[5] Xin, Y., and Tamanini, F., “Assessment of Commodity Classification for Sprinkler Protection Using Representative Fuels,” Fire Safety Science – Proceedings of the Ninth International Symposium, International Association for Fire Safety Science, pp. 527-538, 2008.
www.witpress.com, ISSN 1743-3533 (on-line) WIT Transactions on Engineering Sciences, Vol 79, © 2013 WIT Press
218 Computational Methods in Multiphase Flow VII


![Research Article Viscous Flows Driven by Uniform Shear over a … · 2019. 7. 31. · a stretching sheet in presence of uniform shear-free stream. Xu [ ] obtained the analytic solution](https://img.pdfslide.us/doc/110x75/61020fd01894c120dc1f9af5/research-article-viscous-flows-driven-by-uniform-shear-over-a-2019-7-31-a-stretching.jpg)