Embed Size (px)
Citation preview
Session 027 PD - Impact of New Mortality Tables for U.S. Pension Plans
Moderator:
Julie A. Curtis, FSA, EA, MAAA
Presenters: Irina Pogrebivsky, FSA, EA
Lisa A. Schilling, FSA, EA, FCA, MAAA
SOA Antitrust Compliance Guidelines SOA Presentation Disclaimer
MODERATOR: JULIE A. CURTIS, FSA, EA, MAAA
PRESENTERS:
IRINA POGREBIVSKY, FSA, EA
LISA SCHILLING, FSA, EA, FCA, MAAA
2017 SOA Annual Meeting & Exhibit
027 PD – Impact of New Mortality Tables for US Pension PlansOct. 16, 2017
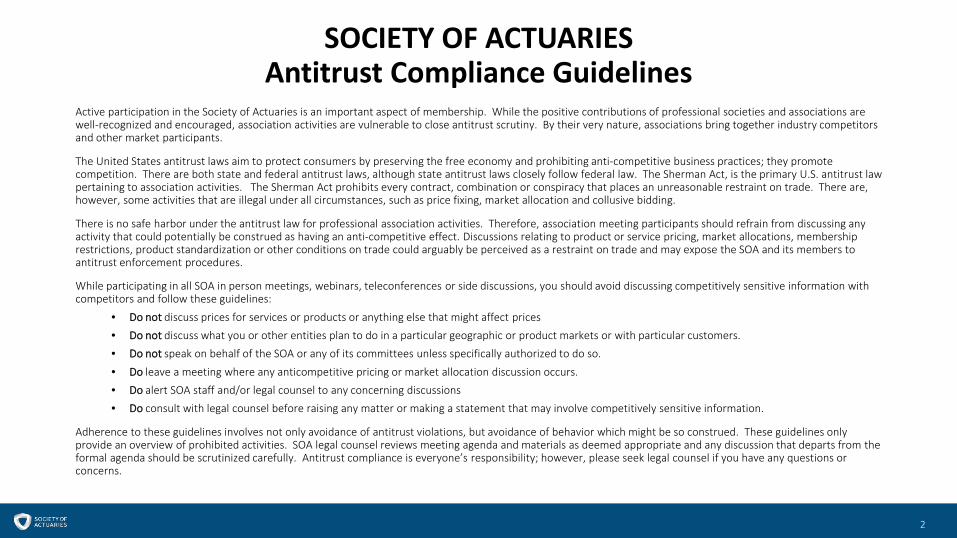
SOCIETY OF ACTUARIESAntitrust Compliance Guidelines
Active participation in the Society of Actuaries is an important aspect of membership. While the positive contributions of professional societies and associations are well-recognized and encouraged, association activities are vulnerable to close antitrust scrutiny. By their very nature, associations bring together industry competitors and other market participants.
The United States antitrust laws aim to protect consumers by preserving the free economy and prohibiting anti-competitive business practices; they promote competition. There are both state and federal antitrust laws, although state antitrust laws closely follow federal law. The Sherman Act, is the primary U.S. antitrust law pertaining to association activities. The Sherman Act prohibits every contract, combination or conspiracy that places an unreasonable restraint on trade. There are, however, some activities that are illegal under all circumstances, such as price fixing, market allocation and collusive bidding.
There is no safe harbor under the antitrust law for professional association activities. Therefore, association meeting participants should refrain from discussing any activity that could potentially be construed as having an anti-competitive effect. Discussions relating to product or service pricing, market allocations, membership restrictions, product standardization or other conditions on trade could arguably be perceived as a restraint on trade and may expose the SOA and its members to antitrust enforcement procedures.
While participating in all SOA in person meetings, webinars, teleconferences or side discussions, you should avoid discussing competitively sensitive information with competitors and follow these guidelines:
• Do not discuss prices for services or products or anything else that might affect prices• Do not discuss what you or other entities plan to do in a particular geographic or product markets or with particular customers.• Do not speak on behalf of the SOA or any of its committees unless specifically authorized to do so.
• Do leave a meeting where any anticompetitive pricing or market allocation discussion occurs.• Do alert SOA staff and/or legal counsel to any concerning discussions• Do consult with legal counsel before raising any matter or making a statement that may involve competitively sensitive information.
Adherence to these guidelines involves not only avoidance of antitrust violations, but avoidance of behavior which might be so construed. These guidelines only provide an overview of prohibited activities. SOA legal counsel reviews meeting agenda and materials as deemed appropriate and any discussion that departs from the formal agenda should be scrutinized carefully. Antitrust compliance is everyone’s responsibility; however, please seek legal counsel if you have any questions or concerns.
2
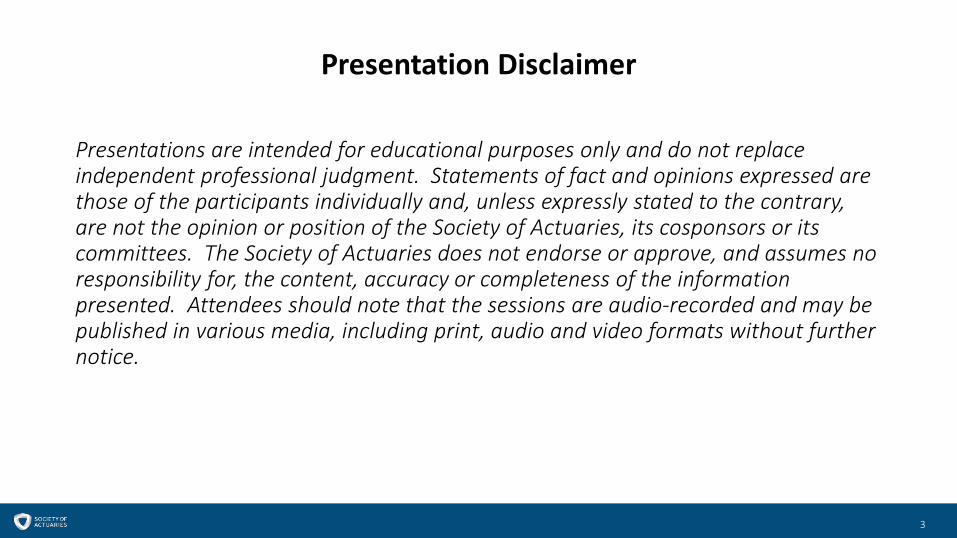
Presentation Disclaimer
Presentations are intended for educational purposes only and do not replace independent professional judgment. Statements of fact and opinions expressed are those of the participants individually and, unless expressly stated to the contrary, are not the opinion or position of the Society of Actuaries, its cosponsors or its committees. The Society of Actuaries does not endorse or approve, and assumes no responsibility for, the content, accuracy or completeness of the information presented. Attendees should note that the sessions are audio-recorded and may be published in various media, including print, audio and video formats without further notice.
3
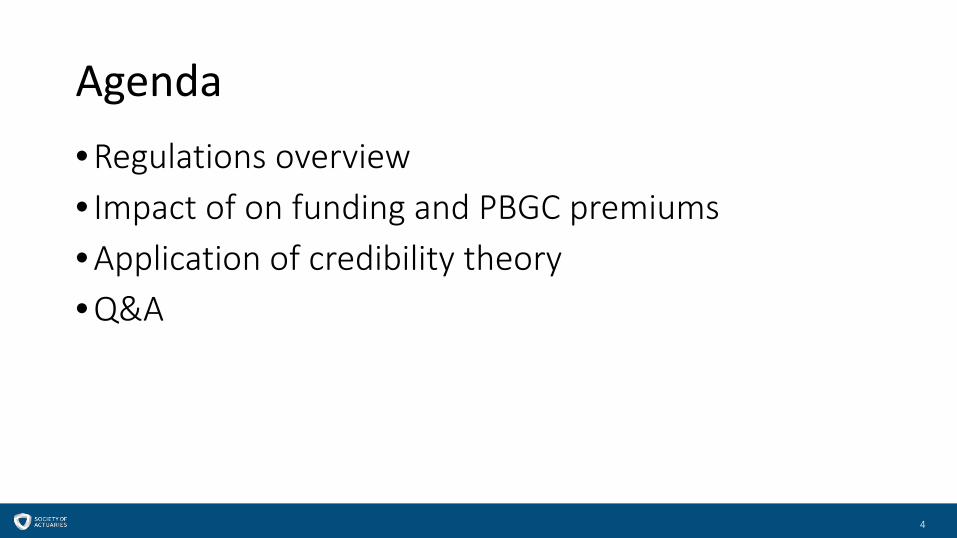
Agenda• Regulations overview• Impact of on funding and PBGC premiums• Application of credibility theory• Q&A
4
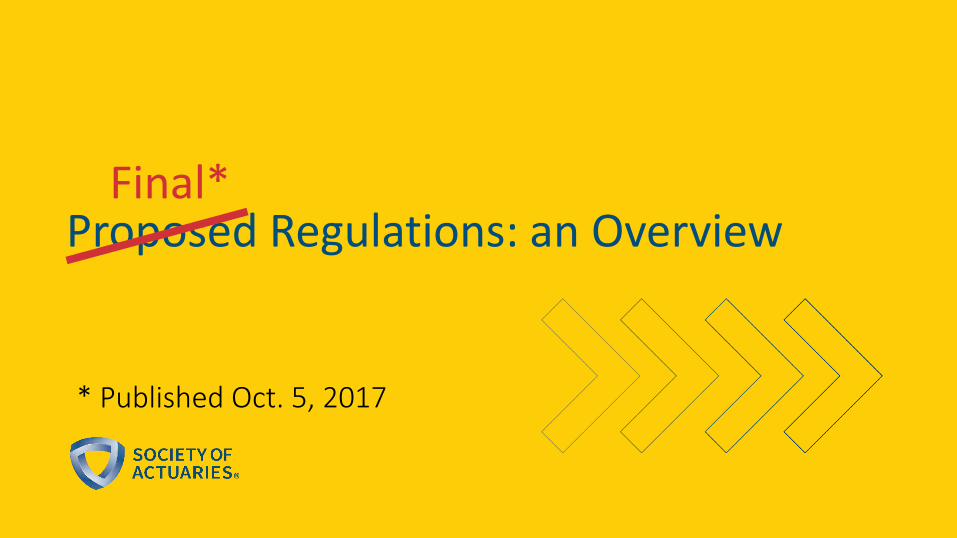
Proposed Regulations: an OverviewFinal*
* Published Oct. 5, 2017
66
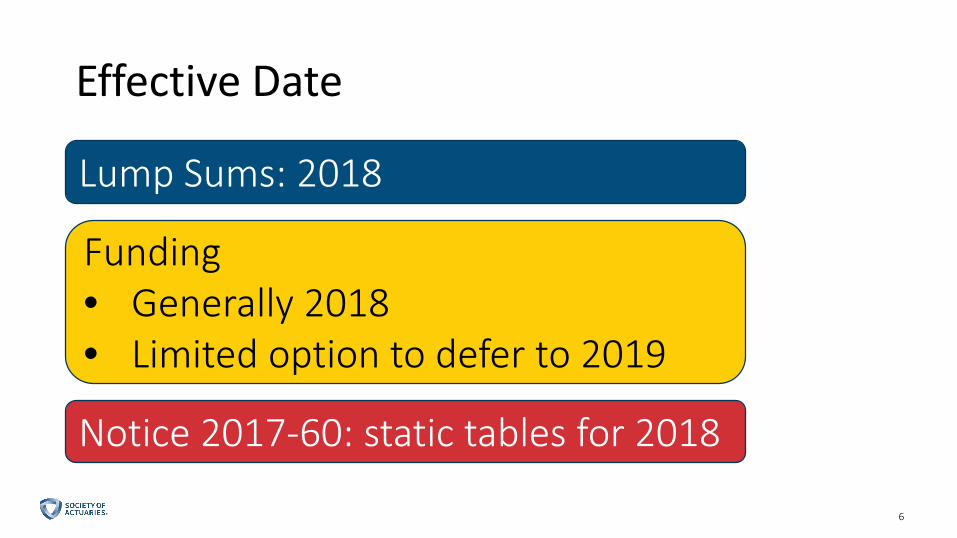
Effective Date
Lump Sums: 2018
Funding• Generally 2018• Limited option to defer to 2019
Notice 2017-60: static tables for 2018
77
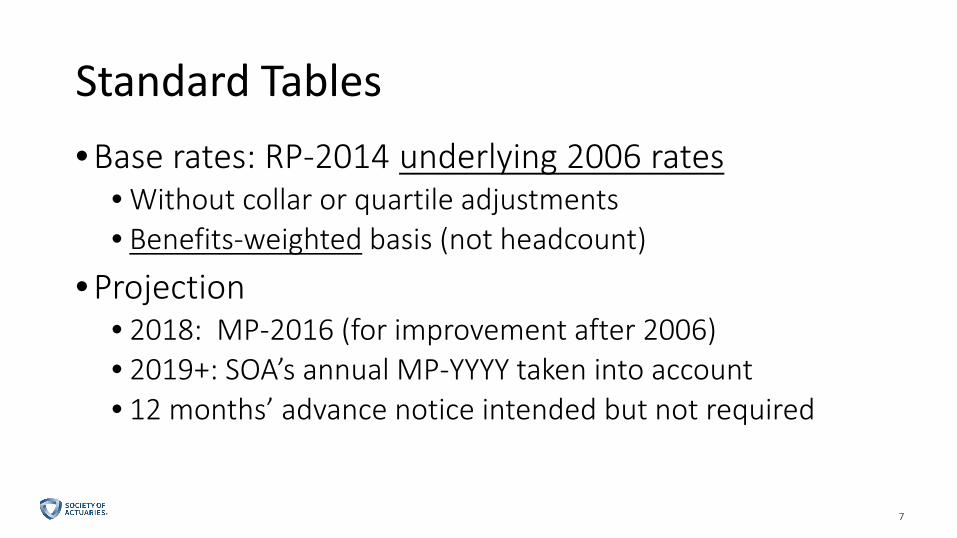
Standard Tables• Base rates: RP-2014 underlying 2006 rates
• Without collar or quartile adjustments• Benefits-weighted basis (not headcount)
• Projection• 2018: MP-2016 (for improvement after 2006)• 2019+: SOA’s annual MP-YYYY taken into account• 12 months’ advance notice intended but not required
88
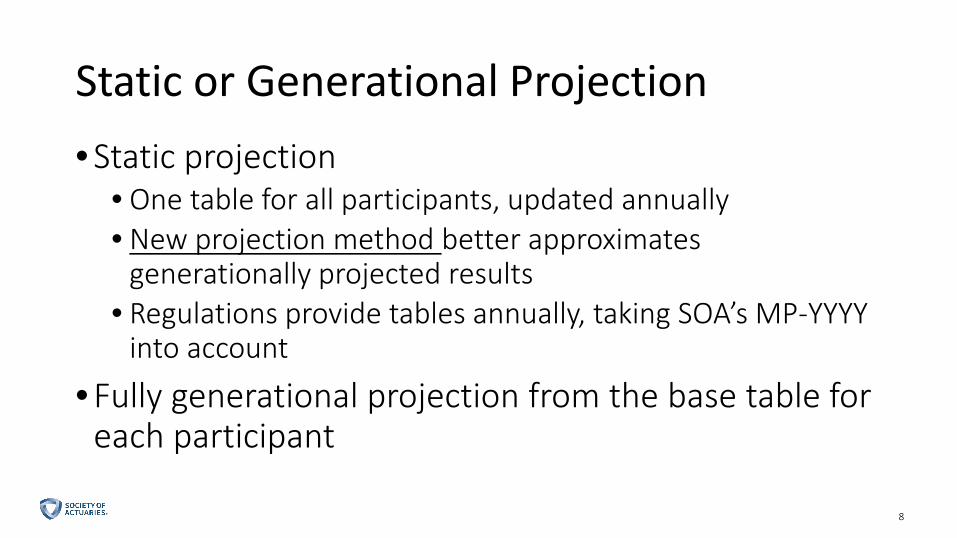
Static or Generational Projection• Static projection
• One table for all participants, updated annually• New projection method better approximates
generationally projected results• Regulations provide tables annually, taking SOA’s MP-YYYY
into account
• Fully generational projection from the base table for each participant
99
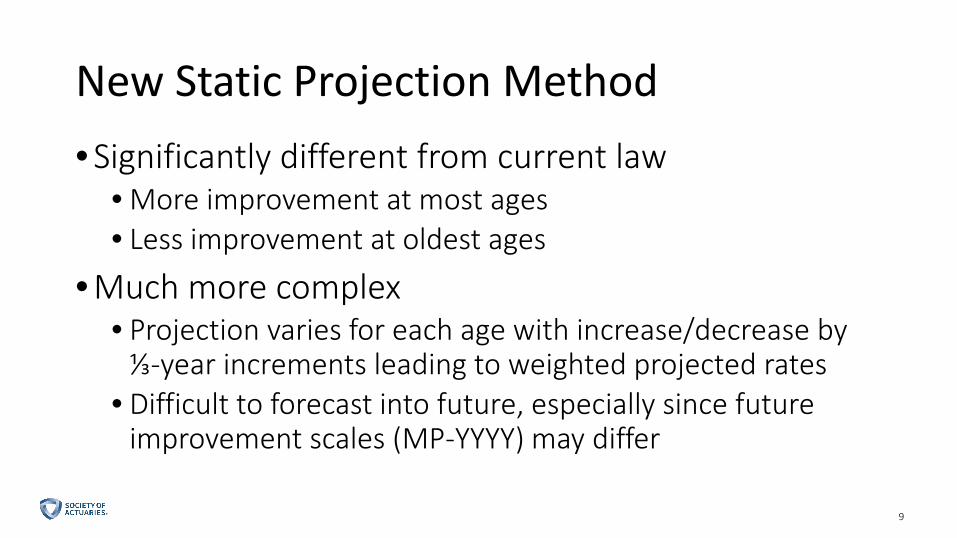
New Static Projection Method• Significantly different from current law
• More improvement at most ages• Less improvement at oldest ages
• Much more complex• Projection varies for each age with increase/decrease by
⅓-year increments leading to weighted projected rates• Difficult to forecast into future, especially since future
improvement scales (MP-YYYY) may differ
1010
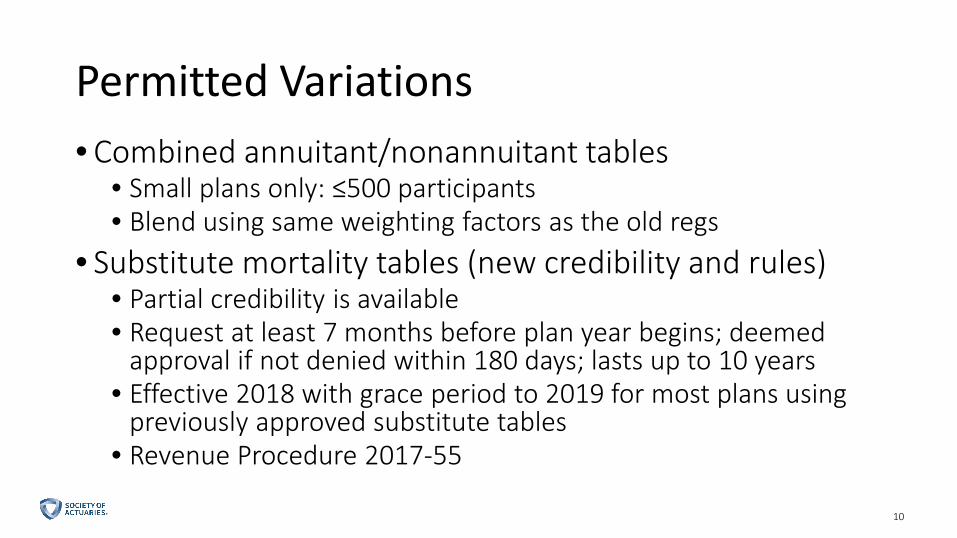
Permitted Variations• Combined annuitant/nonannuitant tables
• Small plans only: ≤500 participants• Blend using same weighting factors as the old regs
• Substitute mortality tables (new credibility and rules)• Partial credibility is available• Request at least 7 months before plan year begins; deemed
approval if not denied within 180 days; lasts up to 10 years• Effective 2018 with grace period to 2019 for most plans using
previously approved substitute tables• Revenue Procedure 2017-55
Impact of Proposed Standard Tables
1212
Effect of Standard Tables• Liabilities could increase 2% to 5%• Magnitude depends on
• Plan design• Demographics• Version of tables used
1313
SE System-wide Analysis• Plan-level data and modeling• Form 5500 database, late Oct. 2016• Full 5500 only (not Form 5500-EZ)
• ~7,500 plans• ~98% of SE universe of liabilities
• Complete reporting for 2014, partial year for 2015
1414
Getting to 2018: Assumptions• Treasury HQM corporate bond yield curve spot rates
are constant after 2016• 6% annual ROA after 2016• Actual contributions: similar to patterns for 2012-
2015 relative to funding levels
1515
2018 Mortality Assumptions• Standard tables for all plans• Static projection
• More common before 2018• New approach more commonly mimics generational
results
16
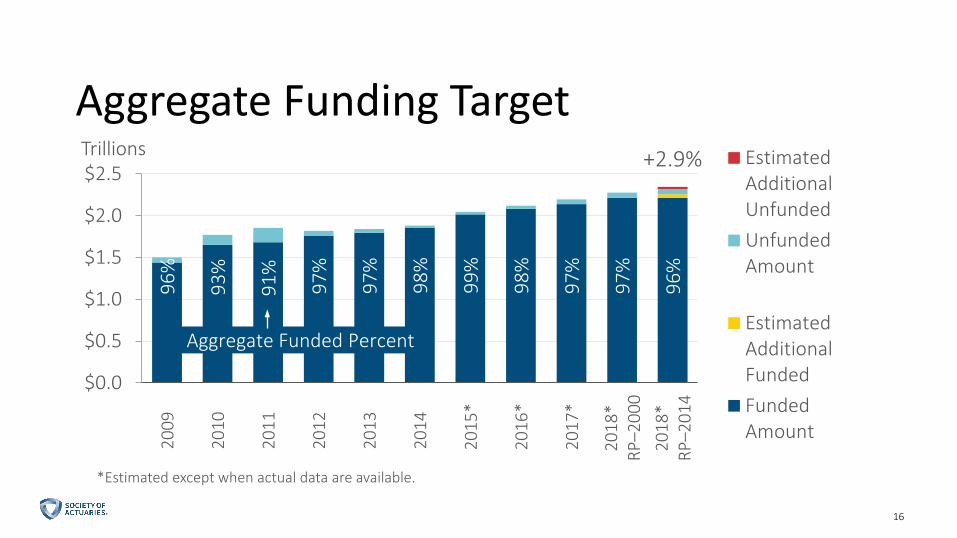
96%
93%
91%
97%
97%
98%
99%
98%
97%
97%
96%
-140%
-40%
60%
160%
260%
360%
460%
$0.0
$0.5
$1.0
$1.5
$2.0
$2.520
09
2010
2011
2012
2013
2014
2015
*
2016
*
2017
*
2018
*RP
–200
020
18*
RP–2
014
Trillions EstimatedAdditionalUnfundedUnfundedAmount
EstimatedAdditionalFundedFundedAmount
Aggregate Funded Percent
16
Aggregate Funding Target
*Estimated except when actual data are available.
+2.9%
17
-140%
-40%
60%
160%
260%
360%
460%
$2.10
$2.15
$2.20
$2.25
$2.30
$2.35
$2.40
2017
2018
RP–2
000
2018
RP–2
014
Trillions
AdditionalUnfundedUnfunded
AdditionalFundedFunded
0.063
0.085
17
Closer Look: Aggregate Funding Target
All values are estimated.
18
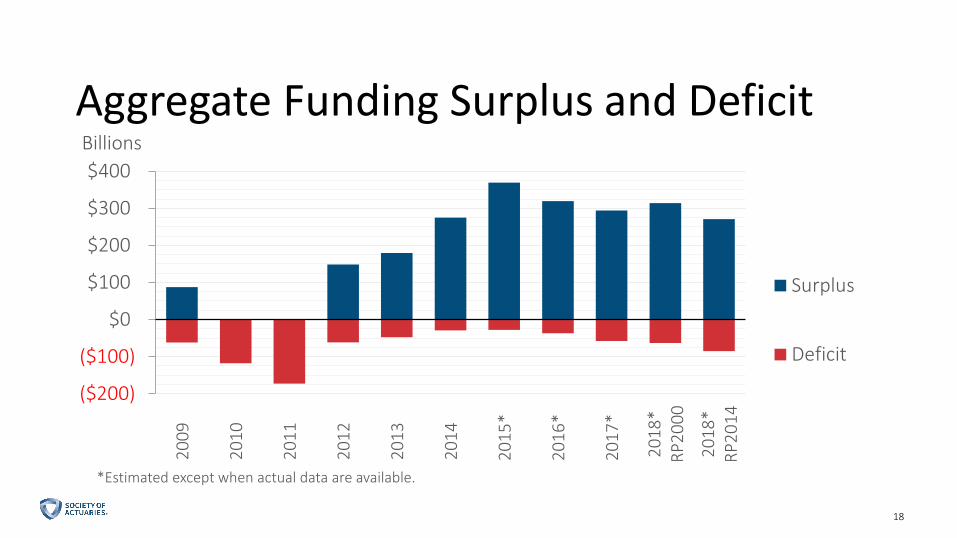
($200)
($100)
$0
$100
$200
$300
$40020
09
2010
2011
2012
2013
2014
2015
*
2016
*
2017
*
2018
*RP
2000
2018
*RP
2014
Billions
Surplus
Deficit
18
Aggregate Funding Surplus and Deficit
*Estimated except when actual data are available.
19
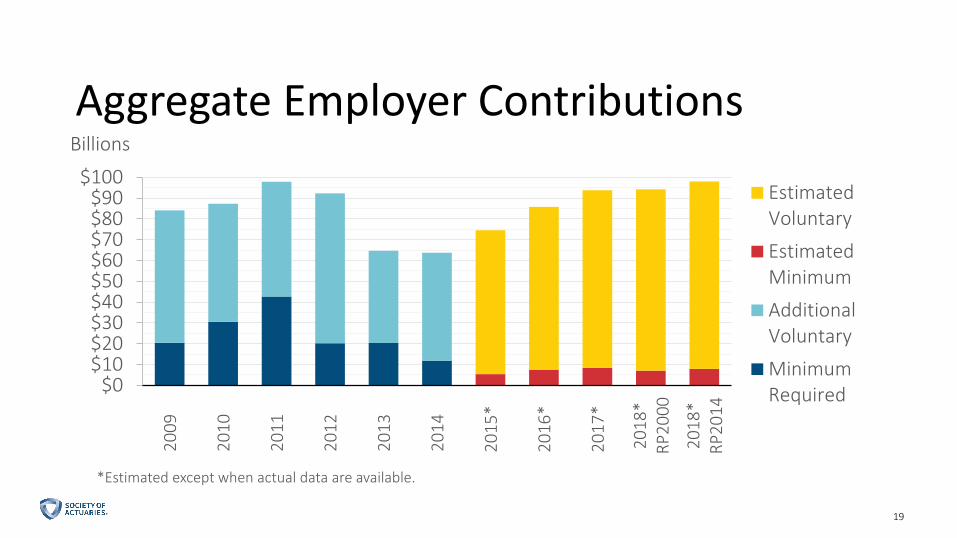
$0$10$20$30$40$50$60$70$80$90
$10020
09
2010
2011
2012
2013
2014
2015
*
2016
*
2017
*
2018
*RP
2000
2018
*RP
2014
Billions
EstimatedVoluntary
EstimatedMinimum
AdditionalVoluntary
MinimumRequired
19
Aggregate Employer Contributions
*Estimated except when actual data are available.
20
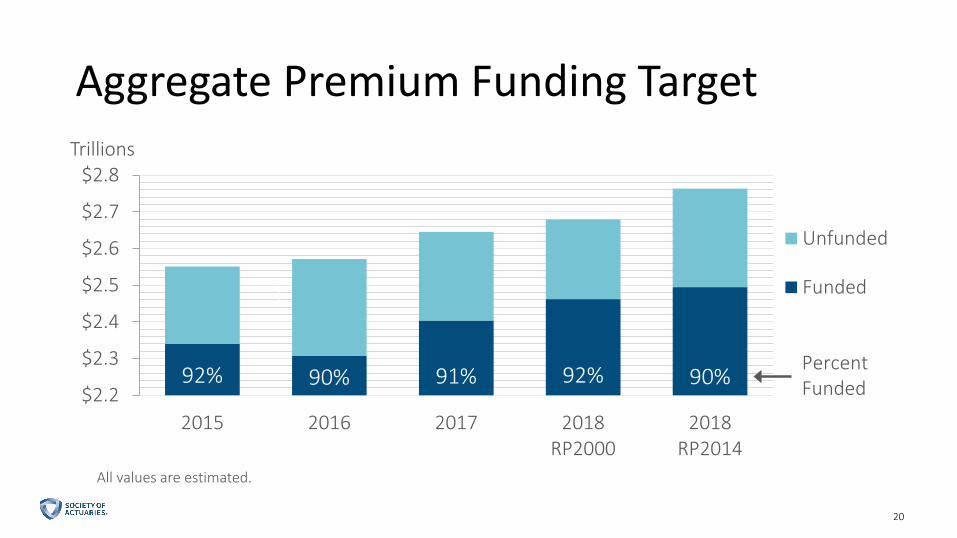
Aggregate Premium Funding Target
92% 90% 91% 92% 90%70%
120%
170%
220%
270%
$2.2
$2.3
$2.4
$2.5
$2.6
$2.7
$2.8
2015 2016 2017 2018RP2000
2018RP2014
Trillions
Unfunded
Funded
PercentFundedPercent Funded
All values are estimated.
20
21
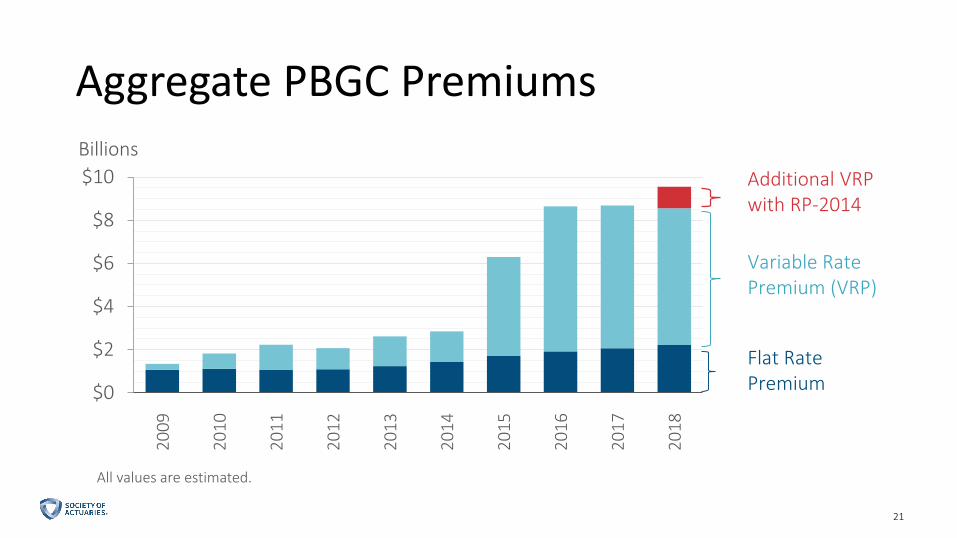
Aggregate PBGC Premiums
$0
$2
$4
$6
$8
$1020
09
2010
2011
2012
2013
2014
2015
2016
2017
2018
BillionsAdditional VRP with RP-2014
Variable Rate Premium (VRP)
Flat Rate Premium
All values are estimated.
21
Application of Credibility Theory in Proposed Regulations and Beyond
2323
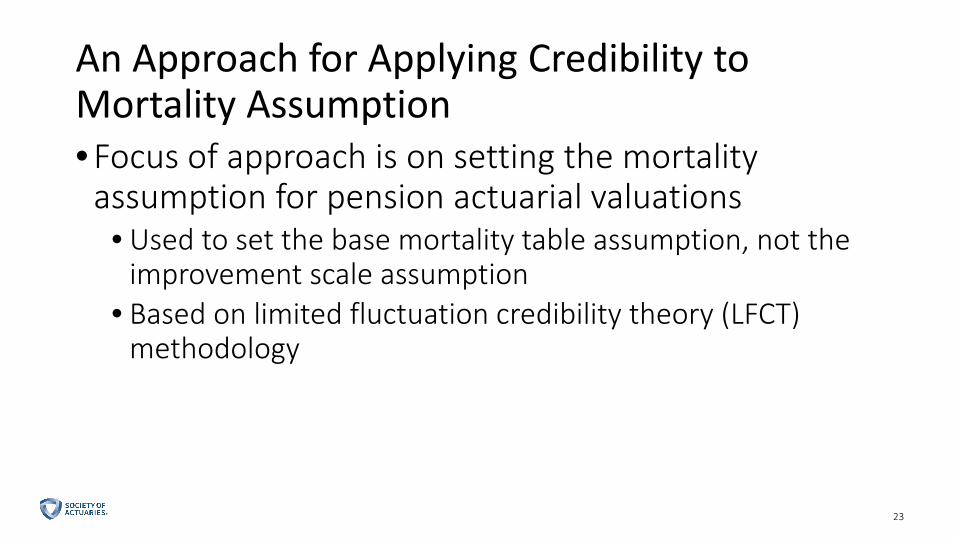
An Approach for Applying Credibility to Mortality Assumption• Focus of approach is on setting the mortality
assumption for pension actuarial valuations• Used to set the base mortality table assumption, not the
improvement scale assumption• Based on limited fluctuation credibility theory (LFCT)
methodology
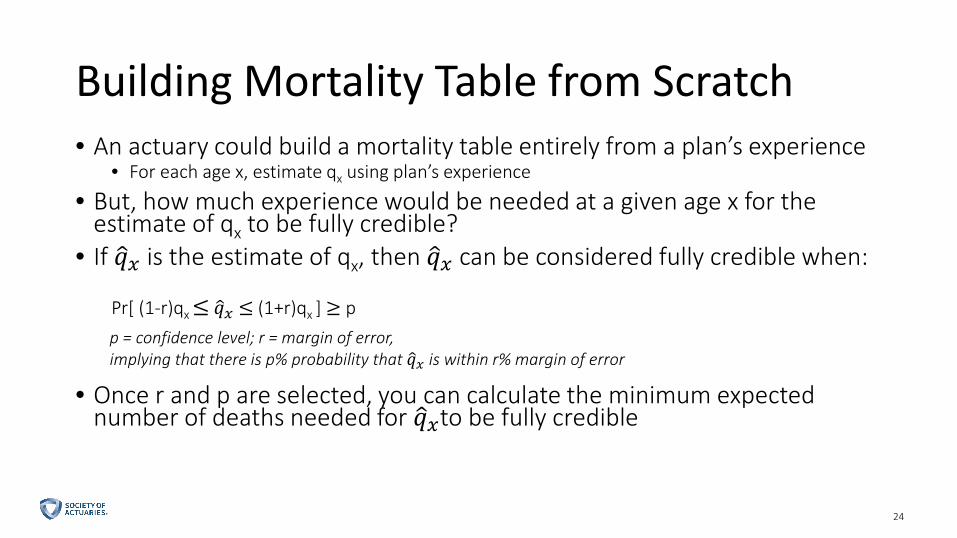
2424
Building Mortality Table from Scratch• An actuary could build a mortality table entirely from a plan’s experience
• For each age x, estimate qx using plan’s experience
• But, how much experience would be needed at a given age x for the estimate of qx to be fully credible?
• If �𝑞𝑞𝑥𝑥 is the estimate of qx, then �𝑞𝑞𝑥𝑥 can be considered fully credible when:
Pr[ (1-r)qx ≤ �𝑞𝑞𝑥𝑥 ≤ (1+r)qx ] ≥ p
• Once r and p are selected, you can calculate the minimum expected number of deaths needed for �𝑞𝑞𝑥𝑥to be fully credible
p = confidence level; r = margin of error,implying that there is p% probability that �𝑞𝑞𝑥𝑥 is within r% margin of error
2525
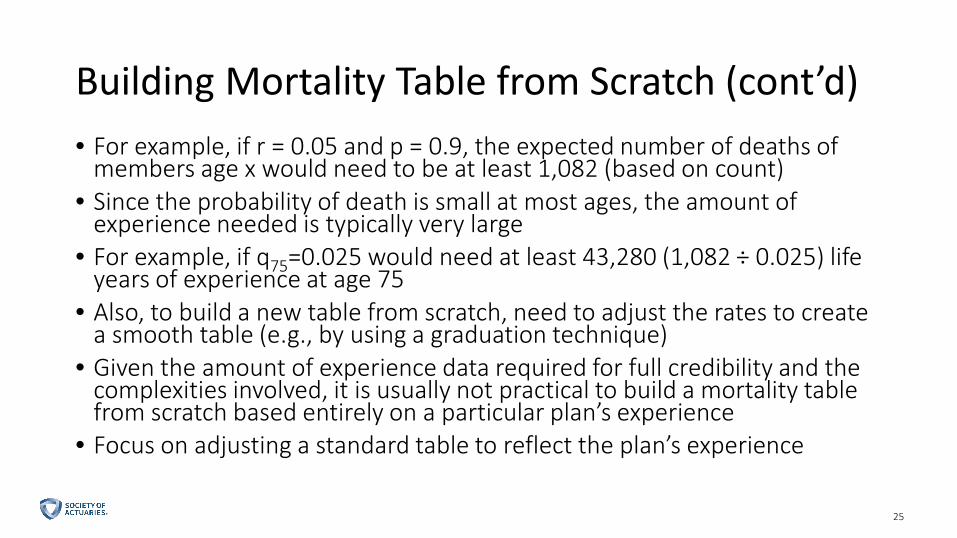
Building Mortality Table from Scratch (cont’d)• For example, if r = 0.05 and p = 0.9, the expected number of deaths of
members age x would need to be at least 1,082 (based on count)• Since the probability of death is small at most ages, the amount of
experience needed is typically very large• For example, if q75=0.025 would need at least 43,280 (1,082 ÷ 0.025) life
years of experience at age 75• Also, to build a new table from scratch, need to adjust the rates to create
a smooth table (e.g., by using a graduation technique)• Given the amount of experience data required for full credibility and the
complexities involved, it is usually not practical to build a mortality table from scratch based entirely on a particular plan’s experience
• Focus on adjusting a standard table to reflect the plan’s experience

2626
Credibility Approach
Lots of data, but may not accurately
reflect specific pension plan
Standard Mortality Table(relevant data)
Reflects plan, but may not be
fully reliable
Actual Plan Mortality Experience
Goal: improve actuarial assumptions by combining actual plan experience with relevant experience.
2727
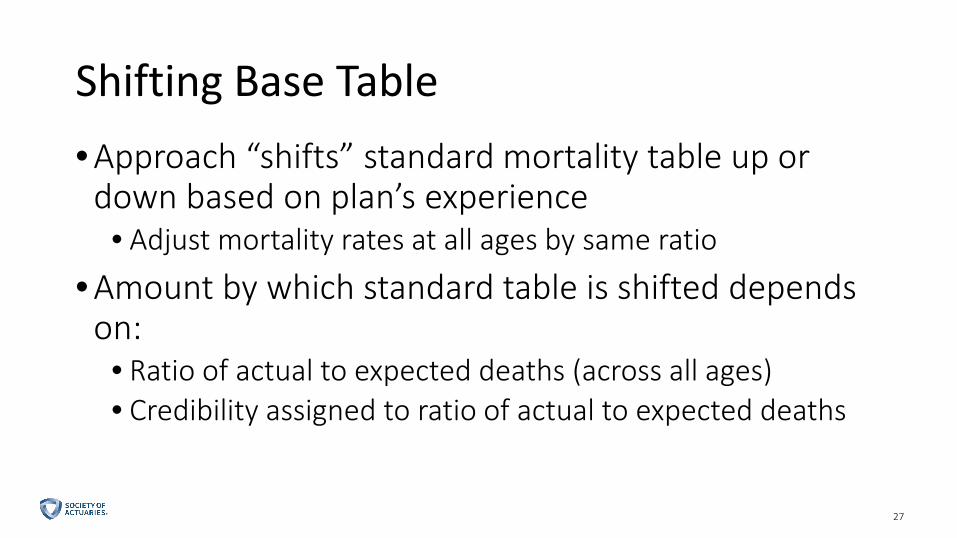
Shifting Base Table • Approach “shifts” standard mortality table up or
down based on plan’s experience• Adjust mortality rates at all ages by same ratio
• Amount by which standard table is shifted depends on:
• Ratio of actual to expected deaths (across all ages)• Credibility assigned to ratio of actual to expected deaths
2828
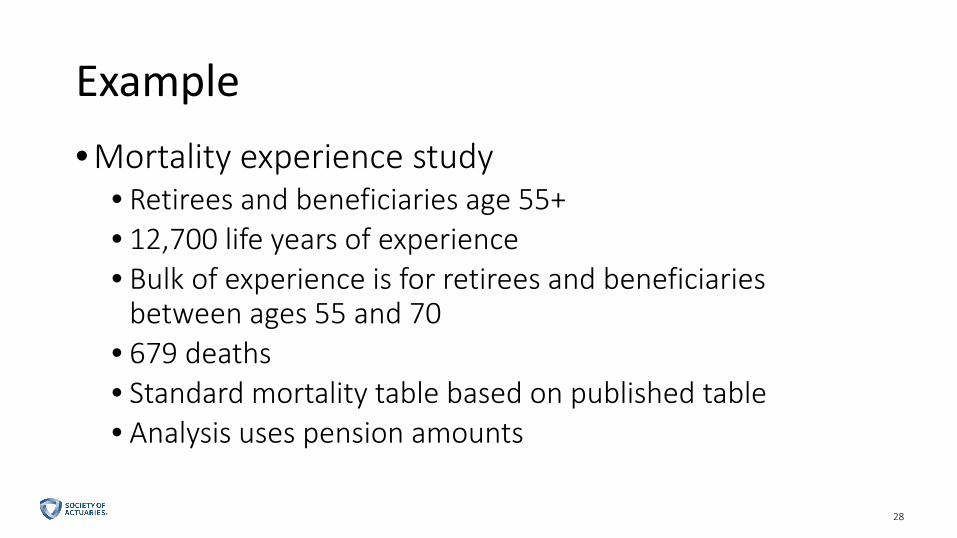
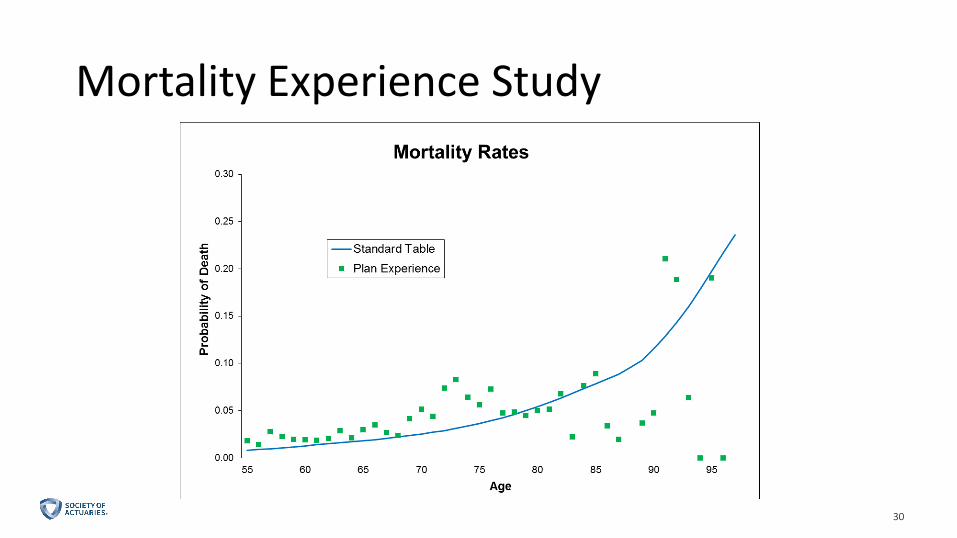
Example • Mortality experience study
• Retirees and beneficiaries age 55+• 12,700 life years of experience• Bulk of experience is for retirees and beneficiaries
between ages 55 and 70• 679 deaths• Standard mortality table based on published table• Analysis uses pension amounts
2929
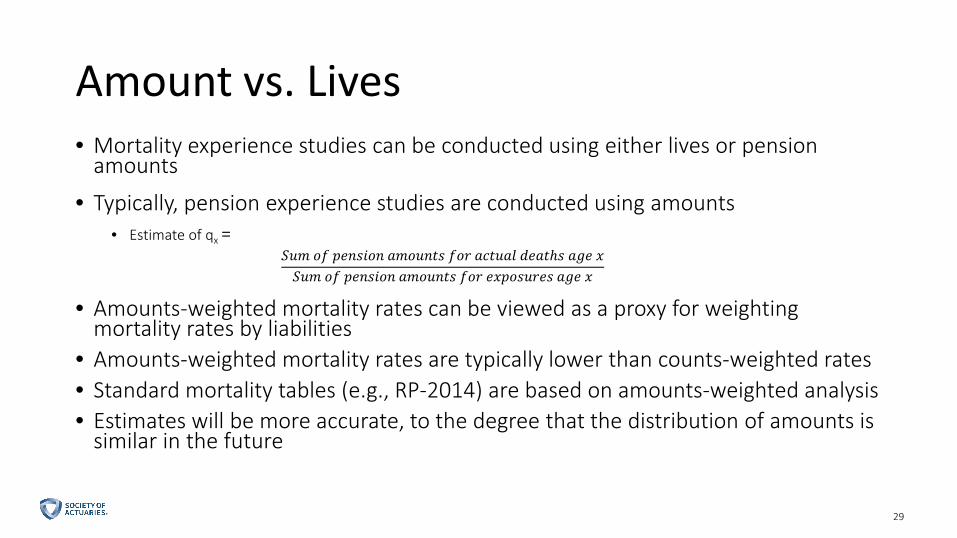
Amount vs. Lives • Mortality experience studies can be conducted using either lives or pension
amounts
• Typically, pension experience studies are conducted using amounts• Estimate of qx =
𝑆𝑆𝑆𝑆𝑆𝑆 𝑜𝑜𝑜𝑜 𝑝𝑝𝑝𝑝𝑝𝑝𝑝𝑝𝑝𝑝𝑜𝑜𝑝𝑝 𝑎𝑎𝑆𝑆𝑜𝑜𝑆𝑆𝑝𝑝𝑎𝑎𝑝𝑝 𝑜𝑜𝑜𝑜𝑓𝑓 𝑎𝑎𝑎𝑎𝑎𝑎𝑆𝑆𝑎𝑎𝑎𝑎 𝑑𝑑𝑝𝑝𝑎𝑎𝑎𝑎𝑑𝑝𝑝 𝑎𝑎𝑎𝑎𝑝𝑝 𝑥𝑥𝑆𝑆𝑆𝑆𝑆𝑆 𝑜𝑜𝑜𝑜 𝑝𝑝𝑝𝑝𝑝𝑝𝑝𝑝𝑝𝑝𝑜𝑜𝑝𝑝 𝑎𝑎𝑆𝑆𝑜𝑜𝑆𝑆𝑝𝑝𝑎𝑎𝑝𝑝 𝑜𝑜𝑜𝑜𝑓𝑓 𝑝𝑝𝑥𝑥𝑝𝑝𝑜𝑜𝑝𝑝𝑆𝑆𝑓𝑓𝑝𝑝𝑝𝑝 𝑎𝑎𝑎𝑎𝑝𝑝 𝑥𝑥
• Amounts-weighted mortality rates can be viewed as a proxy for weighting mortality rates by liabilities
• Amounts-weighted mortality rates are typically lower than counts-weighted rates• Standard mortality tables (e.g., RP-2014) are based on amounts-weighted analysis• Estimates will be more accurate, to the degree that the distribution of amounts is
similar in the future
3030
Mortality Experience Study
3131
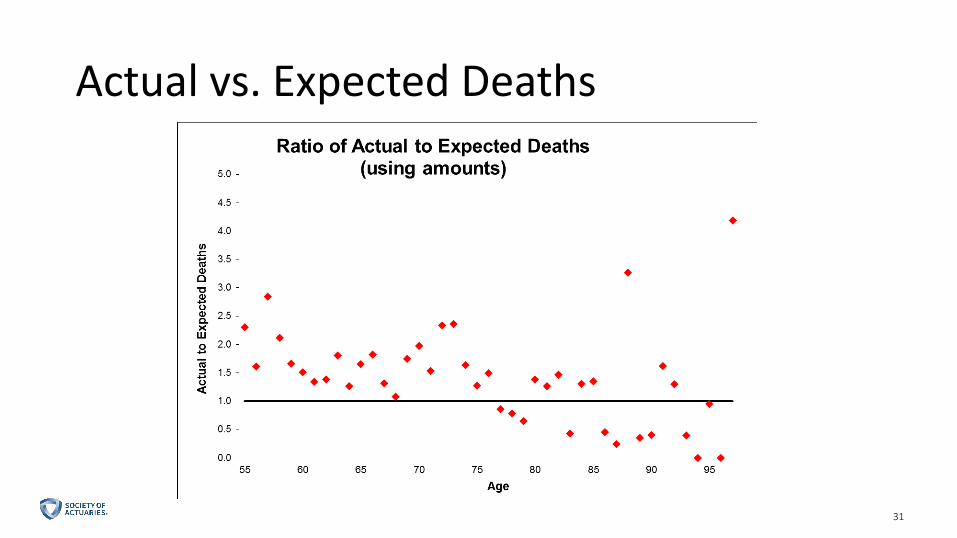
Actual vs. Expected Deaths
3232
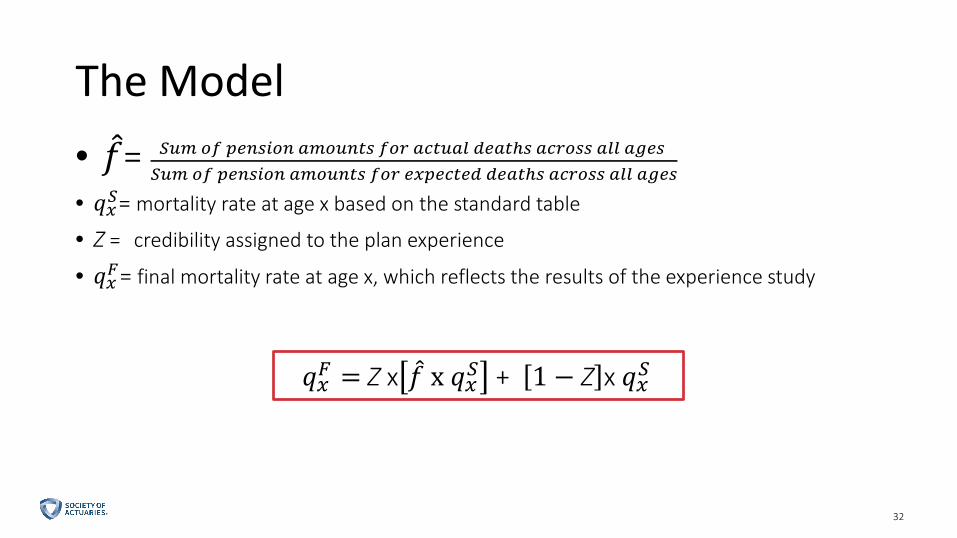
The Model• 𝑜𝑜= 𝑆𝑆𝑆𝑆𝑆𝑆 𝑜𝑜𝑜𝑜 𝑝𝑝𝑝𝑝𝑝𝑝𝑝𝑝𝑝𝑝𝑜𝑜𝑝𝑝 𝑎𝑎𝑆𝑆𝑜𝑜𝑆𝑆𝑝𝑝𝑎𝑎𝑝𝑝 𝑜𝑜𝑜𝑜𝑓𝑓 𝑎𝑎𝑎𝑎𝑎𝑎𝑆𝑆𝑎𝑎𝑎𝑎 𝑑𝑑𝑝𝑝𝑎𝑎𝑎𝑎𝑑𝑝𝑝 𝑎𝑎𝑎𝑎𝑓𝑓𝑜𝑜𝑝𝑝𝑝𝑝 𝑎𝑎𝑎𝑎𝑎𝑎 𝑎𝑎𝑎𝑎𝑝𝑝𝑝𝑝
𝑆𝑆𝑆𝑆𝑆𝑆 𝑜𝑜𝑜𝑜 𝑝𝑝𝑝𝑝𝑝𝑝𝑝𝑝𝑝𝑝𝑜𝑜𝑝𝑝 𝑎𝑎𝑆𝑆𝑜𝑜𝑆𝑆𝑝𝑝𝑎𝑎𝑝𝑝 𝑜𝑜𝑜𝑜𝑓𝑓 𝑝𝑝𝑥𝑥𝑝𝑝𝑝𝑝𝑎𝑎𝑎𝑎𝑝𝑝𝑑𝑑 𝑑𝑑𝑝𝑝𝑎𝑎𝑎𝑎𝑑𝑝𝑝 𝑎𝑎𝑎𝑎𝑓𝑓𝑜𝑜𝑝𝑝𝑝𝑝 𝑎𝑎𝑎𝑎𝑎𝑎 𝑎𝑎𝑎𝑎𝑝𝑝𝑝𝑝
• 𝑞𝑞𝑥𝑥𝑆𝑆= mortality rate at age x based on the standard table
• Z = credibility assigned to the plan experience
• 𝑞𝑞𝑥𝑥𝐹𝐹= final mortality rate at age x, which reflects the results of the experience study
𝑞𝑞𝑥𝑥𝐹𝐹 = Z x 𝑜𝑜 x 𝑞𝑞𝑥𝑥𝑆𝑆 + 1 − Z x 𝑞𝑞𝑥𝑥𝑆𝑆
3333
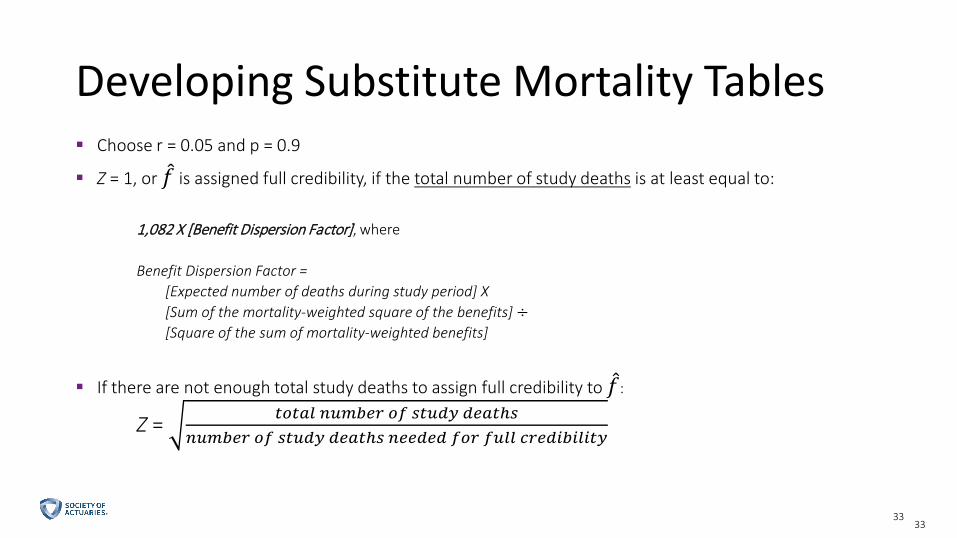
Developing Substitute Mortality Tables Choose r = 0.05 and p = 0.9
Z = 1, or 𝑜𝑜 is assigned full credibility, if the total number of study deaths is at least equal to:
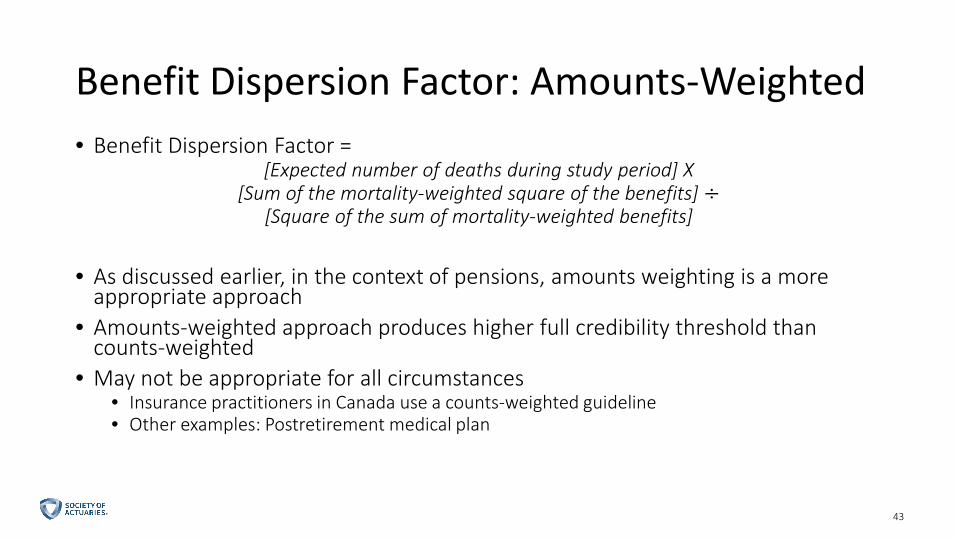
1,082 X [Benefit Dispersion Factor], where
Benefit Dispersion Factor = [Expected number of deaths during study period] X[Sum of the mortality-weighted square of the benefits] ÷[Square of the sum of mortality-weighted benefits]
If there are not enough total study deaths to assign full credibility to 𝑜𝑜:
Z = 𝑎𝑎𝑜𝑜𝑎𝑎𝑎𝑎𝑎𝑎 𝑝𝑝𝑆𝑆𝑆𝑆𝑛𝑛𝑝𝑝𝑓𝑓 𝑜𝑜𝑜𝑜 𝑝𝑝𝑎𝑎𝑆𝑆𝑑𝑑𝑠𝑠 𝑑𝑑𝑝𝑝𝑎𝑎𝑎𝑎𝑑𝑝𝑝𝑝𝑝𝑆𝑆𝑆𝑆𝑛𝑛𝑝𝑝𝑓𝑓 𝑜𝑜𝑜𝑜 𝑝𝑝𝑎𝑎𝑆𝑆𝑑𝑑𝑠𝑠 𝑑𝑑𝑝𝑝𝑎𝑎𝑎𝑎𝑑𝑝𝑝 𝑝𝑝𝑝𝑝𝑝𝑝𝑑𝑑𝑝𝑝𝑑𝑑 𝑜𝑜𝑜𝑜𝑓𝑓 𝑜𝑜𝑆𝑆𝑎𝑎𝑎𝑎 𝑎𝑎𝑓𝑓𝑝𝑝𝑑𝑑𝑝𝑝𝑛𝑛𝑝𝑝𝑎𝑎𝑝𝑝𝑎𝑎𝑠𝑠
3434
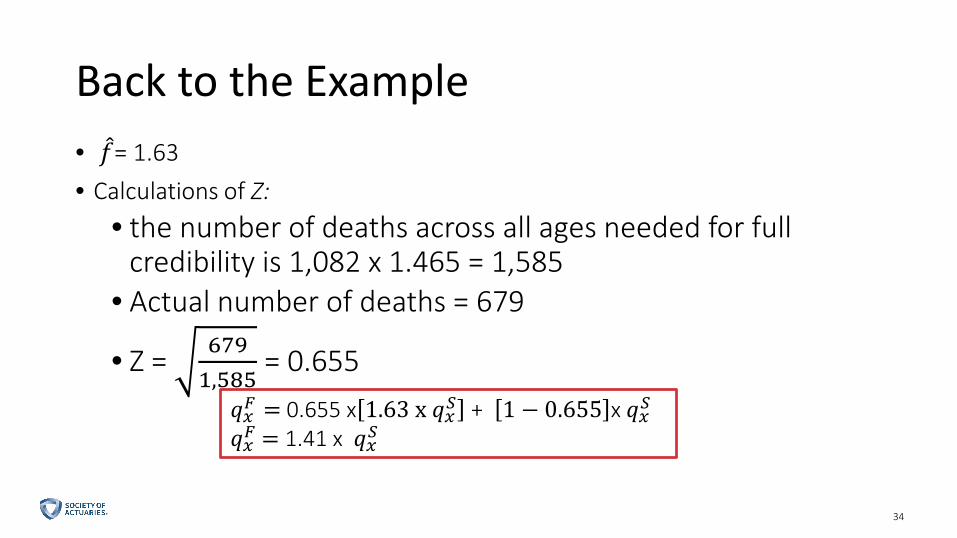
Back to the Example• 𝑜𝑜= 1.63• Calculations of Z:
• the number of deaths across all ages needed for full credibility is 1,082 x 1.465 = 1,585
• Actual number of deaths = 679
• Z = 6791,585
= 0.655𝑞𝑞𝑥𝑥𝐹𝐹 = 0.655 x 1.63 x 𝑞𝑞𝑥𝑥𝑆𝑆 + 1 − 0.655 x 𝑞𝑞𝑥𝑥𝑆𝑆𝑞𝑞𝑥𝑥𝐹𝐹 = 1.41 x 𝑞𝑞𝑥𝑥𝑆𝑆
3535
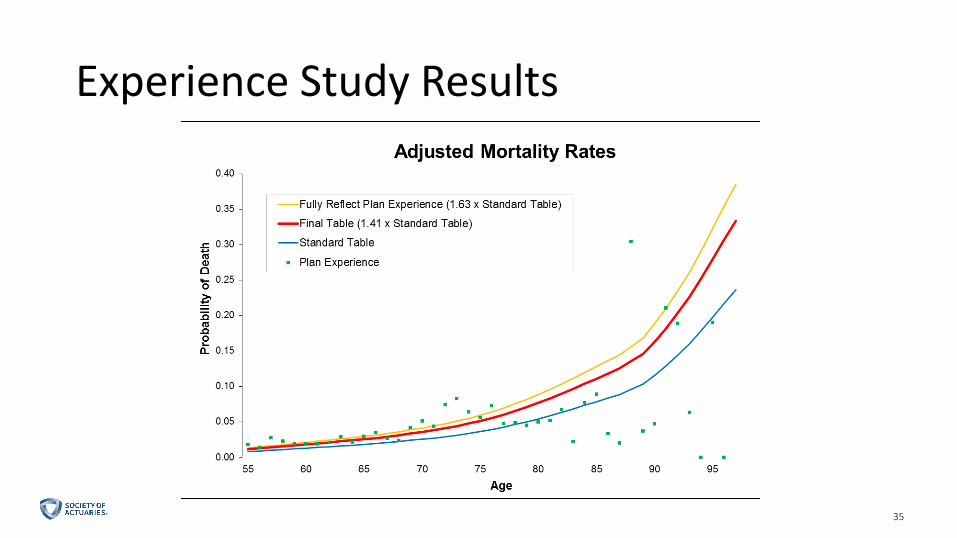
Experience Study Results
3636
Links to Papers on Credibility Theory
Credibility Educational Resource for Pension Actuariesby Irina Pogrebivskyhttps://www.soa.org/Files/static-pages/sections/pension/credibility-resource-pension.pdf
Selecting Mortality Tables: A Credibility Approachby Gavin Benjamin
https://www.soa.org/Files/Research/Projects/research-2008-benjamin.pdf
3737
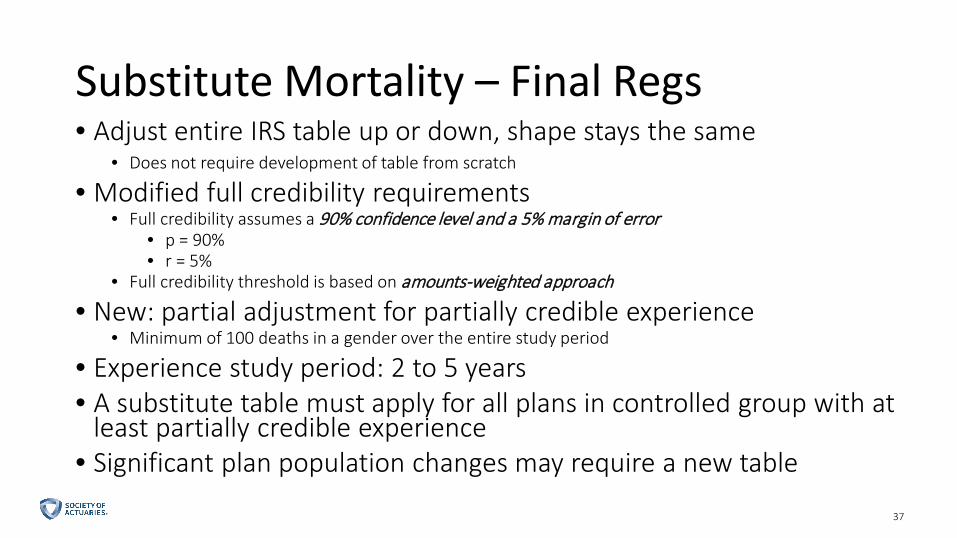
Substitute Mortality – Final Regs• Adjust entire IRS table up or down, shape stays the same
• Does not require development of table from scratch
• Modified full credibility requirements • Full credibility assumes a 90% confidence level and a 5% margin of error
• p = 90%• r = 5%
• Full credibility threshold is based on amounts-weighted approach
• New: partial adjustment for partially credible experience• Minimum of 100 deaths in a gender over the entire study period
• Experience study period: 2 to 5 years• A substitute table must apply for all plans in controlled group with at
least partially credible experience • Significant plan population changes may require a new table
3838
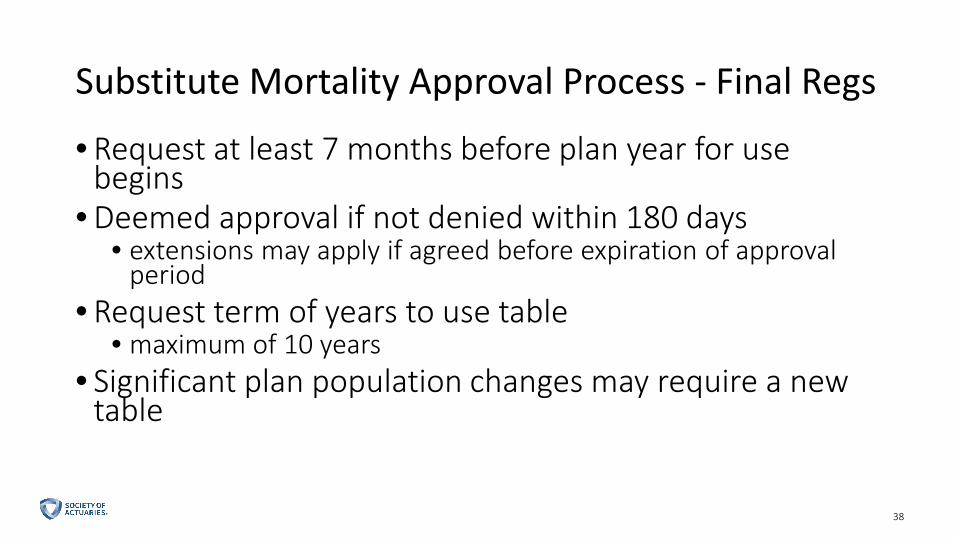
Substitute Mortality Approval Process - Final Regs
• Request at least 7 months before plan year for use begins
• Deemed approval if not denied within 180 days • extensions may apply if agreed before expiration of approval
period• Request term of years to use table
• maximum of 10 years• Significant plan population changes may require a new
table
3939
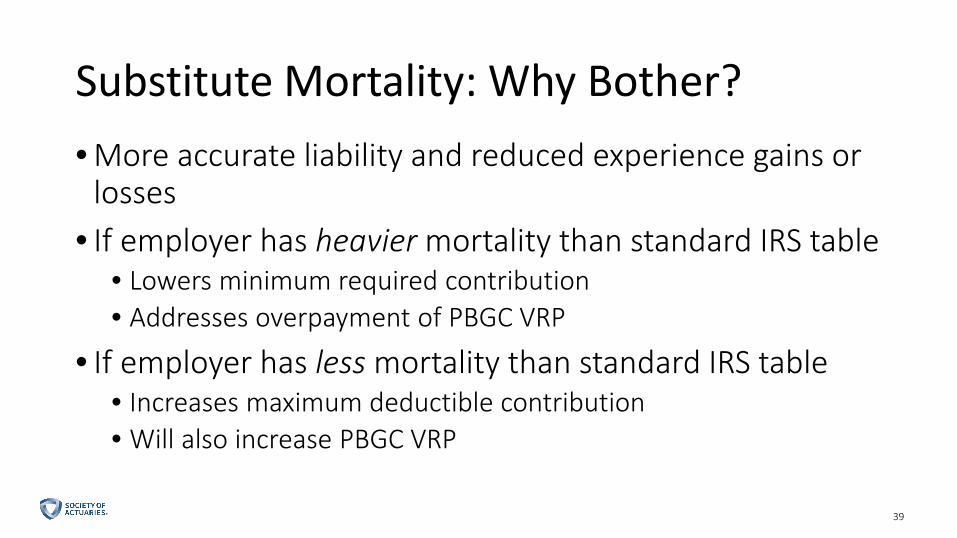
Substitute Mortality: Why Bother?• More accurate liability and reduced experience gains or
losses• If employer has heavier mortality than standard IRS table
• Lowers minimum required contribution• Addresses overpayment of PBGC VRP
• If employer has less mortality than standard IRS table• Increases maximum deductible contribution• Will also increase PBGC VRP
4040
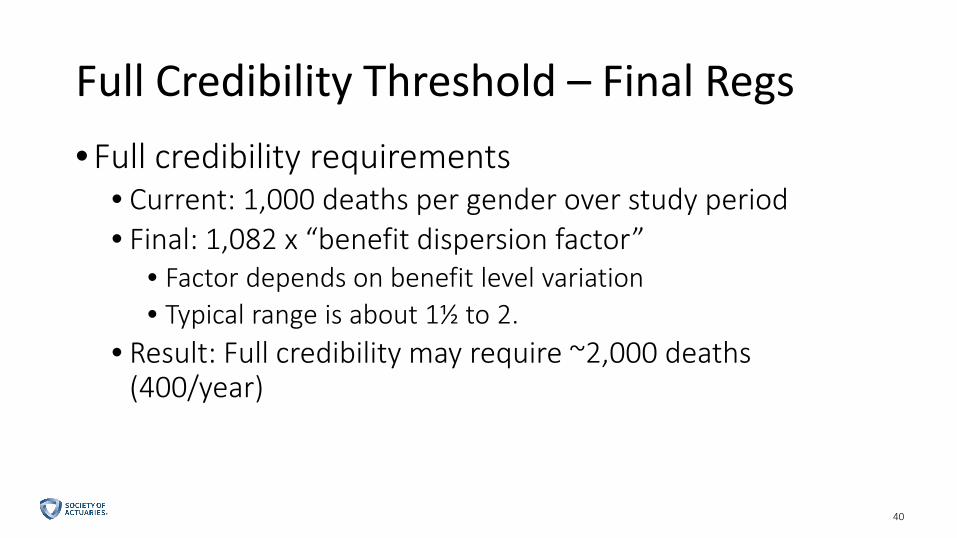
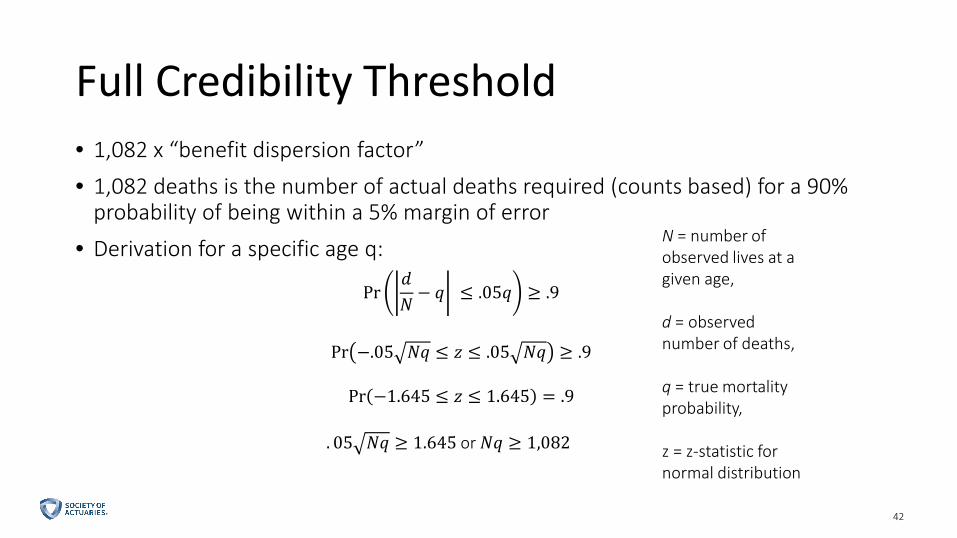
Full Credibility Threshold – Final Regs• Full credibility requirements
• Current: 1,000 deaths per gender over study period• Final: 1,082 x “benefit dispersion factor”
• Factor depends on benefit level variation• Typical range is about 1½ to 2.
• Result: Full credibility may require ~2,000 deaths (400/year)
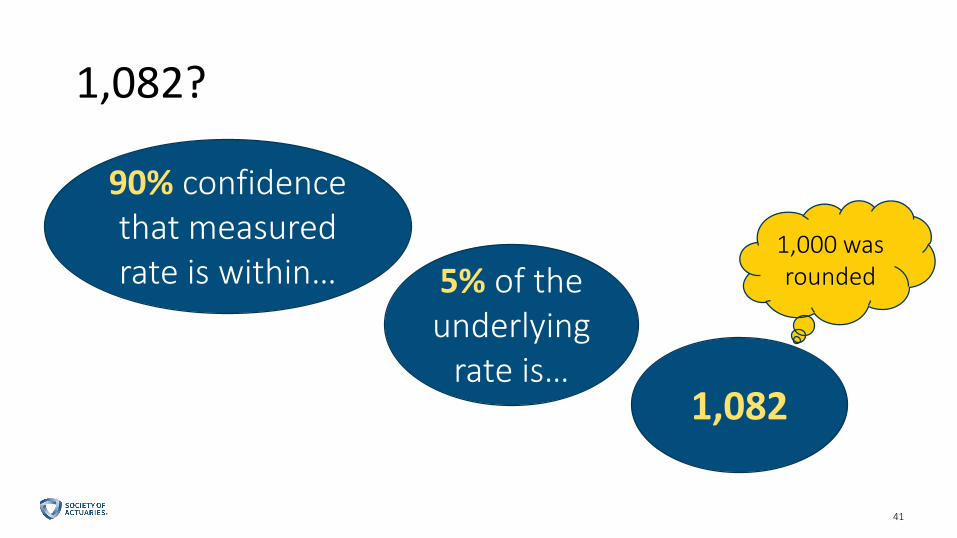
4141
1,082?
90% confidence that measured rate is within… 5% of the
underlying rate is…
1,082
1,000 was rounded
4242
Full Credibility Threshold• 1,082 x “benefit dispersion factor”
• 1,082 deaths is the number of actual deaths required (counts based) for a 90% probability of being within a 5% margin of error
• Derivation for a specific age q:
Pr𝑑𝑑𝑁𝑁− 𝑞𝑞 ≤ .05𝑞𝑞 ≥ .9
Pr −.05 𝑁𝑁𝑞𝑞 ≤ 𝑧𝑧 ≤ .05 𝑁𝑁𝑞𝑞 ≥ .9
Pr −1.645 ≤ 𝑧𝑧 ≤ 1.645 = .9
. 05 𝑁𝑁𝑞𝑞 ≥ 1.645 or 𝑁𝑁𝑞𝑞 ≥ 1,082
N = number of observed lives at a given age,
d = observed number of deaths,
q = true mortality probability,
z = z-statistic for normal distribution
4343
Benefit Dispersion Factor: Amounts-Weighted• Benefit Dispersion Factor =
[Expected number of deaths during study period] X[Sum of the mortality-weighted square of the benefits] ÷
[Square of the sum of mortality-weighted benefits]
• As discussed earlier, in the context of pensions, amounts weighting is a more appropriate approach
• Amounts-weighted approach produces higher full credibility threshold than counts-weighted
• May not be appropriate for all circumstances• Insurance practitioners in Canada use a counts-weighted guideline• Other examples: Postretirement medical plan
4444
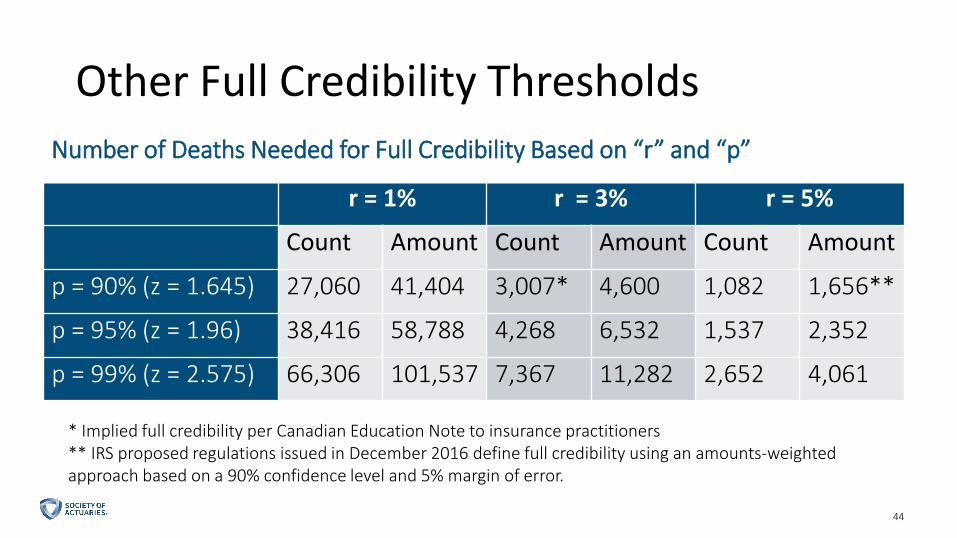
Other Full Credibility ThresholdsNumber of Deaths Needed for Full Credibility Based on “r” and “p”
r = 1% r = 3% r = 5%
Count Amount Count Amount Count Amount
p = 90% (z = 1.645) 27,060 41,404 3,007* 4,600 1,082 1,656**
p = 95% (z = 1.96) 38,416 58,788 4,268 6,532 1,537 2,352
p = 99% (z = 2.575) 66,306 101,537 7,367 11,282 2,652 4,061
* Implied full credibility per Canadian Education Note to insurance practitioners** IRS proposed regulations issued in December 2016 define full credibility using an amounts-weighted approach based on a 90% confidence level and 5% margin of error.
4545
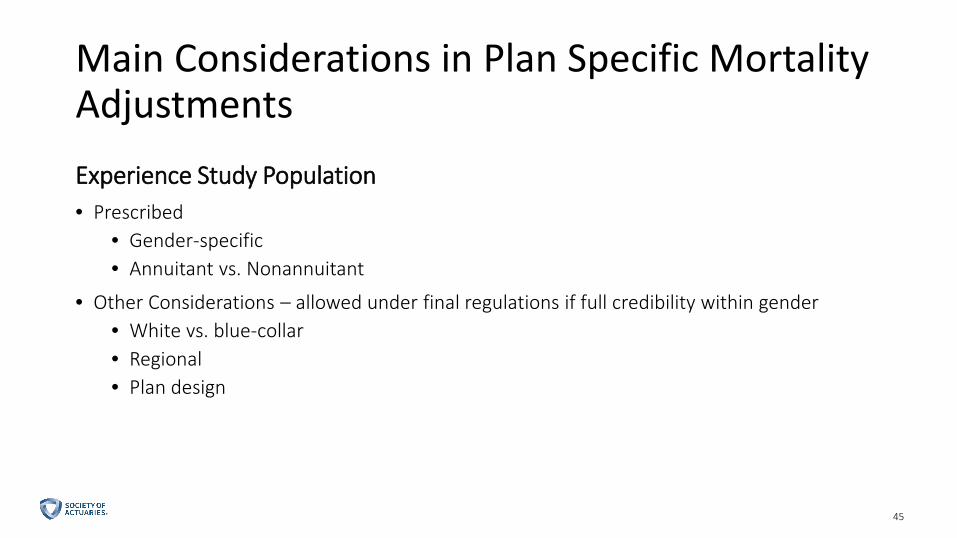
Main Considerations in Plan Specific Mortality AdjustmentsExperience Study Population• Prescribed
• Gender-specific• Annuitant vs. Nonannuitant
• Other Considerations – allowed under final regulations if full credibility within gender• White vs. blue-collar• Regional• Plan design
4646
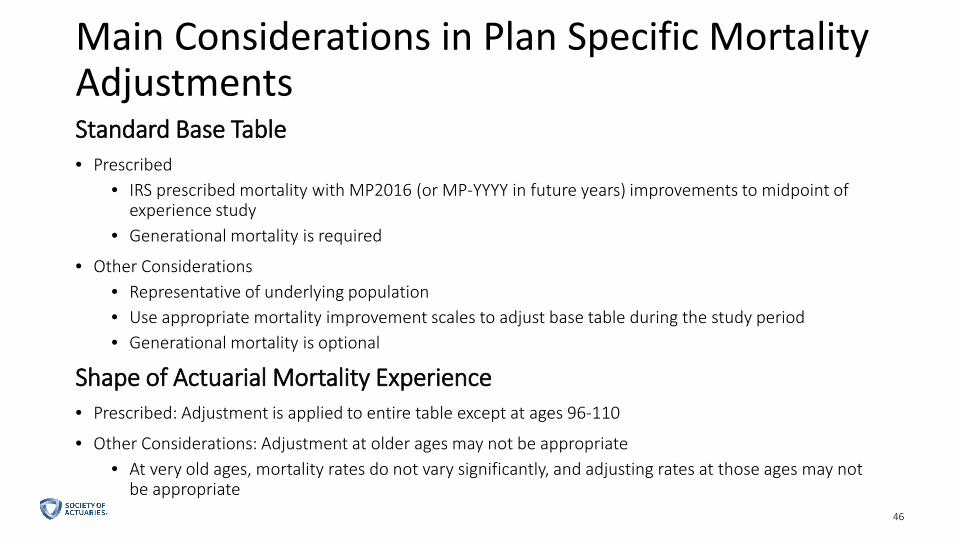
Main Considerations in Plan Specific Mortality AdjustmentsStandard Base Table• Prescribed
• IRS prescribed mortality with MP2016 (or MP-YYYY in future years) improvements to midpoint of experience study
• Generational mortality is required
• Other Considerations• Representative of underlying population• Use appropriate mortality improvement scales to adjust base table during the study period• Generational mortality is optional
Shape of Actuarial Mortality Experience• Prescribed: Adjustment is applied to entire table except at ages 96-110
• Other Considerations: Adjustment at older ages may not be appropriate• At very old ages, mortality rates do not vary significantly, and adjusting rates at those ages may not
be appropriate
4747
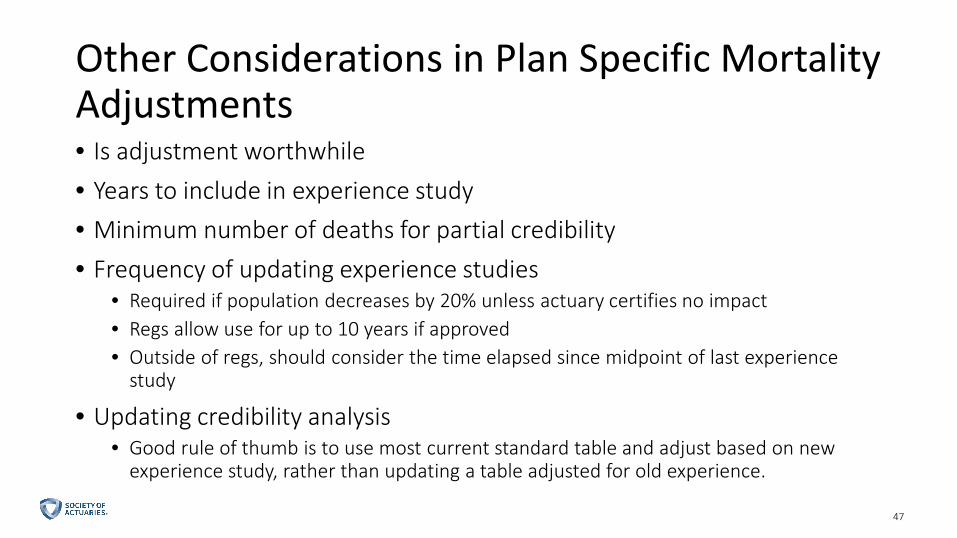
Other Considerations in Plan Specific Mortality Adjustments• Is adjustment worthwhile• Years to include in experience study• Minimum number of deaths for partial credibility• Frequency of updating experience studies
• Required if population decreases by 20% unless actuary certifies no impact• Regs allow use for up to 10 years if approved• Outside of regs, should consider the time elapsed since midpoint of last experience
study
• Updating credibility analysis• Good rule of thumb is to use most current standard table and adjust based on new
experience study, rather than updating a table adjusted for old experience.

Questions
Provide Your Feedback and Win!Complete meeting and session evaluations on the mobile app or meeting website and be entered to win one of these three great prizes:• One (1) complimentary registration to the 2018 Annual Meeting• One (1) complimentary room reservation (max. 3 nights) at the
Omni Nashville Hotel for the 2018 Annual Meeting• One (1) complimentary registration to a SOA webcast
Responses will be kept anonymous. *See Official Rules at
http://soa.org/2017annualinfo
49