Embed Size (px)
DESCRIPTION
Texas has an extraordinary opportunity to expand health care coverage that would benefit up to 2 million of its citizens. The federal government would pay about $100 billion toward this expansion over 10 years, with the state responsible for only about $15 billion under a moderate enrollment scenario. Extending Medicaid to low-income adults certainly would benefit the newly eligible. It also would benefit the wider economy and reduce demands on local indigent health programs and hospital charity care.The amount of state match necessary to extend Medicaid to low-income adults would equal a small fraction of current local government and hospital spending on low-income health care. What's more, covering low-income adults will result in new local revenue because it will generate good-paying jobs and commerce. So local governments will SAVE on health costs at the same time they are GAINING new sales and property taxes without raising tax rates.At the same time, more people in every area of Texas would have health insurance, doctors and other health workers would be more fairly compensated for treating low-income folks, and the state could stop spending so much on piecemeal programs that only treat some health problems. People with health insurance will live longer and be healthier--and the many low-income adults in Texas who are parents will be able to take better care of their kids, too.
Citation preview

Impact of Medicaid Extension and Local Spending for Health CareHouse District 1 - Representative George Lavender
County
2014-2017 New Local Tax
Revenue (Adult Expansion)
2011 County Indigent
Healthcare & Unreimbursed Jail Healthcare
Costs
2011 Total Hospital District or City/County Unreimbursed
Healthcare Expenditures
2010 Total Hospital Charity
Care Costs
Total Unreimbursed Charity Care
Costs for Local Jurisdictions &
Hospitals
2014-2017 Adults Federal Funds
Limited Scenario
2014-2017 Adults Federal Funds
Moderate Scenario
2014-2017 Adults State
Funds Moderate Scenario
2014-2017 Adults Federal Funds
Enhanced Scenario
Statewide Total 2,101,392,352$ 258,927,030$ 2,544,037,688$ 1,836,673,862$ 4,380,711,550$ 14,274,023,031$ 22,962,552,386$ 1,283,318,611$ 31,030,479,514$
District Total 11,929,455$ 2,798,350$ 8,007,553$ 29,302,843$ 37,310,396$ 132,806,637$ 213,645,400$ 11,940,098$ 288,710,031$ Bowie (100%) 6,886,983$ 2,112,466$ 2,664,797$ 29,248,540$ 31,913,337$ 79,364,402$ 127,673,132$ 7,135,326$ 172,531,278$
Frankl in (100%) 746,585$ 133,978$ 326,575$ -$ 326,575$ 6,837,670$ 10,999,727$ 614,747$ 14,864,498$
Lamar (100%) 3,450,726$ 99,320$ 4,491,053$ 54,303$ 4,545,356$ 37,034,086$ 59,576,556$ 3,329,582$ 80,508,868$
Red River (100%) 845,163$ 452,585$ 525,127$ -$ 525,127$ 9,570,480$ 15,395,985$ 860,442$ 20,805,387$
ANALYSIS BY BILLY HAMILTON CONSULTING
Extending Medicaid to Low-Income Adults Will Save Local Tax Dollars and Grow the Economy
Download this one-pager at www.texasimpact.org/Local-Taxpayers-Win-With-Medicaid Download the full report at www.mhm.org
Download the executive summary at www.texasimpact.org
For more information about the report, “Smart, Affordable and Fair” call Texas Impact at 512/472-3903 or email [email protected]

Impact of Medicaid Extension and Local Spending for Health CareHouse District 1 - Representative George Lavender
County
2016 Adults <138% FPL Enrollees Moderate Scenario
2016 Adults Federal Funds
Moderate Scenario
2016 Adults State Funds Moderate Scenario
2016 Adults All Funds Moderate Scenario
2016 Children <200% FPL Enrollees Moderate Scenario
2016 Children Federal Funds
Moderate Scenario
2016 Children State Funds Moderate Scenario
2016 Children All Funds Moderate Scenario
2016 Adults & Children
All Funds Moderate Scenario
Statewide Total 1,004,771 7,615,086,733$ 292,887,951$ 7,907,974,684$ 550,189 1,500,495,384$ 769,325,576$ 2,269,820,960$ 10,177,795,644$
District Total 9,348 70,851,368$ 2,725,053$ 73,576,421$ 3,414 9,311,871$ 4,774,330$ 14,086,201$ 87,662,622$ Bowie (100%) 5,587 42,340,327$ 1,628,474$ 43,968,801$ 2,011 5,485,243$ 2,812,363$ 8,297,606$ 52,266,407$ Frankl in (100%) 481 3,647,847$ 140,302$ 3,788,149$ 204 556,563$ 285,358$ 841,921$ 4,630,070$ Lamar (100%) 2,607 19,757,414$ 759,901$ 20,517,314$ 974 2,655,671$ 1,361,601$ 4,017,272$ 24,534,586$ Red River (100%) 674 5,105,781$ 196,376$ 5,302,157$ 225 614,393$ 315,008$ 929,401$ 6,231,558$ Note: New local tax revenues are an allocation of the statewide estimate based on the county share of state personal income and further allocated in partial counties according to the share of county
population. Variations in personal income or the concentration of direct health care spending in parts of counties could alter these allocations. Remaining columns reflect allocations of statewide
estimates according to the county share of adults below 138% FPL or children below 200% FPL, as applicable, and further allocated for partial counties according to the share of the county's total
population. Variations in percentages of adults below 138% FPL and children below 200% FPL could alter these estimates. Hospital charity cost data exclude certain hospitals, such as those exempt
from reporting, hospitals that report by system, and others, resulting in a conservative estimate of unreimbursed charity costs. Medicaid extension to adults would not relieve all local unreimbursed
costs due to ineligible adults, such as undocumented immigrants, people served with incomes above 138% FPL or health care for incarcerated adults other than inpatient hospital stays. 2016 is the first
full year of implementation; the federal match rate falls to 95 percent in 2017 and to 90 percent by 2020. For full county-level data, see Appendix C, and for further notes and cautions in interpreting
these data, see Appendix A, in "Smart, Affordable and Fair: Why Texas Should Extend Medicaid to Low-Income Adults," at
http://www.mhm.org/images/stories/advocacy_and_public_policy/Smart%20Affordable%20and%20Fair_FNL_FULL.pdf.
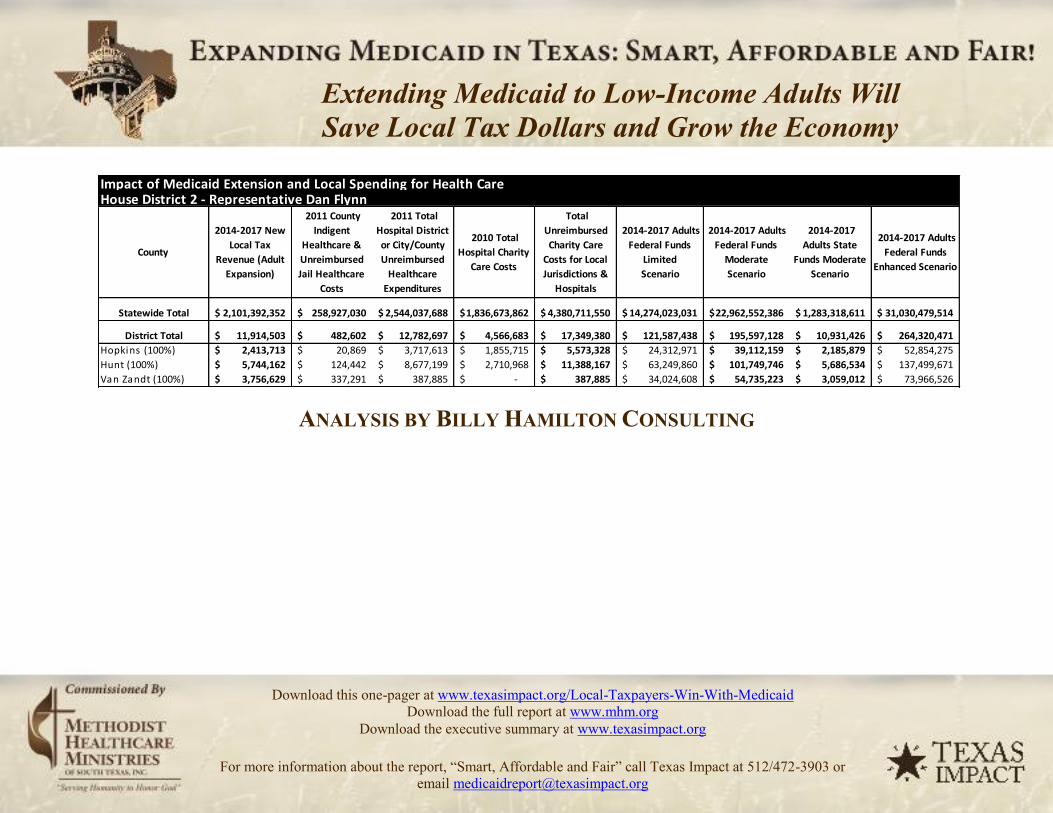
Impact of Medicaid Extension and Local Spending for Health CareHouse District 2 - Representative Dan Flynn
County
2014-2017 New Local Tax
Revenue (Adult Expansion)
2011 County Indigent
Healthcare & Unreimbursed Jail Healthcare
Costs
2011 Total Hospital District or City/County Unreimbursed
Healthcare Expenditures
2010 Total Hospital Charity
Care Costs
Total Unreimbursed Charity Care
Costs for Local Jurisdictions &
Hospitals
2014-2017 Adults Federal Funds
Limited Scenario
2014-2017 Adults Federal Funds
Moderate Scenario
2014-2017 Adults State
Funds Moderate Scenario
2014-2017 Adults Federal Funds
Enhanced Scenario
Statewide Total 2,101,392,352$ 258,927,030$ 2,544,037,688$ 1,836,673,862$ 4,380,711,550$ 14,274,023,031$ 22,962,552,386$ 1,283,318,611$ 31,030,479,514$
District Total 11,914,503$ 482,602$ 12,782,697$ 4,566,683$ 17,349,380$ 121,587,438$ 195,597,128$ 10,931,426$ 264,320,471$ Hopkins (100%) 2,413,713$ 20,869$ 3,717,613$ 1,855,715$ 5,573,328$ 24,312,971$ 39,112,159$ 2,185,879$ 52,854,275$ Hunt (100%) 5,744,162$ 124,442$ 8,677,199$ 2,710,968$ 11,388,167$ 63,249,860$ 101,749,746$ 5,686,534$ 137,499,671$ Van Zandt (100%) 3,756,629$ 337,291$ 387,885$ -$ 387,885$ 34,024,608$ 54,735,223$ 3,059,012$ 73,966,526$
ANALYSIS BY BILLY HAMILTON CONSULTING
Extending Medicaid to Low-Income Adults Will Save Local Tax Dollars and Grow the Economy
Download this one-pager at www.texasimpact.org/Local-Taxpayers-Win-With-Medicaid Download the full report at www.mhm.org
Download the executive summary at www.texasimpact.org
For more information about the report, “Smart, Affordable and Fair” call Texas Impact at 512/472-3903 or email [email protected]
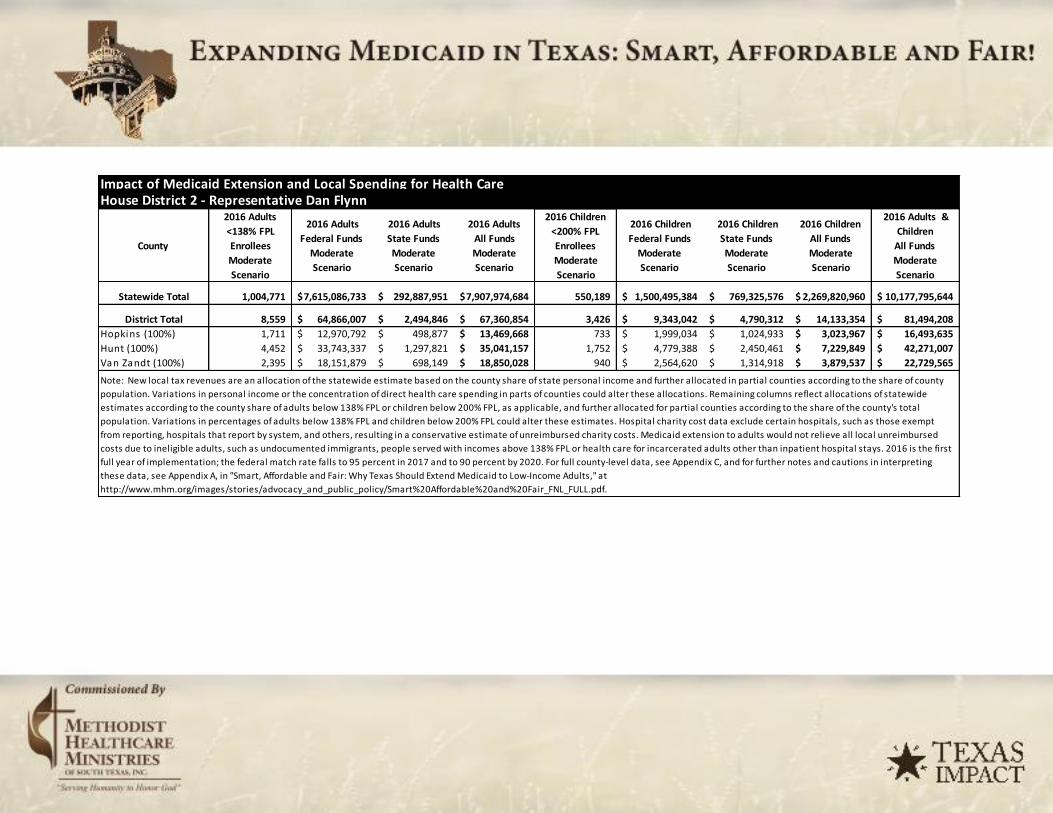
Impact of Medicaid Extension and Local Spending for Health CareHouse District 2 - Representative Dan Flynn
County
2016 Adults <138% FPL Enrollees Moderate Scenario
2016 Adults Federal Funds
Moderate Scenario
2016 Adults State Funds Moderate Scenario
2016 Adults All Funds Moderate Scenario
2016 Children <200% FPL Enrollees Moderate Scenario
2016 Children Federal Funds
Moderate Scenario
2016 Children State Funds Moderate Scenario
2016 Children All Funds Moderate Scenario
2016 Adults & Children
All Funds Moderate Scenario
Statewide Total 1,004,771 7,615,086,733$ 292,887,951$ 7,907,974,684$ 550,189 1,500,495,384$ 769,325,576$ 2,269,820,960$ 10,177,795,644$
District Total 8,559 64,866,007$ 2,494,846$ 67,360,854$ 3,426 9,343,042$ 4,790,312$ 14,133,354$ 81,494,208$ Hopkins (100%) 1,711 12,970,792$ 498,877$ 13,469,668$ 733 1,999,034$ 1,024,933$ 3,023,967$ 16,493,635$ Hunt (100%) 4,452 33,743,337$ 1,297,821$ 35,041,157$ 1,752 4,779,388$ 2,450,461$ 7,229,849$ 42,271,007$ Van Zandt (100%) 2,395 18,151,879$ 698,149$ 18,850,028$ 940 2,564,620$ 1,314,918$ 3,879,537$ 22,729,565$ Note: New local tax revenues are an allocation of the statewide estimate based on the county share of state personal income and further allocated in partial counties according to the share of county population. Variations in personal income or the concentration of direct health care spending in parts of counties could alter these allocations. Remaining columns reflect allocations of statewide estimates according to the county share of adults below 138% FPL or children below 200% FPL, as applicable, and further allocated for partial counties according to the share of the county's total population. Variations in percentages of adults below 138% FPL and children below 200% FPL could alter these estimates. Hospital charity cost data exclude certain hospitals, such as those exempt from reporting, hospitals that report by system, and others, resulting in a conservative estimate of unreimbursed charity costs. Medicaid extension to adults would not relieve all local unreimbursed costs due to ineligible adults, such as undocumented immigrants, people served with incomes above 138% FPL or health care for incarcerated adults other than inpatient hospital stays. 2016 is the first full year of implementation; the federal match rate falls to 95 percent in 2017 and to 90 percent by 2020. For full county-level data, see Appendix C, and for further notes and cautions in interpreting these data, see Appendix A, in "Smart, Affordable and Fair: Why Texas Should Extend Medicaid to Low-Income Adults," at http://www.mhm.org/images/stories/advocacy_and_public_policy/Smart%20Affordable%20and%20Fair_FNL_FULL.pdf.

Impact of Medicaid Extension and Local Spending for Health CareHouse District 3 - Representative Cecil Bell, Jr.
County
2014-2017 New
Local Tax
Revenue (Adult
Expansion)
2011 County
Indigent
Healthcare &
Unreimbursed
Jail Healthcare
Costs
2011 Total
Hospital District
or City/County
Unreimbursed
Healthcare
Expenditures
2010 Total
Hospital Charity
Care Costs
Total
Unreimbursed
Charity Care
Costs for Local
Jurisdictions &
Hospitals
2014-2017 Adults
Federal Funds
Limited
Scenario
2014-2017 Adults
Federal Funds
Moderate
Scenario
2014-2017
Adults State
Funds Moderate
Scenario
2014-2017 Adults
Federal Funds
Enhanced Scenario
Statewide Total 2,101,392,352$ 258,927,030$ 2,544,037,688$ 1,836,673,862$ 4,380,711,550$ 14,274,023,031$ 22,962,552,386$ 1,283,318,611$ 31,030,479,514$
District Total 15,070,251$ 894,893$ 9,311,197$ 3,742,849$ 13,054,046$ 65,425,425$ 105,249,567$ 5,882,130$ 142,229,160$
Montgomery (27%) 12,387,225$ 284,487$ 8,491,785$ 3,742,849$ 12,234,634$ 46,436,916$ 74,702,844$ 4,174,952$ 100,949,800$ Wal ler (100%) 2,683,026$ 610,406$ 819,412$ -$ 819,412$ 18,988,509$ 30,546,723$ 1,707,179$ 41,279,360$
ANALYSIS BY BILLY HAMILTON CONSULTING
Extending Medicaid to Low-Income Adults Will Save Local Tax Dollars and Grow the Economy
Download this one-pager at www.texasimpact.org/Local-Taxpayers-Win-With-Medicaid Download the full report at www.mhm.org
Download the executive summary at www.texasimpact.org
For more information about the report, “Smart, Affordable and Fair” call Texas Impact at 512/472-3903 or email [email protected]

Impact of Medicaid Extension and Local Spending for Health CareHouse District 3 - Representative Cecil Bell, Jr.
County
2016 Adults <138% FPL Enrollees Moderate Scenario
2016 Adults Federal Funds
Moderate Scenario
2016 Adults State Funds Moderate Scenario
2016 Adults All Funds Moderate Scenario
2016 Children <200% FPL Enrollees Moderate Scenario
2016 Children Federal Funds
Moderate Scenario
2016 Children State Funds Moderate Scenario
2016 Children All Funds Moderate Scenario
2016 Adults & Children
All Funds Moderate Scenario
Statewide Total 1,004,771 7,615,086,733$ 292,887,951$ 7,907,974,684$ 550,189 1,500,495,384$ 769,325,576$ 2,269,820,960$ 10,177,795,644$
District Total 4,605 34,903,985$ 1,342,461$ 36,246,446$ 2,436 6,644,501$ 3,406,731$ 10,051,232$ 46,297,678$ Montgomery (27%) 3,269 24,773,754$ 952,837$ 25,726,591$ 1,728 4,711,500$ 2,415,654$ 7,127,154$ 32,853,746$ Waller (100%) 1,337 10,130,230$ 389,624$ 10,519,855$ 709 1,933,001$ 991,077$ 2,924,078$ 13,443,933$ Note: New local tax revenues are an allocation of the statewide estimate based on the county share of state personal income and further allocated in partial counties according to the share of county population. Variations in personal income or the concentration of direct health care spending in parts of counties could alter these allocations. Remaining columns reflect allocations of statewide estimates according to the county share of adults below 138% FPL or children below 200% FPL, as applicable, and further allocated for partial counties according to the share of the county's total population. Variations in percentages of adults below 138% FPL and children below 200% FPL could alter these estimates. Hospital charity cost data exclude certain hospitals, such as those exempt from reporting, hospitals that report by system, and others, resulting in a conservative estimate of unreimbursed charity costs. Medicaid extension to adults would not relieve all local unreimbursed costs due to ineligible adults, such as undocumented immigrants, people served with incomes above 138% FPL or health care for incarcerated adults other than inpatient hospital stays. 2016 is the first full year of implementation; the federal match rate falls to 95 percent in 2017 and to 90 percent by 2020. For full county-level data, see Appendix C, and for further notes and cautions in interpreting these data, see Appendix A, in "Smart, Affordable and Fair: Why Texas Should Extend Medicaid to Low-Income Adults," at http://www.mhm.org/images/stories/advocacy_and_public_policy/Smart%20Affordable%20and%20Fair_FNL_FULL.pdf.

Impact of Medicaid Extension and Local Spending for Health CareHouse District 4 - Representative Lance Gooden
County
2014-2017 New Local Tax
Revenue (Adult Expansion)
2011 County Indigent
Healthcare & Unreimbursed Jail Healthcare
Costs
2011 Total Hospital District or City/County Unreimbursed
Healthcare Expenditures
2010 Total Hospital Charity
Care Costs
Total Unreimbursed Charity Care
Costs for Local Jurisdictions &
Hospitals
2014-2017 Adults Federal Funds
Limited Scenario
2014-2017 Adults Federal Funds
Moderate Scenario
2014-2017 Adults State
Funds Moderate Scenario
2014-2017 Adults Federal Funds
Enhanced Scenario
Statewide Total 2,101,392,352$ 258,927,030$ 2,544,037,688$ 1,836,673,862$ 4,380,711,550$ 14,274,023,031$ 22,962,552,386$ 1,283,318,611$ 31,030,479,514$
District Total 11,694,330$ 1,650,796$ 8,136,011$ 10,821,311$ 18,957,322$ 73,701,852$ 118,563,816$ 6,626,230$ 160,221,390$ Henderson (83%) 4,387,132$ 595,093$ 6,892,098$ 10,821,311$ 17,713,409$ 43,917,616$ 70,650,059$ 3,948,452$ 95,473,063$ Kaufman (100%) 7,307,197$ 1,055,704$ 1,243,913$ -$ 1,243,913$ 29,784,236$ 47,913,757$ 2,677,778$ 64,748,328$
ANALYSIS BY BILLY HAMILTON CONSULTING
Extending Medicaid to Low-Income Adults Will Save Local Tax Dollars and Grow the Economy
Download this one-pager at www.texasimpact.org/Local-Taxpayers-Win-With-Medicaid Download the full report at www.mhm.org
Download the executive summary at www.texasimpact.org
For more information about the report, “Smart, Affordable and Fair” call Texas Impact at 512/472-3903 or email [email protected]

Impact of Medicaid Extension and Local Spending for Health CareHouse District 4 - Representative Lance Gooden
County
2016 Adults <138% FPL Enrollees Moderate Scenario
2016 Adults Federal Funds
Moderate Scenario
2016 Adults State Funds Moderate Scenario
2016 Adults All Funds Moderate Scenario
2016 Children <200% FPL Enrollees Moderate Scenario
2016 Children Federal Funds
Moderate Scenario
2016 Children State Funds Moderate Scenario
2016 Children All Funds Moderate Scenario
2016 Adults & Children
All Funds Moderate Scenario
Statewide Total 1,004,771 7,615,086,733$ 292,887,951$ 7,907,974,684$ 550,189 1,500,495,384$ 769,325,576$ 2,269,820,960$ 10,177,795,644$
District Total 5,188 39,319,398$ 1,512,285$ 40,831,683$ 2,459 6,705,112$ 3,437,807$ 10,142,919$ 50,974,602$ Henderson (83%) 3,091 23,429,727$ 901,143$ 24,330,870$ 1,162 3,168,045$ 1,624,302$ 4,792,347$ 29,123,217$ Kaufman (100%) 2,097 15,889,672$ 611,141$ 16,500,813$ 1,297 3,537,067$ 1,813,505$ 5,350,573$ 21,851,385$ Note: New local tax revenues are an allocation of the statewide estimate based on the county share of state personal income and further allocated in partial counties according to the share of county population. Variations in personal income or the concentration of direct health care spending in parts of counties could alter these allocations. Remaining columns reflect allocations of statewide estimates according to the county share of adults below 138% FPL or children below 200% FPL, as applicable, and further allocated for partial counties according to the share of the county's total population. Variations in percentages of adults below 138% FPL and children below 200% FPL could alter these estimates. Hospital charity cost data exclude certain hospitals, such as those exempt from reporting, hospitals that report by system, and others, resulting in a conservative estimate of unreimbursed charity costs. Medicaid extension to adults would not relieve all local unreimbursed costs due to ineligible adults, such as undocumented immigrants, people served with incomes above 138% FPL or health care for incarcerated adults other than inpatient hospital stays. 2016 is the first full year of implementation; the federal match rate falls to 95 percent in 2017 and to 90 percent by 2020. For full county-level data, see Appendix C, and for further notes and cautions in interpreting these data, see Appendix A, in "Smart, Affordable and Fair: Why Texas Should Extend Medicaid to Low-Income Adults," at http://www.mhm.org/images/stories/advocacy_and_public_policy/Smart%20Affordable%20and%20Fair_FNL_FULL.pdf.

Impact of Medicaid Extension and Local Spending for Health CareHouse District 5 - Representative Bryan Hughes
County
2014-2017 New Local Tax
Revenue (Adult Expansion)
2011 County Indigent
Healthcare & Unreimbursed Jail Healthcare
Costs
2011 Total Hospital District or City/County Unreimbursed
Healthcare Expenditures
2010 Total Hospital Charity
Care Costs
Total Unreimbursed Charity Care
Costs for Local Jurisdictions &
Hospitals
2014-2017 Adults Federal Funds
Limited Scenario
2014-2017 Adults Federal Funds
Moderate Scenario
2014-2017 Adults State
Funds Moderate Scenario
2014-2017 Adults Federal Funds
Enhanced Scenario
Statewide Total 2,101,392,352$ 258,927,030$ 2,544,037,688$ 1,836,673,862$ 4,380,711,550$ 14,274,023,031$ 22,962,552,386$ 1,283,318,611$ 31,030,479,514$
District Total 11,323,103$ 3,627,022$ 7,232,563$ 23,469,261$ 30,701,824$ 103,345,813$ 166,251,913$ 9,291,396$ 224,664,771$ Camp (100%) 879,025$ 2,335,867$ 2,686,247$ 4,673,099$ 7,359,346$ 9,237,348$ 14,860,077$ 830,492$ 20,081,187$ Morris (100%) 935,957$ 131,693$ 172,700$ -$ 172,700$ 10,073,000$ 16,204,387$ 905,622$ 21,897,823$ Ra ins (100%) 696,305$ 110,528$ 127,107$ -$ 127,107$ 7,023,998$ 11,299,472$ 631,499$ 15,269,558$ Smith (24%) 4,030,538$ 781,836$ 999,561$ 18,796,162$ 19,795,723$ 27,340,960$ 43,983,271$ 2,458,113$ 59,436,859$ Ti tus (100%) 1,993,191$ 58,079$ 2,664,845$ -$ 2,664,845$ 22,991,736$ 36,986,696$ 2,067,092$ 49,982,027$ Wood (100%) 2,788,087$ 209,018$ 582,103$ -$ 582,103$ 26,678,770$ 42,918,010$ 2,398,578$ 57,997,317$
ANALYSIS BY BILLY HAMILTON CONSULTING
Extending Medicaid to Low-Income Adults Will Save Local Tax Dollars and Grow the Economy
Download this one-pager at www.texasimpact.org/Local-Taxpayers-Win-With-Medicaid Download the full report at www.mhm.org
Download the executive summary at www.texasimpact.org
For more information about the report, “Smart, Affordable and Fair” call Texas Impact at 512/472-3903 or email [email protected]

Impact of Medicaid Extension and Local Spending for Health CareHouse District 5 - Representative Bryan Hughes
County
2016 Adults <138% FPL Enrollees Moderate Scenario
2016 Adults Federal Funds
Moderate Scenario
2016 Adults State Funds Moderate Scenario
2016 Adults All Funds Moderate Scenario
2016 Children <200% FPL Enrollees Moderate Scenario
2016 Children Federal Funds
Moderate Scenario
2016 Children State Funds Moderate Scenario
2016 Children All Funds Moderate Scenario
2016 Adults & Children
All Funds Moderate Scenario
Statewide Total 1,004,771 7,615,086,733$ 292,887,951$ 7,907,974,684$ 550,189 1,500,495,384$ 769,325,576$ 2,269,820,960$ 10,177,795,644$
District Total 7,275 55,134,234$ 2,120,547$ 57,254,781$ 3,403 9,280,230$ 4,758,107$ 14,038,337$ 71,293,119$ Camp (100%) 650 4,928,057$ 189,541$ 5,117,598$ 308 838,741$ 430,035$ 1,268,776$ 6,386,374$ Morris (100%) 709 5,373,872$ 206,687$ 5,580,559$ 259 706,265$ 362,112$ 1,068,377$ 6,648,937$ Rains (100%) 494 3,747,251$ 144,125$ 3,891,377$ 176 479,867$ 246,034$ 725,901$ 4,617,277$ Smith (24%) 1,925 14,586,202$ 561,008$ 15,147,210$ 1,053 2,870,936$ 1,471,970$ 4,342,906$ 19,490,116$ Titus (100%) 1,618 12,265,923$ 471,766$ 12,737,689$ 962 2,623,270$ 1,344,988$ 3,968,259$ 16,705,948$ Wood (100%) 1,878 14,232,929$ 547,420$ 14,780,349$ 646 1,761,151$ 902,967$ 2,664,119$ 17,444,468$ Note: New local tax revenues are an allocation of the statewide estimate based on the county share of state personal income and further allocated in partial counties according to the share of county
population. Variations in personal income or the concentration of direct health care spending in parts of counties could alter these allocations. Remaining columns reflect allocations of statewide
estimates according to the county share of adults below 138% FPL or children below 200% FPL, as applicable, and further allocated for partial counties according to the share of the county's total
population. Variations in percentages of adults below 138% FPL and children below 200% FPL could alter these estimates. Hospital charity cost data exclude certain hospitals, such as those exempt
from reporting, hospitals that report by system, and others, resulting in a conservative estimate of unreimbursed charity costs. Medicaid extension to adults would not relieve all local unreimbursed
costs due to ineligible adults, such as undocumented immigrants, people served with incomes above 138% FPL or health care for incarcerated adults other than inpatient hospital stays. 2016 is the first
full year of implementation; the federal match rate falls to 95 percent in 2017 and to 90 percent by 2020. For full county-level data, see Appendix C, and for further notes and cautions in interpreting
these data, see Appendix A, in "Smart, Affordable and Fair: Why Texas Should Extend Medicaid to Low-Income Adults," at
http://www.mhm.org/images/stories/advocacy_and_public_policy/Smart%20Affordable%20and%20Fair_FNL_FULL.pdf.

Impact of Medicaid Extension and Local Spending for Health CareHouse District 6 - Representative Matt Schaefer
County
2014-2017 New Local Tax
Revenue (Adult Expansion)
2011 County Indigent
Healthcare & Unreimbursed Jail Healthcare
Costs
2011 Total Hospital District or City/County Unreimbursed
Healthcare Expenditures
2010 Total Hospital Charity
Care Costs
Total Unreimbursed Charity Care
Costs for Local Jurisdictions &
Hospitals
2014-2017 Adults Federal Funds
Limited Scenario
2014-2017 Adults Federal Funds
Moderate Scenario
2014-2017 Adults State
Funds Moderate Scenario
2014-2017 Adults Federal Funds
Enhanced Scenario
Statewide Total 2,101,392,352$ 258,927,030$ 2,544,037,688$ 1,836,673,862$ 4,380,711,550$ 14,274,023,031$ 22,962,552,386$ 1,283,318,611$ 31,030,479,514$
District Total 12,974,656$ 2,516,800$ 3,217,676$ 60,506,504$ 63,724,180$ 88,012,962$ 141,586,030$ 7,912,883$ 191,332,493$ Smith (76%) 12,974,656$ 2,516,800$ 3,217,676$ 60,506,504$ 63,724,180$ 88,012,962$ 141,586,030$ 7,912,883$ 191,332,493$
ANALYSIS BY BILLY HAMILTON CONSULTING
Extending Medicaid to Low-Income Adults Will Save Local Tax Dollars and Grow the Economy
Download this one-pager at www.texasimpact.org/Local-Taxpayers-Win-With-Medicaid Download the full report at www.mhm.org
Download the executive summary at www.texasimpact.org
For more information about the report, “Smart, Affordable and Fair” call Texas Impact at 512/472-3903 or email [email protected]

Impact of Medicaid Extension and Local Spending for Health CareHouse District 6 - Representative Matt Schaefer
County
2016 Adults <138% FPL Enrollees Moderate Scenario
2016 Adults Federal Funds
Moderate Scenario
2016 Adults State Funds Moderate Scenario
2016 Adults All Funds Moderate Scenario
2016 Children <200% FPL Enrollees Moderate Scenario
2016 Children Federal Funds
Moderate Scenario
2016 Children State Funds Moderate Scenario
2016 Children All Funds Moderate Scenario
2016 Adults & Children
All Funds Moderate Scenario
Statewide Total 1,004,771 7,615,086,733$ 292,887,951$ 7,907,974,684$ 550,189 1,500,495,384$ 769,325,576$ 2,269,820,960$ 10,177,795,644$
District Total 6,195 46,954,271$ 1,805,933$ 48,760,204$ 3,389 9,241,797$ 4,738,402$ 13,980,199$ 62,740,403$ Smith (76%) 6,195 46,954,271$ 1,805,933$ 48,760,204$ 3,389 9,241,797$ 4,738,402$ 13,980,199$ 62,740,403$ Note: New local tax revenues are an allocation of the statewide estimate based on the county share of state personal income and further allocated in partial counties according to the share of county population. Variations in personal income or the concentration of direct health care spending in parts of counties could alter these allocations. Remaining columns reflect allocations of statewide estimates according to the county share of adults below 138% FPL or children below 200% FPL, as applicable, and further allocated for partial counties according to the share of the county's total population. Variations in percentages of adults below 138% FPL and children below 200% FPL could alter these estimates. Hospital charity cost data exclude certain hospitals, such as those exempt from reporting, hospitals that report by system, and others, resulting in a conservative estimate of unreimbursed charity costs. Medicaid extension to adults would not relieve all local unreimbursed costs due to ineligible adults, such as undocumented immigrants, people served with incomes above 138% FPL or health care for incarcerated adults other than inpatient hospital stays. 2016 is the first full year of implementation; the federal match rate falls to 95 percent in 2017 and to 90 percent by 2020. For full county-level data, see Appendix C, and for further notes and cautions in interpreting these data, see Appendix A, in "Smart, Affordable and Fair: Why Texas Should Extend Medicaid to Low-Income Adults," at http://www.mhm.org/images/stories/advocacy_and_public_policy/Smart%20Affordable%20and%20Fair_FNL_FULL.pdf.

Impact of Medicaid Extension and Local Spending for Health CareHouse District 7 - Representative David Simpson
County
2014-2017 New
Local Tax
Revenue (Adult
Expansion)
2011 County
Indigent
Healthcare &
Unreimbursed
Jail Healthcare
Costs
2011 Total
Hospital District
or City/County
Unreimbursed
Healthcare
Expenditures
2010 Total
Hospital Charity
Care Costs
Total
Unreimbursed
Charity Care
Costs for Local
Jurisdictions &
Hospitals
2014-2017 Adults
Federal Funds
Limited
Scenario
2014-2017 Adults
Federal Funds
Moderate
Scenario
2014-2017
Adults State
Funds Moderate
Scenario
2014-2017 Adults
Federal Funds
Enhanced Scenario
Statewide Total 2,101,392,352$ 258,927,030$ 2,544,037,688$ 1,836,673,862$ 4,380,711,550$ 14,274,023,031$ 22,962,552,386$ 1,283,318,611$ 31,030,479,514$
District Total 13,655,232$ 2,345,864$ 3,144,752$ 21,095,290$ 24,240,042$ 126,595,706$ 203,653,906$ 11,381,698$ 275,208,010$
Gregg (100%) 10,809,509$ 2,012,812$ 2,761,742$ 21,095,290$ 23,857,032$ 98,957,065$ 159,191,756$ 8,896,822$ 215,124,017$ Upshur (100%) 2,845,723$ 333,053$ 383,011$ -$ 383,011$ 27,638,642$ 44,462,150$ 2,484,876$ 60,083,993$
ANALYSIS BY BILLY HAMILTON CONSULTING
Extending Medicaid to Low-Income Adults Will Save Local Tax Dollars and Grow the Economy
Download this one-pager at www.texasimpact.org/Local-Taxpayers-Win-With-Medicaid Download the full report at www.mhm.org
Download the executive summary at www.texasimpact.org
For more information about the report, “Smart, Affordable and Fair” call Texas Impact at 512/472-3903 or email [email protected]

Impact of Medicaid Extension and Local Spending for Health CareHouse District 7 - Representative David Simpson
County
2016 Adults
<138% FPL
Enrollees
Moderate
Scenario
2016 Adults
Federal Funds
Moderate
Scenario
2016 Adults
State Funds
Moderate
Scenario
2016 Adults
All Funds
Moderate
Scenario
2016 Children
<200% FPL
Enrollees
Moderate
Scenario
2016 Children
Federal Funds
Moderate
Scenario
2016 Children
State Funds
Moderate
Scenario
2016 Children
All Funds
Moderate
Scenario
2016 Adults &
Children
All Funds
Moderate
Scenario
Statewide Total 1,004,771 7,615,086,733$ 292,887,951$ 7,907,974,684$ 550,189 1,500,495,384$ 769,325,576$ 2,269,820,960$ 10,177,795,644$
District Total 8,911 67,537,882$ 2,597,611$ 70,135,493$ 3,536 9,644,086$ 4,944,662$ 14,588,748$ 84,724,241$
Gregg (100%) 6,966 52,792,869$ 2,030,495$ 54,823,364$ 2,803 7,644,232$ 3,919,308$ 11,563,540$ 66,386,905$
Upshur (100%) 1,946 14,745,013$ 567,116$ 15,312,129$ 733 1,999,854$ 1,025,354$ 3,025,208$ 18,337,336$
Note: New local tax revenues are an allocation of the statewide estimate based on the county share of state personal income and further allocated in partial counties according to the share of county population. Variations in personal income or the concentration of direct health care spending in parts of counties could alter these allocations. Remaining columns reflect allocations of statewide estimates according to the county share of adults below 138% FPL or children below 200% FPL, as applicable, and further allocated for partial counties according to the share of the county's total population. Variations in percentages of adults below 138% FPL and children below 200% FPL could alter these estimates. Hospital charity cost data exclude certain hospitals, such as those exempt from reporting, hospitals that report by system, and others, resulting in a conservative estimate of unreimbursed charity costs. Medicaid extension to adults would not relieve all local unreimbursed costs due to ineligible adults, such as undocumented immigrants, people served with incomes above 138% FPL or health care for incarcerated adults other than inpatient hospital stays. 2016 is the first full year of implementation; the federal match rate falls to 95 percent in 2017 and to 90 percent by 2020. For full county-level data, see Appendix C, and for further notes and cautions in interpreting these data, see Appendix A, in "Smart, Affordable and Fair: Why Texas Should Extend Medicaid to Low-Income Adults," at http://www.mhm.org/images/stories/advocacy_and_public_policy/Smart%20Affordable%20and%20Fair_FNL_FULL.pdf.
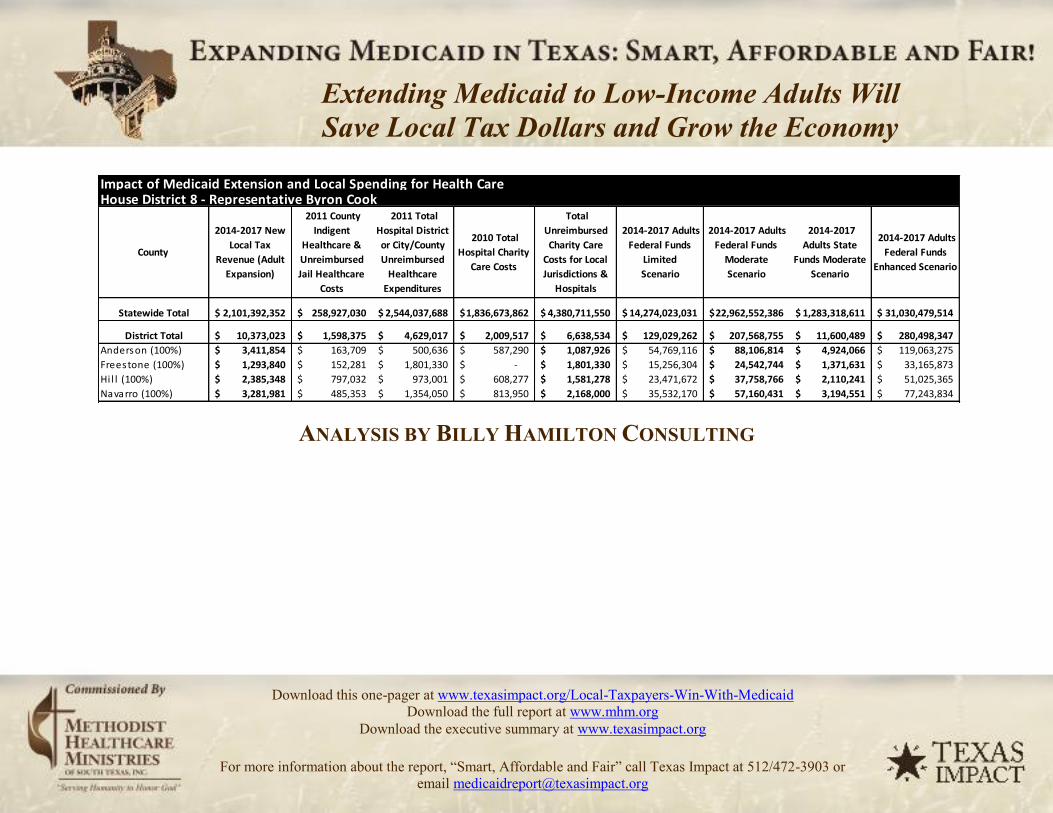
Impact of Medicaid Extension and Local Spending for Health CareHouse District 8 - Representative Byron Cook
County
2014-2017 New Local Tax
Revenue (Adult Expansion)
2011 County Indigent
Healthcare & Unreimbursed Jail Healthcare
Costs
2011 Total Hospital District or City/County Unreimbursed
Healthcare Expenditures
2010 Total Hospital Charity
Care Costs
Total Unreimbursed Charity Care
Costs for Local Jurisdictions &
Hospitals
2014-2017 Adults Federal Funds
Limited Scenario
2014-2017 Adults Federal Funds
Moderate Scenario
2014-2017 Adults State
Funds Moderate Scenario
2014-2017 Adults Federal Funds
Enhanced Scenario
Statewide Total 2,101,392,352$ 258,927,030$ 2,544,037,688$ 1,836,673,862$ 4,380,711,550$ 14,274,023,031$ 22,962,552,386$ 1,283,318,611$ 31,030,479,514$
District Total 10,373,023$ 1,598,375$ 4,629,017$ 2,009,517$ 6,638,534$ 129,029,262$ 207,568,755$ 11,600,489$ 280,498,347$ Anderson (100%) 3,411,854$ 163,709$ 500,636$ 587,290$ 1,087,926$ 54,769,116$ 88,106,814$ 4,924,066$ 119,063,275$ Freestone (100%) 1,293,840$ 152,281$ 1,801,330$ -$ 1,801,330$ 15,256,304$ 24,542,744$ 1,371,631$ 33,165,873$ Hi l l (100%) 2,385,348$ 797,032$ 973,001$ 608,277$ 1,581,278$ 23,471,672$ 37,758,766$ 2,110,241$ 51,025,365$ Navarro (100%) 3,281,981$ 485,353$ 1,354,050$ 813,950$ 2,168,000$ 35,532,170$ 57,160,431$ 3,194,551$ 77,243,834$
ANALYSIS BY BILLY HAMILTON CONSULTING
Extending Medicaid to Low-Income Adults Will Save Local Tax Dollars and Grow the Economy
Download this one-pager at www.texasimpact.org/Local-Taxpayers-Win-With-Medicaid Download the full report at www.mhm.org
Download the executive summary at www.texasimpact.org
For more information about the report, “Smart, Affordable and Fair” call Texas Impact at 512/472-3903 or email [email protected]
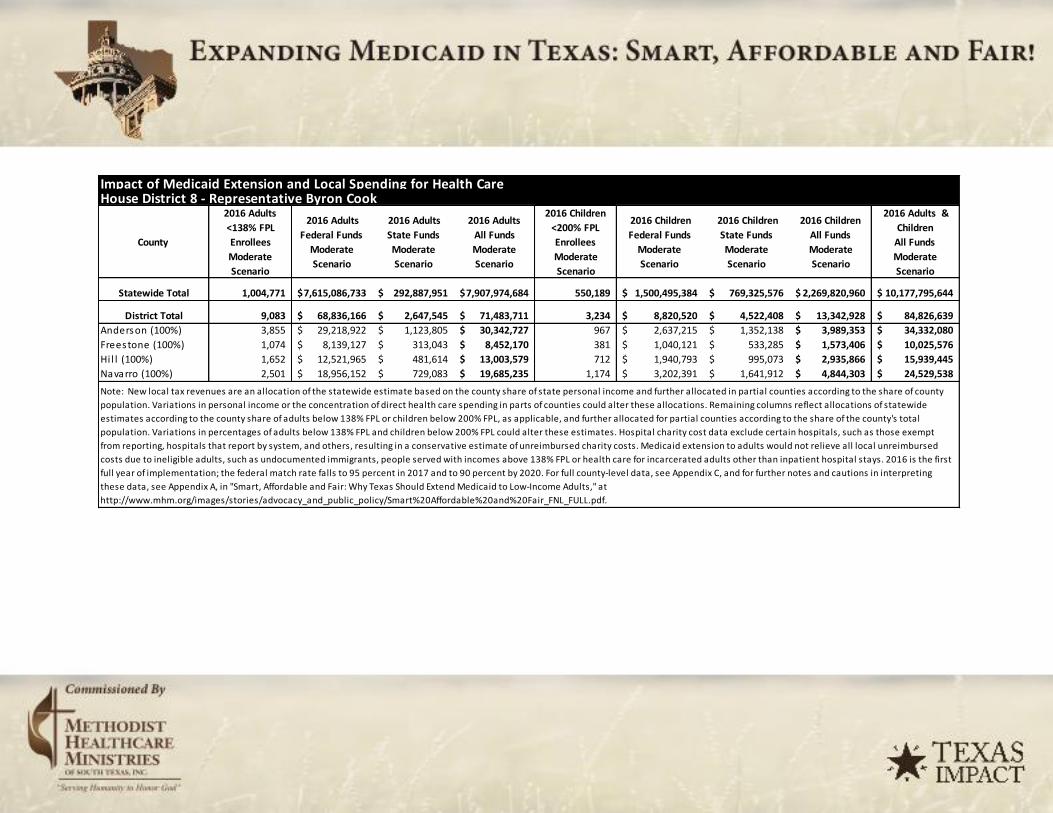
Impact of Medicaid Extension and Local Spending for Health CareHouse District 8 - Representative Byron Cook
County
2016 Adults <138% FPL Enrollees Moderate Scenario
2016 Adults Federal Funds
Moderate Scenario
2016 Adults State Funds Moderate Scenario
2016 Adults All Funds Moderate Scenario
2016 Children <200% FPL Enrollees Moderate Scenario
2016 Children Federal Funds
Moderate Scenario
2016 Children State Funds Moderate Scenario
2016 Children All Funds Moderate Scenario
2016 Adults & Children
All Funds Moderate Scenario
Statewide Total 1,004,771 7,615,086,733$ 292,887,951$ 7,907,974,684$ 550,189 1,500,495,384$ 769,325,576$ 2,269,820,960$ 10,177,795,644$
District Total 9,083 68,836,166$ 2,647,545$ 71,483,711$ 3,234 8,820,520$ 4,522,408$ 13,342,928$ 84,826,639$ Anderson (100%) 3,855 29,218,922$ 1,123,805$ 30,342,727$ 967 2,637,215$ 1,352,138$ 3,989,353$ 34,332,080$ Freestone (100%) 1,074 8,139,127$ 313,043$ 8,452,170$ 381 1,040,121$ 533,285$ 1,573,406$ 10,025,576$ Hi l l (100%) 1,652 12,521,965$ 481,614$ 13,003,579$ 712 1,940,793$ 995,073$ 2,935,866$ 15,939,445$ Navarro (100%) 2,501 18,956,152$ 729,083$ 19,685,235$ 1,174 3,202,391$ 1,641,912$ 4,844,303$ 24,529,538$
Note: New local tax revenues are an allocation of the statewide estimate based on the county share of state personal income and further allocated in partial counties according to the share of county population. Variations in personal income or the concentration of direct health care spending in parts of counties could alter these allocations. Remaining columns reflect allocations of statewide estimates according to the county share of adults below 138% FPL or children below 200% FPL, as applicable, and further allocated for partial counties according to the share of the county's total population. Variations in percentages of adults below 138% FPL and children below 200% FPL could alter these estimates. Hospital charity cost data exclude certain hospitals, such as those exempt from reporting, hospitals that report by system, and others, resulting in a conservative estimate of unreimbursed charity costs. Medicaid extension to adults would not relieve all local unreimbursed costs due to ineligible adults, such as undocumented immigrants, people served with incomes above 138% FPL or health care for incarcerated adults other than inpatient hospital stays. 2016 is the first full year of implementation; the federal match rate falls to 95 percent in 2017 and to 90 percent by 2020. For full county-level data, see Appendix C, and for further notes and cautions in interpreting these data, see Appendix A, in "Smart, Affordable and Fair: Why Texas Should Extend Medicaid to Low-Income Adults," at http://www.mhm.org/images/stories/advocacy_and_public_policy/Smart%20Affordable%20and%20Fair_FNL_FULL.pdf.
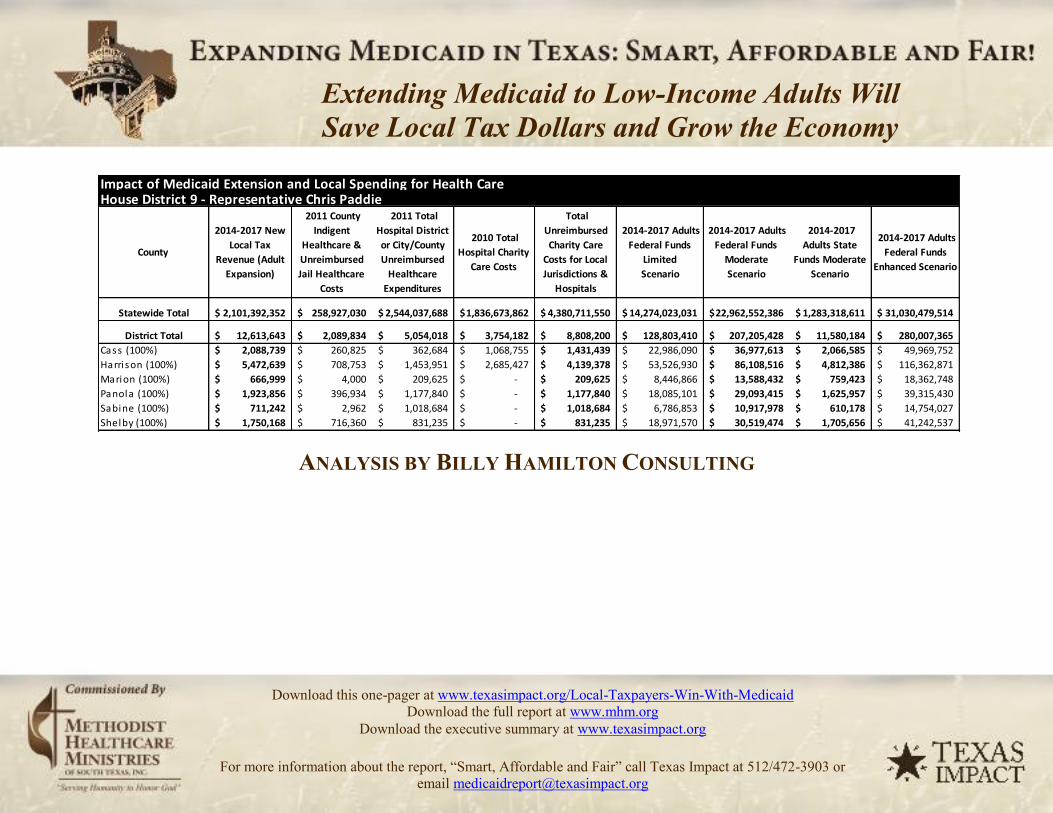
Impact of Medicaid Extension and Local Spending for Health CareHouse District 9 - Representative Chris Paddie
County
2014-2017 New Local Tax
Revenue (Adult Expansion)
2011 County Indigent
Healthcare & Unreimbursed Jail Healthcare
Costs
2011 Total Hospital District or City/County Unreimbursed
Healthcare Expenditures
2010 Total Hospital Charity
Care Costs
Total Unreimbursed Charity Care
Costs for Local Jurisdictions &
Hospitals
2014-2017 Adults Federal Funds
Limited Scenario
2014-2017 Adults Federal Funds
Moderate Scenario
2014-2017 Adults State
Funds Moderate Scenario
2014-2017 Adults Federal Funds
Enhanced Scenario
Statewide Total 2,101,392,352$ 258,927,030$ 2,544,037,688$ 1,836,673,862$ 4,380,711,550$ 14,274,023,031$ 22,962,552,386$ 1,283,318,611$ 31,030,479,514$
District Total 12,613,643$ 2,089,834$ 5,054,018$ 3,754,182$ 8,808,200$ 128,803,410$ 207,205,428$ 11,580,184$ 280,007,365$ Cass (100%) 2,088,739$ 260,825$ 362,684$ 1,068,755$ 1,431,439$ 22,986,090$ 36,977,613$ 2,066,585$ 49,969,752$ Harrison (100%) 5,472,639$ 708,753$ 1,453,951$ 2,685,427$ 4,139,378$ 53,526,930$ 86,108,516$ 4,812,386$ 116,362,871$ Marion (100%) 666,999$ 4,000$ 209,625$ -$ 209,625$ 8,446,866$ 13,588,432$ 759,423$ 18,362,748$ Panola (100%) 1,923,856$ 396,934$ 1,177,840$ -$ 1,177,840$ 18,085,101$ 29,093,415$ 1,625,957$ 39,315,430$ Sabine (100%) 711,242$ 2,962$ 1,018,684$ -$ 1,018,684$ 6,786,853$ 10,917,978$ 610,178$ 14,754,027$ Shelby (100%) 1,750,168$ 716,360$ 831,235$ -$ 831,235$ 18,971,570$ 30,519,474$ 1,705,656$ 41,242,537$
ANALYSIS BY BILLY HAMILTON CONSULTING
Extending Medicaid to Low-Income Adults Will Save Local Tax Dollars and Grow the Economy
Download this one-pager at www.texasimpact.org/Local-Taxpayers-Win-With-Medicaid Download the full report at www.mhm.org
Download the executive summary at www.texasimpact.org
For more information about the report, “Smart, Affordable and Fair” call Texas Impact at 512/472-3903 or email [email protected]

Impact of Medicaid Extension and Local Spending for Health CareHouse District 9 - Representative Chris Paddie
County
2016 Adults
<138% FPL
Enrollees
Moderate
Scenario
2016 Adults
Federal Funds
Moderate
Scenario
2016 Adults
State Funds
Moderate
Scenario
2016 Adults
All Funds
Moderate
Scenario
2016 Children
<200% FPL
Enrollees
Moderate
Scenario
2016 Children
Federal Funds
Moderate
Scenario
2016 Children
State Funds
Moderate
Scenario
2016 Children
All Funds
Moderate
Scenario
2016 Adults &
Children
All Funds
Moderate
Scenario
Statewide Total 1,004,771 7,615,086,733$ 292,887,951$ 7,907,974,684$ 550,189 1,500,495,384$ 769,325,576$ 2,269,820,960$ 10,177,795,644$
District Total 9,067 68,715,676$ 2,642,911$ 71,358,586$ 3,409 9,297,106$ 4,766,760$ 14,063,866$ 85,422,452$
Cass (100%) 1,618 12,262,911$ 471,650$ 12,734,561$ 587 1,602,016$ 821,377$ 2,423,392$ 15,157,953$
Harrison (100%) 3,768 28,556,225$ 1,098,316$ 29,654,541$ 1,448 3,948,850$ 2,024,632$ 5,973,482$ 35,628,024$
Marion (100%) 595 4,506,341$ 173,321$ 4,679,662$ 166 452,797$ 232,156$ 684,953$ 5,364,615$
Panola (100%) 1,273 9,648,269$ 371,087$ 10,019,356$ 471 1,283,745$ 658,195$ 1,941,940$ 11,961,296$
Sabine (100%) 478 3,620,737$ 139,259$ 3,759,996$ 154 420,396$ 215,543$ 635,939$ 4,395,935$
Shelby (100%) 1,335 10,121,194$ 389,277$ 10,510,470$ 583 1,589,301$ 814,858$ 2,404,159$ 12,914,630$
Note: New local tax revenues are an allocation of the statewide estimate based on the county share of state personal income and further allocated in partial counties according to the share of county population. Variations in personal income or the concentration of direct health care spending in parts of counties could alter these allocations. Remaining columns reflect allocations of statewide estimates according to the county share of adults below 138% FPL or children below 200% FPL, as applicable, and further allocated for partial counties according to the share of the county's total population. Variations in percentages of adults below 138% FPL and children below 200% FPL could alter these estimates. Hospital charity cost data exclude certain hospitals, such as those exempt from reporting, hospitals that report by system, and others, resulting in a conservative estimate of unreimbursed charity costs. Medicaid extension to adults would not relieve all local unreimbursed costs due to ineligible adults, such as undocumented immigrants, people served with incomes above 138% FPL or health care for incarcerated adults other than inpatient hospital stays. 2016 is the first full year of implementation; the federal match rate falls to 95 percent in 2017 and to 90 percent by 2020. For full county-level data, see Appendix C, and for further notes and cautions in interpreting these data, see Appendix A, in "Smart, Affordable and Fair: Why Texas Should Extend Medicaid to Low-Income Adults," at http://www.mhm.org/images/stories/advocacy_and_public_policy/Smart%20Affordable%20and%20Fair_FNL_FULL.pdf.

Impact of Medicaid Extension and Local Spending for Health CareHouse District 10 - Representative Jim Pitts
County
2014-2017 New Local Tax
Revenue (Adult Expansion)
2011 County Indigent
Healthcare & Unreimbursed Jail Healthcare
Costs
2011 Total Hospital District or City/County Unreimbursed
Healthcare Expenditures
2010 Total Hospital Charity
Care Costs
Total Unreimbursed Charity Care
Costs for Local Jurisdictions &
Hospitals
2014-2017 Adults Federal Funds
Limited Scenario
2014-2017 Adults Federal Funds
Moderate Scenario
2014-2017 Adults State
Funds Moderate Scenario
2014-2017 Adults Federal Funds
Enhanced Scenario
Statewide Total 2,101,392,352$ 258,927,030$ 2,544,037,688$ 1,836,673,862$ 4,380,711,550$ 14,274,023,031$ 22,962,552,386$ 1,283,318,611$ 31,030,479,514$
District Total 11,836,454$ 2,631,703$ 4,499,967$ 2,495,244$ 6,995,211$ 52,267,115$ 84,081,857$ 4,699,121$ 113,624,143$ El l i s (100%) 10,929,555$ 2,508,687$ 3,075,247$ 258,284$ 3,333,531$ 43,188,554$ 69,477,219$ 3,882,905$ 93,888,144$ Henderson (17%) 906,899$ 123,016$ 1,424,721$ 2,236,960$ 3,661,680$ 9,078,561$ 14,604,638$ 816,216$ 19,736,000$
ANALYSIS BY BILLY HAMILTON CONSULTING
Extending Medicaid to Low-Income Adults Will Save Local Tax Dollars and Grow the Economy
Download this one-pager at www.texasimpact.org/Local-Taxpayers-Win-With-Medicaid Download the full report at www.mhm.org
Download the executive summary at www.texasimpact.org
For more information about the report, “Smart, Affordable and Fair” call Texas Impact at 512/472-3903 or email [email protected]

Impact of Medicaid Extension and Local Spending for Health CareHouse District 10 - Representative Jim Pitts
County
2016 Adults
<138% FPL
Enrollees
Moderate
Scenario
2016 Adults
Federal Funds
Moderate
Scenario
2016 Adults
State Funds
Moderate
Scenario
2016 Adults
All Funds
Moderate
Scenario
2016 Children
<200% FPL
Enrollees
Moderate
Scenario
2016 Children
Federal Funds
Moderate
Scenario
2016 Children
State Funds
Moderate
Scenario
2016 Children
All Funds
Moderate
Scenario
2016 Adults &
Children
All Funds
Moderate
Scenario
Statewide Total 1,004,771 7,615,086,733$ 292,887,951$ 7,907,974,684$ 550,189 1,500,495,384$ 769,325,576$ 2,269,820,960$ 10,177,795,644$
District Total 3,679 27,884,123$ 1,072,466$ 28,956,589$ 2,309 6,297,630$ 3,228,885$ 9,526,515$ 38,483,104$
El l i s (100%) 3,040 23,040,777$ 886,184$ 23,926,961$ 2,069 5,642,738$ 2,893,113$ 8,535,851$ 32,462,811$
Henderson (17%) 639 4,843,346$ 186,283$ 5,029,629$ 240 654,892$ 335,772$ 990,664$ 6,020,293$
Note: New local tax revenues are an allocation of the statewide estimate based on the county share of state personal income and further allocated in partial counties according to the share of county population. Variations in personal income or the concentration of direct health care spending in parts of counties could alter these allocations. Remaining columns reflect allocations of statewide estimates according to the county share of adults below 138% FPL or children below 200% FPL, as applicable, and further allocated for partial counties according to the share of the county's total population. Variations in percentages of adults below 138% FPL and children below 200% FPL could alter these estimates. Hospital charity cost data exclude certain hospitals, such as those exempt from reporting, hospitals that report by system, and others, resulting in a conservative estimate of unreimbursed charity costs. Medicaid extension to adults would not relieve all local unreimbursed costs due to ineligible adults, such as undocumented immigrants, people served with incomes above 138% FPL or health care for incarcerated adults other than inpatient hospital stays. 2016 is the first full year of implementation; the federal match rate falls to 95 percent in 2017 and to 90 percent by 2020. For full county-level data, see Appendix C, and for further notes and cautions in interpreting these data, see Appendix A, in "Smart, Affordable and Fair: Why Texas Should Extend Medicaid to Low-Income Adults," at http://www.mhm.org/images/stories/advocacy_and_public_policy/Smart%20Affordable%20and%20Fair_FNL_FULL.pdf.

Impact of Medicaid Extension and Local Spending for Health CareHouse District 11 - Representative Travis Clardy
County
2014-2017 New
Local Tax
Revenue (Adult
Expansion)
2011 County
Indigent
Healthcare &
Unreimbursed
Jail Healthcare
Costs
2011 Total
Hospital District
or City/County
Unreimbursed
Healthcare
Expenditures
2010 Total
Hospital Charity
Care Costs
Total
Unreimbursed
Charity Care
Costs for Local
Jurisdictions &
Hospitals
2014-2017 Adults
Federal Funds
Limited
Scenario
2014-2017 Adults
Federal Funds
Moderate
Scenario
2014-2017
Adults State
Funds Moderate
Scenario
2014-2017 Adults
Federal Funds
Enhanced Scenario
Statewide Total 2,101,392,352$ 258,927,030$ 2,544,037,688$ 1,836,673,862$ 4,380,711,550$ 14,274,023,031$ 22,962,552,386$ 1,283,318,611$ 31,030,479,514$
District Total 10,511,561$ 683,208$ 9,627,198$ 18,129,120$ 27,756,318$ 136,448,501$ 219,504,049$ 12,267,523$ 296,627,125$
Cherokee (100%) 3,072,890$ 264,722$ 530,084$ 7,855,847$ 8,385,931$ 38,270,626$ 61,565,772$ 3,440,754$ 83,196,998$ Nacogdoches (100%) 4,063,836$ -$ 8,582,629$ 5,935,819$ 14,518,448$ 54,215,779$ 87,216,663$ 4,874,317$ 117,860,368$ Rusk (100%) 3,374,835$ 418,485$ 514,484$ 4,337,454$ 4,851,938$ 43,962,097$ 70,721,614$ 3,952,451$ 95,569,759$
ANALYSIS BY BILLY HAMILTON CONSULTING
Extending Medicaid to Low-Income Adults Will Save Local Tax Dollars and Grow the Economy
Download this one-pager at www.texasimpact.org/Local-Taxpayers-Win-With-Medicaid Download the full report at www.mhm.org
Download the executive summary at www.texasimpact.org
For more information about the report, “Smart, Affordable and Fair” call Texas Impact at 512/472-3903 or email [email protected]

Impact of Medicaid Extension and Local Spending for Health CareHouse District 11 - Representative Travis Clardy
County
2016 Adults <138% FPL Enrollees Moderate Scenario
2016 Adults Federal Funds
Moderate Scenario
2016 Adults State Funds Moderate Scenario
2016 Adults All Funds Moderate Scenario
2016 Children <200% FPL Enrollees Moderate Scenario
2016 Children Federal Funds
Moderate Scenario
2016 Children State Funds Moderate Scenario
2016 Children All Funds Moderate Scenario
2016 Adults & Children
All Funds Moderate Scenario
Statewide Total 1,004,771 7,615,086,733$ 292,887,951$ 7,907,974,684$ 550,189 1,500,495,384$ 769,325,576$ 2,269,820,960$ 10,177,795,644$
District Total 9,605 72,794,276$ 2,799,780$ 75,594,056$ 3,649 9,951,283$ 5,102,166$ 15,053,449$ 90,647,504$ Cherokee (100%) 2,694 20,417,098$ 785,273$ 21,202,371$ 1,182 3,223,719$ 1,652,847$ 4,876,565$ 26,078,937$ Nacogdoches (100%) 3,816 28,923,721$ 1,112,451$ 30,036,172$ 1,419 3,870,103$ 1,984,257$ 5,854,360$ 35,890,532$ Rusk (100%) 3,095 23,453,457$ 902,056$ 24,355,513$ 1,048 2,857,461$ 1,465,062$ 4,322,523$ 28,678,036$ Note: New local tax revenues are an allocation of the statewide estimate based on the county share of state personal income and further allocated in partial counties according to the share of county population. Variations in personal income or the concentration of direct health care spending in parts of counties could alter these allocations. Remaining columns reflect allocations of statewide estimates according to the county share of adults below 138% FPL or children below 200% FPL, as applicable, and further allocated for partial counties according to the share of the county's total population. Variations in percentages of adults below 138% FPL and children below 200% FPL could alter these estimates. Hospital charity cost data exclude certain hospitals, such as those exempt from reporting, hospitals that report by system, and others, resulting in a conservative estimate of unreimbursed charity costs. Medicaid extension to adults would not relieve all local unreimbursed costs due to ineligible adults, such as undocumented immigrants, people served with incomes above 138% FPL or health care for incarcerated adults other than inpatient hospital stays. 2016 is the first full year of implementation; the federal match rate falls to 95 percent in 2017 and to 90 percent by 2020. For full county-level data, see Appendix C, and for further notes and cautions in interpreting these data, see Appendix A, in "Smart, Affordable and Fair: Why Texas Should Extend Medicaid to Low-Income Adults," at http://www.mhm.org/images/stories/advocacy_and_public_policy/Smart%20Affordable%20and%20Fair_FNL_FULL.pdf.

Impact of Medicaid Extension and Local Spending for Health CareHouse District 12 - Representative Kyle Kacal
County
2014-2017 New Local Tax
Revenue (Adult Expansion)
2011 County Indigent
Healthcare & Unreimbursed Jail Healthcare
Costs
2011 Total Hospital District or City/County Unreimbursed
Healthcare Expenditures
2010 Total Hospital Charity
Care Costs
Total Unreimbursed Charity Care
Costs for Local Jurisdictions &
Hospitals
2014-2017 Adults Federal Funds
Limited Scenario
2014-2017 Adults Federal Funds
Moderate Scenario
2014-2017 Adults State
Funds Moderate Scenario
2014-2017 Adults Federal Funds
Enhanced Scenario
Statewide Total 2,101,392,352$ 258,927,030$ 2,544,037,688$ 1,836,673,862$ 4,380,711,550$ 14,274,023,031$ 22,962,552,386$ 1,283,318,611$ 31,030,479,514$
District Total 10,889,156$ 2,924,518$ 10,068,481$ 13,738,264$ 23,806,745$ 144,094,289$ 231,803,792$ 12,954,924$ 313,248,401$ Brazos (16%) 1,940,136$ 327,302$ 679,738$ 2,860,951$ 3,540,689$ 39,610,396$ 63,721,054$ 3,561,208$ 86,109,542$ Fa l l s (100%) 1,047,371$ 261,829$ 332,560$ -$ 332,560$ 15,504,742$ 24,942,403$ 1,393,967$ 33,705,954$ Limestone (100%) 1,527,817$ 535,773$ 6,483,876$ 548,744$ 7,032,620$ 18,310,953$ 29,456,742$ 1,646,262$ 39,806,413$ McLennan (30%) 5,134,485$ 1,635,117$ 2,297,953$ 10,328,569$ 12,626,521$ 57,794,633$ 92,973,949$ 5,196,077$ 125,640,486$ Robertson (100%) 1,239,346$ 164,497$ 274,354$ -$ 274,354$ 12,873,565$ 20,709,643$ 1,157,409$ 27,986,007$
ANALYSIS BY BILLY HAMILTON CONSULTING
Extending Medicaid to Low-Income Adults Will Save Local Tax Dollars and Grow the Economy
Download this one-pager at www.texasimpact.org/Local-Taxpayers-Win-With-Medicaid Download the full report at www.mhm.org
Download the executive summary at www.texasimpact.org
For more information about the report, “Smart, Affordable and Fair” call Texas Impact at 512/472-3903 or email [email protected]

Impact of Medicaid Extension and Local Spending for Health CareHouse District 12 - Representative Kyle Kacal
County
2016 Adults
<138% FPL
Enrollees
Moderate
Scenario
2016 Adults
Federal Funds
Moderate
Scenario
2016 Adults
State Funds
Moderate
Scenario
2016 Adults
All Funds
Moderate
Scenario
2016 Children
<200% FPL
Enrollees
Moderate
Scenario
2016 Children
Federal Funds
Moderate
Scenario
2016 Children
State Funds
Moderate
Scenario
2016 Children
All Funds
Moderate
Scenario
2016 Adults &
Children
All Funds
Moderate
Scenario
Statewide Total 1,004,771 7,615,086,733$ 292,887,951$ 7,907,974,684$ 550,189 1,500,495,384$ 769,325,576$ 2,269,820,960$ 10,177,795,644$
District Total 10,143 76,873,248$ 2,956,663$ 79,829,911$ 3,550 9,681,155$ 4,963,667$ 14,644,822$ 94,474,733$
Brazos (16%) 2,788 21,131,856$ 812,764$ 21,944,620$ 605 1,650,311$ 846,138$ 2,496,450$ 24,441,070$
Fal ls (100%) 1,091 8,271,666$ 318,141$ 8,589,807$ 367 1,001,568$ 513,518$ 1,515,086$ 10,104,893$
Limestone (100%) 1,289 9,768,759$ 375,722$ 10,144,481$ 502 1,369,465$ 702,144$ 2,071,610$ 12,216,090$
McLennan (30%) 4,068 30,833,014$ 1,185,885$ 32,018,899$ 1,694 4,620,100$ 2,368,792$ 6,988,891$ 39,007,790$
Robertson (100%) 906 6,867,953$ 264,152$ 7,132,105$ 381 1,039,711$ 533,075$ 1,572,785$ 8,704,890$
Note: New local tax revenues are an allocation of the statewide estimate based on the county share of state personal income and further allocated in partial counties according to the share of county
population. Variations in personal income or the concentration of direct health care spending in parts of counties could alter these allocations. Remaining columns reflect allocations of statewide
estimates according to the county share of adults below 138% FPL or children below 200% FPL, as applicable, and further allocated for partial counties according to the share of the county's total
population. Variations in percentages of adults below 138% FPL and children below 200% FPL could alter these estimates. Hospital charity cost data exclude certain hospitals, such as those exempt
from reporting, hospitals that report by system, and others, resulting in a conservative estimate of unreimbursed charity costs. Medicaid extension to adults would not relieve all local unreimbursed
costs due to ineligible adults, such as undocumented immigrants, people served with incomes above 138% FPL or health care for incarcerated adults other than inpatient hospital stays. 2016 is the first
full year of implementation; the federal match rate falls to 95 percent in 2017 and to 90 percent by 2020. For full county-level data, see Appendix C, and for further notes and cautions in interpreting
these data, see Appendix A, in "Smart, Affordable and Fair: Why Texas Should Extend Medicaid to Low-Income Adults," at
http://www.mhm.org/images/stories/advocacy_and_public_policy/Smart%20Affordable%20and%20Fair_FNL_FULL.pdf.

Impact of Medicaid Extension and Local Spending for Health CareHouse District 13 - Representative Lois W. Kolkhorst
County
2014-2017 New
Local Tax
Revenue (Adult
Expansion)
2011 County
Indigent
Healthcare &
Unreimbursed
Jail Healthcare
Costs
2011 Total
Hospital District
or City/County
Unreimbursed
Healthcare
Expenditures
2010 Total
Hospital Charity
Care Costs
Total
Unreimbursed
Charity Care
Costs for Local
Jurisdictions &
Hospitals
2014-2017 Adults
Federal Funds
Limited
Scenario
2014-2017 Adults
Federal Funds
Moderate
Scenario
2014-2017
Adults State
Funds Moderate
Scenario
2014-2017 Adults
Federal Funds
Enhanced Scenario
Statewide Total 2,101,392,352$ 258,927,030$ 2,544,037,688$ 1,836,673,862$ 4,380,711,550$ 14,274,023,031$ 22,962,552,386$ 1,283,318,611$ 31,030,479,514$
District Total 13,535,208$ 1,378,123$ 11,423,854$ 2,668,264$ 14,092,118$ 123,947,591$ 199,393,896$ 11,143,617$ 269,451,239$
Austin (100%) 2,362,602$ 170,182$ 1,547,272$ -$ 1,547,272$ 20,321,036$ 32,690,353$ 1,826,981$ 44,176,158$
Burleson (100%) 1,250,760$ 10,357$ 1,297,651$ -$ 1,297,651$ 12,387,984$ 19,928,490$ 1,113,753$ 26,930,394$
Colorado (100%) 1,662,933$ 174,019$ 2,962,420$ 398,947$ 3,361,367$ 14,787,661$ 23,788,840$ 1,329,498$ 32,147,084$
Fayette (100%) 2,007,366$ 384,957$ 2,134,997$ 388,669$ 2,523,666$ 16,148,420$ 25,977,885$ 1,451,838$ 35,105,254$
Grimes (100%) 1,691,842$ 226,619$ 675,471$ 418,982$ 1,094,453$ 21,952,817$ 35,315,391$ 1,973,687$ 47,723,507$
Lavaca (100%) 1,491,549$ 45,346$ 1,641,799$ 885,934$ 2,527,733$ 12,421,861$ 19,982,989$ 1,116,798$ 27,004,042$
Washington (100%) 3,068,155$ 366,643$ 1,164,245$ 575,732$ 1,739,977$ 25,927,812$ 41,709,948$ 2,331,063$ 56,364,800$
ANALYSIS BY BILLY HAMILTON CONSULTING
Extending Medicaid to Low-Income Adults Will Save Local Tax Dollars and Grow the Economy
Download this one-pager at www.texasimpact.org/Local-Taxpayers-Win-With-Medicaid Download the full report at www.mhm.org
Download the executive summary at www.texasimpact.org
For more information about the report, “Smart, Affordable and Fair” call Texas Impact at 512/472-3903 or email [email protected]
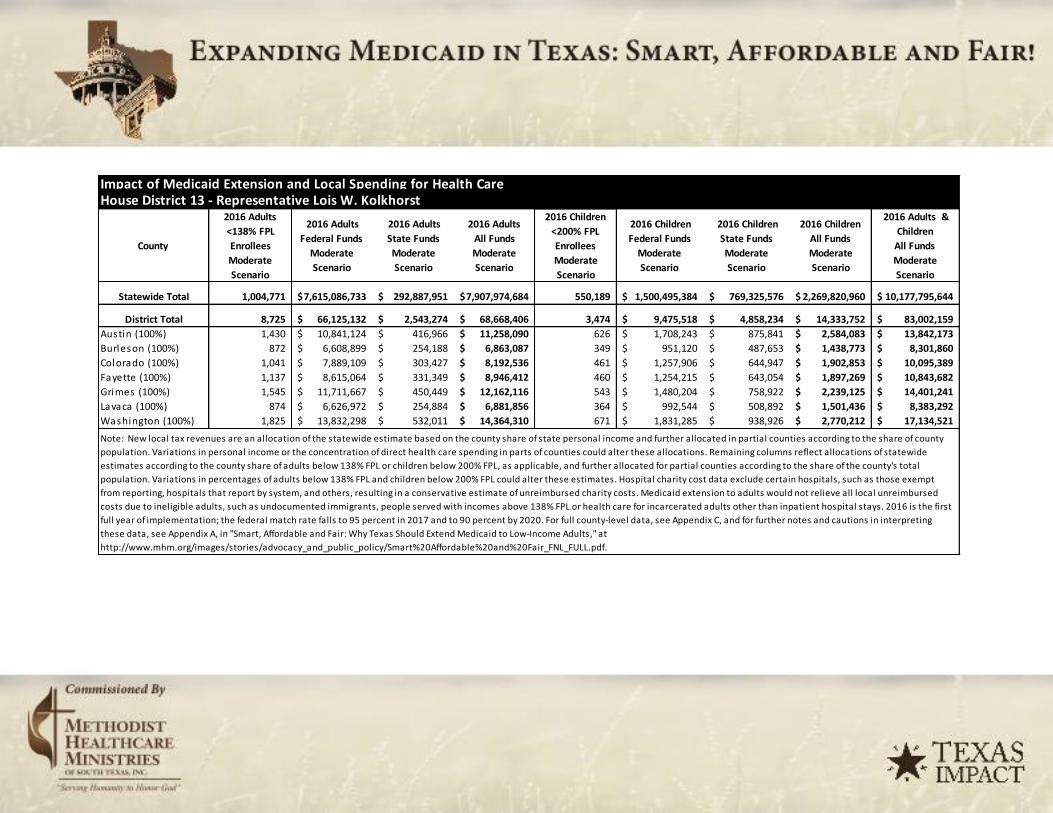
Impact of Medicaid Extension and Local Spending for Health CareHouse District 13 - Representative Lois W. Kolkhorst
County
2016 Adults <138% FPL Enrollees Moderate Scenario
2016 Adults Federal Funds
Moderate Scenario
2016 Adults State Funds Moderate Scenario
2016 Adults All Funds Moderate Scenario
2016 Children <200% FPL Enrollees Moderate Scenario
2016 Children Federal Funds
Moderate Scenario
2016 Children State Funds Moderate Scenario
2016 Children All Funds Moderate Scenario
2016 Adults & Children
All Funds Moderate Scenario
Statewide Total 1,004,771 7,615,086,733$ 292,887,951$ 7,907,974,684$ 550,189 1,500,495,384$ 769,325,576$ 2,269,820,960$ 10,177,795,644$
District Total 8,725 66,125,132$ 2,543,274$ 68,668,406$ 3,474 9,475,518$ 4,858,234$ 14,333,752$ 83,002,159$ Austin (100%) 1,430 10,841,124$ 416,966$ 11,258,090$ 626 1,708,243$ 875,841$ 2,584,083$ 13,842,173$ Burleson (100%) 872 6,608,899$ 254,188$ 6,863,087$ 349 951,120$ 487,653$ 1,438,773$ 8,301,860$ Colorado (100%) 1,041 7,889,109$ 303,427$ 8,192,536$ 461 1,257,906$ 644,947$ 1,902,853$ 10,095,389$ Fayette (100%) 1,137 8,615,064$ 331,349$ 8,946,412$ 460 1,254,215$ 643,054$ 1,897,269$ 10,843,682$ Grimes (100%) 1,545 11,711,667$ 450,449$ 12,162,116$ 543 1,480,204$ 758,922$ 2,239,125$ 14,401,241$ Lavaca (100%) 874 6,626,972$ 254,884$ 6,881,856$ 364 992,544$ 508,892$ 1,501,436$ 8,383,292$ Washington (100%) 1,825 13,832,298$ 532,011$ 14,364,310$ 671 1,831,285$ 938,926$ 2,770,212$ 17,134,521$ Note: New local tax revenues are an allocation of the statewide estimate based on the county share of state personal income and further allocated in partial counties according to the share of county population. Variations in personal income or the concentration of direct health care spending in parts of counties could alter these allocations. Remaining columns reflect allocations of statewide estimates according to the county share of adults below 138% FPL or children below 200% FPL, as applicable, and further allocated for partial counties according to the share of the county's total population. Variations in percentages of adults below 138% FPL and children below 200% FPL could alter these estimates. Hospital charity cost data exclude certain hospitals, such as those exempt from reporting, hospitals that report by system, and others, resulting in a conservative estimate of unreimbursed charity costs. Medicaid extension to adults would not relieve all local unreimbursed costs due to ineligible adults, such as undocumented immigrants, people served with incomes above 138% FPL or health care for incarcerated adults other than inpatient hospital stays. 2016 is the first full year of implementation; the federal match rate falls to 95 percent in 2017 and to 90 percent by 2020. For full county-level data, see Appendix C, and for further notes and cautions in interpreting these data, see Appendix A, in "Smart, Affordable and Fair: Why Texas Should Extend Medicaid to Low-Income Adults," at http://www.mhm.org/images/stories/advocacy_and_public_policy/Smart%20Affordable%20and%20Fair_FNL_FULL.pdf.

Impact of Medicaid Extension and Local Spending for Health CareHouse District 14 - Representative John Raney
County
2014-2017 New
Local Tax
Revenue (Adult
Expansion)
2011 County
Indigent
Healthcare &
Unreimbursed
Jail Healthcare
Costs
2011 Total
Hospital District
or City/County
Unreimbursed
Healthcare
Expenditures
2010 Total
Hospital Charity
Care Costs
Total
Unreimbursed
Charity Care
Costs for Local
Jurisdictions &
Hospitals
2014-2017 Adults
Federal Funds
Limited
Scenario
2014-2017 Adults
Federal Funds
Moderate
Scenario
2014-2017
Adults State
Funds Moderate
Scenario
2014-2017 Adults
Federal Funds
Enhanced Scenario
Statewide Total 2,101,392,352$ 258,927,030$ 2,544,037,688$ 1,836,673,862$ 4,380,711,550$ 14,274,023,031$ 22,962,552,386$ 1,283,318,611$ 31,030,479,514$
District Total 9,998,894$ 1,686,821$ 3,503,172$ 14,744,507$ 18,247,678$ 204,140,402$ 328,399,686$ 18,353,423$ 443,783,407$
Brazos (84%) 9,998,894$ 1,686,821$ 3,503,172$ 14,744,507$ 18,247,678$ 204,140,402$ 328,399,686$ 18,353,423$ 443,783,407$
ANALYSIS BY BILLY HAMILTON CONSULTING
Extending Medicaid to Low-Income Adults Will Save Local Tax Dollars and Grow the Economy
Download this one-pager at www.texasimpact.org/Local-Taxpayers-Win-With-Medicaid Download the full report at www.mhm.org
Download the executive summary at www.texasimpact.org
For more information about the report, “Smart, Affordable and Fair” call Texas Impact at 512/472-3903 or email [email protected]

Impact of Medicaid Extension and Local Spending for Health CareHouse District 14 - Representative John Raney
County
2016 Adults <138% FPL Enrollees Moderate Scenario
2016 Adults Federal Funds
Moderate Scenario
2016 Adults State Funds Moderate Scenario
2016 Adults All Funds Moderate Scenario
2016 Children <200% FPL Enrollees Moderate Scenario
2016 Children Federal Funds
Moderate Scenario
2016 Children State Funds Moderate Scenario
2016 Children All Funds Moderate Scenario
2016 Adults & Children
All Funds Moderate Scenario
Statewide Total 1,004,771 7,615,086,733$ 292,887,951$ 7,907,974,684$ 550,189 1,500,495,384$ 769,325,576$ 2,269,820,960$ 10,177,795,644$
District Total 14,370 108,907,409$ 4,188,747$ 113,096,156$ 3,119 8,505,222$ 4,360,750$ 12,865,972$ 125,962,128$ Brazos (84%) 14,370 108,907,409$ 4,188,747$ 113,096,156$ 3,119 8,505,222$ 4,360,750$ 12,865,972$ 125,962,128$ Note: New local tax revenues are an allocation of the statewide estimate based on the county share of state personal income and further allocated in partial counties according to the share of county population. Variations in personal income or the concentration of direct health care spending in parts of counties could alter these allocations. Remaining columns reflect allocations of statewide estimates according to the county share of adults below 138% FPL or children below 200% FPL, as applicable, and further allocated for partial counties according to the share of the county's total population. Variations in percentages of adults below 138% FPL and children below 200% FPL could alter these estimates. Hospital charity cost data exclude certain hospitals, such as those exempt from reporting, hospitals that report by system, and others, resulting in a conservative estimate of unreimbursed charity costs. Medicaid extension to adults would not relieve all local unreimbursed costs due to ineligible adults, such as undocumented immigrants, people served with incomes above 138% FPL or health care for incarcerated adults other than inpatient hospital stays. 2016 is the first full year of implementation; the federal match rate falls to 95 percent in 2017 and to 90 percent by 2020. For full county-level data, see Appendix C, and for further notes and cautions in interpreting these data, see Appendix A, in "Smart, Affordable and Fair: Why Texas Should Extend Medicaid to Low-Income Adults," at http://www.mhm.org/images/stories/advocacy_and_public_policy/Smart%20Affordable%20and%20Fair_FNL_FULL.pdf.

Impact of Medicaid Extension and Local Spending for Health CareHouse District 15 - Representative Steve Toth
County
2014-2017 New Local Tax
Revenue (Adult Expansion)
2011 County Indigent
Healthcare & Unreimbursed Jail Healthcare
Costs
2011 Total Hospital District or City/County Unreimbursed
Healthcare Expenditures
2010 Total Hospital Charity
Care Costs
Total Unreimbursed Charity Care
Costs for Local Jurisdictions &
Hospitals
2014-2017 Adults Federal Funds
Limited Scenario
2014-2017 Adults Federal Funds
Moderate Scenario
2014-2017 Adults State
Funds Moderate Scenario
2014-2017 Adults Federal Funds
Enhanced Scenario
Statewide Total 2,101,392,352$ 258,927,030$ 2,544,037,688$ 1,836,673,862$ 4,380,711,550$ 14,274,023,031$ 22,962,552,386$ 1,283,318,611$ 31,030,479,514$
District Total 17,026,610$ 391,035$ 11,672,211$ 5,144,657$ 16,816,868$ 63,828,923$ 102,681,283$ 5,738,596$ 138,758,505$ Montgomery (37%) 17,026,610$ 391,035$ 11,672,211$ 5,144,657$ 16,816,868$ 63,828,923$ 102,681,283$ 5,738,596$ 138,758,505$
ANALYSIS BY BILLY HAMILTON CONSULTING
Extending Medicaid to Low-Income Adults Will Save Local Tax Dollars and Grow the Economy
Download this one-pager at www.texasimpact.org/Local-Taxpayers-Win-With-Medicaid Download the full report at www.mhm.org
Download the executive summary at www.texasimpact.org
For more information about the report, “Smart, Affordable and Fair” call Texas Impact at 512/472-3903 or email [email protected]
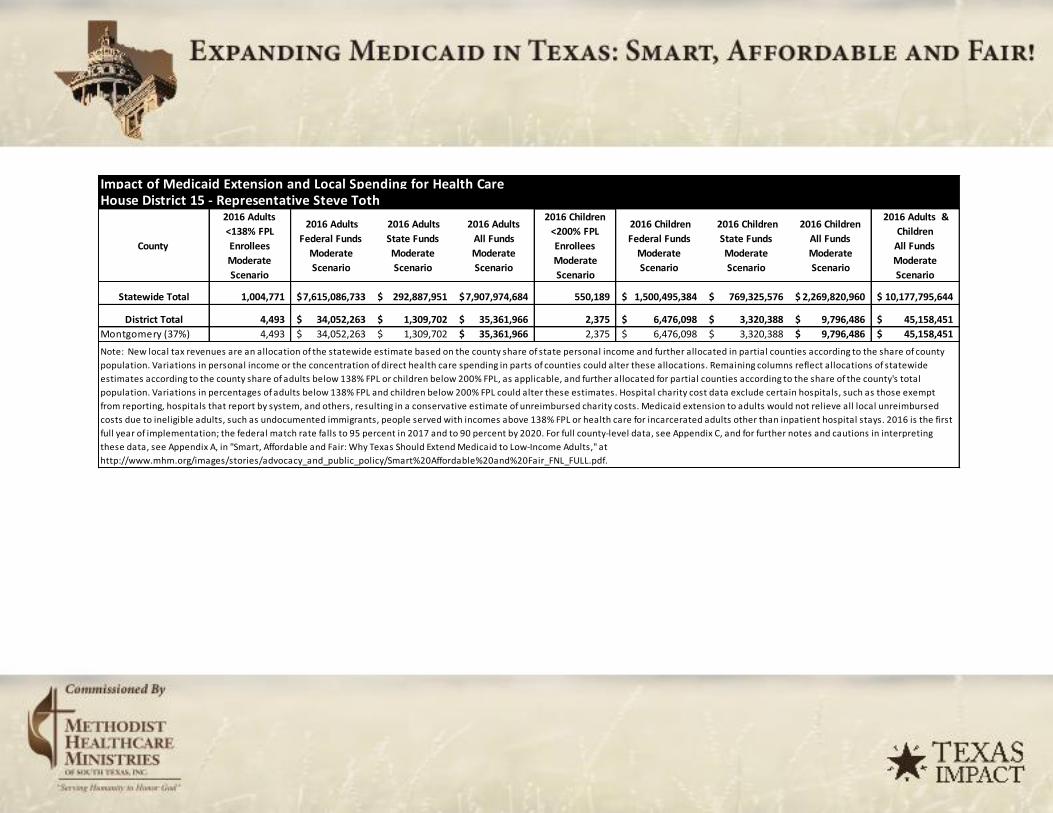
Impact of Medicaid Extension and Local Spending for Health CareHouse District 15 - Representative Steve Toth
County
2016 Adults
<138% FPL
Enrollees
Moderate
Scenario
2016 Adults
Federal Funds
Moderate
Scenario
2016 Adults
State Funds
Moderate
Scenario
2016 Adults
All Funds
Moderate
Scenario
2016 Children
<200% FPL
Enrollees
Moderate
Scenario
2016 Children
Federal Funds
Moderate
Scenario
2016 Children
State Funds
Moderate
Scenario
2016 Children
All Funds
Moderate
Scenario
2016 Adults &
Children
All Funds
Moderate
Scenario
Statewide Total 1,004,771 7,615,086,733$ 292,887,951$ 7,907,974,684$ 550,189 1,500,495,384$ 769,325,576$ 2,269,820,960$ 10,177,795,644$
District Total 4,493 34,052,263$ 1,309,702$ 35,361,966$ 2,375 6,476,098$ 3,320,388$ 9,796,486$ 45,158,451$
Montgomery (37%) 4,493 34,052,263$ 1,309,702$ 35,361,966$ 2,375 6,476,098$ 3,320,388$ 9,796,486$ 45,158,451$
Note: New local tax revenues are an allocation of the statewide estimate based on the county share of state personal income and further allocated in partial counties according to the share of county population. Variations in personal income or the concentration of direct health care spending in parts of counties could alter these allocations. Remaining columns reflect allocations of statewide estimates according to the county share of adults below 138% FPL or children below 200% FPL, as applicable, and further allocated for partial counties according to the share of the county's total population. Variations in percentages of adults below 138% FPL and children below 200% FPL could alter these estimates. Hospital charity cost data exclude certain hospitals, such as those exempt from reporting, hospitals that report by system, and others, resulting in a conservative estimate of unreimbursed charity costs. Medicaid extension to adults would not relieve all local unreimbursed costs due to ineligible adults, such as undocumented immigrants, people served with incomes above 138% FPL or health care for incarcerated adults other than inpatient hospital stays. 2016 is the first full year of implementation; the federal match rate falls to 95 percent in 2017 and to 90 percent by 2020. For full county-level data, see Appendix C, and for further notes and cautions in interpreting these data, see Appendix A, in "Smart, Affordable and Fair: Why Texas Should Extend Medicaid to Low-Income Adults," at http://www.mhm.org/images/stories/advocacy_and_public_policy/Smart%20Affordable%20and%20Fair_FNL_FULL.pdf.

Impact of Medicaid Extension and Local Spending for Health CareHouse District 16 - Representative Brandon Creighton
County
2014-2017 New Local Tax
Revenue (Adult Expansion)
2011 County Indigent
Healthcare & Unreimbursed Jail Healthcare
Costs
2011 Total Hospital District or City/County Unreimbursed
Healthcare Expenditures
2010 Total Hospital Charity
Care Costs
Total Unreimbursed Charity Care
Costs for Local Jurisdictions &
Hospitals
2014-2017 Adults Federal Funds
Limited Scenario
2014-2017 Adults Federal Funds
Moderate Scenario
2014-2017 Adults State
Funds Moderate Scenario
2014-2017 Adults Federal Funds
Enhanced Scenario
Statewide Total 2,101,392,352$ 258,927,030$ 2,544,037,688$ 1,836,673,862$ 4,380,711,550$ 14,274,023,031$ 22,962,552,386$ 1,283,318,611$ 31,030,479,514$
District Total 16,955,186$ 389,395$ 11,623,248$ 5,123,076$ 16,746,324$ 63,561,172$ 102,250,553$ 5,714,523$ 138,176,437$ Montgomery (37%) 16,955,186$ 389,395$ 11,623,248$ 5,123,076$ 16,746,324$ 63,561,172$ 102,250,553$ 5,714,523$ 138,176,437$
ANALYSIS BY BILLY HAMILTON CONSULTING
Extending Medicaid to Low-Income Adults Will Save Local Tax Dollars and Grow the Economy
Download this one-pager at www.texasimpact.org/Local-Taxpayers-Win-With-Medicaid Download the full report at www.mhm.org
Download the executive summary at www.texasimpact.org
For more information about the report, “Smart, Affordable and Fair” call Texas Impact at 512/472-3903 or email [email protected]

Impact of Medicaid Extension and Local Spending for Health CareHouse District 16 - Representative Brandon Creighton
County
2016 Adults
<138% FPL
Enrollees
Moderate
Scenario
2016 Adults
Federal Funds
Moderate
Scenario
2016 Adults
State Funds
Moderate
Scenario
2016 Adults
All Funds
Moderate
Scenario
2016 Children
<200% FPL
Enrollees
Moderate
Scenario
2016 Children
Federal Funds
Moderate
Scenario
2016 Children
State Funds
Moderate
Scenario
2016 Children
All Funds
Moderate
Scenario
2016 Adults &
Children
All Funds
Moderate
Scenario
Statewide Total 1,004,771 7,615,086,733$ 292,887,951$ 7,907,974,684$ 550,189 1,500,495,384$ 769,325,576$ 2,269,820,960$ 10,177,795,644$
District Total 4,474 33,909,420$ 1,304,208$ 35,213,628$ 2,365 6,448,931$ 3,306,460$ 9,755,391$ 44,969,020$
Montgomery (37%) 4,474 33,909,420$ 1,304,208$ 35,213,628$ 2,365 6,448,931$ 3,306,460$ 9,755,391$ 44,969,020$
Note: New local tax revenues are an allocation of the statewide estimate based on the county share of state personal income and further allocated in partial counties according to the share of county population. Variations in personal income or the concentration of direct health care spending in parts of counties could alter these allocations. Remaining columns reflect allocations of statewide estimates according to the county share of adults below 138% FPL or children below 200% FPL, as applicable, and further allocated for partial counties according to the share of the county's total population. Variations in percentages of adults below 138% FPL and children below 200% FPL could alter these estimates. Hospital charity cost data exclude certain hospitals, such as those exempt from reporting, hospitals that report by system, and others, resulting in a conservative estimate of unreimbursed charity costs. Medicaid extension to adults would not relieve all local unreimbursed costs due to ineligible adults, such as undocumented immigrants, people served with incomes above 138% FPL or health care for incarcerated adults other than inpatient hospital stays. 2016 is the first full year of implementation; the federal match rate falls to 95 percent in 2017 and to 90 percent by 2020. For full county-level data, see Appendix C, and for further notes and cautions in interpreting these data, see Appendix A, in "Smart, Affordable and Fair: Why Texas Should Extend Medicaid to Low-Income Adults," at http://www.mhm.org/images/stories/advocacy_and_public_policy/Smart%20Affordable%20and%20Fair_FNL_FULL.pdf.
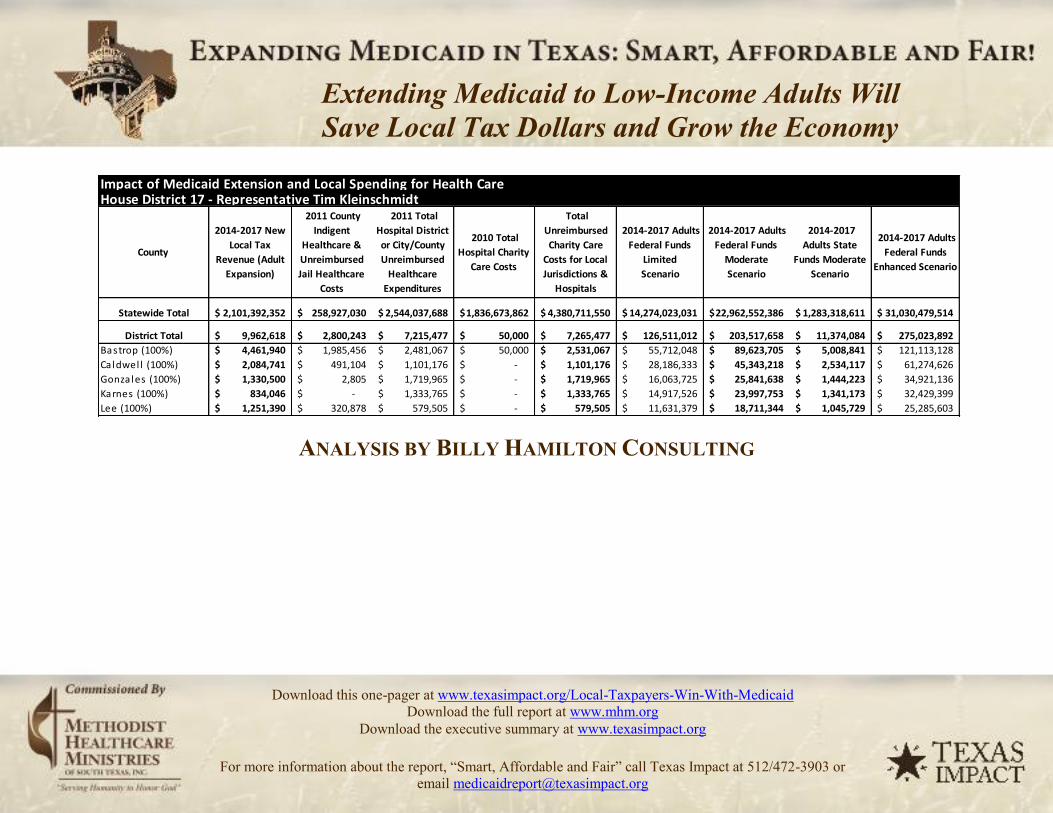
Impact of Medicaid Extension and Local Spending for Health CareHouse District 17 - Representative Tim Kleinschmidt
County
2014-2017 New Local Tax
Revenue (Adult Expansion)
2011 County Indigent
Healthcare & Unreimbursed Jail Healthcare
Costs
2011 Total Hospital District or City/County Unreimbursed
Healthcare Expenditures
2010 Total Hospital Charity
Care Costs
Total Unreimbursed Charity Care
Costs for Local Jurisdictions &
Hospitals
2014-2017 Adults Federal Funds
Limited Scenario
2014-2017 Adults Federal Funds
Moderate Scenario
2014-2017 Adults State
Funds Moderate Scenario
2014-2017 Adults Federal Funds
Enhanced Scenario
Statewide Total 2,101,392,352$ 258,927,030$ 2,544,037,688$ 1,836,673,862$ 4,380,711,550$ 14,274,023,031$ 22,962,552,386$ 1,283,318,611$ 31,030,479,514$
District Total 9,962,618$ 2,800,243$ 7,215,477$ 50,000$ 7,265,477$ 126,511,012$ 203,517,658$ 11,374,084$ 275,023,892$ Bastrop (100%) 4,461,940$ 1,985,456$ 2,481,067$ 50,000$ 2,531,067$ 55,712,048$ 89,623,705$ 5,008,841$ 121,113,128$ Ca ldwel l (100%) 2,084,741$ 491,104$ 1,101,176$ -$ 1,101,176$ 28,186,333$ 45,343,218$ 2,534,117$ 61,274,626$ Gonzales (100%) 1,330,500$ 2,805$ 1,719,965$ -$ 1,719,965$ 16,063,725$ 25,841,638$ 1,444,223$ 34,921,136$ Karnes (100%) 834,046$ -$ 1,333,765$ -$ 1,333,765$ 14,917,526$ 23,997,753$ 1,341,173$ 32,429,399$ Lee (100%) 1,251,390$ 320,878$ 579,505$ -$ 579,505$ 11,631,379$ 18,711,344$ 1,045,729$ 25,285,603$
ANALYSIS BY BILLY HAMILTON CONSULTING
Extending Medicaid to Low-Income Adults Will Save Local Tax Dollars and Grow the Economy
Download this one-pager at www.texasimpact.org/Local-Taxpayers-Win-With-Medicaid Download the full report at www.mhm.org
Download the executive summary at www.texasimpact.org
For more information about the report, “Smart, Affordable and Fair” call Texas Impact at 512/472-3903 or email [email protected]

Impact of Medicaid Extension and Local Spending for Health CareHouse District 17 - Representative Tim Kleinschmidt
County
2016 Adults
<138% FPL
Enrollees
Moderate
Scenario
2016 Adults
Federal Funds
Moderate
Scenario
2016 Adults
State Funds
Moderate
Scenario
2016 Adults
All Funds
Moderate
Scenario
2016 Children
<200% FPL
Enrollees
Moderate
Scenario
2016 Children
Federal Funds
Moderate
Scenario
2016 Children
State Funds
Moderate
Scenario
2016 Children
All Funds
Moderate
Scenario
2016 Adults &
Children
All Funds
Moderate
Scenario
Statewide Total 1,004,771 7,615,086,733$ 292,887,951$ 7,907,974,684$ 550,189 1,500,495,384$ 769,325,576$ 2,269,820,960$ 10,177,795,644$
District Total 8,905 67,492,698$ 2,595,873$ 70,088,571$ 3,995 10,896,661$ 5,586,875$ 16,483,536$ 86,572,107$
Bastrop (100%) 3,922 29,721,970$ 1,143,153$ 30,865,122$ 1,811 4,937,703$ 2,531,632$ 7,469,335$ 38,334,457$
Caldwel l (100%) 1,984 15,037,202$ 578,354$ 15,615,556$ 1,020 2,782,816$ 1,426,790$ 4,209,605$ 19,825,161$
Gonzales (100%) 1,131 8,569,880$ 329,611$ 8,899,491$ 501 1,367,004$ 700,883$ 2,067,887$ 10,967,378$
Karnes (100%) 1,050 7,958,391$ 306,092$ 8,264,483$ 272 742,358$ 380,617$ 1,122,975$ 9,387,458$
Lee (100%) 819 6,205,256$ 238,664$ 6,443,919$ 391 1,066,780$ 546,954$ 1,613,734$ 8,057,653$
Note: New local tax revenues are an allocation of the statewide estimate based on the county share of state personal income and further allocated in partial counties according to the share of county
population. Variations in personal income or the concentration of direct health care spending in parts of counties could alter these allocations. Remaining columns reflect allocations of statewide
estimates according to the county share of adults below 138% FPL or children below 200% FPL, as applicable, and further allocated for partial counties according to the share of the county's total
population. Variations in percentages of adults below 138% FPL and children below 200% FPL could alter these estimates. Hospital charity cost data exclude certain hospitals, such as those exempt
from reporting, hospitals that report by system, and others, resulting in a conservative estimate of unreimbursed charity costs. Medicaid extension to adults would not relieve all local unreimbursed
costs due to ineligible adults, such as undocumented immigrants, people served with incomes above 138% FPL or health care for incarcerated adults other than inpatient hospital stays. 2016 is the first
full year of implementation; the federal match rate falls to 95 percent in 2017 and to 90 percent by 2020. For full county-level data, see Appendix C, and for further notes and cautions in interpreting
these data, see Appendix A, in "Smart, Affordable and Fair: Why Texas Should Extend Medicaid to Low-Income Adults," at
http://www.mhm.org/images/stories/advocacy_and_public_policy/Smart%20Affordable%20and%20Fair_FNL_FULL.pdf.

Impact of Medicaid Extension and Local Spending for Health CareHouse District 18 - Representative John Otto
County
2014-2017 New Local Tax
Revenue (Adult Expansion)
2011 County Indigent
Healthcare & Unreimbursed Jail Healthcare
Costs
2011 Total Hospital District or City/County Unreimbursed
Healthcare Expenditures
2010 Total Hospital Charity
Care Costs
Total Unreimbursed Charity Care
Costs for Local Jurisdictions &
Hospitals
2014-2017 Adults Federal Funds
Limited Scenario
2014-2017 Adults Federal Funds
Moderate Scenario
2014-2017 Adults State
Funds Moderate Scenario
2014-2017 Adults Federal Funds
Enhanced Scenario
Statewide Total 2,101,392,352$ 258,927,030$ 2,544,037,688$ 1,836,673,862$ 4,380,711,550$ 14,274,023,031$ 22,962,552,386$ 1,283,318,611$ 31,030,479,514$
District Total 10,846,900$ 668,124$ 7,899,314$ 3,935,698$ 11,835,012$ 116,550,938$ 187,494,934$ 10,478,615$ 253,371,560$ Liberty (100%) 5,463,992$ 310,992$ 851,423$ -$ 851,423$ 29,970,564$ 48,213,502$ 2,694,530$ 65,153,388$ San Jacinto (100%) 1,744,225$ 275,218$ 316,500$ -$ 316,500$ 18,773,950$ 30,201,563$ 1,687,888$ 40,812,927$ Walker (100%) 3,638,684$ 81,915$ 6,731,391$ 3,935,698$ 10,667,089$ 67,806,424$ 109,079,870$ 6,096,196$ 147,405,245$
ANALYSIS BY BILLY HAMILTON CONSULTING
Extending Medicaid to Low-Income Adults Will Save Local Tax Dollars and Grow the Economy
Download this one-pager at www.texasimpact.org/Local-Taxpayers-Win-With-Medicaid Download the full report at www.mhm.org
Download the executive summary at www.texasimpact.org
For more information about the report, “Smart, Affordable and Fair” call Texas Impact at 512/472-3903 or email [email protected]
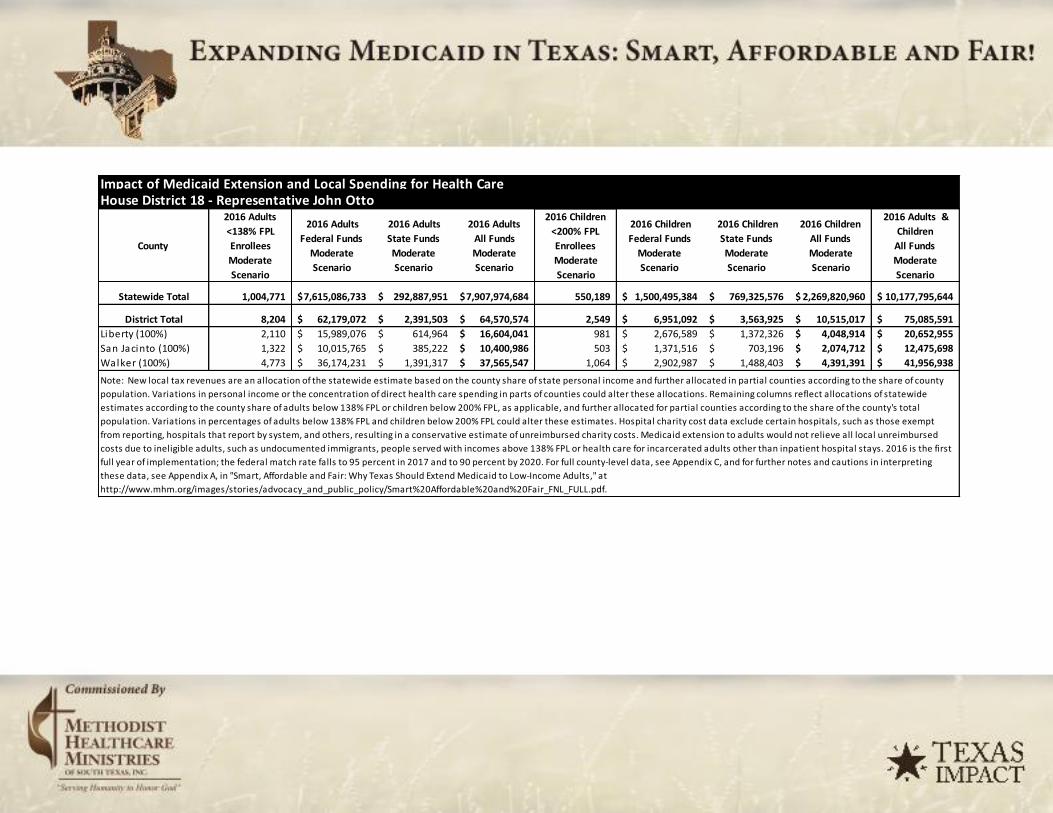
Impact of Medicaid Extension and Local Spending for Health CareHouse District 18 - Representative John Otto
County
2016 Adults <138% FPL Enrollees Moderate Scenario
2016 Adults Federal Funds
Moderate Scenario
2016 Adults State Funds Moderate Scenario
2016 Adults All Funds Moderate Scenario
2016 Children <200% FPL Enrollees Moderate Scenario
2016 Children Federal Funds
Moderate Scenario
2016 Children State Funds Moderate Scenario
2016 Children All Funds Moderate Scenario
2016 Adults & Children
All Funds Moderate Scenario
Statewide Total 1,004,771 7,615,086,733$ 292,887,951$ 7,907,974,684$ 550,189 1,500,495,384$ 769,325,576$ 2,269,820,960$ 10,177,795,644$
District Total 8,204 62,179,072$ 2,391,503$ 64,570,574$ 2,549 6,951,092$ 3,563,925$ 10,515,017$ 75,085,591$ Liberty (100%) 2,110 15,989,076$ 614,964$ 16,604,041$ 981 2,676,589$ 1,372,326$ 4,048,914$ 20,652,955$ San Jacinto (100%) 1,322 10,015,765$ 385,222$ 10,400,986$ 503 1,371,516$ 703,196$ 2,074,712$ 12,475,698$ Walker (100%) 4,773 36,174,231$ 1,391,317$ 37,565,547$ 1,064 2,902,987$ 1,488,403$ 4,391,391$ 41,956,938$
Note: New local tax revenues are an allocation of the statewide estimate based on the county share of state personal income and further allocated in partial counties according to the share of county population. Variations in personal income or the concentration of direct health care spending in parts of counties could alter these allocations. Remaining columns reflect allocations of statewide estimates according to the county share of adults below 138% FPL or children below 200% FPL, as applicable, and further allocated for partial counties according to the share of the county's total population. Variations in percentages of adults below 138% FPL and children below 200% FPL could alter these estimates. Hospital charity cost data exclude certain hospitals, such as those exempt from reporting, hospitals that report by system, and others, resulting in a conservative estimate of unreimbursed charity costs. Medicaid extension to adults would not relieve all local unreimbursed costs due to ineligible adults, such as undocumented immigrants, people served with incomes above 138% FPL or health care for incarcerated adults other than inpatient hospital stays. 2016 is the first full year of implementation; the federal match rate falls to 95 percent in 2017 and to 90 percent by 2020. For full county-level data, see Appendix C, and for further notes and cautions in interpreting these data, see Appendix A, in "Smart, Affordable and Fair: Why Texas Should Extend Medicaid to Low-Income Adults," at http://www.mhm.org/images/stories/advocacy_and_public_policy/Smart%20Affordable%20and%20Fair_FNL_FULL.pdf.
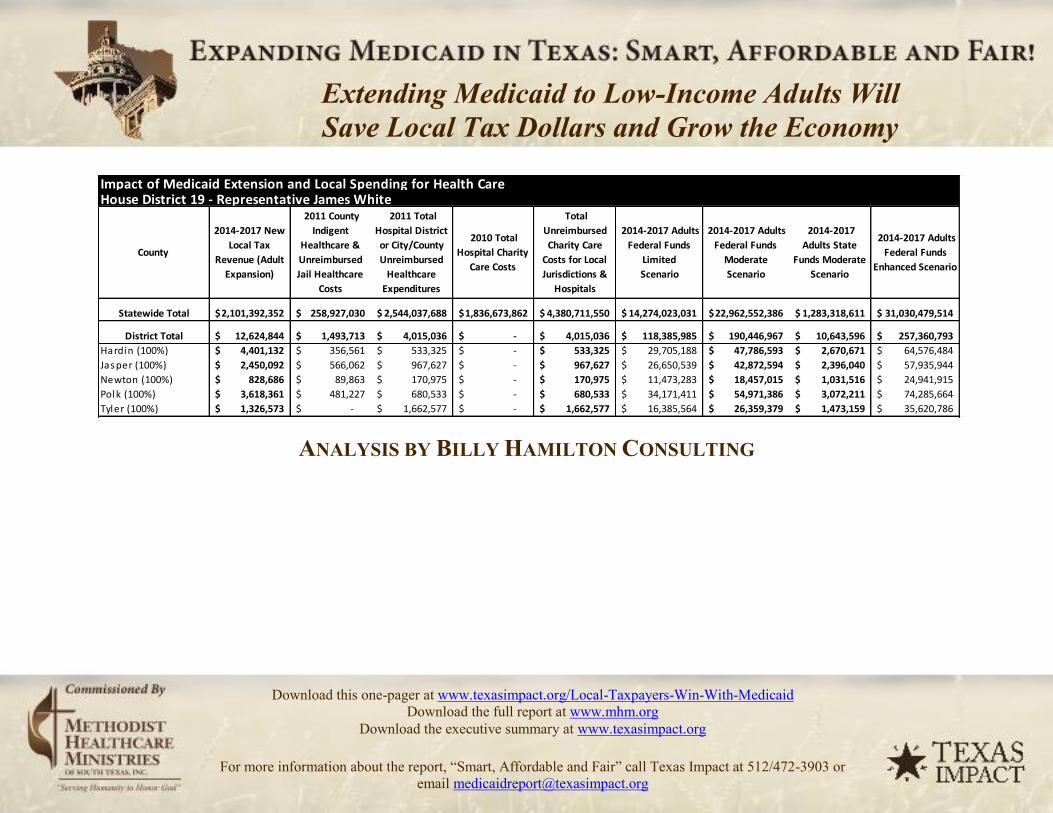
Impact of Medicaid Extension and Local Spending for Health CareHouse District 19 - Representative James White
County
2014-2017 New Local Tax
Revenue (Adult Expansion)
2011 County Indigent
Healthcare & Unreimbursed Jail Healthcare
Costs
2011 Total Hospital District or City/County Unreimbursed
Healthcare Expenditures
2010 Total Hospital Charity
Care Costs
Total Unreimbursed Charity Care
Costs for Local Jurisdictions &
Hospitals
2014-2017 Adults Federal Funds
Limited Scenario
2014-2017 Adults Federal Funds
Moderate Scenario
2014-2017 Adults State
Funds Moderate Scenario
2014-2017 Adults Federal Funds
Enhanced Scenario
Statewide Total 2,101,392,352$ 258,927,030$ 2,544,037,688$ 1,836,673,862$ 4,380,711,550$ 14,274,023,031$ 22,962,552,386$ 1,283,318,611$ 31,030,479,514$
District Total 12,624,844$ 1,493,713$ 4,015,036$ -$ 4,015,036$ 118,385,985$ 190,446,967$ 10,643,596$ 257,360,793$ Hardin (100%) 4,401,132$ 356,561$ 533,325$ -$ 533,325$ 29,705,188$ 47,786,593$ 2,670,671$ 64,576,484$ Jasper (100%) 2,450,092$ 566,062$ 967,627$ -$ 967,627$ 26,650,539$ 42,872,594$ 2,396,040$ 57,935,944$ Newton (100%) 828,686$ 89,863$ 170,975$ -$ 170,975$ 11,473,283$ 18,457,015$ 1,031,516$ 24,941,915$ Polk (100%) 3,618,361$ 481,227$ 680,533$ -$ 680,533$ 34,171,411$ 54,971,386$ 3,072,211$ 74,285,664$ Tyler (100%) 1,326,573$ -$ 1,662,577$ -$ 1,662,577$ 16,385,564$ 26,359,379$ 1,473,159$ 35,620,786$
ANALYSIS BY BILLY HAMILTON CONSULTING
Extending Medicaid to Low-Income Adults Will Save Local Tax Dollars and Grow the Economy
Download this one-pager at www.texasimpact.org/Local-Taxpayers-Win-With-Medicaid Download the full report at www.mhm.org
Download the executive summary at www.texasimpact.org
For more information about the report, “Smart, Affordable and Fair” call Texas Impact at 512/472-3903 or email [email protected]
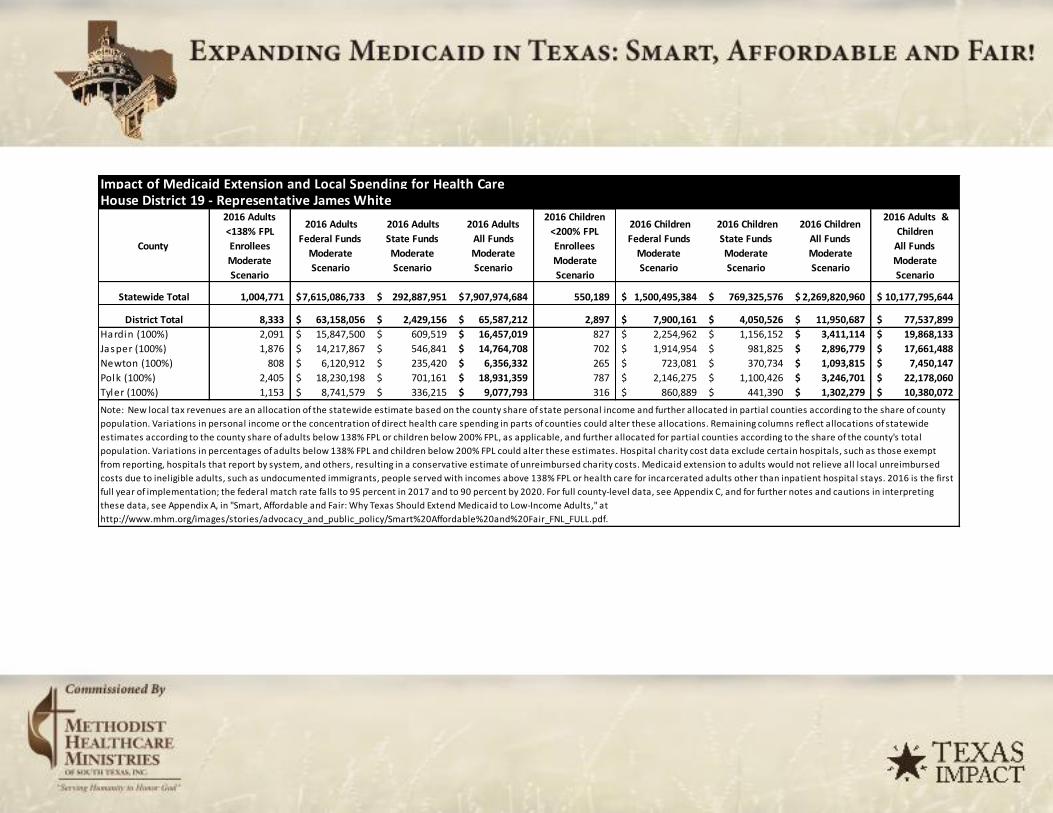
Impact of Medicaid Extension and Local Spending for Health CareHouse District 19 - Representative James White
County
2016 Adults
<138% FPL
Enrollees
Moderate
Scenario
2016 Adults
Federal Funds
Moderate
Scenario
2016 Adults
State Funds
Moderate
Scenario
2016 Adults
All Funds
Moderate
Scenario
2016 Children
<200% FPL
Enrollees
Moderate
Scenario
2016 Children
Federal Funds
Moderate
Scenario
2016 Children
State Funds
Moderate
Scenario
2016 Children
All Funds
Moderate
Scenario
2016 Adults &
Children
All Funds
Moderate
Scenario
Statewide Total 1,004,771 7,615,086,733$ 292,887,951$ 7,907,974,684$ 550,189 1,500,495,384$ 769,325,576$ 2,269,820,960$ 10,177,795,644$
District Total 8,333 63,158,056$ 2,429,156$ 65,587,212$ 2,897 7,900,161$ 4,050,526$ 11,950,687$ 77,537,899$
Hardin (100%) 2,091 15,847,500$ 609,519$ 16,457,019$ 827 2,254,962$ 1,156,152$ 3,411,114$ 19,868,133$
Jasper (100%) 1,876 14,217,867$ 546,841$ 14,764,708$ 702 1,914,954$ 981,825$ 2,896,779$ 17,661,488$
Newton (100%) 808 6,120,912$ 235,420$ 6,356,332$ 265 723,081$ 370,734$ 1,093,815$ 7,450,147$
Polk (100%) 2,405 18,230,198$ 701,161$ 18,931,359$ 787 2,146,275$ 1,100,426$ 3,246,701$ 22,178,060$
Tyler (100%) 1,153 8,741,579$ 336,215$ 9,077,793$ 316 860,889$ 441,390$ 1,302,279$ 10,380,072$
Note: New local tax revenues are an allocation of the statewide estimate based on the county share of state personal income and further allocated in partial counties according to the share of county population. Variations in personal income or the concentration of direct health care spending in parts of counties could alter these allocations. Remaining columns reflect allocations of statewide estimates according to the county share of adults below 138% FPL or children below 200% FPL, as applicable, and further allocated for partial counties according to the share of the county's total population. Variations in percentages of adults below 138% FPL and children below 200% FPL could alter these estimates. Hospital charity cost data exclude certain hospitals, such as those exempt from reporting, hospitals that report by system, and others, resulting in a conservative estimate of unreimbursed charity costs. Medicaid extension to adults would not relieve all local unreimbursed costs due to ineligible adults, such as undocumented immigrants, people served with incomes above 138% FPL or health care for incarcerated adults other than inpatient hospital stays. 2016 is the first full year of implementation; the federal match rate falls to 95 percent in 2017 and to 90 percent by 2020. For full county-level data, see Appendix C, and for further notes and cautions in interpreting these data, see Appendix A, in "Smart, Affordable and Fair: Why Texas Should Extend Medicaid to Low-Income Adults," at http://www.mhm.org/images/stories/advocacy_and_public_policy/Smart%20Affordable%20and%20Fair_FNL_FULL.pdf.

Impact of Medicaid Extension and Local Spending for Health CareHouse District 20 - Representative Marsha Farney
County
2014-2017 New Local Tax
Revenue (Adult Expansion)
2011 County Indigent
Healthcare & Unreimbursed Jail Healthcare
Costs
2011 Total Hospital District or City/County Unreimbursed
Healthcare Expenditures
2010 Total Hospital Charity
Care Costs
Total Unreimbursed Charity Care
Costs for Local Jurisdictions &
Hospitals
2014-2017 Adults Federal Funds
Limited Scenario
2014-2017 Adults Federal Funds
Moderate Scenario
2014-2017 Adults State
Funds Moderate Scenario
2014-2017 Adults Federal Funds
Enhanced Scenario
Statewide Total 2,101,392,352$ 258,927,030$ 2,544,037,688$ 1,836,673,862$ 4,380,711,550$ 14,274,023,031$ 22,962,552,386$ 1,283,318,611$ 31,030,479,514$
District Total 12,955,608$ 1,940,415$ 5,141,820$ 589,028$ 5,730,847$ 85,839,447$ 138,089,507$ 7,717,471$ 186,607,462$ Burnet (100%) 3,621,093$ 609,577$ 1,325,056$ -$ 1,325,056$ 27,604,764$ 44,407,651$ 2,481,831$ 60,010,346$ Mi lam (100%) 1,669,159$ 591,525$ 1,099,156$ -$ 1,099,156$ 16,650,941$ 26,786,288$ 1,497,017$ 36,197,691$ Wi l l iamson (22%) 7,665,356$ 739,313$ 2,717,608$ 589,028$ 3,306,636$ 41,583,743$ 66,895,568$ 3,738,623$ 90,399,425$
ANALYSIS BY BILLY HAMILTON CONSULTING
Extending Medicaid to Low-Income Adults Will Save Local Tax Dollars and Grow the Economy
Download this one-pager at www.texasimpact.org/Local-Taxpayers-Win-With-Medicaid Download the full report at www.mhm.org
Download the executive summary at www.texasimpact.org
For more information about the report, “Smart, Affordable and Fair” call Texas Impact at 512/472-3903 or email [email protected]

Impact of Medicaid Extension and Local Spending for Health CareHouse District 20 - Representative Marsha Farney
County
2016 Adults <138% FPL Enrollees Moderate Scenario
2016 Adults Federal Funds
Moderate Scenario
2016 Adults State Funds Moderate Scenario
2016 Adults All Funds Moderate Scenario
2016 Children <200% FPL Enrollees Moderate Scenario
2016 Children Federal Funds
Moderate Scenario
2016 Children State Funds Moderate Scenario
2016 Children All Funds Moderate Scenario
2016 Adults & Children
All Funds Moderate Scenario
Statewide Total 1,004,771 7,615,086,733$ 292,887,951$ 7,907,974,684$ 550,189 1,500,495,384$ 769,325,576$ 2,269,820,960$ 10,177,795,644$
District Total 6,042 45,794,716$ 1,761,335$ 47,556,052$ 2,793 7,618,517$ 3,906,123$ 11,524,640$ 59,080,691$ Burnet (100%) 1,943 14,726,939$ 566,421$ 15,293,360$ 770 2,101,159$ 1,077,294$ 3,178,454$ 18,471,814$ Milam (100%) 1,172 8,883,155$ 341,660$ 9,224,815$ 581 1,584,380$ 812,334$ 2,396,714$ 11,621,529$ Wil l iamson (22%) 2,927 22,184,622$ 853,255$ 23,037,877$ 1,442 3,932,978$ 2,016,494$ 5,949,472$ 28,987,349$ Note: New local tax revenues are an allocation of the statewide estimate based on the county share of state personal income and further allocated in partial counties according to the share of county population. Variations in personal income or the concentration of direct health care spending in parts of counties could alter these allocations. Remaining columns reflect allocations of statewide estimates according to the county share of adults below 138% FPL or children below 200% FPL, as applicable, and further allocated for partial counties according to the share of the county's total population. Variations in percentages of adults below 138% FPL and children below 200% FPL could alter these estimates. Hospital charity cost data exclude certain hospitals, such as those exempt from reporting, hospitals that report by system, and others, resulting in a conservative estimate of unreimbursed charity costs. Medicaid extension to adults would not relieve all local unreimbursed costs due to ineligible adults, such as undocumented immigrants, people served with incomes above 138% FPL or health care for incarcerated adults other than inpatient hospital stays. 2016 is the first full year of implementation; the federal match rate falls to 95 percent in 2017 and to 90 percent by 2020. For full county-level data, see Appendix C, and for further notes and cautions in interpreting these data, see Appendix A, in "Smart, Affordable and Fair: Why Texas Should Extend Medicaid to Low-Income Adults," at http://www.mhm.org/images/stories/advocacy_and_public_policy/Smart%20Affordable%20and%20Fair_FNL_FULL.pdf.

Impact of Medicaid Extension and Local Spending for Health CareHouse District 21 - Representative Allan Ritter
County
2014-2017 New
Local Tax
Revenue (Adult
Expansion)
2011 County
Indigent
Healthcare &
Unreimbursed
Jail Healthcare
Costs
2011 Total
Hospital District
or City/County
Unreimbursed
Healthcare
Expenditures
2010 Total
Hospital Charity
Care Costs
Total
Unreimbursed
Charity Care
Costs for Local
Jurisdictions &
Hospitals
2014-2017 Adults
Federal Funds
Limited
Scenario
2014-2017 Adults
Federal Funds
Moderate
Scenario
2014-2017
Adults State
Funds Moderate
Scenario
2014-2017 Adults
Federal Funds
Enhanced Scenario
Statewide Total 2,101,392,352$ 258,927,030$ 2,544,037,688$ 1,836,673,862$ 4,380,711,550$ 14,274,023,031$ 22,962,552,386$ 1,283,318,611$ 31,030,479,514$
District Total 13,715,059$ 4,794,990$ 5,739,793$ 8,540,577$ 14,280,370$ 118,616,136$ 190,817,210$ 10,664,288$ 257,861,122$
Jefferson (36%) 7,231,532$ 3,443,467$ 4,183,816$ 7,203,745$ 11,387,562$ 72,079,327$ 115,953,667$ 6,480,355$ 156,694,161$ Orange (100%) 6,483,527$ 1,351,523$ 1,555,976$ 1,336,832$ 2,892,808$ 46,536,810$ 74,863,543$ 4,183,933$ 101,166,960$
ANALYSIS BY BILLY HAMILTON CONSULTING
Extending Medicaid to Low-Income Adults Will Save Local Tax Dollars and Grow the Economy
Download this one-pager at www.texasimpact.org/Local-Taxpayers-Win-With-Medicaid Download the full report at www.mhm.org
Download the executive summary at www.texasimpact.org
For more information about the report, “Smart, Affordable and Fair” call Texas Impact at 512/472-3903 or email [email protected]

Impact of Medicaid Extension and Local Spending for Health CareHouse District 21 - Representative Allan Ritter
County
2016 Adults <138% FPL Enrollees Moderate Scenario
2016 Adults Federal Funds
Moderate Scenario
2016 Adults State Funds Moderate Scenario
2016 Adults All Funds Moderate Scenario
2016 Children <200% FPL Enrollees Moderate Scenario
2016 Children Federal Funds
Moderate Scenario
2016 Children State Funds Moderate Scenario
2016 Children All Funds Moderate Scenario
2016 Adults & Children
All Funds Moderate Scenario
Statewide Total 1,004,771 7,615,086,733$ 292,887,951$ 7,907,974,684$ 550,189 1,500,495,384$ 769,325,576$ 2,269,820,960$ 10,177,795,644$
District Total 8,350 63,280,840$ 2,433,878$ 65,714,718$ 3,154 8,601,426$ 4,410,075$ 13,011,500$ 78,726,219$ Jefferson (36%) 5,074 38,453,793$ 1,478,992$ 39,932,785$ 1,867 5,091,838$ 2,610,659$ 7,702,496$ 47,635,281$ Orange (100%) 3,276 24,827,047$ 954,886$ 25,781,934$ 1,287 3,509,588$ 1,799,416$ 5,309,004$ 31,090,937$ Note: New local tax revenues are an allocation of the statewide estimate based on the county share of state personal income and further allocated in partial counties according to the share of county population. Variations in personal income or the concentration of direct health care spending in parts of counties could alter these allocations. Remaining columns reflect allocations of statewide estimates according to the county share of adults below 138% FPL or children below 200% FPL, as applicable, and further allocated for partial counties according to the share of the county's total population. Variations in percentages of adults below 138% FPL and children below 200% FPL could alter these estimates. Hospital charity cost data exclude certain hospitals, such as those exempt from reporting, hospitals that report by system, and others, resulting in a conservative estimate of unreimbursed charity costs. Medicaid extension to adults would not relieve all local unreimbursed costs due to ineligible adults, such as undocumented immigrants, people served with incomes above 138% FPL or health care for incarcerated adults other than inpatient hospital stays. 2016 is the first full year of implementation; the federal match rate falls to 95 percent in 2017 and to 90 percent by 2020. For full county-level data, see Appendix C, and for further notes and cautions in interpreting these data, see Appendix A, in "Smart, Affordable and Fair: Why Texas Should Extend Medicaid to Low-Income Adults," at http://www.mhm.org/images/stories/advocacy_and_public_policy/Smart%20Affordable%20and%20Fair_FNL_FULL.pdf.

Impact of Medicaid Extension and Local Spending for Health CareHouse District 22 - Representative Joe Deshotel
County
2014-2017 New
Local Tax
Revenue (Adult
Expansion)
2011 County
Indigent
Healthcare &
Unreimbursed
Jail Healthcare
Costs
2011 Total
Hospital District
or City/County
Unreimbursed
Healthcare
Expenditures
2010 Total
Hospital Charity
Care Costs
Total
Unreimbursed
Charity Care
Costs for Local
Jurisdictions &
Hospitals
2014-2017 Adults
Federal Funds
Limited
Scenario
2014-2017 Adults
Federal Funds
Moderate
Scenario
2014-2017
Adults State
Funds Moderate
Scenario
2014-2017 Adults
Federal Funds
Enhanced Scenario
Statewide Total 2,101,392,352$ 258,927,030$ 2,544,037,688$ 1,836,673,862$ 4,380,711,550$ 14,274,023,031$ 22,962,552,386$ 1,283,318,611$ 31,030,479,514$
District Total 12,961,734$ 6,172,040$ 7,499,036$ 12,911,930$ 20,410,966$ 129,194,352$ 207,834,334$ 11,615,332$ 280,857,239$
Jefferson (64%) 12,961,734$ 6,172,040$ 7,499,036$ 12,911,930$ 20,410,966$ 129,194,352$ 207,834,334$ 11,615,332$ 280,857,239$
ANALYSIS BY BILLY HAMILTON CONSULTING
Extending Medicaid to Low-Income Adults Will Save Local Tax Dollars and Grow the Economy
Download this one-pager at www.texasimpact.org/Local-Taxpayers-Win-With-Medicaid Download the full report at www.mhm.org
Download the executive summary at www.texasimpact.org
For more information about the report, “Smart, Affordable and Fair” call Texas Impact at 512/472-3903 or email [email protected]

Impact of Medicaid Extension and Local Spending for Health CareHouse District 22 - Representative Joe Deshotel
County
2016 Adults
<138% FPL
Enrollees
Moderate
Scenario
2016 Adults
Federal Funds
Moderate
Scenario
2016 Adults
State Funds
Moderate
Scenario
2016 Adults
All Funds
Moderate
Scenario
2016 Children
<200% FPL
Enrollees
Moderate
Scenario
2016 Children
Federal Funds
Moderate
Scenario
2016 Children
State Funds
Moderate
Scenario
2016 Children
All Funds
Moderate
Scenario
2016 Adults &
Children
All Funds
Moderate
Scenario
Statewide Total 1,004,771 7,615,086,733$ 292,887,951$ 7,907,974,684$ 550,189 1,500,495,384$ 769,325,576$ 2,269,820,960$ 10,177,795,644$
District Total 9,094 68,924,241$ 2,650,932$ 71,575,173$ 3,346 9,126,566$ 4,679,321$ 13,805,887$ 85,381,060$
Jefferson (64%) 9,094 68,924,241$ 2,650,932$ 71,575,173$ 3,346 9,126,566$ 4,679,321$ 13,805,887$ 85,381,060$
Note: New local tax revenues are an allocation of the statewide estimate based on the county share of state personal income and further allocated in partial counties according to the share of county population. Variations in personal income or the concentration of direct health care spending in parts of counties could alter these allocations. Remaining columns reflect allocations of statewide estimates according to the county share of adults below 138% FPL or children below 200% FPL, as applicable, and further allocated for partial counties according to the share of the county's total population. Variations in percentages of adults below 138% FPL and children below 200% FPL could alter these estimates. Hospital charity cost data exclude certain hospitals, such as those exempt from reporting, hospitals that report by system, and others, resulting in a conservative estimate of unreimbursed charity costs. Medicaid extension to adults would not relieve all local unreimbursed costs due to ineligible adults, such as undocumented immigrants, people served with incomes above 138% FPL or health care for incarcerated adults other than inpatient hospital stays. 2016 is the first full year of implementation; the federal match rate falls to 95 percent in 2017 and to 90 percent by 2020. For full county-level data, see Appendix C, and for further notes and cautions in interpreting these data, see Appendix A, in "Smart, Affordable and Fair: Why Texas Should Extend Medicaid to Low-Income Adults," at http://www.mhm.org/images/stories/advocacy_and_public_policy/Smart%20Affordable%20and%20Fair_FNL_FULL.pdf.

Impact of Medicaid Extension and Local Spending for Health CareHouse District 23 - Representative Craig Eiland
County
2014-2017 New Local Tax
Revenue (Adult Expansion)
2011 County Indigent
Healthcare & Unreimbursed Jail Healthcare
Costs
2011 Total Hospital District or City/County Unreimbursed
Healthcare Expenditures
2010 Total Hospital Charity
Care Costs
Total Unreimbursed Charity Care
Costs for Local Jurisdictions &
Hospitals
2014-2017 Adults Federal Funds
Limited Scenario
2014-2017 Adults Federal Funds
Moderate Scenario
2014-2017 Adults State
Funds Moderate Scenario
2014-2017 Adults Federal Funds
Enhanced Scenario
Statewide Total 2,101,392,352$ 258,927,030$ 2,544,037,688$ 1,836,673,862$ 4,380,711,550$ 14,274,023,031$ 22,962,552,386$ 1,283,318,611$ 31,030,479,514$
District Total 15,294,475$ 5,350,977$ 12,271,686$ -$ 12,271,686$ 66,191,930$ 106,482,640$ 5,951,044$ 143,895,474$ Chambers (100%) 3,512,091$ 884,099$ 5,096,862$ -$ 5,096,862$ 13,443,842$ 21,627,044$ 1,208,680$ 29,225,738$ Galveston (44%) 11,782,384$ 4,466,878$ 7,174,823$ -$ 7,174,823$ 52,748,088$ 84,855,596$ 4,742,363$ 114,669,736$
ANALYSIS BY BILLY HAMILTON CONSULTING
Extending Medicaid to Low-Income Adults Will Save Local Tax Dollars and Grow the Economy
Download this one-pager at www.texasimpact.org/Local-Taxpayers-Win-With-Medicaid Download the full report at www.mhm.org
Download the executive summary at www.texasimpact.org
For more information about the report, “Smart, Affordable and Fair” call Texas Impact at 512/472-3903 or email [email protected]

Impact of Medicaid Extension and Local Spending for Health CareHouse District 23 - Representative Craig Eiland
County
2016 Adults <138% FPL Enrollees Moderate Scenario
2016 Adults Federal Funds
Moderate Scenario
2016 Adults State Funds Moderate Scenario
2016 Adults All Funds Moderate Scenario
2016 Children <200% FPL Enrollees Moderate Scenario
2016 Children Federal Funds
Moderate Scenario
2016 Children State Funds Moderate Scenario
2016 Children All Funds Moderate Scenario
2016 Adults & Children
All Funds Moderate Scenario
Statewide Total 1,004,771 7,615,086,733$ 292,887,951$ 7,907,974,684$ 550,189 1,500,495,384$ 769,325,576$ 2,269,820,960$ 10,177,795,644$
District Total 4,659 35,312,910$ 1,358,189$ 36,671,098$ 2,321 6,331,159$ 3,246,077$ 9,577,236$ 46,248,334$ Chambers (100%) 946 7,172,191$ 275,854$ 7,448,045$ 508 1,384,230$ 709,715$ 2,093,945$ 9,541,990$ Galveston (44%) 3,713 28,140,718$ 1,082,335$ 29,223,054$ 1,814 4,946,929$ 2,536,362$ 7,483,291$ 36,706,345$ Note: New local tax revenues are an allocation of the statewide estimate based on the county share of state personal income and further allocated in partial counties according to the share of county population. Variations in personal income or the concentration of direct health care spending in parts of counties could alter these allocations. Remaining columns reflect allocations of statewide estimates according to the county share of adults below 138% FPL or children below 200% FPL, as applicable, and further allocated for partial counties according to the share of the county's total population. Variations in percentages of adults below 138% FPL and children below 200% FPL could alter these estimates. Hospital charity cost data exclude certain hospitals, such as those exempt from reporting, hospitals that report by system, and others, resulting in a conservative estimate of unreimbursed charity costs. Medicaid extension to adults would not relieve all local unreimbursed costs due to ineligible adults, such as undocumented immigrants, people served with incomes above 138% FPL or health care for incarcerated adults other than inpatient hospital stays. 2016 is the first full year of implementation; the federal match rate falls to 95 percent in 2017 and to 90 percent by 2020. For full county-level data, see Appendix C, and for further notes and cautions in interpreting these data, see Appendix A, in "Smart, Affordable and Fair: Why Texas Should Extend Medicaid to Low-Income Adults," at http://www.mhm.org/images/stories/advocacy_and_public_policy/Smart%20Affordable%20and%20Fair_FNL_FULL.pdf.

Impact of Medicaid Extension and Local Spending for Health CareHouse District 24 - Representative Greg Bonnen
County
2014-2017 New Local Tax
Revenue (Adult Expansion)
2011 County Indigent
Healthcare & Unreimbursed Jail Healthcare
Costs
2011 Total Hospital District or City/County Unreimbursed
Healthcare Expenditures
2010 Total Hospital Charity
Care Costs
Total Unreimbursed Charity Care
Costs for Local Jurisdictions &
Hospitals
2014-2017 Adults Federal Funds
Limited Scenario
2014-2017 Adults Federal Funds
Moderate Scenario
2014-2017 Adults State
Funds Moderate Scenario
2014-2017 Adults Federal Funds
Enhanced Scenario
Statewide Total 2,101,392,352$ 258,927,030$ 2,544,037,688$ 1,836,673,862$ 4,380,711,550$ 14,274,023,031$ 22,962,552,386$ 1,283,318,611$ 31,030,479,514$
District Total 14,902,484$ 5,649,755$ 9,074,793$ -$ 9,074,793$ 66,716,341$ 107,326,258$ 5,998,191$ 145,035,499$ Galveston (56%) 14,902,484$ 5,649,755$ 9,074,793$ -$ 9,074,793$ 66,716,341$ 107,326,258$ 5,998,191$ 145,035,499$
ANALYSIS BY BILLY HAMILTON CONSULTING
Extending Medicaid to Low-Income Adults Will Save Local Tax Dollars and Grow the Economy
Download this one-pager at www.texasimpact.org/Local-Taxpayers-Win-With-Medicaid Download the full report at www.mhm.org
Download the executive summary at www.texasimpact.org
For more information about the report, “Smart, Affordable and Fair” call Texas Impact at 512/472-3903 or email [email protected]

Impact of Medicaid Extension and Local Spending for Health CareHouse District 24 - Representative Greg Bonnen
County
2016 Adults
<138% FPL
Enrollees
Moderate
Scenario
2016 Adults
Federal Funds
Moderate
Scenario
2016 Adults
State Funds
Moderate
Scenario
2016 Adults
All Funds
Moderate
Scenario
2016 Children
<200% FPL
Enrollees
Moderate
Scenario
2016 Children
Federal Funds
Moderate
Scenario
2016 Children
State Funds
Moderate
Scenario
2016 Children
All Funds
Moderate
Scenario
2016 Adults &
Children
All Funds
Moderate
Scenario
Statewide Total 1,004,771 7,615,086,733$ 292,887,951$ 7,907,974,684$ 550,189 1,500,495,384$ 769,325,576$ 2,269,820,960$ 10,177,795,644$
District Total 4,696 35,592,679$ 1,368,949$ 36,961,628$ 2,294 6,256,928$ 3,208,017$ 9,464,946$ 46,426,574$
Galveston (56%) 4,696 35,592,679$ 1,368,949$ 36,961,628$ 2,294 6,256,928$ 3,208,017$ 9,464,946$ 46,426,574$
Note: New local tax revenues are an allocation of the statewide estimate based on the county share of state personal income and further allocated in partial counties according to the share of county population. Variations in personal income or the concentration of direct health care spending in parts of counties could alter these allocations. Remaining columns reflect allocations of statewide estimates according to the county share of adults below 138% FPL or children below 200% FPL, as applicable, and further allocated for partial counties according to the share of the county's total population. Variations in percentages of adults below 138% FPL and children below 200% FPL could alter these estimates. Hospital charity cost data exclude certain hospitals, such as those exempt from reporting, hospitals that report by system, and others, resulting in a conservative estimate of unreimbursed charity costs. Medicaid extension to adults would not relieve all local unreimbursed costs due to ineligible adults, such as undocumented immigrants, people served with incomes above 138% FPL or health care for incarcerated adults other than inpatient hospital stays. 2016 is the first full year of implementation; the federal match rate falls to 95 percent in 2017 and to 90 percent by 2020. For full county-level data, see Appendix C, and for further notes and cautions in interpreting these data, see Appendix A, in "Smart, Affordable and Fair: Why Texas Should Extend Medicaid to Low-Income Adults," at http://www.mhm.org/images/stories/advocacy_and_public_policy/Smart%20Affordable%20and%20Fair_FNL_FULL.pdf.

Impact of Medicaid Extension and Local Spending for Health CareHouse District 25 - Representative Dennis Bonnen
County
2014-2017 New Local Tax
Revenue (Adult Expansion)
2011 County Indigent
Healthcare & Unreimbursed Jail Healthcare
Costs
2011 Total Hospital District or City/County Unreimbursed
Healthcare Expenditures
2010 Total Hospital Charity
Care Costs
Total Unreimbursed Charity Care
Costs for Local Jurisdictions &
Hospitals
2014-2017 Adults Federal Funds
Limited Scenario
2014-2017 Adults Federal Funds
Moderate Scenario
2014-2017 Adults State
Funds Moderate Scenario
2014-2017 Adults Federal Funds
Enhanced Scenario
Statewide Total 2,101,392,352$ 258,927,030$ 2,544,037,688$ 1,836,673,862$ 4,380,711,550$ 14,274,023,031$ 22,962,552,386$ 1,283,318,611$ 31,030,479,514$
District Total 13,675,702$ 2,076,586$ 15,884,860$ 1,777,830$ 17,662,690$ 84,503,791$ 135,940,843$ 7,597,388$ 183,703,862$ Brazoria (44%) 11,149,489$ 2,045,117$ 7,112,520$ 1,522,672$ 8,635,192$ 57,096,648$ 91,851,103$ 5,133,324$ 124,123,126$ Matagorda (100%) 2,526,213$ 31,469$ 8,772,340$ 255,158$ 9,027,498$ 27,407,143$ 44,089,740$ 2,464,063$ 59,580,736$
ANALYSIS BY BILLY HAMILTON CONSULTING
Extending Medicaid to Low-Income Adults Will Save Local Tax Dollars and Grow the Economy
Download this one-pager at www.texasimpact.org/Local-Taxpayers-Win-With-Medicaid Download the full report at www.mhm.org
Download the executive summary at www.texasimpact.org
For more information about the report, “Smart, Affordable and Fair” call Texas Impact at 512/472-3903 or email [email protected]

Impact of Medicaid Extension and Local Spending for Health CareHouse District 25 - Representative Dennis Bonnen
County
2016 Adults <138% FPL Enrollees Moderate Scenario
2016 Adults Federal Funds
Moderate Scenario
2016 Adults State Funds Moderate Scenario
2016 Adults All Funds Moderate Scenario
2016 Children <200% FPL Enrollees Moderate Scenario
2016 Children Federal Funds
Moderate Scenario
2016 Children State Funds Moderate Scenario
2016 Children All Funds Moderate Scenario
2016 Adults & Children
All Funds Moderate Scenario
Statewide Total 1,004,771 7,615,086,733$ 292,887,951$ 7,907,974,684$ 550,189 1,500,495,384$ 769,325,576$ 2,269,820,960$ 10,177,795,644$
District Total 5,948 45,082,154$ 1,733,929$ 46,816,083$ 3,171 8,647,572$ 4,433,735$ 13,081,307$ 59,897,390$ Brazoria (44%) 4,019 30,460,643$ 1,171,563$ 31,632,207$ 2,222 6,061,215$ 3,107,672$ 9,168,887$ 40,801,094$ Matagorda (100%) 1,929 14,621,510$ 562,366$ 15,183,876$ 948 2,586,357$ 1,326,063$ 3,912,420$ 19,096,296$ Note: New local tax revenues are an allocation of the statewide estimate based on the county share of state personal income and further allocated in partial counties according to the share of county population. Variations in personal income or the concentration of direct health care spending in parts of counties could alter these allocations. Remaining columns reflect allocations of statewide estimates according to the county share of adults below 138% FPL or children below 200% FPL, as applicable, and further allocated for partial counties according to the share of the county's total population. Variations in percentages of adults below 138% FPL and children below 200% FPL could alter these estimates. Hospital charity cost data exclude certain hospitals, such as those exempt from reporting, hospitals that report by system, and others, resulting in a conservative estimate of unreimbursed charity costs. Medicaid extension to adults would not relieve all local unreimbursed costs due to ineligible adults, such as undocumented immigrants, people served with incomes above 138% FPL or health care for incarcerated adults other than inpatient hospital stays. 2016 is the first full year of implementation; the federal match rate falls to 95 percent in 2017 and to 90 percent by 2020. For full county-level data, see Appendix C, and for further notes and cautions in interpreting these data, see Appendix A, in "Smart, Affordable and Fair: Why Texas Should Extend Medicaid to Low-Income Adults," at http://www.mhm.org/images/stories/advocacy_and_public_policy/Smart%20Affordable%20and%20Fair_FNL_FULL.pdf.

Impact of Medicaid Extension and Local Spending for Health CareHouse District 26 - Representative Rick Miller
County
2014-2017 New Local Tax
Revenue (Adult Expansion)
2011 County Indigent
Healthcare & Unreimbursed Jail Healthcare
Costs
2011 Total Hospital District or City/County Unreimbursed
Healthcare Expenditures
2010 Total Hospital Charity
Care Costs
Total Unreimbursed Charity Care
Costs for Local Jurisdictions &
Hospitals
2014-2017 Adults Federal Funds
Limited Scenario
2014-2017 Adults Federal Funds
Moderate Scenario
2014-2017 Adults State
Funds Moderate Scenario
2014-2017 Adults Federal Funds
Enhanced Scenario
Statewide Total 2,101,392,352$ 258,927,030$ 2,544,037,688$ 1,836,673,862$ 4,380,711,550$ 14,274,023,031$ 22,962,552,386$ 1,283,318,611$ 31,030,479,514$
District Total 16,216,376$ 1,905,153$ 4,308,218$ 4,864,528$ 9,172,746$ 72,471,259$ 116,584,167$ 6,515,592$ 157,546,188$ Fort Bend (27%) 16,216,376$ 1,905,153$ 4,308,218$ 4,864,528$ 9,172,746$ 72,471,259$ 116,584,167$ 6,515,592$ 157,546,188$
ANALYSIS BY BILLY HAMILTON CONSULTING
Extending Medicaid to Low-Income Adults Will Save Local Tax Dollars and Grow the Economy
Download this one-pager at www.texasimpact.org/Local-Taxpayers-Win-With-Medicaid Download the full report at www.mhm.org
Download the executive summary at www.texasimpact.org
For more information about the report, “Smart, Affordable and Fair” call Texas Impact at 512/472-3903 or email [email protected]

Impact of Medicaid Extension and Local Spending for Health CareHouse District 26 - Representative Rick Miller
County
2016 Adults
<138% FPL
Enrollees
Moderate
Scenario
2016 Adults
Federal Funds
Moderate
Scenario
2016 Adults
State Funds
Moderate
Scenario
2016 Adults
All Funds
Moderate
Scenario
2016 Children
<200% FPL
Enrollees
Moderate
Scenario
2016 Children
Federal Funds
Moderate
Scenario
2016 Children
State Funds
Moderate
Scenario
2016 Children
All Funds
Moderate
Scenario
2016 Adults &
Children
All Funds
Moderate
Scenario
Statewide Total 1,004,771 7,615,086,733$ 292,887,951$ 7,907,974,684$ 550,189 1,500,495,384$ 769,325,576$ 2,269,820,960$ 10,177,795,644$
District Total 5,101 38,662,886$ 1,487,034$ 40,149,920$ 2,823 7,700,192$ 3,947,999$ 11,648,191$ 51,798,111$
Fort Bend (27%) 5,101 38,662,886$ 1,487,034$ 40,149,920$ 2,823 7,700,192$ 3,947,999$ 11,648,191$ 51,798,111$
Note: New local tax revenues are an allocation of the statewide estimate based on the county share of state personal income and further allocated in partial counties according to the share of county population. Variations in personal income or the concentration of direct health care spending in parts of counties could alter these allocations. Remaining columns reflect allocations of statewide estimates according to the county share of adults below 138% FPL or children below 200% FPL, as applicable, and further allocated for partial counties according to the share of the county's total population. Variations in percentages of adults below 138% FPL and children below 200% FPL could alter these estimates. Hospital charity cost data exclude certain hospitals, such as those exempt from reporting, hospitals that report by system, and others, resulting in a conservative estimate of unreimbursed charity costs. Medicaid extension to adults would not relieve all local unreimbursed costs due to ineligible adults, such as undocumented immigrants, people served with incomes above 138% FPL or health care for incarcerated adults other than inpatient hospital stays. 2016 is the first full year of implementation; the federal match rate falls to 95 percent in 2017 and to 90 percent by 2020. For full county-level data, see Appendix C, and for further notes and cautions in interpreting these data, see Appendix A, in "Smart, Affordable and Fair: Why Texas Should Extend Medicaid to Low-Income Adults," at http://www.mhm.org/images/stories/advocacy_and_public_policy/Smart%20Affordable%20and%20Fair_FNL_FULL.pdf.

Impact of Medicaid Extension and Local Spending for Health CareHouse District 27 - Representative Ron Reynolds
County
2014-2017 New
Local Tax
Revenue (Adult
Expansion)
2011 County
Indigent
Healthcare &
Unreimbursed
Jail Healthcare
Costs
2011 Total
Hospital District
or City/County
Unreimbursed
Healthcare
Expenditures
2010 Total
Hospital Charity
Care Costs
Total
Unreimbursed
Charity Care
Costs for Local
Jurisdictions &
Hospitals
2014-2017 Adults
Federal Funds
Limited
Scenario
2014-2017 Adults
Federal Funds
Moderate
Scenario
2014-2017
Adults State
Funds Moderate
Scenario
2014-2017 Adults
Federal Funds
Enhanced Scenario
Statewide Total 2,101,392,352$ 258,927,030$ 2,544,037,688$ 1,836,673,862$ 4,380,711,550$ 14,274,023,031$ 22,962,552,386$ 1,283,318,611$ 31,030,479,514$
District Total 16,215,667$ 1,905,070$ 4,308,029$ 4,864,316$ 9,172,345$ 72,468,090$ 116,579,069$ 6,515,307$ 157,539,300$
Fort Bend (27%) 16,215,667$ 1,905,070$ 4,308,029$ 4,864,316$ 9,172,345$ 72,468,090$ 116,579,069$ 6,515,307$ 157,539,300$
ANALYSIS BY BILLY HAMILTON CONSULTING
Extending Medicaid to Low-Income Adults Will Save Local Tax Dollars and Grow the Economy
Download this one-pager at www.texasimpact.org/Local-Taxpayers-Win-With-Medicaid Download the full report at www.mhm.org
Download the executive summary at www.texasimpact.org
For more information about the report, “Smart, Affordable and Fair” call Texas Impact at 512/472-3903 or email [email protected]

Impact of Medicaid Extension and Local Spending for Health CareHouse District 27 - Representative Ron Reynolds
County
2016 Adults
<138% FPL
Enrollees
Moderate
Scenario
2016 Adults
Federal Funds
Moderate
Scenario
2016 Adults
State Funds
Moderate
Scenario
2016 Adults
All Funds
Moderate
Scenario
2016 Children
<200% FPL
Enrollees
Moderate
Scenario
2016 Children
Federal Funds
Moderate
Scenario
2016 Children
State Funds
Moderate
Scenario
2016 Children
All Funds
Moderate
Scenario
2016 Adults &
Children
All Funds
Moderate
Scenario
Statewide Total 1,004,771 7,615,086,733$ 292,887,951$ 7,907,974,684$ 550,189 1,500,495,384$ 769,325,576$ 2,269,820,960$ 10,177,795,644$
District Total 5,101 38,661,195$ 1,486,969$ 40,148,164$ 2,823 7,699,855$ 3,947,826$ 11,647,681$ 51,795,846$
Fort Bend (27%) 5,101 38,661,195$ 1,486,969$ 40,148,164$ 2,823 7,699,855$ 3,947,826$ 11,647,681$ 51,795,846$
Note: New local tax revenues are an allocation of the statewide estimate based on the county share of state personal income and further allocated in partial counties according to the share of county population. Variations in personal income or the concentration of direct health care spending in parts of counties could alter these allocations. Remaining columns reflect allocations of statewide estimates according to the county share of adults below 138% FPL or children below 200% FPL, as applicable, and further allocated for partial counties according to the share of the county's total population. Variations in percentages of adults below 138% FPL and children below 200% FPL could alter these estimates. Hospital charity cost data exclude certain hospitals, such as those exempt from reporting, hospitals that report by system, and others, resulting in a conservative estimate of unreimbursed charity costs. Medicaid extension to adults would not relieve all local unreimbursed costs due to ineligible adults, such as undocumented immigrants, people served with incomes above 138% FPL or health care for incarcerated adults other than inpatient hospital stays. 2016 is the first full year of implementation; the federal match rate falls to 95 percent in 2017 and to 90 percent by 2020. For full county-level data, see Appendix C, and for further notes and cautions in interpreting these data, see Appendix A, in "Smart, Affordable and Fair: Why Texas Should Extend Medicaid to Low-Income Adults," at http://www.mhm.org/images/stories/advocacy_and_public_policy/Smart%20Affordable%20and%20Fair_FNL_FULL.pdf.

Impact of Medicaid Extension and Local Spending for Health CareHouse District 28 - Representative John Zerwas
County
2014-2017 New Local Tax
Revenue (Adult Expansion)
2011 County Indigent
Healthcare & Unreimbursed Jail Healthcare
Costs
2011 Total Hospital District or City/County Unreimbursed
Healthcare Expenditures
2010 Total Hospital Charity
Care Costs
Total Unreimbursed Charity Care
Costs for Local Jurisdictions &
Hospitals
2014-2017 Adults Federal Funds
Limited Scenario
2014-2017 Adults Federal Funds
Moderate Scenario
2014-2017 Adults State
Funds Moderate Scenario
2014-2017 Adults Federal Funds
Enhanced Scenario
Statewide Total 2,101,392,352$ 258,927,030$ 2,544,037,688$ 1,836,673,862$ 4,380,711,550$ 14,274,023,031$ 22,962,552,386$ 1,283,318,611$ 31,030,479,514$
District Total 16,244,941$ 1,908,509$ 4,315,807$ 4,873,097$ 9,188,904$ 72,598,917$ 116,789,530$ 6,527,070$ 157,823,706$ Fort Bend (27%) 16,244,941$ 1,908,509$ 4,315,807$ 4,873,097$ 9,188,904$ 72,598,917$ 116,789,530$ 6,527,070$ 157,823,706$
ANALYSIS BY BILLY HAMILTON CONSULTING
Extending Medicaid to Low-Income Adults Will Save Local Tax Dollars and Grow the Economy
Download this one-pager at www.texasimpact.org/Local-Taxpayers-Win-With-Medicaid Download the full report at www.mhm.org
Download the executive summary at www.texasimpact.org
For more information about the report, “Smart, Affordable and Fair” call Texas Impact at 512/472-3903 or email [email protected]

Impact of Medicaid Extension and Local Spending for Health CareHouse District 28 - Representative John Zerwas
County
2016 Adults <138% FPL Enrollees Moderate Scenario
2016 Adults Federal Funds
Moderate Scenario
2016 Adults State Funds Moderate Scenario
2016 Adults All Funds Moderate Scenario
2016 Children <200% FPL Enrollees Moderate Scenario
2016 Children Federal Funds
Moderate Scenario
2016 Children State Funds Moderate Scenario
2016 Children All Funds Moderate Scenario
2016 Adults & Children
All Funds Moderate Scenario
Statewide Total 1,004,771 7,615,086,733$ 292,887,951$ 7,907,974,684$ 550,189 1,500,495,384$ 769,325,576$ 2,269,820,960$ 10,177,795,644$
District Total 5,110 38,730,990$ 1,489,653$ 40,220,644$ 2,828 7,713,756$ 3,954,953$ 11,668,709$ 51,889,353$ Fort Bend (27%) 5,110 38,730,990$ 1,489,653$ 40,220,644$ 2,828 7,713,756$ 3,954,953$ 11,668,709$ 51,889,353$ Note: New local tax revenues are an allocation of the statewide estimate based on the county share of state personal income and further allocated in partial counties according to the share of county population. Variations in personal income or the concentration of direct health care spending in parts of counties could alter these allocations. Remaining columns reflect allocations of statewide estimates according to the county share of adults below 138% FPL or children below 200% FPL, as applicable, and further allocated for partial counties according to the share of the county's total population. Variations in percentages of adults below 138% FPL and children below 200% FPL could alter these estimates. Hospital charity cost data exclude certain hospitals, such as those exempt from reporting, hospitals that report by system, and others, resulting in a conservative estimate of unreimbursed charity costs. Medicaid extension to adults would not relieve all local unreimbursed costs due to ineligible adults, such as undocumented immigrants, people served with incomes above 138% FPL or health care for incarcerated adults other than inpatient hospital stays. 2016 is the first full year of implementation; the federal match rate falls to 95 percent in 2017 and to 90 percent by 2020. For full county-level data, see Appendix C, and for further notes and cautions in interpreting these data, see Appendix A, in "Smart, Affordable and Fair: Why Texas Should Extend Medicaid to Low-Income Adults," at http://www.mhm.org/images/stories/advocacy_and_public_policy/Smart%20Affordable%20and%20Fair_FNL_FULL.pdf.

Impact of Medicaid Extension and Local Spending for Health CareHouse District 29 - Representative Ed Thompson
County
2014-2017 New Local Tax
Revenue (Adult Expansion)
2011 County Indigent
Healthcare & Unreimbursed Jail Healthcare
Costs
2011 Total Hospital District or City/County Unreimbursed
Healthcare Expenditures
2010 Total Hospital Charity
Care Costs
Total Unreimbursed Charity Care
Costs for Local Jurisdictions &
Hospitals
2014-2017 Adults Federal Funds
Limited Scenario
2014-2017 Adults Federal Funds
Moderate Scenario
2014-2017 Adults State
Funds Moderate Scenario
2014-2017 Adults Federal Funds
Enhanced Scenario
Statewide Total 2,101,392,352$ 258,927,030$ 2,544,037,688$ 1,836,673,862$ 4,380,711,550$ 14,274,023,031$ 22,962,552,386$ 1,283,318,611$ 31,030,479,514$
District Total 14,250,543$ 2,613,934$ 9,090,756$ 1,946,179$ 11,036,935$ 72,977,180$ 117,398,039$ 6,561,078$ 158,646,016$ Brazoria (56%) 14,250,543$ 2,613,934$ 9,090,756$ 1,946,179$ 11,036,935$ 72,977,180$ 117,398,039$ 6,561,078$ 158,646,016$
ANALYSIS BY BILLY HAMILTON CONSULTING
Extending Medicaid to Low-Income Adults Will Save Local Tax Dollars and Grow the Economy
Download this one-pager at www.texasimpact.org/Local-Taxpayers-Win-With-Medicaid Download the full report at www.mhm.org
Download the executive summary at www.texasimpact.org
For more information about the report, “Smart, Affordable and Fair” call Texas Impact at 512/472-3903 or email [email protected]

Impact of Medicaid Extension and Local Spending for Health CareHouse District 29 - Representative Ed Thompson
County
2016 Adults
<138% FPL
Enrollees
Moderate
Scenario
2016 Adults
Federal Funds
Moderate
Scenario
2016 Adults
State Funds
Moderate
Scenario
2016 Adults
All Funds
Moderate
Scenario
2016 Children
<200% FPL
Enrollees
Moderate
Scenario
2016 Children
Federal Funds
Moderate
Scenario
2016 Children
State Funds
Moderate
Scenario
2016 Children
All Funds
Moderate
Scenario
2016 Adults &
Children
All Funds
Moderate
Scenario
Statewide Total 1,004,771 7,615,086,733$ 292,887,951$ 7,907,974,684$ 550,189 1,500,495,384$ 769,325,576$ 2,269,820,960$ 10,177,795,644$
District Total 5,137 38,932,791$ 1,497,415$ 40,430,206$ 2,841 7,747,046$ 3,972,022$ 11,719,068$ 52,149,274$
Brazoria (56%) 5,137 38,932,791$ 1,497,415$ 40,430,206$ 2,841 7,747,046$ 3,972,022$ 11,719,068$ 52,149,274$
Note: New local tax revenues are an allocation of the statewide estimate based on the county share of state personal income and further allocated in partial counties according to the share of county population. Variations in personal income or the concentration of direct health care spending in parts of counties could alter these allocations. Remaining columns reflect allocations of statewide estimates according to the county share of adults below 138% FPL or children below 200% FPL, as applicable, and further allocated for partial counties according to the share of the county's total population. Variations in percentages of adults below 138% FPL and children below 200% FPL could alter these estimates. Hospital charity cost data exclude certain hospitals, such as those exempt from reporting, hospitals that report by system, and others, resulting in a conservative estimate of unreimbursed charity costs. Medicaid extension to adults would not relieve all local unreimbursed costs due to ineligible adults, such as undocumented immigrants, people served with incomes above 138% FPL or health care for incarcerated adults other than inpatient hospital stays. 2016 is the first full year of implementation; the federal match rate falls to 95 percent in 2017 and to 90 percent by 2020. For full county-level data, see Appendix C, and for further notes and cautions in interpreting these data, see Appendix A, in "Smart, Affordable and Fair: Why Texas Should Extend Medicaid to Low-Income Adults," at http://www.mhm.org/images/stories/advocacy_and_public_policy/Smart%20Affordable%20and%20Fair_FNL_FULL.pdf.
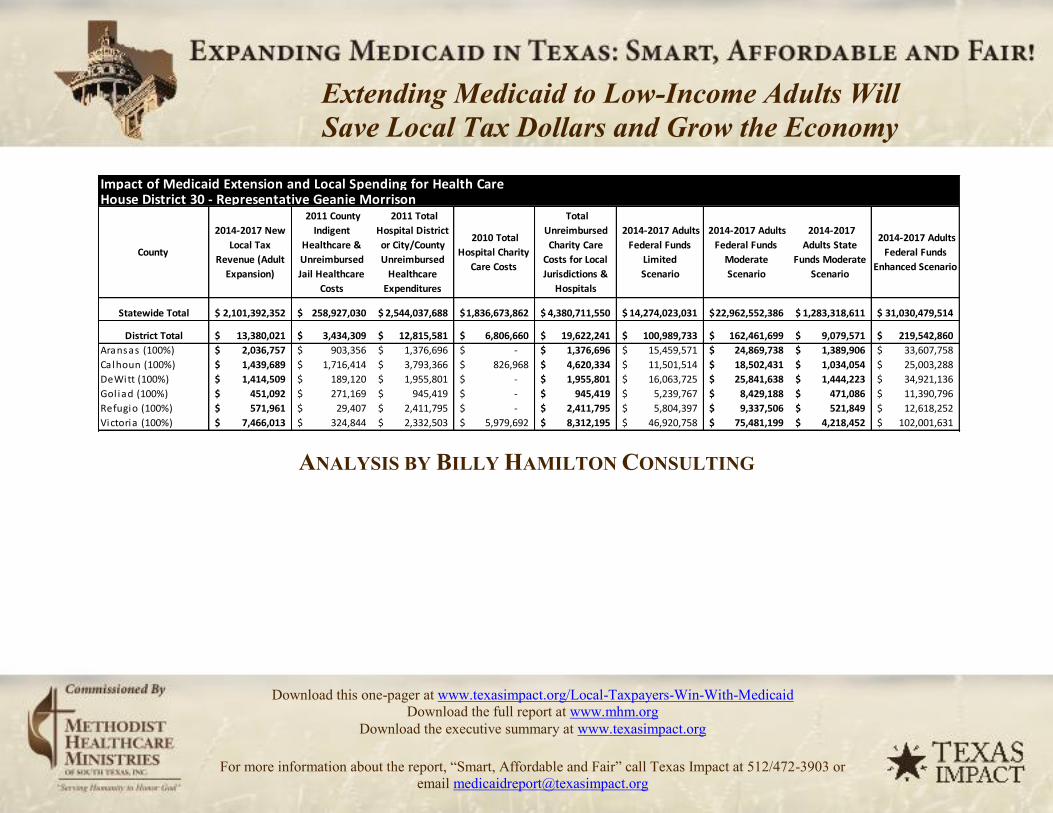
Impact of Medicaid Extension and Local Spending for Health CareHouse District 30 - Representative Geanie Morrison
County
2014-2017 New Local Tax
Revenue (Adult Expansion)
2011 County Indigent
Healthcare & Unreimbursed Jail Healthcare
Costs
2011 Total Hospital District or City/County Unreimbursed
Healthcare Expenditures
2010 Total Hospital Charity
Care Costs
Total Unreimbursed Charity Care
Costs for Local Jurisdictions &
Hospitals
2014-2017 Adults Federal Funds
Limited Scenario
2014-2017 Adults Federal Funds
Moderate Scenario
2014-2017 Adults State
Funds Moderate Scenario
2014-2017 Adults Federal Funds
Enhanced Scenario
Statewide Total 2,101,392,352$ 258,927,030$ 2,544,037,688$ 1,836,673,862$ 4,380,711,550$ 14,274,023,031$ 22,962,552,386$ 1,283,318,611$ 31,030,479,514$
District Total 13,380,021$ 3,434,309$ 12,815,581$ 6,806,660$ 19,622,241$ 100,989,733$ 162,461,699$ 9,079,571$ 219,542,860$ Aransas (100%) 2,036,757$ 903,356$ 1,376,696$ -$ 1,376,696$ 15,459,571$ 24,869,738$ 1,389,906$ 33,607,758$ Ca lhoun (100%) 1,439,689$ 1,716,414$ 3,793,366$ 826,968$ 4,620,334$ 11,501,514$ 18,502,431$ 1,034,054$ 25,003,288$ DeWitt (100%) 1,414,509$ 189,120$ 1,955,801$ -$ 1,955,801$ 16,063,725$ 25,841,638$ 1,444,223$ 34,921,136$ Gol iad (100%) 451,092$ 271,169$ 945,419$ -$ 945,419$ 5,239,767$ 8,429,188$ 471,086$ 11,390,796$ Refugio (100%) 571,961$ 29,407$ 2,411,795$ -$ 2,411,795$ 5,804,397$ 9,337,506$ 521,849$ 12,618,252$ Victoria (100%) 7,466,013$ 324,844$ 2,332,503$ 5,979,692$ 8,312,195$ 46,920,758$ 75,481,199$ 4,218,452$ 102,001,631$
ANALYSIS BY BILLY HAMILTON CONSULTING
Extending Medicaid to Low-Income Adults Will Save Local Tax Dollars and Grow the Economy
Download this one-pager at www.texasimpact.org/Local-Taxpayers-Win-With-Medicaid Download the full report at www.mhm.org
Download the executive summary at www.texasimpact.org
For more information about the report, “Smart, Affordable and Fair” call Texas Impact at 512/472-3903 or email [email protected]

Impact of Medicaid Extension and Local Spending for Health CareHouse District 30 - Representative Geanie Morrison
County
2016 Adults
<138% FPL
Enrollees
Moderate
Scenario
2016 Adults
Federal Funds
Moderate
Scenario
2016 Adults
State Funds
Moderate
Scenario
2016 Adults
All Funds
Moderate
Scenario
2016 Children
<200% FPL
Enrollees
Moderate
Scenario
2016 Children
Federal Funds
Moderate
Scenario
2016 Children
State Funds
Moderate
Scenario
2016 Children
All Funds
Moderate
Scenario
2016 Adults &
Children
All Funds
Moderate
Scenario
Statewide Total 1,004,771 7,615,086,733$ 292,887,951$ 7,907,974,684$ 550,189 1,500,495,384$ 769,325,576$ 2,269,820,960$ 10,177,795,644$
District Total 7,109 53,877,283$ 2,072,203$ 55,949,486$ 3,308 9,020,670$ 4,625,027$ 13,645,697$ 69,595,183$
Aransas (100%) 1,088 8,247,568$ 317,214$ 8,564,782$ 365 994,185$ 509,733$ 1,503,918$ 10,068,700$
Calhoun (100%) 810 6,135,974$ 235,999$ 6,371,973$ 462 1,258,727$ 645,367$ 1,904,094$ 8,276,067$
DeWitt (100%) 1,131 8,569,880$ 329,611$ 8,899,491$ 377 1,028,227$ 527,187$ 1,555,413$ 10,454,904$
Gol iad (100%) 369 2,795,377$ 107,515$ 2,902,892$ 137 372,409$ 190,940$ 563,349$ 3,466,241$
Refugio (100%) 409 3,096,603$ 119,100$ 3,215,703$ 163 444,184$ 227,740$ 671,924$ 3,887,627$
Victoria (100%) 3,303 25,031,881$ 962,765$ 25,994,645$ 1,805 4,922,938$ 2,524,061$ 7,446,999$ 33,441,645$
Note: New local tax revenues are an allocation of the statewide estimate based on the county share of state personal income and further allocated in partial counties according to the share of county population. Variations in personal income or the concentration of direct health care spending in parts of counties could alter these allocations. Remaining columns reflect allocations of statewide estimates according to the county share of adults below 138% FPL or children below 200% FPL, as applicable, and further allocated for partial counties according to the share of the county's total population. Variations in percentages of adults below 138% FPL and children below 200% FPL could alter these estimates. Hospital charity cost data exclude certain hospitals, such as those exempt from reporting, hospitals that report by system, and others, resulting in a conservative estimate of unreimbursed charity costs. Medicaid extension to adults would not relieve all local unreimbursed costs due to ineligible adults, such as undocumented immigrants, people served with incomes above 138% FPL or health care for incarcerated adults other than inpatient hospital stays. 2016 is the first full year of implementation; the federal match rate falls to 95 percent in 2017 and to 90 percent by 2020. For full county-level data, see Appendix C, and for further notes and cautions in interpreting these data, see Appendix A, in "Smart, Affordable and Fair: Why Texas Should Extend Medicaid to Low-Income Adults," at http://www.mhm.org/images/stories/advocacy_and_public_policy/Smart%20Affordable%20and%20Fair_FNL_FULL.pdf.
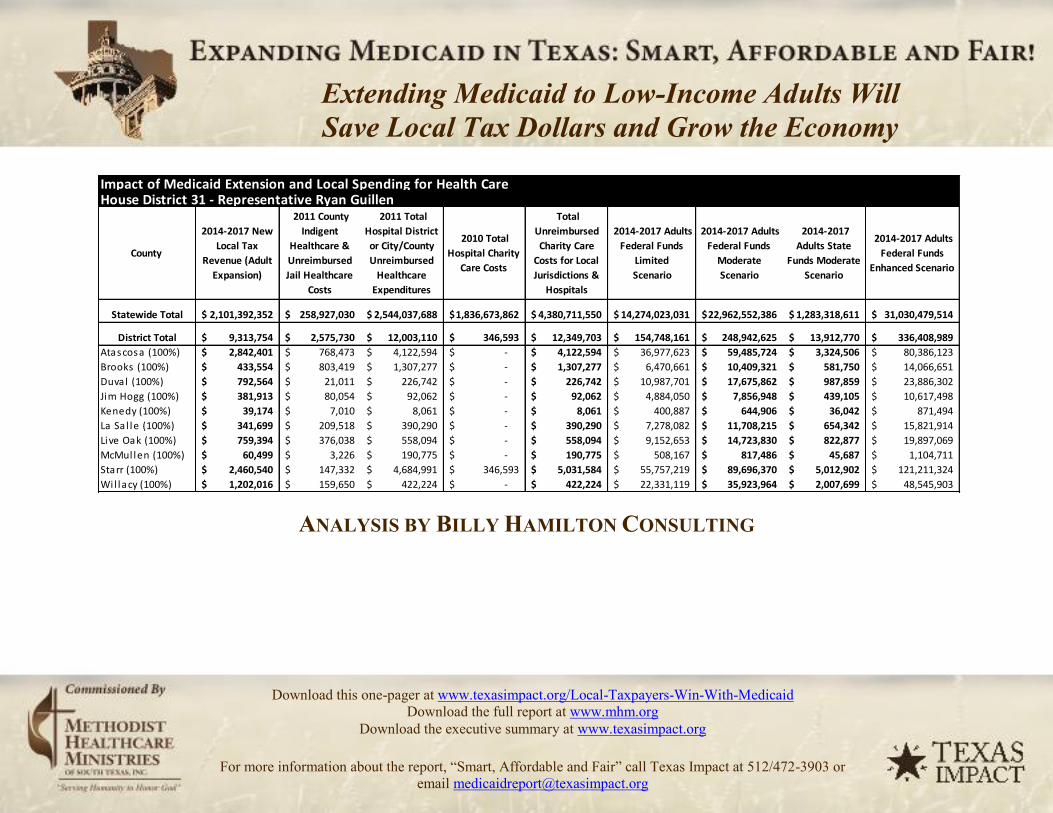
Impact of Medicaid Extension and Local Spending for Health CareHouse District 31 - Representative Ryan Guillen
County
2014-2017 New Local Tax
Revenue (Adult Expansion)
2011 County Indigent
Healthcare & Unreimbursed Jail Healthcare
Costs
2011 Total Hospital District or City/County Unreimbursed
Healthcare Expenditures
2010 Total Hospital Charity
Care Costs
Total Unreimbursed Charity Care
Costs for Local Jurisdictions &
Hospitals
2014-2017 Adults Federal Funds
Limited Scenario
2014-2017 Adults Federal Funds
Moderate Scenario
2014-2017 Adults State
Funds Moderate Scenario
2014-2017 Adults Federal Funds
Enhanced Scenario
Statewide Total 2,101,392,352$ 258,927,030$ 2,544,037,688$ 1,836,673,862$ 4,380,711,550$ 14,274,023,031$ 22,962,552,386$ 1,283,318,611$ 31,030,479,514$
District Total 9,313,754$ 2,575,730$ 12,003,110$ 346,593$ 12,349,703$ 154,748,161$ 248,942,625$ 13,912,770$ 336,408,989$ Atascosa (100%) 2,842,401$ 768,473$ 4,122,594$ -$ 4,122,594$ 36,977,623$ 59,485,724$ 3,324,506$ 80,386,123$ Brooks (100%) 433,554$ 803,419$ 1,307,277$ -$ 1,307,277$ 6,470,661$ 10,409,321$ 581,750$ 14,066,651$ Duval (100%) 792,564$ 21,011$ 226,742$ -$ 226,742$ 10,987,701$ 17,675,862$ 987,859$ 23,886,302$ Jim Hogg (100%) 381,913$ 80,054$ 92,062$ -$ 92,062$ 4,884,050$ 7,856,948$ 439,105$ 10,617,498$ Kenedy (100%) 39,174$ 7,010$ 8,061$ -$ 8,061$ 400,887$ 644,906$ 36,042$ 871,494$ La Sa l le (100%) 341,699$ 209,518$ 390,290$ -$ 390,290$ 7,278,082$ 11,708,215$ 654,342$ 15,821,914$ Live Oak (100%) 759,394$ 376,038$ 558,094$ -$ 558,094$ 9,152,653$ 14,723,830$ 822,877$ 19,897,069$ McMul len (100%) 60,499$ 3,226$ 190,775$ -$ 190,775$ 508,167$ 817,486$ 45,687$ 1,104,711$ Starr (100%) 2,460,540$ 147,332$ 4,684,991$ 346,593$ 5,031,584$ 55,757,219$ 89,696,370$ 5,012,902$ 121,211,324$ Wi l lacy (100%) 1,202,016$ 159,650$ 422,224$ -$ 422,224$ 22,331,119$ 35,923,964$ 2,007,699$ 48,545,903$
ANALYSIS BY BILLY HAMILTON CONSULTING
Extending Medicaid to Low-Income Adults Will Save Local Tax Dollars and Grow the Economy
Download this one-pager at www.texasimpact.org/Local-Taxpayers-Win-With-Medicaid Download the full report at www.mhm.org
Download the executive summary at www.texasimpact.org
For more information about the report, “Smart, Affordable and Fair” call Texas Impact at 512/472-3903 or email [email protected]

Impact of Medicaid Extension and Local Spending for Health CareHouse District 31 - Representative Ryan Guillen
County
2016 Adults
<138% FPL
Enrollees
Moderate
Scenario
2016 Adults
Federal Funds
Moderate
Scenario
2016 Adults
State Funds
Moderate
Scenario
2016 Adults
All Funds
Moderate
Scenario
2016 Children
<200% FPL
Enrollees
Moderate
Scenario
2016 Children
Federal Funds
Moderate
Scenario
2016 Children
State Funds
Moderate
Scenario
2016 Children
All Funds
Moderate
Scenario
2016 Adults &
Children
All Funds
Moderate Scenario
Statewide Total 1,004,771 7,615,086,733$ 292,887,951$ 7,907,974,684$ 550,189 1,500,495,384$ 769,325,576$ 2,269,820,960$ 10,177,795,644$
District Total 10,893 82,557,011$ 3,175,270$ 85,732,280$ 5,280 14,400,507$ 7,383,347$ 21,783,854$ 107,516,134$
Atascosa (100%) 2,603 19,727,291$ 758,742$ 20,486,033$ 1,239 3,380,393$ 1,733,176$ 5,113,569$ 25,599,602$
Brooks (100%) 455 3,452,050$ 132,771$ 3,584,821$ 221 602,499$ 308,910$ 911,409$ 4,496,230$
Duval (100%) 773 5,861,858$ 225,456$ 6,087,314$ 334 911,336$ 467,255$ 1,378,591$ 7,465,905$
Jim Hogg (100%) 344 2,605,605$ 100,216$ 2,705,820$ 168 458,129$ 234,889$ 693,018$ 3,398,839$
Kenedy (100%) 28 213,870$ 8,226$ 222,096$ 10 28,300$ 14,510$ 42,810$ 264,906$
La Sa l le (100%) 512 3,882,803$ 149,339$ 4,032,142$ 162 440,903$ 226,057$ 666,960$ 4,699,102$
Live Oak (100%) 644 4,882,874$ 187,803$ 5,070,676$ 193 527,033$ 270,217$ 797,250$ 5,867,927$
McMul len (100%) 36 271,103$ 10,427$ 281,530$ 11 29,120$ 14,930$ 44,050$ 325,581$
Starr (100%) 3,925 29,746,068$ 1,144,080$ 30,890,147$ 2,290 6,246,057$ 3,202,443$ 9,448,501$ 40,338,648$
Wil lacy (100%) 1,572 11,913,488$ 458,211$ 12,371,700$ 651 1,776,736$ 910,958$ 2,687,695$ 15,059,394$
Note: New local tax revenues are an allocation of the statewide estimate based on the county share of state personal income and further allocated in partial counties according to the share of county population. Variations in personal income or the concentration of direct health care spending in parts of counties could alter these allocations. Remaining columns reflect allocations of statewide estimates according to the county share of adults below 138% FPL or children below 200% FPL, as applicable, and further allocated for partial counties according to the share of the county's total population. Variations in percentages of adults below 138% FPL and children below 200% FPL could alter these estimates. Hospital charity cost data exclude certain hospitals, such as those exempt from reporting, hospitals that report by system, and others, resulting in a conservative estimate of unreimbursed charity costs. Medicaid extension to adults would not relieve all local unreimbursed costs due to ineligible adults, such as undocumented immigrants, people served with incomes above 138% FPL or health care for incarcerated adults other than inpatient hospital stays. 2016 is the first full year of implementation; the federal match rate falls to 95 percent in 2017 and to 90 percent by 2020. For full county-level data, see Appendix C, and for further notes and cautions in interpreting these data, see Appendix A, in "Smart, Affordable and Fair: Why Texas Should Extend Medicaid to Low-Income Adults," at http://www.mhm.org/images/stories/advocacy_and_public_policy/Smart%20Affordable%20and%20Fair_FNL_FULL.pdf.

Impact of Medicaid Extension and Local Spending for Health CareHouse District 32 - Representative Todd Hunter
County
2014-2017 New Local Tax
Revenue (Adult Expansion)
2011 County Indigent
Healthcare & Unreimbursed Jail Healthcare
Costs
2011 Total Hospital District or City/County Unreimbursed
Healthcare Expenditures
2010 Total Hospital Charity
Care Costs
Total Unreimbursed Charity Care
Costs for Local Jurisdictions &
Hospitals
2014-2017 Adults Federal Funds
Limited Scenario
2014-2017 Adults Federal Funds
Moderate Scenario
2014-2017 Adults State
Funds Moderate Scenario
2014-2017 Adults Federal Funds
Enhanced Scenario
Statewide Total 2,101,392,352$ 258,927,030$ 2,544,037,688$ 1,836,673,862$ 4,380,711,550$ 14,274,023,031$ 22,962,552,386$ 1,283,318,611$ 31,030,479,514$
District Total 13,298,453$ 18,187$ 17,570,750$ 23,695,575$ 41,266,325$ 129,231,881$ 207,894,707$ 11,618,706$ 280,938,824$ Nueces (49%) 13,298,453$ 18,187$ 17,570,750$ 23,695,575$ 41,266,325$ 129,231,881$ 207,894,707$ 11,618,706$ 280,938,824$
ANALYSIS BY BILLY HAMILTON CONSULTING
Extending Medicaid to Low-Income Adults Will Save Local Tax Dollars and Grow the Economy
Download this one-pager at www.texasimpact.org/Local-Taxpayers-Win-With-Medicaid Download the full report at www.mhm.org
Download the executive summary at www.texasimpact.org
For more information about the report, “Smart, Affordable and Fair” call Texas Impact at 512/472-3903 or email [email protected]

Impact of Medicaid Extension and Local Spending for Health CareHouse District 32 - Representative Todd Hunter
County
2016 Adults <138% FPL Enrollees Moderate Scenario
2016 Adults Federal Funds
Moderate Scenario
2016 Adults State Funds Moderate Scenario
2016 Adults All Funds Moderate Scenario
2016 Children <200% FPL Enrollees Moderate Scenario
2016 Children Federal Funds
Moderate Scenario
2016 Children State Funds Moderate Scenario
2016 Children All Funds Moderate Scenario
2016 Adults & Children
All Funds Moderate Scenario
Statewide Total 1,004,771 7,615,086,733$ 292,887,951$ 7,907,974,684$ 550,189 1,500,495,384$ 769,325,576$ 2,269,820,960$ 10,177,795,644$
District Total 9,097 68,944,262$ 2,651,702$ 71,595,964$ 3,793 10,344,388$ 5,303,716$ 15,648,104$ 87,244,068$ Nueces (49%) 9,097 68,944,262$ 2,651,702$ 71,595,964$ 3,793 10,344,388$ 5,303,716$ 15,648,104$ 87,244,068$ Note: New local tax revenues are an allocation of the statewide estimate based on the county share of state personal income and further allocated in partial counties according to the share of county
population. Variations in personal income or the concentration of direct health care spending in parts of counties could alter these allocations. Remaining columns reflect allocations of statewide
estimates according to the county share of adults below 138% FPL or children below 200% FPL, as applicable, and further allocated for partial counties according to the share of the county's total
population. Variations in percentages of adults below 138% FPL and children below 200% FPL could alter these estimates. Hospital charity cost data exclude certain hospitals, such as those exempt
from reporting, hospitals that report by system, and others, resulting in a conservative estimate of unreimbursed charity costs. Medicaid extension to adults would not relieve all local unreimbursed
costs due to ineligible adults, such as undocumented immigrants, people served with incomes above 138% FPL or health care for incarcerated adults other than inpatient hospital stays. 2016 is the first
full year of implementation; the federal match rate falls to 95 percent in 2017 and to 90 percent by 2020. For full county-level data, see Appendix C, and for further notes and cautions in interpreting
these data, see Appendix A, in "Smart, Affordable and Fair: Why Texas Should Extend Medicaid to Low-Income Adults," at
http://www.mhm.org/images/stories/advocacy_and_public_policy/Smart%20Affordable%20and%20Fair_FNL_FULL.pdf.

Impact of Medicaid Extension and Local Spending for Health CareHouse District 33 - Representative Scott Turner
County
2014-2017 New Local Tax
Revenue (Adult Expansion)
2011 County Indigent
Healthcare & Unreimbursed Jail Healthcare
Costs
2011 Total Hospital District or City/County Unreimbursed
Healthcare Expenditures
2010 Total Hospital Charity
Care Costs
Total Unreimbursed Charity Care
Costs for Local Jurisdictions &
Hospitals
2014-2017 Adults Federal Funds
Limited Scenario
2014-2017 Adults Federal Funds
Moderate Scenario
2014-2017 Adults State
Funds Moderate Scenario
2014-2017 Adults Federal Funds
Enhanced Scenario
Statewide Total 2,101,392,352$ 258,927,030$ 2,544,037,688$ 1,836,673,862$ 4,380,711,550$ 14,274,023,031$ 22,962,552,386$ 1,283,318,611$ 31,030,479,514$
District Total 18,495,810$ 1,825,803$ 2,332,473$ -$ 2,332,473$ 51,597,930$ 83,005,342$ 4,638,957$ 112,169,393$ Col l in (12%) 10,214,408$ 819,627$ 1,083,371$ -$ 1,083,371$ 29,633,820$ 47,671,784$ 2,664,255$ 64,421,337$ Rockwal l (100%) 8,281,402$ 1,006,175$ 1,249,102$ -$ 1,249,102$ 21,964,109$ 35,333,558$ 1,974,703$ 47,748,056$
ANALYSIS BY BILLY HAMILTON CONSULTING
Extending Medicaid to Low-Income Adults Will Save Local Tax Dollars and Grow the Economy
Download this one-pager at www.texasimpact.org/Local-Taxpayers-Win-With-Medicaid Download the full report at www.mhm.org
Download the executive summary at www.texasimpact.org
For more information about the report, “Smart, Affordable and Fair” call Texas Impact at 512/472-3903 or email [email protected]
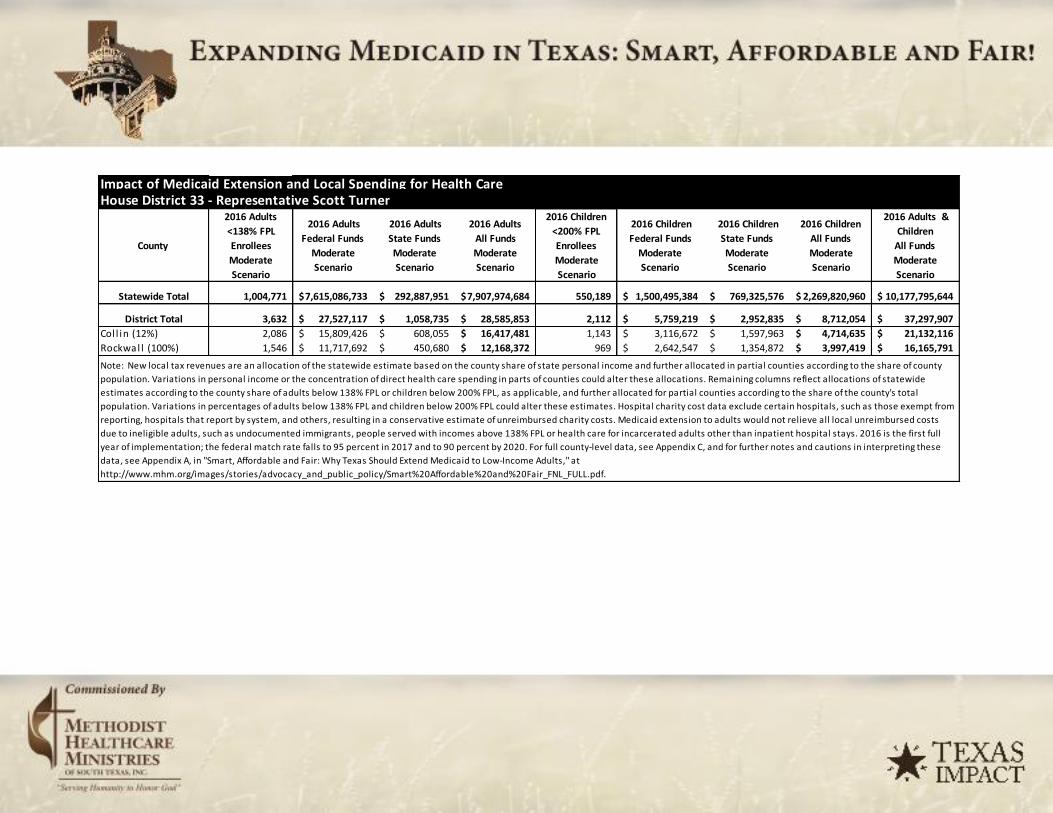
Impact of Medicaid Extension and Local Spending for Health CareHouse District 33 - Representative Scott Turner
County
2016 Adults <138% FPL Enrollees Moderate Scenario
2016 Adults Federal Funds
Moderate Scenario
2016 Adults State Funds Moderate Scenario
2016 Adults All Funds Moderate Scenario
2016 Children <200% FPL Enrollees Moderate Scenario
2016 Children Federal Funds
Moderate Scenario
2016 Children State Funds Moderate Scenario
2016 Children All Funds Moderate Scenario
2016 Adults & Children
All Funds Moderate Scenario
Statewide Total 1,004,771 7,615,086,733$ 292,887,951$ 7,907,974,684$ 550,189 1,500,495,384$ 769,325,576$ 2,269,820,960$ 10,177,795,644$
District Total 3,632 27,527,117$ 1,058,735$ 28,585,853$ 2,112 5,759,219$ 2,952,835$ 8,712,054$ 37,297,907$ Col l in (12%) 2,086 15,809,426$ 608,055$ 16,417,481$ 1,143 3,116,672$ 1,597,963$ 4,714,635$ 21,132,116$ Rockwal l (100%) 1,546 11,717,692$ 450,680$ 12,168,372$ 969 2,642,547$ 1,354,872$ 3,997,419$ 16,165,791$ Note: New local tax revenues are an allocation of the statewide estimate based on the county share of state personal income and further allocated in partial counties according to the share of county population. Variations in personal income or the concentration of direct health care spending in parts of counties could alter these allocations. Remaining columns reflect allocations of statewide estimates according to the county share of adults below 138% FPL or children below 200% FPL, as applicable, and further allocated for partial counties according to the share of the county's total population. Variations in percentages of adults below 138% FPL and children below 200% FPL could alter these estimates. Hospital charity cost data exclude certain hospitals, such as those exempt from reporting, hospitals that report by system, and others, resulting in a conservative estimate of unreimbursed charity costs. Medicaid extension to adults would not relieve all local unreimbursed costs due to ineligible adults, such as undocumented immigrants, people served with incomes above 138% FPL or health care for incarcerated adults other than inpatient hospital stays. 2016 is the first full year of implementation; the federal match rate falls to 95 percent in 2017 and to 90 percent by 2020. For full county-level data, see Appendix C, and for further notes and cautions in interpreting these data, see Appendix A, in "Smart, Affordable and Fair: Why Texas Should Extend Medicaid to Low-Income Adults," at http://www.mhm.org/images/stories/advocacy_and_public_policy/Smart%20Affordable%20and%20Fair_FNL_FULL.pdf.

Impact of Medicaid Extension and Local Spending for Health CareHouse District 34 - Representative Abel Herrero
County
2014-2017 New Local Tax
Revenue (Adult Expansion)
2011 County Indigent
Healthcare & Unreimbursed Jail Healthcare
Costs
2011 Total Hospital District or City/County Unreimbursed
Healthcare Expenditures
2010 Total Hospital Charity
Care Costs
Total Unreimbursed Charity Care
Costs for Local Jurisdictions &
Hospitals
2014-2017 Adults Federal Funds
Limited Scenario
2014-2017 Adults Federal Funds
Moderate Scenario
2014-2017 Adults State
Funds Moderate Scenario
2014-2017 Adults Federal Funds
Enhanced Scenario
Statewide Total 2,101,392,352$ 258,927,030$ 2,544,037,688$ 1,836,673,862$ 4,380,711,550$ 14,274,023,031$ 22,962,552,386$ 1,283,318,611$ 31,030,479,514$
District Total 13,782,000$ 18,849$ 18,209,642$ 24,557,173$ 42,766,815$ 133,930,899$ 215,453,994$ 12,041,175$ 291,154,078$ Nueces (51%) 13,782,000$ 18,849$ 18,209,642$ 24,557,173$ 42,766,815$ 133,930,899$ 215,453,994$ 12,041,175$ 291,154,078$
ANALYSIS BY BILLY HAMILTON CONSULTING
Extending Medicaid to Low-Income Adults Will Save Local Tax Dollars and Grow the Economy
Download this one-pager at www.texasimpact.org/Local-Taxpayers-Win-With-Medicaid Download the full report at www.mhm.org
Download the executive summary at www.texasimpact.org
For more information about the report, “Smart, Affordable and Fair” call Texas Impact at 512/472-3903 or email [email protected]

Impact of Medicaid Extension and Local Spending for Health CareHouse District 34 - Representative Abel Herrero
County
2016 Adults <138% FPL Enrollees Moderate Scenario
2016 Adults Federal Funds
Moderate Scenario
2016 Adults State Funds Moderate Scenario
2016 Adults All Funds Moderate Scenario
2016 Children <200% FPL Enrollees Moderate Scenario
2016 Children Federal Funds
Moderate Scenario
2016 Children State Funds Moderate Scenario
2016 Children All Funds Moderate Scenario
2016 Adults & Children
All Funds Moderate Scenario
Statewide Total 1,004,771 7,615,086,733$ 292,887,951$ 7,907,974,684$ 550,189 1,500,495,384$ 769,325,576$ 2,269,820,960$ 10,177,795,644$
District Total 9,428 71,451,153$ 2,748,121$ 74,199,275$ 3,931 10,720,521$ 5,496,566$ 16,217,087$ 90,416,362$ Nueces (51%) 9,428 71,451,153$ 2,748,121$ 74,199,275$ 3,931 10,720,521$ 5,496,566$ 16,217,087$ 90,416,362$
Note: New local tax revenues are an allocation of the statewide estimate based on the county share of state personal income and further allocated in partial counties according to the share of county
population. Variations in personal income or the concentration of direct health care spending in parts of counties could alter these allocations. Remaining columns reflect allocations of statewide
estimates according to the county share of adults below 138% FPL or children below 200% FPL, as applicable, and further allocated for partial counties according to the share of the county's total
population. Variations in percentages of adults below 138% FPL and children below 200% FPL could alter these estimates. Hospital charity cost data exclude certain hospitals, such as those exempt
from reporting, hospitals that report by system, and others, resulting in a conservative estimate of unreimbursed charity costs. Medicaid extension to adults would not relieve all local unreimbursed
costs due to ineligible adults, such as undocumented immigrants, people served with incomes above 138% FPL or health care for incarcerated adults other than inpatient hospital stays. 2016 is the first
full year of implementation; the federal match rate falls to 95 percent in 2017 and to 90 percent by 2020. For full county-level data, see Appendix C, and for further notes and cautions in interpreting
these data, see Appendix A, in "Smart, Affordable and Fair: Why Texas Should Extend Medicaid to Low-Income Adults," at
http://www.mhm.org/images/stories/advocacy_and_public_policy/Smart%20Affordable%20and%20Fair_FNL_FULL.pdf.

Impact of Medicaid Extension and Local Spending for Health CareHouse District 35 - Representative Oscar Longoria
County
2014-2017 New Local Tax
Revenue (Adult Expansion)
2011 County Indigent
Healthcare & Unreimbursed Jail Healthcare
Costs
2011 Total Hospital District or City/County Unreimbursed
Healthcare Expenditures
2010 Total Hospital Charity
Care Costs
Total Unreimbursed Charity Care
Costs for Local Jurisdictions &
Hospitals
2014-2017 Adults Federal Funds
Limited Scenario
2014-2017 Adults Federal Funds
Moderate Scenario
2014-2017 Adults State
Funds Moderate Scenario
2014-2017 Adults Federal Funds
Enhanced Scenario
Statewide Total 2,101,392,352$ 258,927,030$ 2,544,037,688$ 1,836,673,862$ 4,380,711,550$ 14,274,023,031$ 22,962,552,386$ 1,283,318,611$ 31,030,479,514$
District Total 8,024,642$ 1,289,602$ 3,711,312$ 13,944,273$ 17,655,585$ 133,829,036$ 215,290,128$ 12,032,017$ 290,932,637$ Cameron (17%) 3,398,719$ 921,518$ 1,390,303$ 4,582,482$ 5,972,785$ 59,968,553$ 96,471,124$ 5,391,526$ 130,366,397$ Hidalgo (13%) 4,625,923$ 368,084$ 2,321,010$ 9,361,790$ 11,682,800$ 73,860,483$ 118,819,005$ 6,640,492$ 160,566,240$
ANALYSIS BY BILLY HAMILTON CONSULTING
Extending Medicaid to Low-Income Adults Will Save Local Tax Dollars and Grow the Economy
Download this one-pager at www.texasimpact.org/Local-Taxpayers-Win-With-Medicaid Download the full report at www.mhm.org
Download the executive summary at www.texasimpact.org
For more information about the report, “Smart, Affordable and Fair” call Texas Impact at 512/472-3903 or email [email protected]

Impact of Medicaid Extension and Local Spending for Health CareHouse District 35 - Representative Oscar Longoria
County
2016 Adults <138% FPL Enrollees Moderate Scenario
2016 Adults Federal Funds
Moderate Scenario
2016 Adults State Funds Moderate Scenario
2016 Adults All Funds Moderate Scenario
2016 Children <200% FPL Enrollees Moderate Scenario
2016 Children Federal Funds
Moderate Scenario
2016 Children State Funds Moderate Scenario
2016 Children All Funds Moderate Scenario
2016 Adults & Children
All Funds Moderate Scenario
Statewide Total 1,004,771 7,615,086,733$ 292,887,951$ 7,907,974,684$ 550,189 1,500,495,384$ 769,325,576$ 2,269,820,960$ 10,177,795,644$
District Total 9,420 71,396,810$ 2,746,031$ 74,142,842$ 6,780 18,490,437$ 9,480,313$ 27,970,750$ 102,113,592$ Cameron (17%) 4,221 31,992,784$ 1,230,492$ 33,223,275$ 2,744 7,483,004$ 3,836,644$ 11,319,648$ 44,542,923$ Hidalgo (13%) 5,199 39,404,027$ 1,515,539$ 40,919,566$ 4,036 11,007,433$ 5,643,670$ 16,651,103$ 57,570,669$
Note: New local tax revenues are an allocation of the statewide estimate based on the county share of state personal income and further allocated in partial counties according to the share of county population. Variations in personal income or the concentration of direct health care spending in parts of counties could alter these allocations. Remaining columns reflect allocations of statewide estimates according to the county share of adults below 138% FPL or children below 200% FPL, as applicable, and further allocated for partial counties according to the share of the county's total population. Variations in percentages of adults below 138% FPL and children below 200% FPL could alter these estimates. Hospital charity cost data exclude certain hospitals, such as those exempt from reporting, hospitals that report by system, and others, resulting in a conservative estimate of unreimbursed charity costs. Medicaid extension to adults would not relieve all local unreimbursed costs due to ineligible adults, such as undocumented immigrants, people served with incomes above 138% FPL or health care for incarcerated adults other than inpatient hospital stays. 2016 is the first full year of implementation; the federal match rate falls to 95 percent in 2017 and to 90 percent by 2020. For full county-level data, see Appendix C, and for further notes and cautions in interpreting these data, see Appendix A, in "Smart, Affordable and Fair: Why Texas Should Extend Medicaid to Low-Income Adults," at http://www.mhm.org/images/stories/advocacy_and_public_policy/Smart%20Affordable%20and%20Fair_FNL_FULL.pdf.

Impact of Medicaid Extension and Local Spending for Health CareHouse District 36 - Representative Sergio Muñoz, Jr.
County
2014-2017 New
Local Tax
Revenue (Adult
Expansion)
2011 County
Indigent
Healthcare &
Unreimbursed
Jail Healthcare
Costs
2011 Total
Hospital District
or City/County
Unreimbursed
Healthcare
Expenditures
2010 Total
Hospital Charity
Care Costs
Total
Unreimbursed
Charity Care
Costs for Local
Jurisdictions &
Hospitals
2014-2017 Adults
Federal Funds
Limited
Scenario
2014-2017 Adults
Federal Funds
Moderate
Scenario
2014-2017
Adults State
Funds Moderate
Scenario
2014-2017 Adults
Federal Funds
Enhanced Scenario
Statewide Total 2,101,392,352$ 258,927,030$ 2,544,037,688$ 1,836,673,862$ 4,380,711,550$ 14,274,023,031$ 22,962,552,386$ 1,283,318,611$ 31,030,479,514$
District Total 7,838,909$ 623,741$ 3,933,093$ 15,864,126$ 19,797,219$ 125,161,107$ 201,346,072$ 11,252,720$ 272,089,316$
Hidalgo (22%) 7,838,909$ 623,741$ 3,933,093$ 15,864,126$ 19,797,219$ 125,161,107$ 201,346,072$ 11,252,720$ 272,089,316$
ANALYSIS BY BILLY HAMILTON CONSULTING
Extending Medicaid to Low-Income Adults Will Save Local Tax Dollars and Grow the Economy
Download this one-pager at www.texasimpact.org/Local-Taxpayers-Win-With-Medicaid Download the full report at www.mhm.org
Download the executive summary at www.texasimpact.org
For more information about the report, “Smart, Affordable and Fair” call Texas Impact at 512/472-3903 or email [email protected]

Impact of Medicaid Extension and Local Spending for Health CareHouse District 36 - Representative Sergio Muñoz, Jr.
County
2016 Adults <138% FPL Enrollees Moderate Scenario
2016 Adults Federal Funds
Moderate Scenario
2016 Adults State Funds Moderate Scenario
2016 Adults All Funds Moderate Scenario
2016 Children <200% FPL Enrollees Moderate Scenario
2016 Children Federal Funds
Moderate Scenario
2016 Children State Funds Moderate Scenario
2016 Children All Funds Moderate Scenario
2016 Adults & Children
All Funds Moderate Scenario
Statewide Total 1,004,771 7,615,086,733$ 292,887,951$ 7,907,974,684$ 550,189 1,500,495,384$ 769,325,576$ 2,269,820,960$ 10,177,795,644$
District Total 8,810 66,772,534$ 2,568,174$ 69,340,708$ 6,839 18,652,769$ 9,563,543$ 28,216,312$ 97,557,021$ Hidalgo (22%) 8,810 66,772,534$ 2,568,174$ 69,340,708$ 6,839 18,652,769$ 9,563,543$ 28,216,312$ 97,557,021$ Note: New local tax revenues are an allocation of the statewide estimate based on the county share of state personal income and further allocated in partial counties according to the share of county population. Variations in personal income or the concentration of direct health care spending in parts of counties could alter these allocations. Remaining columns reflect allocations of statewide estimates according to the county share of adults below 138% FPL or children below 200% FPL, as applicable, and further allocated for partial counties according to the share of the county's total population. Variations in percentages of adults below 138% FPL and children below 200% FPL could alter these estimates. Hospital charity cost data exclude certain hospitals, such as those exempt from reporting, hospitals that report by system, and others, resulting in a conservative estimate of unreimbursed charity costs. Medicaid extension to adults would not relieve all local unreimbursed costs due to ineligible adults, such as undocumented immigrants, people served with incomes above 138% FPL or health care for incarcerated adults other than inpatient hospital stays. 2016 is the first full year of implementation; the federal match rate falls to 95 percent in 2017 and to 90 percent by 2020. For full county-level data, see Appendix C, and for further notes and cautions in interpreting these data, see Appendix A, in "Smart, Affordable and Fair: Why Texas Should Extend Medicaid to Low-Income Adults," at http://www.mhm.org/images/stories/advocacy_and_public_policy/Smart%20Affordable%20and%20Fair_FNL_FULL.pdf.

Impact of Medicaid Extension and Local Spending for Health CareHouse District 37 - Representative René Oliveira
County
2014-2017 New Local Tax
Revenue (Adult Expansion)
2011 County Indigent
Healthcare & Unreimbursed Jail Healthcare
Costs
2011 Total Hospital District or City/County Unreimbursed
Healthcare Expenditures
2010 Total Hospital Charity
Care Costs
Total Unreimbursed Charity Care
Costs for Local Jurisdictions &
Hospitals
2014-2017 Adults Federal Funds
Limited Scenario
2014-2017 Adults Federal Funds
Moderate Scenario
2014-2017 Adults State
Funds Moderate Scenario
2014-2017 Adults Federal Funds
Enhanced Scenario
Statewide Total 2,101,392,352$ 258,927,030$ 2,544,037,688$ 1,836,673,862$ 4,380,711,550$ 14,274,023,031$ 22,962,552,386$ 1,283,318,611$ 31,030,479,514$
District Total 8,338,643$ 2,260,913$ 3,411,061$ 11,242,967$ 14,654,028$ 147,130,832$ 236,688,664$ 13,227,927$ 319,849,580$ Cameron (42%) 8,338,643$ 2,260,913$ 3,411,061$ 11,242,967$ 14,654,028$ 147,130,832$ 236,688,664$ 13,227,927$ 319,849,580$
ANALYSIS BY BILLY HAMILTON CONSULTING
Extending Medicaid to Low-Income Adults Will Save Local Tax Dollars and Grow the Economy
Download this one-pager at www.texasimpact.org/Local-Taxpayers-Win-With-Medicaid Download the full report at www.mhm.org
Download the executive summary at www.texasimpact.org
For more information about the report, “Smart, Affordable and Fair” call Texas Impact at 512/472-3903 or email [email protected]

Impact of Medicaid Extension and Local Spending for Health CareHouse District 37 - Representative René Oliveira
County
2016 Adults <138% FPL Enrollees Moderate Scenario
2016 Adults Federal Funds
Moderate Scenario
2016 Adults State Funds Moderate Scenario
2016 Adults All Funds Moderate Scenario
2016 Children <200% FPL Enrollees Moderate Scenario
2016 Children Federal Funds
Moderate Scenario
2016 Children State Funds Moderate Scenario
2016 Children All Funds Moderate Scenario
2016 Adults & Children
All Funds Moderate Scenario
Statewide Total 1,004,771 7,615,086,733$ 292,887,951$ 7,907,974,684$ 550,189 1,500,495,384$ 769,325,576$ 2,269,820,960$ 10,177,795,644$
District Total 10,357 78,493,221$ 3,018,970$ 81,512,191$ 6,732 18,359,299$ 9,413,077$ 27,772,375$ 109,284,567$ Cameron (42%) 10,357 78,493,221$ 3,018,970$ 81,512,191$ 6,732 18,359,299$ 9,413,077$ 27,772,375$ 109,284,567$
Note: New local tax revenues are an allocation of the statewide estimate based on the county share of state personal income and further allocated in partial counties according to the share of county population. Variations in personal income or the concentration of direct health care spending in parts of counties could alter these allocations. Remaining columns reflect allocations of statewide estimates according to the county share of adults below 138% FPL or children below 200% FPL, as applicable, and further allocated for partial counties according to the share of the county's total population. Variations in percentages of adults below 138% FPL and children below 200% FPL could alter these estimates. Hospital charity cost data exclude certain hospitals, such as those exempt from reporting, hospitals that report by system, and others, resulting in a conservative estimate of unreimbursed charity costs. Medicaid extension to adults would not relieve all local unreimbursed costs due to ineligible adults, such as undocumented immigrants, people served with incomes above 138% FPL or health care for incarcerated adults other than inpatient hospital stays. 2016 is the first full year of implementation; the federal match rate falls to 95 percent in 2017 and to 90 percent by 2020. For full county-level data, see Appendix C, and for further notes and cautions in interpreting these data, see Appendix A, in "Smart, Affordable and Fair: Why Texas Should Extend Medicaid to Low-Income Adults," at http://www.mhm.org/images/stories/advocacy_and_public_policy/Smart%20Affordable%20and%20Fair_FNL_FULL.pdf.

Impact of Medicaid Extension and Local Spending for Health CareHouse District 38 - Representative Eddie Lucio III
County
2014-2017 New Local Tax
Revenue (Adult Expansion)
2011 County Indigent
Healthcare & Unreimbursed Jail Healthcare
Costs
2011 Total Hospital District or City/County Unreimbursed
Healthcare Expenditures
2010 Total Hospital Charity
Care Costs
Total Unreimbursed Charity Care
Costs for Local Jurisdictions &
Hospitals
2014-2017 Adults Federal Funds
Limited Scenario
2014-2017 Adults Federal Funds
Moderate Scenario
2014-2017 Adults State
Funds Moderate Scenario
2014-2017 Adults Federal Funds
Enhanced Scenario
Statewide Total 2,101,392,352$ 258,927,030$ 2,544,037,688$ 1,836,673,862$ 4,380,711,550$ 14,274,023,031$ 22,962,552,386$ 1,283,318,611$ 31,030,479,514$
District Total 8,295,541$ 2,249,226$ 3,393,430$ 11,184,853$ 14,578,283$ 146,370,327$ 235,465,243$ 13,159,553$ 318,196,308$ Cameron (41%) 8,295,541$ 2,249,226$ 3,393,430$ 11,184,853$ 14,578,283$ 146,370,327$ 235,465,243$ 13,159,553$ 318,196,308$
ANALYSIS BY BILLY HAMILTON CONSULTING
Extending Medicaid to Low-Income Adults Will Save Local Tax Dollars and Grow the Economy
Download this one-pager at www.texasimpact.org/Local-Taxpayers-Win-With-Medicaid Download the full report at www.mhm.org
Download the executive summary at www.texasimpact.org
For more information about the report, “Smart, Affordable and Fair” call Texas Impact at 512/472-3903 or email [email protected]

Impact of Medicaid Extension and Local Spending for Health CareHouse District 38 - Representative Eddie Lucio III
County
2016 Adults <138% FPL Enrollees Moderate Scenario
2016 Adults Federal Funds
Moderate Scenario
2016 Adults State Funds Moderate Scenario
2016 Adults All Funds Moderate Scenario
2016 Children <200% FPL Enrollees Moderate Scenario
2016 Children Federal Funds
Moderate Scenario
2016 Children State Funds Moderate Scenario
2016 Children All Funds Moderate Scenario
2016 Adults & Children
All Funds Moderate Scenario
Statewide Total 1,004,771 7,615,086,733$ 292,887,951$ 7,907,974,684$ 550,189 1,500,495,384$ 769,325,576$ 2,269,820,960$ 10,177,795,644$
District Total 10,303 78,087,497$ 3,003,365$ 81,090,862$ 6,697 18,264,401$ 9,364,421$ 27,628,823$ 108,719,685$ Cameron (41%) 10,303 78,087,497$ 3,003,365$ 81,090,862$ 6,697 18,264,401$ 9,364,421$ 27,628,823$ 108,719,685$ Note: New local tax revenues are an allocation of the statewide estimate based on the county share of state personal income and further allocated in partial counties according to the share of county population. Variations in personal income or the concentration of direct health care spending in parts of counties could alter these allocations. Remaining columns reflect allocations of statewide estimates according to the county share of adults below 138% FPL or children below 200% FPL, as applicable, and further allocated for partial counties according to the share of the county's total population. Variations in percentages of adults below 138% FPL and children below 200% FPL could alter these estimates. Hospital charity cost data exclude certain hospitals, such as those exempt from reporting, hospitals that report by system, and others, resulting in a conservative estimate of unreimbursed charity costs. Medicaid extension to adults would not relieve all local unreimbursed costs due to ineligible adults, such as undocumented immigrants, people served with incomes above 138% FPL or health care for incarcerated adults other than inpatient hospital stays. 2016 is the first full year of implementation; the federal match rate falls to 95 percent in 2017 and to 90 percent by 2020. For full county-level data, see Appendix C, and for further notes and cautions in interpreting these data, see Appendix A, in "Smart, Affordable and Fair: Why Texas Should Extend Medicaid to Low-Income Adults," at http://www.mhm.org/images/stories/advocacy_and_public_policy/Smart%20Affordable%20and%20Fair_FNL_FULL.pdf.

Impact of Medicaid Extension and Local Spending for Health CareHouse District 39 - Representative Armando Martinez
County
2014-2017 New Local Tax
Revenue (Adult Expansion)
2011 County Indigent
Healthcare & Unreimbursed Jail Healthcare
Costs
2011 Total Hospital District or City/County Unreimbursed
Healthcare Expenditures
2010 Total Hospital Charity
Care Costs
Total Unreimbursed Charity Care
Costs for Local Jurisdictions &
Hospitals
2014-2017 Adults Federal Funds
Limited Scenario
2014-2017 Adults Federal Funds
Moderate Scenario
2014-2017 Adults State
Funds Moderate Scenario
2014-2017 Adults Federal Funds
Enhanced Scenario
Statewide Total 2,101,392,352$ 258,927,030$ 2,544,037,688$ 1,836,673,862$ 4,380,711,550$ 14,274,023,031$ 22,962,552,386$ 1,283,318,611$ 31,030,479,514$
District Total 7,824,805$ 622,618$ 3,926,016$ 15,835,583$ 19,761,600$ 124,935,916$ 200,983,808$ 11,232,474$ 271,599,770$ Hidalgo (22%) 7,824,805$ 622,618$ 3,926,016$ 15,835,583$ 19,761,600$ 124,935,916$ 200,983,808$ 11,232,474$ 271,599,770$
ANALYSIS BY BILLY HAMILTON CONSULTING
Extending Medicaid to Low-Income Adults Will Save Local Tax Dollars and Grow the Economy
Download this one-pager at www.texasimpact.org/Local-Taxpayers-Win-With-Medicaid Download the full report at www.mhm.org
Download the executive summary at www.texasimpact.org
For more information about the report, “Smart, Affordable and Fair” call Texas Impact at 512/472-3903 or email [email protected]

Impact of Medicaid Extension and Local Spending for Health CareHouse District 39 - Representative Armando Martinez
County
2016 Adults <138% FPL Enrollees Moderate Scenario
2016 Adults Federal Funds
Moderate Scenario
2016 Adults State Funds Moderate Scenario
2016 Adults All Funds Moderate Scenario
2016 Children <200% FPL Enrollees Moderate Scenario
2016 Children Federal Funds
Moderate Scenario
2016 Children State Funds Moderate Scenario
2016 Children All Funds Moderate Scenario
2016 Adults & Children
All Funds Moderate Scenario
Statewide Total 1,004,771 7,615,086,733$ 292,887,951$ 7,907,974,684$ 550,189 1,500,495,384$ 769,325,576$ 2,269,820,960$ 10,177,795,644$
District Total 8,794 66,652,396$ 2,563,554$ 69,215,950$ 6,827 18,619,209$ 9,546,336$ 28,165,545$ 97,381,495$ Hidalgo (22%) 8,794 66,652,396$ 2,563,554$ 69,215,950$ 6,827 18,619,209$ 9,546,336$ 28,165,545$ 97,381,495$
Note: New local tax revenues are an allocation of the statewide estimate based on the county share of state personal income and further allocated in partial counties according to the share of county population. Variations in personal income or the concentration of direct health care spending in parts of counties could alter these allocations. Remaining columns reflect allocations of statewide estimates according to the county share of adults below 138% FPL or children below 200% FPL, as applicable, and further allocated for partial counties according to the share of the county's total population. Variations in percentages of adults below 138% FPL and children below 200% FPL could alter these estimates. Hospital charity cost data exclude certain hospitals, such as those exempt from reporting, hospitals that report by system, and others, resulting in a conservative estimate of unreimbursed charity costs. Medicaid extension to adults would not relieve all local unreimbursed costs due to ineligible adults, such as undocumented immigrants, people served with incomes above 138% FPL or health care for incarcerated adults other than inpatient hospital stays. 2016 is the first full year of implementation; the federal match rate falls to 95 percent in 2017 and to 90 percent by 2020. For full county-level data, see Appendix C, and for further notes and cautions in interpreting these data, see Appendix A, in "Smart, Affordable and Fair: Why Texas Should Extend Medicaid to Low-Income Adults," at http://www.mhm.org/images/stories/advocacy_and_public_policy/Smart%20Affordable%20and%20Fair_FNL_FULL.pdf.

Impact of Medicaid Extension and Local Spending for Health CareHouse District 40 - Representative Terry Canales
County
2014-2017 New
Local Tax
Revenue (Adult
Expansion)
2011 County
Indigent
Healthcare &
Unreimbursed
Jail Healthcare
Costs
2011 Total
Hospital District
or City/County
Unreimbursed
Healthcare
Expenditures
2010 Total
Hospital Charity
Care Costs
Total
Unreimbursed
Charity Care
Costs for Local
Jurisdictions &
Hospitals
2014-2017 Adults
Federal Funds
Limited
Scenario
2014-2017 Adults
Federal Funds
Moderate
Scenario
2014-2017
Adults State
Funds Moderate
Scenario
2014-2017 Adults
Federal Funds
Enhanced Scenario
Statewide Total 2,101,392,352$ 258,927,030$ 2,544,037,688$ 1,836,673,862$ 4,380,711,550$ 14,274,023,031$ 22,962,552,386$ 1,283,318,611$ 31,030,479,514$
District Total 7,824,944$ 622,630$ 3,926,086$ 15,835,865$ 19,761,951$ 124,938,138$ 200,987,383$ 11,232,673$ 271,604,601$
Hidalgo (22%) 7,824,944$ 622,630$ 3,926,086$ 15,835,865$ 19,761,951$ 124,938,138$ 200,987,383$ 11,232,673$ 271,604,601$
ANALYSIS BY BILLY HAMILTON CONSULTING
Extending Medicaid to Low-Income Adults Will Save Local Tax Dollars and Grow the Economy
Download this one-pager at www.texasimpact.org/Local-Taxpayers-Win-With-Medicaid Download the full report at www.mhm.org
Download the executive summary at www.texasimpact.org
For more information about the report, “Smart, Affordable and Fair” call Texas Impact at 512/472-3903 or email [email protected]

Impact of Medicaid Extension and Local Spending for Health CareHouse District 40 - Representative Terry Canales
County
2016 Adults
<138% FPL
Enrollees
Moderate
Scenario
2016 Adults
Federal Funds
Moderate
Scenario
2016 Adults
State Funds
Moderate
Scenario
2016 Adults
All Funds
Moderate
Scenario
2016 Children
<200% FPL
Enrollees
Moderate
Scenario
2016 Children
Federal Funds
Moderate
Scenario
2016 Children
State Funds
Moderate
Scenario
2016 Children
All Funds
Moderate
Scenario
2016 Adults &
Children
All Funds
Moderate
Scenario
Statewide Total 1,004,771 7,615,086,733$ 292,887,951$ 7,907,974,684$ 550,189 1,500,495,384$ 769,325,576$ 2,269,820,960$ 10,177,795,644$
District Total 8,795 66,653,581$ 2,563,599$ 69,217,181$ 6,827 18,619,540$ 9,546,506$ 28,166,046$ 97,383,227$
Hidalgo (22%) 8,795 66,653,581$ 2,563,599$ 69,217,181$ 6,827 18,619,540$ 9,546,506$ 28,166,046$ 97,383,227$
Note: New local tax revenues are an allocation of the statewide estimate based on the county share of state personal income and further allocated in partial counties according to the share of county population. Variations in personal income or the concentration of direct health care spending in parts of counties could alter these allocations. Remaining columns reflect allocations of statewide estimates according to the county share of adults below 138% FPL or children below 200% FPL, as applicable, and further allocated for partial counties according to the share of the county's total population. Variations in percentages of adults below 138% FPL and children below 200% FPL could alter these estimates. Hospital charity cost data exclude certain hospitals, such as those exempt from reporting, hospitals that report by system, and others, resulting in a conservative estimate of unreimbursed charity costs. Medicaid extension to adults would not relieve all local unreimbursed costs due to ineligible adults, such as undocumented immigrants, people served with incomes above 138% FPL or health care for incarcerated adults other than inpatient hospital stays. 2016 is the first full year of implementation; the federal match rate falls to 95 percent in 2017 and to 90 percent by 2020. For full county-level data, see Appendix C, and for further notes and cautions in interpreting these data, see Appendix A, in "Smart, Affordable and Fair: Why Texas Should Extend Medicaid to Low-Income Adults," at http://www.mhm.org/images/stories/advocacy_and_public_policy/Smart%20Affordable%20and%20Fair_FNL_FULL.pdf.

Impact of Medicaid Extension and Local Spending for Health CareHouse District 41 - Representative Bobby Guerra
County
2014-2017 New Local Tax
Revenue (Adult Expansion)
2011 County Indigent
Healthcare & Unreimbursed Jail Healthcare
Costs
2011 Total Hospital District or City/County Unreimbursed
Healthcare Expenditures
2010 Total Hospital Charity
Care Costs
Total Unreimbursed Charity Care
Costs for Local Jurisdictions &
Hospitals
2014-2017 Adults Federal Funds
Limited Scenario
2014-2017 Adults Federal Funds
Moderate Scenario
2014-2017 Adults State
Funds Moderate Scenario
2014-2017 Adults Federal Funds
Enhanced Scenario
Statewide Total 2,101,392,352$ 258,927,030$ 2,544,037,688$ 1,836,673,862$ 4,380,711,550$ 14,274,023,031$ 22,962,552,386$ 1,283,318,611$ 31,030,479,514$
District Total 7,830,233$ 623,050$ 3,928,740$ 15,846,569$ 19,775,308$ 125,022,585$ 201,123,232$ 11,240,266$ 271,788,180$ Hidalgo (22%) 7,830,233$ 623,050$ 3,928,740$ 15,846,569$ 19,775,308$ 125,022,585$ 201,123,232$ 11,240,266$ 271,788,180$
ANALYSIS BY BILLY HAMILTON CONSULTING
Extending Medicaid to Low-Income Adults Will Save Local Tax Dollars and Grow the Economy
Download this one-pager at www.texasimpact.org/Local-Taxpayers-Win-With-Medicaid Download the full report at www.mhm.org
Download the executive summary at www.texasimpact.org
For more information about the report, “Smart, Affordable and Fair” call Texas Impact at 512/472-3903 or email [email protected]

Impact of Medicaid Extension and Local Spending for Health CareHouse District 41 - Representative Bobby Guerra
County
2016 Adults <138% FPL Enrollees Moderate Scenario
2016 Adults Federal Funds
Moderate Scenario
2016 Adults State Funds Moderate Scenario
2016 Adults All Funds Moderate Scenario
2016 Children <200% FPL Enrollees Moderate Scenario
2016 Children Federal Funds
Moderate Scenario
2016 Children State Funds Moderate Scenario
2016 Children All Funds Moderate Scenario
2016 Adults & Children
All Funds Moderate Scenario
Statewide Total 1,004,771 7,615,086,733$ 292,887,951$ 7,907,974,684$ 550,189 1,500,495,384$ 769,325,576$ 2,269,820,960$ 10,177,795,644$
District Total 8,801 66,698,633$ 2,565,332$ 69,263,965$ 6,832 18,632,125$ 9,552,959$ 28,185,084$ 97,449,049$ Hidalgo (22%) 8,801 66,698,633$ 2,565,332$ 69,263,965$ 6,832 18,632,125$ 9,552,959$ 28,185,084$ 97,449,049$ Note: New local tax revenues are an allocation of the statewide estimate based on the county share of state personal income and further allocated in partial counties according to the share of county
population. Variations in personal income or the concentration of direct health care spending in parts of counties could alter these allocations. Remaining columns reflect allocations of statewide
estimates according to the county share of adults below 138% FPL or children below 200% FPL, as applicable, and further allocated for partial counties according to the share of the county's total
population. Variations in percentages of adults below 138% FPL and children below 200% FPL could alter these estimates. Hospital charity cost data exclude certain hospitals, such as those exempt
from reporting, hospitals that report by system, and others, resulting in a conservative estimate of unreimbursed charity costs. Medicaid extension to adults would not relieve all local unreimbursed
costs due to ineligible adults, such as undocumented immigrants, people served with incomes above 138% FPL or health care for incarcerated adults other than inpatient hospital stays. 2016 is the first
full year of implementation; the federal match rate falls to 95 percent in 2017 and to 90 percent by 2020. For full county-level data, see Appendix C, and for further notes and cautions in interpreting
these data, see Appendix A, in "Smart, Affordable and Fair: Why Texas Should Extend Medicaid to Low-Income Adults," at
http://www.mhm.org/images/stories/advocacy_and_public_policy/Smart%20Affordable%20and%20Fair_FNL_FULL.pdf.

Impact of Medicaid Extension and Local Spending for Health CareHouse District 42 - Representative Richard Raymond
County
2014-2017 New
Local Tax
Revenue (Adult
Expansion)
2011 County
Indigent
Healthcare &
Unreimbursed
Jail Healthcare
Costs
2011 Total
Hospital District
or City/County
Unreimbursed
Healthcare
Expenditures
2010 Total
Hospital Charity
Care Costs
Total
Unreimbursed
Charity Care
Costs for Local
Jurisdictions &
Hospitals
2014-2017 Adults
Federal Funds
Limited
Scenario
2014-2017 Adults
Federal Funds
Moderate
Scenario
2014-2017
Adults State
Funds Moderate
Scenario
2014-2017 Adults
Federal Funds
Enhanced Scenario
Statewide Total 2,101,392,352$ 258,927,030$ 2,544,037,688$ 1,836,673,862$ 4,380,711,550$ 14,274,023,031$ 22,962,552,386$ 1,283,318,611$ 31,030,479,514$
District Total 8,338,064$ 1,356,025$ 3,202,921$ 7,689,693$ 10,892,614$ 105,657,640$ 169,970,939$ 9,499,243$ 229,690,483$
Webb (64%) 8,338,064$ 1,356,025$ 3,202,921$ 7,689,693$ 10,892,614$ 105,657,640$ 169,970,939$ 9,499,243$ 229,690,483$
ANALYSIS BY BILLY HAMILTON CONSULTING
Extending Medicaid to Low-Income Adults Will Save Local Tax Dollars and Grow the Economy
Download this one-pager at www.texasimpact.org/Local-Taxpayers-Win-With-Medicaid Download the full report at www.mhm.org
Download the executive summary at www.texasimpact.org
For more information about the report, “Smart, Affordable and Fair” call Texas Impact at 512/472-3903 or email [email protected]

Impact of Medicaid Extension and Local Spending for Health CareHouse District 42 - Representative Richard Raymond
County
2016 Adults
<138% FPL
Enrollees
Moderate
Scenario
2016 Adults
Federal Funds
Moderate
Scenario
2016 Adults
State Funds
Moderate
Scenario
2016 Adults
All Funds
Moderate
Scenario
2016 Children
<200% FPL
Enrollees
Moderate
Scenario
2016 Children
Federal Funds
Moderate
Scenario
2016 Children
State Funds
Moderate
Scenario
2016 Children
All Funds
Moderate
Scenario
2016 Adults &
Children
All Funds
Moderate
Scenario
Statewide Total 1,004,771 7,615,086,733$ 292,887,951$ 7,907,974,684$ 550,189 1,500,495,384$ 769,325,576$ 2,269,820,960$ 10,177,795,644$
District Total 7,437 56,367,577$ 2,167,984$ 58,535,561$ 6,194 16,892,321$ 8,660,936$ 25,553,256$ 84,088,817$
Webb (64%) 7,437 56,367,577$ 2,167,984$ 58,535,561$ 6,194 16,892,321$ 8,660,936$ 25,553,256$ 84,088,817$
Note: New local tax revenues are an allocation of the statewide estimate based on the county share of state personal income and further allocated in partial counties according to the share of county population. Variations in personal income or the concentration of direct health care spending in parts of counties could alter these allocations. Remaining columns reflect allocations of statewide estimates according to the county share of adults below 138% FPL or children below 200% FPL, as applicable, and further allocated for partial counties according to the share of the county's total population. Variations in percentages of adults below 138% FPL and children below 200% FPL could alter these estimates. Hospital charity cost data exclude certain hospitals, such as those exempt from reporting, hospitals that report by system, and others, resulting in a conservative estimate of unreimbursed charity costs. Medicaid extension to adults would not relieve all local unreimbursed costs due to ineligible adults, such as undocumented immigrants, people served with incomes above 138% FPL or health care for incarcerated adults other than inpatient hospital stays. 2016 is the first full year of implementation; the federal match rate falls to 95 percent in 2017 and to 90 percent by 2020. For full county-level data, see Appendix C, and for further notes and cautions in interpreting these data, see Appendix A, in "Smart, Affordable and Fair: Why Texas Should Extend Medicaid to Low-Income Adults," at http://www.mhm.org/images/stories/advocacy_and_public_policy/Smart%20Affordable%20and%20Fair_FNL_FULL.pdf.

Impact of Medicaid Extension and Local Spending for Health CareHouse District 43 - Representative J.M. Lozano
County
2014-2017 New Local Tax
Revenue (Adult Expansion)
2011 County Indigent
Healthcare & Unreimbursed Jail Healthcare
Costs
2011 Total Hospital District or City/County Unreimbursed
Healthcare Expenditures
2010 Total Hospital Charity
Care Costs
Total Unreimbursed Charity Care
Costs for Local Jurisdictions &
Hospitals
2014-2017 Adults Federal Funds
Limited Scenario
2014-2017 Adults Federal Funds
Moderate Scenario
2014-2017 Adults State
Funds Moderate Scenario
2014-2017 Adults Federal Funds
Enhanced Scenario
Statewide Total 2,101,392,352$ 258,927,030$ 2,544,037,688$ 1,836,673,862$ 4,380,711,550$ 14,274,023,031$ 22,962,552,386$ 1,283,318,611$ 31,030,479,514$
District Total 12,099,169$ 2,152,944$ 4,033,363$ 10,177,311$ 14,210,674$ 145,550,338$ 234,146,130$ 13,085,831$ 316,413,723$ Bee (100%) 1,727,816$ 215,996$ 481,230$ -$ 481,230$ 32,556,569$ 52,373,597$ 2,927,027$ 70,775,139$ Jim Wel ls (100%) 3,122,660$ 472,818$ 899,293$ 5,429,546$ 6,328,839$ 36,356,530$ 58,486,575$ 3,268,666$ 79,035,921$ Kleberg (100%) 2,200,166$ 777,945$ 1,354,632$ 4,747,765$ 6,102,397$ 31,331,322$ 50,402,548$ 2,816,870$ 68,111,558$ San Patricio (100%) 5,048,527$ 686,185$ 1,298,208$ -$ 1,298,208$ 45,305,916$ 72,883,410$ 4,073,268$ 98,491,105$
ANALYSIS BY BILLY HAMILTON CONSULTING
Extending Medicaid to Low-Income Adults Will Save Local Tax Dollars and Grow the Economy
Download this one-pager at www.texasimpact.org/Local-Taxpayers-Win-With-Medicaid Download the full report at www.mhm.org
Download the executive summary at www.texasimpact.org
For more information about the report, “Smart, Affordable and Fair” call Texas Impact at 512/472-3903 or email [email protected]
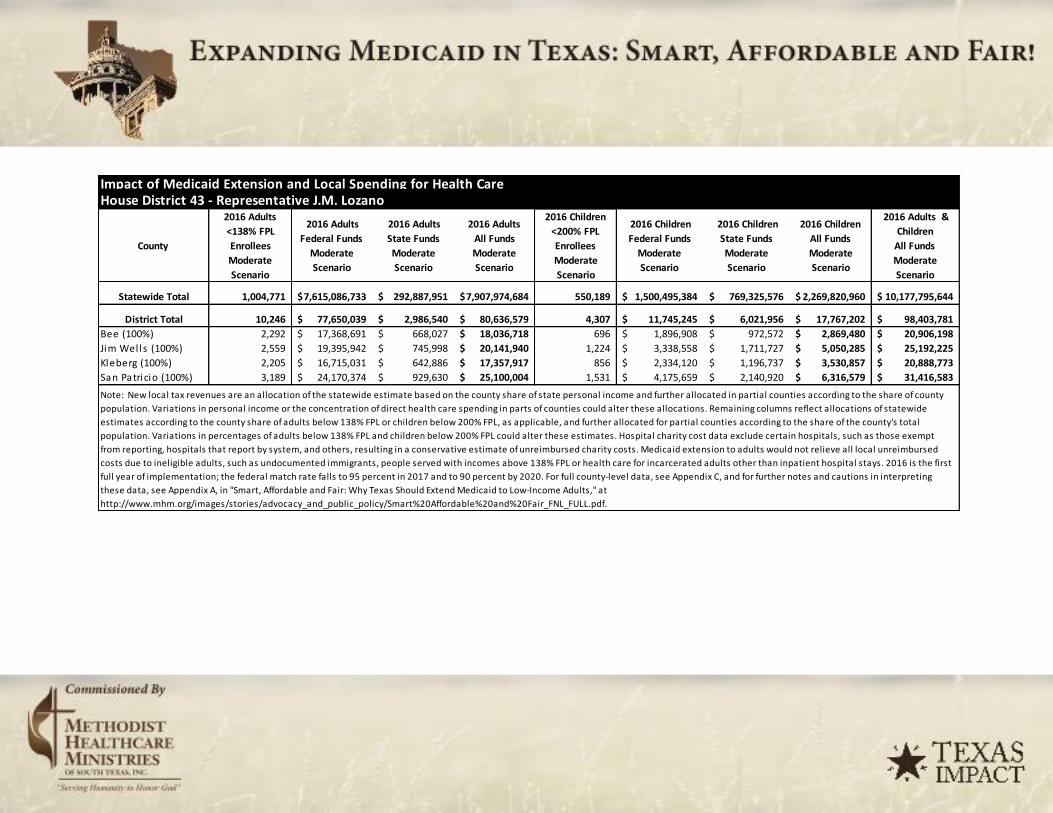
Impact of Medicaid Extension and Local Spending for Health CareHouse District 43 - Representative J.M. Lozano
County
2016 Adults <138% FPL Enrollees Moderate Scenario
2016 Adults Federal Funds
Moderate Scenario
2016 Adults State Funds Moderate Scenario
2016 Adults All Funds Moderate Scenario
2016 Children <200% FPL Enrollees Moderate Scenario
2016 Children Federal Funds
Moderate Scenario
2016 Children State Funds Moderate Scenario
2016 Children All Funds Moderate Scenario
2016 Adults & Children
All Funds Moderate Scenario
Statewide Total 1,004,771 7,615,086,733$ 292,887,951$ 7,907,974,684$ 550,189 1,500,495,384$ 769,325,576$ 2,269,820,960$ 10,177,795,644$
District Total 10,246 77,650,039$ 2,986,540$ 80,636,579$ 4,307 11,745,245$ 6,021,956$ 17,767,202$ 98,403,781$ Bee (100%) 2,292 17,368,691$ 668,027$ 18,036,718$ 696 1,896,908$ 972,572$ 2,869,480$ 20,906,198$ Jim Wel ls (100%) 2,559 19,395,942$ 745,998$ 20,141,940$ 1,224 3,338,558$ 1,711,727$ 5,050,285$ 25,192,225$ Kleberg (100%) 2,205 16,715,031$ 642,886$ 17,357,917$ 856 2,334,120$ 1,196,737$ 3,530,857$ 20,888,773$ San Patricio (100%) 3,189 24,170,374$ 929,630$ 25,100,004$ 1,531 4,175,659$ 2,140,920$ 6,316,579$ 31,416,583$ Note: New local tax revenues are an allocation of the statewide estimate based on the county share of state personal income and further allocated in partial counties according to the share of county
population. Variations in personal income or the concentration of direct health care spending in parts of counties could alter these allocations. Remaining columns reflect allocations of statewide
estimates according to the county share of adults below 138% FPL or children below 200% FPL, as applicable, and further allocated for partial counties according to the share of the county's total
population. Variations in percentages of adults below 138% FPL and children below 200% FPL could alter these estimates. Hospital charity cost data exclude certain hospitals, such as those exempt
from reporting, hospitals that report by system, and others, resulting in a conservative estimate of unreimbursed charity costs. Medicaid extension to adults would not relieve all local unreimbursed
costs due to ineligible adults, such as undocumented immigrants, people served with incomes above 138% FPL or health care for incarcerated adults other than inpatient hospital stays. 2016 is the first
full year of implementation; the federal match rate falls to 95 percent in 2017 and to 90 percent by 2020. For full county-level data, see Appendix C, and for further notes and cautions in interpreting
these data, see Appendix A, in "Smart, Affordable and Fair: Why Texas Should Extend Medicaid to Low-Income Adults," at
http://www.mhm.org/images/stories/advocacy_and_public_policy/Smart%20Affordable%20and%20Fair_FNL_FULL.pdf.

Impact of Medicaid Extension and Local Spending for Health CareHouse District 44 - Representative John Kuempel
County
2014-2017 New Local Tax
Revenue (Adult Expansion)
2011 County Indigent
Healthcare & Unreimbursed Jail Healthcare
Costs
2011 Total Hospital District or City/County Unreimbursed
Healthcare Expenditures
2010 Total Hospital Charity
Care Costs
Total Unreimbursed Charity Care
Costs for Local Jurisdictions &
Hospitals
2014-2017 Adults Federal Funds
Limited Scenario
2014-2017 Adults Federal Funds
Moderate Scenario
2014-2017 Adults State
Funds Moderate Scenario
2014-2017 Adults Federal Funds
Enhanced Scenario
Statewide Total 2,101,392,352$ 258,927,030$ 2,544,037,688$ 1,836,673,862$ 4,380,711,550$ 14,274,023,031$ 22,962,552,386$ 1,283,318,611$ 31,030,479,514$
District Total 13,137,118$ 1,941,724$ 8,037,644$ 6,441,032$ 14,478,676$ 101,571,302$ 163,397,266$ 9,131,857$ 220,807,140$ Guadalupe (100%) 10,089,859$ 1,813,375$ 4,273,442$ 6,441,032$ 10,714,474$ 69,065,549$ 111,105,418$ 6,209,399$ 150,142,473$ Wi lson (100%) 3,047,259$ 128,349$ 3,764,202$ -$ 3,764,202$ 32,505,753$ 52,291,849$ 2,922,458$ 70,664,668$
ANALYSIS BY BILLY HAMILTON CONSULTING
Extending Medicaid to Low-Income Adults Will Save Local Tax Dollars and Grow the Economy
Download this one-pager at www.texasimpact.org/Local-Taxpayers-Win-With-Medicaid Download the full report at www.mhm.org
Download the executive summary at www.texasimpact.org
For more information about the report, “Smart, Affordable and Fair” call Texas Impact at 512/472-3903 or email [email protected]

Impact of Medicaid Extension and Local Spending for Health CareHouse District 44 - Representative John Kuempel
County
2016 Adults
<138% FPL
Enrollees
Moderate
Scenario
2016 Adults
Federal Funds
Moderate
Scenario
2016 Adults
State Funds
Moderate
Scenario
2016 Adults
All Funds
Moderate
Scenario
2016 Children
<200% FPL
Enrollees
Moderate
Scenario
2016 Children
Federal Funds
Moderate
Scenario
2016 Children
State Funds
Moderate
Scenario
2016 Children
All Funds
Moderate
Scenario
2016 Adults &
Children
All Funds
Moderate
Scenario
Statewide Total 1,004,771 7,615,086,733$ 292,887,951$ 7,907,974,684$ 550,189 1,500,495,384$ 769,325,576$ 2,269,820,960$ 10,177,795,644$
District Total 7,150 54,187,546$ 2,084,136$ 56,271,682$ 3,444 9,393,489$ 4,816,177$ 14,209,666$ 70,481,348$
Guadalupe (100%) 4,862 36,845,965$ 1,417,152$ 38,263,117$ 2,524 6,883,008$ 3,529,017$ 10,412,026$ 48,675,143$
Wilson (100%) 2,288 17,341,581$ 666,984$ 18,008,565$ 921 2,510,481$ 1,287,160$ 3,797,641$ 21,806,206$
Note: New local tax revenues are an allocation of the statewide estimate based on the county share of state personal income and further allocated in partial counties according to the share of county population. Variations in personal income or the concentration of direct health care spending in parts of counties could alter these allocations. Remaining columns reflect allocations of statewide estimates according to the county share of adults below 138% FPL or children below 200% FPL, as applicable, and further allocated for partial counties according to the share of the county's total population. Variations in percentages of adults below 138% FPL and children below 200% FPL could alter these estimates. Hospital charity cost data exclude certain hospitals, such as those exempt from reporting, hospitals that report by system, and others, resulting in a conservative estimate of unreimbursed charity costs. Medicaid extension to adults would not relieve all local unreimbursed costs due to ineligible adults, such as undocumented immigrants, people served with incomes above 138% FPL or health care for incarcerated adults other than inpatient hospital stays. 2016 is the first full year of implementation; the federal match rate falls to 95 percent in 2017 and to 90 percent by 2020. For full county-level data, see Appendix C, and for further notes and cautions in interpreting these data, see Appendix A, in "Smart, Affordable and Fair: Why Texas Should Extend Medicaid to Low-Income Adults," at http://www.mhm.org/images/stories/advocacy_and_public_policy/Smart%20Affordable%20and%20Fair_FNL_FULL.pdf.

Impact of Medicaid Extension and Local Spending for Health CareHouse District 45 - Representative Jason Isaac
County
2014-2017 New Local Tax
Revenue (Adult Expansion)
2011 County Indigent
Healthcare & Unreimbursed Jail Healthcare
Costs
2011 Total Hospital District or City/County Unreimbursed
Healthcare Expenditures
2010 Total Hospital Charity
Care Costs
Total Unreimbursed Charity Care
Costs for Local Jurisdictions &
Hospitals
2014-2017 Adults Federal Funds
Limited Scenario
2014-2017 Adults Federal Funds
Moderate Scenario
2014-2017 Adults State
Funds Moderate Scenario
2014-2017 Adults Federal Funds
Enhanced Scenario
Statewide Total 2,101,392,352$ 258,927,030$ 2,544,037,688$ 1,836,673,862$ 4,380,711,550$ 14,274,023,031$ 22,962,552,386$ 1,283,318,611$ 31,030,479,514$
District Total 11,762,445$ 2,462,420$ 4,933,195$ 9,450,241$ 14,383,436$ 80,804,208$ 129,989,342$ 7,264,774$ 175,661,292$ Blanco (100%) 1,023,426$ 125,403$ 577,564$ -$ 577,564$ 6,809,439$ 10,954,311$ 612,209$ 14,803,125$ Hays (100%) 10,739,020$ 2,337,017$ 4,355,631$ 9,450,241$ 13,805,872$ 73,994,770$ 119,035,031$ 6,652,565$ 160,858,167$
ANALYSIS BY BILLY HAMILTON CONSULTING
Extending Medicaid to Low-Income Adults Will Save Local Tax Dollars and Grow the Economy
Download this one-pager at www.texasimpact.org/Local-Taxpayers-Win-With-Medicaid Download the full report at www.mhm.org
Download the executive summary at www.texasimpact.org
For more information about the report, “Smart, Affordable and Fair” call Texas Impact at 512/472-3903 or email [email protected]

Impact of Medicaid Extension and Local Spending for Health CareHouse District 45 - Representative Jason Isaac
County
2016 Adults
<138% FPL
Enrollees
Moderate
Scenario
2016 Adults
Federal Funds
Moderate
Scenario
2016 Adults
State Funds
Moderate
Scenario
2016 Adults
All Funds
Moderate
Scenario
2016 Children
<200% FPL
Enrollees
Moderate
Scenario
2016 Children
Federal Funds
Moderate
Scenario
2016 Children
State Funds
Moderate
Scenario
2016 Children
All Funds
Moderate
Scenario
2016 Adults &
Children
All Funds
Moderate
Scenario
Statewide Total 1,004,771 7,615,086,733$ 292,887,951$ 7,907,974,684$ 550,189 1,500,495,384$ 769,325,576$ 2,269,820,960$ 10,177,795,644$
District Total 5,688 43,108,453$ 1,658,017$ 44,766,471$ 2,662 7,261,159$ 3,722,901$ 10,984,060$ 55,750,531$
Blanco (100%) 479 3,632,786$ 139,723$ 3,772,508$ 171 465,922$ 238,885$ 704,806$ 4,477,315$
Hays (100%) 5,209 39,475,668$ 1,518,295$ 40,993,963$ 2,492 6,795,238$ 3,484,016$ 10,279,254$ 51,273,217$
Note: New local tax revenues are an allocation of the statewide estimate based on the county share of state personal income and further allocated in partial counties according to the share of county population. Variations in personal income or the concentration of direct health care spending in parts of counties could alter these allocations. Remaining columns reflect allocations of statewide estimates according to the county share of adults below 138% FPL or children below 200% FPL, as applicable, and further allocated for partial counties according to the share of the county's total population. Variations in percentages of adults below 138% FPL and children below 200% FPL could alter these estimates. Hospital charity cost data exclude certain hospitals, such as those exempt from reporting, hospitals that report by system, and others, resulting in a conservative estimate of unreimbursed charity costs. Medicaid extension to adults would not relieve all local unreimbursed costs due to ineligible adults, such as undocumented immigrants, people served with incomes above 138% FPL or health care for incarcerated adults other than inpatient hospital stays. 2016 is the first full year of implementation; the federal match rate falls to 95 percent in 2017 and to 90 percent by 2020. For full county-level data, see Appendix C, and for further notes and cautions in interpreting these data, see Appendix A, in "Smart, Affordable and Fair: Why Texas Should Extend Medicaid to Low-Income Adults," at http://www.mhm.org/images/stories/advocacy_and_public_policy/Smart%20Affordable%20and%20Fair_FNL_FULL.pdf.

Impact of Medicaid Extension and Local Spending for Health CareHouse District 46 - Representative Dawnna Dukes
County
2014-2017 New Local Tax
Revenue (Adult Expansion)
2011 County Indigent
Healthcare & Unreimbursed Jail Healthcare
Costs
2011 Total Hospital District or City/County Unreimbursed
Healthcare Expenditures
2010 Total Hospital Charity
Care Costs
Total Unreimbursed Charity Care
Costs for Local Jurisdictions &
Hospitals
2014-2017 Adults Federal Funds
Limited Scenario
2014-2017 Adults Federal Funds
Moderate Scenario
2014-2017 Adults State
Funds Moderate Scenario
2014-2017 Adults Federal Funds
Enhanced Scenario
Statewide Total 2,101,392,352$ 258,927,030$ 2,544,037,688$ 1,836,673,862$ 4,380,711,550$ 14,274,023,031$ 22,962,552,386$ 1,283,318,611$ 31,030,479,514$
District Total 15,300,800$ 2,494,167$ 25,416,928$ 18,380,977$ 43,797,906$ 83,986,210$ 135,108,214$ 7,550,854$ 182,578,687$ Travis (16%) 15,300,800$ 2,494,167$ 25,416,928$ 18,380,977$ 43,797,906$ 83,986,210$ 135,108,214$ 7,550,854$ 182,578,687$
ANALYSIS BY BILLY HAMILTON CONSULTING
Extending Medicaid to Low-Income Adults Will Save Local Tax Dollars and Grow the Economy
Download this one-pager at www.texasimpact.org/Local-Taxpayers-Win-With-Medicaid Download the full report at www.mhm.org
Download the executive summary at www.texasimpact.org
For more information about the report, “Smart, Affordable and Fair” call Texas Impact at 512/472-3903 or email [email protected]

Impact of Medicaid Extension and Local Spending for Health CareHouse District 46 - Representative Dawnna Dukes
County
2016 Adults <138% FPL Enrollees Moderate Scenario
2016 Adults Federal Funds
Moderate Scenario
2016 Adults State Funds Moderate Scenario
2016 Adults All Funds Moderate Scenario
2016 Children <200% FPL Enrollees Moderate Scenario
2016 Children Federal Funds
Moderate Scenario
2016 Children State Funds Moderate Scenario
2016 Children All Funds Moderate Scenario
2016 Adults & Children
All Funds Moderate Scenario
Statewide Total 1,004,771 7,615,086,733$ 292,887,951$ 7,907,974,684$ 550,189 1,500,495,384$ 769,325,576$ 2,269,820,960$ 10,177,795,644$
District Total 5,912 44,806,028$ 1,723,309$ 46,529,337$ 2,653 7,234,609$ 3,709,288$ 10,943,897$ 57,473,234$ Travis (16%) 5,912 44,806,028$ 1,723,309$ 46,529,337$ 2,653 7,234,609$ 3,709,288$ 10,943,897$ 57,473,234$
Note: New local tax revenues are an allocation of the statewide estimate based on the county share of state personal income and further allocated in partial counties according to the share of county population. Variations in personal income or the concentration of direct health care spending in parts of counties could alter these allocations. Remaining columns reflect allocations of statewide estimates according to the county share of adults below 138% FPL or children below 200% FPL, as applicable, and further allocated for partial counties according to the share of the county's total population. Variations in percentages of adults below 138% FPL and children below 200% FPL could alter these estimates. Hospital charity cost data exclude certain hospitals, such as those exempt from reporting, hospitals that report by system, and others, resulting in a conservative estimate of unreimbursed charity costs. Medicaid extension to adults would not relieve all local unreimbursed costs due to ineligible adults, such as undocumented immigrants, people served with incomes above 138% FPL or health care for incarcerated adults other than inpatient hospital stays. 2016 is the first full year of implementation; the federal match rate falls to 95 percent in 2017 and to 90 percent by 2020. For full county-level data, see Appendix C, and for further notes and cautions in interpreting these data, see Appendix A, in "Smart, Affordable and Fair: Why Texas Should Extend Medicaid to Low-Income Adults," at http://www.mhm.org/images/stories/advocacy_and_public_policy/Smart%20Affordable%20and%20Fair_FNL_FULL.pdf.

Impact of Medicaid Extension and Local Spending for Health CareHouse District 47 - Representative Paul Workman
County
2014-2017 New Local Tax
Revenue (Adult Expansion)
2011 County Indigent
Healthcare & Unreimbursed Jail Healthcare
Costs
2011 Total Hospital District or City/County Unreimbursed
Healthcare Expenditures
2010 Total Hospital Charity
Care Costs
Total Unreimbursed Charity Care
Costs for Local Jurisdictions &
Hospitals
2014-2017 Adults Federal Funds
Limited Scenario
2014-2017 Adults Federal Funds
Moderate Scenario
2014-2017 Adults State
Funds Moderate Scenario
2014-2017 Adults Federal Funds
Enhanced Scenario
Statewide Total 2,101,392,352$ 258,927,030$ 2,544,037,688$ 1,836,673,862$ 4,380,711,550$ 14,274,023,031$ 22,962,552,386$ 1,283,318,611$ 31,030,479,514$
District Total 16,119,491$ 2,627,621$ 26,776,897$ 19,364,477$ 46,141,374$ 88,480,010$ 142,337,368$ 7,954,873$ 192,347,815$ Travis (17%) 16,119,491$ 2,627,621$ 26,776,897$ 19,364,477$ 46,141,374$ 88,480,010$ 142,337,368$ 7,954,873$ 192,347,815$
ANALYSIS BY BILLY HAMILTON CONSULTING
Extending Medicaid to Low-Income Adults Will Save Local Tax Dollars and Grow the Economy
Download this one-pager at www.texasimpact.org/Local-Taxpayers-Win-With-Medicaid Download the full report at www.mhm.org
Download the executive summary at www.texasimpact.org
For more information about the report, “Smart, Affordable and Fair” call Texas Impact at 512/472-3903 or email [email protected]

Impact of Medicaid Extension and Local Spending for Health CareHouse District 47 - Representative Paul Workman
County
2016 Adults <138% FPL Enrollees Moderate Scenario
2016 Adults Federal Funds
Moderate Scenario
2016 Adults State Funds Moderate Scenario
2016 Adults All Funds Moderate Scenario
2016 Children <200% FPL Enrollees Moderate Scenario
2016 Children Federal Funds
Moderate Scenario
2016 Children State Funds Moderate Scenario
2016 Children All Funds Moderate Scenario
2016 Adults & Children
All Funds Moderate Scenario
Statewide Total 1,004,771 7,615,086,733$ 292,887,951$ 7,907,974,684$ 550,189 1,500,495,384$ 769,325,576$ 2,269,820,960$ 10,177,795,644$
District Total 6,228 47,203,437$ 1,815,517$ 49,018,954$ 2,795 7,621,707$ 3,907,759$ 11,529,466$ 60,548,420$ Travis (17%) 6,228 47,203,437$ 1,815,517$ 49,018,954$ 2,795 7,621,707$ 3,907,759$ 11,529,466$ 60,548,420$ Note: New local tax revenues are an allocation of the statewide estimate based on the county share of state personal income and further allocated in partial counties according to the share of county population. Variations in personal income or the concentration of direct health care spending in parts of counties could alter these allocations. Remaining columns reflect allocations of statewide estimates according to the county share of adults below 138% FPL or children below 200% FPL, as applicable, and further allocated for partial counties according to the share of the county's total population. Variations in percentages of adults below 138% FPL and children below 200% FPL could alter these estimates. Hospital charity cost data exclude certain hospitals, such as those exempt from reporting, hospitals that report by system, and others, resulting in a conservative estimate of unreimbursed charity costs. Medicaid extension to adults would not relieve all local unreimbursed costs due to ineligible adults, such as undocumented immigrants, people served with incomes above 138% FPL or health care for incarcerated adults other than inpatient hospital stays. 2016 is the first full year of implementation; the federal match rate falls to 95 percent in 2017 and to 90 percent by 2020. For full county-level data, see Appendix C, and for further notes and cautions in interpreting these data, see Appendix A, in "Smart, Affordable and Fair: Why Texas Should Extend Medicaid to Low-Income Adults," at http://www.mhm.org/images/stories/advocacy_and_public_policy/Smart%20Affordable%20and%20Fair_FNL_FULL.pdf.
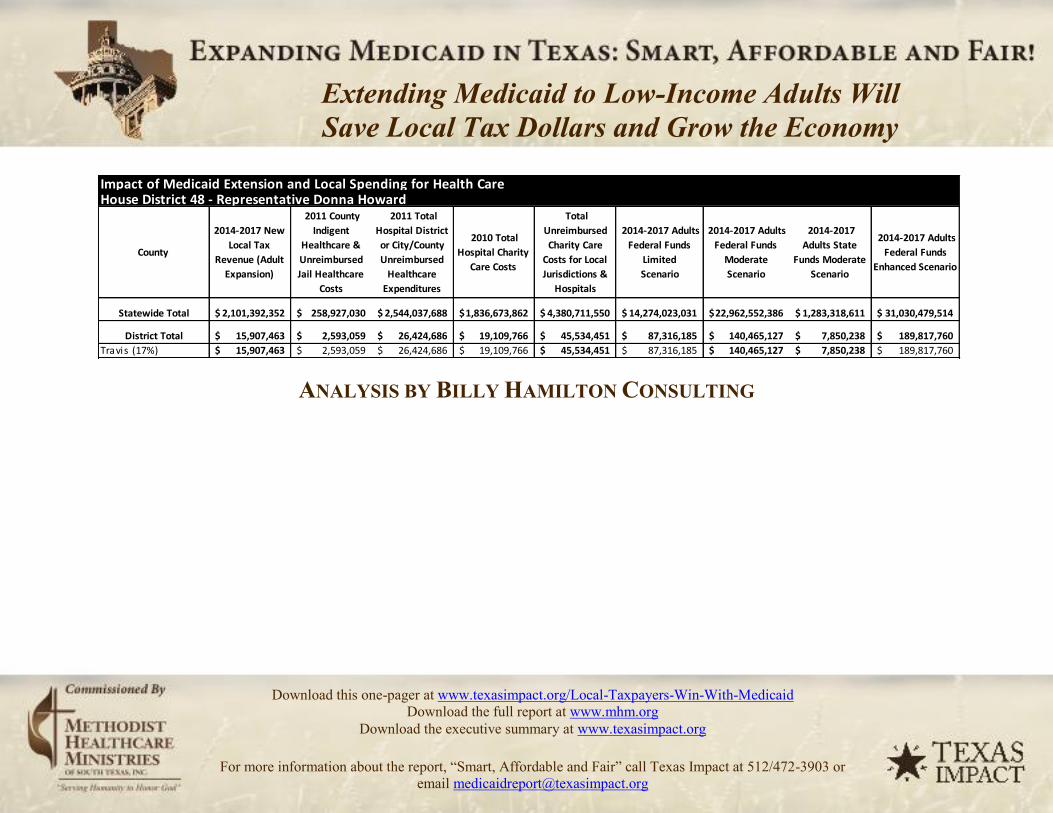
Impact of Medicaid Extension and Local Spending for Health CareHouse District 48 - Representative Donna Howard
County
2014-2017 New Local Tax
Revenue (Adult Expansion)
2011 County Indigent
Healthcare & Unreimbursed Jail Healthcare
Costs
2011 Total Hospital District or City/County Unreimbursed
Healthcare Expenditures
2010 Total Hospital Charity
Care Costs
Total Unreimbursed Charity Care
Costs for Local Jurisdictions &
Hospitals
2014-2017 Adults Federal Funds
Limited Scenario
2014-2017 Adults Federal Funds
Moderate Scenario
2014-2017 Adults State
Funds Moderate Scenario
2014-2017 Adults Federal Funds
Enhanced Scenario
Statewide Total 2,101,392,352$ 258,927,030$ 2,544,037,688$ 1,836,673,862$ 4,380,711,550$ 14,274,023,031$ 22,962,552,386$ 1,283,318,611$ 31,030,479,514$
District Total 15,907,463$ 2,593,059$ 26,424,686$ 19,109,766$ 45,534,451$ 87,316,185$ 140,465,127$ 7,850,238$ 189,817,760$ Travis (17%) 15,907,463$ 2,593,059$ 26,424,686$ 19,109,766$ 45,534,451$ 87,316,185$ 140,465,127$ 7,850,238$ 189,817,760$
ANALYSIS BY BILLY HAMILTON CONSULTING
Extending Medicaid to Low-Income Adults Will Save Local Tax Dollars and Grow the Economy
Download this one-pager at www.texasimpact.org/Local-Taxpayers-Win-With-Medicaid Download the full report at www.mhm.org
Download the executive summary at www.texasimpact.org
For more information about the report, “Smart, Affordable and Fair” call Texas Impact at 512/472-3903 or email [email protected]

Impact of Medicaid Extension and Local Spending for Health Care
House District 48 - Representative Donna Howard
County
2016 Adults
<138% FPL
Enrollees
Moderate
Scenario
2016 Adults
Federal Funds
Moderate
Scenario
2016 Adults
State Funds
Moderate
Scenario
2016 Adults
All Funds
Moderate
Scenario
2016 Children
<200% FPL
Enrollees
Moderate
Scenario
2016 Children
Federal Funds
Moderate
Scenario
2016 Children
State Funds
Moderate
Scenario
2016 Children
All Funds
Moderate
Scenario
2016 Adults &
Children
All Funds
Moderate
Scenario
Statewide Total 1,004,771 7,615,086,733$ 292,887,951$ 7,907,974,684$ 550,189 1,500,495,384$ 769,325,576$ 2,269,820,960$ 10,177,795,644$
District Total 6,146 46,582,545$ 1,791,636$ 48,374,181$ 2,758 7,521,455$ 3,856,358$ 11,377,813$ 59,751,994$
Travis (17%) 6,146 46,582,545$ 1,791,636$ 48,374,181$ 2,758 7,521,455$ 3,856,358$ 11,377,813$ 59,751,994$
Note: New local tax revenues are an allocation of the statewide estimate based on the county share of state personal income and further allocated in partial counties according to the share of county population. Variations in personal income or the concentration of direct health care spending in parts of counties could alter these allocations. Remaining columns reflect allocations of statewide estimates according to the county share of adults below 138% FPL or children below 200% FPL, as applicable, and further allocated for partial counties according to the share of the county's total population. Variations in percentages of adults below 138% FPL and children below 200% FPL could alter these estimates. Hospital charity cost data exclude certain hospitals, such as those exempt from reporting, hospitals that report by system, and others, resulting in a conservative estimate of unreimbursed charity costs. Medicaid extension to adults would not relieve all local unreimbursed costs due to ineligible adults, such as undocumented immigrants, people served with incomes above 138% FPL or health care for incarcerated adults other than inpatient hospital stays. 2016 is the first full year of implementation; the federal match rate falls to 95 percent in 2017 and to 90 percent by 2020. For full county-level data, see Appendix C, and for further notes and cautions in interpreting these data, see Appendix A, in "Smart, Affordable and Fair: Why Texas Should Extend Medicaid to Low-Income Adults," at http://www.mhm.org/images/stories/advocacy_and_public_policy/Smart%20Affordable%20and%20Fair_FNL_FULL.pdf.

Impact of Medicaid Extension and Local Spending for Health CareHouse District 49 - Representative Elliott Naishtat
County
2014-2017 New Local Tax
Revenue (Adult Expansion)
2011 County Indigent
Healthcare & Unreimbursed Jail Healthcare
Costs
2011 Total Hospital District or City/County Unreimbursed
Healthcare Expenditures
2010 Total Hospital Charity
Care Costs
Total Unreimbursed Charity Care
Costs for Local Jurisdictions &
Hospitals
2014-2017 Adults Federal Funds
Limited Scenario
2014-2017 Adults Federal Funds
Moderate Scenario
2014-2017 Adults State
Funds Moderate Scenario
2014-2017 Adults Federal Funds
Enhanced Scenario
Statewide Total 2,101,392,352$ 258,927,030$ 2,544,037,688$ 1,836,673,862$ 4,380,711,550$ 14,274,023,031$ 22,962,552,386$ 1,283,318,611$ 31,030,479,514$
District Total 15,383,460$ 2,507,642$ 25,554,239$ 18,480,277$ 44,034,516$ 84,439,931$ 135,838,111$ 7,591,646$ 183,565,035$ Travis (16%) 15,383,460$ 2,507,642$ 25,554,239$ 18,480,277$ 44,034,516$ 84,439,931$ 135,838,111$ 7,591,646$ 183,565,035$
ANALYSIS BY BILLY HAMILTON CONSULTING
Extending Medicaid to Low-Income Adults Will Save Local Tax Dollars and Grow the Economy
Download this one-pager at www.texasimpact.org/Local-Taxpayers-Win-With-Medicaid Download the full report at www.mhm.org
Download the executive summary at www.texasimpact.org
For more information about the report, “Smart, Affordable and Fair” call Texas Impact at 512/472-3903 or email [email protected]

Impact of Medicaid Extension and Local Spending for Health CareHouse District 49 - Representative Elliott Naishtat
County
2016 Adults
<138% FPL
Enrollees
Moderate
Scenario
2016 Adults
Federal Funds
Moderate
Scenario
2016 Adults
State Funds
Moderate
Scenario
2016 Adults
All Funds
Moderate
Scenario
2016 Children
<200% FPL
Enrollees
Moderate
Scenario
2016 Children
Federal Funds
Moderate
Scenario
2016 Children
State Funds
Moderate
Scenario
2016 Children
All Funds
Moderate
Scenario
2016 Adults &
Children
All Funds
Moderate
Scenario
Statewide Total 1,004,771 7,615,086,733$ 292,887,951$ 7,907,974,684$ 550,189 1,500,495,384$ 769,325,576$ 2,269,820,960$ 10,177,795,644$
District Total 5,944 45,048,085$ 1,732,619$ 46,780,703$ 2,667 7,273,693$ 3,729,327$ 11,003,020$ 57,783,723$
Travis (16%) 5,944 45,048,085$ 1,732,619$ 46,780,703$ 2,667 7,273,693$ 3,729,327$ 11,003,020$ 57,783,723$
Note: New local tax revenues are an allocation of the statewide estimate based on the county share of state personal income and further allocated in partial counties according to the share of county population. Variations in personal income or the concentration of direct health care spending in parts of counties could alter these allocations. Remaining columns reflect allocations of statewide estimates according to the county share of adults below 138% FPL or children below 200% FPL, as applicable, and further allocated for partial counties according to the share of the county's total population. Variations in percentages of adults below 138% FPL and children below 200% FPL could alter these estimates. Hospital charity cost data exclude certain hospitals, such as those exempt from reporting, hospitals that report by system, and others, resulting in a conservative estimate of unreimbursed charity costs. Medicaid extension to adults would not relieve all local unreimbursed costs due to ineligible adults, such as undocumented immigrants, people served with incomes above 138% FPL or health care for incarcerated adults other than inpatient hospital stays. 2016 is the first full year of implementation; the federal match rate falls to 95 percent in 2017 and to 90 percent by 2020. For full county-level data, see Appendix C, and for further notes and cautions in interpreting these data, see Appendix A, in "Smart, Affordable and Fair: Why Texas Should Extend Medicaid to Low-Income Adults," at http://www.mhm.org/images/stories/advocacy_and_public_policy/Smart%20Affordable%20and%20Fair_FNL_FULL.pdf.

Impact of Medicaid Extension and Local Spending for Health CareHouse District 50 - Representative Mark Strama
County
2014-2017 New Local Tax
Revenue (Adult Expansion)
2011 County Indigent
Healthcare & Unreimbursed Jail Healthcare
Costs
2011 Total Hospital District or City/County Unreimbursed
Healthcare Expenditures
2010 Total Hospital Charity
Care Costs
Total Unreimbursed Charity Care
Costs for Local Jurisdictions &
Hospitals
2014-2017 Adults Federal Funds
Limited Scenario
2014-2017 Adults Federal Funds
Moderate Scenario
2014-2017 Adults State
Funds Moderate Scenario
2014-2017 Adults Federal Funds
Enhanced Scenario
Statewide Total 2,101,392,352$ 258,927,030$ 2,544,037,688$ 1,836,673,862$ 4,380,711,550$ 14,274,023,031$ 22,962,552,386$ 1,283,318,611$ 31,030,479,514$
District Total 15,310,546$ 2,495,756$ 25,433,118$ 18,392,686$ 43,825,804$ 84,039,708$ 135,194,275$ 7,555,664$ 182,694,986$ Travis (16%) 15,310,546$ 2,495,756$ 25,433,118$ 18,392,686$ 43,825,804$ 84,039,708$ 135,194,275$ 7,555,664$ 182,694,986$
ANALYSIS BY BILLY HAMILTON CONSULTING
Extending Medicaid to Low-Income Adults Will Save Local Tax Dollars and Grow the Economy
Download this one-pager at www.texasimpact.org/Local-Taxpayers-Win-With-Medicaid Download the full report at www.mhm.org
Download the executive summary at www.texasimpact.org
For more information about the report, “Smart, Affordable and Fair” call Texas Impact at 512/472-3903 or email [email protected]

Impact of Medicaid Extension and Local Spending for Health CareHouse District 50 - Representative Mark Strama
County
2016 Adults <138% FPL Enrollees Moderate Scenario
2016 Adults Federal Funds
Moderate Scenario
2016 Adults State Funds Moderate Scenario
2016 Adults All Funds Moderate Scenario
2016 Children <200% FPL Enrollees Moderate Scenario
2016 Children Federal Funds
Moderate Scenario
2016 Children State Funds Moderate Scenario
2016 Children All Funds Moderate Scenario
2016 Adults & Children
All Funds Moderate Scenario
Statewide Total 1,004,771 7,615,086,733$ 292,887,951$ 7,907,974,684$ 550,189 1,500,495,384$ 769,325,576$ 2,269,820,960$ 10,177,795,644$
District Total 5,916 44,834,569$ 1,724,406$ 46,558,975$ 2,654 7,239,217$ 3,711,651$ 10,950,868$ 57,509,844$ Travis (16%) 5,916 44,834,569$ 1,724,406$ 46,558,975$ 2,654 7,239,217$ 3,711,651$ 10,950,868$ 57,509,844$ Note: New local tax revenues are an allocation of the statewide estimate based on the county share of state personal income and further allocated in partial counties according to the share of county population. Variations in personal income or the concentration of direct health care spending in parts of counties could alter these allocations. Remaining columns reflect allocations of statewide estimates according to the county share of adults below 138% FPL or children below 200% FPL, as applicable, and further allocated for partial counties according to the share of the county's total population. Variations in percentages of adults below 138% FPL and children below 200% FPL could alter these estimates. Hospital charity cost data exclude certain hospitals, such as those exempt from reporting, hospitals that report by system, and others, resulting in a conservative estimate of unreimbursed charity costs. Medicaid extension to adults would not relieve all local unreimbursed costs due to ineligible adults, such as undocumented immigrants, people served with incomes above 138% FPL or health care for incarcerated adults other than inpatient hospital stays. 2016 is the first full year of implementation; the federal match rate falls to 95 percent in 2017 and to 90 percent by 2020. For full county-level data, see Appendix C, and for further notes and cautions in interpreting these data, see Appendix A, in "Smart, Affordable and Fair: Why Texas Should Extend Medicaid to Low-Income Adults," at http://www.mhm.org/images/stories/advocacy_and_public_policy/Smart%20Affordable%20and%20Fair_FNL_FULL.pdf.

Impact of Medicaid Extension and Local Spending for Health CareHouse District 51 - Representative Eddie Rodriguez
County
2014-2017 New Local Tax
Revenue (Adult Expansion)
2011 County Indigent
Healthcare & Unreimbursed Jail Healthcare
Costs
2011 Total Hospital District or City/County Unreimbursed
Healthcare Expenditures
2010 Total Hospital Charity
Care Costs
Total Unreimbursed Charity Care
Costs for Local Jurisdictions &
Hospitals
2014-2017 Adults Federal Funds
Limited Scenario
2014-2017 Adults Federal Funds
Moderate Scenario
2014-2017 Adults State
Funds Moderate Scenario
2014-2017 Adults Federal Funds
Enhanced Scenario
Statewide Total 2,101,392,352$ 258,927,030$ 2,544,037,688$ 1,836,673,862$ 4,380,711,550$ 14,274,023,031$ 22,962,552,386$ 1,283,318,611$ 31,030,479,514$
District Total 16,155,810$ 2,633,542$ 26,837,228$ 19,408,107$ 46,245,335$ 88,679,364$ 142,658,068$ 7,972,796$ 192,781,194$ Travis (17%) 16,155,810$ 2,633,542$ 26,837,228$ 19,408,107$ 46,245,335$ 88,679,364$ 142,658,068$ 7,972,796$ 192,781,194$
ANALYSIS BY BILLY HAMILTON CONSULTING
Extending Medicaid to Low-Income Adults Will Save Local Tax Dollars and Grow the Economy
Download this one-pager at www.texasimpact.org/Local-Taxpayers-Win-With-Medicaid Download the full report at www.mhm.org
Download the executive summary at www.texasimpact.org
For more information about the report, “Smart, Affordable and Fair” call Texas Impact at 512/472-3903 or email [email protected]

Impact of Medicaid Extension and Local Spending for Health CareHouse District 51 - Representative Eddie Rodriguez
County
2016 Adults <138% FPL Enrollees Moderate Scenario
2016 Adults Federal Funds
Moderate Scenario
2016 Adults State Funds Moderate Scenario
2016 Adults All Funds Moderate Scenario
2016 Children <200% FPL Enrollees Moderate Scenario
2016 Children Federal Funds
Moderate Scenario
2016 Children State Funds Moderate Scenario
2016 Children All Funds Moderate Scenario
2016 Adults & Children
All Funds Moderate Scenario
Statewide Total 1,004,771 7,615,086,733$ 292,887,951$ 7,907,974,684$ 550,189 1,500,495,384$ 769,325,576$ 2,269,820,960$ 10,177,795,644$
District Total 6,242 47,309,791$ 1,819,607$ 49,129,399$ 2,801 7,638,880$ 3,916,563$ 11,555,443$ 60,684,842$ Travis (17%) 6,242 47,309,791$ 1,819,607$ 49,129,399$ 2,801 7,638,880$ 3,916,563$ 11,555,443$ 60,684,842$ Note: New local tax revenues are an allocation of the statewide estimate based on the county share of state personal income and further allocated in partial counties according to the share of county population. Variations in personal income or the concentration of direct health care spending in parts of counties could alter these allocations. Remaining columns reflect allocations of statewide estimates according to the county share of adults below 138% FPL or children below 200% FPL, as applicable, and further allocated for partial counties according to the share of the county's total population. Variations in percentages of adults below 138% FPL and children below 200% FPL could alter these estimates. Hospital charity cost data exclude certain hospitals, such as those exempt from reporting, hospitals that report by system, and others, resulting in a conservative estimate of unreimbursed charity costs. Medicaid extension to adults would not relieve all local unreimbursed costs due to ineligible adults, such as undocumented immigrants, people served with incomes above 138% FPL or health care for incarcerated adults other than inpatient hospital stays. 2016 is the first full year of implementation; the federal match rate falls to 95 percent in 2017 and to 90 percent by 2020. For full county-level data, see Appendix C, and for further notes and cautions in interpreting these data, see Appendix A, in "Smart, Affordable and Fair: Why Texas Should Extend Medicaid to Low-Income Adults," at http://www.mhm.org/images/stories/advocacy_and_public_policy/Smart%20Affordable%20and%20Fair_FNL_FULL.pdf.

Impact of Medicaid Extension and Local Spending for Health CareHouse District 52 - Representative Larry Gonzales
County
2014-2017 New Local Tax
Revenue (Adult Expansion)
2011 County Indigent
Healthcare & Unreimbursed Jail Healthcare
Costs
2011 Total Hospital District or City/County Unreimbursed
Healthcare Expenditures
2010 Total Hospital Charity
Care Costs
Total Unreimbursed Charity Care
Costs for Local Jurisdictions &
Hospitals
2014-2017 Adults Federal Funds
Limited Scenario
2014-2017 Adults Federal Funds
Moderate Scenario
2014-2017 Adults State
Funds Moderate Scenario
2014-2017 Adults Federal Funds
Enhanced Scenario
Statewide Total 2,101,392,352$ 258,927,030$ 2,544,037,688$ 1,836,673,862$ 4,380,711,550$ 14,274,023,031$ 22,962,552,386$ 1,283,318,611$ 31,030,479,514$
District Total 13,784,172$ 1,329,463$ 4,886,919$ 1,059,215$ 5,946,134$ 74,777,668$ 120,294,477$ 6,722,952$ 162,560,121$ Wil l iamson (39%) 13,784,172$ 1,329,463$ 4,886,919$ 1,059,215$ 5,946,134$ 74,777,668$ 120,294,477$ 6,722,952$ 162,560,121$
ANALYSIS BY BILLY HAMILTON CONSULTING
Extending Medicaid to Low-Income Adults Will Save Local Tax Dollars and Grow the Economy
Download this one-pager at www.texasimpact.org/Local-Taxpayers-Win-With-Medicaid Download the full report at www.mhm.org
Download the executive summary at www.texasimpact.org
For more information about the report, “Smart, Affordable and Fair” call Texas Impact at 512/472-3903 or email [email protected]

Impact of Medicaid Extension and Local Spending for Health CareHouse District 52 - Representative Larry Gonzales
County
2016 Adults
<138% FPL
Enrollees
Moderate
Scenario
2016 Adults
Federal Funds
Moderate
Scenario
2016 Adults
State Funds
Moderate
Scenario
2016 Adults
All Funds
Moderate
Scenario
2016 Children
<200% FPL
Enrollees
Moderate
Scenario
2016 Children
Federal Funds
Moderate
Scenario
2016 Children
State Funds
Moderate
Scenario
2016 Children
All Funds
Moderate
Scenario
2016 Adults &
Children
All Funds
Moderate
Scenario
Statewide Total 1,004,771 7,615,086,733$ 292,887,951$ 7,907,974,684$ 550,189 1,500,495,384$ 769,325,576$ 2,269,820,960$ 10,177,795,644$
District Total 5,264 39,893,338$ 1,534,359$ 41,427,698$ 2,593 7,072,449$ 3,626,146$ 10,698,596$ 52,126,293$
Wil l iamson (39%) 5,264 39,893,338$ 1,534,359$ 41,427,698$ 2,593 7,072,449$ 3,626,146$ 10,698,596$ 52,126,293$
Note: New local tax revenues are an allocation of the statewide estimate based on the county share of state personal income and further allocated in partial counties according to the share of county population. Variations in personal income or the concentration of direct health care spending in parts of counties could alter these allocations. Remaining columns reflect allocations of statewide estimates according to the county share of adults below 138% FPL or children below 200% FPL, as applicable, and further allocated for partial counties according to the share of the county's total population. Variations in percentages of adults below 138% FPL and children below 200% FPL could alter these estimates. Hospital charity cost data exclude certain hospitals, such as those exempt from reporting, hospitals that report by system, and others, resulting in a conservative estimate of unreimbursed charity costs. Medicaid extension to adults would not relieve all local unreimbursed costs due to ineligible adults, such as undocumented immigrants, people served with incomes above 138% FPL or health care for incarcerated adults other than inpatient hospital stays. 2016 is the first full year of implementation; the federal match rate falls to 95 percent in 2017 and to 90 percent by 2020. For full county-level data, see Appendix C, and for further notes and cautions in interpreting these data, see Appendix A, in "Smart, Affordable and Fair: Why Texas Should Extend Medicaid to Low-Income Adults," at http://www.mhm.org/images/stories/advocacy_and_public_policy/Smart%20Affordable%20and%20Fair_FNL_FULL.pdf.
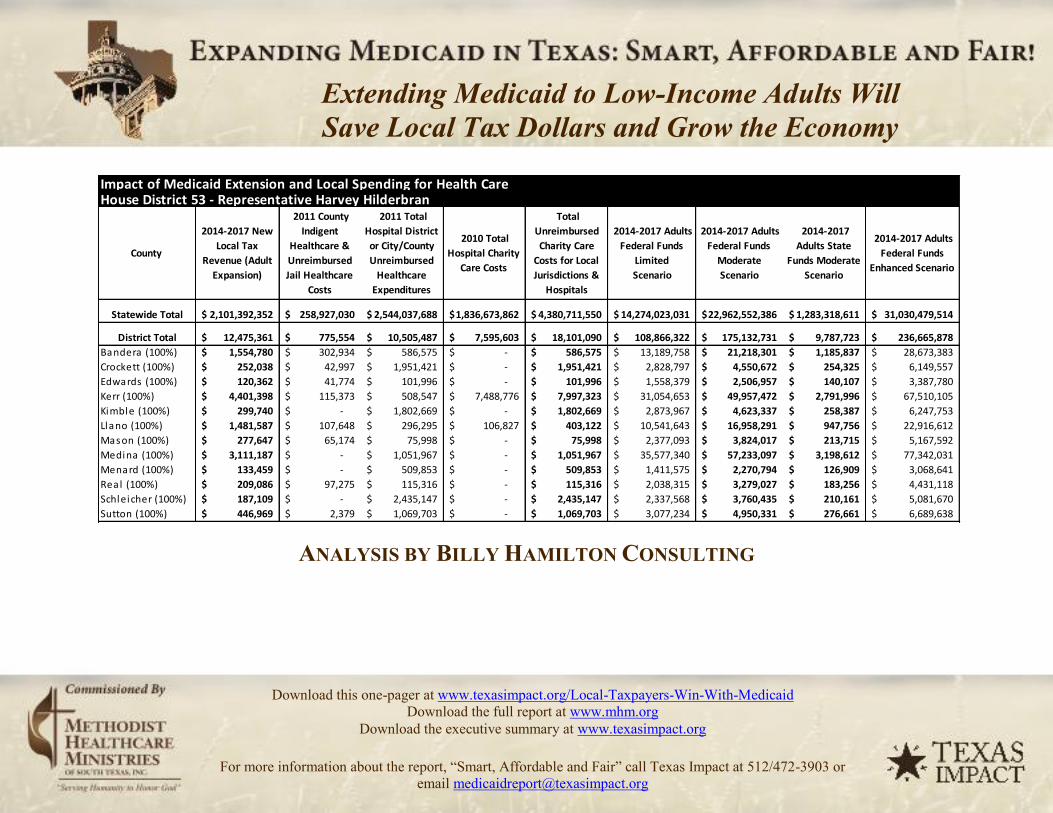
Impact of Medicaid Extension and Local Spending for Health CareHouse District 53 - Representative Harvey Hilderbran
County
2014-2017 New Local Tax
Revenue (Adult Expansion)
2011 County Indigent
Healthcare & Unreimbursed Jail Healthcare
Costs
2011 Total Hospital District or City/County Unreimbursed
Healthcare Expenditures
2010 Total Hospital Charity
Care Costs
Total Unreimbursed Charity Care
Costs for Local Jurisdictions &
Hospitals
2014-2017 Adults Federal Funds
Limited Scenario
2014-2017 Adults Federal Funds
Moderate Scenario
2014-2017 Adults State
Funds Moderate Scenario
2014-2017 Adults Federal Funds
Enhanced Scenario
Statewide Total 2,101,392,352$ 258,927,030$ 2,544,037,688$ 1,836,673,862$ 4,380,711,550$ 14,274,023,031$ 22,962,552,386$ 1,283,318,611$ 31,030,479,514$
District Total 12,475,361$ 775,554$ 10,505,487$ 7,595,603$ 18,101,090$ 108,866,322$ 175,132,731$ 9,787,723$ 236,665,878$ Bandera (100%) 1,554,780$ 302,934$ 586,575$ -$ 586,575$ 13,189,758$ 21,218,301$ 1,185,837$ 28,673,383$ Crockett (100%) 252,038$ 42,997$ 1,951,421$ -$ 1,951,421$ 2,828,797$ 4,550,672$ 254,325$ 6,149,557$ Edwards (100%) 120,362$ 41,774$ 101,996$ -$ 101,996$ 1,558,379$ 2,506,957$ 140,107$ 3,387,780$ Kerr (100%) 4,401,398$ 115,373$ 508,547$ 7,488,776$ 7,997,323$ 31,054,653$ 49,957,472$ 2,791,996$ 67,510,105$ Kimble (100%) 299,740$ -$ 1,802,669$ -$ 1,802,669$ 2,873,967$ 4,623,337$ 258,387$ 6,247,753$ Llano (100%) 1,481,587$ 107,648$ 296,295$ 106,827$ 403,122$ 10,541,643$ 16,958,291$ 947,756$ 22,916,612$ Mason (100%) 277,647$ 65,174$ 75,998$ -$ 75,998$ 2,377,093$ 3,824,017$ 213,715$ 5,167,592$ Medina (100%) 3,111,187$ -$ 1,051,967$ -$ 1,051,967$ 35,577,340$ 57,233,097$ 3,198,612$ 77,342,031$ Menard (100%) 133,459$ -$ 509,853$ -$ 509,853$ 1,411,575$ 2,270,794$ 126,909$ 3,068,641$ Real (100%) 209,086$ 97,275$ 115,316$ -$ 115,316$ 2,038,315$ 3,279,027$ 183,256$ 4,431,118$ Schleicher (100%) 187,109$ -$ 2,435,147$ -$ 2,435,147$ 2,337,568$ 3,760,435$ 210,161$ 5,081,670$ Sutton (100%) 446,969$ 2,379$ 1,069,703$ -$ 1,069,703$ 3,077,234$ 4,950,331$ 276,661$ 6,689,638$
ANALYSIS BY BILLY HAMILTON CONSULTING
Extending Medicaid to Low-Income Adults Will Save Local Tax Dollars and Grow the Economy
Download this one-pager at www.texasimpact.org/Local-Taxpayers-Win-With-Medicaid Download the full report at www.mhm.org
Download the executive summary at www.texasimpact.org
For more information about the report, “Smart, Affordable and Fair” call Texas Impact at 512/472-3903 or email [email protected]
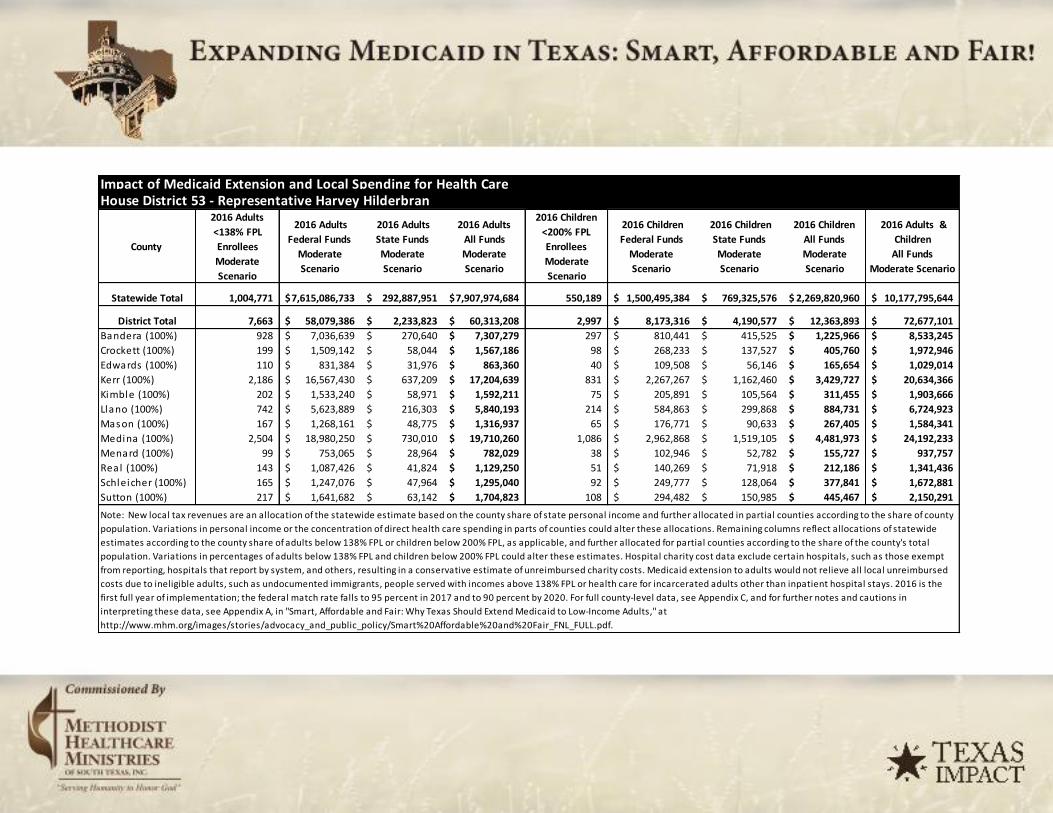
Impact of Medicaid Extension and Local Spending for Health CareHouse District 53 - Representative Harvey Hilderbran
County
2016 Adults <138% FPL Enrollees Moderate Scenario
2016 Adults Federal Funds
Moderate Scenario
2016 Adults State Funds Moderate Scenario
2016 Adults All Funds Moderate Scenario
2016 Children <200% FPL Enrollees Moderate Scenario
2016 Children Federal Funds
Moderate Scenario
2016 Children State Funds Moderate Scenario
2016 Children All Funds Moderate Scenario
2016 Adults & Children
All Funds Moderate Scenario
Statewide Total 1,004,771 7,615,086,733$ 292,887,951$ 7,907,974,684$ 550,189 1,500,495,384$ 769,325,576$ 2,269,820,960$ 10,177,795,644$
District Total 7,663 58,079,386$ 2,233,823$ 60,313,208$ 2,997 8,173,316$ 4,190,577$ 12,363,893$ 72,677,101$ Bandera (100%) 928 7,036,639$ 270,640$ 7,307,279$ 297 810,441$ 415,525$ 1,225,966$ 8,533,245$ Crockett (100%) 199 1,509,142$ 58,044$ 1,567,186$ 98 268,233$ 137,527$ 405,760$ 1,972,946$ Edwards (100%) 110 831,384$ 31,976$ 863,360$ 40 109,508$ 56,146$ 165,654$ 1,029,014$ Kerr (100%) 2,186 16,567,430$ 637,209$ 17,204,639$ 831 2,267,267$ 1,162,460$ 3,429,727$ 20,634,366$ Kimble (100%) 202 1,533,240$ 58,971$ 1,592,211$ 75 205,891$ 105,564$ 311,455$ 1,903,666$ Llano (100%) 742 5,623,889$ 216,303$ 5,840,193$ 214 584,863$ 299,868$ 884,731$ 6,724,923$ Mason (100%) 167 1,268,161$ 48,775$ 1,316,937$ 65 176,771$ 90,633$ 267,405$ 1,584,341$ Medina (100%) 2,504 18,980,250$ 730,010$ 19,710,260$ 1,086 2,962,868$ 1,519,105$ 4,481,973$ 24,192,233$ Menard (100%) 99 753,065$ 28,964$ 782,029$ 38 102,946$ 52,782$ 155,727$ 937,757$ Real (100%) 143 1,087,426$ 41,824$ 1,129,250$ 51 140,269$ 71,918$ 212,186$ 1,341,436$ Schleicher (100%) 165 1,247,076$ 47,964$ 1,295,040$ 92 249,777$ 128,064$ 377,841$ 1,672,881$ Sutton (100%) 217 1,641,682$ 63,142$ 1,704,823$ 108 294,482$ 150,985$ 445,467$ 2,150,291$
Note: New local tax revenues are an allocation of the statewide estimate based on the county share of state personal income and further allocated in partial counties according to the share of county population. Variations in personal income or the concentration of direct health care spending in parts of counties could alter these allocations. Remaining columns reflect allocations of statewide estimates according to the county share of adults below 138% FPL or children below 200% FPL, as applicable, and further allocated for partial counties according to the share of the county's total population. Variations in percentages of adults below 138% FPL and children below 200% FPL could alter these estimates. Hospital charity cost data exclude certain hospitals, such as those exempt from reporting, hospitals that report by system, and others, resulting in a conservative estimate of unreimbursed charity costs. Medicaid extension to adults would not relieve all local unreimbursed costs due to ineligible adults, such as undocumented immigrants, people served with incomes above 138% FPL or health care for incarcerated adults other than inpatient hospital stays. 2016 is the first full year of implementation; the federal match rate falls to 95 percent in 2017 and to 90 percent by 2020. For full county-level data, see Appendix C, and for further notes and cautions in interpreting these data, see Appendix A, in "Smart, Affordable and Fair: Why Texas Should Extend Medicaid to Low-Income Adults," at http://www.mhm.org/images/stories/advocacy_and_public_policy/Smart%20Affordable%20and%20Fair_FNL_FULL.pdf.

Impact of Medicaid Extension and Local Spending for Health CareHouse District 54 - Representative Jimmie Aycock
County
2014-2017 New Local Tax
Revenue (Adult Expansion)
2011 County Indigent
Healthcare & Unreimbursed Jail Healthcare
Costs
2011 Total Hospital District or City/County Unreimbursed
Healthcare Expenditures
2010 Total Hospital Charity
Care Costs
Total Unreimbursed Charity Care
Costs for Local Jurisdictions &
Hospitals
2014-2017 Adults Federal Funds
Limited Scenario
2014-2017 Adults Federal Funds
Moderate Scenario
2014-2017 Adults State
Funds Moderate Scenario
2014-2017 Adults Federal Funds
Enhanced Scenario
Statewide Total 2,101,392,352$ 258,927,030$ 2,544,037,688$ 1,836,673,862$ 4,380,711,550$ 14,274,023,031$ 22,962,552,386$ 1,283,318,611$ 31,030,479,514$
District Total 14,221,621$ 4,127,263$ 7,125,165$ 33,955,882$ 41,081,046$ 88,742,831$ 142,760,166$ 7,978,502$ 192,919,164$ Bel l (48%) 12,262,116$ 4,079,041$ 5,723,395$ 33,955,882$ 39,679,277$ 75,445,793$ 121,369,285$ 6,783,020$ 164,012,565$ Lampasas (100%) 1,959,505$ 48,222$ 1,401,770$ -$ 1,401,770$ 13,297,038$ 21,390,881$ 1,195,482$ 28,906,599$
ANALYSIS BY BILLY HAMILTON CONSULTING
Extending Medicaid to Low-Income Adults Will Save Local Tax Dollars and Grow the Economy
Download this one-pager at www.texasimpact.org/Local-Taxpayers-Win-With-Medicaid Download the full report at www.mhm.org
Download the executive summary at www.texasimpact.org
For more information about the report, “Smart, Affordable and Fair” call Texas Impact at 512/472-3903 or email [email protected]

Impact of Medicaid Extension and Local Spending for Health CareHouse District 54 - Representative Jimmie Aycock
County
2016 Adults <138% FPL Enrollees Moderate Scenario
2016 Adults Federal Funds
Moderate Scenario
2016 Adults State Funds Moderate Scenario
2016 Adults All Funds Moderate Scenario
2016 Children <200% FPL Enrollees Moderate Scenario
2016 Children Federal Funds
Moderate Scenario
2016 Children State Funds Moderate Scenario
2016 Children All Funds Moderate Scenario
2016 Adults & Children
All Funds Moderate Scenario
Statewide Total 1,004,771 7,615,086,733$ 292,887,951$ 7,907,974,684$ 550,189 1,500,495,384$ 769,325,576$ 2,269,820,960$ 10,177,795,644$
District Total 6,247 47,343,650$ 1,820,910$ 49,164,560$ 3,706 10,105,974$ 5,181,478$ 15,287,452$ 64,452,011$ Bel l (48%) 5,311 40,249,778$ 1,548,068$ 41,797,846$ 3,337 9,100,715$ 4,666,067$ 13,766,782$ 55,564,628$ Lampasas (100%) 936 7,093,872$ 272,841$ 7,366,714$ 369 1,005,259$ 515,411$ 1,520,669$ 8,887,383$ Note: New local tax revenues are an allocation of the statewide estimate based on the county share of state personal income and further allocated in partial counties according to the share of county population. Variations in personal income or the concentration of direct health care spending in parts of counties could alter these allocations. Remaining columns reflect allocations of statewide estimates according to the county share of adults below 138% FPL or children below 200% FPL, as applicable, and further allocated for partial counties according to the share of the county's total population. Variations in percentages of adults below 138% FPL and children below 200% FPL could alter these estimates. Hospital charity cost data exclude certain hospitals, such as those exempt from reporting, hospitals that report by system, and others, resulting in a conservative estimate of unreimbursed charity costs. Medicaid extension to adults would not relieve all local unreimbursed costs due to ineligible adults, such as undocumented immigrants, people served with incomes above 138% FPL or health care for incarcerated adults other than inpatient hospital stays. 2016 is the first full year of implementation; the federal match rate falls to 95 percent in 2017 and to 90 percent by 2020. For full county-level data, see Appendix C, and for further notes and cautions in interpreting these data, see Appendix A, in "Smart, Affordable and Fair: Why Texas Should Extend Medicaid to Low-Income Adults," at http://www.mhm.org/images/stories/advocacy_and_public_policy/Smart%20Affordable%20and%20Fair_FNL_FULL.pdf.

Impact of Medicaid Extension and Local Spending for Health CareHouse District 55 - Representative Ralph Sheffield
County
2014-2017 New Local Tax
Revenue (Adult Expansion)
2011 County Indigent
Healthcare & Unreimbursed Jail Healthcare
Costs
2011 Total Hospital District or City/County Unreimbursed
Healthcare Expenditures
2010 Total Hospital Charity
Care Costs
Total Unreimbursed Charity Care
Costs for Local Jurisdictions &
Hospitals
2014-2017 Adults Federal Funds
Limited Scenario
2014-2017 Adults Federal Funds
Moderate Scenario
2014-2017 Adults State
Funds Moderate Scenario
2014-2017 Adults Federal Funds
Enhanced Scenario
Statewide Total 2,101,392,352$ 258,927,030$ 2,544,037,688$ 1,836,673,862$ 4,380,711,550$ 14,274,023,031$ 22,962,552,386$ 1,283,318,611$ 31,030,479,514$
District Total 13,431,273$ 4,467,965$ 6,269,104$ 37,193,477$ 43,462,582$ 82,639,332$ 132,941,497$ 7,429,762$ 179,650,691$ Bel l (52%) 13,431,273$ 4,467,965$ 6,269,104$ 37,193,477$ 43,462,582$ 82,639,332$ 132,941,497$ 7,429,762$ 179,650,691$
ANALYSIS BY BILLY HAMILTON CONSULTING
Extending Medicaid to Low-Income Adults Will Save Local Tax Dollars and Grow the Economy
Download this one-pager at www.texasimpact.org/Local-Taxpayers-Win-With-Medicaid Download the full report at www.mhm.org
Download the executive summary at www.texasimpact.org
For more information about the report, “Smart, Affordable and Fair” call Texas Impact at 512/472-3903 or email [email protected]

Impact of Medicaid Extension and Local Spending for Health CareHouse District 55 - Representative Ralph Sheffield
County
2016 Adults
<138% FPL
Enrollees
Moderate
Scenario
2016 Adults
Federal Funds
Moderate
Scenario
2016 Adults
State Funds
Moderate
Scenario
2016 Adults
All Funds
Moderate
Scenario
2016 Children
<200% FPL
Enrollees
Moderate
Scenario
2016 Children
Federal Funds
Moderate
Scenario
2016 Children
State Funds
Moderate
Scenario
2016 Children
All Funds
Moderate
Scenario
2016 Adults &
Children
All Funds
Moderate
Scenario
Statewide Total 1,004,771 7,615,086,733$ 292,887,951$ 7,907,974,684$ 550,189 1,500,495,384$ 769,325,576$ 2,269,820,960$ 10,177,795,644$
District Total 5,817 44,087,478$ 1,695,672$ 45,783,151$ 3,655 9,968,442$ 5,110,964$ 15,079,405$ 60,862,556$
Bel l (52%) 5,817 44,087,478$ 1,695,672$ 45,783,151$ 3,655 9,968,442$ 5,110,964$ 15,079,405$ 60,862,556$
Note: New local tax revenues are an allocation of the statewide estimate based on the county share of state personal income and further allocated in partial counties according to the share of county population. Variations in personal income or the concentration of direct health care spending in parts of counties could alter these allocations. Remaining columns reflect allocations of statewide estimates according to the county share of adults below 138% FPL or children below 200% FPL, as applicable, and further allocated for partial counties according to the share of the county's total population. Variations in percentages of adults below 138% FPL and children below 200% FPL could alter these estimates. Hospital charity cost data exclude certain hospitals, such as those exempt from reporting, hospitals that report by system, and others, resulting in a conservative estimate of unreimbursed charity costs. Medicaid extension to adults would not relieve all local unreimbursed costs due to ineligible adults, such as undocumented immigrants, people served with incomes above 138% FPL or health care for incarcerated adults other than inpatient hospital stays. 2016 is the first full year of implementation; the federal match rate falls to 95 percent in 2017 and to 90 percent by 2020. For full county-level data, see Appendix C, and for further notes and cautions in interpreting these data, see Appendix A, in "Smart, Affordable and Fair: Why Texas Should Extend Medicaid to Low-Income Adults," at http://www.mhm.org/images/stories/advocacy_and_public_policy/Smart%20Affordable%20and%20Fair_FNL_FULL.pdf.

Impact of Medicaid Extension and Local Spending for Health CareHouse District 56 - Representative Charles "Doc" Anderson
County
2014-2017 New Local Tax
Revenue (Adult Expansion)
2011 County Indigent
Healthcare & Unreimbursed Jail Healthcare
Costs
2011 Total Hospital District or City/County Unreimbursed
Healthcare Expenditures
2010 Total Hospital Charity
Care Costs
Total Unreimbursed Charity Care
Costs for Local Jurisdictions &
Hospitals
2014-2017 Adults Federal Funds
Limited Scenario
2014-2017 Adults Federal Funds
Moderate Scenario
2014-2017 Adults State
Funds Moderate Scenario
2014-2017 Adults Federal Funds
Enhanced Scenario
Statewide Total 2,101,392,352$ 258,927,030$ 2,544,037,688$ 1,836,673,862$ 4,380,711,550$ 14,274,023,031$ 22,962,552,386$ 1,283,318,611$ 31,030,479,514$
District Total 11,844,292$ 3,771,906$ 5,300,944$ 23,826,065$ 29,127,010$ 133,321,350$ 214,473,417$ 11,986,373$ 289,828,973$ McLennan (70%) 11,844,292$ 3,771,906$ 5,300,944$ 23,826,065$ 29,127,010$ 133,321,350$ 214,473,417$ 11,986,373$ 289,828,973$
ANALYSIS BY BILLY HAMILTON CONSULTING
Extending Medicaid to Low-Income Adults Will Save Local Tax Dollars and Grow the Economy
Download this one-pager at www.texasimpact.org/Local-Taxpayers-Win-With-Medicaid Download the full report at www.mhm.org
Download the executive summary at www.texasimpact.org
For more information about the report, “Smart, Affordable and Fair” call Texas Impact at 512/472-3903 or email [email protected]

Impact of Medicaid Extension and Local Spending for Health CareHouse District 56 - Representative Charles "Doc" Anderson
County
2016 Adults <138% FPL Enrollees Moderate Scenario
2016 Adults Federal Funds
Moderate Scenario
2016 Adults State Funds Moderate Scenario
2016 Adults All Funds Moderate Scenario
2016 Children <200% FPL Enrollees Moderate Scenario
2016 Children Federal Funds
Moderate Scenario
2016 Children State Funds Moderate Scenario
2016 Children All Funds Moderate Scenario
2016 Adults & Children
All Funds Moderate Scenario
Statewide Total 1,004,771 7,615,086,733$ 292,887,951$ 7,907,974,684$ 550,189 1,500,495,384$ 769,325,576$ 2,269,820,960$ 10,177,795,644$
District Total 9,385 71,125,964$ 2,735,614$ 73,861,578$ 3,908 10,657,701$ 5,464,357$ 16,122,058$ 89,983,636$ McLennan (70%) 9,385 71,125,964$ 2,735,614$ 73,861,578$ 3,908 10,657,701$ 5,464,357$ 16,122,058$ 89,983,636$ Note: New local tax revenues are an allocation of the statewide estimate based on the county share of state personal income and further allocated in partial counties according to the share of county population. Variations in personal income or the concentration of direct health care spending in parts of counties could alter these allocations. Remaining columns reflect allocations of statewide estimates according to the county share of adults below 138% FPL or children below 200% FPL, as applicable, and further allocated for partial counties according to the share of the county's total population. Variations in percentages of adults below 138% FPL and children below 200% FPL could alter these estimates. Hospital charity cost data exclude certain hospitals, such as those exempt from reporting, hospitals that report by system, and others, resulting in a conservative estimate of unreimbursed charity costs. Medicaid extension to adults would not relieve all local unreimbursed costs due to ineligible adults, such as undocumented immigrants, people served with incomes above 138% FPL or health care for incarcerated adults other than inpatient hospital stays. 2016 is the first full year of implementation; the federal match rate falls to 95 percent in 2017 and to 90 percent by 2020. For full county-level data, see Appendix C, and for further notes and cautions in interpreting these data, see Appendix A, in "Smart, Affordable and Fair: Why Texas Should Extend Medicaid to Low-Income Adults," at http://www.mhm.org/images/stories/advocacy_and_public_policy/Smart%20Affordable%20and%20Fair_FNL_FULL.pdf.
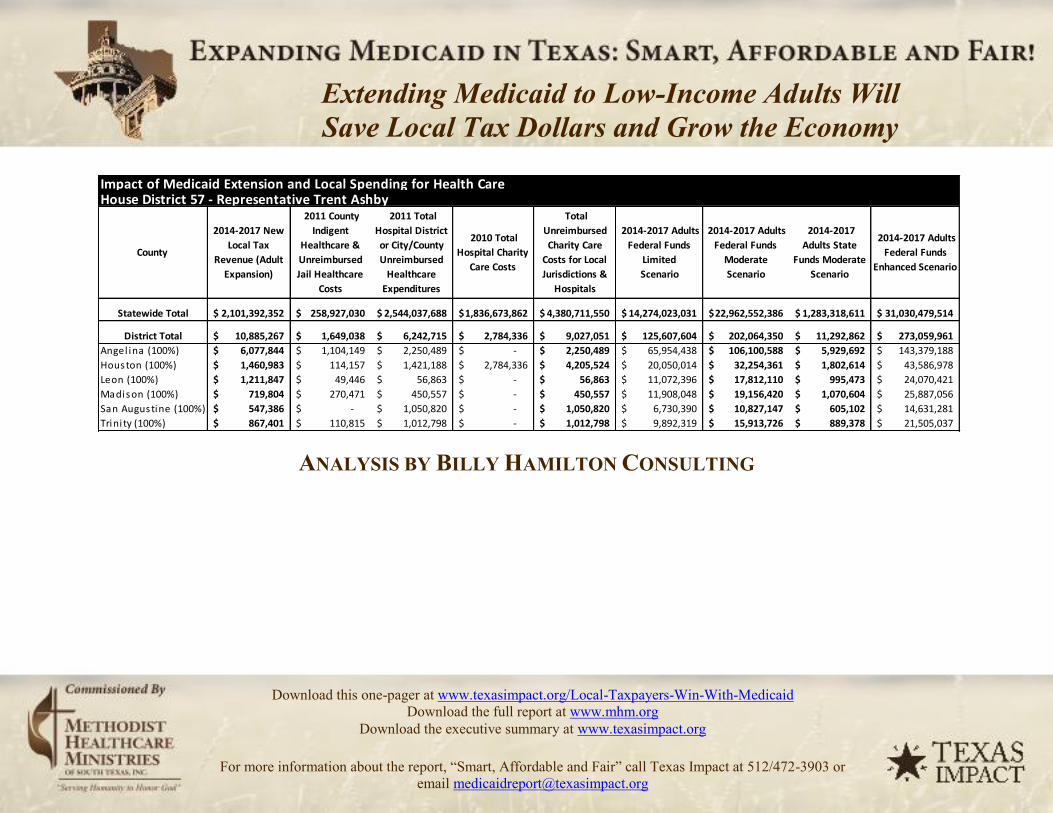
Impact of Medicaid Extension and Local Spending for Health CareHouse District 57 - Representative Trent Ashby
County
2014-2017 New Local Tax
Revenue (Adult Expansion)
2011 County Indigent
Healthcare & Unreimbursed Jail Healthcare
Costs
2011 Total Hospital District or City/County Unreimbursed
Healthcare Expenditures
2010 Total Hospital Charity
Care Costs
Total Unreimbursed Charity Care
Costs for Local Jurisdictions &
Hospitals
2014-2017 Adults Federal Funds
Limited Scenario
2014-2017 Adults Federal Funds
Moderate Scenario
2014-2017 Adults State
Funds Moderate Scenario
2014-2017 Adults Federal Funds
Enhanced Scenario
Statewide Total 2,101,392,352$ 258,927,030$ 2,544,037,688$ 1,836,673,862$ 4,380,711,550$ 14,274,023,031$ 22,962,552,386$ 1,283,318,611$ 31,030,479,514$
District Total 10,885,267$ 1,649,038$ 6,242,715$ 2,784,336$ 9,027,051$ 125,607,604$ 202,064,350$ 11,292,862$ 273,059,961$ Angel ina (100%) 6,077,844$ 1,104,149$ 2,250,489$ -$ 2,250,489$ 65,954,438$ 106,100,588$ 5,929,692$ 143,379,188$ Houston (100%) 1,460,983$ 114,157$ 1,421,188$ 2,784,336$ 4,205,524$ 20,050,014$ 32,254,361$ 1,802,614$ 43,586,978$ Leon (100%) 1,211,847$ 49,446$ 56,863$ -$ 56,863$ 11,072,396$ 17,812,110$ 995,473$ 24,070,421$ Madison (100%) 719,804$ 270,471$ 450,557$ -$ 450,557$ 11,908,048$ 19,156,420$ 1,070,604$ 25,887,056$ San Augustine (100%) 547,386$ -$ 1,050,820$ -$ 1,050,820$ 6,730,390$ 10,827,147$ 605,102$ 14,631,281$ Trini ty (100%) 867,401$ 110,815$ 1,012,798$ -$ 1,012,798$ 9,892,319$ 15,913,726$ 889,378$ 21,505,037$
ANALYSIS BY BILLY HAMILTON CONSULTING
Extending Medicaid to Low-Income Adults Will Save Local Tax Dollars and Grow the Economy
Download this one-pager at www.texasimpact.org/Local-Taxpayers-Win-With-Medicaid Download the full report at www.mhm.org
Download the executive summary at www.texasimpact.org
For more information about the report, “Smart, Affordable and Fair” call Texas Impact at 512/472-3903 or email [email protected]

Impact of Medicaid Extension and Local Spending for Health CareHouse District 57 - Representative Trent Ashby
County
2016 Adults <138% FPL Enrollees Moderate Scenario
2016 Adults Federal Funds
Moderate Scenario
2016 Adults State Funds Moderate Scenario
2016 Adults All Funds Moderate Scenario
2016 Children <200% FPL Enrollees Moderate Scenario
2016 Children Federal Funds
Moderate Scenario
2016 Children State Funds Moderate Scenario
2016 Children All Funds Moderate Scenario
2016 Adults & Children
All Funds Moderate Scenario
Statewide Total 1,004,771 7,615,086,733$ 292,887,951$ 7,907,974,684$ 550,189 1,500,495,384$ 769,325,576$ 2,269,820,960$ 10,177,795,644$
District Total 8,842 67,010,737$ 2,577,336$ 69,588,073$ 3,423 9,334,019$ 4,785,686$ 14,119,704$ 83,707,777$ Angel ina (100%) 4,643 35,186,209$ 1,353,316$ 36,539,525$ 2,039 5,561,940$ 2,851,687$ 8,413,626$ 44,953,152$ Houston (100%) 1,411 10,696,535$ 411,405$ 11,107,941$ 429 1,169,316$ 599,525$ 1,768,841$ 12,876,781$ Leon (100%) 779 5,907,042$ 227,194$ 6,134,236$ 299 815,363$ 418,048$ 1,233,411$ 7,367,647$ Madison (100%) 838 6,352,856$ 244,341$ 6,597,197$ 262 715,698$ 366,949$ 1,082,647$ 7,679,844$ San Augustine (100%) 474 3,590,614$ 138,101$ 3,728,714$ 156 425,728$ 218,277$ 644,004$ 4,372,719$ Trini ty (100%) 696 5,277,480$ 202,980$ 5,480,460$ 237 645,974$ 331,200$ 977,174$ 6,457,634$ Note: New local tax revenues are an allocation of the statewide estimate based on the county share of state personal income and further allocated in partial counties according to the share of county
population. Variations in personal income or the concentration of direct health care spending in parts of counties could alter these allocations. Remaining columns reflect allocations of statewide
estimates according to the county share of adults below 138% FPL or children below 200% FPL, as applicable, and further allocated for partial counties according to the share of the county's total
population. Variations in percentages of adults below 138% FPL and children below 200% FPL could alter these estimates. Hospital charity cost data exclude certain hospitals, such as those exempt
from reporting, hospitals that report by system, and others, resulting in a conservative estimate of unreimbursed charity costs. Medicaid extension to adults would not relieve all local unreimbursed
costs due to ineligible adults, such as undocumented immigrants, people served with incomes above 138% FPL or health care for incarcerated adults other than inpatient hospital stays. 2016 is the first
full year of implementation; the federal match rate falls to 95 percent in 2017 and to 90 percent by 2020. For full county-level data, see Appendix C, and for further notes and cautions in interpreting
these data, see Appendix A, in "Smart, Affordable and Fair: Why Texas Should Extend Medicaid to Low-Income Adults," at
http://www.mhm.org/images/stories/advocacy_and_public_policy/Smart%20Affordable%20and%20Fair_FNL_FULL.pdf.

Impact of Medicaid Extension and Local Spending for Health CareHouse District 58 - Representative Rob Orr
County
2014-2017 New Local Tax
Revenue (Adult Expansion)
2011 County Indigent
Healthcare & Unreimbursed Jail Healthcare
Costs
2011 Total Hospital District or City/County Unreimbursed
Healthcare Expenditures
2010 Total Hospital Charity
Care Costs
Total Unreimbursed Charity Care
Costs for Local Jurisdictions &
Hospitals
2014-2017 Adults Federal Funds
Limited Scenario
2014-2017 Adults Federal Funds
Moderate Scenario
2014-2017 Adults State
Funds Moderate Scenario
2014-2017 Adults Federal Funds
Enhanced Scenario
Statewide Total 2,101,392,352$ 258,927,030$ 2,544,037,688$ 1,836,673,862$ 4,380,711,550$ 14,274,023,031$ 22,962,552,386$ 1,283,318,611$ 31,030,479,514$
District Total 11,847,221$ 1,685,509$ 2,434,706$ -$ 2,434,706$ 53,018,763$ 85,291,030$ 4,766,699$ 115,258,160$ Bosque (100%) 1,241,726$ 180,901$ 528,434$ -$ 528,434$ 10,970,762$ 17,648,612$ 986,336$ 23,849,479$ Johnson (100%) 10,605,495$ 1,504,608$ 1,906,272$ -$ 1,906,272$ 42,048,001$ 67,642,417$ 3,780,363$ 91,408,682$
ANALYSIS BY BILLY HAMILTON CONSULTING
Extending Medicaid to Low-Income Adults Will Save Local Tax Dollars and Grow the Economy
Download this one-pager at www.texasimpact.org/Local-Taxpayers-Win-With-Medicaid Download the full report at www.mhm.org
Download the executive summary at www.texasimpact.org
For more information about the report, “Smart, Affordable and Fair” call Texas Impact at 512/472-3903 or email [email protected]

Impact of Medicaid Extension and Local Spending for Health CareHouse District 58 - Representative Rob Orr
County
2016 Adults <138% FPL Enrollees Moderate Scenario
2016 Adults Federal Funds
Moderate Scenario
2016 Adults State Funds Moderate Scenario
2016 Adults All Funds Moderate Scenario
2016 Children <200% FPL Enrollees Moderate Scenario
2016 Children Federal Funds
Moderate Scenario
2016 Children State Funds Moderate Scenario
2016 Children All Funds Moderate Scenario
2016 Adults & Children
All Funds Moderate Scenario
Statewide Total 1,004,771 7,615,086,733$ 292,887,951$ 7,907,974,684$ 550,189 1,500,495,384$ 769,325,576$ 2,269,820,960$ 10,177,795,644$
District Total 3,732 28,285,122$ 1,087,889$ 29,373,011$ 2,070 5,645,199$ 2,894,375$ 8,539,573$ 37,912,584$ Bosque (100%) 772 5,852,821$ 225,109$ 6,077,930$ 312 850,635$ 436,133$ 1,286,768$ 7,364,698$ Johnson (100%) 2,960 22,432,300$ 862,781$ 23,295,081$ 1,758 4,794,564$ 2,458,242$ 7,252,805$ 30,547,887$
Note: New local tax revenues are an allocation of the statewide estimate based on the county share of state personal income and further allocated in partial counties according to the share of county population. Variations in personal income or the concentration of direct health care spending in parts of counties could alter these allocations. Remaining columns reflect allocations of statewide estimates according to the county share of adults below 138% FPL or children below 200% FPL, as applicable, and further allocated for partial counties according to the share of the county's total population. Variations in percentages of adults below 138% FPL and children below 200% FPL could alter these estimates. Hospital charity cost data exclude certain hospitals, such as those exempt from reporting, hospitals that report by system, and others, resulting in a conservative estimate of unreimbursed charity costs. Medicaid extension to adults would not relieve all local unreimbursed costs due to ineligible adults, such as undocumented immigrants, people served with incomes above 138% FPL or health care for incarcerated adults other than inpatient hospital stays. 2016 is the first full year of implementation; the federal match rate falls to 95 percent in 2017 and to 90 percent by 2020. For full county-level data, see Appendix C, and for further notes and cautions in interpreting these data, see Appendix A, in "Smart, Affordable and Fair: Why Texas Should Extend Medicaid to Low-Income Adults," at http://www.mhm.org/images/stories/advocacy_and_public_policy/Smart%20Affordable%20and%20Fair_FNL_FULL.pdf.
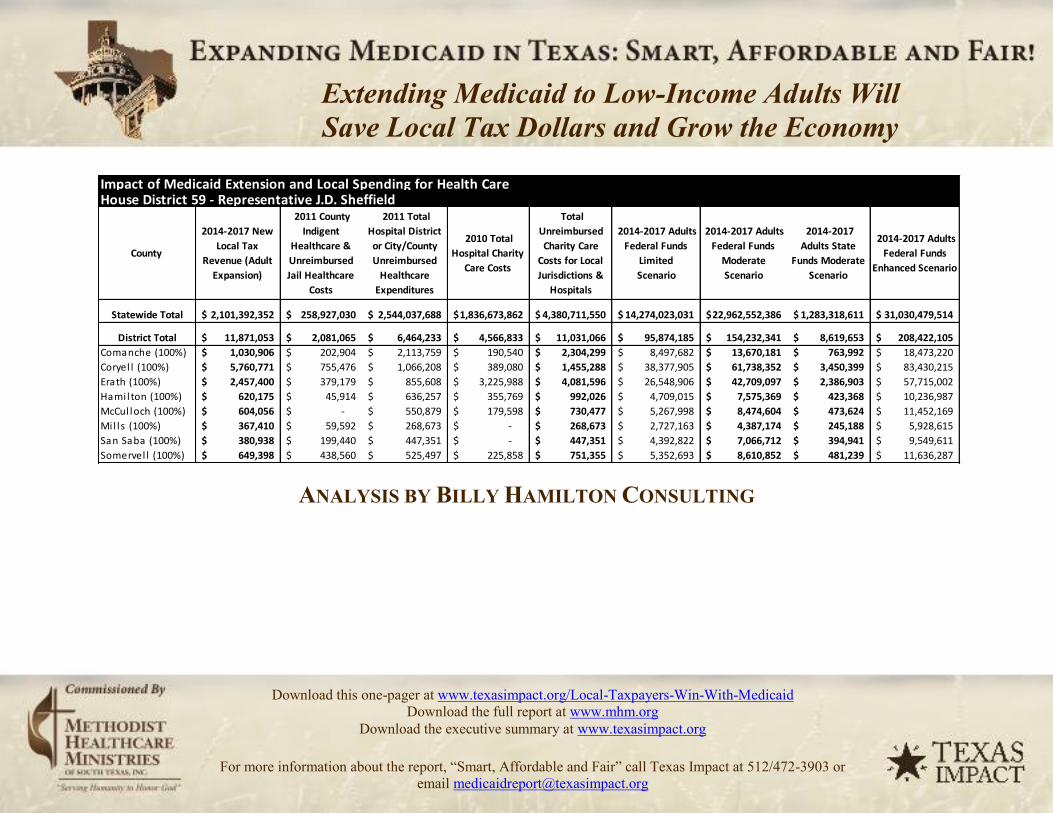
Impact of Medicaid Extension and Local Spending for Health CareHouse District 59 - Representative J.D. Sheffield
County
2014-2017 New Local Tax
Revenue (Adult Expansion)
2011 County Indigent
Healthcare & Unreimbursed Jail Healthcare
Costs
2011 Total Hospital District or City/County Unreimbursed
Healthcare Expenditures
2010 Total Hospital Charity
Care Costs
Total Unreimbursed Charity Care
Costs for Local Jurisdictions &
Hospitals
2014-2017 Adults Federal Funds
Limited Scenario
2014-2017 Adults Federal Funds
Moderate Scenario
2014-2017 Adults State
Funds Moderate Scenario
2014-2017 Adults Federal Funds
Enhanced Scenario
Statewide Total 2,101,392,352$ 258,927,030$ 2,544,037,688$ 1,836,673,862$ 4,380,711,550$ 14,274,023,031$ 22,962,552,386$ 1,283,318,611$ 31,030,479,514$
District Total 11,871,053$ 2,081,065$ 6,464,233$ 4,566,833$ 11,031,066$ 95,874,185$ 154,232,341$ 8,619,653$ 208,422,105$ Comanche (100%) 1,030,906$ 202,904$ 2,113,759$ 190,540$ 2,304,299$ 8,497,682$ 13,670,181$ 763,992$ 18,473,220$ Coryel l (100%) 5,760,771$ 755,476$ 1,066,208$ 389,080$ 1,455,288$ 38,377,905$ 61,738,352$ 3,450,399$ 83,430,215$ Erath (100%) 2,457,400$ 379,179$ 855,608$ 3,225,988$ 4,081,596$ 26,548,906$ 42,709,097$ 2,386,903$ 57,715,002$ Hami l ton (100%) 620,175$ 45,914$ 636,257$ 355,769$ 992,026$ 4,709,015$ 7,575,369$ 423,368$ 10,236,987$ McCul loch (100%) 604,056$ -$ 550,879$ 179,598$ 730,477$ 5,267,998$ 8,474,604$ 473,624$ 11,452,169$ Mi l l s (100%) 367,410$ 59,592$ 268,673$ -$ 268,673$ 2,727,163$ 4,387,174$ 245,188$ 5,928,615$ San Saba (100%) 380,938$ 199,440$ 447,351$ -$ 447,351$ 4,392,822$ 7,066,712$ 394,941$ 9,549,611$ Somervel l (100%) 649,398$ 438,560$ 525,497$ 225,858$ 751,355$ 5,352,693$ 8,610,852$ 481,239$ 11,636,287$
ANALYSIS BY BILLY HAMILTON CONSULTING
Extending Medicaid to Low-Income Adults Will Save Local Tax Dollars and Grow the Economy
Download this one-pager at www.texasimpact.org/Local-Taxpayers-Win-With-Medicaid Download the full report at www.mhm.org
Download the executive summary at www.texasimpact.org
For more information about the report, “Smart, Affordable and Fair” call Texas Impact at 512/472-3903 or email [email protected]

Impact of Medicaid Extension and Local Spending for Health CareHouse District 59 - Representative J.D. Sheffield
County
2016 Adults <138% FPL Enrollees Moderate Scenario
2016 Adults Federal Funds
Moderate Scenario
2016 Adults State Funds Moderate Scenario
2016 Adults All Funds Moderate Scenario
2016 Children <200% FPL Enrollees Moderate Scenario
2016 Children Federal Funds
Moderate Scenario
2016 Children State Funds Moderate Scenario
2016 Children All Funds Moderate Scenario
2016 Adults & Children
All Funds Moderate Scenario
Statewide Total 1,004,771 7,615,086,733$ 292,887,951$ 7,907,974,684$ 550,189 1,500,495,384$ 769,325,576$ 2,269,820,960$ 10,177,795,644$
District Total 6,749 51,148,175$ 1,967,238$ 53,115,413$ 3,183 8,679,842$ 4,450,280$ 13,130,121$ 66,245,534$ Comanche (100%) 598 4,533,451$ 174,364$ 4,707,815$ 275 749,330$ 384,192$ 1,133,522$ 5,841,337$ Coryel l (100%) 2,701 20,474,331$ 787,474$ 21,261,806$ 1,579 4,307,315$ 2,208,422$ 6,515,737$ 27,777,542$ Erath (100%) 1,869 14,163,647$ 544,756$ 14,708,402$ 672 1,832,926$ 939,768$ 2,772,694$ 17,481,096$ Hamil ton (100%) 331 2,512,225$ 96,624$ 2,608,849$ 128 349,851$ 179,374$ 529,225$ 3,138,074$ McCul loch (100%) 371 2,810,439$ 108,094$ 2,918,532$ 165 449,106$ 230,263$ 679,369$ 3,597,901$ Mil ls (100%) 192 1,454,922$ 55,959$ 1,510,880$ 88 238,703$ 122,386$ 361,089$ 1,871,969$ San Saba (100%) 309 2,343,538$ 90,136$ 2,433,674$ 105 285,869$ 146,569$ 432,438$ 2,866,113$ Somervel l (100%) 377 2,855,623$ 109,832$ 2,965,454$ 171 466,742$ 239,305$ 706,047$ 3,671,501$ Note: New local tax revenues are an allocation of the statewide estimate based on the county share of state personal income and further allocated in partial counties according to the share of county population. Variations in personal income or the concentration of direct health care spending in parts of counties could alter these allocations. Remaining columns reflect allocations of statewide estimates according to the county share of adults below 138% FPL or children below 200% FPL, as applicable, and further allocated for partial counties according to the share of the county's total population. Variations in percentages of adults below 138% FPL and children below 200% FPL could alter these estimates. Hospital charity cost data exclude certain hospitals, such as those exempt from reporting, hospitals that report by system, and others, resulting in a conservative estimate of unreimbursed charity costs. Medicaid extension to adults would not relieve all local unreimbursed costs due to ineligible adults, such as undocumented immigrants, people served with incomes above 138% FPL or health care for incarcerated adults other than inpatient hospital stays. 2016 is the first full year of implementation; the federal match rate falls to 95 percent in 2017 and to 90 percent by 2020. For full county-level data, see Appendix C, and for further notes and cautions in interpreting these data, see Appendix A, in "Smart, Affordable and Fair: Why Texas Should Extend Medicaid to Low-Income Adults," at http://www.mhm.org/images/stories/advocacy_and_public_policy/Smart%20Affordable%20and%20Fair_FNL_FULL.pdf.
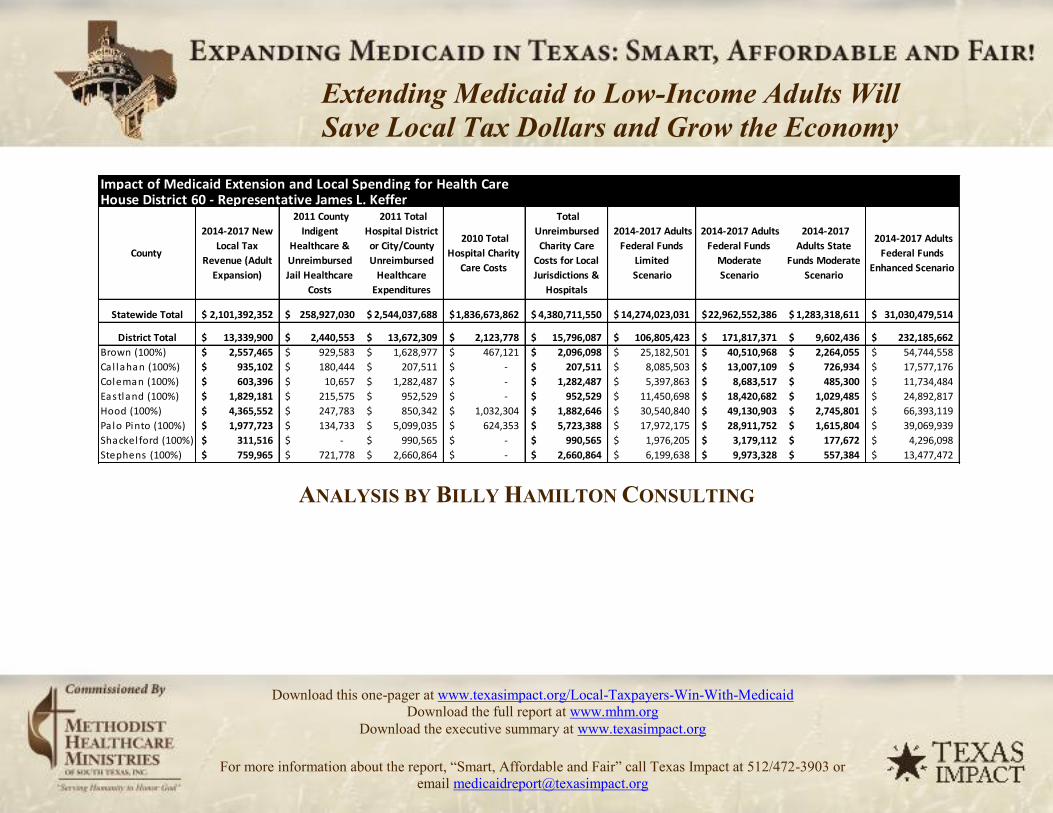
Impact of Medicaid Extension and Local Spending for Health CareHouse District 60 - Representative James L. Keffer
County
2014-2017 New Local Tax
Revenue (Adult Expansion)
2011 County Indigent
Healthcare & Unreimbursed Jail Healthcare
Costs
2011 Total Hospital District or City/County Unreimbursed
Healthcare Expenditures
2010 Total Hospital Charity
Care Costs
Total Unreimbursed Charity Care
Costs for Local Jurisdictions &
Hospitals
2014-2017 Adults Federal Funds
Limited Scenario
2014-2017 Adults Federal Funds
Moderate Scenario
2014-2017 Adults State
Funds Moderate Scenario
2014-2017 Adults Federal Funds
Enhanced Scenario
Statewide Total 2,101,392,352$ 258,927,030$ 2,544,037,688$ 1,836,673,862$ 4,380,711,550$ 14,274,023,031$ 22,962,552,386$ 1,283,318,611$ 31,030,479,514$
District Total 13,339,900$ 2,440,553$ 13,672,309$ 2,123,778$ 15,796,087$ 106,805,423$ 171,817,371$ 9,602,436$ 232,185,662$ Brown (100%) 2,557,465$ 929,583$ 1,628,977$ 467,121$ 2,096,098$ 25,182,501$ 40,510,968$ 2,264,055$ 54,744,558$ Ca l lahan (100%) 935,102$ 180,444$ 207,511$ -$ 207,511$ 8,085,503$ 13,007,109$ 726,934$ 17,577,176$ Coleman (100%) 603,396$ 10,657$ 1,282,487$ -$ 1,282,487$ 5,397,863$ 8,683,517$ 485,300$ 11,734,484$ Eastland (100%) 1,829,181$ 215,575$ 952,529$ -$ 952,529$ 11,450,698$ 18,420,682$ 1,029,485$ 24,892,817$ Hood (100%) 4,365,552$ 247,783$ 850,342$ 1,032,304$ 1,882,646$ 30,540,840$ 49,130,903$ 2,745,801$ 66,393,119$ Pa lo Pinto (100%) 1,977,723$ 134,733$ 5,099,035$ 624,353$ 5,723,388$ 17,972,175$ 28,911,752$ 1,615,804$ 39,069,939$ Shackel ford (100%) 311,516$ -$ 990,565$ -$ 990,565$ 1,976,205$ 3,179,112$ 177,672$ 4,296,098$ Stephens (100%) 759,965$ 721,778$ 2,660,864$ -$ 2,660,864$ 6,199,638$ 9,973,328$ 557,384$ 13,477,472$
ANALYSIS BY BILLY HAMILTON CONSULTING
Extending Medicaid to Low-Income Adults Will Save Local Tax Dollars and Grow the Economy
Download this one-pager at www.texasimpact.org/Local-Taxpayers-Win-With-Medicaid Download the full report at www.mhm.org
Download the executive summary at www.texasimpact.org
For more information about the report, “Smart, Affordable and Fair” call Texas Impact at 512/472-3903 or email [email protected]
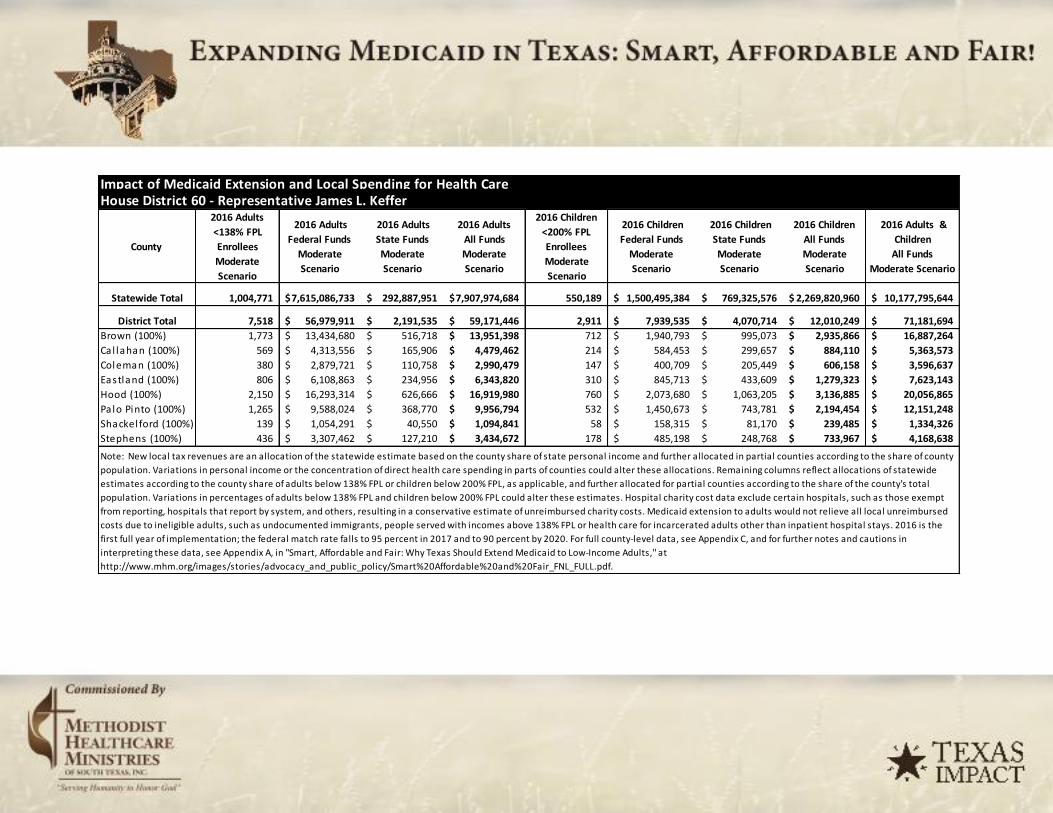
Impact of Medicaid Extension and Local Spending for Health CareHouse District 60 - Representative James L. Keffer
County
2016 Adults
<138% FPL
Enrollees
Moderate
Scenario
2016 Adults
Federal Funds
Moderate
Scenario
2016 Adults
State Funds
Moderate
Scenario
2016 Adults
All Funds
Moderate
Scenario
2016 Children
<200% FPL
Enrollees
Moderate
Scenario
2016 Children
Federal Funds
Moderate
Scenario
2016 Children
State Funds
Moderate
Scenario
2016 Children
All Funds
Moderate
Scenario
2016 Adults &
Children
All Funds
Moderate Scenario
Statewide Total 1,004,771 7,615,086,733$ 292,887,951$ 7,907,974,684$ 550,189 1,500,495,384$ 769,325,576$ 2,269,820,960$ 10,177,795,644$
District Total 7,518 56,979,911$ 2,191,535$ 59,171,446$ 2,911 7,939,535$ 4,070,714$ 12,010,249$ 71,181,694$
Brown (100%) 1,773 13,434,680$ 516,718$ 13,951,398$ 712 1,940,793$ 995,073$ 2,935,866$ 16,887,264$
Cal lahan (100%) 569 4,313,556$ 165,906$ 4,479,462$ 214 584,453$ 299,657$ 884,110$ 5,363,573$
Coleman (100%) 380 2,879,721$ 110,758$ 2,990,479$ 147 400,709$ 205,449$ 606,158$ 3,596,637$
Eastland (100%) 806 6,108,863$ 234,956$ 6,343,820$ 310 845,713$ 433,609$ 1,279,323$ 7,623,143$
Hood (100%) 2,150 16,293,314$ 626,666$ 16,919,980$ 760 2,073,680$ 1,063,205$ 3,136,885$ 20,056,865$
Palo Pinto (100%) 1,265 9,588,024$ 368,770$ 9,956,794$ 532 1,450,673$ 743,781$ 2,194,454$ 12,151,248$
Shackel ford (100%) 139 1,054,291$ 40,550$ 1,094,841$ 58 158,315$ 81,170$ 239,485$ 1,334,326$
Stephens (100%) 436 3,307,462$ 127,210$ 3,434,672$ 178 485,198$ 248,768$ 733,967$ 4,168,638$
Note: New local tax revenues are an allocation of the statewide estimate based on the county share of state personal income and further allocated in partial counties according to the share of county population. Variations in personal income or the concentration of direct health care spending in parts of counties could alter these allocations. Remaining columns reflect allocations of statewide estimates according to the county share of adults below 138% FPL or children below 200% FPL, as applicable, and further allocated for partial counties according to the share of the county's total population. Variations in percentages of adults below 138% FPL and children below 200% FPL could alter these estimates. Hospital charity cost data exclude certain hospitals, such as those exempt from reporting, hospitals that report by system, and others, resulting in a conservative estimate of unreimbursed charity costs. Medicaid extension to adults would not relieve all local unreimbursed costs due to ineligible adults, such as undocumented immigrants, people served with incomes above 138% FPL or health care for incarcerated adults other than inpatient hospital stays. 2016 is the first full year of implementation; the federal match rate falls to 95 percent in 2017 and to 90 percent by 2020. For full county-level data, see Appendix C, and for further notes and cautions in interpreting these data, see Appendix A, in "Smart, Affordable and Fair: Why Texas Should Extend Medicaid to Low-Income Adults," at http://www.mhm.org/images/stories/advocacy_and_public_policy/Smart%20Affordable%20and%20Fair_FNL_FULL.pdf.

Impact of Medicaid Extension and Local Spending for Health CareHouse District 61 - Representative Phil King
County
2014-2017 New Local Tax
Revenue (Adult Expansion)
2011 County Indigent
Healthcare & Unreimbursed Jail Healthcare
Costs
2011 Total Hospital District or City/County Unreimbursed
Healthcare Expenditures
2010 Total Hospital Charity
Care Costs
Total Unreimbursed Charity Care
Costs for Local Jurisdictions &
Hospitals
2014-2017 Adults Federal Funds
Limited Scenario
2014-2017 Adults Federal Funds
Moderate Scenario
2014-2017 Adults State
Funds Moderate Scenario
2014-2017 Adults Federal Funds
Enhanced Scenario
Statewide Total 2,101,392,352$ 258,927,030$ 2,544,037,688$ 1,836,673,862$ 4,380,711,550$ 14,274,023,031$ 22,962,552,386$ 1,283,318,611$ 31,030,479,514$
District Total 13,964,405$ 804,260$ 17,806,111$ 4,540,980$ 22,347,091$ 71,657,201$ 115,274,596$ 6,442,404$ 155,776,498$ Parker (100%) 9,540,045$ 165,929$ 14,956,050$ -$ 14,956,050$ 32,421,058$ 52,155,601$ 2,914,844$ 70,480,549$ Wise (100%) 4,424,360$ 638,331$ 2,850,061$ 4,540,980$ 7,391,041$ 39,236,143$ 63,118,995$ 3,527,560$ 85,295,949$
ANALYSIS BY BILLY HAMILTON CONSULTING
Extending Medicaid to Low-Income Adults Will Save Local Tax Dollars and Grow the Economy
Download this one-pager at www.texasimpact.org/Local-Taxpayers-Win-With-Medicaid Download the full report at www.mhm.org
Download the executive summary at www.texasimpact.org
For more information about the report, “Smart, Affordable and Fair” call Texas Impact at 512/472-3903 or email [email protected]

Impact of Medicaid Extension and Local Spending for Health CareHouse District 61 - Representative Phil King
County
2016 Adults
<138% FPL
Enrollees
Moderate
Scenario
2016 Adults
Federal Funds
Moderate
Scenario
2016 Adults
State Funds
Moderate
Scenario
2016 Adults
All Funds
Moderate
Scenario
2016 Children
<200% FPL
Enrollees
Moderate
Scenario
2016 Children
Federal Funds
Moderate
Scenario
2016 Children
State Funds
Moderate
Scenario
2016 Children
All Funds
Moderate
Scenario
2016 Adults &
Children
All Funds
Moderate
Scenario
Statewide Total 1,004,771 7,615,086,733$ 292,887,951$ 7,907,974,684$ 550,189 1,500,495,384$ 769,325,576$ 2,269,820,960$ 10,177,795,644$
District Total 5,044 38,228,592$ 1,470,330$ 39,698,922$ 2,227 6,073,387$ 3,113,913$ 9,187,300$ 48,886,223$
Parker (100%) 2,282 17,296,397$ 665,246$ 17,961,643$ 1,095 2,986,246$ 1,531,091$ 4,517,338$ 22,478,981$
Wise (100%) 2,762 20,932,195$ 805,084$ 21,737,279$ 1,132 3,087,141$ 1,582,822$ 4,669,963$ 26,407,242$
Note: New local tax revenues are an allocation of the statewide estimate based on the county share of state personal income and further allocated in partial counties according to the share of county population. Variations in personal income or the concentration of direct health care spending in parts of counties could alter these allocations. Remaining columns reflect allocations of statewide estimates according to the county share of adults below 138% FPL or children below 200% FPL, as applicable, and further allocated for partial counties according to the share of the county's total population. Variations in percentages of adults below 138% FPL and children below 200% FPL could alter these estimates. Hospital charity cost data exclude certain hospitals, such as those exempt from reporting, hospitals that report by system, and others, resulting in a conservative estimate of unreimbursed charity costs. Medicaid extension to adults would not relieve all local unreimbursed costs due to ineligible adults, such as undocumented immigrants, people served with incomes above 138% FPL or health care for incarcerated adults other than inpatient hospital stays. 2016 is the first full year of implementation; the federal match rate falls to 95 percent in 2017 and to 90 percent by 2020. For full county-level data, see Appendix C, and for further notes and cautions in interpreting these data, see Appendix A, in "Smart, Affordable and Fair: Why Texas Should Extend Medicaid to Low-Income Adults," at http://www.mhm.org/images/stories/advocacy_and_public_policy/Smart%20Affordable%20and%20Fair_FNL_FULL.pdf.
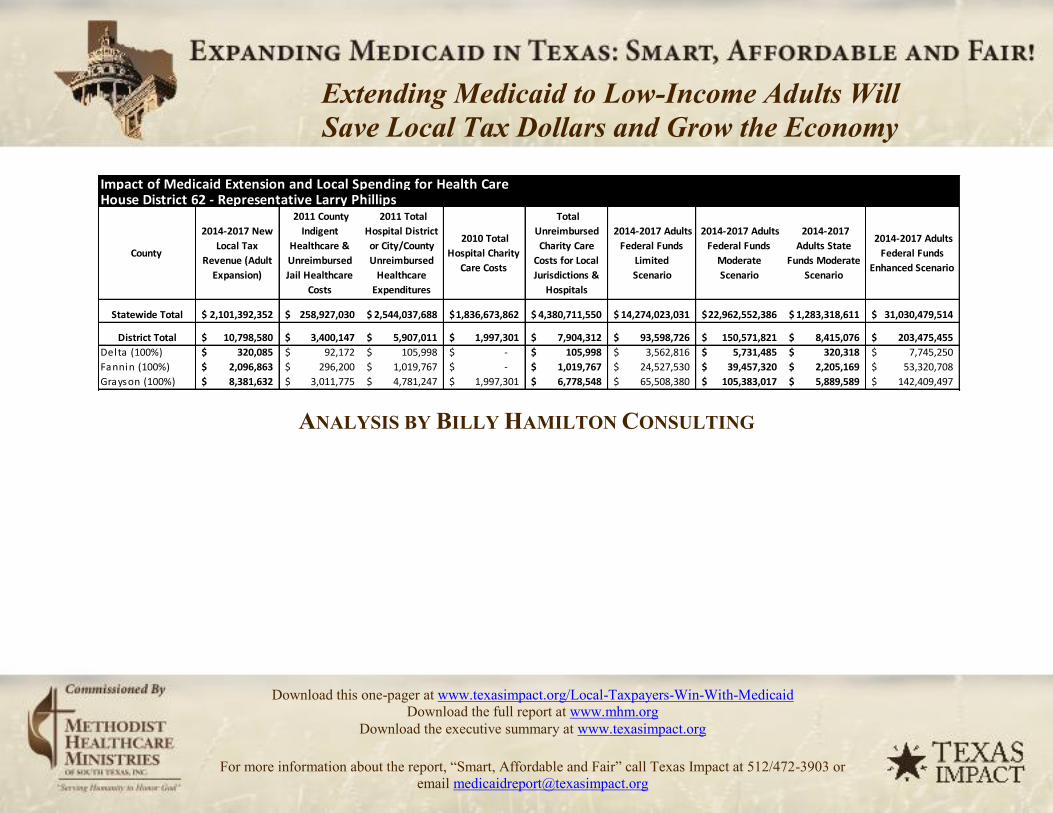
Impact of Medicaid Extension and Local Spending for Health CareHouse District 62 - Representative Larry Phillips
County
2014-2017 New Local Tax
Revenue (Adult Expansion)
2011 County Indigent
Healthcare & Unreimbursed Jail Healthcare
Costs
2011 Total Hospital District or City/County Unreimbursed
Healthcare Expenditures
2010 Total Hospital Charity
Care Costs
Total Unreimbursed Charity Care
Costs for Local Jurisdictions &
Hospitals
2014-2017 Adults Federal Funds
Limited Scenario
2014-2017 Adults Federal Funds
Moderate Scenario
2014-2017 Adults State
Funds Moderate Scenario
2014-2017 Adults Federal Funds
Enhanced Scenario
Statewide Total 2,101,392,352$ 258,927,030$ 2,544,037,688$ 1,836,673,862$ 4,380,711,550$ 14,274,023,031$ 22,962,552,386$ 1,283,318,611$ 31,030,479,514$
District Total 10,798,580$ 3,400,147$ 5,907,011$ 1,997,301$ 7,904,312$ 93,598,726$ 150,571,821$ 8,415,076$ 203,475,455$ Delta (100%) 320,085$ 92,172$ 105,998$ -$ 105,998$ 3,562,816$ 5,731,485$ 320,318$ 7,745,250$ Fannin (100%) 2,096,863$ 296,200$ 1,019,767$ -$ 1,019,767$ 24,527,530$ 39,457,320$ 2,205,169$ 53,320,708$ Grayson (100%) 8,381,632$ 3,011,775$ 4,781,247$ 1,997,301$ 6,778,548$ 65,508,380$ 105,383,017$ 5,889,589$ 142,409,497$
ANALYSIS BY BILLY HAMILTON CONSULTING
Extending Medicaid to Low-Income Adults Will Save Local Tax Dollars and Grow the Economy
Download this one-pager at www.texasimpact.org/Local-Taxpayers-Win-With-Medicaid Download the full report at www.mhm.org
Download the executive summary at www.texasimpact.org
For more information about the report, “Smart, Affordable and Fair” call Texas Impact at 512/472-3903 or email [email protected]

Impact of Medicaid Extension and Local Spending for Health CareHouse District 62 - Representative Larry Phillips
County
2016 Adults <138% FPL Enrollees Moderate Scenario
2016 Adults Federal Funds
Moderate Scenario
2016 Adults State Funds Moderate Scenario
2016 Adults All Funds Moderate Scenario
2016 Children <200% FPL Enrollees Moderate Scenario
2016 Children Federal Funds
Moderate Scenario
2016 Children State Funds Moderate Scenario
2016 Children All Funds Moderate Scenario
2016 Adults & Children
All Funds Moderate Scenario
Statewide Total 1,004,771 7,615,086,733$ 292,887,951$ 7,907,974,684$ 550,189 1,500,495,384$ 769,325,576$ 2,269,820,960$ 10,177,795,644$
District Total 6,589 49,934,234$ 1,920,547$ 51,854,782$ 2,888 7,876,373$ 4,038,330$ 11,914,703$ 63,769,485$ Delta (100%) 251 1,900,736$ 73,105$ 1,973,841$ 90 245,675$ 125,961$ 371,636$ 2,345,478$ Fannin (100%) 1,727 13,085,258$ 503,279$ 13,588,537$ 567 1,546,647$ 792,988$ 2,339,635$ 15,928,171$ Grayson (100%) 4,611 34,948,241$ 1,344,163$ 36,292,404$ 2,231 6,084,051$ 3,119,381$ 9,203,432$ 45,495,835$ Note: New local tax revenues are an allocation of the statewide estimate based on the county share of state personal income and further allocated in partial counties according to the share of county population. Variations in personal income or the concentration of direct health care spending in parts of counties could alter these allocations. Remaining columns reflect allocations of statewide estimates according to the county share of adults below 138% FPL or children below 200% FPL, as applicable, and further allocated for partial counties according to the share of the county's total population. Variations in percentages of adults below 138% FPL and children below 200% FPL could alter these estimates. Hospital charity cost data exclude certain hospitals, such as those exempt from reporting, hospitals that report by system, and others, resulting in a conservative estimate of unreimbursed charity costs. Medicaid extension to adults would not relieve all local unreimbursed costs due to ineligible adults, such as undocumented immigrants, people served with incomes above 138% FPL or health care for incarcerated adults other than inpatient hospital stays. 2016 is the first full year of implementation; the federal match rate falls to 95 percent in 2017 and to 90 percent by 2020. For full county-level data, see Appendix C, and for further notes and cautions in interpreting these data, see Appendix A, in "Smart, Affordable and Fair: Why Texas Should Extend Medicaid to Low-Income Adults," at http://www.mhm.org/images/stories/advocacy_and_public_policy/Smart%20Affordable%20and%20Fair_FNL_FULL.pdf.

Impact of Medicaid Extension and Local Spending for Health CareHouse District 63 - Representative Tan Parker
County
2014-2017 New Local Tax
Revenue (Adult Expansion)
2011 County Indigent
Healthcare & Unreimbursed Jail Healthcare
Costs
2011 Total Hospital District or City/County Unreimbursed
Healthcare Expenditures
2010 Total Hospital Charity
Care Costs
Total Unreimbursed Charity Care
Costs for Local Jurisdictions &
Hospitals
2014-2017 Adults Federal Funds
Limited Scenario
2014-2017 Adults Federal Funds
Moderate Scenario
2014-2017 Adults State
Funds Moderate Scenario
2014-2017 Adults Federal Funds
Enhanced Scenario
Statewide Total 2,101,392,352$ 258,927,030$ 2,544,037,688$ 1,836,673,862$ 4,380,711,550$ 14,274,023,031$ 22,962,552,386$ 1,283,318,611$ 31,030,479,514$
District Total 14,863,790$ 1,237,072$ 2,962,350$ -$ 2,962,350$ 53,392,174$ 85,891,734$ 4,800,270$ 116,069,924$ Denton (25%) 14,863,790$ 1,237,072$ 2,962,350$ -$ 2,962,350$ 53,392,174$ 85,891,734$ 4,800,270$ 116,069,924$
ANALYSIS BY BILLY HAMILTON CONSULTING
Extending Medicaid to Low-Income Adults Will Save Local Tax Dollars and Grow the Economy
Download this one-pager at www.texasimpact.org/Local-Taxpayers-Win-With-Medicaid Download the full report at www.mhm.org
Download the executive summary at www.texasimpact.org
For more information about the report, “Smart, Affordable and Fair” call Texas Impact at 512/472-3903 or email [email protected]

Impact of Medicaid Extension and Local Spending for Health CareHouse District 63 - Representative Tan Parker
County
2016 Adults
<138% FPL
Enrollees
Moderate
Scenario
2016 Adults
Federal Funds
Moderate
Scenario
2016 Adults
State Funds
Moderate
Scenario
2016 Adults
All Funds
Moderate
Scenario
2016 Children
<200% FPL
Enrollees
Moderate
Scenario
2016 Children
Federal Funds
Moderate
Scenario
2016 Children
State Funds
Moderate
Scenario
2016 Children
All Funds
Moderate
Scenario
2016 Adults &
Children
All Funds
Moderate
Scenario
Statewide Total 1,004,771 7,615,086,733$ 292,887,951$ 7,907,974,684$ 550,189 1,500,495,384$ 769,325,576$ 2,269,820,960$ 10,177,795,644$
District Total 3,758 28,484,334$ 1,095,551$ 29,579,885$ 2,053 5,598,371$ 2,870,365$ 8,468,736$ 38,048,621$
Denton (25%) 3,758 28,484,334$ 1,095,551$ 29,579,885$ 2,053 5,598,371$ 2,870,365$ 8,468,736$ 38,048,621$
Note: New local tax revenues are an allocation of the statewide estimate based on the county share of state personal income and further allocated in partial counties according to the share of county population. Variations in personal income or the concentration of direct health care spending in parts of counties could alter these allocations. Remaining columns reflect allocations of statewide estimates according to the county share of adults below 138% FPL or children below 200% FPL, as applicable, and further allocated for partial counties according to the share of the county's total population. Variations in percentages of adults below 138% FPL and children below 200% FPL could alter these estimates. Hospital charity cost data exclude certain hospitals, such as those exempt from reporting, hospitals that report by system, and others, resulting in a conservative estimate of unreimbursed charity costs. Medicaid extension to adults would not relieve all local unreimbursed costs due to ineligible adults, such as undocumented immigrants, people served with incomes above 138% FPL or health care for incarcerated adults other than inpatient hospital stays. 2016 is the first full year of implementation; the federal match rate falls to 95 percent in 2017 and to 90 percent by 2020. For full county-level data, see Appendix C, and for further notes and cautions in interpreting these data, see Appendix A, in "Smart, Affordable and Fair: Why Texas Should Extend Medicaid to Low-Income Adults," at http://www.mhm.org/images/stories/advocacy_and_public_policy/Smart%20Affordable%20and%20Fair_FNL_FULL.pdf.

Impact of Medicaid Extension and Local Spending for Health CareHouse District 64 - Representative Myra Crownover
County
2014-2017 New Local Tax
Revenue (Adult Expansion)
2011 County Indigent
Healthcare & Unreimbursed Jail Healthcare
Costs
2011 Total Hospital District or City/County Unreimbursed
Healthcare Expenditures
2010 Total Hospital Charity
Care Costs
Total Unreimbursed Charity Care
Costs for Local Jurisdictions &
Hospitals
2014-2017 Adults Federal Funds
Limited Scenario
2014-2017 Adults Federal Funds
Moderate Scenario
2014-2017 Adults State
Funds Moderate Scenario
2014-2017 Adults Federal Funds
Enhanced Scenario
Statewide Total 2,101,392,352$ 258,927,030$ 2,544,037,688$ 1,836,673,862$ 4,380,711,550$ 14,274,023,031$ 22,962,552,386$ 1,283,318,611$ 31,030,479,514$
District Total 14,886,085$ 1,238,928$ 2,966,793$ -$ 2,966,793$ 53,472,261$ 86,020,569$ 4,807,471$ 116,244,025$ Denton (25%) 14,886,085$ 1,238,928$ 2,966,793$ -$ 2,966,793$ 53,472,261$ 86,020,569$ 4,807,471$ 116,244,025$
ANALYSIS BY BILLY HAMILTON CONSULTING
Extending Medicaid to Low-Income Adults Will Save Local Tax Dollars and Grow the Economy
Download this one-pager at www.texasimpact.org/Local-Taxpayers-Win-With-Medicaid Download the full report at www.mhm.org
Download the executive summary at www.texasimpact.org
For more information about the report, “Smart, Affordable and Fair” call Texas Impact at 512/472-3903 or email [email protected]

Impact of Medicaid Extension and Local Spending for Health CareHouse District 64 - Representative Myra Crownover
County
2016 Adults
<138% FPL
Enrollees
Moderate
Scenario
2016 Adults
Federal Funds
Moderate
Scenario
2016 Adults
State Funds
Moderate
Scenario
2016 Adults
All Funds
Moderate
Scenario
2016 Children
<200% FPL
Enrollees
Moderate
Scenario
2016 Children
Federal Funds
Moderate
Scenario
2016 Children
State Funds
Moderate
Scenario
2016 Children
All Funds
Moderate
Scenario
2016 Adults &
Children
All Funds
Moderate
Scenario
Statewide Total 1,004,771 7,615,086,733$ 292,887,951$ 7,907,974,684$ 550,189 1,500,495,384$ 769,325,576$ 2,269,820,960$ 10,177,795,644$
District Total 3,764 28,527,059$ 1,097,195$ 29,624,254$ 2,056 5,606,768$ 2,874,671$ 8,481,439$ 38,105,693$
Denton (25%) 3,764 28,527,059$ 1,097,195$ 29,624,254$ 2,056 5,606,768$ 2,874,671$ 8,481,439$ 38,105,693$
Note: New local tax revenues are an allocation of the statewide estimate based on the county share of state personal income and further allocated in partial counties according to the share of county population. Variations in personal income or the concentration of direct health care spending in parts of counties could alter these allocations. Remaining columns reflect allocations of statewide estimates according to the county share of adults below 138% FPL or children below 200% FPL, as applicable, and further allocated for partial counties according to the share of the county's total population. Variations in percentages of adults below 138% FPL and children below 200% FPL could alter these estimates. Hospital charity cost data exclude certain hospitals, such as those exempt from reporting, hospitals that report by system, and others, resulting in a conservative estimate of unreimbursed charity costs. Medicaid extension to adults would not relieve all local unreimbursed costs due to ineligible adults, such as undocumented immigrants, people served with incomes above 138% FPL or health care for incarcerated adults other than inpatient hospital stays. 2016 is the first full year of implementation; the federal match rate falls to 95 percent in 2017 and to 90 percent by 2020. For full county-level data, see Appendix C, and for further notes and cautions in interpreting these data, see Appendix A, in "Smart, Affordable and Fair: Why Texas Should Extend Medicaid to Low-Income Adults," at http://www.mhm.org/images/stories/advocacy_and_public_policy/Smart%20Affordable%20and%20Fair_FNL_FULL.pdf.

Impact of Medicaid Extension and Local Spending for Health CareHouse District 65 - Representative Ron Simmons
County
2014-2017 New Local Tax
Revenue (Adult Expansion)
2011 County Indigent
Healthcare & Unreimbursed Jail Healthcare
Costs
2011 Total Hospital District or City/County Unreimbursed
Healthcare Expenditures
2010 Total Hospital Charity
Care Costs
Total Unreimbursed Charity Care
Costs for Local Jurisdictions &
Hospitals
2014-2017 Adults Federal Funds
Limited Scenario
2014-2017 Adults Federal Funds
Moderate Scenario
2014-2017 Adults State
Funds Moderate Scenario
2014-2017 Adults Federal Funds
Enhanced Scenario
Statewide Total 2,101,392,352$ 258,927,030$ 2,544,037,688$ 1,836,673,862$ 4,380,711,550$ 14,274,023,031$ 22,962,552,386$ 1,283,318,611$ 31,030,479,514$
District Total 14,722,113$ 1,225,281$ 2,934,114$ -$ 2,934,114$ 52,883,258$ 85,073,043$ 4,754,516$ 114,963,584$ Denton (25%) 14,722,113$ 1,225,281$ 2,934,114$ -$ 2,934,114$ 52,883,258$ 85,073,043$ 4,754,516$ 114,963,584$
ANALYSIS BY BILLY HAMILTON CONSULTING
Extending Medicaid to Low-Income Adults Will Save Local Tax Dollars and Grow the Economy
Download this one-pager at www.texasimpact.org/Local-Taxpayers-Win-With-Medicaid Download the full report at www.mhm.org
Download the executive summary at www.texasimpact.org
For more information about the report, “Smart, Affordable and Fair” call Texas Impact at 512/472-3903 or email [email protected]

Impact of Medicaid Extension and Local Spending for Health CareHouse District 65 - Representative Ron Simmons
County
2016 Adults
<138% FPL
Enrollees
Moderate
Scenario
2016 Adults
Federal Funds
Moderate
Scenario
2016 Adults
State Funds
Moderate
Scenario
2016 Adults
All Funds
Moderate
Scenario
2016 Children
<200% FPL
Enrollees
Moderate
Scenario
2016 Children
Federal Funds
Moderate
Scenario
2016 Children
State Funds
Moderate
Scenario
2016 Children
All Funds
Moderate
Scenario
2016 Adults &
Children
All Funds
Moderate
Scenario
Statewide Total 1,004,771 7,615,086,733$ 292,887,951$ 7,907,974,684$ 550,189 1,500,495,384$ 769,325,576$ 2,269,820,960$ 10,177,795,644$
District Total 3,723 28,212,831$ 1,085,109$ 29,297,940$ 2,033 5,545,009$ 2,843,006$ 8,388,015$ 37,685,954$
Denton (25%) 3,723 28,212,831$ 1,085,109$ 29,297,940$ 2,033 5,545,009$ 2,843,006$ 8,388,015$ 37,685,954$
Note: New local tax revenues are an allocation of the statewide estimate based on the county share of state personal income and further allocated in partial counties according to the share of county population. Variations in personal income or the concentration of direct health care spending in parts of counties could alter these allocations. Remaining columns reflect allocations of statewide estimates according to the county share of adults below 138% FPL or children below 200% FPL, as applicable, and further allocated for partial counties according to the share of the county's total population. Variations in percentages of adults below 138% FPL and children below 200% FPL could alter these estimates. Hospital charity cost data exclude certain hospitals, such as those exempt from reporting, hospitals that report by system, and others, resulting in a conservative estimate of unreimbursed charity costs. Medicaid extension to adults would not relieve all local unreimbursed costs due to ineligible adults, such as undocumented immigrants, people served with incomes above 138% FPL or health care for incarcerated adults other than inpatient hospital stays. 2016 is the first full year of implementation; the federal match rate falls to 95 percent in 2017 and to 90 percent by 2020. For full county-level data, see Appendix C, and for further notes and cautions in interpreting these data, see Appendix A, in "Smart, Affordable and Fair: Why Texas Should Extend Medicaid to Low-Income Adults," at http://www.mhm.org/images/stories/advocacy_and_public_policy/Smart%20Affordable%20and%20Fair_FNL_FULL.pdf.

Impact of Medicaid Extension and Local Spending for Health CareHouse District 66 - Representative Van Taylor
County
2014-2017 New Local Tax
Revenue (Adult Expansion)
2011 County Indigent
Healthcare & Unreimbursed Jail Healthcare
Costs
2011 Total Hospital District or City/County Unreimbursed
Healthcare Expenditures
2010 Total Hospital Charity
Care Costs
Total Unreimbursed Charity Care
Costs for Local Jurisdictions &
Hospitals
2014-2017 Adults Federal Funds
Limited Scenario
2014-2017 Adults Federal Funds
Moderate Scenario
2014-2017 Adults State
Funds Moderate Scenario
2014-2017 Adults Federal Funds
Enhanced Scenario
Statewide Total 2,101,392,352$ 258,927,030$ 2,544,037,688$ 1,836,673,862$ 4,380,711,550$ 14,274,023,031$ 22,962,552,386$ 1,283,318,611$ 31,030,479,514$
District Total 18,744,492$ 1,504,101$ 1,988,098$ -$ 1,988,098$ 54,381,115$ 87,482,639$ 4,889,182$ 118,219,795$ Col l in (22%) 18,744,492$ 1,504,101$ 1,988,098$ -$ 1,988,098$ 54,381,115$ 87,482,639$ 4,889,182$ 118,219,795$
ANALYSIS BY BILLY HAMILTON CONSULTING
Extending Medicaid to Low-Income Adults Will Save Local Tax Dollars and Grow the Economy
Download this one-pager at www.texasimpact.org/Local-Taxpayers-Win-With-Medicaid Download the full report at www.mhm.org
Download the executive summary at www.texasimpact.org
For more information about the report, “Smart, Affordable and Fair” call Texas Impact at 512/472-3903 or email [email protected]

Impact of Medicaid Extension and Local Spending for Health CareHouse District 66 - Representative Van Taylor
County
2016 Adults
<138% FPL
Enrollees
Moderate
Scenario
2016 Adults
Federal Funds
Moderate
Scenario
2016 Adults
State Funds
Moderate
Scenario
2016 Adults
All Funds
Moderate
Scenario
2016 Children
<200% FPL
Enrollees
Moderate
Scenario
2016 Children
Federal Funds
Moderate
Scenario
2016 Children
State Funds
Moderate
Scenario
2016 Children
All Funds
Moderate
Scenario
2016 Adults &
Children
All Funds
Moderate
Scenario
Statewide Total 1,004,771 7,615,086,733$ 292,887,951$ 7,907,974,684$ 550,189 1,500,495,384$ 769,325,576$ 2,269,820,960$ 10,177,795,644$
District Total 3,828 29,011,927$ 1,115,843$ 30,127,770$ 2,097 5,719,415$ 2,932,426$ 8,651,841$ 38,779,611$
Col l in (22%) 3,828 29,011,927$ 1,115,843$ 30,127,770$ 2,097 5,719,415$ 2,932,426$ 8,651,841$ 38,779,611$
Note: New local tax revenues are an allocation of the statewide estimate based on the county share of state personal income and further allocated in partial counties according to the share of county population. Variations in personal income or the concentration of direct health care spending in parts of counties could alter these allocations. Remaining columns reflect allocations of statewide estimates according to the county share of adults below 138% FPL or children below 200% FPL, as applicable, and further allocated for partial counties according to the share of the county's total population. Variations in percentages of adults below 138% FPL and children below 200% FPL could alter these estimates. Hospital charity cost data exclude certain hospitals, such as those exempt from reporting, hospitals that report by system, and others, resulting in a conservative estimate of unreimbursed charity costs. Medicaid extension to adults would not relieve all local unreimbursed costs due to ineligible adults, such as undocumented immigrants, people served with incomes above 138% FPL or health care for incarcerated adults other than inpatient hospital stays. 2016 is the first full year of implementation; the federal match rate falls to 95 percent in 2017 and to 90 percent by 2020. For full county-level data, see Appendix C, and for further notes and cautions in interpreting these data, see Appendix A, in "Smart, Affordable and Fair: Why Texas Should Extend Medicaid to Low-Income Adults," at http://www.mhm.org/images/stories/advocacy_and_public_policy/Smart%20Affordable%20and%20Fair_FNL_FULL.pdf.

Impact of Medicaid Extension and Local Spending for Health CareHouse District 67 - Representative Jeff Leach
County
2014-2017 New Local Tax
Revenue (Adult Expansion)
2011 County Indigent
Healthcare & Unreimbursed Jail Healthcare
Costs
2011 Total Hospital District or City/County Unreimbursed
Healthcare Expenditures
2010 Total Hospital Charity
Care Costs
Total Unreimbursed Charity Care
Costs for Local Jurisdictions &
Hospitals
2014-2017 Adults Federal Funds
Limited Scenario
2014-2017 Adults Federal Funds
Moderate Scenario
2014-2017 Adults State
Funds Moderate Scenario
2014-2017 Adults Federal Funds
Enhanced Scenario
Statewide Total 2,101,392,352$ 258,927,030$ 2,544,037,688$ 1,836,673,862$ 4,380,711,550$ 14,274,023,031$ 22,962,552,386$ 1,283,318,611$ 31,030,479,514$
District Total 18,745,799$ 1,504,206$ 1,988,236$ -$ 1,988,236$ 54,384,906$ 87,488,738$ 4,889,523$ 118,228,037$ Col l in (22%) 18,745,799$ 1,504,206$ 1,988,236$ -$ 1,988,236$ 54,384,906$ 87,488,738$ 4,889,523$ 118,228,037$
ANALYSIS BY BILLY HAMILTON CONSULTING
Extending Medicaid to Low-Income Adults Will Save Local Tax Dollars and Grow the Economy
Download this one-pager at www.texasimpact.org/Local-Taxpayers-Win-With-Medicaid Download the full report at www.mhm.org
Download the executive summary at www.texasimpact.org
For more information about the report, “Smart, Affordable and Fair” call Texas Impact at 512/472-3903 or email [email protected]

Impact of Medicaid Extension and Local Spending for Health CareHouse District 67 - Representative Jeff Leach
County
2016 Adults <138% FPL Enrollees Moderate Scenario
2016 Adults Federal Funds
Moderate Scenario
2016 Adults State Funds Moderate Scenario
2016 Adults All Funds Moderate Scenario
2016 Children <200% FPL Enrollees Moderate Scenario
2016 Children Federal Funds
Moderate Scenario
2016 Children State Funds Moderate Scenario
2016 Children All Funds Moderate Scenario
2016 Adults & Children
All Funds Moderate Scenario
Statewide Total 1,004,771 7,615,086,733$ 292,887,951$ 7,907,974,684$ 550,189 1,500,495,384$ 769,325,576$ 2,269,820,960$ 10,177,795,644$
District Total 3,828 29,013,949$ 1,115,921$ 30,129,870$ 2,097 5,719,814$ 2,932,631$ 8,652,445$ 38,782,315$ Col l in (22%) 3,828 29,013,949$ 1,115,921$ 30,129,870$ 2,097 5,719,814$ 2,932,631$ 8,652,445$ 38,782,315$ Note: New local tax revenues are an allocation of the statewide estimate based on the county share of state personal income and further allocated in partial counties according to the share of county population. Variations in personal income or the concentration of direct health care spending in parts of counties could alter these allocations. Remaining columns reflect allocations of statewide estimates according to the county share of adults below 138% FPL or children below 200% FPL, as applicable, and further allocated for partial counties according to the share of the county's total population. Variations in percentages of adults below 138% FPL and children below 200% FPL could alter these estimates. Hospital charity cost data exclude certain hospitals, such as those exempt from reporting, hospitals that report by system, and others, resulting in a conservative estimate of unreimbursed charity costs. Medicaid extension to adults would not relieve all local unreimbursed costs due to ineligible adults, such as undocumented immigrants, people served with incomes above 138% FPL or health care for incarcerated adults other than inpatient hospital stays. 2016 is the first full year of implementation; the federal match rate falls to 95 percent in 2017 and to 90 percent by 2020. For full county-level data, see Appendix C, and for further notes and cautions in interpreting these data, see Appendix A, in "Smart, Affordable and Fair: Why Texas Should Extend Medicaid to Low-Income Adults," at http://www.mhm.org/images/stories/advocacy_and_public_policy/Smart%20Affordable%20and%20Fair_FNL_FULL.pdf.
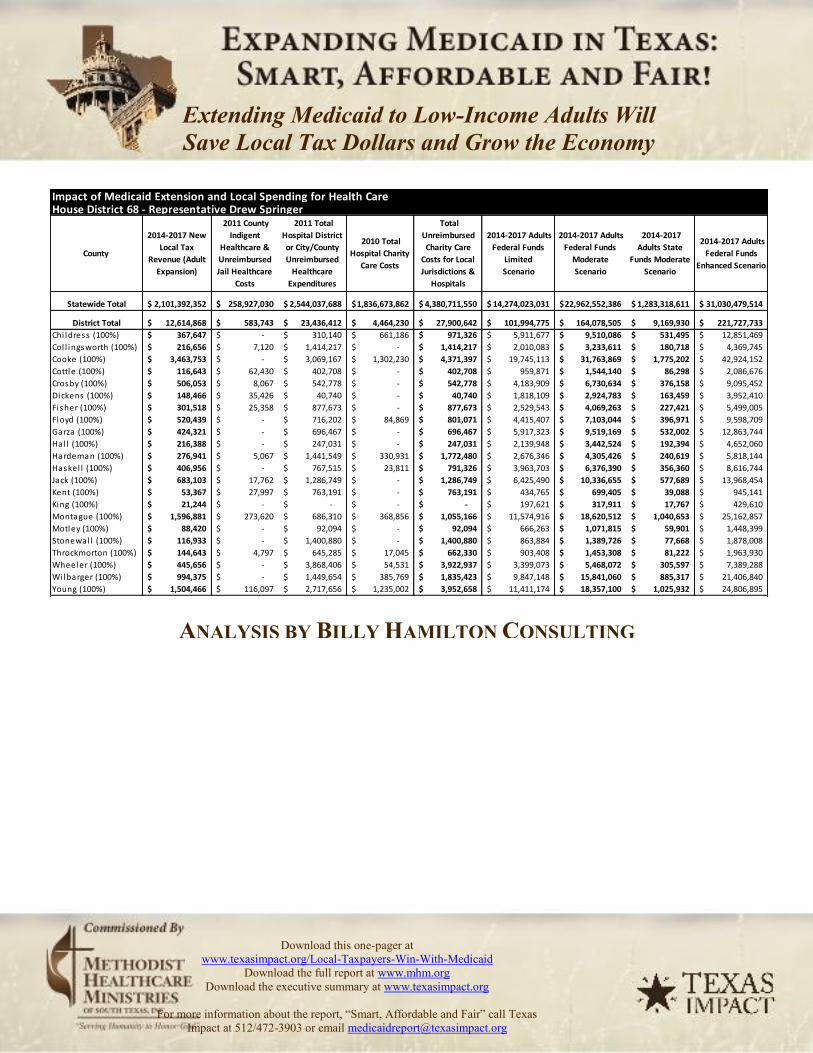
Impact of Medicaid Extension and Local Spending for Health CareHouse District 68 - Representative Drew Springer
County
2014-2017 New Local Tax
Revenue (Adult Expansion)
2011 County Indigent
Healthcare & Unreimbursed Jail Healthcare
Costs
2011 Total Hospital District or City/County Unreimbursed
Healthcare Expenditures
2010 Total Hospital Charity
Care Costs
Total Unreimbursed Charity Care
Costs for Local Jurisdictions &
Hospitals
2014-2017 Adults Federal Funds
Limited Scenario
2014-2017 Adults Federal Funds
Moderate Scenario
2014-2017 Adults State
Funds Moderate Scenario
2014-2017 Adults Federal Funds
Enhanced Scenario
Statewide Total 2,101,392,352$ 258,927,030$ 2,544,037,688$ 1,836,673,862$ 4,380,711,550$ 14,274,023,031$ 22,962,552,386$ 1,283,318,611$ 31,030,479,514$
District Total 12,614,868$ 583,743$ 23,436,412$ 4,464,230$ 27,900,642$ 101,994,775$ 164,078,505$ 9,169,930$ 221,727,733$ Chi ldress (100%) 367,647$ -$ 310,140$ 661,186$ 971,326$ 5,911,677$ 9,510,086$ 531,495$ 12,851,469$ Col l ingsworth (100%) 216,656$ 7,120$ 1,414,217$ -$ 1,414,217$ 2,010,083$ 3,233,611$ 180,718$ 4,369,745$ Cooke (100%) 3,463,753$ -$ 3,069,167$ 1,302,230$ 4,371,397$ 19,745,113$ 31,763,869$ 1,775,202$ 42,924,152$ Cottle (100%) 116,643$ 62,430$ 402,708$ -$ 402,708$ 959,871$ 1,544,140$ 86,298$ 2,086,676$ Crosby (100%) 506,053$ 8,067$ 542,778$ -$ 542,778$ 4,183,909$ 6,730,634$ 376,158$ 9,095,452$ Dickens (100%) 148,466$ 35,426$ 40,740$ -$ 40,740$ 1,818,109$ 2,924,783$ 163,459$ 3,952,410$ Fi sher (100%) 301,518$ 25,358$ 877,673$ -$ 877,673$ 2,529,543$ 4,069,263$ 227,421$ 5,499,005$ Floyd (100%) 520,439$ -$ 716,202$ 84,869$ 801,071$ 4,415,407$ 7,103,044$ 396,971$ 9,598,709$ Garza (100%) 424,321$ -$ 696,467$ -$ 696,467$ 5,917,323$ 9,519,169$ 532,002$ 12,863,744$ Hal l (100%) 216,388$ -$ 247,031$ -$ 247,031$ 2,139,948$ 3,442,524$ 192,394$ 4,652,060$ Hardeman (100%) 276,941$ 5,067$ 1,441,549$ 330,931$ 1,772,480$ 2,676,346$ 4,305,426$ 240,619$ 5,818,144$ Haskel l (100%) 406,956$ -$ 767,515$ 23,811$ 791,326$ 3,963,703$ 6,376,390$ 356,360$ 8,616,744$ Jack (100%) 683,103$ 17,762$ 1,286,749$ -$ 1,286,749$ 6,425,490$ 10,336,655$ 577,689$ 13,968,454$ Kent (100%) 53,367$ 27,997$ 763,191$ -$ 763,191$ 434,765$ 699,405$ 39,088$ 945,141$ King (100%) 21,244$ -$ -$ -$ -$ 197,621$ 317,911$ 17,767$ 429,610$ Montague (100%) 1,596,881$ 273,620$ 686,310$ 368,856$ 1,055,166$ 11,574,916$ 18,620,512$ 1,040,653$ 25,162,857$ Motley (100%) 88,420$ -$ 92,094$ -$ 92,094$ 666,263$ 1,071,815$ 59,901$ 1,448,399$ Stonewal l (100%) 116,933$ -$ 1,400,880$ -$ 1,400,880$ 863,884$ 1,389,726$ 77,668$ 1,878,008$ Throckmorton (100%) 144,643$ 4,797$ 645,285$ 17,045$ 662,330$ 903,408$ 1,453,308$ 81,222$ 1,963,930$ Wheeler (100%) 445,656$ -$ 3,868,406$ 54,531$ 3,922,937$ 3,399,073$ 5,468,072$ 305,597$ 7,389,288$ Wi lbarger (100%) 994,375$ -$ 1,449,654$ 385,769$ 1,835,423$ 9,847,148$ 15,841,060$ 885,317$ 21,406,840$ Young (100%) 1,504,466$ 116,097$ 2,717,656$ 1,235,002$ 3,952,658$ 11,411,174$ 18,357,100$ 1,025,932$ 24,806,895$
Extending Medicaid to Low-Income Adults Will Save Local Tax Dollars and Grow the Economy
Download this one-pager at www.texasimpact.org/Local-Taxpayers-Win-With-Medicaid
Download the full report at www.mhm.org Download the executive summary at www.texasimpact.org
For more information about the report, “Smart, Affordable and Fair” call Texas
Impact at 512/472-3903 or email [email protected]
ANALYSIS BY BILLY HAMILTON CONSULTING
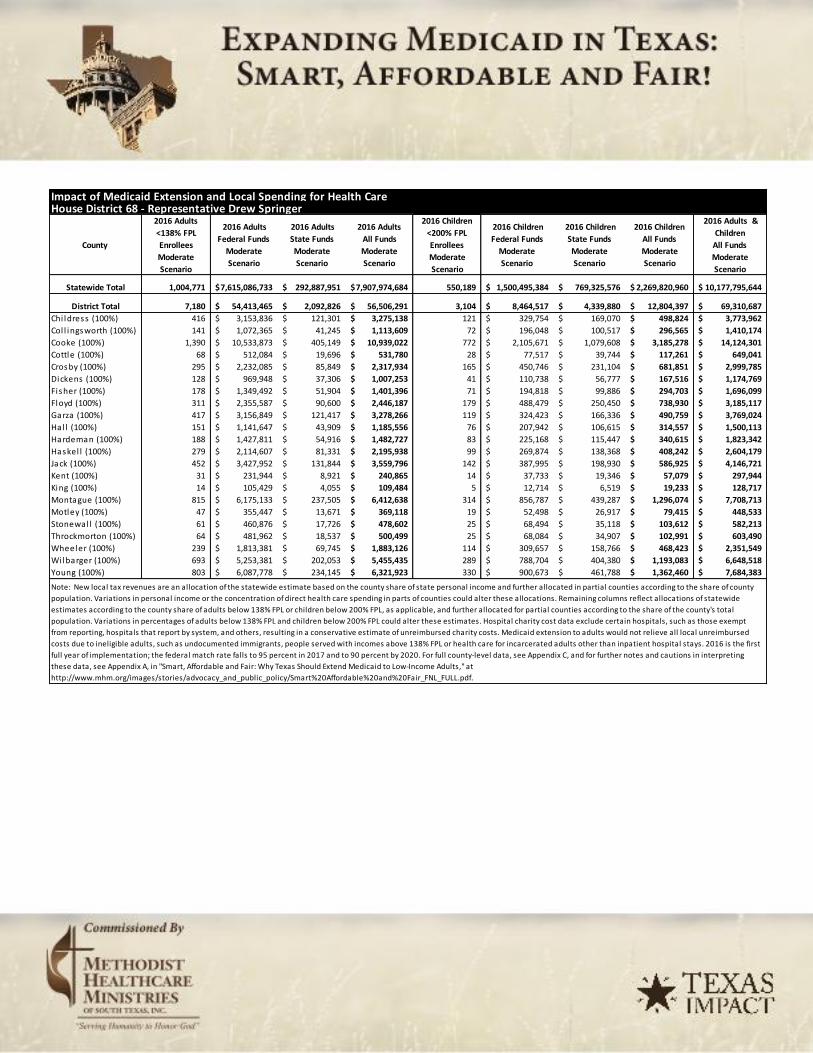
Impact of Medicaid Extension and Local Spending for Health CareHouse District 68 - Representative Drew Springer
County
2016 Adults <138% FPL Enrollees Moderate Scenario
2016 Adults Federal Funds
Moderate Scenario
2016 Adults State Funds Moderate Scenario
2016 Adults All Funds Moderate Scenario
2016 Children <200% FPL Enrollees Moderate Scenario
2016 Children Federal Funds
Moderate Scenario
2016 Children State Funds Moderate Scenario
2016 Children All Funds Moderate Scenario
2016 Adults & Children
All Funds Moderate Scenario
Statewide Total 1,004,771 7,615,086,733$ 292,887,951$ 7,907,974,684$ 550,189 1,500,495,384$ 769,325,576$ 2,269,820,960$ 10,177,795,644$
District Total 7,180 54,413,465$ 2,092,826$ 56,506,291$ 3,104 8,464,517$ 4,339,880$ 12,804,397$ 69,310,687$ Chi ldress (100%) 416 3,153,836$ 121,301$ 3,275,138$ 121 329,754$ 169,070$ 498,824$ 3,773,962$ Col l ingsworth (100%) 141 1,072,365$ 41,245$ 1,113,609$ 72 196,048$ 100,517$ 296,565$ 1,410,174$ Cooke (100%) 1,390 10,533,873$ 405,149$ 10,939,022$ 772 2,105,671$ 1,079,608$ 3,185,278$ 14,124,301$ Cottle (100%) 68 512,084$ 19,696$ 531,780$ 28 77,517$ 39,744$ 117,261$ 649,041$ Crosby (100%) 295 2,232,085$ 85,849$ 2,317,934$ 165 450,746$ 231,104$ 681,851$ 2,999,785$ Dickens (100%) 128 969,948$ 37,306$ 1,007,253$ 41 110,738$ 56,777$ 167,516$ 1,174,769$ Fisher (100%) 178 1,349,492$ 51,904$ 1,401,396$ 71 194,818$ 99,886$ 294,703$ 1,696,099$ Floyd (100%) 311 2,355,587$ 90,600$ 2,446,187$ 179 488,479$ 250,450$ 738,930$ 3,185,117$ Garza (100%) 417 3,156,849$ 121,417$ 3,278,266$ 119 324,423$ 166,336$ 490,759$ 3,769,024$ Hal l (100%) 151 1,141,647$ 43,909$ 1,185,556$ 76 207,942$ 106,615$ 314,557$ 1,500,113$ Hardeman (100%) 188 1,427,811$ 54,916$ 1,482,727$ 83 225,168$ 115,447$ 340,615$ 1,823,342$ Haskel l (100%) 279 2,114,607$ 81,331$ 2,195,938$ 99 269,874$ 138,368$ 408,242$ 2,604,179$ Jack (100%) 452 3,427,952$ 131,844$ 3,559,796$ 142 387,995$ 198,930$ 586,925$ 4,146,721$ Kent (100%) 31 231,944$ 8,921$ 240,865$ 14 37,733$ 19,346$ 57,079$ 297,944$ King (100%) 14 105,429$ 4,055$ 109,484$ 5 12,714$ 6,519$ 19,233$ 128,717$ Montague (100%) 815 6,175,133$ 237,505$ 6,412,638$ 314 856,787$ 439,287$ 1,296,074$ 7,708,713$ Motley (100%) 47 355,447$ 13,671$ 369,118$ 19 52,498$ 26,917$ 79,415$ 448,533$ Stonewal l (100%) 61 460,876$ 17,726$ 478,602$ 25 68,494$ 35,118$ 103,612$ 582,213$ Throckmorton (100%) 64 481,962$ 18,537$ 500,499$ 25 68,084$ 34,907$ 102,991$ 603,490$ Wheeler (100%) 239 1,813,381$ 69,745$ 1,883,126$ 114 309,657$ 158,766$ 468,423$ 2,351,549$ Wilbarger (100%) 693 5,253,381$ 202,053$ 5,455,435$ 289 788,704$ 404,380$ 1,193,083$ 6,648,518$ Young (100%) 803 6,087,778$ 234,145$ 6,321,923$ 330 900,673$ 461,788$ 1,362,460$ 7,684,383$ Note: New local tax revenues are an allocation of the statewide estimate based on the county share of state personal income and further allocated in partial counties according to the share of county population. Variations in personal income or the concentration of direct health care spending in parts of counties could alter these allocations. Remaining columns reflect allocations of statewide estimates according to the county share of adults below 138% FPL or children below 200% FPL, as applicable, and further allocated for partial counties according to the share of the county's total population. Variations in percentages of adults below 138% FPL and children below 200% FPL could alter these estimates. Hospital charity cost data exclude certain hospitals, such as those exempt from reporting, hospitals that report by system, and others, resulting in a conservative estimate of unreimbursed charity costs. Medicaid extension to adults would not relieve all local unreimbursed costs due to ineligible adults, such as undocumented immigrants, people served with incomes above 138% FPL or health care for incarcerated adults other than inpatient hospital stays. 2016 is the first full year of implementation; the federal match rate falls to 95 percent in 2017 and to 90 percent by 2020. For full county-level data, see Appendix C, and for further notes and cautions in interpreting these data, see Appendix A, in "Smart, Affordable and Fair: Why Texas Should Extend Medicaid to Low-Income Adults," at http://www.mhm.org/images/stories/advocacy_and_public_policy/Smart%20Affordable%20and%20Fair_FNL_FULL.pdf.

Impact of Medicaid Extension and Local Spending for Health CareHouse District 69 - Representative James Frank
County
2014-2017 New
Local Tax
Revenue (Adult
Expansion)
2011 County
Indigent
Healthcare &
Unreimbursed
Jail Healthcare
Costs
2011 Total
Hospital District
or City/County
Unreimbursed
Healthcare
Expenditures
2010 Total
Hospital Charity
Care Costs
Total
Unreimbursed
Charity Care
Costs for Local
Jurisdictions &
Hospitals
2014-2017 Adults
Federal Funds
Limited
Scenario
2014-2017 Adults
Federal Funds
Moderate
Scenario
2014-2017
Adults State
Funds Moderate
Scenario
2014-2017 Adults
Federal Funds
Enhanced Scenario
Statewide Total 2,101,392,352$ 258,927,030$ 2,544,037,688$ 1,836,673,862$ 4,380,711,550$ 14,274,023,031$ 22,962,552,386$ 1,283,318,611$ 31,030,479,514$
District Total 12,133,669$ 3,311,595$ 6,651,545$ 36,512,422$ 43,163,967$ 116,183,928$ 186,904,528$ 10,445,618$ 252,573,713$
Archer (100%) 824,371$ 133,552$ 168,031$ -$ 168,031$ 5,426,095$ 8,728,933$ 487,838$ 11,795,856$ Baylor (100%) 263,269$ -$ 524,177$ 440,678$ 964,855$ 2,139,948$ 3,442,524$ 192,394$ 4,652,060$ Clay (100%) 963,023$ 134,958$ 241,451$ 39,957$ 281,408$ 6,442,429$ 10,363,905$ 579,212$ 14,005,278$ Foard (100%) 84,606$ -$ 239,652$ -$ 239,652$ 801,775$ 1,289,811$ 72,084$ 1,742,988$ Knox (100%) 259,065$ 1,368$ 640,689$ 309,013$ 949,702$ 2,382,739$ 3,833,101$ 214,222$ 5,179,866$ Wichita (100%) 9,739,335$ 3,041,717$ 4,837,545$ 35,722,774$ 40,560,319$ 98,990,943$ 159,246,255$ 8,899,868$ 215,197,664$
ANALYSIS BY BILLY HAMILTON CONSULTING
Extending Medicaid to Low-Income Adults Will Save Local Tax Dollars and Grow the Economy
Download this one-pager at www.texasimpact.org/Local-Taxpayers-Win-With-Medicaid Download the full report at www.mhm.org
Download the executive summary at www.texasimpact.org
For more information about the report, “Smart, Affordable and Fair” call Texas Impact at 512/472-3903 or email [email protected]

Impact of Medicaid Extension and Local Spending for Health CareHouse District 69 - Representative James Frank
County
2016 Adults <138% FPL Enrollees Moderate Scenario
2016 Adults Federal Funds
Moderate Scenario
2016 Adults State Funds Moderate Scenario
2016 Adults All Funds Moderate Scenario
2016 Children <200% FPL Enrollees Moderate Scenario
2016 Children Federal Funds
Moderate Scenario
2016 Children State Funds Moderate Scenario
2016 Children All Funds Moderate Scenario
2016 Adults & Children
All Funds Moderate Scenario
Statewide Total 1,004,771 7,615,086,733$ 292,887,951$ 7,907,974,684$ 550,189 1,500,495,384$ 769,325,576$ 2,269,820,960$ 10,177,795,644$
District Total 8,178 61,983,275$ 2,383,972$ 64,367,247$ 2,986 8,142,965$ 4,175,016$ 12,317,981$ 76,685,228$ Archer (100%) 382 2,894,782$ 111,338$ 3,006,120$ 147 401,119$ 205,660$ 606,779$ 3,612,898$ Baylor (100%) 151 1,141,647$ 43,909$ 1,185,556$ 56 151,753$ 77,806$ 229,558$ 1,415,114$ Clay (100%) 453 3,436,989$ 132,192$ 3,569,181$ 158 431,880$ 221,431$ 653,311$ 4,222,491$ Foard (100%) 56 427,741$ 16,452$ 444,192$ 21 56,600$ 29,019$ 85,619$ 529,812$ Knox (100%) 168 1,271,174$ 48,891$ 1,320,065$ 80 218,196$ 111,872$ 330,068$ 1,650,133$ Wichita (100%) 6,968 52,810,943$ 2,031,190$ 54,842,133$ 2,524 6,883,418$ 3,529,228$ 10,412,646$ 65,254,779$
Note: New local tax revenues are an allocation of the statewide estimate based on the county share of state personal income and further allocated in partial counties according to the share of county
population. Variations in personal income or the concentration of direct health care spending in parts of counties could alter these allocations. Remaining columns reflect allocations of statewide
estimates according to the county share of adults below 138% FPL or children below 200% FPL, as applicable, and further allocated for partial counties according to the share of the county's total
population. Variations in percentages of adults below 138% FPL and children below 200% FPL could alter these estimates. Hospital charity cost data exclude certain hospitals, such as those exempt
from reporting, hospitals that report by system, and others, resulting in a conservative estimate of unreimbursed charity costs. Medicaid extension to adults would not relieve all local unreimbursed
costs due to ineligible adults, such as undocumented immigrants, people served with incomes above 138% FPL or health care for incarcerated adults other than inpatient hospital stays. 2016 is the first
full year of implementation; the federal match rate falls to 95 percent in 2017 and to 90 percent by 2020. For full county-level data, see Appendix C, and for further notes and cautions in interpreting
these data, see Appendix A, in "Smart, Affordable and Fair: Why Texas Should Extend Medicaid to Low-Income Adults," at
http://www.mhm.org/images/stories/advocacy_and_public_policy/Smart%20Affordable%20and%20Fair_FNL_FULL.pdf.

Impact of Medicaid Extension and Local Spending for Health Care
House District 70 - Representative Scott Sanford
County
2014-2017 New
Local Tax
Revenue (Adult
Expansion)
2011 County
Indigent
Healthcare &
Unreimbursed
Jail Healthcare
Costs
2011 Total
Hospital District
or City/County
Unreimbursed
Healthcare
Expenditures
2010 Total
Hospital Charity
Care Costs
Total
Unreimbursed
Charity Care
Costs for Local
Jurisdictions &
Hospitals
2014-2017 Adults
Federal Funds
Limited
Scenario
2014-2017 Adults
Federal Funds
Moderate
Scenario
2014-2017
Adults State
Funds Moderate
Scenario
2014-2017 Adults
Federal Funds
Enhanced Scenario
Statewide Total 2,101,392,352$ 258,927,030$ 2,544,037,688$ 1,836,673,862$ 4,380,711,550$ 14,274,023,031$ 22,962,552,386$ 1,283,318,611$ 31,030,479,514$
District Total 18,745,146$ 1,504,153$ 1,988,167$ -$ 1,988,167$ 54,383,011$ 87,485,688$ 4,889,352$ 118,223,916$
Col l in (22%) 18,745,146$ 1,504,153$ 1,988,167$ -$ 1,988,167$ 54,383,011$ 87,485,688$ 4,889,352$ 118,223,916$
ANALYSIS BY BILLY HAMILTON CONSULTING
Extending Medicaid to Low-Income Adults Will Save Local Tax Dollars and Grow the Economy
Download this one-pager at www.texasimpact.org/Local-Taxpayers-Win-With-Medicaid Download the full report at www.mhm.org
Download the executive summary at www.texasimpact.org
For more information about the report, “Smart, Affordable and Fair” call Texas Impact at 512/472-3903 or email [email protected]

Impact of Medicaid Extension and Local Spending for Health Care
House District 70 - Representative Scott Sanford
County
2016 Adults
<138% FPL
Enrollees
Moderate
Scenario
2016 Adults
Federal Funds
Moderate
Scenario
2016 Adults
State Funds
Moderate
Scenario
2016 Adults
All Funds
Moderate
Scenario
2016 Children
<200% FPL
Enrollees
Moderate
Scenario
2016 Children
Federal Funds
Moderate
Scenario
2016 Children
State Funds
Moderate
Scenario
2016 Children
All Funds
Moderate
Scenario
2016 Adults &
Children
All Funds
Moderate
Scenario
Statewide Total 1,004,771 7,615,086,733$ 292,887,951$ 7,907,974,684$ 550,189 1,500,495,384$ 769,325,576$ 2,269,820,960$ 10,177,795,644$
District Total 3,828 29,012,938$ 1,115,882$ 30,128,820$ 2,097 5,719,614$ 2,932,529$ 8,652,143$ 38,780,963$
Col l in (22%) 3,828 29,012,938$ 1,115,882$ 30,128,820$ 2,097 5,719,614$ 2,932,529$ 8,652,143$ 38,780,963$
Note: New local tax revenues are an allocation of the statewide estimate based on the county share of state personal income and further allocated in partial counties according to the share of county population. Variations in personal income or the concentration of direct health care spending in parts of counties could alter these allocations. Remaining columns reflect allocations of statewide estimates according to the county share of adults below 138% FPL or children below 200% FPL, as applicable, and further allocated for partial counties according to the share of the county's total population. Variations in percentages of adults below 138% FPL and children below 200% FPL could alter these estimates. Hospital charity cost data exclude certain hospitals, such as those exempt from reporting, hospitals that report by system, and others, resulting in a conservative estimate of unreimbursed charity costs. Medicaid extension to adults would not relieve all local unreimbursed costs due to ineligible adults, such as undocumented immigrants, people served with incomes above 138% FPL or health care for incarcerated adults other than inpatient hospital stays. 2016 is the first full year of implementation; the federal match rate falls to 95 percent in 2017 and to 90 percent by 2020. For full county-level data, see Appendix C, and for further notes and cautions in interpreting these data, see Appendix A, in "Smart, Affordable and Fair: Why Texas Should Extend Medicaid to Low-Income Adults," at http://www.mhm.org/images/stories/advocacy_and_public_policy/Smart%20Affordable%20and%20Fair_FNL_FULL.pdf.

Impact of Medicaid Extension and Local Spending for Health CareHouse District 71 - Representative Susan King
County
2014-2017 New Local Tax
Revenue (Adult Expansion)
2011 County Indigent
Healthcare & Unreimbursed Jail Healthcare
Costs
2011 Total Hospital District or City/County Unreimbursed
Healthcare Expenditures
2010 Total Hospital Charity
Care Costs
Total Unreimbursed Charity Care
Costs for Local Jurisdictions &
Hospitals
2014-2017 Adults Federal Funds
Limited Scenario
2014-2017 Adults Federal Funds
Moderate Scenario
2014-2017 Adults State
Funds Moderate Scenario
2014-2017 Adults Federal Funds
Enhanced Scenario
Statewide Total 2,101,392,352$ 258,927,030$ 2,544,037,688$ 1,836,673,862$ 4,380,711,550$ 14,274,023,031$ 22,962,552,386$ 1,283,318,611$ 31,030,479,514$
District Total 12,353,817$ 2,966,606$ 8,813,379$ 15,746,924$ 24,560,303$ 125,929,443$ 202,582,091$ 11,321,797$ 273,759,612$ Jones (100%) 1,143,744$ 211,687$ 1,906,203$ -$ 1,906,203$ 18,294,014$ 29,429,493$ 1,644,739$ 39,769,589$ Nolan (100%) 1,043,131$ 57,433$ 2,487,848$ -$ 2,487,848$ 10,535,997$ 16,949,208$ 947,248$ 22,904,337$ Taylor (100%) 10,166,943$ 2,697,486$ 4,419,328$ 15,746,924$ 20,166,252$ 97,099,432$ 156,203,390$ 8,729,810$ 211,085,685$
ANALYSIS BY BILLY HAMILTON CONSULTING
Extending Medicaid to Low-Income Adults Will Save Local Tax Dollars and Grow the Economy
Download this one-pager at www.texasimpact.org/Local-Taxpayers-Win-With-Medicaid Download the full report at www.mhm.org
Download the executive summary at www.texasimpact.org
For more information about the report, “Smart, Affordable and Fair” call Texas Impact at 512/472-3903 or email [email protected]

Impact of Medicaid Extension and Local Spending for Health CareHouse District 71 - Representative Susan King
County
2016 Adults <138% FPL Enrollees Moderate Scenario
2016 Adults Federal Funds
Moderate Scenario
2016 Adults State Funds Moderate Scenario
2016 Adults All Funds Moderate Scenario
2016 Children <200% FPL Enrollees Moderate Scenario
2016 Children Federal Funds
Moderate Scenario
2016 Children State Funds Moderate Scenario
2016 Children All Funds Moderate Scenario
2016 Adults & Children
All Funds Moderate Scenario
Statewide Total 1,004,771 7,615,086,733$ 292,887,951$ 7,907,974,684$ 550,189 1,500,495,384$ 769,325,576$ 2,269,820,960$ 10,177,795,644$
District Total 8,864 67,182,435$ 2,583,940$ 69,766,375$ 3,523 9,609,224$ 4,926,788$ 14,536,012$ 84,302,387$ Jones (100%) 1,288 9,759,722$ 375,374$ 10,135,096$ 293 797,727$ 409,006$ 1,206,733$ 11,341,829$ Nolan (100%) 742 5,620,877$ 216,188$ 5,837,065$ 336 915,848$ 469,568$ 1,385,416$ 7,222,481$ Taylor (100%) 6,835 51,801,836$ 1,992,378$ 53,794,214$ 2,895 7,895,650$ 4,048,213$ 11,943,863$ 65,738,077$ Note: New local tax revenues are an allocation of the statewide estimate based on the county share of state personal income and further allocated in partial counties according to the share of county population. Variations in personal income or the concentration of direct health care spending in parts of counties could alter these allocations. Remaining columns reflect allocations of statewide estimates according to the county share of adults below 138% FPL or children below 200% FPL, as applicable, and further allocated for partial counties according to the share of the county's total population. Variations in percentages of adults below 138% FPL and children below 200% FPL could alter these estimates. Hospital charity cost data exclude certain hospitals, such as those exempt from reporting, hospitals that report by system, and others, resulting in a conservative estimate of unreimbursed charity costs. Medicaid extension to adults would not relieve all local unreimbursed costs due to ineligible adults, such as undocumented immigrants, people served with incomes above 138% FPL or health care for incarcerated adults other than inpatient hospital stays. 2016 is the first full year of implementation; the federal match rate falls to 95 percent in 2017 and to 90 percent by 2020. For full county-level data, see Appendix C, and for further notes and cautions in interpreting these data, see Appendix A, in "Smart, Affordable and Fair: Why Texas Should Extend Medicaid to Low-Income Adults," at http://www.mhm.org/images/stories/advocacy_and_public_policy/Smart%20Affordable%20and%20Fair_FNL_FULL.pdf.
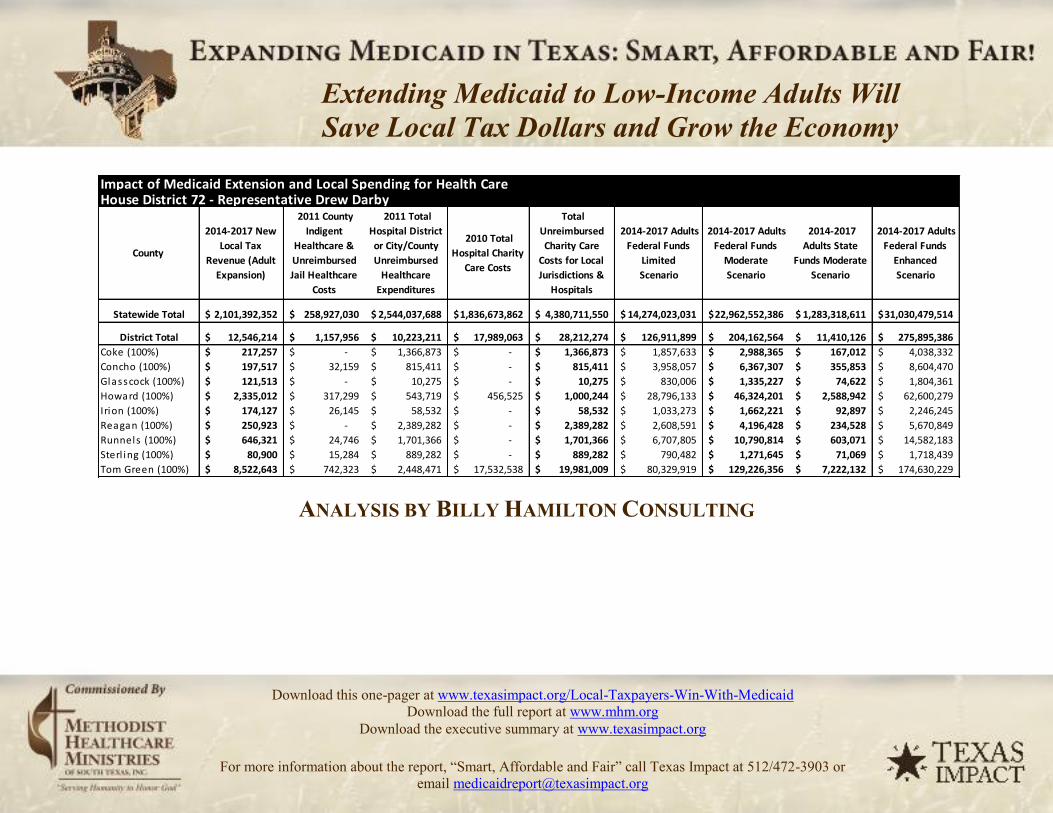
Impact of Medicaid Extension and Local Spending for Health CareHouse District 72 - Representative Drew Darby
County
2014-2017 New
Local Tax
Revenue (Adult
Expansion)
2011 County
Indigent
Healthcare &
Unreimbursed
Jail Healthcare
Costs
2011 Total
Hospital District
or City/County
Unreimbursed
Healthcare
Expenditures
2010 Total
Hospital Charity
Care Costs
Total
Unreimbursed
Charity Care
Costs for Local
Jurisdictions &
Hospitals
2014-2017 Adults
Federal Funds
Limited
Scenario
2014-2017 Adults
Federal Funds
Moderate
Scenario
2014-2017
Adults State
Funds Moderate
Scenario
2014-2017 Adults
Federal Funds
Enhanced
Scenario
Statewide Total 2,101,392,352$ 258,927,030$ 2,544,037,688$ 1,836,673,862$ 4,380,711,550$ 14,274,023,031$ 22,962,552,386$ 1,283,318,611$ 31,030,479,514$
District Total 12,546,214$ 1,157,956$ 10,223,211$ 17,989,063$ 28,212,274$ 126,911,899$ 204,162,564$ 11,410,126$ 275,895,386$
Coke (100%) 217,257$ -$ 1,366,873$ -$ 1,366,873$ 1,857,633$ 2,988,365$ 167,012$ 4,038,332$ Concho (100%) 197,517$ 32,159$ 815,411$ -$ 815,411$ 3,958,057$ 6,367,307$ 355,853$ 8,604,470$ Glasscock (100%) 121,513$ -$ 10,275$ -$ 10,275$ 830,006$ 1,335,227$ 74,622$ 1,804,361$ Howard (100%) 2,335,012$ 317,299$ 543,719$ 456,525$ 1,000,244$ 28,796,133$ 46,324,201$ 2,588,942$ 62,600,279$ Irion (100%) 174,127$ 26,145$ 58,532$ -$ 58,532$ 1,033,273$ 1,662,221$ 92,897$ 2,246,245$ Reagan (100%) 250,923$ -$ 2,389,282$ -$ 2,389,282$ 2,608,591$ 4,196,428$ 234,528$ 5,670,849$ Runnels (100%) 646,321$ 24,746$ 1,701,366$ -$ 1,701,366$ 6,707,805$ 10,790,814$ 603,071$ 14,582,183$ Sterl ing (100%) 80,900$ 15,284$ 889,282$ -$ 889,282$ 790,482$ 1,271,645$ 71,069$ 1,718,439$ Tom Green (100%) 8,522,643$ 742,323$ 2,448,471$ 17,532,538$ 19,981,009$ 80,329,919$ 129,226,356$ 7,222,132$ 174,630,229$
ANALYSIS BY BILLY HAMILTON CONSULTING
Extending Medicaid to Low-Income Adults Will Save Local Tax Dollars and Grow the Economy
Download this one-pager at www.texasimpact.org/Local-Taxpayers-Win-With-Medicaid Download the full report at www.mhm.org
Download the executive summary at www.texasimpact.org
For more information about the report, “Smart, Affordable and Fair” call Texas Impact at 512/472-3903 or email [email protected]

Impact of Medicaid Extension and Local Spending for Health CareHouse District 72 - Representative Drew Darby
County
2016 Adults <138% FPL Enrollees Moderate Scenario
2016 Adults Federal Funds
Moderate Scenario
2016 Adults State Funds Moderate Scenario
2016 Adults All Funds Moderate Scenario
2016 Children <200% FPL Enrollees Moderate Scenario
2016 Children Federal Funds
Moderate Scenario
2016 Children State Funds Moderate Scenario
2016 Children All Funds Moderate Scenario
2016 Adults & Children
All Funds Moderate Scenario
Statewide Total 1,004,771 7,615,086,733$ 292,887,951$ 7,907,974,684$ 550,189 1,500,495,384$ 769,325,576$ 2,269,820,960$ 10,177,795,644$
District Total 8,934 67,706,569$ 2,604,099$ 70,310,667$ 3,555 9,694,124$ 4,970,317$ 14,664,440$ 84,975,108$ Coke (100%) 131 991,034$ 38,117$ 1,029,150$ 54 146,831$ 75,282$ 222,113$ 1,251,264$ Concho (100%) 279 2,111,594$ 81,215$ 2,192,809$ 48 130,425$ 66,871$ 197,296$ 2,390,106$ Glasscock (100%) 58 442,802$ 17,031$ 459,833$ 28 76,286$ 39,113$ 115,400$ 575,233$ Howard (100%) 2,027 15,362,526$ 590,866$ 15,953,393$ 708 1,929,720$ 989,395$ 2,919,115$ 18,872,507$ Irion (100%) 73 551,244$ 21,202$ 572,445$ 30 80,798$ 41,426$ 122,224$ 694,670$ Reagan (100%) 184 1,391,664$ 53,526$ 1,445,190$ 100 272,334$ 139,630$ 411,964$ 1,857,154$ Runnels (100%) 472 3,578,565$ 137,637$ 3,716,202$ 220 600,858$ 308,069$ 908,927$ 4,625,129$ Sterl ing (100%) 56 421,716$ 16,220$ 437,936$ 23 61,521$ 31,543$ 93,064$ 531,000$ Tom Green (100%) 5,655 42,855,423$ 1,648,286$ 44,503,709$ 2,345 6,395,349$ 3,278,987$ 9,674,337$ 54,178,045$
Note: New local tax revenues are an allocation of the statewide estimate based on the county share of state personal income and further allocated in partial counties according to the share of county population. Variations in personal income or the concentration of direct health care spending in parts of counties could alter these allocations. Remaining columns reflect allocations of statewide estimates according to the county share of adults below 138% FPL or children below 200% FPL, as applicable, and further allocated for partial counties according to the share of the county's total population. Variations in percentages of adults below 138% FPL and children below 200% FPL could alter these estimates. Hospital charity cost data exclude certain hospitals, such as those exempt from reporting, hospitals that report by system, and others, resulting in a conservative estimate of unreimbursed charity costs. Medicaid extension to adults would not relieve all local unreimbursed costs due to ineligible adults, such as undocumented immigrants, people served with incomes above 138% FPL or health care for incarcerated adults other than inpatient hospital stays. 2016 is the first full year of implementation; the federal match rate falls to 95 percent in 2017 and to 90 percent by 2020. For full county-level data, see Appendix C, and for further notes and cautions in interpreting these data, see Appendix A, in "Smart, Affordable and Fair: Why Texas Should Extend Medicaid to Low-Income Adults," at http://www.mhm.org/images/stories/advocacy_and_public_policy/Smart%20Affordable%20and%20Fair_FNL_FULL.pdf.

Impact of Medicaid Extension and Local Spending for Health CareHouse District 73 - Representative Doug Miller
County
2014-2017 New Local Tax
Revenue (Adult Expansion)
2011 County Indigent
Healthcare & Unreimbursed Jail Healthcare
Costs
2011 Total Hospital District or City/County Unreimbursed
Healthcare Expenditures
2010 Total Hospital Charity
Care Costs
Total Unreimbursed Charity Care
Costs for Local Jurisdictions &
Hospitals
2014-2017 Adults Federal Funds
Limited Scenario
2014-2017 Adults Federal Funds
Moderate Scenario
2014-2017 Adults State
Funds Moderate Scenario
2014-2017 Adults Federal Funds
Enhanced Scenario
Statewide Total 2,101,392,352$ 258,927,030$ 2,544,037,688$ 1,836,673,862$ 4,380,711,550$ 14,274,023,031$ 22,962,552,386$ 1,283,318,611$ 31,030,479,514$
District Total 16,410,648$ 3,422,037$ 5,437,933$ 2,702,478$ 8,140,411$ 87,432,965$ 140,652,992$ 7,860,738$ 190,071,631$ Comal (100%) 10,001,894$ 2,946,604$ 3,791,375$ -$ 3,791,375$ 51,663,651$ 83,111,067$ 4,644,866$ 112,312,265$ Gi l lespie (100%) 2,444,083$ 309,772$ 805,370$ 2,702,478$ 3,507,848$ 14,324,665$ 23,044,019$ 1,287,872$ 31,140,570$ Kendal l (100%) 3,964,670$ 165,661$ 841,188$ -$ 841,188$ 21,444,650$ 34,497,905$ 1,928,000$ 46,618,796$
ANALYSIS BY BILLY HAMILTON CONSULTING
Extending Medicaid to Low-Income Adults Will Save Local Tax Dollars and Grow the Economy
Download this one-pager at www.texasimpact.org/Local-Taxpayers-Win-With-Medicaid Download the full report at www.mhm.org
Download the executive summary at www.texasimpact.org
For more information about the report, “Smart, Affordable and Fair” call Texas Impact at 512/472-3903 or email [email protected]

Impact of Medicaid Extension and Local Spending for Health CareHouse District 73 - Representative Doug Miller
County
2016 Adults
<138% FPL
Enrollees
Moderate
Scenario
2016 Adults
Federal Funds
Moderate
Scenario
2016 Adults
State Funds
Moderate
Scenario
2016 Adults
All Funds
Moderate
Scenario
2016 Children
<200% FPL
Enrollees
Moderate
Scenario
2016 Children
Federal Funds
Moderate
Scenario
2016 Children
State Funds
Moderate
Scenario
2016 Children
All Funds
Moderate
Scenario
2016 Adults &
Children
All Funds
Moderate
Scenario
Statewide Total 1,004,771 7,615,086,733$ 292,887,951$ 7,907,974,684$ 550,189 1,500,495,384$ 769,325,576$ 2,269,820,960$ 10,177,795,644$
District Total 6,155 46,644,847$ 1,794,033$ 48,438,879$ 2,598 7,084,388$ 3,632,268$ 10,716,656$ 59,155,535$
Comal (100%) 3,637 27,562,179$ 1,060,084$ 28,622,263$ 1,593 4,345,048$ 2,227,768$ 6,572,816$ 35,195,079$
Gi l lespie (100%) 1,008 7,642,104$ 293,927$ 7,936,031$ 394 1,075,803$ 551,580$ 1,627,383$ 9,563,414$
Kendal l (100%) 1,510 11,440,564$ 440,022$ 11,880,585$ 610 1,663,537$ 852,919$ 2,516,457$ 14,397,042$
Note: New local tax revenues are an allocation of the statewide estimate based on the county share of state personal income and further allocated in partial counties according to the share of county population. Variations in personal income or the concentration of direct health care spending in parts of counties could alter these allocations. Remaining columns reflect allocations of statewide estimates according to the county share of adults below 138% FPL or children below 200% FPL, as applicable, and further allocated for partial counties according to the share of the county's total population. Variations in percentages of adults below 138% FPL and children below 200% FPL could alter these estimates. Hospital charity cost data exclude certain hospitals, such as those exempt from reporting, hospitals that report by system, and others, resulting in a conservative estimate of unreimbursed charity costs. Medicaid extension to adults would not relieve all local unreimbursed costs due to ineligible adults, such as undocumented immigrants, people served with incomes above 138% FPL or health care for incarcerated adults other than inpatient hospital stays. 2016 is the first full year of implementation; the federal match rate falls to 95 percent in 2017 and to 90 percent by 2020. For full county-level data, see Appendix C, and for further notes and cautions in interpreting these data, see Appendix A, in "Smart, Affordable and Fair: Why Texas Should Extend Medicaid to Low-Income Adults," at http://www.mhm.org/images/stories/advocacy_and_public_policy/Smart%20Affordable%20and%20Fair_FNL_FULL.pdf.
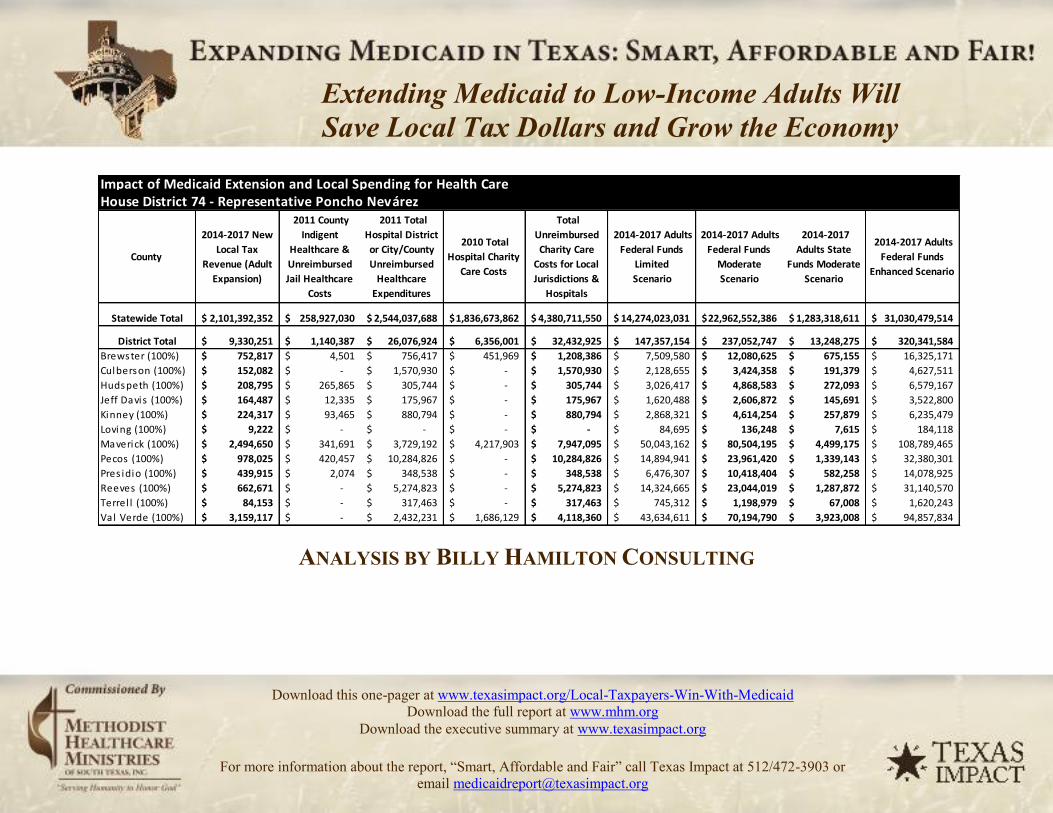
Impact of Medicaid Extension and Local Spending for Health CareHouse District 74 - Representative Poncho Nevárez
County
2014-2017 New Local Tax
Revenue (Adult Expansion)
2011 County Indigent
Healthcare & Unreimbursed Jail Healthcare
Costs
2011 Total Hospital District or City/County Unreimbursed
Healthcare Expenditures
2010 Total Hospital Charity
Care Costs
Total Unreimbursed Charity Care
Costs for Local Jurisdictions &
Hospitals
2014-2017 Adults Federal Funds
Limited Scenario
2014-2017 Adults Federal Funds
Moderate Scenario
2014-2017 Adults State
Funds Moderate Scenario
2014-2017 Adults Federal Funds
Enhanced Scenario
Statewide Total 2,101,392,352$ 258,927,030$ 2,544,037,688$ 1,836,673,862$ 4,380,711,550$ 14,274,023,031$ 22,962,552,386$ 1,283,318,611$ 31,030,479,514$
District Total 9,330,251$ 1,140,387$ 26,076,924$ 6,356,001$ 32,432,925$ 147,357,154$ 237,052,747$ 13,248,275$ 320,341,584$ Brewster (100%) 752,817$ 4,501$ 756,417$ 451,969$ 1,208,386$ 7,509,580$ 12,080,625$ 675,155$ 16,325,171$ Culberson (100%) 152,082$ -$ 1,570,930$ -$ 1,570,930$ 2,128,655$ 3,424,358$ 191,379$ 4,627,511$ Hudspeth (100%) 208,795$ 265,865$ 305,744$ -$ 305,744$ 3,026,417$ 4,868,583$ 272,093$ 6,579,167$ Jeff Davis (100%) 164,487$ 12,335$ 175,967$ -$ 175,967$ 1,620,488$ 2,606,872$ 145,691$ 3,522,800$ Kinney (100%) 224,317$ 93,465$ 880,794$ -$ 880,794$ 2,868,321$ 4,614,254$ 257,879$ 6,235,479$ Loving (100%) 9,222$ -$ -$ -$ -$ 84,695$ 136,248$ 7,615$ 184,118$ Maverick (100%) 2,494,650$ 341,691$ 3,729,192$ 4,217,903$ 7,947,095$ 50,043,162$ 80,504,195$ 4,499,175$ 108,789,465$ Pecos (100%) 978,025$ 420,457$ 10,284,826$ -$ 10,284,826$ 14,894,941$ 23,961,420$ 1,339,143$ 32,380,301$ Pres idio (100%) 439,915$ 2,074$ 348,538$ -$ 348,538$ 6,476,307$ 10,418,404$ 582,258$ 14,078,925$ Reeves (100%) 662,671$ -$ 5,274,823$ -$ 5,274,823$ 14,324,665$ 23,044,019$ 1,287,872$ 31,140,570$ Terrel l (100%) 84,153$ -$ 317,463$ -$ 317,463$ 745,312$ 1,198,979$ 67,008$ 1,620,243$ Va l Verde (100%) 3,159,117$ -$ 2,432,231$ 1,686,129$ 4,118,360$ 43,634,611$ 70,194,790$ 3,923,008$ 94,857,834$
ANALYSIS BY BILLY HAMILTON CONSULTING
Extending Medicaid to Low-Income Adults Will Save Local Tax Dollars and Grow the Economy
Download this one-pager at www.texasimpact.org/Local-Taxpayers-Win-With-Medicaid Download the full report at www.mhm.org
Download the executive summary at www.texasimpact.org
For more information about the report, “Smart, Affordable and Fair” call Texas Impact at 512/472-3903 or email [email protected]

Impact of Medicaid Extension and Local Spending for Health CareHouse District 74 - Representative Poncho Nevárez
County
2016 Adults <138% FPL Enrollees Moderate Scenario
2016 Adults Federal Funds
Moderate Scenario
2016 Adults State Funds Moderate Scenario
2016 Adults All Funds Moderate Scenario
2016 Children <200% FPL Enrollees Moderate Scenario
2016 Children Federal Funds
Moderate Scenario
2016 Children State Funds Moderate Scenario
2016 Children All Funds Moderate Scenario
2016 Adults & Children
All Funds Moderate Scenario
Statewide Total 1,004,771 7,615,086,733$ 292,887,951$ 7,907,974,684$ 550,189 1,500,495,384$ 769,325,576$ 2,269,820,960$ 10,177,795,644$
District Total 10,373 78,613,962$ 3,023,614$ 81,637,576$ 5,039 13,741,408$ 7,045,418$ 20,786,826$ 102,424,402$ Brewster (100%) 529 4,006,306$ 154,089$ 4,160,395$ 164 448,286$ 229,842$ 678,128$ 4,838,523$ Culberson (100%) 150 1,135,622$ 43,678$ 1,179,300$ 69 189,486$ 97,152$ 286,638$ 1,465,938$ Hudspeth (100%) 213 1,614,571$ 62,099$ 1,676,670$ 112 305,146$ 156,453$ 461,599$ 2,138,269$ Jeff Davis (100%) 114 864,519$ 33,251$ 897,769$ 38 103,766$ 53,202$ 156,968$ 1,054,738$ Kinney (100%) 202 1,530,228$ 58,855$ 1,589,083$ 71 193,587$ 99,255$ 292,842$ 1,881,925$ Loving (100%) 6 45,184$ 1,738$ 46,922$ 1 1,641$ 841$ 2,482$ 49,403$ Maverick (100%) 3,523 26,697,661$ 1,026,833$ 27,724,494$ 2,041 5,566,451$ 2,854,000$ 8,420,451$ 36,144,945$ Pecos (100%) 1,048 7,946,342$ 305,629$ 8,251,970$ 393 1,071,292$ 549,267$ 1,620,558$ 9,872,529$ Pres idio (100%) 456 3,455,062$ 132,887$ 3,587,949$ 244 665,661$ 341,294$ 1,006,955$ 4,594,904$ Reeves (100%) 1,008 7,642,104$ 293,927$ 7,936,031$ 335 914,207$ 468,727$ 1,382,934$ 9,318,965$ Terrel l (100%) 52 397,618$ 15,293$ 412,911$ 19 50,858$ 26,075$ 76,933$ 489,844$ Val Verde (100%) 3,072 23,278,746$ 895,336$ 24,174,082$ 1,551 4,231,028$ 2,169,309$ 6,400,337$ 30,574,419$ Note: New local tax revenues are an allocation of the statewide estimate based on the county share of state personal income and further allocated in partial counties according to the share of county population. Variations in personal income or the concentration of direct health care spending in parts of counties could alter these allocations. Remaining columns reflect allocations of statewide estimates according to the county share of adults below 138% FPL or children below 200% FPL, as applicable, and further allocated for partial counties according to the share of the county's total population. Variations in percentages of adults below 138% FPL and children below 200% FPL could alter these estimates. Hospital charity cost data exclude certain hospitals, such as those exempt from reporting, hospitals that report by system, and others, resulting in a conservative estimate of unreimbursed charity costs. Medicaid extension to adults would not relieve all local unreimbursed costs due to ineligible adults, such as undocumented immigrants, people served with incomes above 138% FPL or health care for incarcerated adults other than inpatient hospital stays. 2016 is the first full year of implementation; the federal match rate falls to 95 percent in 2017 and to 90 percent by 2020. For full county-level data, see Appendix C, and for further notes and cautions in interpreting these data, see Appendix A, in "Smart, Affordable and Fair: Why Texas Should Extend Medicaid to Low-Income Adults," at http://www.mhm.org/images/stories/advocacy_and_public_policy/Smart%20Affordable%20and%20Fair_FNL_FULL.pdf.

Impact of Medicaid Extension and Local Spending for Health CareHouse District 75 - Representative Mary González
County
2014-2017 New Local Tax
Revenue (Adult Expansion)
2011 County Indigent
Healthcare & Unreimbursed Jail Healthcare
Costs
2011 Total Hospital District or City/County Unreimbursed
Healthcare Expenditures
2010 Total Hospital Charity
Care Costs
Total Unreimbursed Charity Care
Costs for Local Jurisdictions &
Hospitals
2014-2017 Adults Federal Funds
Limited Scenario
2014-2017 Adults Federal Funds
Moderate Scenario
2014-2017 Adults State
Funds Moderate Scenario
2014-2017 Adults Federal Funds
Enhanced Scenario
Statewide Total 2,101,392,352$ 258,927,030$ 2,544,037,688$ 1,836,673,862$ 4,380,711,550$ 14,274,023,031$ 22,962,552,386$ 1,283,318,611$ 31,030,479,514$
District Total 10,007,437$ 1,191,262$ 14,607,030$ 16,974,469$ 31,581,498$ 113,997,528$ 183,387,276$ 10,249,048$ 247,820,670$ El Paso (20%) 10,007,437$ 1,191,262$ 14,607,030$ 16,974,469$ 31,581,498$ 113,997,528$ 183,387,276$ 10,249,048$ 247,820,670$
ANALYSIS BY BILLY HAMILTON CONSULTING
Extending Medicaid to Low-Income Adults Will Save Local Tax Dollars and Grow the Economy
Download this one-pager at www.texasimpact.org/Local-Taxpayers-Win-With-Medicaid Download the full report at www.mhm.org
Download the executive summary at www.texasimpact.org
For more information about the report, “Smart, Affordable and Fair” call Texas Impact at 512/472-3903 or email [email protected]

Impact of Medicaid Extension and Local Spending for Health CareHouse District 75 - Representative Mary González
County
2016 Adults <138% FPL Enrollees Moderate Scenario
2016 Adults Federal Funds
Moderate Scenario
2016 Adults State Funds Moderate Scenario
2016 Adults All Funds Moderate Scenario
2016 Children <200% FPL Enrollees Moderate Scenario
2016 Children Federal Funds
Moderate Scenario
2016 Children State Funds Moderate Scenario
2016 Children All Funds Moderate Scenario
2016 Adults & Children
All Funds Moderate Scenario
Statewide Total 1,004,771 7,615,086,733$ 292,887,951$ 7,907,974,684$ 550,189 1,500,495,384$ 769,325,576$ 2,269,820,960$ 10,177,795,644$
District Total 8,024 60,816,846$ 2,339,109$ 63,155,956$ 5,085 13,866,658$ 7,109,635$ 20,976,294$ 84,132,249$ El Paso (20%) 8,024 60,816,846$ 2,339,109$ 63,155,956$ 5,085 13,866,658$ 7,109,635$ 20,976,294$ 84,132,249$ Note: New local tax revenues are an allocation of the statewide estimate based on the county share of state personal income and further allocated in partial counties according to the share of county population. Variations in personal income or the concentration of direct health care spending in parts of counties could alter these allocations. Remaining columns reflect allocations of statewide estimates according to the county share of adults below 138% FPL or children below 200% FPL, as applicable, and further allocated for partial counties according to the share of the county's total population. Variations in percentages of adults below 138% FPL and children below 200% FPL could alter these estimates. Hospital charity cost data exclude certain hospitals, such as those exempt from reporting, hospitals that report by system, and others, resulting in a conservative estimate of unreimbursed charity costs. Medicaid extension to adults would not relieve all local unreimbursed costs due to ineligible adults, such as undocumented immigrants, people served with incomes above 138% FPL or health care for incarcerated adults other than inpatient hospital stays. 2016 is the first full year of implementation; the federal match rate falls to 95 percent in 2017 and to 90 percent by 2020. For full county-level data, see Appendix C, and for further notes and cautions in interpreting these data, see Appendix A, in "Smart, Affordable and Fair: Why Texas Should Extend Medicaid to Low-Income Adults," at http://www.mhm.org/images/stories/advocacy_and_public_policy/Smart%20Affordable%20and%20Fair_FNL_FULL.pdf.

Impact of Medicaid Extension and Local Spending for Health CareHouse District 76 - Representative Naomi Gonzalez
County
2014-2017 New Local Tax
Revenue (Adult Expansion)
2011 County Indigent
Healthcare & Unreimbursed Jail Healthcare
Costs
2011 Total Hospital District or City/County Unreimbursed
Healthcare Expenditures
2010 Total Hospital Charity
Care Costs
Total Unreimbursed Charity Care
Costs for Local Jurisdictions &
Hospitals
2014-2017 Adults Federal Funds
Limited Scenario
2014-2017 Adults Federal Funds
Moderate Scenario
2014-2017 Adults State
Funds Moderate Scenario
2014-2017 Adults Federal Funds
Enhanced Scenario
Statewide Total 2,101,392,352$ 258,927,030$ 2,544,037,688$ 1,836,673,862$ 4,380,711,550$ 14,274,023,031$ 22,962,552,386$ 1,283,318,611$ 31,030,479,514$
District Total 10,011,260$ 1,191,717$ 14,612,609$ 16,980,953$ 31,593,562$ 114,041,074$ 183,457,328$ 10,252,963$ 247,915,335$ El Paso (20%) 10,011,260$ 1,191,717$ 14,612,609$ 16,980,953$ 31,593,562$ 114,041,074$ 183,457,328$ 10,252,963$ 247,915,335$
ANALYSIS BY BILLY HAMILTON CONSULTING
Extending Medicaid to Low-Income Adults Will Save Local Tax Dollars and Grow the Economy
Download this one-pager at www.texasimpact.org/Local-Taxpayers-Win-With-Medicaid Download the full report at www.mhm.org
Download the executive summary at www.texasimpact.org
For more information about the report, “Smart, Affordable and Fair” call Texas Impact at 512/472-3903 or email [email protected]

Impact of Medicaid Extension and Local Spending for Health CareHouse District 76 - Representative Naomi Gonzalez
County
2016 Adults <138% FPL Enrollees Moderate Scenario
2016 Adults Federal Funds
Moderate Scenario
2016 Adults State Funds Moderate Scenario
2016 Adults All Funds Moderate Scenario
2016 Children <200% FPL Enrollees Moderate Scenario
2016 Children Federal Funds
Moderate Scenario
2016 Children State Funds Moderate Scenario
2016 Children All Funds Moderate Scenario
2016 Adults & Children
All Funds Moderate Scenario
Statewide Total 1,004,771 7,615,086,733$ 292,887,951$ 7,907,974,684$ 550,189 1,500,495,384$ 769,325,576$ 2,269,820,960$ 10,177,795,644$
District Total 8,028 60,840,077$ 2,340,003$ 63,180,080$ 5,086 13,871,955$ 7,112,351$ 20,984,306$ 84,164,387$ El Paso (20%) 8,028 60,840,077$ 2,340,003$ 63,180,080$ 5,086 13,871,955$ 7,112,351$ 20,984,306$ 84,164,387$ Note: New local tax revenues are an allocation of the statewide estimate based on the county share of state personal income and further allocated in partial counties according to the share of county population. Variations in personal income or the concentration of direct health care spending in parts of counties could alter these allocations. Remaining columns reflect allocations of statewide estimates according to the county share of adults below 138% FPL or children below 200% FPL, as applicable, and further allocated for partial counties according to the share of the county's total population. Variations in percentages of adults below 138% FPL and children below 200% FPL could alter these estimates. Hospital charity cost data exclude certain hospitals, such as those exempt from reporting, hospitals that report by system, and others, resulting in a conservative estimate of unreimbursed charity costs. Medicaid extension to adults would not relieve all local unreimbursed costs due to ineligible adults, such as undocumented immigrants, people served with incomes above 138% FPL or health care for incarcerated adults other than inpatient hospital stays. 2016 is the first full year of implementation; the federal match rate falls to 95 percent in 2017 and to 90 percent by 2020. For full county-level data, see Appendix C, and for further notes and cautions in interpreting these data, see Appendix A, in "Smart, Affordable and Fair: Why Texas Should Extend Medicaid to Low-Income Adults," at http://www.mhm.org/images/stories/advocacy_and_public_policy/Smart%20Affordable%20and%20Fair_FNL_FULL.pdf.

Impact of Medicaid Extension and Local Spending for Health CareHouse District 77 - Representative Marisa Márquez
County
2014-2017 New Local Tax
Revenue (Adult Expansion)
2011 County Indigent
Healthcare & Unreimbursed Jail Healthcare
Costs
2011 Total Hospital District or City/County Unreimbursed
Healthcare Expenditures
2010 Total Hospital Charity
Care Costs
Total Unreimbursed Charity Care
Costs for Local Jurisdictions &
Hospitals
2014-2017 Adults Federal Funds
Limited Scenario
2014-2017 Adults Federal Funds
Moderate Scenario
2014-2017 Adults State
Funds Moderate Scenario
2014-2017 Adults Federal Funds
Enhanced Scenario
Statewide Total 2,101,392,352$ 258,927,030$ 2,544,037,688$ 1,836,673,862$ 4,380,711,550$ 14,274,023,031$ 22,962,552,386$ 1,283,318,611$ 31,030,479,514$
District Total 10,050,928$ 1,196,439$ 14,670,510$ 17,048,238$ 31,718,748$ 114,492,949$ 184,184,258$ 10,293,589$ 248,897,672$ El Paso (20%) 10,050,928$ 1,196,439$ 14,670,510$ 17,048,238$ 31,718,748$ 114,492,949$ 184,184,258$ 10,293,589$ 248,897,672$
ANALYSIS BY BILLY HAMILTON CONSULTING
Extending Medicaid to Low-Income Adults Will Save Local Tax Dollars and Grow the Economy
Download this one-pager at www.texasimpact.org/Local-Taxpayers-Win-With-Medicaid Download the full report at www.mhm.org
Download the executive summary at www.texasimpact.org
For more information about the report, “Smart, Affordable and Fair” call Texas Impact at 512/472-3903 or email [email protected]

Impact of Medicaid Extension and Local Spending for Health CareHouse District 77 - Representative Marisa Márquez
County
2016 Adults <138% FPL Enrollees Moderate Scenario
2016 Adults Federal Funds
Moderate Scenario
2016 Adults State Funds Moderate Scenario
2016 Adults All Funds Moderate Scenario
2016 Children <200% FPL Enrollees Moderate Scenario
2016 Children Federal Funds
Moderate Scenario
2016 Children State Funds Moderate Scenario
2016 Children All Funds Moderate Scenario
2016 Adults & Children
All Funds Moderate Scenario
Statewide Total 1,004,771 7,615,086,733$ 292,887,951$ 7,907,974,684$ 550,189 1,500,495,384$ 769,325,576$ 2,269,820,960$ 10,177,795,644$
District Total 8,059 61,081,150$ 2,349,275$ 63,430,425$ 5,107 13,926,921$ 7,140,533$ 21,067,454$ 84,497,879$ El Paso (20%) 8,059 61,081,150$ 2,349,275$ 63,430,425$ 5,107 13,926,921$ 7,140,533$ 21,067,454$ 84,497,879$ Note: New local tax revenues are an allocation of the statewide estimate based on the county share of state personal income and further allocated in partial counties according to the share of county population. Variations in personal income or the concentration of direct health care spending in parts of counties could alter these allocations. Remaining columns reflect allocations of statewide estimates according to the county share of adults below 138% FPL or children below 200% FPL, as applicable, and further allocated for partial counties according to the share of the county's total population. Variations in percentages of adults below 138% FPL and children below 200% FPL could alter these estimates. Hospital charity cost data exclude certain hospitals, such as those exempt from reporting, hospitals that report by system, and others, resulting in a conservative estimate of unreimbursed charity costs. Medicaid extension to adults would not relieve all local unreimbursed costs due to ineligible adults, such as undocumented immigrants, people served with incomes above 138% FPL or health care for incarcerated adults other than inpatient hospital stays. 2016 is the first full year of implementation; the federal match rate falls to 95 percent in 2017 and to 90 percent by 2020. For full county-level data, see Appendix C, and for further notes and cautions in interpreting these data, see Appendix A, in "Smart, Affordable and Fair: Why Texas Should Extend Medicaid to Low-Income Adults," at http://www.mhm.org/images/stories/advocacy_and_public_policy/Smart%20Affordable%20and%20Fair_FNL_FULL.pdf.

Impact of Medicaid Extension and Local Spending for Health CareHouse District 78 - Representative Joe Moody
County
2014-2017 New Local Tax
Revenue (Adult Expansion)
2011 County Indigent
Healthcare & Unreimbursed Jail Healthcare
Costs
2011 Total Hospital District or City/County Unreimbursed
Healthcare Expenditures
2010 Total Hospital Charity
Care Costs
Total Unreimbursed Charity Care
Costs for Local Jurisdictions &
Hospitals
2014-2017 Adults Federal Funds
Limited Scenario
2014-2017 Adults Federal Funds
Moderate Scenario
2014-2017 Adults State
Funds Moderate Scenario
2014-2017 Adults Federal Funds
Enhanced Scenario
Statewide Total 2,101,392,352$ 258,927,030$ 2,544,037,688$ 1,836,673,862$ 4,380,711,550$ 14,274,023,031$ 22,962,552,386$ 1,283,318,611$ 31,030,479,514$
District Total 10,036,891$ 1,194,768$ 14,650,021$ 17,024,428$ 31,674,448$ 114,333,044$ 183,927,019$ 10,279,213$ 248,550,052$ El Paso (20%) 10,036,891$ 1,194,768$ 14,650,021$ 17,024,428$ 31,674,448$ 114,333,044$ 183,927,019$ 10,279,213$ 248,550,052$
ANALYSIS BY BILLY HAMILTON CONSULTING
Extending Medicaid to Low-Income Adults Will Save Local Tax Dollars and Grow the Economy
Download this one-pager at www.texasimpact.org/Local-Taxpayers-Win-With-Medicaid Download the full report at www.mhm.org
Download the executive summary at www.texasimpact.org
For more information about the report, “Smart, Affordable and Fair” call Texas Impact at 512/472-3903 or email [email protected]

Impact of Medicaid Extension and Local Spending for Health CareHouse District 78 - Representative Joe Moody
County
2016 Adults <138% FPL Enrollees Moderate Scenario
2016 Adults Federal Funds
Moderate Scenario
2016 Adults State Funds Moderate Scenario
2016 Adults All Funds Moderate Scenario
2016 Children <200% FPL Enrollees Moderate Scenario
2016 Children Federal Funds
Moderate Scenario
2016 Children State Funds Moderate Scenario
2016 Children All Funds Moderate Scenario
2016 Adults & Children
All Funds Moderate Scenario
Statewide Total 1,004,771 7,615,086,733$ 292,887,951$ 7,907,974,684$ 550,189 1,500,495,384$ 769,325,576$ 2,269,820,960$ 10,177,795,644$
District Total 8,048 60,995,841$ 2,345,994$ 63,341,835$ 5,099 13,907,471$ 7,130,560$ 21,038,031$ 84,379,866$ El Paso (20%) 8,048 60,995,841$ 2,345,994$ 63,341,835$ 5,099 13,907,471$ 7,130,560$ 21,038,031$ 84,379,866$
Note: New local tax revenues are an allocation of the statewide estimate based on the county share of state personal income and further allocated in partial counties according to the share of county population. Variations in personal income or the concentration of direct health care spending in parts of counties could alter these allocations. Remaining columns reflect allocations of statewide estimates according to the county share of adults below 138% FPL or children below 200% FPL, as applicable, and further allocated for partial counties according to the share of the county's total population. Variations in percentages of adults below 138% FPL and children below 200% FPL could alter these estimates. Hospital charity cost data exclude certain hospitals, such as those exempt from reporting, hospitals that report by system, and others, resulting in a conservative estimate of unreimbursed charity costs. Medicaid extension to adults would not relieve all local unreimbursed costs due to ineligible adults, such as undocumented immigrants, people served with incomes above 138% FPL or health care for incarcerated adults other than inpatient hospital stays. 2016 is the first full year of implementation; the federal match rate falls to 95 percent in 2017 and to 90 percent by 2020. For full county-level data, see Appendix C, and for further notes and cautions in interpreting these data, see Appendix A, in "Smart, Affordable and Fair: Why Texas Should Extend Medicaid to Low-Income Adults," at http://www.mhm.org/images/stories/advocacy_and_public_policy/Smart%20Affordable%20and%20Fair_FNL_FULL.pdf.

Impact of Medicaid Extension and Local Spending for Health CareHouse District 79 - Representative Joe C. Pickett
County
2014-2017 New
Local Tax
Revenue (Adult
Expansion)
2011 County
Indigent
Healthcare &
Unreimbursed
Jail Healthcare
Costs
2011 Total
Hospital District
or City/County
Unreimbursed
Healthcare
Expenditures
2010 Total
Hospital Charity
Care Costs
Total
Unreimbursed
Charity Care
Costs for Local
Jurisdictions &
Hospitals
2014-2017 Adults
Federal Funds
Limited
Scenario
2014-2017 Adults
Federal Funds
Moderate
Scenario
2014-2017
Adults State
Funds Moderate
Scenario
2014-2017 Adults
Federal Funds
Enhanced Scenario
Statewide Total 2,101,392,352$ 258,927,030$ 2,544,037,688$ 1,836,673,862$ 4,380,711,550$ 14,274,023,031$ 22,962,552,386$ 1,283,318,611$ 31,030,479,514$
District Total 10,068,037$ 1,198,475$ 14,695,482$ 17,077,257$ 31,772,738$ 114,687,834$ 184,497,768$ 10,311,111$ 249,321,335$
El Paso (20%) 10,068,037$ 1,198,475$ 14,695,482$ 17,077,257$ 31,772,738$ 114,687,834$ 184,497,768$ 10,311,111$ 249,321,335$
ANALYSIS BY BILLY HAMILTON CONSULTING
Extending Medicaid to Low-Income Adults Will Save Local Tax Dollars and Grow the Economy
Download this one-pager at www.texasimpact.org/Local-Taxpayers-Win-With-Medicaid Download the full report at www.mhm.org
Download the executive summary at www.texasimpact.org
For more information about the report, “Smart, Affordable and Fair” call Texas Impact at 512/472-3903 or email [email protected]

Impact of Medicaid Extension and Local Spending for Health CareHouse District 79 - Representative Joe C. Pickett
County
2016 Adults <138% FPL Enrollees Moderate Scenario
2016 Adults Federal Funds
Moderate Scenario
2016 Adults State Funds Moderate Scenario
2016 Adults All Funds Moderate Scenario
2016 Children <200% FPL Enrollees Moderate Scenario
2016 Children Federal Funds
Moderate Scenario
2016 Children State Funds Moderate Scenario
2016 Children All Funds Moderate Scenario
2016 Adults & Children
All Funds Moderate Scenario
Statewide Total 1,004,771 7,615,086,733$ 292,887,951$ 7,907,974,684$ 550,189 1,500,495,384$ 769,325,576$ 2,269,820,960$ 10,177,795,644$
District Total 8,073 61,185,119$ 2,353,274$ 63,538,393$ 5,115 13,950,627$ 7,152,687$ 21,103,315$ 84,641,708$ El Paso (20%) 8,073 61,185,119$ 2,353,274$ 63,538,393$ 5,115 13,950,627$ 7,152,687$ 21,103,315$ 84,641,708$ Note: New local tax revenues are an allocation of the statewide estimate based on the county share of state personal income and further allocated in partial counties according to the share of county population. Variations in personal income or the concentration of direct health care spending in parts of counties could alter these allocations. Remaining columns reflect allocations of statewide estimates according to the county share of adults below 138% FPL or children below 200% FPL, as applicable, and further allocated for partial counties according to the share of the county's total population. Variations in percentages of adults below 138% FPL and children below 200% FPL could alter these estimates. Hospital charity cost data exclude certain hospitals, such as those exempt from reporting, hospitals that report by system, and others, resulting in a conservative estimate of unreimbursed charity costs. Medicaid extension to adults would not relieve all local unreimbursed costs due to ineligible adults, such as undocumented immigrants, people served with incomes above 138% FPL or health care for incarcerated adults other than inpatient hospital stays. 2016 is the first full year of implementation; the federal match rate falls to 95 percent in 2017 and to 90 percent by 2020. For full county-level data, see Appendix C, and for further notes and cautions in interpreting these data, see Appendix A, in "Smart, Affordable and Fair: Why Texas Should Extend Medicaid to Low-Income Adults," at http://www.mhm.org/images/stories/advocacy_and_public_policy/Smart%20Affordable%20and%20Fair_FNL_FULL.pdf.
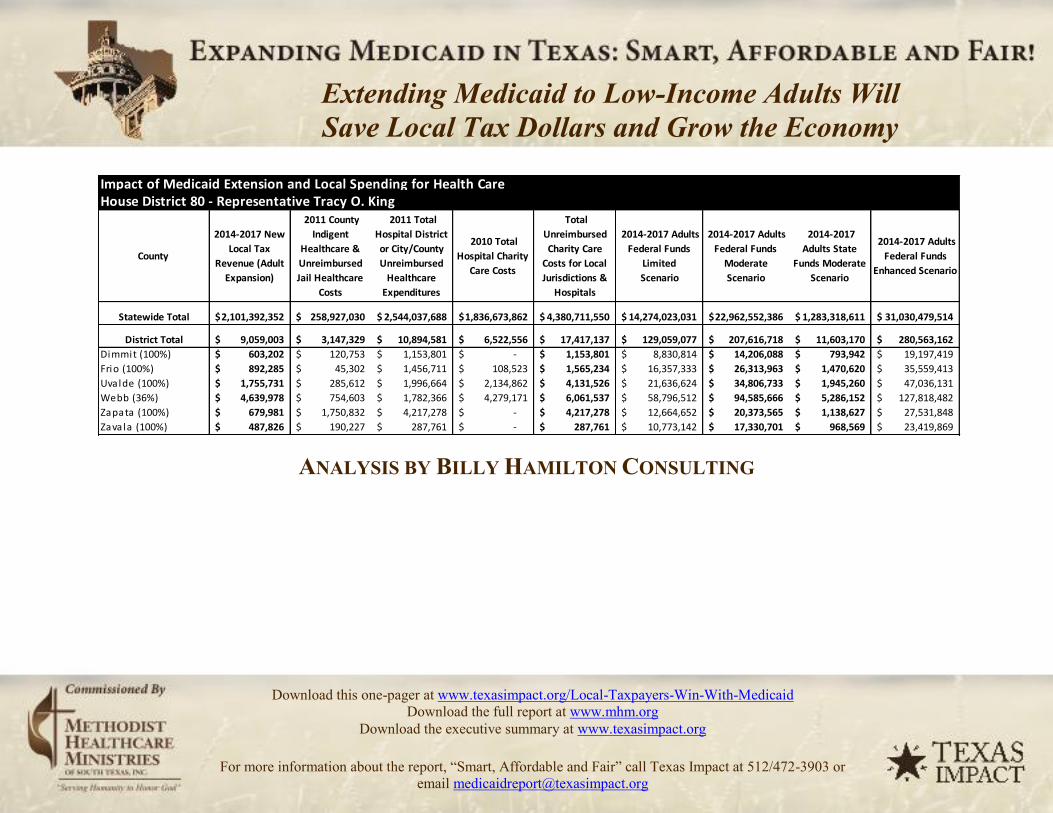
Impact of Medicaid Extension and Local Spending for Health CareHouse District 80 - Representative Tracy O. King
County
2014-2017 New Local Tax
Revenue (Adult Expansion)
2011 County Indigent
Healthcare & Unreimbursed Jail Healthcare
Costs
2011 Total Hospital District or City/County Unreimbursed
Healthcare Expenditures
2010 Total Hospital Charity
Care Costs
Total Unreimbursed Charity Care
Costs for Local Jurisdictions &
Hospitals
2014-2017 Adults Federal Funds
Limited Scenario
2014-2017 Adults Federal Funds
Moderate Scenario
2014-2017 Adults State
Funds Moderate Scenario
2014-2017 Adults Federal Funds
Enhanced Scenario
Statewide Total 2,101,392,352$ 258,927,030$ 2,544,037,688$ 1,836,673,862$ 4,380,711,550$ 14,274,023,031$ 22,962,552,386$ 1,283,318,611$ 31,030,479,514$
District Total 9,059,003$ 3,147,329$ 10,894,581$ 6,522,556$ 17,417,137$ 129,059,077$ 207,616,718$ 11,603,170$ 280,563,162$ Dimmit (100%) 603,202$ 120,753$ 1,153,801$ -$ 1,153,801$ 8,830,814$ 14,206,088$ 793,942$ 19,197,419$ Frio (100%) 892,285$ 45,302$ 1,456,711$ 108,523$ 1,565,234$ 16,357,333$ 26,313,963$ 1,470,620$ 35,559,413$ Uvalde (100%) 1,755,731$ 285,612$ 1,996,664$ 2,134,862$ 4,131,526$ 21,636,624$ 34,806,733$ 1,945,260$ 47,036,131$ Webb (36%) 4,639,978$ 754,603$ 1,782,366$ 4,279,171$ 6,061,537$ 58,796,512$ 94,585,666$ 5,286,152$ 127,818,482$ Zapata (100%) 679,981$ 1,750,832$ 4,217,278$ -$ 4,217,278$ 12,664,652$ 20,373,565$ 1,138,627$ 27,531,848$ Zavala (100%) 487,826$ 190,227$ 287,761$ -$ 287,761$ 10,773,142$ 17,330,701$ 968,569$ 23,419,869$
ANALYSIS BY BILLY HAMILTON CONSULTING
Extending Medicaid to Low-Income Adults Will Save Local Tax Dollars and Grow the Economy
Download this one-pager at www.texasimpact.org/Local-Taxpayers-Win-With-Medicaid Download the full report at www.mhm.org
Download the executive summary at www.texasimpact.org
For more information about the report, “Smart, Affordable and Fair” call Texas Impact at 512/472-3903 or email [email protected]
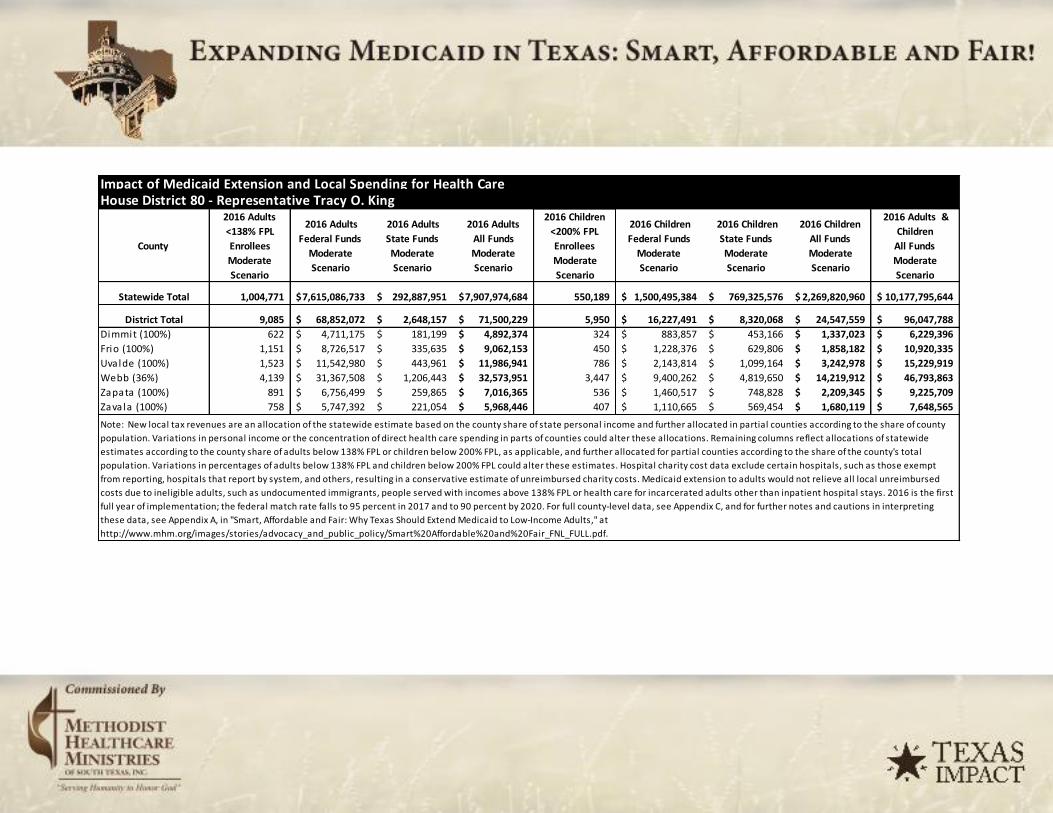
Impact of Medicaid Extension and Local Spending for Health CareHouse District 80 - Representative Tracy O. King
County
2016 Adults <138% FPL Enrollees Moderate Scenario
2016 Adults Federal Funds
Moderate Scenario
2016 Adults State Funds Moderate Scenario
2016 Adults All Funds Moderate Scenario
2016 Children <200% FPL Enrollees Moderate Scenario
2016 Children Federal Funds
Moderate Scenario
2016 Children State Funds Moderate Scenario
2016 Children All Funds Moderate Scenario
2016 Adults & Children
All Funds Moderate Scenario
Statewide Total 1,004,771 7,615,086,733$ 292,887,951$ 7,907,974,684$ 550,189 1,500,495,384$ 769,325,576$ 2,269,820,960$ 10,177,795,644$
District Total 9,085 68,852,072$ 2,648,157$ 71,500,229$ 5,950 16,227,491$ 8,320,068$ 24,547,559$ 96,047,788$ Dimmit (100%) 622 4,711,175$ 181,199$ 4,892,374$ 324 883,857$ 453,166$ 1,337,023$ 6,229,396$ Frio (100%) 1,151 8,726,517$ 335,635$ 9,062,153$ 450 1,228,376$ 629,806$ 1,858,182$ 10,920,335$ Uvalde (100%) 1,523 11,542,980$ 443,961$ 11,986,941$ 786 2,143,814$ 1,099,164$ 3,242,978$ 15,229,919$ Webb (36%) 4,139 31,367,508$ 1,206,443$ 32,573,951$ 3,447 9,400,262$ 4,819,650$ 14,219,912$ 46,793,863$ Zapata (100%) 891 6,756,499$ 259,865$ 7,016,365$ 536 1,460,517$ 748,828$ 2,209,345$ 9,225,709$ Zavala (100%) 758 5,747,392$ 221,054$ 5,968,446$ 407 1,110,665$ 569,454$ 1,680,119$ 7,648,565$ Note: New local tax revenues are an allocation of the statewide estimate based on the county share of state personal income and further allocated in partial counties according to the share of county population. Variations in personal income or the concentration of direct health care spending in parts of counties could alter these allocations. Remaining columns reflect allocations of statewide estimates according to the county share of adults below 138% FPL or children below 200% FPL, as applicable, and further allocated for partial counties according to the share of the county's total population. Variations in percentages of adults below 138% FPL and children below 200% FPL could alter these estimates. Hospital charity cost data exclude certain hospitals, such as those exempt from reporting, hospitals that report by system, and others, resulting in a conservative estimate of unreimbursed charity costs. Medicaid extension to adults would not relieve all local unreimbursed costs due to ineligible adults, such as undocumented immigrants, people served with incomes above 138% FPL or health care for incarcerated adults other than inpatient hospital stays. 2016 is the first full year of implementation; the federal match rate falls to 95 percent in 2017 and to 90 percent by 2020. For full county-level data, see Appendix C, and for further notes and cautions in interpreting these data, see Appendix A, in "Smart, Affordable and Fair: Why Texas Should Extend Medicaid to Low-Income Adults," at http://www.mhm.org/images/stories/advocacy_and_public_policy/Smart%20Affordable%20and%20Fair_FNL_FULL.pdf.

Impact of Medicaid Extension and Local Spending for Health CareHouse District 81 - Representative Tryon D. Lewis
County
2014-2017 New Local Tax
Revenue (Adult Expansion)
2011 County Indigent
Healthcare & Unreimbursed Jail Healthcare
Costs
2011 Total Hospital District or City/County Unreimbursed
Healthcare Expenditures
2010 Total Hospital Charity
Care Costs
Total Unreimbursed Charity Care
Costs for Local Jurisdictions &
Hospitals
2014-2017 Adults Federal Funds
Limited Scenario
2014-2017 Adults Federal Funds
Moderate Scenario
2014-2017 Adults State
Funds Moderate Scenario
2014-2017 Adults Federal Funds
Enhanced Scenario
Statewide Total 2,101,392,352$ 258,927,030$ 2,544,037,688$ 1,836,673,862$ 4,380,711,550$ 14,274,023,031$ 22,962,552,386$ 1,283,318,611$ 31,030,479,514$
District Total 12,646,647$ 252,974$ 50,579,180$ 8,303,610$ 58,882,790$ 102,711,855$ 165,232,068$ 9,234,400$ 223,286,602$ Andrews (100%) 1,160,386$ 16,436$ 10,258,573$ 392,056$ 10,650,629$ 11,653,965$ 18,747,677$ 1,047,760$ 25,334,701$ Ector (100%) 10,201,519$ -$ 34,263,225$ 7,911,554$ 42,174,779$ 76,976,017$ 123,830,949$ 6,920,597$ 167,339,138$ Ward (100%) 796,259$ 200,245$ 3,203,146$ -$ 3,203,146$ 8,367,818$ 13,461,268$ 752,316$ 18,190,905$ Winkler (100%) 488,484$ 36,293$ 2,854,237$ -$ 2,854,237$ 5,714,056$ 9,192,175$ 513,727$ 12,421,859$
ANALYSIS BY BILLY HAMILTON CONSULTING
Extending Medicaid to Low-Income Adults Will Save Local Tax Dollars and Grow the Economy
Download this one-pager at www.texasimpact.org/Local-Taxpayers-Win-With-Medicaid Download the full report at www.mhm.org
Download the executive summary at www.texasimpact.org
For more information about the report, “Smart, Affordable and Fair” call Texas Impact at 512/472-3903 or email [email protected]

Impact of Medicaid Extension and Local Spending for Health CareHouse District 81 - Representative Tryon D. Lewis
County
2016 Adults
<138% FPL
Enrollees
Moderate
Scenario
2016 Adults
Federal Funds
Moderate
Scenario
2016 Adults
State Funds
Moderate
Scenario
2016 Adults
All Funds
Moderate
Scenario
2016 Children
<200% FPL
Enrollees
Moderate
Scenario
2016 Children
Federal Funds
Moderate
Scenario
2016 Children
State Funds
Moderate
Scenario
2016 Children
All Funds
Moderate
Scenario
2016 Adults &
Children
All Funds
Moderate
Scenario
Statewide Total 1,004,771 7,615,086,733$ 292,887,951$ 7,907,974,684$ 550,189 1,500,495,384$ 769,325,576$ 2,269,820,960$ 10,177,795,644$
District Total 7,230 54,796,022$ 2,107,539$ 56,903,561$ 3,952 10,777,720$ 5,525,892$ 16,303,612$ 73,207,173$
Andrews (100%) 820 6,217,305$ 239,127$ 6,456,432$ 392 1,068,421$ 547,795$ 1,616,215$ 8,072,647$
Ector (100%) 5,418 41,066,141$ 1,579,467$ 42,645,608$ 3,099 8,452,213$ 4,333,571$ 12,785,784$ 55,431,392$
Ward (100%) 589 4,464,169$ 171,699$ 4,635,868$ 266 726,362$ 372,416$ 1,098,778$ 5,734,646$
Winkler (100%) 402 3,048,407$ 117,246$ 3,165,654$ 195 530,724$ 272,110$ 802,834$ 3,968,488$
Note: New local tax revenues are an allocation of the statewide estimate based on the county share of state personal income and further allocated in partial counties according to the share of county population. Variations in personal income or the concentration of direct health care spending in parts of counties could alter these allocations. Remaining columns reflect allocations of statewide estimates according to the county share of adults below 138% FPL or children below 200% FPL, as applicable, and further allocated for partial counties according to the share of the county's total population. Variations in percentages of adults below 138% FPL and children below 200% FPL could alter these estimates. Hospital charity cost data exclude certain hospitals, such as those exempt from reporting, hospitals that report by system, and others, resulting in a conservative estimate of unreimbursed charity costs. Medicaid extension to adults would not relieve all local unreimbursed costs due to ineligible adults, such as undocumented immigrants, people served with incomes above 138% FPL or health care for incarcerated adults other than inpatient hospital stays. 2016 is the first full year of implementation; the federal match rate falls to 95 percent in 2017 and to 90 percent by 2020. For full county-level data, see Appendix C, and for further notes and cautions in interpreting these data, see Appendix A, in "Smart, Affordable and Fair: Why Texas Should Extend Medicaid to Low-Income Adults," at http://www.mhm.org/images/stories/advocacy_and_public_policy/Smart%20Affordable%20and%20Fair_FNL_FULL.pdf.
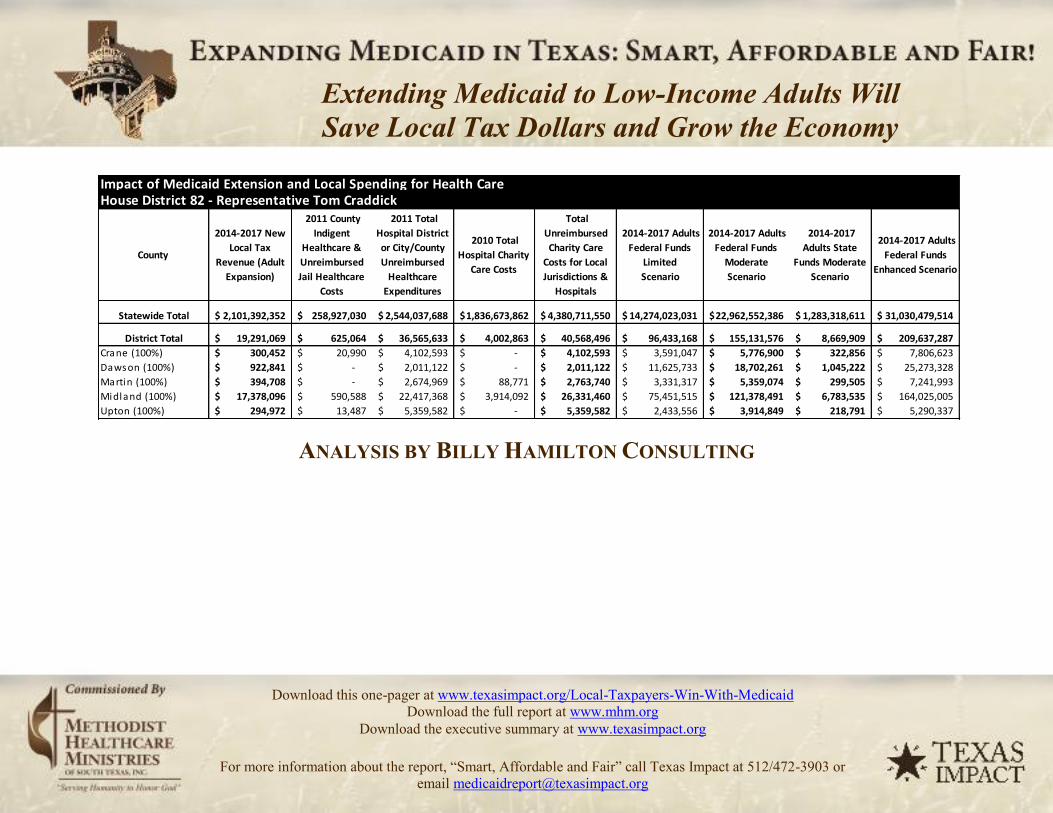
Impact of Medicaid Extension and Local Spending for Health CareHouse District 82 - Representative Tom Craddick
County
2014-2017 New Local Tax
Revenue (Adult Expansion)
2011 County Indigent
Healthcare & Unreimbursed Jail Healthcare
Costs
2011 Total Hospital District or City/County Unreimbursed
Healthcare Expenditures
2010 Total Hospital Charity
Care Costs
Total Unreimbursed Charity Care
Costs for Local Jurisdictions &
Hospitals
2014-2017 Adults Federal Funds
Limited Scenario
2014-2017 Adults Federal Funds
Moderate Scenario
2014-2017 Adults State
Funds Moderate Scenario
2014-2017 Adults Federal Funds
Enhanced Scenario
Statewide Total 2,101,392,352$ 258,927,030$ 2,544,037,688$ 1,836,673,862$ 4,380,711,550$ 14,274,023,031$ 22,962,552,386$ 1,283,318,611$ 31,030,479,514$
District Total 19,291,069$ 625,064$ 36,565,633$ 4,002,863$ 40,568,496$ 96,433,168$ 155,131,576$ 8,669,909$ 209,637,287$ Crane (100%) 300,452$ 20,990$ 4,102,593$ -$ 4,102,593$ 3,591,047$ 5,776,900$ 322,856$ 7,806,623$ Dawson (100%) 922,841$ -$ 2,011,122$ -$ 2,011,122$ 11,625,733$ 18,702,261$ 1,045,222$ 25,273,328$ Martin (100%) 394,708$ -$ 2,674,969$ 88,771$ 2,763,740$ 3,331,317$ 5,359,074$ 299,505$ 7,241,993$ Midland (100%) 17,378,096$ 590,588$ 22,417,368$ 3,914,092$ 26,331,460$ 75,451,515$ 121,378,491$ 6,783,535$ 164,025,005$ Upton (100%) 294,972$ 13,487$ 5,359,582$ -$ 5,359,582$ 2,433,556$ 3,914,849$ 218,791$ 5,290,337$
ANALYSIS BY BILLY HAMILTON CONSULTING
Extending Medicaid to Low-Income Adults Will Save Local Tax Dollars and Grow the Economy
Download this one-pager at www.texasimpact.org/Local-Taxpayers-Win-With-Medicaid Download the full report at www.mhm.org
Download the executive summary at www.texasimpact.org
For more information about the report, “Smart, Affordable and Fair” call Texas Impact at 512/472-3903 or email [email protected]

Impact of Medicaid Extension and Local Spending for Health Care
House District 82 - Representative Tom Craddick
County
2016 Adults
<138% FPL
Enrollees
Moderate
Scenario
2016 Adults
Federal Funds
Moderate
Scenario
2016 Adults
State Funds
Moderate
Scenario
2016 Adults
All Funds
Moderate
Scenario
2016 Children
<200% FPL
Enrollees
Moderate
Scenario
2016 Children
Federal Funds
Moderate
Scenario
2016 Children
State Funds
Moderate
Scenario
2016 Children
All Funds
Moderate
Scenario
2016 Adults &
Children
All Funds
Moderate
Scenario
Statewide Total 1,004,771 7,615,086,733$ 292,887,951$ 7,907,974,684$ 550,189 1,500,495,384$ 769,325,576$ 2,269,820,960$ 10,177,795,644$
District Total 6,788 51,446,389$ 1,978,707$ 53,425,096$ 3,390 9,244,198$ 4,739,633$ 13,983,831$ 67,408,927$
Crane (100%) 253 1,915,797$ 73,685$ 1,989,482$ 124 338,778$ 173,696$ 512,474$ 2,501,956$
Dawson (100%) 818 6,202,243$ 238,548$ 6,440,791$ 326 890,009$ 456,320$ 1,346,329$ 7,787,120$
Martin (100%) 234 1,777,233$ 68,355$ 1,845,589$ 126 343,699$ 176,220$ 519,919$ 2,365,507$
Midland (100%) 5,311 40,252,831$ 1,548,186$ 41,801,017$ 2,730 7,445,723$ 3,817,530$ 11,263,253$ 53,064,270$
Upton (100%) 171 1,298,284$ 49,934$ 1,348,218$ 83 225,988$ 115,868$ 341,856$ 1,690,074$
Note: New local tax revenues are an allocation of the statewide estimate based on the county share of state personal income and further allocated in partial counties according to the share of county population. Variations in personal income or the concentration of direct health care spending in parts of counties could alter these allocations. Remaining columns reflect allocations of statewide estimates according to the county share of adults below 138% FPL or children below 200% FPL, as applicable, and further allocated for partial counties according to the share of the county's total population. Variations in percentages of adults below 138% FPL and children below 200% FPL could alter these estimates. Hospital charity cost data exclude certain hospitals, such as those exempt from reporting, hospitals that report by system, and others, resulting in a conservative estimate of unreimbursed charity costs. Medicaid extension to adults would not relieve all local unreimbursed costs due to ineligible adults, such as undocumented immigrants, people served with incomes above 138% FPL or health care for incarcerated adults other than inpatient hospital stays. 2016 is the first full year of implementation; the federal match rate falls to 95 percent in 2017 and to 90 percent by 2020. For full county-level data, see Appendix C, and for further notes and cautions in interpreting these data, see Appendix A, in "Smart, Affordable and Fair: Why Texas Should Extend Medicaid to Low-Income Adults," at http://www.mhm.org/images/stories/advocacy_and_public_policy/Smart%20Affordable%20and%20Fair_FNL_FULL.pdf.
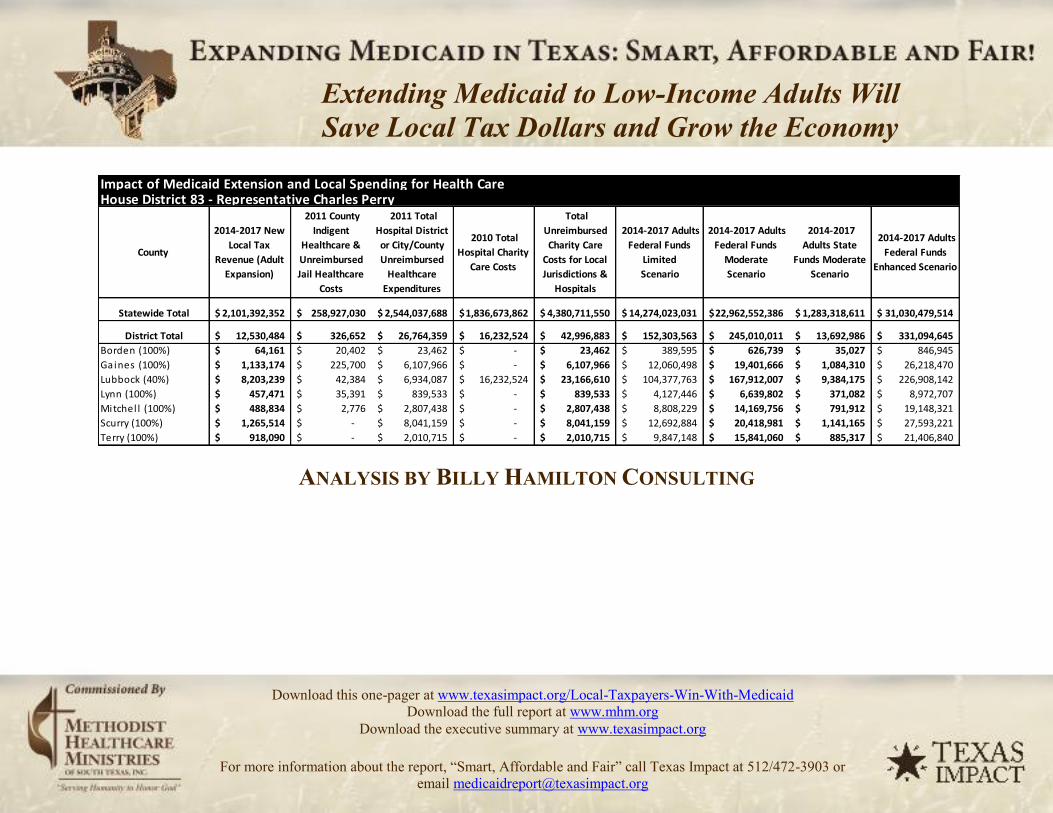
Impact of Medicaid Extension and Local Spending for Health CareHouse District 83 - Representative Charles Perry
County
2014-2017 New Local Tax
Revenue (Adult Expansion)
2011 County Indigent
Healthcare & Unreimbursed Jail Healthcare
Costs
2011 Total Hospital District or City/County Unreimbursed
Healthcare Expenditures
2010 Total Hospital Charity
Care Costs
Total Unreimbursed Charity Care
Costs for Local Jurisdictions &
Hospitals
2014-2017 Adults Federal Funds
Limited Scenario
2014-2017 Adults Federal Funds
Moderate Scenario
2014-2017 Adults State
Funds Moderate Scenario
2014-2017 Adults Federal Funds
Enhanced Scenario
Statewide Total 2,101,392,352$ 258,927,030$ 2,544,037,688$ 1,836,673,862$ 4,380,711,550$ 14,274,023,031$ 22,962,552,386$ 1,283,318,611$ 31,030,479,514$
District Total 12,530,484$ 326,652$ 26,764,359$ 16,232,524$ 42,996,883$ 152,303,563$ 245,010,011$ 13,692,986$ 331,094,645$ Borden (100%) 64,161$ 20,402$ 23,462$ -$ 23,462$ 389,595$ 626,739$ 35,027$ 846,945$ Gaines (100%) 1,133,174$ 225,700$ 6,107,966$ -$ 6,107,966$ 12,060,498$ 19,401,666$ 1,084,310$ 26,218,470$ Lubbock (40%) 8,203,239$ 42,384$ 6,934,087$ 16,232,524$ 23,166,610$ 104,377,763$ 167,912,007$ 9,384,175$ 226,908,142$ Lynn (100%) 457,471$ 35,391$ 839,533$ -$ 839,533$ 4,127,446$ 6,639,802$ 371,082$ 8,972,707$ Mitchel l (100%) 488,834$ 2,776$ 2,807,438$ -$ 2,807,438$ 8,808,229$ 14,169,756$ 791,912$ 19,148,321$ Scurry (100%) 1,265,514$ -$ 8,041,159$ -$ 8,041,159$ 12,692,884$ 20,418,981$ 1,141,165$ 27,593,221$ Terry (100%) 918,090$ -$ 2,010,715$ -$ 2,010,715$ 9,847,148$ 15,841,060$ 885,317$ 21,406,840$
ANALYSIS BY BILLY HAMILTON CONSULTING
Extending Medicaid to Low-Income Adults Will Save Local Tax Dollars and Grow the Economy
Download this one-pager at www.texasimpact.org/Local-Taxpayers-Win-With-Medicaid Download the full report at www.mhm.org
Download the executive summary at www.texasimpact.org
For more information about the report, “Smart, Affordable and Fair” call Texas Impact at 512/472-3903 or email [email protected]
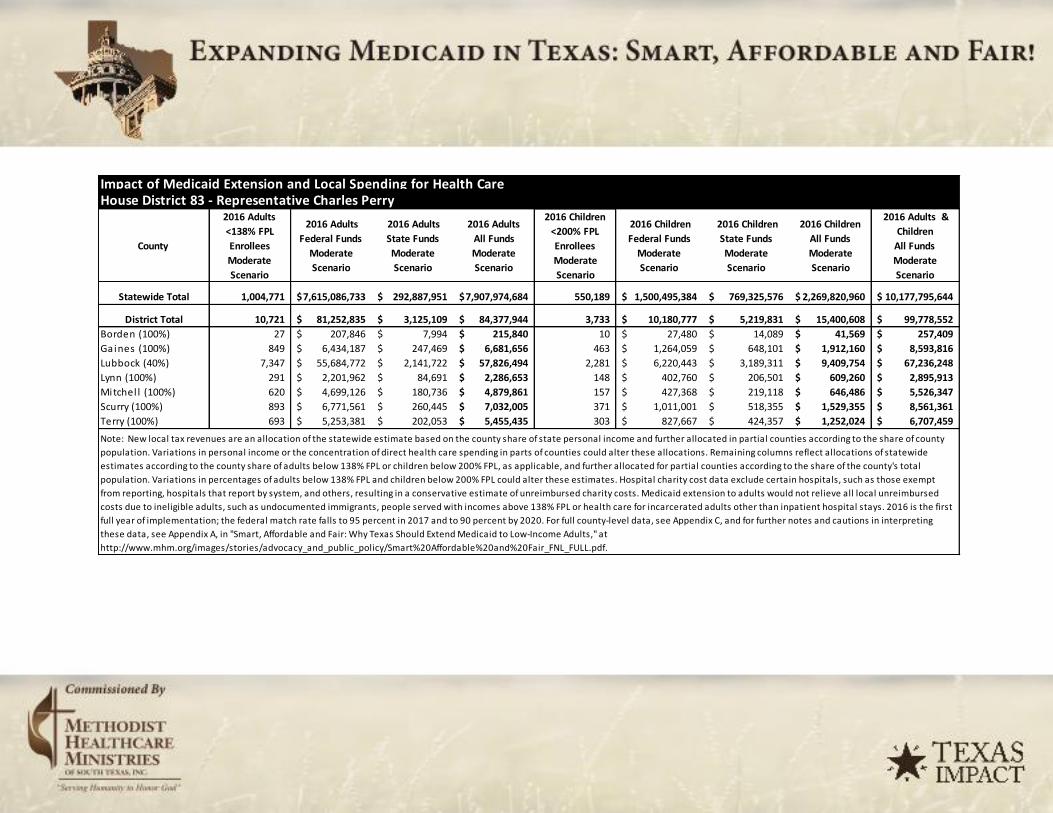
Impact of Medicaid Extension and Local Spending for Health CareHouse District 83 - Representative Charles Perry
County
2016 Adults <138% FPL Enrollees Moderate Scenario
2016 Adults Federal Funds
Moderate Scenario
2016 Adults State Funds Moderate Scenario
2016 Adults All Funds Moderate Scenario
2016 Children <200% FPL Enrollees Moderate Scenario
2016 Children Federal Funds
Moderate Scenario
2016 Children State Funds Moderate Scenario
2016 Children All Funds Moderate Scenario
2016 Adults & Children
All Funds Moderate Scenario
Statewide Total 1,004,771 7,615,086,733$ 292,887,951$ 7,907,974,684$ 550,189 1,500,495,384$ 769,325,576$ 2,269,820,960$ 10,177,795,644$
District Total 10,721 81,252,835$ 3,125,109$ 84,377,944$ 3,733 10,180,777$ 5,219,831$ 15,400,608$ 99,778,552$ Borden (100%) 27 207,846$ 7,994$ 215,840$ 10 27,480$ 14,089$ 41,569$ 257,409$ Gaines (100%) 849 6,434,187$ 247,469$ 6,681,656$ 463 1,264,059$ 648,101$ 1,912,160$ 8,593,816$ Lubbock (40%) 7,347 55,684,772$ 2,141,722$ 57,826,494$ 2,281 6,220,443$ 3,189,311$ 9,409,754$ 67,236,248$ Lynn (100%) 291 2,201,962$ 84,691$ 2,286,653$ 148 402,760$ 206,501$ 609,260$ 2,895,913$ Mitchel l (100%) 620 4,699,126$ 180,736$ 4,879,861$ 157 427,368$ 219,118$ 646,486$ 5,526,347$ Scurry (100%) 893 6,771,561$ 260,445$ 7,032,005$ 371 1,011,001$ 518,355$ 1,529,355$ 8,561,361$ Terry (100%) 693 5,253,381$ 202,053$ 5,455,435$ 303 827,667$ 424,357$ 1,252,024$ 6,707,459$
Note: New local tax revenues are an allocation of the statewide estimate based on the county share of state personal income and further allocated in partial counties according to the share of county population. Variations in personal income or the concentration of direct health care spending in parts of counties could alter these allocations. Remaining columns reflect allocations of statewide estimates according to the county share of adults below 138% FPL or children below 200% FPL, as applicable, and further allocated for partial counties according to the share of the county's total population. Variations in percentages of adults below 138% FPL and children below 200% FPL could alter these estimates. Hospital charity cost data exclude certain hospitals, such as those exempt from reporting, hospitals that report by system, and others, resulting in a conservative estimate of unreimbursed charity costs. Medicaid extension to adults would not relieve all local unreimbursed costs due to ineligible adults, such as undocumented immigrants, people served with incomes above 138% FPL or health care for incarcerated adults other than inpatient hospital stays. 2016 is the first full year of implementation; the federal match rate falls to 95 percent in 2017 and to 90 percent by 2020. For full county-level data, see Appendix C, and for further notes and cautions in interpreting these data, see Appendix A, in "Smart, Affordable and Fair: Why Texas Should Extend Medicaid to Low-Income Adults," at http://www.mhm.org/images/stories/advocacy_and_public_policy/Smart%20Affordable%20and%20Fair_FNL_FULL.pdf.

Impact of Medicaid Extension and Local Spending for Health CareHouse District 84 - Representative John Frullo
County
2014-2017 New Local Tax
Revenue (Adult Expansion)
2011 County Indigent
Healthcare & Unreimbursed Jail Healthcare
Costs
2011 Total Hospital District or City/County Unreimbursed
Healthcare Expenditures
2010 Total Hospital Charity
Care Costs
Total Unreimbursed Charity Care
Costs for Local Jurisdictions &
Hospitals
2014-2017 Adults Federal Funds
Limited Scenario
2014-2017 Adults Federal Funds
Moderate Scenario
2014-2017 Adults State
Funds Moderate Scenario
2014-2017 Adults Federal Funds
Enhanced Scenario
Statewide Total 2,101,392,352$ 258,927,030$ 2,544,037,688$ 1,836,673,862$ 4,380,711,550$ 14,274,023,031$ 22,962,552,386$ 1,283,318,611$ 31,030,479,514$
District Total 12,429,061$ 64,218$ 10,506,116$ 24,594,555$ 35,100,672$ 158,146,985$ 254,410,296$ 14,218,344$ 343,797,734$ Lubbock (60%) 12,429,061$ 64,218$ 10,506,116$ 24,594,555$ 35,100,672$ 158,146,985$ 254,410,296$ 14,218,344$ 343,797,734$
ANALYSIS BY BILLY HAMILTON CONSULTING
Extending Medicaid to Low-Income Adults Will Save Local Tax Dollars and Grow the Economy
Download this one-pager at www.texasimpact.org/Local-Taxpayers-Win-With-Medicaid Download the full report at www.mhm.org
Download the executive summary at www.texasimpact.org
For more information about the report, “Smart, Affordable and Fair” call Texas Impact at 512/472-3903 or email [email protected]

Impact of Medicaid Extension and Local Spending for Health CareHouse District 84 - Representative John Frullo
County
2016 Adults <138% FPL Enrollees Moderate Scenario
2016 Adults Federal Funds
Moderate Scenario
2016 Adults State Funds Moderate Scenario
2016 Adults All Funds Moderate Scenario
2016 Children <200% FPL Enrollees Moderate Scenario
2016 Children Federal Funds
Moderate Scenario
2016 Children State Funds Moderate Scenario
2016 Children All Funds Moderate Scenario
2016 Adults & Children
All Funds Moderate Scenario
Statewide Total 1,004,771 7,615,086,733$ 292,887,951$ 7,907,974,684$ 550,189 1,500,495,384$ 769,325,576$ 2,269,820,960$ 10,177,795,644$
District Total 11,132 84,370,258$ 3,245,010$ 87,615,268$ 3,456 9,424,846$ 4,832,254$ 14,257,100$ 101,872,367$ Lubbock (60%) 11,132 84,370,258$ 3,245,010$ 87,615,268$ 3,456 9,424,846$ 4,832,254$ 14,257,100$ 101,872,367$ Note: New local tax revenues are an allocation of the statewide estimate based on the county share of state personal income and further allocated in partial counties according to the share of county population. Variations in personal income or the concentration of direct health care spending in parts of counties could alter these allocations. Remaining columns reflect allocations of statewide estimates according to the county share of adults below 138% FPL or children below 200% FPL, as applicable, and further allocated for partial counties according to the share of the county's total population. Variations in percentages of adults below 138% FPL and children below 200% FPL could alter these estimates. Hospital charity cost data exclude certain hospitals, such as those exempt from reporting, hospitals that report by system, and others, resulting in a conservative estimate of unreimbursed charity costs. Medicaid extension to adults would not relieve all local unreimbursed costs due to ineligible adults, such as undocumented immigrants, people served with incomes above 138% FPL or health care for incarcerated adults other than inpatient hospital stays. 2016 is the first full year of implementation; the federal match rate falls to 95 percent in 2017 and to 90 percent by 2020. For full county-level data, see Appendix C, and for further notes and cautions in interpreting these data, see Appendix A, in "Smart, Affordable and Fair: Why Texas Should Extend Medicaid to Low-Income Adults," at http://www.mhm.org/images/stories/advocacy_and_public_policy/Smart%20Affordable%20and%20Fair_FNL_FULL.pdf.
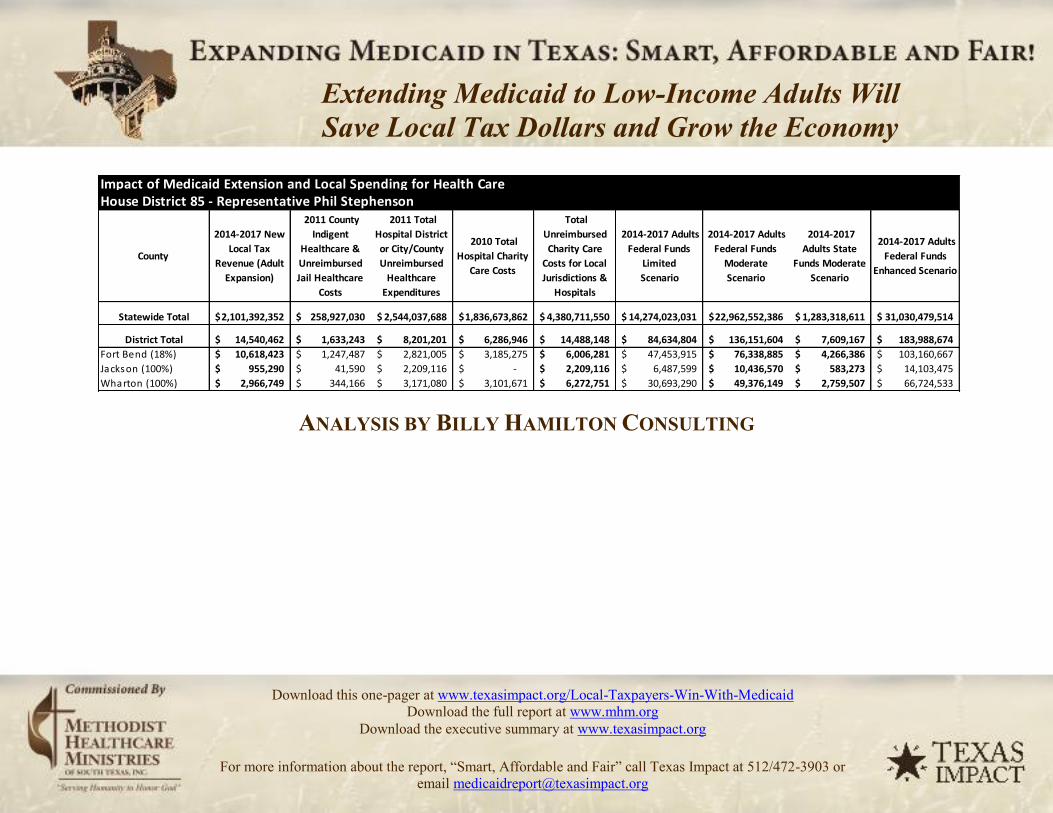
Impact of Medicaid Extension and Local Spending for Health CareHouse District 85 - Representative Phil Stephenson
County
2014-2017 New Local Tax
Revenue (Adult Expansion)
2011 County Indigent
Healthcare & Unreimbursed Jail Healthcare
Costs
2011 Total Hospital District or City/County Unreimbursed
Healthcare Expenditures
2010 Total Hospital Charity
Care Costs
Total Unreimbursed Charity Care
Costs for Local Jurisdictions &
Hospitals
2014-2017 Adults Federal Funds
Limited Scenario
2014-2017 Adults Federal Funds
Moderate Scenario
2014-2017 Adults State
Funds Moderate Scenario
2014-2017 Adults Federal Funds
Enhanced Scenario
Statewide Total 2,101,392,352$ 258,927,030$ 2,544,037,688$ 1,836,673,862$ 4,380,711,550$ 14,274,023,031$ 22,962,552,386$ 1,283,318,611$ 31,030,479,514$
District Total 14,540,462$ 1,633,243$ 8,201,201$ 6,286,946$ 14,488,148$ 84,634,804$ 136,151,604$ 7,609,167$ 183,988,674$ Fort Bend (18%) 10,618,423$ 1,247,487$ 2,821,005$ 3,185,275$ 6,006,281$ 47,453,915$ 76,338,885$ 4,266,386$ 103,160,667$ Jackson (100%) 955,290$ 41,590$ 2,209,116$ -$ 2,209,116$ 6,487,599$ 10,436,570$ 583,273$ 14,103,475$ Wharton (100%) 2,966,749$ 344,166$ 3,171,080$ 3,101,671$ 6,272,751$ 30,693,290$ 49,376,149$ 2,759,507$ 66,724,533$
ANALYSIS BY BILLY HAMILTON CONSULTING
Extending Medicaid to Low-Income Adults Will Save Local Tax Dollars and Grow the Economy
Download this one-pager at www.texasimpact.org/Local-Taxpayers-Win-With-Medicaid Download the full report at www.mhm.org
Download the executive summary at www.texasimpact.org
For more information about the report, “Smart, Affordable and Fair” call Texas Impact at 512/472-3903 or email [email protected]

Impact of Medicaid Extension and Local Spending for Health Care
House District 85 - Representative Phil Stephenson
County
2016 Adults
<138% FPL
Enrollees
Moderate
Scenario
2016 Adults
Federal Funds
Moderate
Scenario
2016 Adults
State Funds
Moderate
Scenario
2016 Adults
All Funds
Moderate
Scenario
2016 Children
<200% FPL
Enrollees
Moderate
Scenario
2016 Children
Federal Funds
Moderate
Scenario
2016 Children
State Funds
Moderate
Scenario
2016 Children
All Funds
Moderate
Scenario
2016 Adults &
Children
All Funds
Moderate
Scenario
Statewide Total 1,004,771 7,615,086,733$ 292,887,951$ 7,907,974,684$ 550,189 1,500,495,384$ 769,325,576$ 2,269,820,960$ 10,177,795,644$
District Total 5,958 45,152,048$ 1,736,617$ 46,888,665$ 3,162 8,622,189$ 4,420,721$ 13,042,910$ 59,931,576$
Fort Bend (18%) 3,340 25,316,316$ 973,704$ 26,290,020$ 1,849 5,042,057$ 2,585,135$ 7,627,193$ 33,917,213$
Jackson (100%) 457 3,461,087$ 133,119$ 3,594,205$ 243 662,380$ 339,612$ 1,001,991$ 4,596,197$
Wharton (100%) 2,161 16,374,646$ 629,794$ 17,004,440$ 1,070 2,917,752$ 1,495,974$ 4,413,726$ 21,418,166$
Note: New local tax revenues are an allocation of the statewide estimate based on the county share of state personal income and further allocated in partial counties according to the share of county population. Variations in personal income or the concentration of direct health care spending in parts of counties could alter these allocations. Remaining columns reflect allocations of statewide estimates according to the county share of adults below 138% FPL or children below 200% FPL, as applicable, and further allocated for partial counties according to the share of the county's total population. Variations in percentages of adults below 138% FPL and children below 200% FPL could alter these estimates. Hospital charity cost data exclude certain hospitals, such as those exempt from reporting, hospitals that report by system, and others, resulting in a conservative estimate of unreimbursed charity costs. Medicaid extension to adults would not relieve all local unreimbursed costs due to ineligible adults, such as undocumented immigrants, people served with incomes above 138% FPL or health care for incarcerated adults other than inpatient hospital stays. 2016 is the first full year of implementation; the federal match rate falls to 95 percent in 2017 and to 90 percent by 2020. For full county-level data, see Appendix C, and for further notes and cautions in interpreting these data, see Appendix A, in "Smart, Affordable and Fair: Why Texas Should Extend Medicaid to Low-Income Adults," at http://www.mhm.org/images/stories/advocacy_and_public_policy/Smart%20Affordable%20and%20Fair_FNL_FULL.pdf.
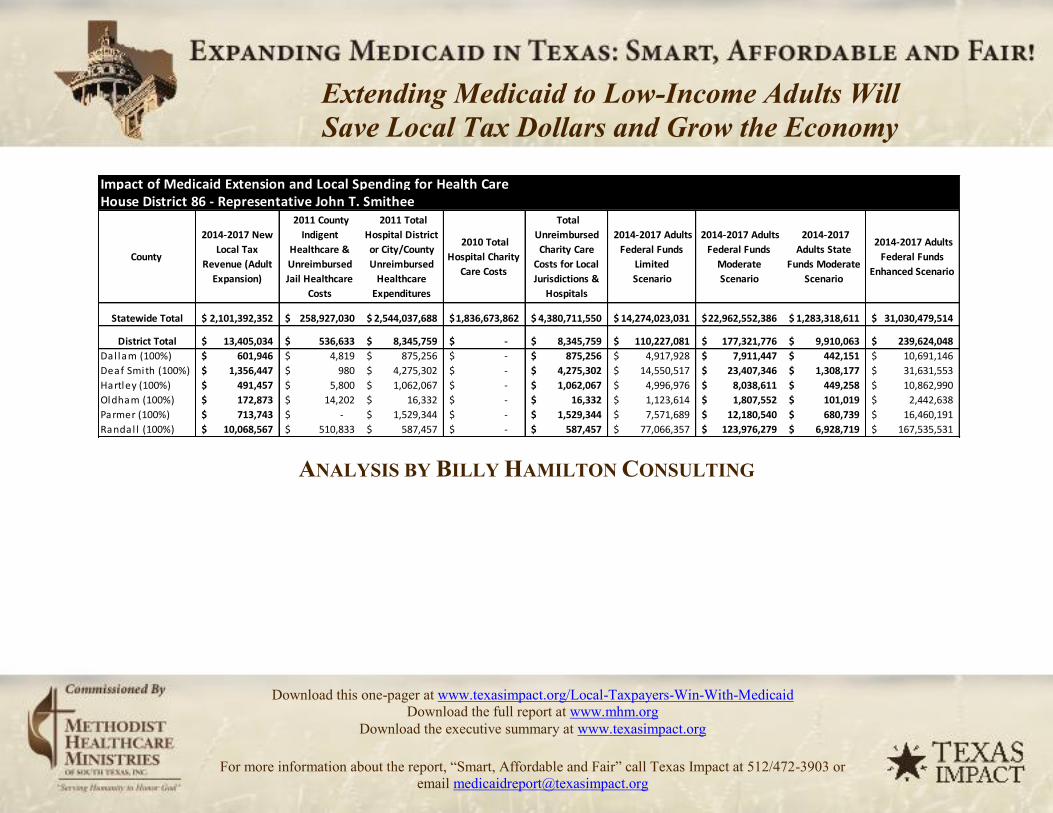
Impact of Medicaid Extension and Local Spending for Health CareHouse District 86 - Representative John T. Smithee
County
2014-2017 New Local Tax
Revenue (Adult Expansion)
2011 County Indigent
Healthcare & Unreimbursed Jail Healthcare
Costs
2011 Total Hospital District or City/County Unreimbursed
Healthcare Expenditures
2010 Total Hospital Charity
Care Costs
Total Unreimbursed Charity Care
Costs for Local Jurisdictions &
Hospitals
2014-2017 Adults Federal Funds
Limited Scenario
2014-2017 Adults Federal Funds
Moderate Scenario
2014-2017 Adults State
Funds Moderate Scenario
2014-2017 Adults Federal Funds
Enhanced Scenario
Statewide Total 2,101,392,352$ 258,927,030$ 2,544,037,688$ 1,836,673,862$ 4,380,711,550$ 14,274,023,031$ 22,962,552,386$ 1,283,318,611$ 31,030,479,514$
District Total 13,405,034$ 536,633$ 8,345,759$ -$ 8,345,759$ 110,227,081$ 177,321,776$ 9,910,063$ 239,624,048$ Dal lam (100%) 601,946$ 4,819$ 875,256$ -$ 875,256$ 4,917,928$ 7,911,447$ 442,151$ 10,691,146$ Deaf Smith (100%) 1,356,447$ 980$ 4,275,302$ -$ 4,275,302$ 14,550,517$ 23,407,346$ 1,308,177$ 31,631,553$ Hartley (100%) 491,457$ 5,800$ 1,062,067$ -$ 1,062,067$ 4,996,976$ 8,038,611$ 449,258$ 10,862,990$ Oldham (100%) 172,873$ 14,202$ 16,332$ -$ 16,332$ 1,123,614$ 1,807,552$ 101,019$ 2,442,638$ Parmer (100%) 713,743$ -$ 1,529,344$ -$ 1,529,344$ 7,571,689$ 12,180,540$ 680,739$ 16,460,191$ Randal l (100%) 10,068,567$ 510,833$ 587,457$ -$ 587,457$ 77,066,357$ 123,976,279$ 6,928,719$ 167,535,531$
ANALYSIS BY BILLY HAMILTON CONSULTING
Extending Medicaid to Low-Income Adults Will Save Local Tax Dollars and Grow the Economy
Download this one-pager at www.texasimpact.org/Local-Taxpayers-Win-With-Medicaid Download the full report at www.mhm.org
Download the executive summary at www.texasimpact.org
For more information about the report, “Smart, Affordable and Fair” call Texas Impact at 512/472-3903 or email [email protected]

Impact of Medicaid Extension and Local Spending for Health CareHouse District 86 - Representative John T. Smithee
County
2016 Adults <138% FPL Enrollees Moderate Scenario
2016 Adults Federal Funds
Moderate Scenario
2016 Adults State Funds Moderate Scenario
2016 Adults All Funds Moderate Scenario
2016 Children <200% FPL Enrollees Moderate Scenario
2016 Children Federal Funds
Moderate Scenario
2016 Children State Funds Moderate Scenario
2016 Children All Funds Moderate Scenario
2016 Adults & Children
All Funds Moderate Scenario
Statewide Total 1,004,771 7,615,086,733$ 292,887,951$ 7,907,974,684$ 550,189 1,500,495,384$ 769,325,576$ 2,269,820,960$ 10,177,795,644$
District Total 7,759 58,805,340$ 2,261,744$ 61,067,084$ 3,450 9,407,844$ 4,823,537$ 14,231,381$ 75,298,466$ Dal lam (100%) 346 2,623,678$ 100,911$ 2,724,589$ 172 467,972$ 239,936$ 707,909$ 3,432,498$ Deaf Smith (100%) 1,024 7,762,594$ 298,561$ 8,061,155$ 624 1,702,091$ 872,686$ 2,574,777$ 10,635,932$ Hartley (100%) 352 2,665,850$ 102,533$ 2,768,383$ 101 276,436$ 141,733$ 418,169$ 3,186,551$ Oldham (100%) 79 599,440$ 23,055$ 622,495$ 50 136,988$ 70,235$ 207,223$ 829,718$ Parmer (100%) 533 4,039,441$ 155,363$ 4,194,804$ 309 842,432$ 431,927$ 1,274,359$ 5,469,163$ Randal l (100%) 5,425 41,114,337$ 1,581,321$ 42,695,658$ 2,193 5,981,926$ 3,067,019$ 9,048,945$ 51,744,603$
Note: New local tax revenues are an allocation of the statewide estimate based on the county share of state personal income and further allocated in partial counties according to the share of county
population. Variations in personal income or the concentration of direct health care spending in parts of counties could alter these allocations. Remaining columns reflect allocations of statewide
estimates according to the county share of adults below 138% FPL or children below 200% FPL, as applicable, and further allocated for partial counties according to the share of the county's total
population. Variations in percentages of adults below 138% FPL and children below 200% FPL could alter these estimates. Hospital charity cost data exclude certain hospitals, such as those exempt
from reporting, hospitals that report by system, and others, resulting in a conservative estimate of unreimbursed charity costs. Medicaid extension to adults would not relieve all local unreimbursed
costs due to ineligible adults, such as undocumented immigrants, people served with incomes above 138% FPL or health care for incarcerated adults other than inpatient hospital stays. 2016 is the
first full year of implementation; the federal match rate falls to 95 percent in 2017 and to 90 percent by 2020. For full county-level data, see Appendix C, and for further notes and cautions in
interpreting these data, see Appendix A, in "Smart, Affordable and Fair: Why Texas Should Extend Medicaid to Low-Income Adults," at
http://www.mhm.org/images/stories/advocacy_and_public_policy/Smart%20Affordable%20and%20Fair_FNL_FULL.pdf.
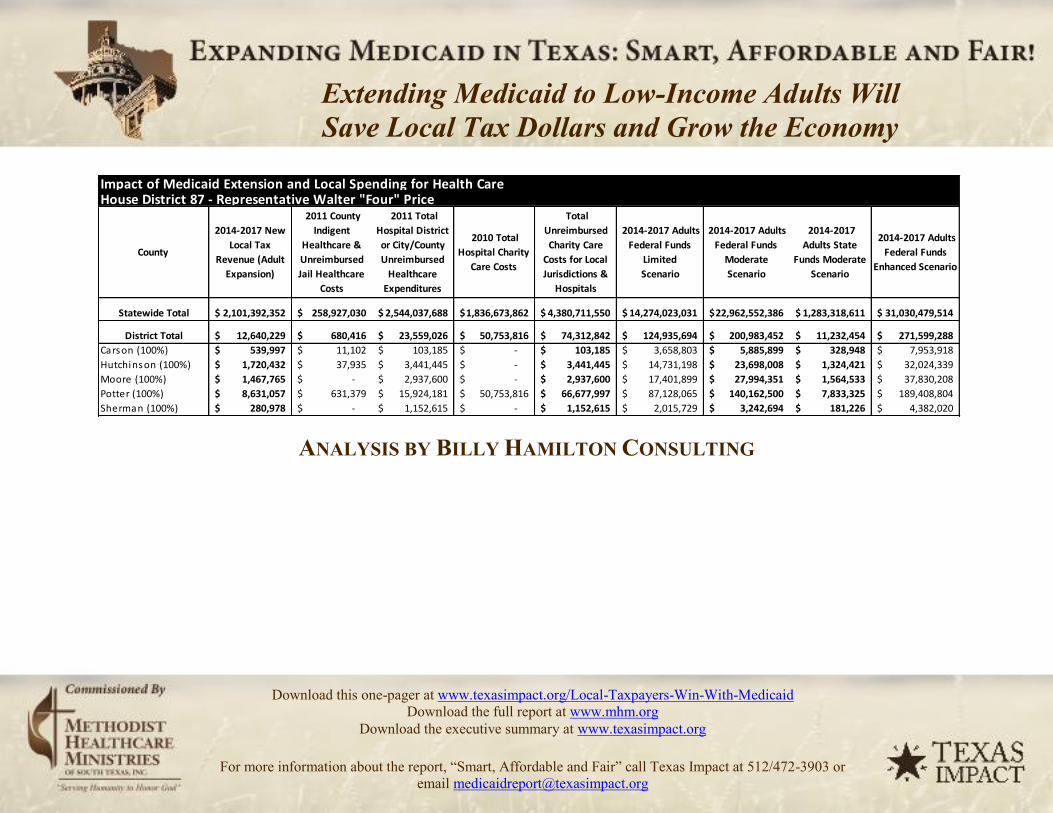
Impact of Medicaid Extension and Local Spending for Health CareHouse District 87 - Representative Walter "Four" Price
County
2014-2017 New
Local Tax
Revenue (Adult
Expansion)
2011 County
Indigent
Healthcare &
Unreimbursed
Jail Healthcare
Costs
2011 Total
Hospital District
or City/County
Unreimbursed
Healthcare
Expenditures
2010 Total
Hospital Charity
Care Costs
Total
Unreimbursed
Charity Care
Costs for Local
Jurisdictions &
Hospitals
2014-2017 Adults
Federal Funds
Limited
Scenario
2014-2017 Adults
Federal Funds
Moderate
Scenario
2014-2017
Adults State
Funds Moderate
Scenario
2014-2017 Adults
Federal Funds
Enhanced Scenario
Statewide Total 2,101,392,352$ 258,927,030$ 2,544,037,688$ 1,836,673,862$ 4,380,711,550$ 14,274,023,031$ 22,962,552,386$ 1,283,318,611$ 31,030,479,514$
District Total 12,640,229$ 680,416$ 23,559,026$ 50,753,816$ 74,312,842$ 124,935,694$ 200,983,452$ 11,232,454$ 271,599,288$
Carson (100%) 539,997$ 11,102$ 103,185$ -$ 103,185$ 3,658,803$ 5,885,899$ 328,948$ 7,953,918$ Hutchinson (100%) 1,720,432$ 37,935$ 3,441,445$ -$ 3,441,445$ 14,731,198$ 23,698,008$ 1,324,421$ 32,024,339$ Moore (100%) 1,467,765$ -$ 2,937,600$ -$ 2,937,600$ 17,401,899$ 27,994,351$ 1,564,533$ 37,830,208$ Potter (100%) 8,631,057$ 631,379$ 15,924,181$ 50,753,816$ 66,677,997$ 87,128,065$ 140,162,500$ 7,833,325$ 189,408,804$ Sherman (100%) 280,978$ -$ 1,152,615$ -$ 1,152,615$ 2,015,729$ 3,242,694$ 181,226$ 4,382,020$
ANALYSIS BY BILLY HAMILTON CONSULTING
Extending Medicaid to Low-Income Adults Will Save Local Tax Dollars and Grow the Economy
Download this one-pager at www.texasimpact.org/Local-Taxpayers-Win-With-Medicaid Download the full report at www.mhm.org
Download the executive summary at www.texasimpact.org
For more information about the report, “Smart, Affordable and Fair” call Texas Impact at 512/472-3903 or email [email protected]

Impact of Medicaid Extension and Local Spending for Health CareHouse District 87 - Representative Walter "Four" Price
County
2016 Adults <138% FPL Enrollees Moderate Scenario
2016 Adults Federal Funds
Moderate Scenario
2016 Adults State Funds Moderate Scenario
2016 Adults All Funds Moderate Scenario
2016 Children <200% FPL Enrollees Moderate Scenario
2016 Children Federal Funds
Moderate Scenario
2016 Children State Funds Moderate Scenario
2016 Children All Funds Moderate Scenario
2016 Adults & Children
All Funds Moderate Scenario
Statewide Total 1,004,771 7,615,086,733$ 292,887,951$ 7,907,974,684$ 550,189 1,500,495,384$ 769,325,576$ 2,269,820,960$ 10,177,795,644$
District Total 8,794 66,652,278$ 2,563,549$ 69,215,827$ 4,228 11,529,921$ 5,911,556$ 17,441,477$ 86,657,304$ Carson (100%) 258 1,951,944$ 75,075$ 2,027,019$ 105 286,689$ 146,990$ 433,679$ 2,460,699$ Hutchinson (100%) 1,037 7,858,986$ 302,269$ 8,161,255$ 446 1,217,302$ 624,128$ 1,841,431$ 10,002,686$ Moore (100%) 1,225 9,283,785$ 357,069$ 9,640,854$ 667 1,818,161$ 932,197$ 2,750,358$ 12,391,212$ Potter (100%) 6,133 46,482,185$ 1,787,776$ 48,269,961$ 2,930 7,989,572$ 4,096,369$ 12,085,941$ 60,355,902$ Sherman (100%) 142 1,075,377$ 41,361$ 1,116,737$ 80 218,196$ 111,872$ 330,068$ 1,446,805$
Note: New local tax revenues are an allocation of the statewide estimate based on the county share of state personal income and further allocated in partial counties according to the share of county population. Variations in personal income or the concentration of direct health care spending in parts of counties could alter these allocations. Remaining columns reflect allocations of statewide estimates according to the county share of adults below 138% FPL or children below 200% FPL, as applicable, and further allocated for partial counties according to the share of the county's total population. Variations in percentages of adults below 138% FPL and children below 200% FPL could alter these estimates. Hospital charity cost data exclude certain hospitals, such as those exempt from reporting, hospitals that report by system, and others, resulting in a conservative estimate of unreimbursed charity costs. Medicaid extension to adults would not relieve all local unreimbursed costs due to ineligible adults, such as undocumented immigrants, people served with incomes above 138% FPL or health care for incarcerated adults other than inpatient hospital stays. 2016 is the first full year of implementation; the federal match rate falls to 95 percent in 2017 and to 90 percent by 2020. For full county-level data, see Appendix C, and for further notes and cautions in interpreting these data, see Appendix A, in "Smart, Affordable and Fair: Why Texas Should Extend Medicaid to Low-Income Adults," at http://www.mhm.org/images/stories/advocacy_and_public_policy/Smart%20Affordable%20and%20Fair_FNL_FULL.pdf.
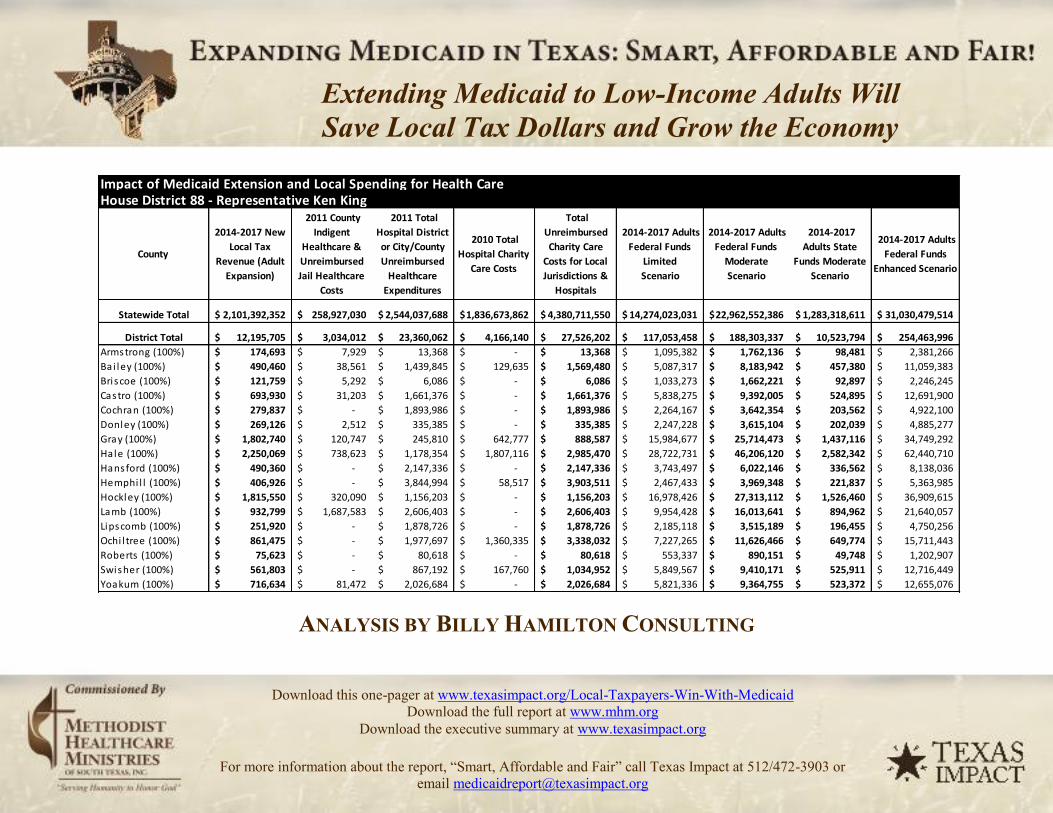
Impact of Medicaid Extension and Local Spending for Health CareHouse District 88 - Representative Ken King
County
2014-2017 New Local Tax
Revenue (Adult Expansion)
2011 County Indigent
Healthcare & Unreimbursed Jail Healthcare
Costs
2011 Total Hospital District or City/County Unreimbursed
Healthcare Expenditures
2010 Total Hospital Charity
Care Costs
Total Unreimbursed Charity Care
Costs for Local Jurisdictions &
Hospitals
2014-2017 Adults Federal Funds
Limited Scenario
2014-2017 Adults Federal Funds
Moderate Scenario
2014-2017 Adults State
Funds Moderate Scenario
2014-2017 Adults Federal Funds
Enhanced Scenario
Statewide Total 2,101,392,352$ 258,927,030$ 2,544,037,688$ 1,836,673,862$ 4,380,711,550$ 14,274,023,031$ 22,962,552,386$ 1,283,318,611$ 31,030,479,514$
District Total 12,195,705$ 3,034,012$ 23,360,062$ 4,166,140$ 27,526,202$ 117,053,458$ 188,303,337$ 10,523,794$ 254,463,996$ Armstrong (100%) 174,693$ 7,929$ 13,368$ -$ 13,368$ 1,095,382$ 1,762,136$ 98,481$ 2,381,266$ Ba i ley (100%) 490,460$ 38,561$ 1,439,845$ 129,635$ 1,569,480$ 5,087,317$ 8,183,942$ 457,380$ 11,059,383$ Briscoe (100%) 121,759$ 5,292$ 6,086$ -$ 6,086$ 1,033,273$ 1,662,221$ 92,897$ 2,246,245$ Castro (100%) 693,930$ 31,203$ 1,661,376$ -$ 1,661,376$ 5,838,275$ 9,392,005$ 524,895$ 12,691,900$ Cochran (100%) 279,837$ -$ 1,893,986$ -$ 1,893,986$ 2,264,167$ 3,642,354$ 203,562$ 4,922,100$ Donley (100%) 269,126$ 2,512$ 335,385$ -$ 335,385$ 2,247,228$ 3,615,104$ 202,039$ 4,885,277$ Gray (100%) 1,802,740$ 120,747$ 245,810$ 642,777$ 888,587$ 15,984,677$ 25,714,473$ 1,437,116$ 34,749,292$ Hale (100%) 2,250,069$ 738,623$ 1,178,354$ 1,807,116$ 2,985,470$ 28,722,731$ 46,206,120$ 2,582,342$ 62,440,710$ Hansford (100%) 490,360$ -$ 2,147,336$ -$ 2,147,336$ 3,743,497$ 6,022,146$ 336,562$ 8,138,036$ Hemphi l l (100%) 406,926$ -$ 3,844,994$ 58,517$ 3,903,511$ 2,467,433$ 3,969,348$ 221,837$ 5,363,985$ Hockley (100%) 1,815,550$ 320,090$ 1,156,203$ -$ 1,156,203$ 16,978,426$ 27,313,112$ 1,526,460$ 36,909,615$ Lamb (100%) 932,799$ 1,687,583$ 2,606,403$ -$ 2,606,403$ 9,954,428$ 16,013,641$ 894,962$ 21,640,057$ Lipscomb (100%) 251,920$ -$ 1,878,726$ -$ 1,878,726$ 2,185,118$ 3,515,189$ 196,455$ 4,750,256$ Ochi l tree (100%) 861,475$ -$ 1,977,697$ 1,360,335$ 3,338,032$ 7,227,265$ 11,626,466$ 649,774$ 15,711,443$ Roberts (100%) 75,623$ -$ 80,618$ -$ 80,618$ 553,337$ 890,151$ 49,748$ 1,202,907$ Swisher (100%) 561,803$ -$ 867,192$ 167,760$ 1,034,952$ 5,849,567$ 9,410,171$ 525,911$ 12,716,449$ Yoakum (100%) 716,634$ 81,472$ 2,026,684$ -$ 2,026,684$ 5,821,336$ 9,364,755$ 523,372$ 12,655,076$
ANALYSIS BY BILLY HAMILTON CONSULTING
Extending Medicaid to Low-Income Adults Will Save Local Tax Dollars and Grow the Economy
Download this one-pager at www.texasimpact.org/Local-Taxpayers-Win-With-Medicaid Download the full report at www.mhm.org
Download the executive summary at www.texasimpact.org
For more information about the report, “Smart, Affordable and Fair” call Texas Impact at 512/472-3903 or email [email protected]
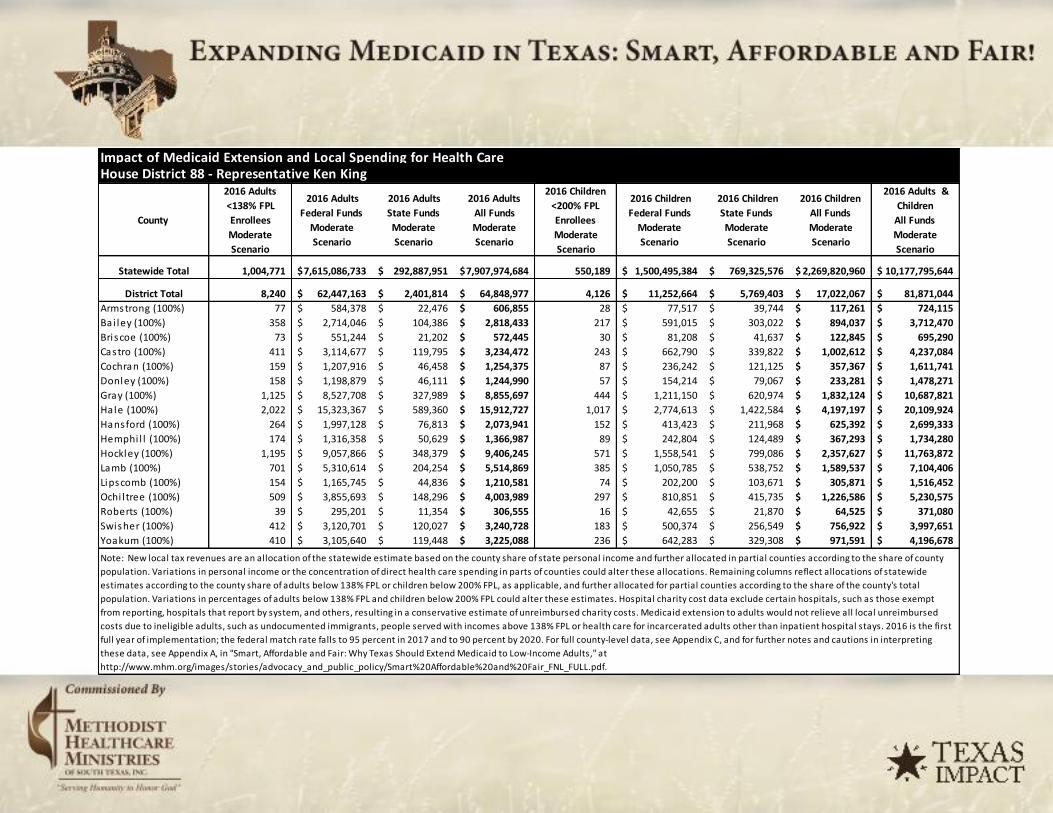
Impact of Medicaid Extension and Local Spending for Health CareHouse District 88 - Representative Ken King
County
2016 Adults
<138% FPL
Enrollees
Moderate
Scenario
2016 Adults
Federal Funds
Moderate
Scenario
2016 Adults
State Funds
Moderate
Scenario
2016 Adults
All Funds
Moderate
Scenario
2016 Children
<200% FPL
Enrollees
Moderate
Scenario
2016 Children
Federal Funds
Moderate
Scenario
2016 Children
State Funds
Moderate
Scenario
2016 Children
All Funds
Moderate
Scenario
2016 Adults &
Children
All Funds
Moderate
Scenario
Statewide Total 1,004,771 7,615,086,733$ 292,887,951$ 7,907,974,684$ 550,189 1,500,495,384$ 769,325,576$ 2,269,820,960$ 10,177,795,644$
District Total 8,240 62,447,163$ 2,401,814$ 64,848,977$ 4,126 11,252,664$ 5,769,403$ 17,022,067$ 81,871,044$
Armstrong (100%) 77 584,378$ 22,476$ 606,855$ 28 77,517$ 39,744$ 117,261$ 724,115$
Bai ley (100%) 358 2,714,046$ 104,386$ 2,818,433$ 217 591,015$ 303,022$ 894,037$ 3,712,470$
Briscoe (100%) 73 551,244$ 21,202$ 572,445$ 30 81,208$ 41,637$ 122,845$ 695,290$
Castro (100%) 411 3,114,677$ 119,795$ 3,234,472$ 243 662,790$ 339,822$ 1,002,612$ 4,237,084$
Cochran (100%) 159 1,207,916$ 46,458$ 1,254,375$ 87 236,242$ 121,125$ 357,367$ 1,611,741$
Donley (100%) 158 1,198,879$ 46,111$ 1,244,990$ 57 154,214$ 79,067$ 233,281$ 1,478,271$
Gray (100%) 1,125 8,527,708$ 327,989$ 8,855,697$ 444 1,211,150$ 620,974$ 1,832,124$ 10,687,821$
Hale (100%) 2,022 15,323,367$ 589,360$ 15,912,727$ 1,017 2,774,613$ 1,422,584$ 4,197,197$ 20,109,924$
Hansford (100%) 264 1,997,128$ 76,813$ 2,073,941$ 152 413,423$ 211,968$ 625,392$ 2,699,333$
Hemphi l l (100%) 174 1,316,358$ 50,629$ 1,366,987$ 89 242,804$ 124,489$ 367,293$ 1,734,280$
Hockley (100%) 1,195 9,057,866$ 348,379$ 9,406,245$ 571 1,558,541$ 799,086$ 2,357,627$ 11,763,872$
Lamb (100%) 701 5,310,614$ 204,254$ 5,514,869$ 385 1,050,785$ 538,752$ 1,589,537$ 7,104,406$
Lipscomb (100%) 154 1,165,745$ 44,836$ 1,210,581$ 74 202,200$ 103,671$ 305,871$ 1,516,452$
Ochi l tree (100%) 509 3,855,693$ 148,296$ 4,003,989$ 297 810,851$ 415,735$ 1,226,586$ 5,230,575$
Roberts (100%) 39 295,201$ 11,354$ 306,555$ 16 42,655$ 21,870$ 64,525$ 371,080$
Swisher (100%) 412 3,120,701$ 120,027$ 3,240,728$ 183 500,374$ 256,549$ 756,922$ 3,997,651$
Yoakum (100%) 410 3,105,640$ 119,448$ 3,225,088$ 236 642,283$ 329,308$ 971,591$ 4,196,678$
Note: New local tax revenues are an allocation of the statewide estimate based on the county share of state personal income and further allocated in partial counties according to the share of county population. Variations in personal income or the concentration of direct health care spending in parts of counties could alter these allocations. Remaining columns reflect allocations of statewide estimates according to the county share of adults below 138% FPL or children below 200% FPL, as applicable, and further allocated for partial counties according to the share of the county's total population. Variations in percentages of adults below 138% FPL and children below 200% FPL could alter these estimates. Hospital charity cost data exclude certain hospitals, such as those exempt from reporting, hospitals that report by system, and others, resulting in a conservative estimate of unreimbursed charity costs. Medicaid extension to adults would not relieve all local unreimbursed costs due to ineligible adults, such as undocumented immigrants, people served with incomes above 138% FPL or health care for incarcerated adults other than inpatient hospital stays. 2016 is the first full year of implementation; the federal match rate falls to 95 percent in 2017 and to 90 percent by 2020. For full county-level data, see Appendix C, and for further notes and cautions in interpreting these data, see Appendix A, in "Smart, Affordable and Fair: Why Texas Should Extend Medicaid to Low-Income Adults," at http://www.mhm.org/images/stories/advocacy_and_public_policy/Smart%20Affordable%20and%20Fair_FNL_FULL.pdf.

Impact of Medicaid Extension and Local Spending for Health CareHouse District 89 - Representative Jodie Laubenberg
County
2014-2017 New Local Tax
Revenue (Adult Expansion)
2011 County Indigent
Healthcare & Unreimbursed Jail Healthcare
Costs
2011 Total Hospital District or City/County Unreimbursed
Healthcare Expenditures
2010 Total Hospital Charity
Care Costs
Total Unreimbursed Charity Care
Costs for Local Jurisdictions &
Hospitals
2014-2017 Adults Federal Funds
Limited Scenario
2014-2017 Adults Federal Funds
Moderate Scenario
2014-2017 Adults State
Funds Moderate Scenario
2014-2017 Adults Federal Funds
Enhanced Scenario
Statewide Total 2,101,392,352$ 258,927,030$ 2,544,037,688$ 1,836,673,862$ 4,380,711,550$ 14,274,023,031$ 22,962,552,386$ 1,283,318,611$ 31,030,479,514$
District Total 18,745,472$ 1,504,180$ 1,988,202$ -$ 1,988,202$ 54,383,958$ 87,487,213$ 4,889,438$ 118,225,976$ Col l in (22%) 18,745,472$ 1,504,180$ 1,988,202$ -$ 1,988,202$ 54,383,958$ 87,487,213$ 4,889,438$ 118,225,976$
ANALYSIS BY BILLY HAMILTON CONSULTING
Extending Medicaid to Low-Income Adults Will Save Local Tax Dollars and Grow the Economy
Download this one-pager at www.texasimpact.org/Local-Taxpayers-Win-With-Medicaid Download the full report at www.mhm.org
Download the executive summary at www.texasimpact.org
For more information about the report, “Smart, Affordable and Fair” call Texas Impact at 512/472-3903 or email [email protected]

Impact of Medicaid Extension and Local Spending for Health CareHouse District 89 - Representative Jodie Laubenberg
County
2016 Adults <138% FPL Enrollees Moderate Scenario
2016 Adults Federal Funds
Moderate Scenario
2016 Adults State Funds Moderate Scenario
2016 Adults All Funds Moderate Scenario
2016 Children <200% FPL Enrollees Moderate Scenario
2016 Children Federal Funds
Moderate Scenario
2016 Children State Funds Moderate Scenario
2016 Children All Funds Moderate Scenario
2016 Adults & Children
All Funds Moderate Scenario
Statewide Total 1,004,771 7,615,086,733$ 292,887,951$ 7,907,974,684$ 550,189 1,500,495,384$ 769,325,576$ 2,269,820,960$ 10,177,795,644$
District Total 3,828 29,013,443$ 1,115,902$ 30,129,345$ 2,097 5,719,714$ 2,932,580$ 8,652,294$ 38,781,639$ Col l in (22%) 3,828 29,013,443$ 1,115,902$ 30,129,345$ 2,097 5,719,714$ 2,932,580$ 8,652,294$ 38,781,639$
Note: New local tax revenues are an allocation of the statewide estimate based on the county share of state personal income and further allocated in partial counties according to the share of county
population. Variations in personal income or the concentration of direct health care spending in parts of counties could alter these allocations. Remaining columns reflect allocations of statewide
estimates according to the county share of adults below 138% FPL or children below 200% FPL, as applicable, and further allocated for partial counties according to the share of the county's total
population. Variations in percentages of adults below 138% FPL and children below 200% FPL could alter these estimates. Hospital charity cost data exclude certain hospitals, such as those exempt
from reporting, hospitals that report by system, and others, resulting in a conservative estimate of unreimbursed charity costs. Medicaid extension to adults would not relieve all local unreimbursed
costs due to ineligible adults, such as undocumented immigrants, people served with incomes above 138% FPL or health care for incarcerated adults other than inpatient hospital stays. 2016 is the first
full year of implementation; the federal match rate falls to 95 percent in 2017 and to 90 percent by 2020. For full county-level data, see Appendix C, and for further notes and cautions in interpreting
these data, see Appendix A, in "Smart, Affordable and Fair: Why Texas Should Extend Medicaid to Low-Income Adults," at
http://www.mhm.org/images/stories/advocacy_and_public_policy/Smart%20Affordable%20and%20Fair_FNL_FULL.pdf.

Impact of Medicaid Extension and Local Spending for Health CareHouse District 90 - Representative Lon Burnam
County
2014-2017 New Local Tax
Revenue (Adult Expansion)
2011 County Indigent
Healthcare & Unreimbursed Jail Healthcare
Costs
2011 Total Hospital District or City/County Unreimbursed
Healthcare Expenditures
2010 Total Hospital Charity
Care Costs
Total Unreimbursed Charity Care
Costs for Local Jurisdictions &
Hospitals
2014-2017 Adults Federal Funds
Limited Scenario
2014-2017 Adults Federal Funds
Moderate Scenario
2014-2017 Adults State
Funds Moderate Scenario
2014-2017 Adults Federal Funds
Enhanced Scenario
Statewide Total 2,101,392,352$ 258,927,030$ 2,544,037,688$ 1,836,673,862$ 4,380,711,550$ 14,274,023,031$ 22,962,552,386$ 1,283,318,611$ 31,030,479,514$
District Total 13,722,724$ -$ 23,696,125$ 13,236,976$ 36,933,101$ 70,977,411$ 114,181,020$ 6,381,287$ 154,298,692$ Tarrant (9%) 13,722,724$ -$ 23,696,125$ 13,236,976$ 36,933,101$ 70,977,411$ 114,181,020$ 6,381,287$ 154,298,692$
ANALYSIS BY BILLY HAMILTON CONSULTING
Extending Medicaid to Low-Income Adults Will Save Local Tax Dollars and Grow the Economy
Download this one-pager at www.texasimpact.org/Local-Taxpayers-Win-With-Medicaid Download the full report at www.mhm.org
Download the executive summary at www.texasimpact.org
For more information about the report, “Smart, Affordable and Fair” call Texas Impact at 512/472-3903 or email [email protected]

Impact of Medicaid Extension and Local Spending for Health CareHouse District 90 - Representative Lon Burnam
County
2016 Adults <138% FPL Enrollees Moderate Scenario
2016 Adults Federal Funds
Moderate Scenario
2016 Adults State Funds Moderate Scenario
2016 Adults All Funds Moderate Scenario
2016 Children <200% FPL Enrollees Moderate Scenario
2016 Children Federal Funds
Moderate Scenario
2016 Children State Funds Moderate Scenario
2016 Children All Funds Moderate Scenario
2016 Adults & Children
All Funds Moderate Scenario
Statewide Total 1,004,771 7,615,086,733$ 292,887,951$ 7,907,974,684$ 550,189 1,500,495,384$ 769,325,576$ 2,269,820,960$ 10,177,795,644$
District Total 4,996 37,865,929$ 1,456,382$ 39,322,311$ 3,296 8,987,614$ 4,608,079$ 13,595,693$ 52,918,003$ Tarrant (9%) 4,996 37,865,929$ 1,456,382$ 39,322,311$ 3,296 8,987,614$ 4,608,079$ 13,595,693$ 52,918,003$ Note: New local tax revenues are an allocation of the statewide estimate based on the county share of state personal income and further allocated in partial counties according to the share of county population. Variations in personal income or the concentration of direct health care spending in parts of counties could alter these allocations. Remaining columns reflect allocations of statewide estimates according to the county share of adults below 138% FPL or children below 200% FPL, as applicable, and further allocated for partial counties according to the share of the county's total population. Variations in percentages of adults below 138% FPL and children below 200% FPL could alter these estimates. Hospital charity cost data exclude certain hospitals, such as those exempt from reporting, hospitals that report by system, and others, resulting in a conservative estimate of unreimbursed charity costs. Medicaid extension to adults would not relieve all local unreimbursed costs due to ineligible adults, such as undocumented immigrants, people served with incomes above 138% FPL or health care for incarcerated adults other than inpatient hospital stays. 2016 is the first full year of implementation; the federal match rate falls to 95 percent in 2017 and to 90 percent by 2020. For full county-level data, see Appendix C, and for further notes and cautions in interpreting these data, see Appendix A, in "Smart, Affordable and Fair: Why Texas Should Extend Medicaid to Low-Income Adults," at http://www.mhm.org/images/stories/advocacy_and_public_policy/Smart%20Affordable%20and%20Fair_FNL_FULL.pdf.

Impact of Medicaid Extension and Local Spending for Health CareHouse District 91 - Representative Stephanie Klick
County
2014-2017 New Local Tax
Revenue (Adult Expansion)
2011 County Indigent
Healthcare & Unreimbursed Jail Healthcare
Costs
2011 Total Hospital District or City/County Unreimbursed
Healthcare Expenditures
2010 Total Hospital Charity
Care Costs
Total Unreimbursed Charity Care
Costs for Local Jurisdictions &
Hospitals
2014-2017 Adults Federal Funds
Limited Scenario
2014-2017 Adults Federal Funds
Moderate Scenario
2014-2017 Adults State
Funds Moderate Scenario
2014-2017 Adults Federal Funds
Enhanced Scenario
Statewide Total 2,101,392,352$ 258,927,030$ 2,544,037,688$ 1,836,673,862$ 4,380,711,550$ 14,274,023,031$ 22,962,552,386$ 1,283,318,611$ 31,030,479,514$
District Total 14,016,239$ -$ 24,202,961$ 13,520,101$ 37,723,061$ 72,495,544$ 116,623,234$ 6,517,776$ 157,598,982$ Tarrant (9%) 14,016,239$ -$ 24,202,961$ 13,520,101$ 37,723,061$ 72,495,544$ 116,623,234$ 6,517,776$ 157,598,982$
ANALYSIS BY BILLY HAMILTON CONSULTING
Extending Medicaid to Low-Income Adults Will Save Local Tax Dollars and Grow the Economy
Download this one-pager at www.texasimpact.org/Local-Taxpayers-Win-With-Medicaid Download the full report at www.mhm.org
Download the executive summary at www.texasimpact.org
For more information about the report, “Smart, Affordable and Fair” call Texas Impact at 512/472-3903 or email [email protected]

Impact of Medicaid Extension and Local Spending for Health CareHouse District 91 - Representative Stephanie Klick
County
2016 Adults <138% FPL Enrollees Moderate Scenario
2016 Adults Federal Funds
Moderate Scenario
2016 Adults State Funds Moderate Scenario
2016 Adults All Funds Moderate Scenario
2016 Children <200% FPL Enrollees Moderate Scenario
2016 Children Federal Funds
Moderate Scenario
2016 Children State Funds Moderate Scenario
2016 Children All Funds Moderate Scenario
2016 Adults & Children
All Funds Moderate Scenario
Statewide Total 1,004,771 7,615,086,733$ 292,887,951$ 7,907,974,684$ 550,189 1,500,495,384$ 769,325,576$ 2,269,820,960$ 10,177,795,644$
District Total 5,103 38,675,842$ 1,487,532$ 40,163,374$ 3,366 9,179,849$ 4,706,641$ 13,886,490$ 54,049,865$ Tarrant (9%) 5,103 38,675,842$ 1,487,532$ 40,163,374$ 3,366 9,179,849$ 4,706,641$ 13,886,490$ 54,049,865$ Note: New local tax revenues are an allocation of the statewide estimate based on the county share of state personal income and further allocated in partial counties according to the share of county population. Variations in personal income or the concentration of direct health care spending in parts of counties could alter these allocations. Remaining columns reflect allocations of statewide estimates according to the county share of adults below 138% FPL or children below 200% FPL, as applicable, and further allocated for partial counties according to the share of the county's total population. Variations in percentages of adults below 138% FPL and children below 200% FPL could alter these estimates. Hospital charity cost data exclude certain hospitals, such as those exempt from reporting, hospitals that report by system, and others, resulting in a conservative estimate of unreimbursed charity costs. Medicaid extension to adults would not relieve all local unreimbursed costs due to ineligible adults, such as undocumented immigrants, people served with incomes above 138% FPL or health care for incarcerated adults other than inpatient hospital stays. 2016 is the first full year of implementation; the federal match rate falls to 95 percent in 2017 and to 90 percent by 2020. For full county-level data, see Appendix C, and for further notes and cautions in interpreting these data, see Appendix A, in "Smart, Affordable and Fair: Why Texas Should Extend Medicaid to Low-Income Adults," at http://www.mhm.org/images/stories/advocacy_and_public_policy/Smart%20Affordable%20and%20Fair_FNL_FULL.pdf.

Impact of Medicaid Extension and Local Spending for Health CareHouse District 92 - Representative Jonathan Stickland
County
2014-2017 New Local Tax
Revenue (Adult Expansion)
2011 County Indigent
Healthcare & Unreimbursed Jail Healthcare
Costs
2011 Total Hospital District or City/County Unreimbursed
Healthcare Expenditures
2010 Total Hospital Charity
Care Costs
Total Unreimbursed Charity Care
Costs for Local Jurisdictions &
Hospitals
2014-2017 Adults Federal Funds
Limited Scenario
2014-2017 Adults Federal Funds
Moderate Scenario
2014-2017 Adults State
Funds Moderate Scenario
2014-2017 Adults Federal Funds
Enhanced Scenario
Statewide Total 2,101,392,352$ 258,927,030$ 2,544,037,688$ 1,836,673,862$ 4,380,711,550$ 14,274,023,031$ 22,962,552,386$ 1,283,318,611$ 31,030,479,514$
District Total 13,972,169$ -$ 24,126,861$ 13,477,591$ 37,604,452$ 72,267,602$ 116,256,544$ 6,497,282$ 157,103,455$ Tarrant (9%) 13,972,169$ -$ 24,126,861$ 13,477,591$ 37,604,452$ 72,267,602$ 116,256,544$ 6,497,282$ 157,103,455$
ANALYSIS BY BILLY HAMILTON CONSULTING
Extending Medicaid to Low-Income Adults Will Save Local Tax Dollars and Grow the Economy
Download this one-pager at www.texasimpact.org/Local-Taxpayers-Win-With-Medicaid Download the full report at www.mhm.org
Download the executive summary at www.texasimpact.org
For more information about the report, “Smart, Affordable and Fair” call Texas Impact at 512/472-3903 or email [email protected]

Impact of Medicaid Extension and Local Spending for Health CareHouse District 92 - Representative Jonathan Stickland
County
2016 Adults <138% FPL Enrollees Moderate Scenario
2016 Adults Federal Funds
Moderate Scenario
2016 Adults State Funds Moderate Scenario
2016 Adults All Funds Moderate Scenario
2016 Children <200% FPL Enrollees Moderate Scenario
2016 Children Federal Funds
Moderate Scenario
2016 Children State Funds Moderate Scenario
2016 Children All Funds Moderate Scenario
2016 Adults & Children
All Funds Moderate Scenario
Statewide Total 1,004,771 7,615,086,733$ 292,887,951$ 7,907,974,684$ 550,189 1,500,495,384$ 769,325,576$ 2,269,820,960$ 10,177,795,644$
District Total 5,087 38,554,236$ 1,482,855$ 40,037,091$ 3,355 9,150,986$ 4,691,842$ 13,842,828$ 53,879,919$ Tarrant (9%) 5,087 38,554,236$ 1,482,855$ 40,037,091$ 3,355 9,150,986$ 4,691,842$ 13,842,828$ 53,879,919$ Note: New local tax revenues are an allocation of the statewide estimate based on the county share of state personal income and further allocated in partial counties according to the share of county population. Variations in personal income or the concentration of direct health care spending in parts of counties could alter these allocations. Remaining columns reflect allocations of statewide estimates according to the county share of adults below 138% FPL or children below 200% FPL, as applicable, and further allocated for partial counties according to the share of the county's total population. Variations in percentages of adults below 138% FPL and children below 200% FPL could alter these estimates. Hospital charity cost data exclude certain hospitals, such as those exempt from reporting, hospitals that report by system, and others, resulting in a conservative estimate of unreimbursed charity costs. Medicaid extension to adults would not relieve all local unreimbursed costs due to ineligible adults, such as undocumented immigrants, people served with incomes above 138% FPL or health care for incarcerated adults other than inpatient hospital stays. 2016 is the first full year of implementation; the federal match rate falls to 95 percent in 2017 and to 90 percent by 2020. For full county-level data, see Appendix C, and for further notes and cautions in interpreting these data, see Appendix A, in "Smart, Affordable and Fair: Why Texas Should Extend Medicaid to Low-Income Adults," at http://www.mhm.org/images/stories/advocacy_and_public_policy/Smart%20Affordable%20and%20Fair_FNL_FULL.pdf.

Impact of Medicaid Extension and Local Spending for Health CareHouse District 93 - Representative Matt Krause
County
2014-2017 New Local Tax
Revenue (Adult Expansion)
2011 County Indigent
Healthcare & Unreimbursed Jail Healthcare
Costs
2011 Total Hospital District or City/County Unreimbursed
Healthcare Expenditures
2010 Total Hospital Charity
Care Costs
Total Unreimbursed Charity Care
Costs for Local Jurisdictions &
Hospitals
2014-2017 Adults Federal Funds
Limited Scenario
2014-2017 Adults Federal Funds
Moderate Scenario
2014-2017 Adults State
Funds Moderate Scenario
2014-2017 Adults Federal Funds
Enhanced Scenario
Statewide Total 2,101,392,352$ 258,927,030$ 2,544,037,688$ 1,836,673,862$ 4,380,711,550$ 14,274,023,031$ 22,962,552,386$ 1,283,318,611$ 31,030,479,514$
District Total 13,957,967$ -$ 24,102,337$ 13,463,891$ 37,566,228$ 72,194,143$ 116,138,372$ 6,490,678$ 156,943,763$ Tarrant (9%) 13,957,967$ -$ 24,102,337$ 13,463,891$ 37,566,228$ 72,194,143$ 116,138,372$ 6,490,678$ 156,943,763$
ANALYSIS BY BILLY HAMILTON CONSULTING
Extending Medicaid to Low-Income Adults Will Save Local Tax Dollars and Grow the Economy
Download this one-pager at www.texasimpact.org/Local-Taxpayers-Win-With-Medicaid Download the full report at www.mhm.org
Download the executive summary at www.texasimpact.org
For more information about the report, “Smart, Affordable and Fair” call Texas Impact at 512/472-3903 or email [email protected]
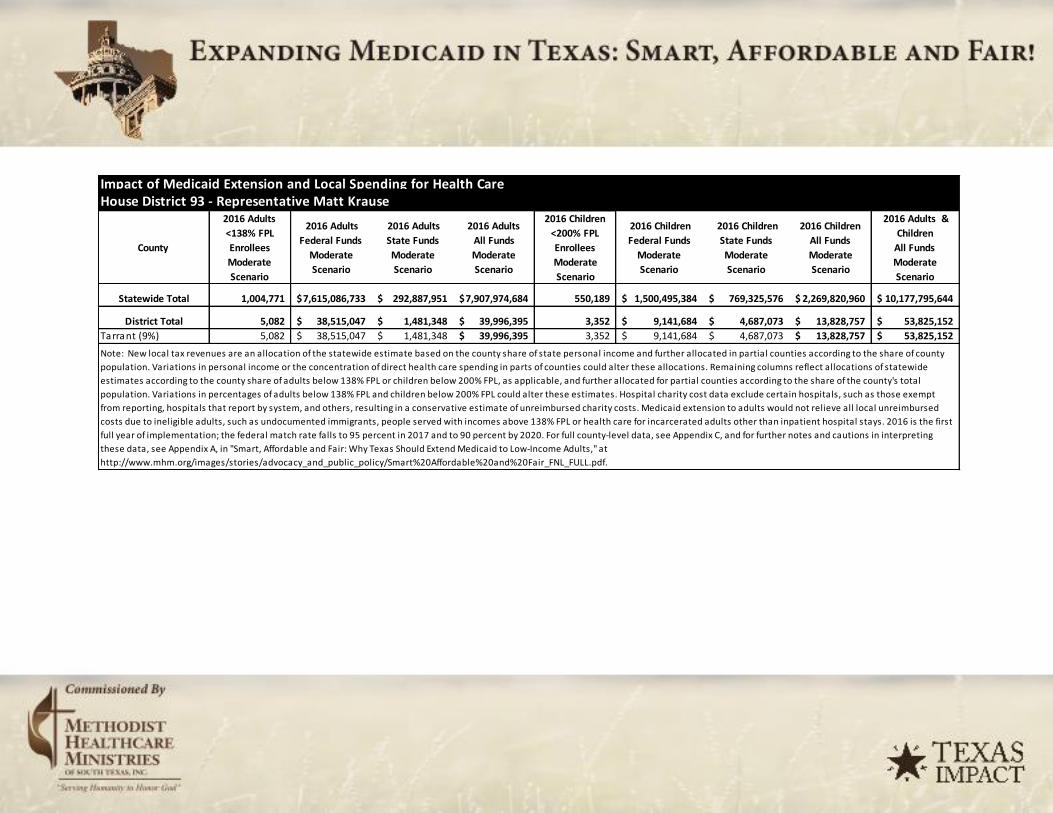
Impact of Medicaid Extension and Local Spending for Health CareHouse District 93 - Representative Matt Krause
County
2016 Adults <138% FPL Enrollees Moderate Scenario
2016 Adults Federal Funds
Moderate Scenario
2016 Adults State Funds Moderate Scenario
2016 Adults All Funds Moderate Scenario
2016 Children <200% FPL Enrollees Moderate Scenario
2016 Children Federal Funds
Moderate Scenario
2016 Children State Funds Moderate Scenario
2016 Children All Funds Moderate Scenario
2016 Adults & Children
All Funds Moderate Scenario
Statewide Total 1,004,771 7,615,086,733$ 292,887,951$ 7,907,974,684$ 550,189 1,500,495,384$ 769,325,576$ 2,269,820,960$ 10,177,795,644$
District Total 5,082 38,515,047$ 1,481,348$ 39,996,395$ 3,352 9,141,684$ 4,687,073$ 13,828,757$ 53,825,152$ Tarrant (9%) 5,082 38,515,047$ 1,481,348$ 39,996,395$ 3,352 9,141,684$ 4,687,073$ 13,828,757$ 53,825,152$ Note: New local tax revenues are an allocation of the statewide estimate based on the county share of state personal income and further allocated in partial counties according to the share of county population. Variations in personal income or the concentration of direct health care spending in parts of counties could alter these allocations. Remaining columns reflect allocations of statewide estimates according to the county share of adults below 138% FPL or children below 200% FPL, as applicable, and further allocated for partial counties according to the share of the county's total population. Variations in percentages of adults below 138% FPL and children below 200% FPL could alter these estimates. Hospital charity cost data exclude certain hospitals, such as those exempt from reporting, hospitals that report by system, and others, resulting in a conservative estimate of unreimbursed charity costs. Medicaid extension to adults would not relieve all local unreimbursed costs due to ineligible adults, such as undocumented immigrants, people served with incomes above 138% FPL or health care for incarcerated adults other than inpatient hospital stays. 2016 is the first full year of implementation; the federal match rate falls to 95 percent in 2017 and to 90 percent by 2020. For full county-level data, see Appendix C, and for further notes and cautions in interpreting these data, see Appendix A, in "Smart, Affordable and Fair: Why Texas Should Extend Medicaid to Low-Income Adults," at http://www.mhm.org/images/stories/advocacy_and_public_policy/Smart%20Affordable%20and%20Fair_FNL_FULL.pdf.

Impact of Medicaid Extension and Local Spending for Health CareHouse District 94 - Representative Diane Patrick
County
2014-2017 New Local Tax
Revenue (Adult Expansion)
2011 County Indigent
Healthcare & Unreimbursed Jail Healthcare
Costs
2011 Total Hospital District or City/County Unreimbursed
Healthcare Expenditures
2010 Total Hospital Charity
Care Costs
Total Unreimbursed Charity Care
Costs for Local Jurisdictions &
Hospitals
2014-2017 Adults Federal Funds
Limited Scenario
2014-2017 Adults Federal Funds
Moderate Scenario
2014-2017 Adults State
Funds Moderate Scenario
2014-2017 Adults Federal Funds
Enhanced Scenario
Statewide Total 2,101,392,352$ 258,927,030$ 2,544,037,688$ 1,836,673,862$ 4,380,711,550$ 14,274,023,031$ 22,962,552,386$ 1,283,318,611$ 31,030,479,514$
District Total 14,406,674$ -$ 24,877,156$ 13,896,716$ 38,773,872$ 74,514,973$ 119,871,880$ 6,699,334$ 161,989,044$ Tarrant (9%) 14,406,674$ -$ 24,877,156$ 13,896,716$ 38,773,872$ 74,514,973$ 119,871,880$ 6,699,334$ 161,989,044$
ANALYSIS BY BILLY HAMILTON CONSULTING
Extending Medicaid to Low-Income Adults Will Save Local Tax Dollars and Grow the Economy
Download this one-pager at www.texasimpact.org/Local-Taxpayers-Win-With-Medicaid Download the full report at www.mhm.org
Download the executive summary at www.texasimpact.org
For more information about the report, “Smart, Affordable and Fair” call Texas Impact at 512/472-3903 or email [email protected]

Impact of Medicaid Extension and Local Spending for Health CareHouse District 94 - Representative Diane Patrick
County
2016 Adults <138% FPL Enrollees Moderate Scenario
2016 Adults Federal Funds
Moderate Scenario
2016 Adults State Funds Moderate Scenario
2016 Adults All Funds Moderate Scenario
2016 Children <200% FPL Enrollees Moderate Scenario
2016 Children Federal Funds
Moderate Scenario
2016 Children State Funds Moderate Scenario
2016 Children All Funds Moderate Scenario
2016 Adults & Children
All Funds Moderate Scenario
Statewide Total 1,004,771 7,615,086,733$ 292,887,951$ 7,907,974,684$ 550,189 1,500,495,384$ 769,325,576$ 2,269,820,960$ 10,177,795,644$
District Total 5,245 39,753,192$ 1,528,969$ 41,282,161$ 3,460 9,435,562$ 4,837,749$ 14,273,311$ 55,555,472$ Tarrant (9%) 5,245 39,753,192$ 1,528,969$ 41,282,161$ 3,460 9,435,562$ 4,837,749$ 14,273,311$ 55,555,472$ Note: New local tax revenues are an allocation of the statewide estimate based on the county share of state personal income and further allocated in partial counties according to the share of county population. Variations in personal income or the concentration of direct health care spending in parts of counties could alter these allocations. Remaining columns reflect allocations of statewide estimates according to the county share of adults below 138% FPL or children below 200% FPL, as applicable, and further allocated for partial counties according to the share of the county's total population. Variations in percentages of adults below 138% FPL and children below 200% FPL could alter these estimates. Hospital charity cost data exclude certain hospitals, such as those exempt from reporting, hospitals that report by system, and others, resulting in a conservative estimate of unreimbursed charity costs. Medicaid extension to adults would not relieve all local unreimbursed costs due to ineligible adults, such as undocumented immigrants, people served with incomes above 138% FPL or health care for incarcerated adults other than inpatient hospital stays. 2016 is the first full year of implementation; the federal match rate falls to 95 percent in 2017 and to 90 percent by 2020. For full county-level data, see Appendix C, and for further notes and cautions in interpreting these data, see Appendix A, in "Smart, Affordable and Fair: Why Texas Should Extend Medicaid to Low-Income Adults," at http://www.mhm.org/images/stories/advocacy_and_public_policy/Smart%20Affordable%20and%20Fair_FNL_FULL.pdf.

Impact of Medicaid Extension and Local Spending for Health CareHouse District 95 - Representative Nicole Collier
County
2014-2017 New Local Tax
Revenue (Adult Expansion)
2011 County Indigent
Healthcare & Unreimbursed Jail Healthcare
Costs
2011 Total Hospital District or City/County Unreimbursed
Healthcare Expenditures
2010 Total Hospital Charity
Care Costs
Total Unreimbursed Charity Care
Costs for Local Jurisdictions &
Hospitals
2014-2017 Adults Federal Funds
Limited Scenario
2014-2017 Adults Federal Funds
Moderate Scenario
2014-2017 Adults State
Funds Moderate Scenario
2014-2017 Adults Federal Funds
Enhanced Scenario
Statewide Total 2,101,392,352$ 258,927,030$ 2,544,037,688$ 1,836,673,862$ 4,380,711,550$ 14,274,023,031$ 22,962,552,386$ 1,283,318,611$ 31,030,479,514$
District Total 13,912,605$ -$ 24,024,007$ 13,420,135$ 37,444,143$ 71,959,523$ 115,760,939$ 6,469,584$ 156,433,718$ Tarrant (9%) 13,912,605$ -$ 24,024,007$ 13,420,135$ 37,444,143$ 71,959,523$ 115,760,939$ 6,469,584$ 156,433,718$
ANALYSIS BY BILLY HAMILTON CONSULTING
Extending Medicaid to Low-Income Adults Will Save Local Tax Dollars and Grow the Economy
Download this one-pager at www.texasimpact.org/Local-Taxpayers-Win-With-Medicaid Download the full report at www.mhm.org
Download the executive summary at www.texasimpact.org
For more information about the report, “Smart, Affordable and Fair” call Texas Impact at 512/472-3903 or email [email protected]

Impact of Medicaid Extension and Local Spending for Health CareHouse District 95 - Representative Nicole Collier
County
2016 Adults <138% FPL Enrollees Moderate Scenario
2016 Adults Federal Funds
Moderate Scenario
2016 Adults State Funds Moderate Scenario
2016 Adults All Funds Moderate Scenario
2016 Children <200% FPL Enrollees Moderate Scenario
2016 Children Federal Funds
Moderate Scenario
2016 Children State Funds Moderate Scenario
2016 Children All Funds Moderate Scenario
2016 Adults & Children
All Funds Moderate Scenario
Statewide Total 1,004,771 7,615,086,733$ 292,887,951$ 7,907,974,684$ 550,189 1,500,495,384$ 769,325,576$ 2,269,820,960$ 10,177,795,644$
District Total 5,065 38,389,878$ 1,476,534$ 39,866,412$ 3,341 9,111,975$ 4,671,841$ 13,783,816$ 53,650,228$ Tarrant (9%) 5,065 38,389,878$ 1,476,534$ 39,866,412$ 3,341 9,111,975$ 4,671,841$ 13,783,816$ 53,650,228$ Note: New local tax revenues are an allocation of the statewide estimate based on the county share of state personal income and further allocated in partial counties according to the share of county population. Variations in personal income or the concentration of direct health care spending in parts of counties could alter these allocations. Remaining columns reflect allocations of statewide estimates according to the county share of adults below 138% FPL or children below 200% FPL, as applicable, and further allocated for partial counties according to the share of the county's total population. Variations in percentages of adults below 138% FPL and children below 200% FPL could alter these estimates. Hospital charity cost data exclude certain hospitals, such as those exempt from reporting, hospitals that report by system, and others, resulting in a conservative estimate of unreimbursed charity costs. Medicaid extension to adults would not relieve all local unreimbursed costs due to ineligible adults, such as undocumented immigrants, people served with incomes above 138% FPL or health care for incarcerated adults other than inpatient hospital stays. 2016 is the first full year of implementation; the federal match rate falls to 95 percent in 2017 and to 90 percent by 2020. For full county-level data, see Appendix C, and for further notes and cautions in interpreting these data, see Appendix A, in "Smart, Affordable and Fair: Why Texas Should Extend Medicaid to Low-Income Adults," at http://www.mhm.org/images/stories/advocacy_and_public_policy/Smart%20Affordable%20and%20Fair_FNL_FULL.pdf.

Impact of Medicaid Extension and Local Spending for Health CareHouse District 96 - Representative Bill Zedler
County
2014-2017 New Local Tax
Revenue (Adult Expansion)
2011 County Indigent
Healthcare & Unreimbursed Jail Healthcare
Costs
2011 Total Hospital District or City/County Unreimbursed
Healthcare Expenditures
2010 Total Hospital Charity
Care Costs
Total Unreimbursed Charity Care
Costs for Local Jurisdictions &
Hospitals
2014-2017 Adults Federal Funds
Limited Scenario
2014-2017 Adults Federal Funds
Moderate Scenario
2014-2017 Adults State
Funds Moderate Scenario
2014-2017 Adults Federal Funds
Enhanced Scenario
Statewide Total 2,101,392,352$ 258,927,030$ 2,544,037,688$ 1,836,673,862$ 4,380,711,550$ 14,274,023,031$ 22,962,552,386$ 1,283,318,611$ 31,030,479,514$
District Total 14,196,308$ -$ 24,513,899$ 13,693,795$ 38,207,694$ 73,426,903$ 118,121,507$ 6,601,510$ 159,623,676$ Tarrant (9%) 14,196,308$ -$ 24,513,899$ 13,693,795$ 38,207,694$ 73,426,903$ 118,121,507$ 6,601,510$ 159,623,676$
ANALYSIS BY BILLY HAMILTON CONSULTING
Extending Medicaid to Low-Income Adults Will Save Local Tax Dollars and Grow the Economy
Download this one-pager at www.texasimpact.org/Local-Taxpayers-Win-With-Medicaid Download the full report at www.mhm.org
Download the executive summary at www.texasimpact.org
For more information about the report, “Smart, Affordable and Fair” call Texas Impact at 512/472-3903 or email [email protected]

Impact of Medicaid Extension and Local Spending for Health CareHouse District 96 - Representative Bill Zedler
County
2016 Adults <138% FPL Enrollees Moderate Scenario
2016 Adults Federal Funds
Moderate Scenario
2016 Adults State Funds Moderate Scenario
2016 Adults All Funds Moderate Scenario
2016 Children <200% FPL Enrollees Moderate Scenario
2016 Children Federal Funds
Moderate Scenario
2016 Children State Funds Moderate Scenario
2016 Children All Funds Moderate Scenario
2016 Adults & Children
All Funds Moderate Scenario
Statewide Total 1,004,771 7,615,086,733$ 292,887,951$ 7,907,974,684$ 550,189 1,500,495,384$ 769,325,576$ 2,269,820,960$ 10,177,795,644$
District Total 5,169 39,172,715$ 1,506,643$ 40,679,358$ 3,409 9,297,784$ 4,767,108$ 14,064,892$ 54,744,250$ Tarrant (9%) 5,169 39,172,715$ 1,506,643$ 40,679,358$ 3,409 9,297,784$ 4,767,108$ 14,064,892$ 54,744,250$ Note: New local tax revenues are an allocation of the statewide estimate based on the county share of state personal income and further allocated in partial counties according to the share of county population. Variations in personal income or the concentration of direct health care spending in parts of counties could alter these allocations. Remaining columns reflect allocations of statewide estimates according to the county share of adults below 138% FPL or children below 200% FPL, as applicable, and further allocated for partial counties according to the share of the county's total population. Variations in percentages of adults below 138% FPL and children below 200% FPL could alter these estimates. Hospital charity cost data exclude certain hospitals, such as those exempt from reporting, hospitals that report by system, and others, resulting in a conservative estimate of unreimbursed charity costs. Medicaid extension to adults would not relieve all local unreimbursed costs due to ineligible adults, such as undocumented immigrants, people served with incomes above 138% FPL or health care for incarcerated adults other than inpatient hospital stays. 2016 is the first full year of implementation; the federal match rate falls to 95 percent in 2017 and to 90 percent by 2020. For full county-level data, see Appendix C, and for further notes and cautions in interpreting these data, see Appendix A, in "Smart, Affordable and Fair: Why Texas Should Extend Medicaid to Low-Income Adults," at http://www.mhm.org/images/stories/advocacy_and_public_policy/Smart%20Affordable%20and%20Fair_FNL_FULL.pdf.

Impact of Medicaid Extension and Local Spending for Health CareHouse District 97 - Representative Craig Goldman
County
2014-2017 New Local Tax
Revenue (Adult Expansion)
2011 County Indigent
Healthcare & Unreimbursed Jail Healthcare
Costs
2011 Total Hospital District or City/County Unreimbursed
Healthcare Expenditures
2010 Total Hospital Charity
Care Costs
Total Unreimbursed Charity Care
Costs for Local Jurisdictions &
Hospitals
2014-2017 Adults Federal Funds
Limited Scenario
2014-2017 Adults Federal Funds
Moderate Scenario
2014-2017 Adults State
Funds Moderate Scenario
2014-2017 Adults Federal Funds
Enhanced Scenario
Statewide Total 2,101,392,352$ 258,927,030$ 2,544,037,688$ 1,836,673,862$ 4,380,711,550$ 14,274,023,031$ 22,962,552,386$ 1,283,318,611$ 31,030,479,514$
District Total 14,538,110$ -$ 25,104,117$ 14,023,499$ 39,127,616$ 75,194,794$ 120,965,505$ 6,760,454$ 163,466,916$ Tarrant (9%) 14,538,110$ -$ 25,104,117$ 14,023,499$ 39,127,616$ 75,194,794$ 120,965,505$ 6,760,454$ 163,466,916$
ANALYSIS BY BILLY HAMILTON CONSULTING
Extending Medicaid to Low-Income Adults Will Save Local Tax Dollars and Grow the Economy
Download this one-pager at www.texasimpact.org/Local-Taxpayers-Win-With-Medicaid Download the full report at www.mhm.org
Download the executive summary at www.texasimpact.org
For more information about the report, “Smart, Affordable and Fair” call Texas Impact at 512/472-3903 or email [email protected]

Impact of Medicaid Extension and Local Spending for Health CareHouse District 97 - Representative Craig Goldman
County
2016 Adults <138% FPL Enrollees Moderate Scenario
2016 Adults Federal Funds
Moderate Scenario
2016 Adults State Funds Moderate Scenario
2016 Adults All Funds Moderate Scenario
2016 Children <200% FPL Enrollees Moderate Scenario
2016 Children Federal Funds
Moderate Scenario
2016 Children State Funds Moderate Scenario
2016 Children All Funds Moderate Scenario
2016 Adults & Children
All Funds Moderate Scenario
Statewide Total 1,004,771 7,615,086,733$ 292,887,951$ 7,907,974,684$ 550,189 1,500,495,384$ 769,325,576$ 2,269,820,960$ 10,177,795,644$
District Total 5,293 40,115,872$ 1,542,918$ 41,658,790$ 3,491 9,521,646$ 4,881,885$ 14,403,531$ 56,062,321$ Tarrant (9%) 5,293 40,115,872$ 1,542,918$ 41,658,790$ 3,491 9,521,646$ 4,881,885$ 14,403,531$ 56,062,321$ Note: New local tax revenues are an allocation of the statewide estimate based on the county share of state personal income and further allocated in partial counties according to the share of county population. Variations in personal income or the concentration of direct health care spending in parts of counties could alter these allocations. Remaining columns reflect allocations of statewide estimates according to the county share of adults below 138% FPL or children below 200% FPL, as applicable, and further allocated for partial counties according to the share of the county's total population. Variations in percentages of adults below 138% FPL and children below 200% FPL could alter these estimates. Hospital charity cost data exclude certain hospitals, such as those exempt from reporting, hospitals that report by system, and others, resulting in a conservative estimate of unreimbursed charity costs. Medicaid extension to adults would not relieve all local unreimbursed costs due to ineligible adults, such as undocumented immigrants, people served with incomes above 138% FPL or health care for incarcerated adults other than inpatient hospital stays. 2016 is the first full year of implementation; the federal match rate falls to 95 percent in 2017 and to 90 percent by 2020. For full county-level data, see Appendix C, and for further notes and cautions in interpreting these data, see Appendix A, in "Smart, Affordable and Fair: Why Texas Should Extend Medicaid to Low-Income Adults," at http://www.mhm.org/images/stories/advocacy_and_public_policy/Smart%20Affordable%20and%20Fair_FNL_FULL.pdf.

Impact of Medicaid Extension and Local Spending for Health CareHouse District 98 - Representative Giovanni Capriglione
County
2014-2017 New Local Tax
Revenue (Adult Expansion)
2011 County Indigent
Healthcare & Unreimbursed Jail Healthcare
Costs
2011 Total Hospital District or City/County Unreimbursed
Healthcare Expenditures
2010 Total Hospital Charity
Care Costs
Total Unreimbursed Charity Care
Costs for Local Jurisdictions &
Hospitals
2014-2017 Adults Federal Funds
Limited Scenario
2014-2017 Adults Federal Funds
Moderate Scenario
2014-2017 Adults State
Funds Moderate Scenario
2014-2017 Adults Federal Funds
Enhanced Scenario
Statewide Total 2,101,392,352$ 258,927,030$ 2,544,037,688$ 1,836,673,862$ 4,380,711,550$ 14,274,023,031$ 22,962,552,386$ 1,283,318,611$ 31,030,479,514$
District Total 14,123,230$ -$ 24,387,710$ 13,623,305$ 38,011,015$ 73,048,928$ 117,513,460$ 6,567,528$ 158,801,991$ Tarrant (9%) 14,123,230$ -$ 24,387,710$ 13,623,305$ 38,011,015$ 73,048,928$ 117,513,460$ 6,567,528$ 158,801,991$
ANALYSIS BY BILLY HAMILTON CONSULTING
Extending Medicaid to Low-Income Adults Will Save Local Tax Dollars and Grow the Economy
Download this one-pager at www.texasimpact.org/Local-Taxpayers-Win-With-Medicaid Download the full report at www.mhm.org
Download the executive summary at www.texasimpact.org
For more information about the report, “Smart, Affordable and Fair” call Texas Impact at 512/472-3903 or email [email protected]

Impact of Medicaid Extension and Local Spending for Health CareHouse District 98 - Representative Giovanni Capriglione
County
2016 Adults <138% FPL Enrollees Moderate Scenario
2016 Adults Federal Funds
Moderate Scenario
2016 Adults State Funds Moderate Scenario
2016 Adults All Funds Moderate Scenario
2016 Children <200% FPL Enrollees Moderate Scenario
2016 Children Federal Funds
Moderate Scenario
2016 Children State Funds Moderate Scenario
2016 Children All Funds Moderate Scenario
2016 Adults & Children
All Funds Moderate Scenario
Statewide Total 1,004,771 7,615,086,733$ 292,887,951$ 7,907,974,684$ 550,189 1,500,495,384$ 769,325,576$ 2,269,820,960$ 10,177,795,644$
District Total 5,142 38,971,068$ 1,498,887$ 40,469,955$ 3,392 9,249,922$ 4,742,568$ 13,992,491$ 54,462,446$ Tarrant (9%) 5,142 38,971,068$ 1,498,887$ 40,469,955$ 3,392 9,249,922$ 4,742,568$ 13,992,491$ 54,462,446$ Note: New local tax revenues are an allocation of the statewide estimate based on the county share of state personal income and further allocated in partial counties according to the share of county population. Variations in personal income or the concentration of direct health care spending in parts of counties could alter these allocations. Remaining columns reflect allocations of statewide estimates according to the county share of adults below 138% FPL or children below 200% FPL, as applicable, and further allocated for partial counties according to the share of the county's total population. Variations in percentages of adults below 138% FPL and children below 200% FPL could alter these estimates. Hospital charity cost data exclude certain hospitals, such as those exempt from reporting, hospitals that report by system, and others, resulting in a conservative estimate of unreimbursed charity costs. Medicaid extension to adults would not relieve all local unreimbursed costs due to ineligible adults, such as undocumented immigrants, people served with incomes above 138% FPL or health care for incarcerated adults other than inpatient hospital stays. 2016 is the first full year of implementation; the federal match rate falls to 95 percent in 2017 and to 90 percent by 2020. For full county-level data, see Appendix C, and for further notes and cautions in interpreting these data, see Appendix A, in "Smart, Affordable and Fair: Why Texas Should Extend Medicaid to Low-Income Adults," at http://www.mhm.org/images/stories/advocacy_and_public_policy/Smart%20Affordable%20and%20Fair_FNL_FULL.pdf.

Impact of Medicaid Extension and Local Spending for Health CareHouse District 99 - Representative Charlie Geren
County
2014-2017 New Local Tax
Revenue (Adult Expansion)
2011 County Indigent
Healthcare & Unreimbursed Jail Healthcare
Costs
2011 Total Hospital District or City/County Unreimbursed
Healthcare Expenditures
2010 Total Hospital Charity
Care Costs
Total Unreimbursed Charity Care
Costs for Local Jurisdictions &
Hospitals
2014-2017 Adults Federal Funds
Limited Scenario
2014-2017 Adults Federal Funds
Moderate Scenario
2014-2017 Adults State
Funds Moderate Scenario
2014-2017 Adults Federal Funds
Enhanced Scenario
Statewide Total 2,101,392,352$ 258,927,030$ 2,544,037,688$ 1,836,673,862$ 4,380,711,550$ 14,274,023,031$ 22,962,552,386$ 1,283,318,611$ 31,030,479,514$
District Total 14,692,701$ -$ 25,371,061$ 14,172,617$ 39,543,678$ 75,994,374$ 122,251,785$ 6,832,341$ 165,205,133$ Tarrant (9%) 14,692,701$ -$ 25,371,061$ 14,172,617$ 39,543,678$ 75,994,374$ 122,251,785$ 6,832,341$ 165,205,133$
ANALYSIS BY BILLY HAMILTON CONSULTING
Extending Medicaid to Low-Income Adults Will Save Local Tax Dollars and Grow the Economy
Download this one-pager at www.texasimpact.org/Local-Taxpayers-Win-With-Medicaid Download the full report at www.mhm.org
Download the executive summary at www.texasimpact.org
For more information about the report, “Smart, Affordable and Fair” call Texas Impact at 512/472-3903 or email [email protected]

Impact of Medicaid Extension and Local Spending for Health CareHouse District 99 - Representative Charlie Geren
County
2016 Adults <138% FPL Enrollees Moderate Scenario
2016 Adults Federal Funds
Moderate Scenario
2016 Adults State Funds Moderate Scenario
2016 Adults All Funds Moderate Scenario
2016 Children <200% FPL Enrollees Moderate Scenario
2016 Children Federal Funds
Moderate Scenario
2016 Children State Funds Moderate Scenario
2016 Children All Funds Moderate Scenario
2016 Adults & Children
All Funds Moderate Scenario
Statewide Total 1,004,771 7,615,086,733$ 292,887,951$ 7,907,974,684$ 550,189 1,500,495,384$ 769,325,576$ 2,269,820,960$ 10,177,795,644$
District Total 5,349 40,542,442$ 1,559,325$ 42,101,767$ 3,528 9,622,894$ 4,933,796$ 14,556,690$ 56,658,456$ Tarrant (9%) 5,349 40,542,442$ 1,559,325$ 42,101,767$ 3,528 9,622,894$ 4,933,796$ 14,556,690$ 56,658,456$ Note: New local tax revenues are an allocation of the statewide estimate based on the county share of state personal income and further allocated in partial counties according to the share of county population. Variations in personal income or the concentration of direct health care spending in parts of counties could alter these allocations. Remaining columns reflect allocations of statewide estimates according to the county share of adults below 138% FPL or children below 200% FPL, as applicable, and further allocated for partial counties according to the share of the county's total population. Variations in percentages of adults below 138% FPL and children below 200% FPL could alter these estimates. Hospital charity cost data exclude certain hospitals, such as those exempt from reporting, hospitals that report by system, and others, resulting in a conservative estimate of unreimbursed charity costs. Medicaid extension to adults would not relieve all local unreimbursed costs due to ineligible adults, such as undocumented immigrants, people served with incomes above 138% FPL or health care for incarcerated adults other than inpatient hospital stays. 2016 is the first full year of implementation; the federal match rate falls to 95 percent in 2017 and to 90 percent by 2020. For full county-level data, see Appendix C, and for further notes and cautions in interpreting these data, see Appendix A, in "Smart, Affordable and Fair: Why Texas Should Extend Medicaid to Low-Income Adults," at http://www.mhm.org/images/stories/advocacy_and_public_policy/Smart%20Affordable%20and%20Fair_FNL_FULL.pdf.

Impact of Medicaid Extension and Local Spending for Health CareHouse District 100 - Representative Eric Johnson
County
2014-2017 New Local Tax
Revenue (Adult Expansion)
2011 County Indigent
Healthcare & Unreimbursed Jail Healthcare
Costs
2011 Total Hospital District or City/County Unreimbursed
Healthcare Expenditures
2010 Total Hospital Charity
Care Costs
Total Unreimbursed Charity Care
Costs for Local Jurisdictions &
Hospitals
2014-2017 Adults Federal Funds
Limited Scenario
2014-2017 Adults Federal Funds
Moderate Scenario
2014-2017 Adults State
Funds Moderate Scenario
2014-2017 Adults Federal Funds
Enhanced Scenario
Statewide Total 2,101,392,352$ 258,927,030$ 2,544,037,688$ 1,836,673,862$ 4,380,711,550$ 14,274,023,031$ 22,962,552,386$ 1,283,318,611$ 31,030,479,514$
District Total 15,487,996$ 706,778$ 30,619,767$ 16,395,610$ 47,015,377$ 78,026,445$ 125,520,769$ 7,015,036$ 169,622,678$ Dal las (7%) 15,487,996$ 706,778$ 30,619,767$ 16,395,610$ 47,015,377$ 78,026,445$ 125,520,769$ 7,015,036$ 169,622,678$
ANALYSIS BY BILLY HAMILTON CONSULTING
Extending Medicaid to Low-Income Adults Will Save Local Tax Dollars and Grow the Economy
Download this one-pager at www.texasimpact.org/Local-Taxpayers-Win-With-Medicaid Download the full report at www.mhm.org
Download the executive summary at www.texasimpact.org
For more information about the report, “Smart, Affordable and Fair” call Texas Impact at 512/472-3903 or email [email protected]

Impact of Medicaid Extension and Local Spending for Health CareHouse District 100 - Representative Eric Johnson
County
2016 Adults <138% FPL Enrollees Moderate Scenario
2016 Adults Federal Funds
Moderate Scenario
2016 Adults State Funds Moderate Scenario
2016 Adults All Funds Moderate Scenario
2016 Children <200% FPL Enrollees Moderate Scenario
2016 Children Federal Funds
Moderate Scenario
2016 Children State Funds Moderate Scenario
2016 Children All Funds Moderate Scenario
2016 Adults & Children
All Funds Moderate Scenario
Statewide Total 1,004,771 7,615,086,733$ 292,887,951$ 7,907,974,684$ 550,189 1,500,495,384$ 769,325,576$ 2,269,820,960$ 10,177,795,644$
District Total 5,492 41,626,537$ 1,601,021$ 43,227,558$ 3,897 10,626,693$ 5,448,458$ 16,075,151$ 59,302,709$ Dal las (7%) 5,492 41,626,537$ 1,601,021$ 43,227,558$ 3,897 10,626,693$ 5,448,458$ 16,075,151$ 59,302,709$ Note: New local tax revenues are an allocation of the statewide estimate based on the county share of state personal income and further allocated in partial counties according to the share of county population. Variations in personal income or the concentration of direct health care spending in parts of counties could alter these allocations. Remaining columns reflect allocations of statewide estimates according to the county share of adults below 138% FPL or children below 200% FPL, as applicable, and further allocated for partial counties according to the share of the county's total population. Variations in percentages of adults below 138% FPL and children below 200% FPL could alter these estimates. Hospital charity cost data exclude certain hospitals, such as those exempt from reporting, hospitals that report by system, and others, resulting in a conservative estimate of unreimbursed charity costs. Medicaid extension to adults would not relieve all local unreimbursed costs due to ineligible adults, such as undocumented immigrants, people served with incomes above 138% FPL or health care for incarcerated adults other than inpatient hospital stays. 2016 is the first full year of implementation; the federal match rate falls to 95 percent in 2017 and to 90 percent by 2020. For full county-level data, see Appendix C, and for further notes and cautions in interpreting these data, see Appendix A, in "Smart, Affordable and Fair: Why Texas Should Extend Medicaid to Low-Income Adults," at http://www.mhm.org/images/stories/advocacy_and_public_policy/Smart%20Affordable%20and%20Fair_FNL_FULL.pdf.

Impact of Medicaid Extension and Local Spending for Health CareHouse District 101 - Representative Chris Turner
County
2014-2017 New Local Tax
Revenue (Adult Expansion)
2011 County Indigent
Healthcare & Unreimbursed Jail Healthcare
Costs
2011 Total Hospital District or City/County Unreimbursed
Healthcare Expenditures
2010 Total Hospital Charity
Care Costs
Total Unreimbursed Charity Care
Costs for Local Jurisdictions &
Hospitals
2014-2017 Adults Federal Funds
Limited Scenario
2014-2017 Adults Federal Funds
Moderate Scenario
2014-2017 Adults State
Funds Moderate Scenario
2014-2017 Adults Federal Funds
Enhanced Scenario
Statewide Total 2,101,392,352$ 258,927,030$ 2,544,037,688$ 1,836,673,862$ 4,380,711,550$ 14,274,023,031$ 22,962,552,386$ 1,283,318,611$ 31,030,479,514$
District Total 14,173,412$ -$ 24,474,363$ 13,671,710$ 38,146,073$ 73,308,480$ 117,931,000$ 6,590,863$ 159,366,234$ Tarrant (9%) 14,173,412$ -$ 24,474,363$ 13,671,710$ 38,146,073$ 73,308,480$ 117,931,000$ 6,590,863$ 159,366,234$
ANALYSIS BY BILLY HAMILTON CONSULTING
Extending Medicaid to Low-Income Adults Will Save Local Tax Dollars and Grow the Economy
Download this one-pager at www.texasimpact.org/Local-Taxpayers-Win-With-Medicaid Download the full report at www.mhm.org
Download the executive summary at www.texasimpact.org
For more information about the report, “Smart, Affordable and Fair” call Texas Impact at 512/472-3903 or email [email protected]

Impact of Medicaid Extension and Local Spending for Health CareHouse District 101 - Representative Chris Turner
County
2016 Adults <138% FPL Enrollees Moderate Scenario
2016 Adults Federal Funds
Moderate Scenario
2016 Adults State Funds Moderate Scenario
2016 Adults All Funds Moderate Scenario
2016 Children <200% FPL Enrollees Moderate Scenario
2016 Children Federal Funds
Moderate Scenario
2016 Children State Funds Moderate Scenario
2016 Children All Funds Moderate Scenario
2016 Adults & Children
All Funds Moderate Scenario
Statewide Total 1,004,771 7,615,086,733$ 292,887,951$ 7,907,974,684$ 550,189 1,500,495,384$ 769,325,576$ 2,269,820,960$ 10,177,795,644$
District Total 5,160 39,109,537$ 1,504,213$ 40,613,750$ 3,404 9,282,789$ 4,759,419$ 14,042,208$ 54,655,958$ Tarrant (9%) 5,160 39,109,537$ 1,504,213$ 40,613,750$ 3,404 9,282,789$ 4,759,419$ 14,042,208$ 54,655,958$ Note: New local tax revenues are an allocation of the statewide estimate based on the county share of state personal income and further allocated in partial counties according to the share of county population. Variations in personal income or the concentration of direct health care spending in parts of counties could alter these allocations. Remaining columns reflect allocations of statewide estimates according to the county share of adults below 138% FPL or children below 200% FPL, as applicable, and further allocated for partial counties according to the share of the county's total population. Variations in percentages of adults below 138% FPL and children below 200% FPL could alter these estimates. Hospital charity cost data exclude certain hospitals, such as those exempt from reporting, hospitals that report by system, and others, resulting in a conservative estimate of unreimbursed charity costs. Medicaid extension to adults would not relieve all local unreimbursed costs due to ineligible adults, such as undocumented immigrants, people served with incomes above 138% FPL or health care for incarcerated adults other than inpatient hospital stays. 2016 is the first full year of implementation; the federal match rate falls to 95 percent in 2017 and to 90 percent by 2020. For full county-level data, see Appendix C, and for further notes and cautions in interpreting these data, see Appendix A, in "Smart, Affordable and Fair: Why Texas Should Extend Medicaid to Low-Income Adults," at http://www.mhm.org/images/stories/advocacy_and_public_policy/Smart%20Affordable%20and%20Fair_FNL_FULL.pdf.

Impact of Medicaid Extension and Local Spending for Health CareHouse District 102 - Representative Stefani Carter
County
2014-2017 New Local Tax
Revenue (Adult Expansion)
2011 County Indigent
Healthcare & Unreimbursed Jail Healthcare
Costs
2011 Total Hospital District or City/County Unreimbursed
Healthcare Expenditures
2010 Total Hospital Charity
Care Costs
Total Unreimbursed Charity Care
Costs for Local Jurisdictions &
Hospitals
2014-2017 Adults Federal Funds
Limited Scenario
2014-2017 Adults Federal Funds
Moderate Scenario
2014-2017 Adults State
Funds Moderate Scenario
2014-2017 Adults Federal Funds
Enhanced Scenario
Statewide Total 2,101,392,352$ 258,927,030$ 2,544,037,688$ 1,836,673,862$ 4,380,711,550$ 14,274,023,031$ 22,962,552,386$ 1,283,318,611$ 31,030,479,514$
District Total 15,487,323$ 706,748$ 30,618,437$ 16,394,898$ 47,013,334$ 78,023,056$ 125,515,316$ 7,014,732$ 169,615,310$ Dal las (7%) 15,487,323$ 706,748$ 30,618,437$ 16,394,898$ 47,013,334$ 78,023,056$ 125,515,316$ 7,014,732$ 169,615,310$
ANALYSIS BY BILLY HAMILTON CONSULTING
Extending Medicaid to Low-Income Adults Will Save Local Tax Dollars and Grow the Economy
Download this one-pager at www.texasimpact.org/Local-Taxpayers-Win-With-Medicaid Download the full report at www.mhm.org
Download the executive summary at www.texasimpact.org
For more information about the report, “Smart, Affordable and Fair” call Texas Impact at 512/472-3903 or email [email protected]

Impact of Medicaid Extension and Local Spending for Health CareHouse District 102 - Representative Stefani Carter
County
2016 Adults <138% FPL Enrollees Moderate Scenario
2016 Adults Federal Funds
Moderate Scenario
2016 Adults State Funds Moderate Scenario
2016 Adults All Funds Moderate Scenario
2016 Children <200% FPL Enrollees Moderate Scenario
2016 Children Federal Funds
Moderate Scenario
2016 Children State Funds Moderate Scenario
2016 Children All Funds Moderate Scenario
2016 Adults & Children
All Funds Moderate Scenario
Statewide Total 1,004,771 7,615,086,733$ 292,887,951$ 7,907,974,684$ 550,189 1,500,495,384$ 769,325,576$ 2,269,820,960$ 10,177,795,644$
District Total 5,492 41,624,729$ 1,600,951$ 43,225,680$ 3,896 10,626,231$ 5,448,222$ 16,074,453$ 59,300,133$ Dal las (7%) 5,492 41,624,729$ 1,600,951$ 43,225,680$ 3,896 10,626,231$ 5,448,222$ 16,074,453$ 59,300,133$ Note: New local tax revenues are an allocation of the statewide estimate based on the county share of state personal income and further allocated in partial counties according to the share of county population. Variations in personal income or the concentration of direct health care spending in parts of counties could alter these allocations. Remaining columns reflect allocations of statewide estimates according to the county share of adults below 138% FPL or children below 200% FPL, as applicable, and further allocated for partial counties according to the share of the county's total population. Variations in percentages of adults below 138% FPL and children below 200% FPL could alter these estimates. Hospital charity cost data exclude certain hospitals, such as those exempt from reporting, hospitals that report by system, and others, resulting in a conservative estimate of unreimbursed charity costs. Medicaid extension to adults would not relieve all local unreimbursed costs due to ineligible adults, such as undocumented immigrants, people served with incomes above 138% FPL or health care for incarcerated adults other than inpatient hospital stays. 2016 is the first full year of implementation; the federal match rate falls to 95 percent in 2017 and to 90 percent by 2020. For full county-level data, see Appendix C, and for further notes and cautions in interpreting these data, see Appendix A, in "Smart, Affordable and Fair: Why Texas Should Extend Medicaid to Low-Income Adults," at http://www.mhm.org/images/stories/advocacy_and_public_policy/Smart%20Affordable%20and%20Fair_FNL_FULL.pdf.

Impact of Medicaid Extension and Local Spending for Health CareHouse District 103 - Representative Rafael Anchia
County
2014-2017 New Local Tax
Revenue (Adult Expansion)
2011 County Indigent
Healthcare & Unreimbursed Jail Healthcare
Costs
2011 Total Hospital District or City/County Unreimbursed
Healthcare Expenditures
2010 Total Hospital Charity
Care Costs
Total Unreimbursed Charity Care
Costs for Local Jurisdictions &
Hospitals
2014-2017 Adults Federal Funds
Limited Scenario
2014-2017 Adults Federal Funds
Moderate Scenario
2014-2017 Adults State
Funds Moderate Scenario
2014-2017 Adults Federal Funds
Enhanced Scenario
Statewide Total 2,101,392,352$ 258,927,030$ 2,544,037,688$ 1,836,673,862$ 4,380,711,550$ 14,274,023,031$ 22,962,552,386$ 1,283,318,611$ 31,030,479,514$
District Total 16,917,490$ 772,012$ 33,445,877$ 17,908,874$ 51,354,751$ 85,228,045$ 137,105,947$ 7,662,502$ 185,278,326$ Dal las (7%) 16,917,490$ 772,012$ 33,445,877$ 17,908,874$ 51,354,751$ 85,228,045$ 137,105,947$ 7,662,502$ 185,278,326$
ANALYSIS BY BILLY HAMILTON CONSULTING
Extending Medicaid to Low-Income Adults Will Save Local Tax Dollars and Grow the Economy
Download this one-pager at www.texasimpact.org/Local-Taxpayers-Win-With-Medicaid Download the full report at www.mhm.org
Download the executive summary at www.texasimpact.org
For more information about the report, “Smart, Affordable and Fair” call Texas Impact at 512/472-3903 or email [email protected]

Impact of Medicaid Extension and Local Spending for Health CareHouse District 103 - Representative Rafael Anchia
County
2016 Adults <138% FPL Enrollees Moderate Scenario
2016 Adults Federal Funds
Moderate Scenario
2016 Adults State Funds Moderate Scenario
2016 Adults All Funds Moderate Scenario
2016 Children <200% FPL Enrollees Moderate Scenario
2016 Children Federal Funds
Moderate Scenario
2016 Children State Funds Moderate Scenario
2016 Children All Funds Moderate Scenario
2016 Adults & Children
All Funds Moderate Scenario
Statewide Total 1,004,771 7,615,086,733$ 292,887,951$ 7,907,974,684$ 550,189 1,500,495,384$ 769,325,576$ 2,269,820,960$ 10,177,795,644$
District Total 5,999 45,468,538$ 1,748,790$ 47,217,328$ 4,256 11,607,504$ 5,951,334$ 17,558,838$ 64,776,165$ Dal las (7%) 5,999 45,468,538$ 1,748,790$ 47,217,328$ 4,256 11,607,504$ 5,951,334$ 17,558,838$ 64,776,165$ Note: New local tax revenues are an allocation of the statewide estimate based on the county share of state personal income and further allocated in partial counties according to the share of county population. Variations in personal income or the concentration of direct health care spending in parts of counties could alter these allocations. Remaining columns reflect allocations of statewide estimates according to the county share of adults below 138% FPL or children below 200% FPL, as applicable, and further allocated for partial counties according to the share of the county's total population. Variations in percentages of adults below 138% FPL and children below 200% FPL could alter these estimates. Hospital charity cost data exclude certain hospitals, such as those exempt from reporting, hospitals that report by system, and others, resulting in a conservative estimate of unreimbursed charity costs. Medicaid extension to adults would not relieve all local unreimbursed costs due to ineligible adults, such as undocumented immigrants, people served with incomes above 138% FPL or health care for incarcerated adults other than inpatient hospital stays. 2016 is the first full year of implementation; the federal match rate falls to 95 percent in 2017 and to 90 percent by 2020. For full county-level data, see Appendix C, and for further notes and cautions in interpreting these data, see Appendix A, in "Smart, Affordable and Fair: Why Texas Should Extend Medicaid to Low-Income Adults," at http://www.mhm.org/images/stories/advocacy_and_public_policy/Smart%20Affordable%20and%20Fair_FNL_FULL.pdf.

Impact of Medicaid Extension and Local Spending for Health CareHouse District 104 - Representative Roberto R. Alonzo
County
2014-2017 New Local Tax
Revenue (Adult Expansion)
2011 County Indigent
Healthcare & Unreimbursed Jail Healthcare
Costs
2011 Total Hospital District or City/County Unreimbursed
Healthcare Expenditures
2010 Total Hospital Charity
Care Costs
Total Unreimbursed Charity Care
Costs for Local Jurisdictions &
Hospitals
2014-2017 Adults Federal Funds
Limited Scenario
2014-2017 Adults Federal Funds
Moderate Scenario
2014-2017 Adults State
Funds Moderate Scenario
2014-2017 Adults Federal Funds
Enhanced Scenario
Statewide Total 2,101,392,352$ 258,927,030$ 2,544,037,688$ 1,836,673,862$ 4,380,711,550$ 14,274,023,031$ 22,962,552,386$ 1,283,318,611$ 31,030,479,514$
District Total 16,606,852$ 757,836$ 32,831,745$ 17,580,032$ 50,411,776$ 83,663,090$ 134,588,412$ 7,521,804$ 181,876,252$ Dal las (7%) 16,606,852$ 757,836$ 32,831,745$ 17,580,032$ 50,411,776$ 83,663,090$ 134,588,412$ 7,521,804$ 181,876,252$
ANALYSIS BY BILLY HAMILTON CONSULTING
Extending Medicaid to Low-Income Adults Will Save Local Tax Dollars and Grow the Economy
Download this one-pager at www.texasimpact.org/Local-Taxpayers-Win-With-Medicaid Download the full report at www.mhm.org
Download the executive summary at www.texasimpact.org
For more information about the report, “Smart, Affordable and Fair” call Texas Impact at 512/472-3903 or email [email protected]
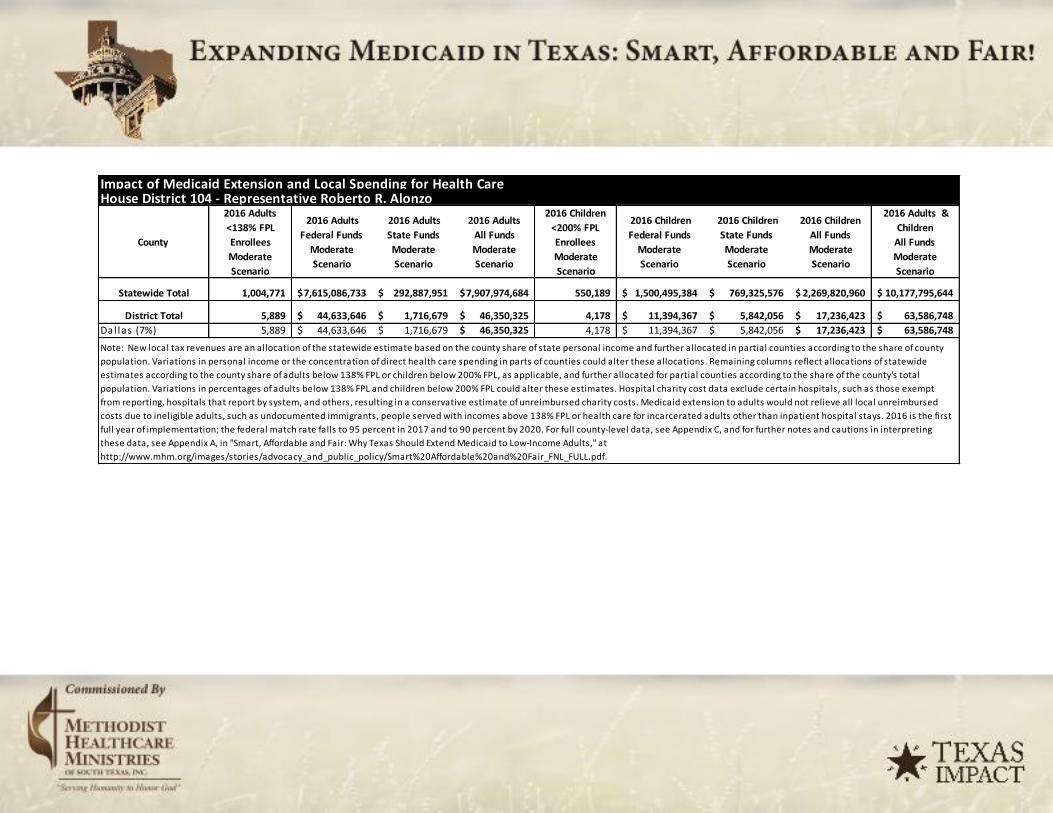
Impact of Medicaid Extension and Local Spending for Health CareHouse District 104 - Representative Roberto R. Alonzo
County
2016 Adults <138% FPL Enrollees Moderate Scenario
2016 Adults Federal Funds
Moderate Scenario
2016 Adults State Funds Moderate Scenario
2016 Adults All Funds Moderate Scenario
2016 Children <200% FPL Enrollees Moderate Scenario
2016 Children Federal Funds
Moderate Scenario
2016 Children State Funds Moderate Scenario
2016 Children All Funds Moderate Scenario
2016 Adults & Children
All Funds Moderate Scenario
Statewide Total 1,004,771 7,615,086,733$ 292,887,951$ 7,907,974,684$ 550,189 1,500,495,384$ 769,325,576$ 2,269,820,960$ 10,177,795,644$
District Total 5,889 44,633,646$ 1,716,679$ 46,350,325$ 4,178 11,394,367$ 5,842,056$ 17,236,423$ 63,586,748$ Dal las (7%) 5,889 44,633,646$ 1,716,679$ 46,350,325$ 4,178 11,394,367$ 5,842,056$ 17,236,423$ 63,586,748$ Note: New local tax revenues are an allocation of the statewide estimate based on the county share of state personal income and further allocated in partial counties according to the share of county population. Variations in personal income or the concentration of direct health care spending in parts of counties could alter these allocations. Remaining columns reflect allocations of statewide estimates according to the county share of adults below 138% FPL or children below 200% FPL, as applicable, and further allocated for partial counties according to the share of the county's total population. Variations in percentages of adults below 138% FPL and children below 200% FPL could alter these estimates. Hospital charity cost data exclude certain hospitals, such as those exempt from reporting, hospitals that report by system, and others, resulting in a conservative estimate of unreimbursed charity costs. Medicaid extension to adults would not relieve all local unreimbursed costs due to ineligible adults, such as undocumented immigrants, people served with incomes above 138% FPL or health care for incarcerated adults other than inpatient hospital stays. 2016 is the first full year of implementation; the federal match rate falls to 95 percent in 2017 and to 90 percent by 2020. For full county-level data, see Appendix C, and for further notes and cautions in interpreting these data, see Appendix A, in "Smart, Affordable and Fair: Why Texas Should Extend Medicaid to Low-Income Adults," at http://www.mhm.org/images/stories/advocacy_and_public_policy/Smart%20Affordable%20and%20Fair_FNL_FULL.pdf.

Impact of Medicaid Extension and Local Spending for Health CareHouse District 105 - Representative Linda Harper-Brown
County
2014-2017 New Local Tax
Revenue (Adult Expansion)
2011 County Indigent
Healthcare & Unreimbursed Jail Healthcare
Costs
2011 Total Hospital District or City/County Unreimbursed
Healthcare Expenditures
2010 Total Hospital Charity
Care Costs
Total Unreimbursed Charity Care
Costs for Local Jurisdictions &
Hospitals
2014-2017 Adults Federal Funds
Limited Scenario
2014-2017 Adults Federal Funds
Moderate Scenario
2014-2017 Adults State
Funds Moderate Scenario
2014-2017 Adults Federal Funds
Enhanced Scenario
Statewide Total 2,101,392,352$ 258,927,030$ 2,544,037,688$ 1,836,673,862$ 4,380,711,550$ 14,274,023,031$ 22,962,552,386$ 1,283,318,611$ 31,030,479,514$
District Total 16,889,809$ 770,749$ 33,391,152$ 17,879,571$ 51,270,723$ 85,088,593$ 136,881,612$ 7,649,965$ 184,975,171$ Dal las (7%) 16,889,809$ 770,749$ 33,391,152$ 17,879,571$ 51,270,723$ 85,088,593$ 136,881,612$ 7,649,965$ 184,975,171$
ANALYSIS BY BILLY HAMILTON CONSULTING
Extending Medicaid to Low-Income Adults Will Save Local Tax Dollars and Grow the Economy
Download this one-pager at www.texasimpact.org/Local-Taxpayers-Win-With-Medicaid Download the full report at www.mhm.org
Download the executive summary at www.texasimpact.org
For more information about the report, “Smart, Affordable and Fair” call Texas Impact at 512/472-3903 or email [email protected]

Impact of Medicaid Extension and Local Spending for Health CareHouse District 105 - Representative Linda Harper-Brown
County
2016 Adults <138% FPL Enrollees Moderate Scenario
2016 Adults Federal Funds
Moderate Scenario
2016 Adults State Funds Moderate Scenario
2016 Adults All Funds Moderate Scenario
2016 Children <200% FPL Enrollees Moderate Scenario
2016 Children Federal Funds
Moderate Scenario
2016 Children State Funds Moderate Scenario
2016 Children All Funds Moderate Scenario
2016 Adults & Children
All Funds Moderate Scenario
Statewide Total 1,004,771 7,615,086,733$ 292,887,951$ 7,907,974,684$ 550,189 1,500,495,384$ 769,325,576$ 2,269,820,960$ 10,177,795,644$
District Total 5,990 45,394,141$ 1,745,929$ 47,140,070$ 4,249 11,588,511$ 5,941,597$ 17,530,108$ 64,670,178$ Dal las (7%) 5,990 45,394,141$ 1,745,929$ 47,140,070$ 4,249 11,588,511$ 5,941,597$ 17,530,108$ 64,670,178$ Note: New local tax revenues are an allocation of the statewide estimate based on the county share of state personal income and further allocated in partial counties according to the share of county population. Variations in personal income or the concentration of direct health care spending in parts of counties could alter these allocations. Remaining columns reflect allocations of statewide estimates according to the county share of adults below 138% FPL or children below 200% FPL, as applicable, and further allocated for partial counties according to the share of the county's total population. Variations in percentages of adults below 138% FPL and children below 200% FPL could alter these estimates. Hospital charity cost data exclude certain hospitals, such as those exempt from reporting, hospitals that report by system, and others, resulting in a conservative estimate of unreimbursed charity costs. Medicaid extension to adults would not relieve all local unreimbursed costs due to ineligible adults, such as undocumented immigrants, people served with incomes above 138% FPL or health care for incarcerated adults other than inpatient hospital stays. 2016 is the first full year of implementation; the federal match rate falls to 95 percent in 2017 and to 90 percent by 2020. For full county-level data, see Appendix C, and for further notes and cautions in interpreting these data, see Appendix A, in "Smart, Affordable and Fair: Why Texas Should Extend Medicaid to Low-Income Adults," at http://www.mhm.org/images/stories/advocacy_and_public_policy/Smart%20Affordable%20and%20Fair_FNL_FULL.pdf.

Impact of Medicaid Extension and Local Spending for Health CareHouse District 106 - Representative Pat Fallon
County
2014-2017 New Local Tax
Revenue (Adult Expansion)
2011 County Indigent
Healthcare & Unreimbursed Jail Healthcare
Costs
2011 Total Hospital District or City/County Unreimbursed
Healthcare Expenditures
2010 Total Hospital Charity
Care Costs
Total Unreimbursed Charity Care
Costs for Local Jurisdictions &
Hospitals
2014-2017 Adults Federal Funds
Limited Scenario
2014-2017 Adults Federal Funds
Moderate Scenario
2014-2017 Adults State
Funds Moderate Scenario
2014-2017 Adults Federal Funds
Enhanced Scenario
Statewide Total 2,101,392,352$ 258,927,030$ 2,544,037,688$ 1,836,673,862$ 4,380,711,550$ 14,274,023,031$ 22,962,552,386$ 1,283,318,611$ 31,030,479,514$
District Total 14,385,021$ 1,197,225$ 2,866,931$ -$ 2,866,931$ 51,672,388$ 83,125,123$ 4,645,652$ 112,331,259$ Denton (24%) 14,385,021$ 1,197,225$ 2,866,931$ -$ 2,866,931$ 51,672,388$ 83,125,123$ 4,645,652$ 112,331,259$
ANALYSIS BY BILLY HAMILTON CONSULTING
Extending Medicaid to Low-Income Adults Will Save Local Tax Dollars and Grow the Economy
Download this one-pager at www.texasimpact.org/Local-Taxpayers-Win-With-Medicaid Download the full report at www.mhm.org
Download the executive summary at www.texasimpact.org
For more information about the report, “Smart, Affordable and Fair” call Texas Impact at 512/472-3903 or email [email protected]

Impact of Medicaid Extension and Local Spending for Health CareHouse District 106 - Representative Pat Fallon
County
2016 Adults <138% FPL Enrollees Moderate Scenario
2016 Adults Federal Funds
Moderate Scenario
2016 Adults State Funds Moderate Scenario
2016 Adults All Funds Moderate Scenario
2016 Children <200% FPL Enrollees Moderate Scenario
2016 Children Federal Funds
Moderate Scenario
2016 Children State Funds Moderate Scenario
2016 Children All Funds Moderate Scenario
2016 Adults & Children
All Funds Moderate Scenario
Statewide Total 1,004,771 7,615,086,733$ 292,887,951$ 7,907,974,684$ 550,189 1,500,495,384$ 769,325,576$ 2,269,820,960$ 10,177,795,644$
District Total 3,637 27,566,841$ 1,060,263$ 28,627,104$ 1,987 5,418,045$ 2,777,909$ 8,195,954$ 36,823,058$ Denton (24%) 3,637 27,566,841$ 1,060,263$ 28,627,104$ 1,987 5,418,045$ 2,777,909$ 8,195,954$ 36,823,058$ Note: New local tax revenues are an allocation of the statewide estimate based on the county share of state personal income and further allocated in partial counties according to the share of county population. Variations in personal income or the concentration of direct health care spending in parts of counties could alter these allocations. Remaining columns reflect allocations of statewide estimates according to the county share of adults below 138% FPL or children below 200% FPL, as applicable, and further allocated for partial counties according to the share of the county's total population. Variations in percentages of adults below 138% FPL and children below 200% FPL could alter these estimates. Hospital charity cost data exclude certain hospitals, such as those exempt from reporting, hospitals that report by system, and others, resulting in a conservative estimate of unreimbursed charity costs. Medicaid extension to adults would not relieve all local unreimbursed costs due to ineligible adults, such as undocumented immigrants, people served with incomes above 138% FPL or health care for incarcerated adults other than inpatient hospital stays. 2016 is the first full year of implementation; the federal match rate falls to 95 percent in 2017 and to 90 percent by 2020. For full county-level data, see Appendix C, and for further notes and cautions in interpreting these data, see Appendix A, in "Smart, Affordable and Fair: Why Texas Should Extend Medicaid to Low-Income Adults," at http://www.mhm.org/images/stories/advocacy_and_public_policy/Smart%20Affordable%20and%20Fair_FNL_FULL.pdf.

Impact of Medicaid Extension and Local Spending for Health CareHouse District 107 - Representative Kenneth Sheets
County
2014-2017 New Local Tax
Revenue (Adult Expansion)
2011 County Indigent
Healthcare & Unreimbursed Jail Healthcare
Costs
2011 Total Hospital District or City/County Unreimbursed
Healthcare Expenditures
2010 Total Hospital Charity
Care Costs
Total Unreimbursed Charity Care
Costs for Local Jurisdictions &
Hospitals
2014-2017 Adults Federal Funds
Limited Scenario
2014-2017 Adults Federal Funds
Moderate Scenario
2014-2017 Adults State
Funds Moderate Scenario
2014-2017 Adults Federal Funds
Enhanced Scenario
Statewide Total 2,101,392,352$ 258,927,030$ 2,544,037,688$ 1,836,673,862$ 4,380,711,550$ 14,274,023,031$ 22,962,552,386$ 1,283,318,611$ 31,030,479,514$
District Total 16,519,196$ 753,836$ 32,658,450$ 17,487,240$ 50,145,690$ 83,221,494$ 133,878,018$ 7,482,102$ 180,916,261$ Dal las (7%) 16,519,196$ 753,836$ 32,658,450$ 17,487,240$ 50,145,690$ 83,221,494$ 133,878,018$ 7,482,102$ 180,916,261$
ANALYSIS BY BILLY HAMILTON CONSULTING
Extending Medicaid to Low-Income Adults Will Save Local Tax Dollars and Grow the Economy
Download this one-pager at www.texasimpact.org/Local-Taxpayers-Win-With-Medicaid Download the full report at www.mhm.org
Download the executive summary at www.texasimpact.org
For more information about the report, “Smart, Affordable and Fair” call Texas Impact at 512/472-3903 or email [email protected]

Impact of Medicaid Extension and Local Spending for Health CareHouse District 107 - Representative Kenneth Sheets
County
2016 Adults <138% FPL Enrollees Moderate Scenario
2016 Adults Federal Funds
Moderate Scenario
2016 Adults State Funds Moderate Scenario
2016 Adults All Funds Moderate Scenario
2016 Children <200% FPL Enrollees Moderate Scenario
2016 Children Federal Funds
Moderate Scenario
2016 Children State Funds Moderate Scenario
2016 Children All Funds Moderate Scenario
2016 Adults & Children
All Funds Moderate Scenario
Statewide Total 1,004,771 7,615,086,733$ 292,887,951$ 7,907,974,684$ 550,189 1,500,495,384$ 769,325,576$ 2,269,820,960$ 10,177,795,644$
District Total 5,858 44,398,058$ 1,707,618$ 46,105,675$ 4,156 11,334,225$ 5,811,220$ 17,145,445$ 63,251,120$ Dal las (7%) 5,858 44,398,058$ 1,707,618$ 46,105,675$ 4,156 11,334,225$ 5,811,220$ 17,145,445$ 63,251,120$ Note: New local tax revenues are an allocation of the statewide estimate based on the county share of state personal income and further allocated in partial counties according to the share of county population. Variations in personal income or the concentration of direct health care spending in parts of counties could alter these allocations. Remaining columns reflect allocations of statewide estimates according to the county share of adults below 138% FPL or children below 200% FPL, as applicable, and further allocated for partial counties according to the share of the county's total population. Variations in percentages of adults below 138% FPL and children below 200% FPL could alter these estimates. Hospital charity cost data exclude certain hospitals, such as those exempt from reporting, hospitals that report by system, and others, resulting in a conservative estimate of unreimbursed charity costs. Medicaid extension to adults would not relieve all local unreimbursed costs due to ineligible adults, such as undocumented immigrants, people served with incomes above 138% FPL or health care for incarcerated adults other than inpatient hospital stays. 2016 is the first full year of implementation; the federal match rate falls to 95 percent in 2017 and to 90 percent by 2020. For full county-level data, see Appendix C, and for further notes and cautions in interpreting these data, see Appendix A, in "Smart, Affordable and Fair: Why Texas Should Extend Medicaid to Low-Income Adults," at http://www.mhm.org/images/stories/advocacy_and_public_policy/Smart%20Affordable%20and%20Fair_FNL_FULL.pdf.

Impact of Medicaid Extension and Local Spending for Health CareHouse District 108 - Representative Dan Branch
County
2014-2017 New Local Tax
Revenue (Adult Expansion)
2011 County Indigent
Healthcare & Unreimbursed Jail Healthcare
Costs
2011 Total Hospital District or City/County Unreimbursed
Healthcare Expenditures
2010 Total Hospital Charity
Care Costs
Total Unreimbursed Charity Care
Costs for Local Jurisdictions &
Hospitals
2014-2017 Adults Federal Funds
Limited Scenario
2014-2017 Adults Federal Funds
Moderate Scenario
2014-2017 Adults State
Funds Moderate Scenario
2014-2017 Adults Federal Funds
Enhanced Scenario
Statewide Total 2,101,392,352$ 258,927,030$ 2,544,037,688$ 1,836,673,862$ 4,380,711,550$ 14,274,023,031$ 22,962,552,386$ 1,283,318,611$ 31,030,479,514$
District Total 15,688,873$ 715,945$ 31,016,901$ 16,608,258$ 47,625,159$ 79,038,436$ 127,148,754$ 7,106,020$ 171,822,658$ Dal las (7%) 15,688,873$ 715,945$ 31,016,901$ 16,608,258$ 47,625,159$ 79,038,436$ 127,148,754$ 7,106,020$ 171,822,658$
ANALYSIS BY BILLY HAMILTON CONSULTING
Extending Medicaid to Low-Income Adults Will Save Local Tax Dollars and Grow the Economy
Download this one-pager at www.texasimpact.org/Local-Taxpayers-Win-With-Medicaid Download the full report at www.mhm.org
Download the executive summary at www.texasimpact.org
For more information about the report, “Smart, Affordable and Fair” call Texas Impact at 512/472-3903 or email [email protected]

Impact of Medicaid Extension and Local Spending for Health CareHouse District 108 - Representative Dan Branch
County
2016 Adults <138% FPL Enrollees Moderate Scenario
2016 Adults Federal Funds
Moderate Scenario
2016 Adults State Funds Moderate Scenario
2016 Adults All Funds Moderate Scenario
2016 Children <200% FPL Enrollees Moderate Scenario
2016 Children Federal Funds
Moderate Scenario
2016 Children State Funds Moderate Scenario
2016 Children All Funds Moderate Scenario
2016 Adults & Children
All Funds Moderate Scenario
Statewide Total 1,004,771 7,615,086,733$ 292,887,951$ 7,907,974,684$ 550,189 1,500,495,384$ 769,325,576$ 2,269,820,960$ 10,177,795,644$
District Total 5,564 42,166,427$ 1,621,786$ 43,788,213$ 3,947 10,764,519$ 5,519,124$ 16,283,643$ 60,071,856$ Dal las (7%) 5,564 42,166,427$ 1,621,786$ 43,788,213$ 3,947 10,764,519$ 5,519,124$ 16,283,643$ 60,071,856$ Note: New local tax revenues are an allocation of the statewide estimate based on the county share of state personal income and further allocated in partial counties according to the share of county population. Variations in personal income or the concentration of direct health care spending in parts of counties could alter these allocations. Remaining columns reflect allocations of statewide estimates according to the county share of adults below 138% FPL or children below 200% FPL, as applicable, and further allocated for partial counties according to the share of the county's total population. Variations in percentages of adults below 138% FPL and children below 200% FPL could alter these estimates. Hospital charity cost data exclude certain hospitals, such as those exempt from reporting, hospitals that report by system, and others, resulting in a conservative estimate of unreimbursed charity costs. Medicaid extension to adults would not relieve all local unreimbursed costs due to ineligible adults, such as undocumented immigrants, people served with incomes above 138% FPL or health care for incarcerated adults other than inpatient hospital stays. 2016 is the first full year of implementation; the federal match rate falls to 95 percent in 2017 and to 90 percent by 2020. For full county-level data, see Appendix C, and for further notes and cautions in interpreting these data, see Appendix A, in "Smart, Affordable and Fair: Why Texas Should Extend Medicaid to Low-Income Adults," at http://www.mhm.org/images/stories/advocacy_and_public_policy/Smart%20Affordable%20and%20Fair_FNL_FULL.pdf.

Impact of Medicaid Extension and Local Spending for Health CareHouse District 109 - Representative Helen Giddings
County
2014-2017 New Local Tax
Revenue (Adult Expansion)
2011 County Indigent
Healthcare & Unreimbursed Jail Healthcare
Costs
2011 Total Hospital District or City/County Unreimbursed
Healthcare Expenditures
2010 Total Hospital Charity
Care Costs
Total Unreimbursed Charity Care
Costs for Local Jurisdictions &
Hospitals
2014-2017 Adults Federal Funds
Limited Scenario
2014-2017 Adults Federal Funds
Moderate Scenario
2014-2017 Adults State
Funds Moderate Scenario
2014-2017 Adults Federal Funds
Enhanced Scenario
Statewide Total 2,101,392,352$ 258,927,030$ 2,544,037,688$ 1,836,673,862$ 4,380,711,550$ 14,274,023,031$ 22,962,552,386$ 1,283,318,611$ 31,030,479,514$
District Total 16,740,641$ 763,942$ 33,096,247$ 17,721,662$ 50,817,909$ 84,337,105$ 135,672,697$ 7,582,402$ 183,341,502$ Dal las (7%) 16,740,641$ 763,942$ 33,096,247$ 17,721,662$ 50,817,909$ 84,337,105$ 135,672,697$ 7,582,402$ 183,341,502$
ANALYSIS BY BILLY HAMILTON CONSULTING
Extending Medicaid to Low-Income Adults Will Save Local Tax Dollars and Grow the Economy
Download this one-pager at www.texasimpact.org/Local-Taxpayers-Win-With-Medicaid Download the full report at www.mhm.org
Download the executive summary at www.texasimpact.org
For more information about the report, “Smart, Affordable and Fair” call Texas Impact at 512/472-3903 or email [email protected]

Impact of Medicaid Extension and Local Spending for Health CareHouse District 109 - Representative Helen Giddings
County
2016 Adults <138% FPL Enrollees Moderate Scenario
2016 Adults Federal Funds
Moderate Scenario
2016 Adults State Funds Moderate Scenario
2016 Adults All Funds Moderate Scenario
2016 Children <200% FPL Enrollees Moderate Scenario
2016 Children Federal Funds
Moderate Scenario
2016 Children State Funds Moderate Scenario
2016 Children All Funds Moderate Scenario
2016 Adults & Children
All Funds Moderate Scenario
Statewide Total 1,004,771 7,615,086,733$ 292,887,951$ 7,907,974,684$ 550,189 1,500,495,384$ 769,325,576$ 2,269,820,960$ 10,177,795,644$
District Total 5,937 44,993,228$ 1,730,509$ 46,723,737$ 4,212 11,486,164$ 5,889,121$ 17,375,285$ 64,099,022$ Dal las (7%) 5,937 44,993,228$ 1,730,509$ 46,723,737$ 4,212 11,486,164$ 5,889,121$ 17,375,285$ 64,099,022$ Note: New local tax revenues are an allocation of the statewide estimate based on the county share of state personal income and further allocated in partial counties according to the share of county population. Variations in personal income or the concentration of direct health care spending in parts of counties could alter these allocations. Remaining columns reflect allocations of statewide estimates according to the county share of adults below 138% FPL or children below 200% FPL, as applicable, and further allocated for partial counties according to the share of the county's total population. Variations in percentages of adults below 138% FPL and children below 200% FPL could alter these estimates. Hospital charity cost data exclude certain hospitals, such as those exempt from reporting, hospitals that report by system, and others, resulting in a conservative estimate of unreimbursed charity costs. Medicaid extension to adults would not relieve all local unreimbursed costs due to ineligible adults, such as undocumented immigrants, people served with incomes above 138% FPL or health care for incarcerated adults other than inpatient hospital stays. 2016 is the first full year of implementation; the federal match rate falls to 95 percent in 2017 and to 90 percent by 2020. For full county-level data, see Appendix C, and for further notes and cautions in interpreting these data, see Appendix A, in "Smart, Affordable and Fair: Why Texas Should Extend Medicaid to Low-Income Adults," at http://www.mhm.org/images/stories/advocacy_and_public_policy/Smart%20Affordable%20and%20Fair_FNL_FULL.pdf.

Impact of Medicaid Extension and Local Spending for Health CareHouse District 110 - Representative Toni Rose
County
2014-2017 New Local Tax
Revenue (Adult Expansion)
2011 County Indigent
Healthcare & Unreimbursed Jail Healthcare
Costs
2011 Total Hospital District or City/County Unreimbursed
Healthcare Expenditures
2010 Total Hospital Charity
Care Costs
Total Unreimbursed Charity Care
Costs for Local Jurisdictions &
Hospitals
2014-2017 Adults Federal Funds
Limited Scenario
2014-2017 Adults Federal Funds
Moderate Scenario
2014-2017 Adults State
Funds Moderate Scenario
2014-2017 Adults Federal Funds
Enhanced Scenario
Statewide Total 2,101,392,352$ 258,927,030$ 2,544,037,688$ 1,836,673,862$ 4,380,711,550$ 14,274,023,031$ 22,962,552,386$ 1,283,318,611$ 31,030,479,514$
District Total 16,103,506$ 734,867$ 31,836,630$ 17,047,189$ 48,883,820$ 81,127,302$ 130,509,102$ 7,293,822$ 176,363,670$ Dal las (7%) 16,103,506$ 734,867$ 31,836,630$ 17,047,189$ 48,883,820$ 81,127,302$ 130,509,102$ 7,293,822$ 176,363,670$
ANALYSIS BY BILLY HAMILTON CONSULTING
Extending Medicaid to Low-Income Adults Will Save Local Tax Dollars and Grow the Economy
Download this one-pager at www.texasimpact.org/Local-Taxpayers-Win-With-Medicaid Download the full report at www.mhm.org
Download the executive summary at www.texasimpact.org
For more information about the report, “Smart, Affordable and Fair” call Texas Impact at 512/472-3903 or email [email protected]

Impact of Medicaid Extension and Local Spending for Health CareHouse District 110 - Representative Toni Rose
County
2016 Adults <138% FPL Enrollees Moderate Scenario
2016 Adults Federal Funds
Moderate Scenario
2016 Adults State Funds Moderate Scenario
2016 Adults All Funds Moderate Scenario
2016 Children <200% FPL Enrollees Moderate Scenario
2016 Children Federal Funds
Moderate Scenario
2016 Children State Funds Moderate Scenario
2016 Children All Funds Moderate Scenario
2016 Adults & Children
All Funds Moderate Scenario
Statewide Total 1,004,771 7,615,086,733$ 292,887,951$ 7,907,974,684$ 550,189 1,500,495,384$ 769,325,576$ 2,269,820,960$ 10,177,795,644$
District Total 5,711 43,280,821$ 1,664,647$ 44,945,468$ 4,051 11,049,009$ 5,664,986$ 16,713,995$ 61,659,464$ Dal las (7%) 5,711 43,280,821$ 1,664,647$ 44,945,468$ 4,051 11,049,009$ 5,664,986$ 16,713,995$ 61,659,464$ Note: New local tax revenues are an allocation of the statewide estimate based on the county share of state personal income and further allocated in partial counties according to the share of county population. Variations in personal income or the concentration of direct health care spending in parts of counties could alter these allocations. Remaining columns reflect allocations of statewide estimates according to the county share of adults below 138% FPL or children below 200% FPL, as applicable, and further allocated for partial counties according to the share of the county's total population. Variations in percentages of adults below 138% FPL and children below 200% FPL could alter these estimates. Hospital charity cost data exclude certain hospitals, such as those exempt from reporting, hospitals that report by system, and others, resulting in a conservative estimate of unreimbursed charity costs. Medicaid extension to adults would not relieve all local unreimbursed costs due to ineligible adults, such as undocumented immigrants, people served with incomes above 138% FPL or health care for incarcerated adults other than inpatient hospital stays. 2016 is the first full year of implementation; the federal match rate falls to 95 percent in 2017 and to 90 percent by 2020. For full county-level data, see Appendix C, and for further notes and cautions in interpreting these data, see Appendix A, in "Smart, Affordable and Fair: Why Texas Should Extend Medicaid to Low-Income Adults," at http://www.mhm.org/images/stories/advocacy_and_public_policy/Smart%20Affordable%20and%20Fair_FNL_FULL.pdf.

Impact of Medicaid Extension and Local Spending for Health CareHouse District 111 - Representative Yvonne Davis
County
2014-2017 New Local Tax
Revenue (Adult Expansion)
2011 County Indigent
Healthcare & Unreimbursed Jail Healthcare
Costs
2011 Total Hospital District or City/County Unreimbursed
Healthcare Expenditures
2010 Total Hospital Charity
Care Costs
Total Unreimbursed Charity Care
Costs for Local Jurisdictions &
Hospitals
2014-2017 Adults Federal Funds
Limited Scenario
2014-2017 Adults Federal Funds
Moderate Scenario
2014-2017 Adults State
Funds Moderate Scenario
2014-2017 Adults Federal Funds
Enhanced Scenario
Statewide Total 2,101,392,352$ 258,927,030$ 2,544,037,688$ 1,836,673,862$ 4,380,711,550$ 14,274,023,031$ 22,962,552,386$ 1,283,318,611$ 31,030,479,514$
District Total 16,048,914$ 732,375$ 31,728,701$ 16,989,398$ 48,718,099$ 80,852,273$ 130,066,664$ 7,269,095$ 175,765,781$ Dal las (7%) 16,048,914$ 732,375$ 31,728,701$ 16,989,398$ 48,718,099$ 80,852,273$ 130,066,664$ 7,269,095$ 175,765,781$
ANALYSIS BY BILLY HAMILTON CONSULTING
Extending Medicaid to Low-Income Adults Will Save Local Tax Dollars and Grow the Economy
Download this one-pager at www.texasimpact.org/Local-Taxpayers-Win-With-Medicaid Download the full report at www.mhm.org
Download the executive summary at www.texasimpact.org
For more information about the report, “Smart, Affordable and Fair” call Texas Impact at 512/472-3903 or email [email protected]

Impact of Medicaid Extension and Local Spending for Health CareHouse District 111 - Representative Yvonne Davis
County
2016 Adults <138% FPL Enrollees Moderate Scenario
2016 Adults Federal Funds
Moderate Scenario
2016 Adults State Funds Moderate Scenario
2016 Adults All Funds Moderate Scenario
2016 Children <200% FPL Enrollees Moderate Scenario
2016 Children Federal Funds
Moderate Scenario
2016 Children State Funds Moderate Scenario
2016 Children All Funds Moderate Scenario
2016 Adults & Children
All Funds Moderate Scenario
Statewide Total 1,004,771 7,615,086,733$ 292,887,951$ 7,907,974,684$ 550,189 1,500,495,384$ 769,325,576$ 2,269,820,960$ 10,177,795,644$
District Total 5,691 43,134,095$ 1,659,004$ 44,793,099$ 4,038 11,011,552$ 5,645,781$ 16,657,333$ 61,450,433$ Dal las (7%) 5,691 43,134,095$ 1,659,004$ 44,793,099$ 4,038 11,011,552$ 5,645,781$ 16,657,333$ 61,450,433$ Note: New local tax revenues are an allocation of the statewide estimate based on the county share of state personal income and further allocated in partial counties according to the share of county population. Variations in personal income or the concentration of direct health care spending in parts of counties could alter these allocations. Remaining columns reflect allocations of statewide estimates according to the county share of adults below 138% FPL or children below 200% FPL, as applicable, and further allocated for partial counties according to the share of the county's total population. Variations in percentages of adults below 138% FPL and children below 200% FPL could alter these estimates. Hospital charity cost data exclude certain hospitals, such as those exempt from reporting, hospitals that report by system, and others, resulting in a conservative estimate of unreimbursed charity costs. Medicaid extension to adults would not relieve all local unreimbursed costs due to ineligible adults, such as undocumented immigrants, people served with incomes above 138% FPL or health care for incarcerated adults other than inpatient hospital stays. 2016 is the first full year of implementation; the federal match rate falls to 95 percent in 2017 and to 90 percent by 2020. For full county-level data, see Appendix C, and for further notes and cautions in interpreting these data, see Appendix A, in "Smart, Affordable and Fair: Why Texas Should Extend Medicaid to Low-Income Adults," at http://www.mhm.org/images/stories/advocacy_and_public_policy/Smart%20Affordable%20and%20Fair_FNL_FULL.pdf.

Impact of Medicaid Extension and Local Spending for Health CareHouse District 112 - Representative Angie Chen Button
County
2014-2017 New Local Tax
Revenue (Adult Expansion)
2011 County Indigent
Healthcare & Unreimbursed Jail Healthcare
Costs
2011 Total Hospital District or City/County Unreimbursed
Healthcare Expenditures
2010 Total Hospital Charity
Care Costs
Total Unreimbursed Charity Care
Costs for Local Jurisdictions &
Hospitals
2014-2017 Adults Federal Funds
Limited Scenario
2014-2017 Adults Federal Funds
Moderate Scenario
2014-2017 Adults State
Funds Moderate Scenario
2014-2017 Adults Federal Funds
Enhanced Scenario
Statewide Total 2,101,392,352$ 258,927,030$ 2,544,037,688$ 1,836,673,862$ 4,380,711,550$ 14,274,023,031$ 22,962,552,386$ 1,283,318,611$ 31,030,479,514$
District Total 16,055,834$ 732,691$ 31,742,382$ 16,996,723$ 48,739,106$ 80,887,136$ 130,122,748$ 7,272,229$ 175,841,570$ Dal las (7%) 16,055,834$ 732,691$ 31,742,382$ 16,996,723$ 48,739,106$ 80,887,136$ 130,122,748$ 7,272,229$ 175,841,570$
ANALYSIS BY BILLY HAMILTON CONSULTING
Extending Medicaid to Low-Income Adults Will Save Local Tax Dollars and Grow the Economy
Download this one-pager at www.texasimpact.org/Local-Taxpayers-Win-With-Medicaid Download the full report at www.mhm.org
Download the executive summary at www.texasimpact.org
For more information about the report, “Smart, Affordable and Fair” call Texas Impact at 512/472-3903 or email [email protected]

Impact of Medicaid Extension and Local Spending for Health CareHouse District 112 - Representative Angie Chen Button
County
2016 Adults <138% FPL Enrollees Moderate Scenario
2016 Adults Federal Funds
Moderate Scenario
2016 Adults State Funds Moderate Scenario
2016 Adults All Funds Moderate Scenario
2016 Children <200% FPL Enrollees Moderate Scenario
2016 Children Federal Funds
Moderate Scenario
2016 Children State Funds Moderate Scenario
2016 Children All Funds Moderate Scenario
2016 Adults & Children
All Funds Moderate Scenario
Statewide Total 1,004,771 7,615,086,733$ 292,887,951$ 7,907,974,684$ 550,189 1,500,495,384$ 769,325,576$ 2,269,820,960$ 10,177,795,644$
District Total 5,694 43,152,695$ 1,659,719$ 44,812,414$ 4,039 11,016,300$ 5,648,216$ 16,664,516$ 61,476,929$ Dal las (7%) 5,694 43,152,695$ 1,659,719$ 44,812,414$ 4,039 11,016,300$ 5,648,216$ 16,664,516$ 61,476,929$ Note: New local tax revenues are an allocation of the statewide estimate based on the county share of state personal income and further allocated in partial counties according to the share of county population. Variations in personal income or the concentration of direct health care spending in parts of counties could alter these allocations. Remaining columns reflect allocations of statewide estimates according to the county share of adults below 138% FPL or children below 200% FPL, as applicable, and further allocated for partial counties according to the share of the county's total population. Variations in percentages of adults below 138% FPL and children below 200% FPL could alter these estimates. Hospital charity cost data exclude certain hospitals, such as those exempt from reporting, hospitals that report by system, and others, resulting in a conservative estimate of unreimbursed charity costs. Medicaid extension to adults would not relieve all local unreimbursed costs due to ineligible adults, such as undocumented immigrants, people served with incomes above 138% FPL or health care for incarcerated adults other than inpatient hospital stays. 2016 is the first full year of implementation; the federal match rate falls to 95 percent in 2017 and to 90 percent by 2020. For full county-level data, see Appendix C, and for further notes and cautions in interpreting these data, see Appendix A, in "Smart, Affordable and Fair: Why Texas Should Extend Medicaid to Low-Income Adults," at http://www.mhm.org/images/stories/advocacy_and_public_policy/Smart%20Affordable%20and%20Fair_FNL_FULL.pdf.

Impact of Medicaid Extension and Local Spending for Health CareHouse District 113 - Representative Cindy Burkett
County
2014-2017 New Local Tax
Revenue (Adult Expansion)
2011 County Indigent
Healthcare & Unreimbursed Jail Healthcare
Costs
2011 Total Hospital District or City/County Unreimbursed
Healthcare Expenditures
2010 Total Hospital Charity
Care Costs
Total Unreimbursed Charity Care
Costs for Local Jurisdictions &
Hospitals
2014-2017 Adults Federal Funds
Limited Scenario
2014-2017 Adults Federal Funds
Moderate Scenario
2014-2017 Adults State
Funds Moderate Scenario
2014-2017 Adults Federal Funds
Enhanced Scenario
Statewide Total 2,101,392,352$ 258,927,030$ 2,544,037,688$ 1,836,673,862$ 4,380,711,550$ 14,274,023,031$ 22,962,552,386$ 1,283,318,611$ 31,030,479,514$
District Total 16,474,792$ 751,810$ 32,570,663$ 17,440,233$ 50,010,896$ 82,997,791$ 133,518,148$ 7,461,989$ 180,429,949$ Dal las (7%) 16,474,792$ 751,810$ 32,570,663$ 17,440,233$ 50,010,896$ 82,997,791$ 133,518,148$ 7,461,989$ 180,429,949$
ANALYSIS BY BILLY HAMILTON CONSULTING
Extending Medicaid to Low-Income Adults Will Save Local Tax Dollars and Grow the Economy
Download this one-pager at www.texasimpact.org/Local-Taxpayers-Win-With-Medicaid Download the full report at www.mhm.org
Download the executive summary at www.texasimpact.org
For more information about the report, “Smart, Affordable and Fair” call Texas Impact at 512/472-3903 or email [email protected]

Impact of Medicaid Extension and Local Spending for Health CareHouse District 113 - Representative Cindy Burkett
County
2016 Adults <138% FPL Enrollees Moderate Scenario
2016 Adults Federal Funds
Moderate Scenario
2016 Adults State Funds Moderate Scenario
2016 Adults All Funds Moderate Scenario
2016 Children <200% FPL Enrollees Moderate Scenario
2016 Children Federal Funds
Moderate Scenario
2016 Children State Funds Moderate Scenario
2016 Children All Funds Moderate Scenario
2016 Adults & Children
All Funds Moderate Scenario
Statewide Total 1,004,771 7,615,086,733$ 292,887,951$ 7,907,974,684$ 550,189 1,500,495,384$ 769,325,576$ 2,269,820,960$ 10,177,795,644$
District Total 5,842 44,278,713$ 1,703,027$ 45,981,741$ 4,145 11,303,758$ 5,795,599$ 17,099,357$ 63,081,098$ Dal las (7%) 5,842 44,278,713$ 1,703,027$ 45,981,741$ 4,145 11,303,758$ 5,795,599$ 17,099,357$ 63,081,098$ Note: New local tax revenues are an allocation of the statewide estimate based on the county share of state personal income and further allocated in partial counties according to the share of county population. Variations in personal income or the concentration of direct health care spending in parts of counties could alter these allocations. Remaining columns reflect allocations of statewide estimates according to the county share of adults below 138% FPL or children below 200% FPL, as applicable, and further allocated for partial counties according to the share of the county's total population. Variations in percentages of adults below 138% FPL and children below 200% FPL could alter these estimates. Hospital charity cost data exclude certain hospitals, such as those exempt from reporting, hospitals that report by system, and others, resulting in a conservative estimate of unreimbursed charity costs. Medicaid extension to adults would not relieve all local unreimbursed costs due to ineligible adults, such as undocumented immigrants, people served with incomes above 138% FPL or health care for incarcerated adults other than inpatient hospital stays. 2016 is the first full year of implementation; the federal match rate falls to 95 percent in 2017 and to 90 percent by 2020. For full county-level data, see Appendix C, and for further notes and cautions in interpreting these data, see Appendix A, in "Smart, Affordable and Fair: Why Texas Should Extend Medicaid to Low-Income Adults," at http://www.mhm.org/images/stories/advocacy_and_public_policy/Smart%20Affordable%20and%20Fair_FNL_FULL.pdf.

Impact of Medicaid Extension and Local Spending for Health CareHouse District 114 - Representative Jason Villalba
County
2014-2017 New Local Tax
Revenue (Adult Expansion)
2011 County Indigent
Healthcare & Unreimbursed Jail Healthcare
Costs
2011 Total Hospital District or City/County Unreimbursed
Healthcare Expenditures
2010 Total Hospital Charity
Care Costs
Total Unreimbursed Charity Care
Costs for Local Jurisdictions &
Hospitals
2014-2017 Adults Federal Funds
Limited Scenario
2014-2017 Adults Federal Funds
Moderate Scenario
2014-2017 Adults State
Funds Moderate Scenario
2014-2017 Adults Federal Funds
Enhanced Scenario
Statewide Total 2,101,392,352$ 258,927,030$ 2,544,037,688$ 1,836,673,862$ 4,380,711,550$ 14,274,023,031$ 22,962,552,386$ 1,283,318,611$ 31,030,479,514$
District Total 16,563,216$ 755,845$ 32,745,477$ 17,533,839$ 50,279,316$ 83,443,261$ 134,234,773$ 7,502,040$ 181,398,361$ Dal las (7%) 16,563,216$ 755,845$ 32,745,477$ 17,533,839$ 50,279,316$ 83,443,261$ 134,234,773$ 7,502,040$ 181,398,361$
ANALYSIS BY BILLY HAMILTON CONSULTING
Extending Medicaid to Low-Income Adults Will Save Local Tax Dollars and Grow the Economy
Download this one-pager at www.texasimpact.org/Local-Taxpayers-Win-With-Medicaid Download the full report at www.mhm.org
Download the executive summary at www.texasimpact.org
For more information about the report, “Smart, Affordable and Fair” call Texas Impact at 512/472-3903 or email [email protected]

Impact of Medicaid Extension and Local Spending for Health CareHouse District 114 - Representative Jason Villalba
County
2016 Adults <138% FPL Enrollees Moderate Scenario
2016 Adults Federal Funds
Moderate Scenario
2016 Adults State Funds Moderate Scenario
2016 Adults All Funds Moderate Scenario
2016 Children <200% FPL Enrollees Moderate Scenario
2016 Children Federal Funds
Moderate Scenario
2016 Children State Funds Moderate Scenario
2016 Children All Funds Moderate Scenario
2016 Adults & Children
All Funds Moderate Scenario
Statewide Total 1,004,771 7,615,086,733$ 292,887,951$ 7,907,974,684$ 550,189 1,500,495,384$ 769,325,576$ 2,269,820,960$ 10,177,795,644$
District Total 5,874 44,516,368$ 1,712,168$ 46,228,536$ 4,167 11,364,428$ 5,826,706$ 17,191,133$ 63,419,670$ Dal las (7%) 5,874 44,516,368$ 1,712,168$ 46,228,536$ 4,167 11,364,428$ 5,826,706$ 17,191,133$ 63,419,670$ Note: New local tax revenues are an allocation of the statewide estimate based on the county share of state personal income and further allocated in partial counties according to the share of county population. Variations in personal income or the concentration of direct health care spending in parts of counties could alter these allocations. Remaining columns reflect allocations of statewide estimates according to the county share of adults below 138% FPL or children below 200% FPL, as applicable, and further allocated for partial counties according to the share of the county's total population. Variations in percentages of adults below 138% FPL and children below 200% FPL could alter these estimates. Hospital charity cost data exclude certain hospitals, such as those exempt from reporting, hospitals that report by system, and others, resulting in a conservative estimate of unreimbursed charity costs. Medicaid extension to adults would not relieve all local unreimbursed costs due to ineligible adults, such as undocumented immigrants, people served with incomes above 138% FPL or health care for incarcerated adults other than inpatient hospital stays. 2016 is the first full year of implementation; the federal match rate falls to 95 percent in 2017 and to 90 percent by 2020. For full county-level data, see Appendix C, and for further notes and cautions in interpreting these data, see Appendix A, in "Smart, Affordable and Fair: Why Texas Should Extend Medicaid to Low-Income Adults," at http://www.mhm.org/images/stories/advocacy_and_public_policy/Smart%20Affordable%20and%20Fair_FNL_FULL.pdf.

Impact of Medicaid Extension and Local Spending for Health CareHouse District 115 - Representative Bennett Ratliff
County
2014-2017 New Local Tax
Revenue (Adult Expansion)
2011 County Indigent
Healthcare & Unreimbursed Jail Healthcare
Costs
2011 Total Hospital District or City/County Unreimbursed
Healthcare Expenditures
2010 Total Hospital Charity
Care Costs
Total Unreimbursed Charity Care
Costs for Local Jurisdictions &
Hospitals
2014-2017 Adults Federal Funds
Limited Scenario
2014-2017 Adults Federal Funds
Moderate Scenario
2014-2017 Adults State
Funds Moderate Scenario
2014-2017 Adults Federal Funds
Enhanced Scenario
Statewide Total 2,101,392,352$ 258,927,030$ 2,544,037,688$ 1,836,673,862$ 4,380,711,550$ 14,274,023,031$ 22,962,552,386$ 1,283,318,611$ 31,030,479,514$
District Total 16,025,366$ 731,301$ 31,682,147$ 16,964,470$ 48,646,617$ 80,733,643$ 129,875,823$ 7,258,429$ 175,507,888$ Dal las (7%) 16,025,366$ 731,301$ 31,682,147$ 16,964,470$ 48,646,617$ 80,733,643$ 129,875,823$ 7,258,429$ 175,507,888$
ANALYSIS BY BILLY HAMILTON CONSULTING
Extending Medicaid to Low-Income Adults Will Save Local Tax Dollars and Grow the Economy
Download this one-pager at www.texasimpact.org/Local-Taxpayers-Win-With-Medicaid Download the full report at www.mhm.org
Download the executive summary at www.texasimpact.org
For more information about the report, “Smart, Affordable and Fair” call Texas Impact at 512/472-3903 or email [email protected]

Impact of Medicaid Extension and Local Spending for Health CareHouse District 115 - Representative Bennett Ratliff
County
2016 Adults <138% FPL Enrollees Moderate Scenario
2016 Adults Federal Funds
Moderate Scenario
2016 Adults State Funds Moderate Scenario
2016 Adults All Funds Moderate Scenario
2016 Children <200% FPL Enrollees Moderate Scenario
2016 Children Federal Funds
Moderate Scenario
2016 Children State Funds Moderate Scenario
2016 Children All Funds Moderate Scenario
2016 Adults & Children
All Funds Moderate Scenario
Statewide Total 1,004,771 7,615,086,733$ 292,887,951$ 7,907,974,684$ 550,189 1,500,495,384$ 769,325,576$ 2,269,820,960$ 10,177,795,644$
District Total 5,683 43,070,807$ 1,656,569$ 44,727,376$ 4,032 10,995,395$ 5,637,497$ 16,632,893$ 61,360,269$ Dal las (7%) 5,683 43,070,807$ 1,656,569$ 44,727,376$ 4,032 10,995,395$ 5,637,497$ 16,632,893$ 61,360,269$ Note: New local tax revenues are an allocation of the statewide estimate based on the county share of state personal income and further allocated in partial counties according to the share of county population. Variations in personal income or the concentration of direct health care spending in parts of counties could alter these allocations. Remaining columns reflect allocations of statewide estimates according to the county share of adults below 138% FPL or children below 200% FPL, as applicable, and further allocated for partial counties according to the share of the county's total population. Variations in percentages of adults below 138% FPL and children below 200% FPL could alter these estimates. Hospital charity cost data exclude certain hospitals, such as those exempt from reporting, hospitals that report by system, and others, resulting in a conservative estimate of unreimbursed charity costs. Medicaid extension to adults would not relieve all local unreimbursed costs due to ineligible adults, such as undocumented immigrants, people served with incomes above 138% FPL or health care for incarcerated adults other than inpatient hospital stays. 2016 is the first full year of implementation; the federal match rate falls to 95 percent in 2017 and to 90 percent by 2020. For full county-level data, see Appendix C, and for further notes and cautions in interpreting these data, see Appendix A, in "Smart, Affordable and Fair: Why Texas Should Extend Medicaid to Low-Income Adults," at http://www.mhm.org/images/stories/advocacy_and_public_policy/Smart%20Affordable%20and%20Fair_FNL_FULL.pdf.

Impact of Medicaid Extension and Local Spending for Health CareHouse District 116 - Representative Trey Martinez Fischer
County
2014-2017 New Local Tax
Revenue (Adult Expansion)
2011 County Indigent
Healthcare & Unreimbursed Jail Healthcare
Costs
2011 Total Hospital District or City/County Unreimbursed
Healthcare Expenditures
2010 Total Hospital Charity
Care Costs
Total Unreimbursed Charity Care
Costs for Local Jurisdictions &
Hospitals
2014-2017 Adults Federal Funds
Limited Scenario
2014-2017 Adults Federal Funds
Moderate Scenario
2014-2017 Adults State
Funds Moderate Scenario
2014-2017 Adults Federal Funds
Enhanced Scenario
Statewide Total 2,101,392,352$ 258,927,030$ 2,544,037,688$ 1,836,673,862$ 4,380,711,550$ 14,274,023,031$ 22,962,552,386$ 1,283,318,611$ 31,030,479,514$
District Total 13,042,188$ 45,050$ 28,603,600$ 13,612,285$ 42,215,884$ 107,527,651$ 172,979,216$ 9,667,368$ 233,755,723$ Bexar (10%) 13,042,188$ 45,050$ 28,603,600$ 13,612,285$ 42,215,884$ 107,527,651$ 172,979,216$ 9,667,368$ 233,755,723$
ANALYSIS BY BILLY HAMILTON CONSULTING
Extending Medicaid to Low-Income Adults Will Save Local Tax Dollars and Grow the Economy
Download this one-pager at www.texasimpact.org/Local-Taxpayers-Win-With-Medicaid Download the full report at www.mhm.org
Download the executive summary at www.texasimpact.org
For more information about the report, “Smart, Affordable and Fair” call Texas Impact at 512/472-3903 or email [email protected]

Impact of Medicaid Extension and Local Spending for Health CareHouse District 116 - Representative Trey Martinez Fischer
County
2016 Adults <138% FPL Enrollees Moderate Scenario
2016 Adults Federal Funds
Moderate Scenario
2016 Adults State Funds Moderate Scenario
2016 Adults All Funds Moderate Scenario
2016 Children <200% FPL Enrollees Moderate Scenario
2016 Children Federal Funds
Moderate Scenario
2016 Children State Funds Moderate Scenario
2016 Children All Funds Moderate Scenario
2016 Adults & Children
All Funds Moderate Scenario
Statewide Total 1,004,771 7,615,086,733$ 292,887,951$ 7,907,974,684$ 550,189 1,500,495,384$ 769,325,576$ 2,269,820,960$ 10,177,795,644$
District Total 7,569 57,365,214$ 2,206,354$ 59,571,569$ 3,827 10,437,210$ 5,351,308$ 15,788,518$ 75,360,087$ Bexar (10%) 7,569 57,365,214$ 2,206,354$ 59,571,569$ 3,827 10,437,210$ 5,351,308$ 15,788,518$ 75,360,087$ Note: New local tax revenues are an allocation of the statewide estimate based on the county share of state personal income and further allocated in partial counties according to the share of county population. Variations in personal income or the concentration of direct health care spending in parts of counties could alter these allocations. Remaining columns reflect allocations of statewide estimates according to the county share of adults below 138% FPL or children below 200% FPL, as applicable, and further allocated for partial counties according to the share of the county's total population. Variations in percentages of adults below 138% FPL and children below 200% FPL could alter these estimates. Hospital charity cost data exclude certain hospitals, such as those exempt from reporting, hospitals that report by system, and others, resulting in a conservative estimate of unreimbursed charity costs. Medicaid extension to adults would not relieve all local unreimbursed costs due to ineligible adults, such as undocumented immigrants, people served with incomes above 138% FPL or health care for incarcerated adults other than inpatient hospital stays. 2016 is the first full year of implementation; the federal match rate falls to 95 percent in 2017 and to 90 percent by 2020. For full county-level data, see Appendix C, and for further notes and cautions in interpreting these data, see Appendix A, in "Smart, Affordable and Fair: Why Texas Should Extend Medicaid to Low-Income Adults," at http://www.mhm.org/images/stories/advocacy_and_public_policy/Smart%20Affordable%20and%20Fair_FNL_FULL.pdf.

Impact of Medicaid Extension and Local Spending for Health CareHouse District 117 - Representative Philip Cortez
County
2014-2017 New Local Tax
Revenue (Adult Expansion)
2011 County Indigent
Healthcare & Unreimbursed Jail Healthcare
Costs
2011 Total Hospital District or City/County Unreimbursed
Healthcare Expenditures
2010 Total Hospital Charity
Care Costs
Total Unreimbursed Charity Care
Costs for Local Jurisdictions &
Hospitals
2014-2017 Adults Federal Funds
Limited Scenario
2014-2017 Adults Federal Funds
Moderate Scenario
2014-2017 Adults State
Funds Moderate Scenario
2014-2017 Adults Federal Funds
Enhanced Scenario
Statewide Total 2,101,392,352$ 258,927,030$ 2,544,037,688$ 1,836,673,862$ 4,380,711,550$ 14,274,023,031$ 22,962,552,386$ 1,283,318,611$ 31,030,479,514$
District Total 12,831,415$ 44,322$ 28,141,339$ 13,392,298$ 41,533,637$ 105,789,905$ 170,183,713$ 9,511,135$ 229,978,015$ Bexar (10%) 12,831,415$ 44,322$ 28,141,339$ 13,392,298$ 41,533,637$ 105,789,905$ 170,183,713$ 9,511,135$ 229,978,015$
ANALYSIS BY BILLY HAMILTON CONSULTING
Extending Medicaid to Low-Income Adults Will Save Local Tax Dollars and Grow the Economy
Download this one-pager at www.texasimpact.org/Local-Taxpayers-Win-With-Medicaid Download the full report at www.mhm.org
Download the executive summary at www.texasimpact.org
For more information about the report, “Smart, Affordable and Fair” call Texas Impact at 512/472-3903 or email [email protected]

Impact of Medicaid Extension and Local Spending for Health CareHouse District 117 - Representative Philip Cortez
County
2016 Adults <138% FPL Enrollees Moderate Scenario
2016 Adults Federal Funds
Moderate Scenario
2016 Adults State Funds Moderate Scenario
2016 Adults All Funds Moderate Scenario
2016 Children <200% FPL Enrollees Moderate Scenario
2016 Children Federal Funds
Moderate Scenario
2016 Children State Funds Moderate Scenario
2016 Children All Funds Moderate Scenario
2016 Adults & Children
All Funds Moderate Scenario
Statewide Total 1,004,771 7,615,086,733$ 292,887,951$ 7,907,974,684$ 550,189 1,500,495,384$ 769,325,576$ 2,269,820,960$ 10,177,795,644$
District Total 7,447 56,438,139$ 2,170,698$ 58,608,837$ 3,765 10,268,535$ 5,264,826$ 15,533,361$ 74,142,198$ Bexar (10%) 7,447 56,438,139$ 2,170,698$ 58,608,837$ 3,765 10,268,535$ 5,264,826$ 15,533,361$ 74,142,198$ Note: New local tax revenues are an allocation of the statewide estimate based on the county share of state personal income and further allocated in partial counties according to the share of county population. Variations in personal income or the concentration of direct health care spending in parts of counties could alter these allocations. Remaining columns reflect allocations of statewide estimates according to the county share of adults below 138% FPL or children below 200% FPL, as applicable, and further allocated for partial counties according to the share of the county's total population. Variations in percentages of adults below 138% FPL and children below 200% FPL could alter these estimates. Hospital charity cost data exclude certain hospitals, such as those exempt from reporting, hospitals that report by system, and others, resulting in a conservative estimate of unreimbursed charity costs. Medicaid extension to adults would not relieve all local unreimbursed costs due to ineligible adults, such as undocumented immigrants, people served with incomes above 138% FPL or health care for incarcerated adults other than inpatient hospital stays. 2016 is the first full year of implementation; the federal match rate falls to 95 percent in 2017 and to 90 percent by 2020. For full county-level data, see Appendix C, and for further notes and cautions in interpreting these data, see Appendix A, in "Smart, Affordable and Fair: Why Texas Should Extend Medicaid to Low-Income Adults," at http://www.mhm.org/images/stories/advocacy_and_public_policy/Smart%20Affordable%20and%20Fair_FNL_FULL.pdf.

Impact of Medicaid Extension and Local Spending for Health CareHouse District 118 - Representative Joe Farias
County
2014-2017 New Local Tax
Revenue (Adult Expansion)
2011 County Indigent
Healthcare & Unreimbursed Jail Healthcare
Costs
2011 Total Hospital District or City/County Unreimbursed
Healthcare Expenditures
2010 Total Hospital Charity
Care Costs
Total Unreimbursed Charity Care
Costs for Local Jurisdictions &
Hospitals
2014-2017 Adults Federal Funds
Limited Scenario
2014-2017 Adults Federal Funds
Moderate Scenario
2014-2017 Adults State
Funds Moderate Scenario
2014-2017 Adults Federal Funds
Enhanced Scenario
Statewide Total 2,101,392,352$ 258,927,030$ 2,544,037,688$ 1,836,673,862$ 4,380,711,550$ 14,274,023,031$ 22,962,552,386$ 1,283,318,611$ 31,030,479,514$
District Total 12,507,686$ 43,204$ 27,431,350$ 13,054,418$ 40,485,768$ 103,120,888$ 165,890,078$ 9,271,174$ 224,175,805$ Bexar (10%) 12,507,686$ 43,204$ 27,431,350$ 13,054,418$ 40,485,768$ 103,120,888$ 165,890,078$ 9,271,174$ 224,175,805$
ANALYSIS BY BILLY HAMILTON CONSULTING
Extending Medicaid to Low-Income Adults Will Save Local Tax Dollars and Grow the Economy
Download this one-pager at www.texasimpact.org/Local-Taxpayers-Win-With-Medicaid Download the full report at www.mhm.org
Download the executive summary at www.texasimpact.org
For more information about the report, “Smart, Affordable and Fair” call Texas Impact at 512/472-3903 or email [email protected]

Impact of Medicaid Extension and Local Spending for Health CareHouse District 118 - Representative Joe Farias
County
2016 Adults <138% FPL Enrollees Moderate Scenario
2016 Adults Federal Funds
Moderate Scenario
2016 Adults State Funds Moderate Scenario
2016 Adults All Funds Moderate Scenario
2016 Children <200% FPL Enrollees Moderate Scenario
2016 Children Federal Funds
Moderate Scenario
2016 Children State Funds Moderate Scenario
2016 Children All Funds Moderate Scenario
2016 Adults & Children
All Funds Moderate Scenario
Statewide Total 1,004,771 7,615,086,733$ 292,887,951$ 7,907,974,684$ 550,189 1,500,495,384$ 769,325,576$ 2,269,820,960$ 10,177,795,644$
District Total 7,259 55,014,238$ 2,115,932$ 57,130,171$ 3,670 10,009,466$ 5,131,997$ 15,141,464$ 72,271,634$ Bexar (10%) 7,259 55,014,238$ 2,115,932$ 57,130,171$ 3,670 10,009,466$ 5,131,997$ 15,141,464$ 72,271,634$ Note: New local tax revenues are an allocation of the statewide estimate based on the county share of state personal income and further allocated in partial counties according to the share of county population. Variations in personal income or the concentration of direct health care spending in parts of counties could alter these allocations. Remaining columns reflect allocations of statewide estimates according to the county share of adults below 138% FPL or children below 200% FPL, as applicable, and further allocated for partial counties according to the share of the county's total population. Variations in percentages of adults below 138% FPL and children below 200% FPL could alter these estimates. Hospital charity cost data exclude certain hospitals, such as those exempt from reporting, hospitals that report by system, and others, resulting in a conservative estimate of unreimbursed charity costs. Medicaid extension to adults would not relieve all local unreimbursed costs due to ineligible adults, such as undocumented immigrants, people served with incomes above 138% FPL or health care for incarcerated adults other than inpatient hospital stays. 2016 is the first full year of implementation; the federal match rate falls to 95 percent in 2017 and to 90 percent by 2020. For full county-level data, see Appendix C, and for further notes and cautions in interpreting these data, see Appendix A, in "Smart, Affordable and Fair: Why Texas Should Extend Medicaid to Low-Income Adults," at http://www.mhm.org/images/stories/advocacy_and_public_policy/Smart%20Affordable%20and%20Fair_FNL_FULL.pdf.

Impact of Medicaid Extension and Local Spending for Health CareHouse District 119 - Representative Roland Gutierrez
County
2014-2017 New Local Tax
Revenue (Adult Expansion)
2011 County Indigent
Healthcare & Unreimbursed Jail Healthcare
Costs
2011 Total Hospital District or City/County Unreimbursed
Healthcare Expenditures
2010 Total Hospital Charity
Care Costs
Total Unreimbursed Charity Care
Costs for Local Jurisdictions &
Hospitals
2014-2017 Adults Federal Funds
Limited Scenario
2014-2017 Adults Federal Funds
Moderate Scenario
2014-2017 Adults State
Funds Moderate Scenario
2014-2017 Adults Federal Funds
Enhanced Scenario
Statewide Total 2,101,392,352$ 258,927,030$ 2,544,037,688$ 1,836,673,862$ 4,380,711,550$ 14,274,023,031$ 22,962,552,386$ 1,283,318,611$ 31,030,479,514$
District Total 12,168,820$ 42,033$ 26,688,163$ 12,700,740$ 39,388,903$ 100,327,074$ 161,395,683$ 9,019,994$ 218,102,298$ Bexar (9%) 12,168,820$ 42,033$ 26,688,163$ 12,700,740$ 39,388,903$ 100,327,074$ 161,395,683$ 9,019,994$ 218,102,298$
ANALYSIS BY BILLY HAMILTON CONSULTING
Extending Medicaid to Low-Income Adults Will Save Local Tax Dollars and Grow the Economy
Download this one-pager at www.texasimpact.org/Local-Taxpayers-Win-With-Medicaid Download the full report at www.mhm.org
Download the executive summary at www.texasimpact.org
For more information about the report, “Smart, Affordable and Fair” call Texas Impact at 512/472-3903 or email [email protected]

Impact of Medicaid Extension and Local Spending for Health CareHouse District 119 - Representative Roland Gutierrez
County
2016 Adults <138% FPL Enrollees Moderate Scenario
2016 Adults Federal Funds
Moderate Scenario
2016 Adults State Funds Moderate Scenario
2016 Adults All Funds Moderate Scenario
2016 Children <200% FPL Enrollees Moderate Scenario
2016 Children Federal Funds
Moderate Scenario
2016 Children State Funds Moderate Scenario
2016 Children All Funds Moderate Scenario
2016 Adults & Children
All Funds Moderate Scenario
Statewide Total 1,004,771 7,615,086,733$ 292,887,951$ 7,907,974,684$ 550,189 1,500,495,384$ 769,325,576$ 2,269,820,960$ 10,177,795,644$
District Total 7,062 53,523,759$ 2,058,606$ 55,582,365$ 3,571 9,738,284$ 4,992,958$ 14,731,242$ 70,313,607$ Bexar (9%) 7,062 53,523,759$ 2,058,606$ 55,582,365$ 3,571 9,738,284$ 4,992,958$ 14,731,242$ 70,313,607$ Note: New local tax revenues are an allocation of the statewide estimate based on the county share of state personal income and further allocated in partial counties according to the share of county population. Variations in personal income or the concentration of direct health care spending in parts of counties could alter these allocations. Remaining columns reflect allocations of statewide estimates according to the county share of adults below 138% FPL or children below 200% FPL, as applicable, and further allocated for partial counties according to the share of the county's total population. Variations in percentages of adults below 138% FPL and children below 200% FPL could alter these estimates. Hospital charity cost data exclude certain hospitals, such as those exempt from reporting, hospitals that report by system, and others, resulting in a conservative estimate of unreimbursed charity costs. Medicaid extension to adults would not relieve all local unreimbursed costs due to ineligible adults, such as undocumented immigrants, people served with incomes above 138% FPL or health care for incarcerated adults other than inpatient hospital stays. 2016 is the first full year of implementation; the federal match rate falls to 95 percent in 2017 and to 90 percent by 2020. For full county-level data, see Appendix C, and for further notes and cautions in interpreting these data, see Appendix A, in "Smart, Affordable and Fair: Why Texas Should Extend Medicaid to Low-Income Adults," at http://www.mhm.org/images/stories/advocacy_and_public_policy/Smart%20Affordable%20and%20Fair_FNL_FULL.pdf.

Impact of Medicaid Extension and Local Spending for Health CareHouse District 120 - Representative Ruth Jones McClendon
County
2014-2017 New Local Tax
Revenue (Adult Expansion)
2011 County Indigent
Healthcare & Unreimbursed Jail Healthcare
Costs
2011 Total Hospital District or City/County Unreimbursed
Healthcare Expenditures
2010 Total Hospital Charity
Care Costs
Total Unreimbursed Charity Care
Costs for Local Jurisdictions &
Hospitals
2014-2017 Adults Federal Funds
Limited Scenario
2014-2017 Adults Federal Funds
Moderate Scenario
2014-2017 Adults State
Funds Moderate Scenario
2014-2017 Adults Federal Funds
Enhanced Scenario
Statewide Total 2,101,392,352$ 258,927,030$ 2,544,037,688$ 1,836,673,862$ 4,380,711,550$ 14,274,023,031$ 22,962,552,386$ 1,283,318,611$ 31,030,479,514$
District Total 13,321,268$ 46,014$ 29,215,665$ 13,903,563$ 43,119,228$ 109,828,549$ 176,680,661$ 9,874,232$ 238,757,675$ Bexar (10%) 13,321,268$ 46,014$ 29,215,665$ 13,903,563$ 43,119,228$ 109,828,549$ 176,680,661$ 9,874,232$ 238,757,675$
ANALYSIS BY BILLY HAMILTON CONSULTING
Extending Medicaid to Low-Income Adults Will Save Local Tax Dollars and Grow the Economy
Download this one-pager at www.texasimpact.org/Local-Taxpayers-Win-With-Medicaid Download the full report at www.mhm.org
Download the executive summary at www.texasimpact.org
For more information about the report, “Smart, Affordable and Fair” call Texas Impact at 512/472-3903 or email [email protected]

Impact of Medicaid Extension and Local Spending for Health CareHouse District 120 - Representative Ruth Jones McClendon
County
2016 Adults <138% FPL Enrollees Moderate Scenario
2016 Adults Federal Funds
Moderate Scenario
2016 Adults State Funds Moderate Scenario
2016 Adults All Funds Moderate Scenario
2016 Children <200% FPL Enrollees Moderate Scenario
2016 Children Federal Funds
Moderate Scenario
2016 Children State Funds Moderate Scenario
2016 Children All Funds Moderate Scenario
2016 Adults & Children
All Funds Moderate Scenario
Statewide Total 1,004,771 7,615,086,733$ 292,887,951$ 7,907,974,684$ 550,189 1,500,495,384$ 769,325,576$ 2,269,820,960$ 10,177,795,644$
District Total 7,731 58,592,727$ 2,253,566$ 60,846,293$ 3,909 10,660,548$ 5,465,816$ 16,126,364$ 76,972,657$ Bexar (10%) 7,731 58,592,727$ 2,253,566$ 60,846,293$ 3,909 10,660,548$ 5,465,816$ 16,126,364$ 76,972,657$ Note: New local tax revenues are an allocation of the statewide estimate based on the county share of state personal income and further allocated in partial counties according to the share of county population. Variations in personal income or the concentration of direct health care spending in parts of counties could alter these allocations. Remaining columns reflect allocations of statewide estimates according to the county share of adults below 138% FPL or children below 200% FPL, as applicable, and further allocated for partial counties according to the share of the county's total population. Variations in percentages of adults below 138% FPL and children below 200% FPL could alter these estimates. Hospital charity cost data exclude certain hospitals, such as those exempt from reporting, hospitals that report by system, and others, resulting in a conservative estimate of unreimbursed charity costs. Medicaid extension to adults would not relieve all local unreimbursed costs due to ineligible adults, such as undocumented immigrants, people served with incomes above 138% FPL or health care for incarcerated adults other than inpatient hospital stays. 2016 is the first full year of implementation; the federal match rate falls to 95 percent in 2017 and to 90 percent by 2020. For full county-level data, see Appendix C, and for further notes and cautions in interpreting these data, see Appendix A, in "Smart, Affordable and Fair: Why Texas Should Extend Medicaid to Low-Income Adults," at http://www.mhm.org/images/stories/advocacy_and_public_policy/Smart%20Affordable%20and%20Fair_FNL_FULL.pdf.

Impact of Medicaid Extension and Local Spending for Health CareHouse District 121 - Representative Joe Straus
County
2014-2017 New Local Tax
Revenue (Adult Expansion)
2011 County Indigent
Healthcare & Unreimbursed Jail Healthcare
Costs
2011 Total Hospital District or City/County Unreimbursed
Healthcare Expenditures
2010 Total Hospital Charity
Care Costs
Total Unreimbursed Charity Care
Costs for Local Jurisdictions &
Hospitals
2014-2017 Adults Federal Funds
Limited Scenario
2014-2017 Adults Federal Funds
Moderate Scenario
2014-2017 Adults State
Funds Moderate Scenario
2014-2017 Adults Federal Funds
Enhanced Scenario
Statewide Total 2,101,392,352$ 258,927,030$ 2,544,037,688$ 1,836,673,862$ 4,380,711,550$ 14,274,023,031$ 22,962,552,386$ 1,283,318,611$ 31,030,479,514$
District Total 13,301,111$ 45,945$ 29,171,458$ 13,882,525$ 43,053,983$ 109,662,363$ 176,413,317$ 9,859,291$ 238,396,400$ Bexar (10%) 13,301,111$ 45,945$ 29,171,458$ 13,882,525$ 43,053,983$ 109,662,363$ 176,413,317$ 9,859,291$ 238,396,400$
ANALYSIS BY BILLY HAMILTON CONSULTING
Extending Medicaid to Low-Income Adults Will Save Local Tax Dollars and Grow the Economy
Download this one-pager at www.texasimpact.org/Local-Taxpayers-Win-With-Medicaid Download the full report at www.mhm.org
Download the executive summary at www.texasimpact.org
For more information about the report, “Smart, Affordable and Fair” call Texas Impact at 512/472-3903 or email [email protected]

Impact of Medicaid Extension and Local Spending for Health CareHouse District 121 - Representative Joe Straus
County
2016 Adults <138% FPL Enrollees Moderate Scenario
2016 Adults Federal Funds
Moderate Scenario
2016 Adults State Funds Moderate Scenario
2016 Adults All Funds Moderate Scenario
2016 Children <200% FPL Enrollees Moderate Scenario
2016 Children Federal Funds
Moderate Scenario
2016 Children State Funds Moderate Scenario
2016 Children All Funds Moderate Scenario
2016 Adults & Children
All Funds Moderate Scenario
Statewide Total 1,004,771 7,615,086,733$ 292,887,951$ 7,907,974,684$ 550,189 1,500,495,384$ 769,325,576$ 2,269,820,960$ 10,177,795,644$
District Total 7,719 58,504,067$ 2,250,156$ 60,754,224$ 3,903 10,644,417$ 5,457,546$ 16,101,963$ 76,856,186$ Bexar (10%) 7,719 58,504,067$ 2,250,156$ 60,754,224$ 3,903 10,644,417$ 5,457,546$ 16,101,963$ 76,856,186$ Note: New local tax revenues are an allocation of the statewide estimate based on the county share of state personal income and further allocated in partial counties according to the share of county population. Variations in personal income or the concentration of direct health care spending in parts of counties could alter these allocations. Remaining columns reflect allocations of statewide estimates according to the county share of adults below 138% FPL or children below 200% FPL, as applicable, and further allocated for partial counties according to the share of the county's total population. Variations in percentages of adults below 138% FPL and children below 200% FPL could alter these estimates. Hospital charity cost data exclude certain hospitals, such as those exempt from reporting, hospitals that report by system, and others, resulting in a conservative estimate of unreimbursed charity costs. Medicaid extension to adults would not relieve all local unreimbursed costs due to ineligible adults, such as undocumented immigrants, people served with incomes above 138% FPL or health care for incarcerated adults other than inpatient hospital stays. 2016 is the first full year of implementation; the federal match rate falls to 95 percent in 2017 and to 90 percent by 2020. For full county-level data, see Appendix C, and for further notes and cautions in interpreting these data, see Appendix A, in "Smart, Affordable and Fair: Why Texas Should Extend Medicaid to Low-Income Adults," at http://www.mhm.org/images/stories/advocacy_and_public_policy/Smart%20Affordable%20and%20Fair_FNL_FULL.pdf.

Impact of Medicaid Extension and Local Spending for Health CareHouse District 122 - Representative Lyle Larson
County
2014-2017 New Local Tax
Revenue (Adult Expansion)
2011 County Indigent
Healthcare & Unreimbursed Jail Healthcare
Costs
2011 Total Hospital District or City/County Unreimbursed
Healthcare Expenditures
2010 Total Hospital Charity
Care Costs
Total Unreimbursed Charity Care
Costs for Local Jurisdictions &
Hospitals
2014-2017 Adults Federal Funds
Limited Scenario
2014-2017 Adults Federal Funds
Moderate Scenario
2014-2017 Adults State
Funds Moderate Scenario
2014-2017 Adults Federal Funds
Enhanced Scenario
Statewide Total 2,101,392,352$ 258,927,030$ 2,544,037,688$ 1,836,673,862$ 4,380,711,550$ 14,274,023,031$ 22,962,552,386$ 1,283,318,611$ 31,030,479,514$
District Total 13,325,223$ 46,028$ 29,224,340$ 13,907,691$ 43,132,031$ 109,861,160$ 176,733,120$ 9,877,164$ 238,828,567$ Bexar (10%) 13,325,223$ 46,028$ 29,224,340$ 13,907,691$ 43,132,031$ 109,861,160$ 176,733,120$ 9,877,164$ 238,828,567$
ANALYSIS BY BILLY HAMILTON CONSULTING
Extending Medicaid to Low-Income Adults Will Save Local Tax Dollars and Grow the Economy
Download this one-pager at www.texasimpact.org/Local-Taxpayers-Win-With-Medicaid Download the full report at www.mhm.org
Download the executive summary at www.texasimpact.org
For more information about the report, “Smart, Affordable and Fair” call Texas Impact at 512/472-3903 or email [email protected]

Impact of Medicaid Extension and Local Spending for Health CareHouse District 122 - Representative Lyle Larson
County
2016 Adults <138% FPL Enrollees Moderate Scenario
2016 Adults Federal Funds
Moderate Scenario
2016 Adults State Funds Moderate Scenario
2016 Adults All Funds Moderate Scenario
2016 Children <200% FPL Enrollees Moderate Scenario
2016 Children Federal Funds
Moderate Scenario
2016 Children State Funds Moderate Scenario
2016 Children All Funds Moderate Scenario
2016 Adults & Children
All Funds Moderate Scenario
Statewide Total 1,004,771 7,615,086,733$ 292,887,951$ 7,907,974,684$ 550,189 1,500,495,384$ 769,325,576$ 2,269,820,960$ 10,177,795,644$
District Total 7,733 58,610,124$ 2,254,236$ 60,864,359$ 3,910 10,663,713$ 5,467,439$ 16,131,152$ 76,995,512$ Bexar (10%) 7,733 58,610,124$ 2,254,236$ 60,864,359$ 3,910 10,663,713$ 5,467,439$ 16,131,152$ 76,995,512$ Note: New local tax revenues are an allocation of the statewide estimate based on the county share of state personal income and further allocated in partial counties according to the share of county population. Variations in personal income or the concentration of direct health care spending in parts of counties could alter these allocations. Remaining columns reflect allocations of statewide estimates according to the county share of adults below 138% FPL or children below 200% FPL, as applicable, and further allocated for partial counties according to the share of the county's total population. Variations in percentages of adults below 138% FPL and children below 200% FPL could alter these estimates. Hospital charity cost data exclude certain hospitals, such as those exempt from reporting, hospitals that report by system, and others, resulting in a conservative estimate of unreimbursed charity costs. Medicaid extension to adults would not relieve all local unreimbursed costs due to ineligible adults, such as undocumented immigrants, people served with incomes above 138% FPL or health care for incarcerated adults other than inpatient hospital stays. 2016 is the first full year of implementation; the federal match rate falls to 95 percent in 2017 and to 90 percent by 2020. For full county-level data, see Appendix C, and for further notes and cautions in interpreting these data, see Appendix A, in "Smart, Affordable and Fair: Why Texas Should Extend Medicaid to Low-Income Adults," at http://www.mhm.org/images/stories/advocacy_and_public_policy/Smart%20Affordable%20and%20Fair_FNL_FULL.pdf.

Impact of Medicaid Extension and Local Spending for Health CareHouse District 123 - Representative Mike Villarreal
County
2014-2017 New Local Tax
Revenue (Adult Expansion)
2011 County Indigent
Healthcare & Unreimbursed Jail Healthcare
Costs
2011 Total Hospital District or City/County Unreimbursed
Healthcare Expenditures
2010 Total Hospital Charity
Care Costs
Total Unreimbursed Charity Care
Costs for Local Jurisdictions &
Hospitals
2014-2017 Adults Federal Funds
Limited Scenario
2014-2017 Adults Federal Funds
Moderate Scenario
2014-2017 Adults State
Funds Moderate Scenario
2014-2017 Adults Federal Funds
Enhanced Scenario
Statewide Total 2,101,392,352$ 258,927,030$ 2,544,037,688$ 1,836,673,862$ 4,380,711,550$ 14,274,023,031$ 22,962,552,386$ 1,283,318,611$ 31,030,479,514$
District Total 13,362,495$ 46,157$ 29,306,082$ 13,946,592$ 43,252,674$ 110,168,448$ 177,227,453$ 9,904,791$ 239,496,584$ Bexar (10%) 13,362,495$ 46,157$ 29,306,082$ 13,946,592$ 43,252,674$ 110,168,448$ 177,227,453$ 9,904,791$ 239,496,584$
ANALYSIS BY BILLY HAMILTON CONSULTING
Extending Medicaid to Low-Income Adults Will Save Local Tax Dollars and Grow the Economy
Download this one-pager at www.texasimpact.org/Local-Taxpayers-Win-With-Medicaid Download the full report at www.mhm.org
Download the executive summary at www.texasimpact.org
For more information about the report, “Smart, Affordable and Fair” call Texas Impact at 512/472-3903 or email [email protected]

Impact of Medicaid Extension and Local Spending for Health CareHouse District 123 - Representative Mike Villarreal
County
2016 Adults <138% FPL Enrollees Moderate Scenario
2016 Adults Federal Funds
Moderate Scenario
2016 Adults State Funds Moderate Scenario
2016 Adults All Funds Moderate Scenario
2016 Children <200% FPL Enrollees Moderate Scenario
2016 Children Federal Funds
Moderate Scenario
2016 Children State Funds Moderate Scenario
2016 Children All Funds Moderate Scenario
2016 Adults & Children
All Funds Moderate Scenario
Statewide Total 1,004,771 7,615,086,733$ 292,887,951$ 7,907,974,684$ 550,189 1,500,495,384$ 769,325,576$ 2,269,820,960$ 10,177,795,644$
District Total 7,755 58,774,060$ 2,260,541$ 61,034,601$ 3,921 10,693,540$ 5,482,732$ 16,176,272$ 77,210,873$ Bexar (10%) 7,755 58,774,060$ 2,260,541$ 61,034,601$ 3,921 10,693,540$ 5,482,732$ 16,176,272$ 77,210,873$ Note: New local tax revenues are an allocation of the statewide estimate based on the county share of state personal income and further allocated in partial counties according to the share of county population. Variations in personal income or the concentration of direct health care spending in parts of counties could alter these allocations. Remaining columns reflect allocations of statewide estimates according to the county share of adults below 138% FPL or children below 200% FPL, as applicable, and further allocated for partial counties according to the share of the county's total population. Variations in percentages of adults below 138% FPL and children below 200% FPL could alter these estimates. Hospital charity cost data exclude certain hospitals, such as those exempt from reporting, hospitals that report by system, and others, resulting in a conservative estimate of unreimbursed charity costs. Medicaid extension to adults would not relieve all local unreimbursed costs due to ineligible adults, such as undocumented immigrants, people served with incomes above 138% FPL or health care for incarcerated adults other than inpatient hospital stays. 2016 is the first full year of implementation; the federal match rate falls to 95 percent in 2017 and to 90 percent by 2020. For full county-level data, see Appendix C, and for further notes and cautions in interpreting these data, see Appendix A, in "Smart, Affordable and Fair: Why Texas Should Extend Medicaid to Low-Income Adults," at http://www.mhm.org/images/stories/advocacy_and_public_policy/Smart%20Affordable%20and%20Fair_FNL_FULL.pdf.
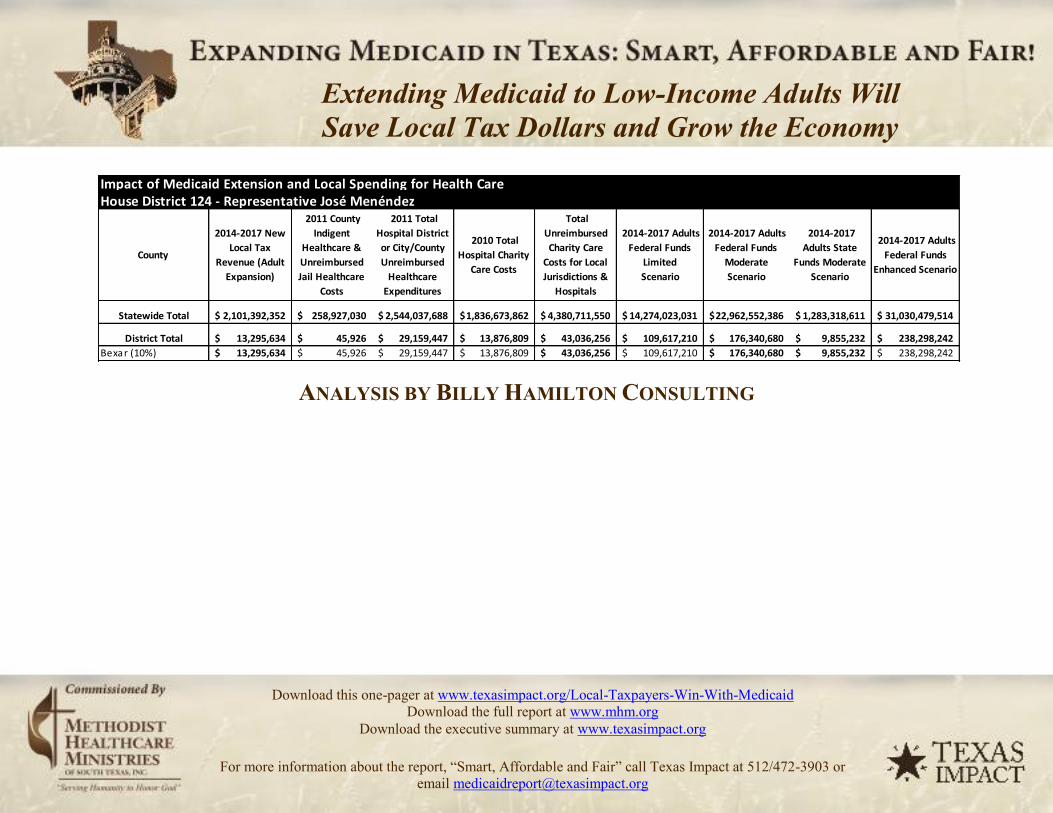
Impact of Medicaid Extension and Local Spending for Health CareHouse District 124 - Representative José Menéndez
County
2014-2017 New Local Tax
Revenue (Adult Expansion)
2011 County Indigent
Healthcare & Unreimbursed Jail Healthcare
Costs
2011 Total Hospital District or City/County Unreimbursed
Healthcare Expenditures
2010 Total Hospital Charity
Care Costs
Total Unreimbursed Charity Care
Costs for Local Jurisdictions &
Hospitals
2014-2017 Adults Federal Funds
Limited Scenario
2014-2017 Adults Federal Funds
Moderate Scenario
2014-2017 Adults State
Funds Moderate Scenario
2014-2017 Adults Federal Funds
Enhanced Scenario
Statewide Total 2,101,392,352$ 258,927,030$ 2,544,037,688$ 1,836,673,862$ 4,380,711,550$ 14,274,023,031$ 22,962,552,386$ 1,283,318,611$ 31,030,479,514$
District Total 13,295,634$ 45,926$ 29,159,447$ 13,876,809$ 43,036,256$ 109,617,210$ 176,340,680$ 9,855,232$ 238,298,242$ Bexar (10%) 13,295,634$ 45,926$ 29,159,447$ 13,876,809$ 43,036,256$ 109,617,210$ 176,340,680$ 9,855,232$ 238,298,242$
ANALYSIS BY BILLY HAMILTON CONSULTING
Extending Medicaid to Low-Income Adults Will Save Local Tax Dollars and Grow the Economy
Download this one-pager at www.texasimpact.org/Local-Taxpayers-Win-With-Medicaid Download the full report at www.mhm.org
Download the executive summary at www.texasimpact.org
For more information about the report, “Smart, Affordable and Fair” call Texas Impact at 512/472-3903 or email [email protected]

Impact of Medicaid Extension and Local Spending for Health CareHouse District 124 - Representative José Menéndez
County
2016 Adults <138% FPL Enrollees Moderate Scenario
2016 Adults Federal Funds
Moderate Scenario
2016 Adults State Funds Moderate Scenario
2016 Adults All Funds Moderate Scenario
2016 Children <200% FPL Enrollees Moderate Scenario
2016 Children Federal Funds
Moderate Scenario
2016 Children State Funds Moderate Scenario
2016 Children All Funds Moderate Scenario
2016 Adults & Children
All Funds Moderate Scenario
Statewide Total 1,004,771 7,615,086,733$ 292,887,951$ 7,907,974,684$ 550,189 1,500,495,384$ 769,325,576$ 2,269,820,960$ 10,177,795,644$
District Total 7,716 58,479,979$ 2,249,230$ 60,729,209$ 3,901 10,640,034$ 5,455,299$ 16,095,333$ 76,824,541$ Bexar (10%) 7,716 58,479,979$ 2,249,230$ 60,729,209$ 3,901 10,640,034$ 5,455,299$ 16,095,333$ 76,824,541$ Note: New local tax revenues are an allocation of the statewide estimate based on the county share of state personal income and further allocated in partial counties according to the share of county population. Variations in personal income or the concentration of direct health care spending in parts of counties could alter these allocations. Remaining columns reflect allocations of statewide estimates according to the county share of adults below 138% FPL or children below 200% FPL, as applicable, and further allocated for partial counties according to the share of the county's total population. Variations in percentages of adults below 138% FPL and children below 200% FPL could alter these estimates. Hospital charity cost data exclude certain hospitals, such as those exempt from reporting, hospitals that report by system, and others, resulting in a conservative estimate of unreimbursed charity costs. Medicaid extension to adults would not relieve all local unreimbursed costs due to ineligible adults, such as undocumented immigrants, people served with incomes above 138% FPL or health care for incarcerated adults other than inpatient hospital stays. 2016 is the first full year of implementation; the federal match rate falls to 95 percent in 2017 and to 90 percent by 2020. For full county-level data, see Appendix C, and for further notes and cautions in interpreting these data, see Appendix A, in "Smart, Affordable and Fair: Why Texas Should Extend Medicaid to Low-Income Adults," at http://www.mhm.org/images/stories/advocacy_and_public_policy/Smart%20Affordable%20and%20Fair_FNL_FULL.pdf.

Impact of Medicaid Extension and Local Spending for Health CareHouse District 125 - Representative Justin Rodriguez
County
2014-2017 New Local Tax
Revenue (Adult Expansion)
2011 County Indigent
Healthcare & Unreimbursed Jail Healthcare
Costs
2011 Total Hospital District or City/County Unreimbursed
Healthcare Expenditures
2010 Total Hospital Charity
Care Costs
Total Unreimbursed Charity Care
Costs for Local Jurisdictions &
Hospitals
2014-2017 Adults Federal Funds
Limited Scenario
2014-2017 Adults Federal Funds
Moderate Scenario
2014-2017 Adults State
Funds Moderate Scenario
2014-2017 Adults Federal Funds
Enhanced Scenario
Statewide Total 2,101,392,352$ 258,927,030$ 2,544,037,688$ 1,836,673,862$ 4,380,711,550$ 14,274,023,031$ 22,962,552,386$ 1,283,318,611$ 31,030,479,514$
District Total 13,276,922$ 45,861$ 29,118,409$ 13,857,279$ 42,975,688$ 109,462,939$ 176,092,505$ 9,841,362$ 237,962,870$ Bexar (10%) 13,276,922$ 45,861$ 29,118,409$ 13,857,279$ 42,975,688$ 109,462,939$ 176,092,505$ 9,841,362$ 237,962,870$
ANALYSIS BY BILLY HAMILTON CONSULTING
Extending Medicaid to Low-Income Adults Will Save Local Tax Dollars and Grow the Economy
Download this one-pager at www.texasimpact.org/Local-Taxpayers-Win-With-Medicaid Download the full report at www.mhm.org
Download the executive summary at www.texasimpact.org
For more information about the report, “Smart, Affordable and Fair” call Texas Impact at 512/472-3903 or email [email protected]

Impact of Medicaid Extension and Local Spending for Health CareHouse District 125 - Representative Justin Rodriguez
County
2016 Adults <138% FPL Enrollees Moderate Scenario
2016 Adults Federal Funds
Moderate Scenario
2016 Adults State Funds Moderate Scenario
2016 Adults All Funds Moderate Scenario
2016 Children <200% FPL Enrollees Moderate Scenario
2016 Children Federal Funds
Moderate Scenario
2016 Children State Funds Moderate Scenario
2016 Children All Funds Moderate Scenario
2016 Adults & Children
All Funds Moderate Scenario
Statewide Total 1,004,771 7,615,086,733$ 292,887,951$ 7,907,974,684$ 550,189 1,500,495,384$ 769,325,576$ 2,269,820,960$ 10,177,795,644$
District Total 7,705 58,397,676$ 2,246,064$ 60,643,741$ 3,896 10,625,060$ 5,447,621$ 16,072,681$ 76,716,421$ Bexar (10%) 7,705 58,397,676$ 2,246,064$ 60,643,741$ 3,896 10,625,060$ 5,447,621$ 16,072,681$ 76,716,421$ Note: New local tax revenues are an allocation of the statewide estimate based on the county share of state personal income and further allocated in partial counties according to the share of county population. Variations in personal income or the concentration of direct health care spending in parts of counties could alter these allocations. Remaining columns reflect allocations of statewide estimates according to the county share of adults below 138% FPL or children below 200% FPL, as applicable, and further allocated for partial counties according to the share of the county's total population. Variations in percentages of adults below 138% FPL and children below 200% FPL could alter these estimates. Hospital charity cost data exclude certain hospitals, such as those exempt from reporting, hospitals that report by system, and others, resulting in a conservative estimate of unreimbursed charity costs. Medicaid extension to adults would not relieve all local unreimbursed costs due to ineligible adults, such as undocumented immigrants, people served with incomes above 138% FPL or health care for incarcerated adults other than inpatient hospital stays. 2016 is the first full year of implementation; the federal match rate falls to 95 percent in 2017 and to 90 percent by 2020. For full county-level data, see Appendix C, and for further notes and cautions in interpreting these data, see Appendix A, in "Smart, Affordable and Fair: Why Texas Should Extend Medicaid to Low-Income Adults," at http://www.mhm.org/images/stories/advocacy_and_public_policy/Smart%20Affordable%20and%20Fair_FNL_FULL.pdf.

Impact of Medicaid Extension and Local Spending for Health CareHouse District 126 - Representative Patricia Harless
County
2014-2017 New Local Tax
Revenue (Adult Expansion)
2011 County Indigent
Healthcare & Unreimbursed Jail Healthcare
Costs
2011 Total Hospital District or City/County Unreimbursed
Healthcare Expenditures
2010 Total Hospital Charity
Care Costs
Total Unreimbursed Charity Care
Costs for Local Jurisdictions &
Hospitals
2014-2017 Adults Federal Funds
Limited Scenario
2014-2017 Adults Federal Funds
Moderate Scenario
2014-2017 Adults State
Funds Moderate Scenario
2014-2017 Adults Federal Funds
Enhanced Scenario
Statewide Total 2,101,392,352$ 258,927,030$ 2,544,037,688$ 1,836,673,862$ 4,380,711,550$ 14,274,023,031$ 22,962,552,386$ 1,283,318,611$ 31,030,479,514$
District Total 17,016,952$ 3,046,905$ 24,352,225$ 13,699,428$ 38,051,653$ 80,515,530$ 129,524,947$ 7,238,820$ 175,033,730$ Harris (4%) 17,016,952$ 3,046,905$ 24,352,225$ 13,699,428$ 38,051,653$ 80,515,530$ 129,524,947$ 7,238,820$ 175,033,730$
ANALYSIS BY BILLY HAMILTON CONSULTING
Extending Medicaid to Low-Income Adults Will Save Local Tax Dollars and Grow the Economy
Download this one-pager at www.texasimpact.org/Local-Taxpayers-Win-With-Medicaid Download the full report at www.mhm.org
Download the executive summary at www.texasimpact.org
For more information about the report, “Smart, Affordable and Fair” call Texas Impact at 512/472-3903 or email [email protected]

Impact of Medicaid Extension and Local Spending for Health CareHouse District 126 - Representative Patricia Harless
County
2016 Adults <138% FPL Enrollees Moderate Scenario
2016 Adults Federal Funds
Moderate Scenario
2016 Adults State Funds Moderate Scenario
2016 Adults All Funds Moderate Scenario
2016 Children <200% FPL Enrollees Moderate Scenario
2016 Children Federal Funds
Moderate Scenario
2016 Children State Funds Moderate Scenario
2016 Children All Funds Moderate Scenario
2016 Adults & Children
All Funds Moderate Scenario
Statewide Total 1,004,771 7,615,086,733$ 292,887,951$ 7,907,974,684$ 550,189 1,500,495,384$ 769,325,576$ 2,269,820,960$ 10,177,795,644$
District Total 5,668 42,954,445$ 1,652,094$ 44,606,539$ 3,995 10,895,312$ 5,586,183$ 16,481,495$ 61,088,035$ Harris (4%) 5,668 42,954,445$ 1,652,094$ 44,606,539$ 3,995 10,895,312$ 5,586,183$ 16,481,495$ 61,088,035$ Note: New local tax revenues are an allocation of the statewide estimate based on the county share of state personal income and further allocated in partial counties according to the share of county population. Variations in personal income or the concentration of direct health care spending in parts of counties could alter these allocations. Remaining columns reflect allocations of statewide estimates according to the county share of adults below 138% FPL or children below 200% FPL, as applicable, and further allocated for partial counties according to the share of the county's total population. Variations in percentages of adults below 138% FPL and children below 200% FPL could alter these estimates. Hospital charity cost data exclude certain hospitals, such as those exempt from reporting, hospitals that report by system, and others, resulting in a conservative estimate of unreimbursed charity costs. Medicaid extension to adults would not relieve all local unreimbursed costs due to ineligible adults, such as undocumented immigrants, people served with incomes above 138% FPL or health care for incarcerated adults other than inpatient hospital stays. 2016 is the first full year of implementation; the federal match rate falls to 95 percent in 2017 and to 90 percent by 2020. For full county-level data, see Appendix C, and for further notes and cautions in interpreting these data, see Appendix A, in "Smart, Affordable and Fair: Why Texas Should Extend Medicaid to Low-Income Adults," at http://www.mhm.org/images/stories/advocacy_and_public_policy/Smart%20Affordable%20and%20Fair_FNL_FULL.pdf.

Impact of Medicaid Extension and Local Spending for Health CareHouse District 127 - Representative Dan Huberty
County
2014-2017 New Local Tax
Revenue (Adult Expansion)
2011 County Indigent
Healthcare & Unreimbursed Jail Healthcare
Costs
2011 Total Hospital District or City/County Unreimbursed
Healthcare Expenditures
2010 Total Hospital Charity
Care Costs
Total Unreimbursed Charity Care
Costs for Local Jurisdictions &
Hospitals
2014-2017 Adults Federal Funds
Limited Scenario
2014-2017 Adults Federal Funds
Moderate Scenario
2014-2017 Adults State
Funds Moderate Scenario
2014-2017 Adults Federal Funds
Enhanced Scenario
Statewide Total 2,101,392,352$ 258,927,030$ 2,544,037,688$ 1,836,673,862$ 4,380,711,550$ 14,274,023,031$ 22,962,552,386$ 1,283,318,611$ 31,030,479,514$
District Total 16,486,806$ 2,951,982$ 23,593,556$ 13,272,636$ 36,866,192$ 78,007,150$ 125,489,727$ 7,013,301$ 169,580,731$ Harris (4%) 16,486,806$ 2,951,982$ 23,593,556$ 13,272,636$ 36,866,192$ 78,007,150$ 125,489,727$ 7,013,301$ 169,580,731$
ANALYSIS BY BILLY HAMILTON CONSULTING
Extending Medicaid to Low-Income Adults Will Save Local Tax Dollars and Grow the Economy
Download this one-pager at www.texasimpact.org/Local-Taxpayers-Win-With-Medicaid Download the full report at www.mhm.org
Download the executive summary at www.texasimpact.org
For more information about the report, “Smart, Affordable and Fair” call Texas Impact at 512/472-3903 or email [email protected]

Impact of Medicaid Extension and Local Spending for Health CareHouse District 127 - Representative Dan Huberty
County
2016 Adults <138% FPL Enrollees Moderate Scenario
2016 Adults Federal Funds
Moderate Scenario
2016 Adults State Funds Moderate Scenario
2016 Adults All Funds Moderate Scenario
2016 Children <200% FPL Enrollees Moderate Scenario
2016 Children Federal Funds
Moderate Scenario
2016 Children State Funds Moderate Scenario
2016 Children All Funds Moderate Scenario
2016 Adults & Children
All Funds Moderate Scenario
Statewide Total 1,004,771 7,615,086,733$ 292,887,951$ 7,907,974,684$ 550,189 1,500,495,384$ 769,325,576$ 2,269,820,960$ 10,177,795,644$
District Total 5,491 41,616,243$ 1,600,625$ 43,216,868$ 3,871 10,555,879$ 5,412,151$ 15,968,031$ 59,184,898$ Harris (4%) 5,491 41,616,243$ 1,600,625$ 43,216,868$ 3,871 10,555,879$ 5,412,151$ 15,968,031$ 59,184,898$ Note: New local tax revenues are an allocation of the statewide estimate based on the county share of state personal income and further allocated in partial counties according to the share of county population. Variations in personal income or the concentration of direct health care spending in parts of counties could alter these allocations. Remaining columns reflect allocations of statewide estimates according to the county share of adults below 138% FPL or children below 200% FPL, as applicable, and further allocated for partial counties according to the share of the county's total population. Variations in percentages of adults below 138% FPL and children below 200% FPL could alter these estimates. Hospital charity cost data exclude certain hospitals, such as those exempt from reporting, hospitals that report by system, and others, resulting in a conservative estimate of unreimbursed charity costs. Medicaid extension to adults would not relieve all local unreimbursed costs due to ineligible adults, such as undocumented immigrants, people served with incomes above 138% FPL or health care for incarcerated adults other than inpatient hospital stays. 2016 is the first full year of implementation; the federal match rate falls to 95 percent in 2017 and to 90 percent by 2020. For full county-level data, see Appendix C, and for further notes and cautions in interpreting these data, see Appendix A, in "Smart, Affordable and Fair: Why Texas Should Extend Medicaid to Low-Income Adults," at http://www.mhm.org/images/stories/advocacy_and_public_policy/Smart%20Affordable%20and%20Fair_FNL_FULL.pdf.

Impact of Medicaid Extension and Local Spending for Health CareHouse District 128 - Representative Wayne Smith
County
2014-2017 New Local Tax
Revenue (Adult Expansion)
2011 County Indigent
Healthcare & Unreimbursed Jail Healthcare
Costs
2011 Total Hospital District or City/County Unreimbursed
Healthcare Expenditures
2010 Total Hospital Charity
Care Costs
Total Unreimbursed Charity Care
Costs for Local Jurisdictions &
Hospitals
2014-2017 Adults Federal Funds
Limited Scenario
2014-2017 Adults Federal Funds
Moderate Scenario
2014-2017 Adults State
Funds Moderate Scenario
2014-2017 Adults Federal Funds
Enhanced Scenario
Statewide Total 2,101,392,352$ 258,927,030$ 2,544,037,688$ 1,836,673,862$ 4,380,711,550$ 14,274,023,031$ 22,962,552,386$ 1,283,318,611$ 31,030,479,514$
District Total 17,315,052$ 3,100,280$ 24,778,823$ 13,939,412$ 38,718,235$ 81,925,988$ 131,793,944$ 7,365,628$ 178,099,944$ Harris (4%) 17,315,052$ 3,100,280$ 24,778,823$ 13,939,412$ 38,718,235$ 81,925,988$ 131,793,944$ 7,365,628$ 178,099,944$
ANALYSIS BY BILLY HAMILTON CONSULTING
Extending Medicaid to Low-Income Adults Will Save Local Tax Dollars and Grow the Economy
Download this one-pager at www.texasimpact.org/Local-Taxpayers-Win-With-Medicaid Download the full report at www.mhm.org
Download the executive summary at www.texasimpact.org
For more information about the report, “Smart, Affordable and Fair” call Texas Impact at 512/472-3903 or email [email protected]

Impact of Medicaid Extension and Local Spending for Health CareHouse District 128 - Representative Wayne Smith
County
2016 Adults <138% FPL Enrollees Moderate Scenario
2016 Adults Federal Funds
Moderate Scenario
2016 Adults State Funds Moderate Scenario
2016 Adults All Funds Moderate Scenario
2016 Children <200% FPL Enrollees Moderate Scenario
2016 Children Federal Funds
Moderate Scenario
2016 Children State Funds Moderate Scenario
2016 Children All Funds Moderate Scenario
2016 Adults & Children
All Funds Moderate Scenario
Statewide Total 1,004,771 7,615,086,733$ 292,887,951$ 7,907,974,684$ 550,189 1,500,495,384$ 769,325,576$ 2,269,820,960$ 10,177,795,644$
District Total 5,767 43,706,915$ 1,681,035$ 45,387,950$ 4,065 11,086,174$ 5,684,041$ 16,770,215$ 62,158,165$ Harris (4%) 5,767 43,706,915$ 1,681,035$ 45,387,950$ 4,065 11,086,174$ 5,684,041$ 16,770,215$ 62,158,165$ Note: New local tax revenues are an allocation of the statewide estimate based on the county share of state personal income and further allocated in partial counties according to the share of county population. Variations in personal income or the concentration of direct health care spending in parts of counties could alter these allocations. Remaining columns reflect allocations of statewide estimates according to the county share of adults below 138% FPL or children below 200% FPL, as applicable, and further allocated for partial counties according to the share of the county's total population. Variations in percentages of adults below 138% FPL and children below 200% FPL could alter these estimates. Hospital charity cost data exclude certain hospitals, such as those exempt from reporting, hospitals that report by system, and others, resulting in a conservative estimate of unreimbursed charity costs. Medicaid extension to adults would not relieve all local unreimbursed costs due to ineligible adults, such as undocumented immigrants, people served with incomes above 138% FPL or health care for incarcerated adults other than inpatient hospital stays. 2016 is the first full year of implementation; the federal match rate falls to 95 percent in 2017 and to 90 percent by 2020. For full county-level data, see Appendix C, and for further notes and cautions in interpreting these data, see Appendix A, in "Smart, Affordable and Fair: Why Texas Should Extend Medicaid to Low-Income Adults," at http://www.mhm.org/images/stories/advocacy_and_public_policy/Smart%20Affordable%20and%20Fair_FNL_FULL.pdf.

Impact of Medicaid Extension and Local Spending for Health CareHouse District 129 - Representative John E. Davis
County
2014-2017 New Local Tax
Revenue (Adult Expansion)
2011 County Indigent
Healthcare & Unreimbursed Jail Healthcare
Costs
2011 Total Hospital District or City/County Unreimbursed
Healthcare Expenditures
2010 Total Hospital Charity
Care Costs
Total Unreimbursed Charity Care
Costs for Local Jurisdictions &
Hospitals
2014-2017 Adults Federal Funds
Limited Scenario
2014-2017 Adults Federal Funds
Moderate Scenario
2014-2017 Adults State
Funds Moderate Scenario
2014-2017 Adults Federal Funds
Enhanced Scenario
Statewide Total 2,101,392,352$ 258,927,030$ 2,544,037,688$ 1,836,673,862$ 4,380,711,550$ 14,274,023,031$ 22,962,552,386$ 1,283,318,611$ 31,030,479,514$
District Total 17,506,681$ 3,134,592$ 25,053,055$ 14,093,682$ 39,146,737$ 82,832,677$ 133,252,531$ 7,447,145$ 180,071,007$ Harris (4%) 17,506,681$ 3,134,592$ 25,053,055$ 14,093,682$ 39,146,737$ 82,832,677$ 133,252,531$ 7,447,145$ 180,071,007$
ANALYSIS BY BILLY HAMILTON CONSULTING
Extending Medicaid to Low-Income Adults Will Save Local Tax Dollars and Grow the Economy
Download this one-pager at www.texasimpact.org/Local-Taxpayers-Win-With-Medicaid Download the full report at www.mhm.org
Download the executive summary at www.texasimpact.org
For more information about the report, “Smart, Affordable and Fair” call Texas Impact at 512/472-3903 or email [email protected]

Impact of Medicaid Extension and Local Spending for Health CareHouse District 129 - Representative John E. Davis
County
2016 Adults <138% FPL Enrollees Moderate Scenario
2016 Adults Federal Funds
Moderate Scenario
2016 Adults State Funds Moderate Scenario
2016 Adults All Funds Moderate Scenario
2016 Children <200% FPL Enrollees Moderate Scenario
2016 Children Federal Funds
Moderate Scenario
2016 Children State Funds Moderate Scenario
2016 Children All Funds Moderate Scenario
2016 Adults & Children
All Funds Moderate Scenario
Statewide Total 1,004,771 7,615,086,733$ 292,887,951$ 7,907,974,684$ 550,189 1,500,495,384$ 769,325,576$ 2,269,820,960$ 10,177,795,644$
District Total 5,831 44,190,627$ 1,699,639$ 45,890,266$ 4,110 11,208,867$ 5,746,947$ 16,955,814$ 62,846,080$ Harris (4%) 5,831 44,190,627$ 1,699,639$ 45,890,266$ 4,110 11,208,867$ 5,746,947$ 16,955,814$ 62,846,080$ Note: New local tax revenues are an allocation of the statewide estimate based on the county share of state personal income and further allocated in partial counties according to the share of county population. Variations in personal income or the concentration of direct health care spending in parts of counties could alter these allocations. Remaining columns reflect allocations of statewide estimates according to the county share of adults below 138% FPL or children below 200% FPL, as applicable, and further allocated for partial counties according to the share of the county's total population. Variations in percentages of adults below 138% FPL and children below 200% FPL could alter these estimates. Hospital charity cost data exclude certain hospitals, such as those exempt from reporting, hospitals that report by system, and others, resulting in a conservative estimate of unreimbursed charity costs. Medicaid extension to adults would not relieve all local unreimbursed costs due to ineligible adults, such as undocumented immigrants, people served with incomes above 138% FPL or health care for incarcerated adults other than inpatient hospital stays. 2016 is the first full year of implementation; the federal match rate falls to 95 percent in 2017 and to 90 percent by 2020. For full county-level data, see Appendix C, and for further notes and cautions in interpreting these data, see Appendix A, in "Smart, Affordable and Fair: Why Texas Should Extend Medicaid to Low-Income Adults," at http://www.mhm.org/images/stories/advocacy_and_public_policy/Smart%20Affordable%20and%20Fair_FNL_FULL.pdf.

Impact of Medicaid Extension and Local Spending for Health CareHouse District 130 - Representative Allen Fletcher
County
2014-2017 New Local Tax
Revenue (Adult Expansion)
2011 County Indigent
Healthcare & Unreimbursed Jail Healthcare
Costs
2011 Total Hospital District or City/County Unreimbursed
Healthcare Expenditures
2010 Total Hospital Charity
Care Costs
Total Unreimbursed Charity Care
Costs for Local Jurisdictions &
Hospitals
2014-2017 Adults Federal Funds
Limited Scenario
2014-2017 Adults Federal Funds
Moderate Scenario
2014-2017 Adults State
Funds Moderate Scenario
2014-2017 Adults Federal Funds
Enhanced Scenario
Statewide Total 2,101,392,352$ 258,927,030$ 2,544,037,688$ 1,836,673,862$ 4,380,711,550$ 14,274,023,031$ 22,962,552,386$ 1,283,318,611$ 31,030,479,514$
District Total 17,647,939$ 3,159,884$ 25,255,203$ 14,207,402$ 39,462,605$ 83,501,040$ 134,327,722$ 7,507,235$ 181,523,968$ Harris (4%) 17,647,939$ 3,159,884$ 25,255,203$ 14,207,402$ 39,462,605$ 83,501,040$ 134,327,722$ 7,507,235$ 181,523,968$
ANALYSIS BY BILLY HAMILTON CONSULTING
Extending Medicaid to Low-Income Adults Will Save Local Tax Dollars and Grow the Economy
Download this one-pager at www.texasimpact.org/Local-Taxpayers-Win-With-Medicaid Download the full report at www.mhm.org
Download the executive summary at www.texasimpact.org
For more information about the report, “Smart, Affordable and Fair” call Texas Impact at 512/472-3903 or email [email protected]

Impact of Medicaid Extension and Local Spending for Health CareHouse District 130 - Representative Allen Fletcher
County
2016 Adults <138% FPL Enrollees Moderate Scenario
2016 Adults Federal Funds
Moderate Scenario
2016 Adults State Funds Moderate Scenario
2016 Adults All Funds Moderate Scenario
2016 Children <200% FPL Enrollees Moderate Scenario
2016 Children Federal Funds
Moderate Scenario
2016 Children State Funds Moderate Scenario
2016 Children All Funds Moderate Scenario
2016 Adults & Children
All Funds Moderate Scenario
Statewide Total 1,004,771 7,615,086,733$ 292,887,951$ 7,907,974,684$ 550,189 1,500,495,384$ 769,325,576$ 2,269,820,960$ 10,177,795,644$
District Total 5,878 44,547,193$ 1,713,354$ 46,260,547$ 4,143 11,299,309$ 5,793,318$ 17,092,628$ 63,353,174$ Harris (4%) 5,878 44,547,193$ 1,713,354$ 46,260,547$ 4,143 11,299,309$ 5,793,318$ 17,092,628$ 63,353,174$ Note: New local tax revenues are an allocation of the statewide estimate based on the county share of state personal income and further allocated in partial counties according to the share of county population. Variations in personal income or the concentration of direct health care spending in parts of counties could alter these allocations. Remaining columns reflect allocations of statewide estimates according to the county share of adults below 138% FPL or children below 200% FPL, as applicable, and further allocated for partial counties according to the share of the county's total population. Variations in percentages of adults below 138% FPL and children below 200% FPL could alter these estimates. Hospital charity cost data exclude certain hospitals, such as those exempt from reporting, hospitals that report by system, and others, resulting in a conservative estimate of unreimbursed charity costs. Medicaid extension to adults would not relieve all local unreimbursed costs due to ineligible adults, such as undocumented immigrants, people served with incomes above 138% FPL or health care for incarcerated adults other than inpatient hospital stays. 2016 is the first full year of implementation; the federal match rate falls to 95 percent in 2017 and to 90 percent by 2020. For full county-level data, see Appendix C, and for further notes and cautions in interpreting these data, see Appendix A, in "Smart, Affordable and Fair: Why Texas Should Extend Medicaid to Low-Income Adults," at http://www.mhm.org/images/stories/advocacy_and_public_policy/Smart%20Affordable%20and%20Fair_FNL_FULL.pdf.

Impact of Medicaid Extension and Local Spending for Health CareHouse District 131 - Representative Alma A. Allen
County
2014-2017 New Local Tax
Revenue (Adult Expansion)
2011 County Indigent
Healthcare & Unreimbursed Jail Healthcare
Costs
2011 Total Hospital District or City/County Unreimbursed
Healthcare Expenditures
2010 Total Hospital Charity
Care Costs
Total Unreimbursed Charity Care
Costs for Local Jurisdictions &
Hospitals
2014-2017 Adults Federal Funds
Limited Scenario
2014-2017 Adults Federal Funds
Moderate Scenario
2014-2017 Adults State
Funds Moderate Scenario
2014-2017 Adults Federal Funds
Enhanced Scenario
Statewide Total 2,101,392,352$ 258,927,030$ 2,544,037,688$ 1,836,673,862$ 4,380,711,550$ 14,274,023,031$ 22,962,552,386$ 1,283,318,611$ 31,030,479,514$
District Total 17,617,275$ 3,154,394$ 25,211,321$ 14,182,715$ 39,394,036$ 83,355,950$ 134,094,318$ 7,494,190$ 181,208,557$ Harris (4%) 17,617,275$ 3,154,394$ 25,211,321$ 14,182,715$ 39,394,036$ 83,355,950$ 134,094,318$ 7,494,190$ 181,208,557$
ANALYSIS BY BILLY HAMILTON CONSULTING
Extending Medicaid to Low-Income Adults Will Save Local Tax Dollars and Grow the Economy
Download this one-pager at www.texasimpact.org/Local-Taxpayers-Win-With-Medicaid Download the full report at www.mhm.org
Download the executive summary at www.texasimpact.org
For more information about the report, “Smart, Affordable and Fair” call Texas Impact at 512/472-3903 or email [email protected]

Impact of Medicaid Extension and Local Spending for Health CareHouse District 131 - Representative Alma A. Allen
County
2016 Adults <138% FPL Enrollees Moderate Scenario
2016 Adults Federal Funds
Moderate Scenario
2016 Adults State Funds Moderate Scenario
2016 Adults All Funds Moderate Scenario
2016 Children <200% FPL Enrollees Moderate Scenario
2016 Children Federal Funds
Moderate Scenario
2016 Children State Funds Moderate Scenario
2016 Children All Funds Moderate Scenario
2016 Adults & Children
All Funds Moderate Scenario
Statewide Total 1,004,771 7,615,086,733$ 292,887,951$ 7,907,974,684$ 550,189 1,500,495,384$ 769,325,576$ 2,269,820,960$ 10,177,795,644$
District Total 5,868 44,469,789$ 1,710,376$ 46,180,165$ 4,136 11,279,676$ 5,783,252$ 17,062,928$ 63,243,093$ Harris (4%) 5,868 44,469,789$ 1,710,376$ 46,180,165$ 4,136 11,279,676$ 5,783,252$ 17,062,928$ 63,243,093$ Note: New local tax revenues are an allocation of the statewide estimate based on the county share of state personal income and further allocated in partial counties according to the share of county population. Variations in personal income or the concentration of direct health care spending in parts of counties could alter these allocations. Remaining columns reflect allocations of statewide estimates according to the county share of adults below 138% FPL or children below 200% FPL, as applicable, and further allocated for partial counties according to the share of the county's total population. Variations in percentages of adults below 138% FPL and children below 200% FPL could alter these estimates. Hospital charity cost data exclude certain hospitals, such as those exempt from reporting, hospitals that report by system, and others, resulting in a conservative estimate of unreimbursed charity costs. Medicaid extension to adults would not relieve all local unreimbursed costs due to ineligible adults, such as undocumented immigrants, people served with incomes above 138% FPL or health care for incarcerated adults other than inpatient hospital stays. 2016 is the first full year of implementation; the federal match rate falls to 95 percent in 2017 and to 90 percent by 2020. For full county-level data, see Appendix C, and for further notes and cautions in interpreting these data, see Appendix A, in "Smart, Affordable and Fair: Why Texas Should Extend Medicaid to Low-Income Adults," at http://www.mhm.org/images/stories/advocacy_and_public_policy/Smart%20Affordable%20and%20Fair_FNL_FULL.pdf.

Impact of Medicaid Extension and Local Spending for Health CareHouse District 132 - Representative Bill Callegari
County
2014-2017 New Local Tax
Revenue (Adult Expansion)
2011 County Indigent
Healthcare & Unreimbursed Jail Healthcare
Costs
2011 Total Hospital District or City/County Unreimbursed
Healthcare Expenditures
2010 Total Hospital Charity
Care Costs
Total Unreimbursed Charity Care
Costs for Local Jurisdictions &
Hospitals
2014-2017 Adults Federal Funds
Limited Scenario
2014-2017 Adults Federal Funds
Moderate Scenario
2014-2017 Adults State
Funds Moderate Scenario
2014-2017 Adults Federal Funds
Enhanced Scenario
Statewide Total 2,101,392,352$ 258,927,030$ 2,544,037,688$ 1,836,673,862$ 4,380,711,550$ 14,274,023,031$ 22,962,552,386$ 1,283,318,611$ 31,030,479,514$
District Total 17,390,658$ 3,113,818$ 24,887,019$ 14,000,279$ 38,887,298$ 82,283,717$ 132,369,420$ 7,397,790$ 178,877,614$ Harris (4%) 17,390,658$ 3,113,818$ 24,887,019$ 14,000,279$ 38,887,298$ 82,283,717$ 132,369,420$ 7,397,790$ 178,877,614$
ANALYSIS BY BILLY HAMILTON CONSULTING
Extending Medicaid to Low-Income Adults Will Save Local Tax Dollars and Grow the Economy
Download this one-pager at www.texasimpact.org/Local-Taxpayers-Win-With-Medicaid Download the full report at www.mhm.org
Download the executive summary at www.texasimpact.org
For more information about the report, “Smart, Affordable and Fair” call Texas Impact at 512/472-3903 or email [email protected]

Impact of Medicaid Extension and Local Spending for Health CareHouse District 132 - Representative Bill Callegari
County
2016 Adults <138% FPL Enrollees Moderate Scenario
2016 Adults Federal Funds
Moderate Scenario
2016 Adults State Funds Moderate Scenario
2016 Adults All Funds Moderate Scenario
2016 Children <200% FPL Enrollees Moderate Scenario
2016 Children Federal Funds
Moderate Scenario
2016 Children State Funds Moderate Scenario
2016 Children All Funds Moderate Scenario
2016 Adults & Children
All Funds Moderate Scenario
Statewide Total 1,004,771 7,615,086,733$ 292,887,951$ 7,907,974,684$ 550,189 1,500,495,384$ 769,325,576$ 2,269,820,960$ 10,177,795,644$
District Total 5,792 43,897,760$ 1,688,375$ 45,586,135$ 4,083 11,134,582$ 5,708,860$ 16,843,442$ 62,429,578$ Harris (4%) 5,792 43,897,760$ 1,688,375$ 45,586,135$ 4,083 11,134,582$ 5,708,860$ 16,843,442$ 62,429,578$ Note: New local tax revenues are an allocation of the statewide estimate based on the county share of state personal income and further allocated in partial counties according to the share of county population. Variations in personal income or the concentration of direct health care spending in parts of counties could alter these allocations. Remaining columns reflect allocations of statewide estimates according to the county share of adults below 138% FPL or children below 200% FPL, as applicable, and further allocated for partial counties according to the share of the county's total population. Variations in percentages of adults below 138% FPL and children below 200% FPL could alter these estimates. Hospital charity cost data exclude certain hospitals, such as those exempt from reporting, hospitals that report by system, and others, resulting in a conservative estimate of unreimbursed charity costs. Medicaid extension to adults would not relieve all local unreimbursed costs due to ineligible adults, such as undocumented immigrants, people served with incomes above 138% FPL or health care for incarcerated adults other than inpatient hospital stays. 2016 is the first full year of implementation; the federal match rate falls to 95 percent in 2017 and to 90 percent by 2020. For full county-level data, see Appendix C, and for further notes and cautions in interpreting these data, see Appendix A, in "Smart, Affordable and Fair: Why Texas Should Extend Medicaid to Low-Income Adults," at http://www.mhm.org/images/stories/advocacy_and_public_policy/Smart%20Affordable%20and%20Fair_FNL_FULL.pdf.

Impact of Medicaid Extension and Local Spending for Health CareHouse District 133 - Representative Jim Murphy
County
2014-2017 New Local Tax
Revenue (Adult Expansion)
2011 County Indigent
Healthcare & Unreimbursed Jail Healthcare
Costs
2011 Total Hospital District or City/County Unreimbursed
Healthcare Expenditures
2010 Total Hospital Charity
Care Costs
Total Unreimbursed Charity Care
Costs for Local Jurisdictions &
Hospitals
2014-2017 Adults Federal Funds
Limited Scenario
2014-2017 Adults Federal Funds
Moderate Scenario
2014-2017 Adults State
Funds Moderate Scenario
2014-2017 Adults Federal Funds
Enhanced Scenario
Statewide Total 2,101,392,352$ 258,927,030$ 2,544,037,688$ 1,836,673,862$ 4,380,711,550$ 14,274,023,031$ 22,962,552,386$ 1,283,318,611$ 31,030,479,514$
District Total 17,155,194$ 3,071,658$ 24,550,057$ 13,810,719$ 38,360,776$ 81,169,621$ 130,577,180$ 7,297,626$ 176,455,667$ Harris (4%) 17,155,194$ 3,071,658$ 24,550,057$ 13,810,719$ 38,360,776$ 81,169,621$ 130,577,180$ 7,297,626$ 176,455,667$
ANALYSIS BY BILLY HAMILTON CONSULTING
Extending Medicaid to Low-Income Adults Will Save Local Tax Dollars and Grow the Economy
Download this one-pager at www.texasimpact.org/Local-Taxpayers-Win-With-Medicaid Download the full report at www.mhm.org
Download the executive summary at www.texasimpact.org
For more information about the report, “Smart, Affordable and Fair” call Texas Impact at 512/472-3903 or email [email protected]

Impact of Medicaid Extension and Local Spending for Health CareHouse District 133 - Representative Jim Murphy
County
2016 Adults <138% FPL Enrollees Moderate Scenario
2016 Adults Federal Funds
Moderate Scenario
2016 Adults State Funds Moderate Scenario
2016 Adults All Funds Moderate Scenario
2016 Children <200% FPL Enrollees Moderate Scenario
2016 Children Federal Funds
Moderate Scenario
2016 Children State Funds Moderate Scenario
2016 Children All Funds Moderate Scenario
2016 Adults & Children
All Funds Moderate Scenario
Statewide Total 1,004,771 7,615,086,733$ 292,887,951$ 7,907,974,684$ 550,189 1,500,495,384$ 769,325,576$ 2,269,820,960$ 10,177,795,644$
District Total 5,714 43,303,398$ 1,665,515$ 44,968,914$ 4,027 10,983,823$ 5,631,564$ 16,615,387$ 61,584,301$ Harris (4%) 5,714 43,303,398$ 1,665,515$ 44,968,914$ 4,027 10,983,823$ 5,631,564$ 16,615,387$ 61,584,301$ Note: New local tax revenues are an allocation of the statewide estimate based on the county share of state personal income and further allocated in partial counties according to the share of county population. Variations in personal income or the concentration of direct health care spending in parts of counties could alter these allocations. Remaining columns reflect allocations of statewide estimates according to the county share of adults below 138% FPL or children below 200% FPL, as applicable, and further allocated for partial counties according to the share of the county's total population. Variations in percentages of adults below 138% FPL and children below 200% FPL could alter these estimates. Hospital charity cost data exclude certain hospitals, such as those exempt from reporting, hospitals that report by system, and others, resulting in a conservative estimate of unreimbursed charity costs. Medicaid extension to adults would not relieve all local unreimbursed costs due to ineligible adults, such as undocumented immigrants, people served with incomes above 138% FPL or health care for incarcerated adults other than inpatient hospital stays. 2016 is the first full year of implementation; the federal match rate falls to 95 percent in 2017 and to 90 percent by 2020. For full county-level data, see Appendix C, and for further notes and cautions in interpreting these data, see Appendix A, in "Smart, Affordable and Fair: Why Texas Should Extend Medicaid to Low-Income Adults," at http://www.mhm.org/images/stories/advocacy_and_public_policy/Smart%20Affordable%20and%20Fair_FNL_FULL.pdf.

Impact of Medicaid Extension and Local Spending for Health CareHouse District 134 - Representative Sarah Davis
County
2014-2017 New Local Tax
Revenue (Adult Expansion)
2011 County Indigent
Healthcare & Unreimbursed Jail Healthcare
Costs
2011 Total Hospital District or City/County Unreimbursed
Healthcare Expenditures
2010 Total Hospital Charity
Care Costs
Total Unreimbursed Charity Care
Costs for Local Jurisdictions &
Hospitals
2014-2017 Adults Federal Funds
Limited Scenario
2014-2017 Adults Federal Funds
Moderate Scenario
2014-2017 Adults State
Funds Moderate Scenario
2014-2017 Adults Federal Funds
Enhanced Scenario
Statewide Total 2,101,392,352$ 258,927,030$ 2,544,037,688$ 1,836,673,862$ 4,380,711,550$ 14,274,023,031$ 22,962,552,386$ 1,283,318,611$ 31,030,479,514$
District Total 17,536,240$ 3,139,884$ 25,095,355$ 14,117,478$ 39,212,833$ 82,972,534$ 133,477,518$ 7,459,719$ 180,375,043$ Harris (4%) 17,536,240$ 3,139,884$ 25,095,355$ 14,117,478$ 39,212,833$ 82,972,534$ 133,477,518$ 7,459,719$ 180,375,043$
ANALYSIS BY BILLY HAMILTON CONSULTING
Extending Medicaid to Low-Income Adults Will Save Local Tax Dollars and Grow the Economy
Download this one-pager at www.texasimpact.org/Local-Taxpayers-Win-With-Medicaid Download the full report at www.mhm.org
Download the executive summary at www.texasimpact.org
For more information about the report, “Smart, Affordable and Fair” call Texas Impact at 512/472-3903 or email [email protected]

Impact of Medicaid Extension and Local Spending for Health CareHouse District 134 - Representative Sarah Davis
County
2016 Adults <138% FPL Enrollees Moderate Scenario
2016 Adults Federal Funds
Moderate Scenario
2016 Adults State Funds Moderate Scenario
2016 Adults All Funds Moderate Scenario
2016 Children <200% FPL Enrollees Moderate Scenario
2016 Children Federal Funds
Moderate Scenario
2016 Children State Funds Moderate Scenario
2016 Children All Funds Moderate Scenario
2016 Adults & Children
All Funds Moderate Scenario
Statewide Total 1,004,771 7,615,086,733$ 292,887,951$ 7,907,974,684$ 550,189 1,500,495,384$ 769,325,576$ 2,269,820,960$ 10,177,795,644$
District Total 5,841 44,265,239$ 1,702,509$ 45,967,748$ 4,117 11,227,792$ 5,756,651$ 16,984,443$ 62,952,191$ Harris (4%) 5,841 44,265,239$ 1,702,509$ 45,967,748$ 4,117 11,227,792$ 5,756,651$ 16,984,443$ 62,952,191$ Note: New local tax revenues are an allocation of the statewide estimate based on the county share of state personal income and further allocated in partial counties according to the share of county population. Variations in personal income or the concentration of direct health care spending in parts of counties could alter these allocations. Remaining columns reflect allocations of statewide estimates according to the county share of adults below 138% FPL or children below 200% FPL, as applicable, and further allocated for partial counties according to the share of the county's total population. Variations in percentages of adults below 138% FPL and children below 200% FPL could alter these estimates. Hospital charity cost data exclude certain hospitals, such as those exempt from reporting, hospitals that report by system, and others, resulting in a conservative estimate of unreimbursed charity costs. Medicaid extension to adults would not relieve all local unreimbursed costs due to ineligible adults, such as undocumented immigrants, people served with incomes above 138% FPL or health care for incarcerated adults other than inpatient hospital stays. 2016 is the first full year of implementation; the federal match rate falls to 95 percent in 2017 and to 90 percent by 2020. For full county-level data, see Appendix C, and for further notes and cautions in interpreting these data, see Appendix A, in "Smart, Affordable and Fair: Why Texas Should Extend Medicaid to Low-Income Adults," at http://www.mhm.org/images/stories/advocacy_and_public_policy/Smart%20Affordable%20and%20Fair_FNL_FULL.pdf.

Impact of Medicaid Extension and Local Spending for Health CareHouse District 135 - Representative Gary Elkins
County
2014-2017 New Local Tax
Revenue (Adult Expansion)
2011 County Indigent
Healthcare & Unreimbursed Jail Healthcare
Costs
2011 Total Hospital District or City/County Unreimbursed
Healthcare Expenditures
2010 Total Hospital Charity
Care Costs
Total Unreimbursed Charity Care
Costs for Local Jurisdictions &
Hospitals
2014-2017 Adults Federal Funds
Limited Scenario
2014-2017 Adults Federal Funds
Moderate Scenario
2014-2017 Adults State
Funds Moderate Scenario
2014-2017 Adults Federal Funds
Enhanced Scenario
Statewide Total 2,101,392,352$ 258,927,030$ 2,544,037,688$ 1,836,673,862$ 4,380,711,550$ 14,274,023,031$ 22,962,552,386$ 1,283,318,611$ 31,030,479,514$
District Total 17,335,261$ 3,103,899$ 24,807,743$ 13,955,681$ 38,763,424$ 82,021,604$ 131,947,762$ 7,374,225$ 178,307,805$ Harris (4%) 17,335,261$ 3,103,899$ 24,807,743$ 13,955,681$ 38,763,424$ 82,021,604$ 131,947,762$ 7,374,225$ 178,307,805$
ANALYSIS BY BILLY HAMILTON CONSULTING
Extending Medicaid to Low-Income Adults Will Save Local Tax Dollars and Grow the Economy
Download this one-pager at www.texasimpact.org/Local-Taxpayers-Win-With-Medicaid Download the full report at www.mhm.org
Download the executive summary at www.texasimpact.org
For more information about the report, “Smart, Affordable and Fair” call Texas Impact at 512/472-3903 or email [email protected]

Impact of Medicaid Extension and Local Spending for Health CareHouse District 135 - Representative Gary Elkins
County
2016 Adults <138% FPL Enrollees Moderate Scenario
2016 Adults Federal Funds
Moderate Scenario
2016 Adults State Funds Moderate Scenario
2016 Adults All Funds Moderate Scenario
2016 Children <200% FPL Enrollees Moderate Scenario
2016 Children Federal Funds
Moderate Scenario
2016 Children State Funds Moderate Scenario
2016 Children All Funds Moderate Scenario
2016 Adults & Children
All Funds Moderate Scenario
Statewide Total 1,004,771 7,615,086,733$ 292,887,951$ 7,907,974,684$ 550,189 1,500,495,384$ 769,325,576$ 2,269,820,960$ 10,177,795,644$
District Total 5,774 43,757,925$ 1,682,997$ 45,440,922$ 4,070 11,099,113$ 5,690,675$ 16,789,788$ 62,230,710$ Harris (4%) 5,774 43,757,925$ 1,682,997$ 45,440,922$ 4,070 11,099,113$ 5,690,675$ 16,789,788$ 62,230,710$ Note: New local tax revenues are an allocation of the statewide estimate based on the county share of state personal income and further allocated in partial counties according to the share of county population. Variations in personal income or the concentration of direct health care spending in parts of counties could alter these allocations. Remaining columns reflect allocations of statewide estimates according to the county share of adults below 138% FPL or children below 200% FPL, as applicable, and further allocated for partial counties according to the share of the county's total population. Variations in percentages of adults below 138% FPL and children below 200% FPL could alter these estimates. Hospital charity cost data exclude certain hospitals, such as those exempt from reporting, hospitals that report by system, and others, resulting in a conservative estimate of unreimbursed charity costs. Medicaid extension to adults would not relieve all local unreimbursed costs due to ineligible adults, such as undocumented immigrants, people served with incomes above 138% FPL or health care for incarcerated adults other than inpatient hospital stays. 2016 is the first full year of implementation; the federal match rate falls to 95 percent in 2017 and to 90 percent by 2020. For full county-level data, see Appendix C, and for further notes and cautions in interpreting these data, see Appendix A, in "Smart, Affordable and Fair: Why Texas Should Extend Medicaid to Low-Income Adults," at http://www.mhm.org/images/stories/advocacy_and_public_policy/Smart%20Affordable%20and%20Fair_FNL_FULL.pdf.

Impact of Medicaid Extension and Local Spending for Health CareHouse District 136 - Representative Tony Dale
County
2014-2017 New Local Tax
Revenue (Adult Expansion)
2011 County Indigent
Healthcare & Unreimbursed Jail Healthcare
Costs
2011 Total Hospital District or City/County Unreimbursed
Healthcare Expenditures
2010 Total Hospital Charity
Care Costs
Total Unreimbursed Charity Care
Costs for Local Jurisdictions &
Hospitals
2014-2017 Adults Federal Funds
Limited Scenario
2014-2017 Adults Federal Funds
Moderate Scenario
2014-2017 Adults State
Funds Moderate Scenario
2014-2017 Adults Federal Funds
Enhanced Scenario
Statewide Total 2,101,392,352$ 258,927,030$ 2,544,037,688$ 1,836,673,862$ 4,380,711,550$ 14,274,023,031$ 22,962,552,386$ 1,283,318,611$ 31,030,479,514$
District Total 13,649,813$ 1,316,505$ 4,839,285$ 1,048,890$ 5,888,175$ 74,048,785$ 119,121,925$ 6,657,421$ 160,975,592$ Wil l iamson (39%) 13,649,813$ 1,316,505$ 4,839,285$ 1,048,890$ 5,888,175$ 74,048,785$ 119,121,925$ 6,657,421$ 160,975,592$
ANALYSIS BY BILLY HAMILTON CONSULTING
Extending Medicaid to Low-Income Adults Will Save Local Tax Dollars and Grow the Economy
Download this one-pager at www.texasimpact.org/Local-Taxpayers-Win-With-Medicaid Download the full report at www.mhm.org
Download the executive summary at www.texasimpact.org
For more information about the report, “Smart, Affordable and Fair” call Texas Impact at 512/472-3903 or email [email protected]

Impact of Medicaid Extension and Local Spending for Health CareHouse District 136 - Representative Tony Dale
County
2016 Adults <138% FPL Enrollees Moderate Scenario
2016 Adults Federal Funds
Moderate Scenario
2016 Adults State Funds Moderate Scenario
2016 Adults All Funds Moderate Scenario
2016 Children <200% FPL Enrollees Moderate Scenario
2016 Children Federal Funds
Moderate Scenario
2016 Children State Funds Moderate Scenario
2016 Children All Funds Moderate Scenario
2016 Adults & Children
All Funds Moderate Scenario
Statewide Total 1,004,771 7,615,086,733$ 292,887,951$ 7,907,974,684$ 550,189 1,500,495,384$ 769,325,576$ 2,269,820,960$ 10,177,795,644$
District Total 5,212 39,504,484$ 1,519,403$ 41,023,888$ 2,568 7,003,512$ 3,590,801$ 10,594,313$ 51,618,201$ Wil l iamson (39%) 5,212 39,504,484$ 1,519,403$ 41,023,888$ 2,568 7,003,512$ 3,590,801$ 10,594,313$ 51,618,201$ Note: New local tax revenues are an allocation of the statewide estimate based on the county share of state personal income and further allocated in partial counties according to the share of county population. Variations in personal income or the concentration of direct health care spending in parts of counties could alter these allocations. Remaining columns reflect allocations of statewide estimates according to the county share of adults below 138% FPL or children below 200% FPL, as applicable, and further allocated for partial counties according to the share of the county's total population. Variations in percentages of adults below 138% FPL and children below 200% FPL could alter these estimates. Hospital charity cost data exclude certain hospitals, such as those exempt from reporting, hospitals that report by system, and others, resulting in a conservative estimate of unreimbursed charity costs. Medicaid extension to adults would not relieve all local unreimbursed costs due to ineligible adults, such as undocumented immigrants, people served with incomes above 138% FPL or health care for incarcerated adults other than inpatient hospital stays. 2016 is the first full year of implementation; the federal match rate falls to 95 percent in 2017 and to 90 percent by 2020. For full county-level data, see Appendix C, and for further notes and cautions in interpreting these data, see Appendix A, in "Smart, Affordable and Fair: Why Texas Should Extend Medicaid to Low-Income Adults," at http://www.mhm.org/images/stories/advocacy_and_public_policy/Smart%20Affordable%20and%20Fair_FNL_FULL.pdf.
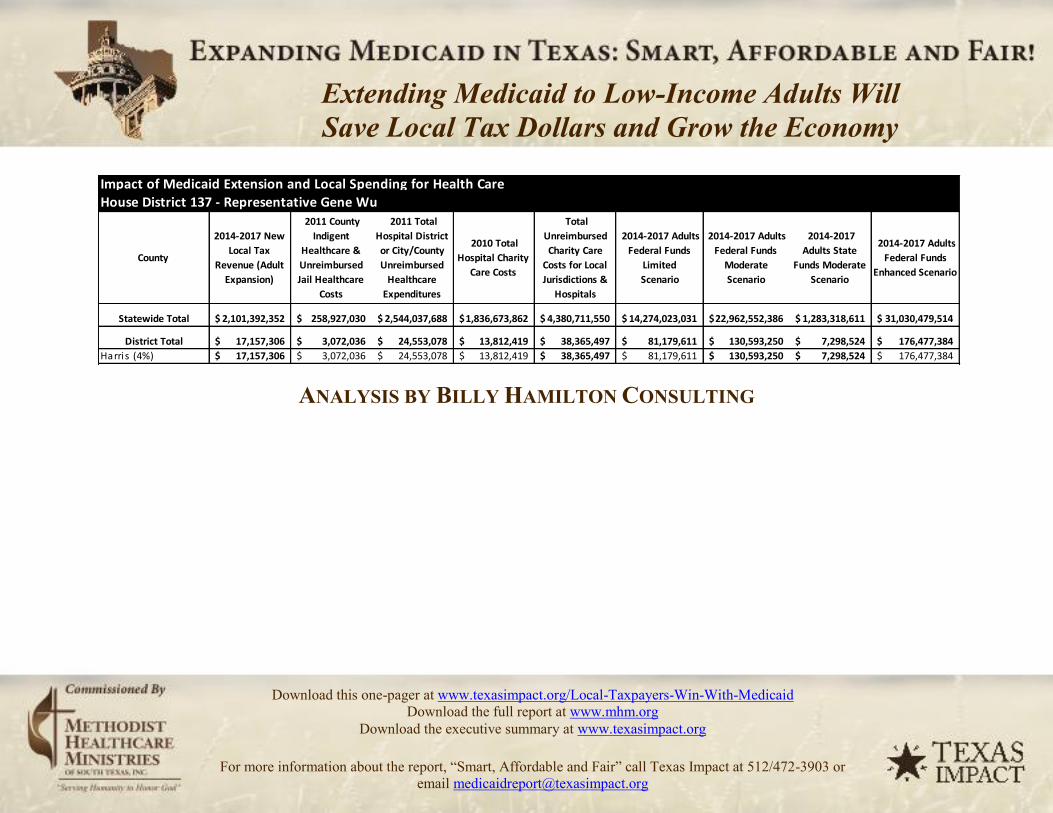
Impact of Medicaid Extension and Local Spending for Health CareHouse District 137 - Representative Gene Wu
County
2014-2017 New Local Tax
Revenue (Adult Expansion)
2011 County Indigent
Healthcare & Unreimbursed Jail Healthcare
Costs
2011 Total Hospital District or City/County Unreimbursed
Healthcare Expenditures
2010 Total Hospital Charity
Care Costs
Total Unreimbursed Charity Care
Costs for Local Jurisdictions &
Hospitals
2014-2017 Adults Federal Funds
Limited Scenario
2014-2017 Adults Federal Funds
Moderate Scenario
2014-2017 Adults State
Funds Moderate Scenario
2014-2017 Adults Federal Funds
Enhanced Scenario
Statewide Total 2,101,392,352$ 258,927,030$ 2,544,037,688$ 1,836,673,862$ 4,380,711,550$ 14,274,023,031$ 22,962,552,386$ 1,283,318,611$ 31,030,479,514$
District Total 17,157,306$ 3,072,036$ 24,553,078$ 13,812,419$ 38,365,497$ 81,179,611$ 130,593,250$ 7,298,524$ 176,477,384$ Harris (4%) 17,157,306$ 3,072,036$ 24,553,078$ 13,812,419$ 38,365,497$ 81,179,611$ 130,593,250$ 7,298,524$ 176,477,384$
ANALYSIS BY BILLY HAMILTON CONSULTING
Extending Medicaid to Low-Income Adults Will Save Local Tax Dollars and Grow the Economy
Download this one-pager at www.texasimpact.org/Local-Taxpayers-Win-With-Medicaid Download the full report at www.mhm.org
Download the executive summary at www.texasimpact.org
For more information about the report, “Smart, Affordable and Fair” call Texas Impact at 512/472-3903 or email [email protected]

Impact of Medicaid Extension and Local Spending for Health CareHouse District 137 - Representative Gene Wu
County
2016 Adults <138% FPL Enrollees Moderate Scenario
2016 Adults Federal Funds
Moderate Scenario
2016 Adults State Funds Moderate Scenario
2016 Adults All Funds Moderate Scenario
2016 Children <200% FPL Enrollees Moderate Scenario
2016 Children Federal Funds
Moderate Scenario
2016 Children State Funds Moderate Scenario
2016 Children All Funds Moderate Scenario
2016 Adults & Children
All Funds Moderate Scenario
Statewide Total 1,004,771 7,615,086,733$ 292,887,951$ 7,907,974,684$ 550,189 1,500,495,384$ 769,325,576$ 2,269,820,960$ 10,177,795,644$
District Total 5,714 43,308,728$ 1,665,720$ 44,974,448$ 4,028 10,985,175$ 5,632,257$ 16,617,432$ 61,591,880$ Harris (4%) 5,714 43,308,728$ 1,665,720$ 44,974,448$ 4,028 10,985,175$ 5,632,257$ 16,617,432$ 61,591,880$ Note: New local tax revenues are an allocation of the statewide estimate based on the county share of state personal income and further allocated in partial counties according to the share of county population. Variations in personal income or the concentration of direct health care spending in parts of counties could alter these allocations. Remaining columns reflect allocations of statewide estimates according to the county share of adults below 138% FPL or children below 200% FPL, as applicable, and further allocated for partial counties according to the share of the county's total population. Variations in percentages of adults below 138% FPL and children below 200% FPL could alter these estimates. Hospital charity cost data exclude certain hospitals, such as those exempt from reporting, hospitals that report by system, and others, resulting in a conservative estimate of unreimbursed charity costs. Medicaid extension to adults would not relieve all local unreimbursed costs due to ineligible adults, such as undocumented immigrants, people served with incomes above 138% FPL or health care for incarcerated adults other than inpatient hospital stays. 2016 is the first full year of implementation; the federal match rate falls to 95 percent in 2017 and to 90 percent by 2020. For full county-level data, see Appendix C, and for further notes and cautions in interpreting these data, see Appendix A, in "Smart, Affordable and Fair: Why Texas Should Extend Medicaid to Low-Income Adults," at http://www.mhm.org/images/stories/advocacy_and_public_policy/Smart%20Affordable%20and%20Fair_FNL_FULL.pdf.

Impact of Medicaid Extension and Local Spending for Health CareHouse District 138 - Representative Dwayne Bohac
County
2014-2017 New Local Tax
Revenue (Adult Expansion)
2011 County Indigent
Healthcare & Unreimbursed Jail Healthcare
Costs
2011 Total Hospital District or City/County Unreimbursed
Healthcare Expenditures
2010 Total Hospital Charity
Care Costs
Total Unreimbursed Charity Care
Costs for Local Jurisdictions &
Hospitals
2014-2017 Adults Federal Funds
Limited Scenario
2014-2017 Adults Federal Funds
Moderate Scenario
2014-2017 Adults State
Funds Moderate Scenario
2014-2017 Adults Federal Funds
Enhanced Scenario
Statewide Total 2,101,392,352$ 258,927,030$ 2,544,037,688$ 1,836,673,862$ 4,380,711,550$ 14,274,023,031$ 22,962,552,386$ 1,283,318,611$ 31,030,479,514$
District Total 17,399,305$ 3,115,366$ 24,899,393$ 14,007,239$ 38,906,632$ 82,324,627$ 132,435,233$ 7,401,468$ 178,966,550$ Harris (4%) 17,399,305$ 3,115,366$ 24,899,393$ 14,007,239$ 38,906,632$ 82,324,627$ 132,435,233$ 7,401,468$ 178,966,550$
ANALYSIS BY BILLY HAMILTON CONSULTING
Extending Medicaid to Low-Income Adults Will Save Local Tax Dollars and Grow the Economy
Download this one-pager at www.texasimpact.org/Local-Taxpayers-Win-With-Medicaid Download the full report at www.mhm.org
Download the executive summary at www.texasimpact.org
For more information about the report, “Smart, Affordable and Fair” call Texas Impact at 512/472-3903 or email [email protected]

Impact of Medicaid Extension and Local Spending for Health CareHouse District 138 - Representative Dwayne Bohac
County
2016 Adults <138% FPL Enrollees Moderate Scenario
2016 Adults Federal Funds
Moderate Scenario
2016 Adults State Funds Moderate Scenario
2016 Adults All Funds Moderate Scenario
2016 Children <200% FPL Enrollees Moderate Scenario
2016 Children Federal Funds
Moderate Scenario
2016 Children State Funds Moderate Scenario
2016 Children All Funds Moderate Scenario
2016 Adults & Children
All Funds Moderate Scenario
Statewide Total 1,004,771 7,615,086,733$ 292,887,951$ 7,907,974,684$ 550,189 1,500,495,384$ 769,325,576$ 2,269,820,960$ 10,177,795,644$
District Total 5,795 43,919,585$ 1,689,215$ 45,608,800$ 4,085 11,140,118$ 5,711,699$ 16,851,817$ 62,460,617$ Harris (4%) 5,795 43,919,585$ 1,689,215$ 45,608,800$ 4,085 11,140,118$ 5,711,699$ 16,851,817$ 62,460,617$ Note: New local tax revenues are an allocation of the statewide estimate based on the county share of state personal income and further allocated in partial counties according to the share of county population. Variations in personal income or the concentration of direct health care spending in parts of counties could alter these allocations. Remaining columns reflect allocations of statewide estimates according to the county share of adults below 138% FPL or children below 200% FPL, as applicable, and further allocated for partial counties according to the share of the county's total population. Variations in percentages of adults below 138% FPL and children below 200% FPL could alter these estimates. Hospital charity cost data exclude certain hospitals, such as those exempt from reporting, hospitals that report by system, and others, resulting in a conservative estimate of unreimbursed charity costs. Medicaid extension to adults would not relieve all local unreimbursed costs due to ineligible adults, such as undocumented immigrants, people served with incomes above 138% FPL or health care for incarcerated adults other than inpatient hospital stays. 2016 is the first full year of implementation; the federal match rate falls to 95 percent in 2017 and to 90 percent by 2020. For full county-level data, see Appendix C, and for further notes and cautions in interpreting these data, see Appendix A, in "Smart, Affordable and Fair: Why Texas Should Extend Medicaid to Low-Income Adults," at http://www.mhm.org/images/stories/advocacy_and_public_policy/Smart%20Affordable%20and%20Fair_FNL_FULL.pdf.

Impact of Medicaid Extension and Local Spending for Health CareHouse District 139 - Representative Sylvester Turner
County
2014-2017 New Local Tax
Revenue (Adult Expansion)
2011 County Indigent
Healthcare & Unreimbursed Jail Healthcare
Costs
2011 Total Hospital District or City/County Unreimbursed
Healthcare Expenditures
2010 Total Hospital Charity
Care Costs
Total Unreimbursed Charity Care
Costs for Local Jurisdictions &
Hospitals
2014-2017 Adults Federal Funds
Limited Scenario
2014-2017 Adults Federal Funds
Moderate Scenario
2014-2017 Adults State
Funds Moderate Scenario
2014-2017 Adults Federal Funds
Enhanced Scenario
Statewide Total 2,101,392,352$ 258,927,030$ 2,544,037,688$ 1,836,673,862$ 4,380,711,550$ 14,274,023,031$ 22,962,552,386$ 1,283,318,611$ 31,030,479,514$
District Total 17,668,148$ 3,163,503$ 25,284,123$ 14,223,670$ 39,507,793$ 83,596,656$ 134,481,539$ 7,515,831$ 181,731,829$ Harris (4%) 17,668,148$ 3,163,503$ 25,284,123$ 14,223,670$ 39,507,793$ 83,596,656$ 134,481,539$ 7,515,831$ 181,731,829$
ANALYSIS BY BILLY HAMILTON CONSULTING
Extending Medicaid to Low-Income Adults Will Save Local Tax Dollars and Grow the Economy
Download this one-pager at www.texasimpact.org/Local-Taxpayers-Win-With-Medicaid Download the full report at www.mhm.org
Download the executive summary at www.texasimpact.org
For more information about the report, “Smart, Affordable and Fair” call Texas Impact at 512/472-3903 or email [email protected]

Impact of Medicaid Extension and Local Spending for Health CareHouse District 139 - Representative Sylvester Turner
County
2016 Adults <138% FPL Enrollees Moderate Scenario
2016 Adults Federal Funds
Moderate Scenario
2016 Adults State Funds Moderate Scenario
2016 Adults All Funds Moderate Scenario
2016 Children <200% FPL Enrollees Moderate Scenario
2016 Children Federal Funds
Moderate Scenario
2016 Children State Funds Moderate Scenario
2016 Children All Funds Moderate Scenario
2016 Adults & Children
All Funds Moderate Scenario
Statewide Total 1,004,771 7,615,086,733$ 292,887,951$ 7,907,974,684$ 550,189 1,500,495,384$ 769,325,576$ 2,269,820,960$ 10,177,795,644$
District Total 5,884 44,598,204$ 1,715,316$ 46,313,519$ 4,148 11,312,248$ 5,799,952$ 17,112,200$ 63,425,719$ Harris (4%) 5,884 44,598,204$ 1,715,316$ 46,313,519$ 4,148 11,312,248$ 5,799,952$ 17,112,200$ 63,425,719$ Note: New local tax revenues are an allocation of the statewide estimate based on the county share of state personal income and further allocated in partial counties according to the share of county population. Variations in personal income or the concentration of direct health care spending in parts of counties could alter these allocations. Remaining columns reflect allocations of statewide estimates according to the county share of adults below 138% FPL or children below 200% FPL, as applicable, and further allocated for partial counties according to the share of the county's total population. Variations in percentages of adults below 138% FPL and children below 200% FPL could alter these estimates. Hospital charity cost data exclude certain hospitals, such as those exempt from reporting, hospitals that report by system, and others, resulting in a conservative estimate of unreimbursed charity costs. Medicaid extension to adults would not relieve all local unreimbursed costs due to ineligible adults, such as undocumented immigrants, people served with incomes above 138% FPL or health care for incarcerated adults other than inpatient hospital stays. 2016 is the first full year of implementation; the federal match rate falls to 95 percent in 2017 and to 90 percent by 2020. For full county-level data, see Appendix C, and for further notes and cautions in interpreting these data, see Appendix A, in "Smart, Affordable and Fair: Why Texas Should Extend Medicaid to Low-Income Adults," at http://www.mhm.org/images/stories/advocacy_and_public_policy/Smart%20Affordable%20and%20Fair_FNL_FULL.pdf.

Impact of Medicaid Extension and Local Spending for Health CareHouse District 140 - Representative Armando Walle
County
2014-2017 New Local Tax
Revenue (Adult Expansion)
2011 County Indigent
Healthcare & Unreimbursed Jail Healthcare
Costs
2011 Total Hospital District or City/County Unreimbursed
Healthcare Expenditures
2010 Total Hospital Charity
Care Costs
Total Unreimbursed Charity Care
Costs for Local Jurisdictions &
Hospitals
2014-2017 Adults Federal Funds
Limited Scenario
2014-2017 Adults Federal Funds
Moderate Scenario
2014-2017 Adults State
Funds Moderate Scenario
2014-2017 Adults Federal Funds
Enhanced Scenario
Statewide Total 2,101,392,352$ 258,927,030$ 2,544,037,688$ 1,836,673,862$ 4,380,711,550$ 14,274,023,031$ 22,962,552,386$ 1,283,318,611$ 31,030,479,514$
District Total 17,165,349$ 3,073,476$ 24,564,589$ 13,818,894$ 38,383,483$ 81,217,667$ 130,654,471$ 7,301,946$ 176,560,115$ Harris (4%) 17,165,349$ 3,073,476$ 24,564,589$ 13,818,894$ 38,383,483$ 81,217,667$ 130,654,471$ 7,301,946$ 176,560,115$
ANALYSIS BY BILLY HAMILTON CONSULTING
Extending Medicaid to Low-Income Adults Will Save Local Tax Dollars and Grow the Economy
Download this one-pager at www.texasimpact.org/Local-Taxpayers-Win-With-Medicaid Download the full report at www.mhm.org
Download the executive summary at www.texasimpact.org
For more information about the report, “Smart, Affordable and Fair” call Texas Impact at 512/472-3903 or email [email protected]

Impact of Medicaid Extension and Local Spending for Health CareHouse District 140 - Representative Armando Walle
County
2016 Adults <138% FPL Enrollees Moderate Scenario
2016 Adults Federal Funds
Moderate Scenario
2016 Adults State Funds Moderate Scenario
2016 Adults All Funds Moderate Scenario
2016 Children <200% FPL Enrollees Moderate Scenario
2016 Children Federal Funds
Moderate Scenario
2016 Children State Funds Moderate Scenario
2016 Children All Funds Moderate Scenario
2016 Adults & Children
All Funds Moderate Scenario
Statewide Total 1,004,771 7,615,086,733$ 292,887,951$ 7,907,974,684$ 550,189 1,500,495,384$ 769,325,576$ 2,269,820,960$ 10,177,795,644$
District Total 5,717 43,329,030$ 1,666,501$ 44,995,532$ 4,030 10,990,325$ 5,634,898$ 16,625,222$ 61,620,754$ Harris (4%) 5,717 43,329,030$ 1,666,501$ 44,995,532$ 4,030 10,990,325$ 5,634,898$ 16,625,222$ 61,620,754$ Note: New local tax revenues are an allocation of the statewide estimate based on the county share of state personal income and further allocated in partial counties according to the share of county population. Variations in personal income or the concentration of direct health care spending in parts of counties could alter these allocations. Remaining columns reflect allocations of statewide estimates according to the county share of adults below 138% FPL or children below 200% FPL, as applicable, and further allocated for partial counties according to the share of the county's total population. Variations in percentages of adults below 138% FPL and children below 200% FPL could alter these estimates. Hospital charity cost data exclude certain hospitals, such as those exempt from reporting, hospitals that report by system, and others, resulting in a conservative estimate of unreimbursed charity costs. Medicaid extension to adults would not relieve all local unreimbursed costs due to ineligible adults, such as undocumented immigrants, people served with incomes above 138% FPL or health care for incarcerated adults other than inpatient hospital stays. 2016 is the first full year of implementation; the federal match rate falls to 95 percent in 2017 and to 90 percent by 2020. For full county-level data, see Appendix C, and for further notes and cautions in interpreting these data, see Appendix A, in "Smart, Affordable and Fair: Why Texas Should Extend Medicaid to Low-Income Adults," at http://www.mhm.org/images/stories/advocacy_and_public_policy/Smart%20Affordable%20and%20Fair_FNL_FULL.pdf.

Impact of Medicaid Extension and Local Spending for Health CareHouse District 141 - Representative Senfronia Thompson
County
2014-2017 New Local Tax
Revenue (Adult Expansion)
2011 County Indigent
Healthcare & Unreimbursed Jail Healthcare
Costs
2011 Total Hospital District or City/County Unreimbursed
Healthcare Expenditures
2010 Total Hospital Charity
Care Costs
Total Unreimbursed Charity Care
Costs for Local Jurisdictions &
Hospitals
2014-2017 Adults Federal Funds
Limited Scenario
2014-2017 Adults Federal Funds
Moderate Scenario
2014-2017 Adults State
Funds Moderate Scenario
2014-2017 Adults Federal Funds
Enhanced Scenario
Statewide Total 2,101,392,352$ 258,927,030$ 2,544,037,688$ 1,836,673,862$ 4,380,711,550$ 14,274,023,031$ 22,962,552,386$ 1,283,318,611$ 31,030,479,514$
District Total 16,739,664$ 2,997,256$ 23,955,409$ 13,476,198$ 37,431,607$ 79,203,542$ 127,414,358$ 7,120,864$ 172,181,583$ Harris (4%) 16,739,664$ 2,997,256$ 23,955,409$ 13,476,198$ 37,431,607$ 79,203,542$ 127,414,358$ 7,120,864$ 172,181,583$
ANALYSIS BY BILLY HAMILTON CONSULTING
Extending Medicaid to Low-Income Adults Will Save Local Tax Dollars and Grow the Economy
Download this one-pager at www.texasimpact.org/Local-Taxpayers-Win-With-Medicaid Download the full report at www.mhm.org
Download the executive summary at www.texasimpact.org
For more information about the report, “Smart, Affordable and Fair” call Texas Impact at 512/472-3903 or email [email protected]

Impact of Medicaid Extension and Local Spending for Health CareHouse District 141 - Representative Senfronia Thompson
County
2016 Adults <138% FPL Enrollees Moderate Scenario
2016 Adults Federal Funds
Moderate Scenario
2016 Adults State Funds Moderate Scenario
2016 Adults All Funds Moderate Scenario
2016 Children <200% FPL Enrollees Moderate Scenario
2016 Children Federal Funds
Moderate Scenario
2016 Children State Funds Moderate Scenario
2016 Children All Funds Moderate Scenario
2016 Adults & Children
All Funds Moderate Scenario
Statewide Total 1,004,771 7,615,086,733$ 292,887,951$ 7,907,974,684$ 550,189 1,500,495,384$ 769,325,576$ 2,269,820,960$ 10,177,795,644$
District Total 5,575 42,254,509$ 1,625,173$ 43,879,683$ 3,930 10,717,775$ 5,495,157$ 16,212,932$ 60,092,615$ Harris (4%) 5,575 42,254,509$ 1,625,173$ 43,879,683$ 3,930 10,717,775$ 5,495,157$ 16,212,932$ 60,092,615$ Note: New local tax revenues are an allocation of the statewide estimate based on the county share of state personal income and further allocated in partial counties according to the share of county population. Variations in personal income or the concentration of direct health care spending in parts of counties could alter these allocations. Remaining columns reflect allocations of statewide estimates according to the county share of adults below 138% FPL or children below 200% FPL, as applicable, and further allocated for partial counties according to the share of the county's total population. Variations in percentages of adults below 138% FPL and children below 200% FPL could alter these estimates. Hospital charity cost data exclude certain hospitals, such as those exempt from reporting, hospitals that report by system, and others, resulting in a conservative estimate of unreimbursed charity costs. Medicaid extension to adults would not relieve all local unreimbursed costs due to ineligible adults, such as undocumented immigrants, people served with incomes above 138% FPL or health care for incarcerated adults other than inpatient hospital stays. 2016 is the first full year of implementation; the federal match rate falls to 95 percent in 2017 and to 90 percent by 2020. For full county-level data, see Appendix C, and for further notes and cautions in interpreting these data, see Appendix A, in "Smart, Affordable and Fair: Why Texas Should Extend Medicaid to Low-Income Adults," at http://www.mhm.org/images/stories/advocacy_and_public_policy/Smart%20Affordable%20and%20Fair_FNL_FULL.pdf.

Impact of Medicaid Extension and Local Spending for Health CareHouse District 142 - Representative Harold V. Dutton, Jr.
County
2014-2017 New Local Tax
Revenue (Adult Expansion)
2011 County Indigent
Healthcare & Unreimbursed Jail Healthcare
Costs
2011 Total Hospital District or City/County Unreimbursed
Healthcare Expenditures
2010 Total Hospital Charity
Care Costs
Total Unreimbursed Charity Care
Costs for Local Jurisdictions &
Hospitals
2014-2017 Adults Federal Funds
Limited Scenario
2014-2017 Adults Federal Funds
Moderate Scenario
2014-2017 Adults State
Funds Moderate Scenario
2014-2017 Adults Federal Funds
Enhanced Scenario
Statewide Total 2,101,392,352$ 258,927,030$ 2,544,037,688$ 1,836,673,862$ 4,380,711,550$ 14,274,023,031$ 22,962,552,386$ 1,283,318,611$ 31,030,479,514$
District Total 16,040,209$ 2,872,018$ 22,954,449$ 12,913,105$ 35,867,554$ 75,894,078$ 122,090,440$ 6,823,324$ 164,987,099$ Harris (4%) 16,040,209$ 2,872,018$ 22,954,449$ 12,913,105$ 35,867,554$ 75,894,078$ 122,090,440$ 6,823,324$ 164,987,099$
ANALYSIS BY BILLY HAMILTON CONSULTING
Extending Medicaid to Low-Income Adults Will Save Local Tax Dollars and Grow the Economy
Download this one-pager at www.texasimpact.org/Local-Taxpayers-Win-With-Medicaid Download the full report at www.mhm.org
Download the executive summary at www.texasimpact.org
For more information about the report, “Smart, Affordable and Fair” call Texas Impact at 512/472-3903 or email [email protected]

Impact of Medicaid Extension and Local Spending for Health CareHouse District 142 - Representative Harold V. Dutton, Jr.
County
2016 Adults <138% FPL Enrollees Moderate Scenario
2016 Adults Federal Funds
Moderate Scenario
2016 Adults State Funds Moderate Scenario
2016 Adults All Funds Moderate Scenario
2016 Children <200% FPL Enrollees Moderate Scenario
2016 Children Federal Funds
Moderate Scenario
2016 Children State Funds Moderate Scenario
2016 Children All Funds Moderate Scenario
2016 Adults & Children
All Funds Moderate Scenario
Statewide Total 1,004,771 7,615,086,733$ 292,887,951$ 7,907,974,684$ 550,189 1,500,495,384$ 769,325,576$ 2,269,820,960$ 10,177,795,644$
District Total 5,342 40,488,935$ 1,557,267$ 42,046,202$ 3,766 10,269,940$ 5,265,546$ 15,535,486$ 57,581,688$ Harris (4%) 5,342 40,488,935$ 1,557,267$ 42,046,202$ 3,766 10,269,940$ 5,265,546$ 15,535,486$ 57,581,688$ Note: New local tax revenues are an allocation of the statewide estimate based on the county share of state personal income and further allocated in partial counties according to the share of county population. Variations in personal income or the concentration of direct health care spending in parts of counties could alter these allocations. Remaining columns reflect allocations of statewide estimates according to the county share of adults below 138% FPL or children below 200% FPL, as applicable, and further allocated for partial counties according to the share of the county's total population. Variations in percentages of adults below 138% FPL and children below 200% FPL could alter these estimates. Hospital charity cost data exclude certain hospitals, such as those exempt from reporting, hospitals that report by system, and others, resulting in a conservative estimate of unreimbursed charity costs. Medicaid extension to adults would not relieve all local unreimbursed costs due to ineligible adults, such as undocumented immigrants, people served with incomes above 138% FPL or health care for incarcerated adults other than inpatient hospital stays. 2016 is the first full year of implementation; the federal match rate falls to 95 percent in 2017 and to 90 percent by 2020. For full county-level data, see Appendix C, and for further notes and cautions in interpreting these data, see Appendix A, in "Smart, Affordable and Fair: Why Texas Should Extend Medicaid to Low-Income Adults," at http://www.mhm.org/images/stories/advocacy_and_public_policy/Smart%20Affordable%20and%20Fair_FNL_FULL.pdf.

Impact of Medicaid Extension and Local Spending for Health CareHouse District 143 - Representative Ana Hernandez Luna
County
2014-2017 New Local Tax
Revenue (Adult Expansion)
2011 County Indigent
Healthcare & Unreimbursed Jail Healthcare
Costs
2011 Total Hospital District or City/County Unreimbursed
Healthcare Expenditures
2010 Total Hospital Charity
Care Costs
Total Unreimbursed Charity Care
Costs for Local Jurisdictions &
Hospitals
2014-2017 Adults Federal Funds
Limited Scenario
2014-2017 Adults Federal Funds
Moderate Scenario
2014-2017 Adults State
Funds Moderate Scenario
2014-2017 Adults Federal Funds
Enhanced Scenario
Statewide Total 2,101,392,352$ 258,927,030$ 2,544,037,688$ 1,836,673,862$ 4,380,711,550$ 14,274,023,031$ 22,962,552,386$ 1,283,318,611$ 31,030,479,514$
District Total 16,811,751$ 3,010,164$ 24,058,570$ 13,534,231$ 37,592,801$ 79,544,621$ 127,963,050$ 7,151,529$ 172,923,059$ Harris (4%) 16,811,751$ 3,010,164$ 24,058,570$ 13,534,231$ 37,592,801$ 79,544,621$ 127,963,050$ 7,151,529$ 172,923,059$
ANALYSIS BY BILLY HAMILTON CONSULTING
Extending Medicaid to Low-Income Adults Will Save Local Tax Dollars and Grow the Economy
Download this one-pager at www.texasimpact.org/Local-Taxpayers-Win-With-Medicaid Download the full report at www.mhm.org
Download the executive summary at www.texasimpact.org
For more information about the report, “Smart, Affordable and Fair” call Texas Impact at 512/472-3903 or email [email protected]

Impact of Medicaid Extension and Local Spending for Health CareHouse District 143 - Representative Ana Hernandez Luna
County
2016 Adults <138% FPL Enrollees Moderate Scenario
2016 Adults Federal Funds
Moderate Scenario
2016 Adults State Funds Moderate Scenario
2016 Adults All Funds Moderate Scenario
2016 Children <200% FPL Enrollees Moderate Scenario
2016 Children Federal Funds
Moderate Scenario
2016 Children State Funds Moderate Scenario
2016 Children All Funds Moderate Scenario
2016 Adults & Children
All Funds Moderate Scenario
Statewide Total 1,004,771 7,615,086,733$ 292,887,951$ 7,907,974,684$ 550,189 1,500,495,384$ 769,325,576$ 2,269,820,960$ 10,177,795,644$
District Total 5,599 42,436,472$ 1,632,172$ 44,068,644$ 3,947 10,763,929$ 5,518,821$ 16,282,750$ 60,351,395$ Harris (4%) 5,599 42,436,472$ 1,632,172$ 44,068,644$ 3,947 10,763,929$ 5,518,821$ 16,282,750$ 60,351,395$ Note: New local tax revenues are an allocation of the statewide estimate based on the county share of state personal income and further allocated in partial counties according to the share of county population. Variations in personal income or the concentration of direct health care spending in parts of counties could alter these allocations. Remaining columns reflect allocations of statewide estimates according to the county share of adults below 138% FPL or children below 200% FPL, as applicable, and further allocated for partial counties according to the share of the county's total population. Variations in percentages of adults below 138% FPL and children below 200% FPL could alter these estimates. Hospital charity cost data exclude certain hospitals, such as those exempt from reporting, hospitals that report by system, and others, resulting in a conservative estimate of unreimbursed charity costs. Medicaid extension to adults would not relieve all local unreimbursed costs due to ineligible adults, such as undocumented immigrants, people served with incomes above 138% FPL or health care for incarcerated adults other than inpatient hospital stays. 2016 is the first full year of implementation; the federal match rate falls to 95 percent in 2017 and to 90 percent by 2020. For full county-level data, see Appendix C, and for further notes and cautions in interpreting these data, see Appendix A, in "Smart, Affordable and Fair: Why Texas Should Extend Medicaid to Low-Income Adults," at http://www.mhm.org/images/stories/advocacy_and_public_policy/Smart%20Affordable%20and%20Fair_FNL_FULL.pdf.

Impact of Medicaid Extension and Local Spending for Health CareHouse District 144 - Representative Mary Ann Perez
County
2014-2017 New Local Tax
Revenue (Adult Expansion)
2011 County Indigent
Healthcare & Unreimbursed Jail Healthcare
Costs
2011 Total Hospital District or City/County Unreimbursed
Healthcare Expenditures
2010 Total Hospital Charity
Care Costs
Total Unreimbursed Charity Care
Costs for Local Jurisdictions &
Hospitals
2014-2017 Adults Federal Funds
Limited Scenario
2014-2017 Adults Federal Funds
Moderate Scenario
2014-2017 Adults State
Funds Moderate Scenario
2014-2017 Adults Federal Funds
Enhanced Scenario
Statewide Total 2,101,392,352$ 258,927,030$ 2,544,037,688$ 1,836,673,862$ 4,380,711,550$ 14,274,023,031$ 22,962,552,386$ 1,283,318,611$ 31,030,479,514$
District Total 16,273,260$ 2,913,746$ 23,287,959$ 13,100,721$ 36,388,680$ 76,996,757$ 123,864,314$ 6,922,461$ 167,384,226$ Harris (4%) 16,273,260$ 2,913,746$ 23,287,959$ 13,100,721$ 36,388,680$ 76,996,757$ 123,864,314$ 6,922,461$ 167,384,226$
ANALYSIS BY BILLY HAMILTON CONSULTING
Extending Medicaid to Low-Income Adults Will Save Local Tax Dollars and Grow the Economy
Download this one-pager at www.texasimpact.org/Local-Taxpayers-Win-With-Medicaid Download the full report at www.mhm.org
Download the executive summary at www.texasimpact.org
For more information about the report, “Smart, Affordable and Fair” call Texas Impact at 512/472-3903 or email [email protected]

Impact of Medicaid Extension and Local Spending for Health CareHouse District 144 - Representative Mary Ann Perez
County
2016 Adults <138% FPL Enrollees Moderate Scenario
2016 Adults Federal Funds
Moderate Scenario
2016 Adults State Funds Moderate Scenario
2016 Adults All Funds Moderate Scenario
2016 Children <200% FPL Enrollees Moderate Scenario
2016 Children Federal Funds
Moderate Scenario
2016 Children State Funds Moderate Scenario
2016 Children All Funds Moderate Scenario
2016 Adults & Children
All Funds Moderate Scenario
Statewide Total 1,004,771 7,615,086,733$ 292,887,951$ 7,907,974,684$ 550,189 1,500,495,384$ 769,325,576$ 2,269,820,960$ 10,177,795,644$
District Total 5,420 41,077,206$ 1,579,893$ 42,657,099$ 3,820 10,419,154$ 5,342,050$ 15,761,204$ 58,418,302$ Harris (4%) 5,420 41,077,206$ 1,579,893$ 42,657,099$ 3,820 10,419,154$ 5,342,050$ 15,761,204$ 58,418,302$ Note: New local tax revenues are an allocation of the statewide estimate based on the county share of state personal income and further allocated in partial counties according to the share of county population. Variations in personal income or the concentration of direct health care spending in parts of counties could alter these allocations. Remaining columns reflect allocations of statewide estimates according to the county share of adults below 138% FPL or children below 200% FPL, as applicable, and further allocated for partial counties according to the share of the county's total population. Variations in percentages of adults below 138% FPL and children below 200% FPL could alter these estimates. Hospital charity cost data exclude certain hospitals, such as those exempt from reporting, hospitals that report by system, and others, resulting in a conservative estimate of unreimbursed charity costs. Medicaid extension to adults would not relieve all local unreimbursed costs due to ineligible adults, such as undocumented immigrants, people served with incomes above 138% FPL or health care for incarcerated adults other than inpatient hospital stays. 2016 is the first full year of implementation; the federal match rate falls to 95 percent in 2017 and to 90 percent by 2020. For full county-level data, see Appendix C, and for further notes and cautions in interpreting these data, see Appendix A, in "Smart, Affordable and Fair: Why Texas Should Extend Medicaid to Low-Income Adults," at http://www.mhm.org/images/stories/advocacy_and_public_policy/Smart%20Affordable%20and%20Fair_FNL_FULL.pdf.

Impact of Medicaid Extension and Local Spending for Health CareHouse District 145 - Representative Carol Alvarado
County
2014-2017 New Local Tax
Revenue (Adult Expansion)
2011 County Indigent
Healthcare & Unreimbursed Jail Healthcare
Costs
2011 Total Hospital District or City/County Unreimbursed
Healthcare Expenditures
2010 Total Hospital Charity
Care Costs
Total Unreimbursed Charity Care
Costs for Local Jurisdictions &
Hospitals
2014-2017 Adults Federal Funds
Limited Scenario
2014-2017 Adults Federal Funds
Moderate Scenario
2014-2017 Adults State
Funds Moderate Scenario
2014-2017 Adults Federal Funds
Enhanced Scenario
Statewide Total 2,101,392,352$ 258,927,030$ 2,544,037,688$ 1,836,673,862$ 4,380,711,550$ 14,274,023,031$ 22,962,552,386$ 1,283,318,611$ 31,030,479,514$
District Total 16,546,225$ 2,962,621$ 23,678,588$ 13,320,471$ 36,999,059$ 78,288,290$ 125,941,996$ 7,038,578$ 170,191,905$ Harris (4%) 16,546,225$ 2,962,621$ 23,678,588$ 13,320,471$ 36,999,059$ 78,288,290$ 125,941,996$ 7,038,578$ 170,191,905$
ANALYSIS BY BILLY HAMILTON CONSULTING
Extending Medicaid to Low-Income Adults Will Save Local Tax Dollars and Grow the Economy
Download this one-pager at www.texasimpact.org/Local-Taxpayers-Win-With-Medicaid Download the full report at www.mhm.org
Download the executive summary at www.texasimpact.org
For more information about the report, “Smart, Affordable and Fair” call Texas Impact at 512/472-3903 or email [email protected]

Impact of Medicaid Extension and Local Spending for Health CareHouse District 145 - Representative Carol Alvarado
County
2016 Adults <138% FPL Enrollees Moderate Scenario
2016 Adults Federal Funds
Moderate Scenario
2016 Adults State Funds Moderate Scenario
2016 Adults All Funds Moderate Scenario
2016 Children <200% FPL Enrollees Moderate Scenario
2016 Children Federal Funds
Moderate Scenario
2016 Children State Funds Moderate Scenario
2016 Children All Funds Moderate Scenario
2016 Adults & Children
All Funds Moderate Scenario
Statewide Total 1,004,771 7,615,086,733$ 292,887,951$ 7,907,974,684$ 550,189 1,500,495,384$ 769,325,576$ 2,269,820,960$ 10,177,795,644$
District Total 5,511 41,766,229$ 1,606,393$ 43,372,623$ 3,884 10,593,923$ 5,431,657$ 16,025,580$ 59,398,203$ Harris (4%) 5,511 41,766,229$ 1,606,393$ 43,372,623$ 3,884 10,593,923$ 5,431,657$ 16,025,580$ 59,398,203$ Note: New local tax revenues are an allocation of the statewide estimate based on the county share of state personal income and further allocated in partial counties according to the share of county population. Variations in personal income or the concentration of direct health care spending in parts of counties could alter these allocations. Remaining columns reflect allocations of statewide estimates according to the county share of adults below 138% FPL or children below 200% FPL, as applicable, and further allocated for partial counties according to the share of the county's total population. Variations in percentages of adults below 138% FPL and children below 200% FPL could alter these estimates. Hospital charity cost data exclude certain hospitals, such as those exempt from reporting, hospitals that report by system, and others, resulting in a conservative estimate of unreimbursed charity costs. Medicaid extension to adults would not relieve all local unreimbursed costs due to ineligible adults, such as undocumented immigrants, people served with incomes above 138% FPL or health care for incarcerated adults other than inpatient hospital stays. 2016 is the first full year of implementation; the federal match rate falls to 95 percent in 2017 and to 90 percent by 2020. For full county-level data, see Appendix C, and for further notes and cautions in interpreting these data, see Appendix A, in "Smart, Affordable and Fair: Why Texas Should Extend Medicaid to Low-Income Adults," at http://www.mhm.org/images/stories/advocacy_and_public_policy/Smart%20Affordable%20and%20Fair_FNL_FULL.pdf.

Impact of Medicaid Extension and Local Spending for Health CareHouse District 146 - Representative Borris Miles
County
2014-2017 New Local Tax
Revenue (Adult Expansion)
2011 County Indigent
Healthcare & Unreimbursed Jail Healthcare
Costs
2011 Total Hospital District or City/County Unreimbursed
Healthcare Expenditures
2010 Total Hospital Charity
Care Costs
Total Unreimbursed Charity Care
Costs for Local Jurisdictions &
Hospitals
2014-2017 Adults Federal Funds
Limited Scenario
2014-2017 Adults Federal Funds
Moderate Scenario
2014-2017 Adults State
Funds Moderate Scenario
2014-2017 Adults Federal Funds
Enhanced Scenario
Statewide Total 2,101,392,352$ 258,927,030$ 2,544,037,688$ 1,836,673,862$ 4,380,711,550$ 14,274,023,031$ 22,962,552,386$ 1,283,318,611$ 31,030,479,514$
District Total 17,542,674$ 3,141,036$ 25,104,563$ 14,122,658$ 39,227,222$ 83,002,979$ 133,526,494$ 7,462,456$ 180,441,228$ Harris (4%) 17,542,674$ 3,141,036$ 25,104,563$ 14,122,658$ 39,227,222$ 83,002,979$ 133,526,494$ 7,462,456$ 180,441,228$
ANALYSIS BY BILLY HAMILTON CONSULTING
Extending Medicaid to Low-Income Adults Will Save Local Tax Dollars and Grow the Economy
Download this one-pager at www.texasimpact.org/Local-Taxpayers-Win-With-Medicaid Download the full report at www.mhm.org
Download the executive summary at www.texasimpact.org
For more information about the report, “Smart, Affordable and Fair” call Texas Impact at 512/472-3903 or email [email protected]

Impact of Medicaid Extension and Local Spending for Health CareHouse District 146 - Representative Borris Miles
County
2016 Adults <138% FPL Enrollees Moderate Scenario
2016 Adults Federal Funds
Moderate Scenario
2016 Adults State Funds Moderate Scenario
2016 Adults All Funds Moderate Scenario
2016 Children <200% FPL Enrollees Moderate Scenario
2016 Children Federal Funds
Moderate Scenario
2016 Children State Funds Moderate Scenario
2016 Children All Funds Moderate Scenario
2016 Adults & Children
All Funds Moderate Scenario
Statewide Total 1,004,771 7,615,086,733$ 292,887,951$ 7,907,974,684$ 550,189 1,500,495,384$ 769,325,576$ 2,269,820,960$ 10,177,795,644$
District Total 5,843 44,281,481$ 1,703,134$ 45,984,615$ 4,118 11,231,912$ 5,758,763$ 16,990,675$ 62,975,290$ Harris (4%) 5,843 44,281,481$ 1,703,134$ 45,984,615$ 4,118 11,231,912$ 5,758,763$ 16,990,675$ 62,975,290$ Note: New local tax revenues are an allocation of the statewide estimate based on the county share of state personal income and further allocated in partial counties according to the share of county population. Variations in personal income or the concentration of direct health care spending in parts of counties could alter these allocations. Remaining columns reflect allocations of statewide estimates according to the county share of adults below 138% FPL or children below 200% FPL, as applicable, and further allocated for partial counties according to the share of the county's total population. Variations in percentages of adults below 138% FPL and children below 200% FPL could alter these estimates. Hospital charity cost data exclude certain hospitals, such as those exempt from reporting, hospitals that report by system, and others, resulting in a conservative estimate of unreimbursed charity costs. Medicaid extension to adults would not relieve all local unreimbursed costs due to ineligible adults, such as undocumented immigrants, people served with incomes above 138% FPL or health care for incarcerated adults other than inpatient hospital stays. 2016 is the first full year of implementation; the federal match rate falls to 95 percent in 2017 and to 90 percent by 2020. For full county-level data, see Appendix C, and for further notes and cautions in interpreting these data, see Appendix A, in "Smart, Affordable and Fair: Why Texas Should Extend Medicaid to Low-Income Adults," at http://www.mhm.org/images/stories/advocacy_and_public_policy/Smart%20Affordable%20and%20Fair_FNL_FULL.pdf.

Impact of Medicaid Extension and Local Spending for Health CareHouse District 147 - Representative Garnet Coleman
County
2014-2017 New Local Tax
Revenue (Adult Expansion)
2011 County Indigent
Healthcare & Unreimbursed Jail Healthcare
Costs
2011 Total Hospital District or City/County Unreimbursed
Healthcare Expenditures
2010 Total Hospital Charity
Care Costs
Total Unreimbursed Charity Care
Costs for Local Jurisdictions &
Hospitals
2014-2017 Adults Federal Funds
Limited Scenario
2014-2017 Adults Federal Funds
Moderate Scenario
2014-2017 Adults State
Funds Moderate Scenario
2014-2017 Adults Federal Funds
Enhanced Scenario
Statewide Total 2,101,392,352$ 258,927,030$ 2,544,037,688$ 1,836,673,862$ 4,380,711,550$ 14,274,023,031$ 22,962,552,386$ 1,283,318,611$ 31,030,479,514$
District Total 17,682,224$ 3,166,023$ 25,304,266$ 14,235,002$ 39,539,268$ 83,663,254$ 134,588,676$ 7,521,819$ 181,876,608$ Harris (4%) 17,682,224$ 3,166,023$ 25,304,266$ 14,235,002$ 39,539,268$ 83,663,254$ 134,588,676$ 7,521,819$ 181,876,608$
ANALYSIS BY BILLY HAMILTON CONSULTING
Extending Medicaid to Low-Income Adults Will Save Local Tax Dollars and Grow the Economy
Download this one-pager at www.texasimpact.org/Local-Taxpayers-Win-With-Medicaid Download the full report at www.mhm.org
Download the executive summary at www.texasimpact.org
For more information about the report, “Smart, Affordable and Fair” call Texas Impact at 512/472-3903 or email [email protected]

Impact of Medicaid Extension and Local Spending for Health CareHouse District 147 - Representative Garnet Coleman
County
2016 Adults <138% FPL Enrollees Moderate Scenario
2016 Adults Federal Funds
Moderate Scenario
2016 Adults State Funds Moderate Scenario
2016 Adults All Funds Moderate Scenario
2016 Children <200% FPL Enrollees Moderate Scenario
2016 Children Federal Funds
Moderate Scenario
2016 Children State Funds Moderate Scenario
2016 Children All Funds Moderate Scenario
2016 Adults & Children
All Funds Moderate Scenario
Statewide Total 1,004,771 7,615,086,733$ 292,887,951$ 7,907,974,684$ 550,189 1,500,495,384$ 769,325,576$ 2,269,820,960$ 10,177,795,644$
District Total 5,889 44,633,733$ 1,716,682$ 46,350,415$ 4,151 11,321,260$ 5,804,573$ 17,125,833$ 63,476,248$ Harris (4%) 5,889 44,633,733$ 1,716,682$ 46,350,415$ 4,151 11,321,260$ 5,804,573$ 17,125,833$ 63,476,248$ Note: New local tax revenues are an allocation of the statewide estimate based on the county share of state personal income and further allocated in partial counties according to the share of county population. Variations in personal income or the concentration of direct health care spending in parts of counties could alter these allocations. Remaining columns reflect allocations of statewide estimates according to the county share of adults below 138% FPL or children below 200% FPL, as applicable, and further allocated for partial counties according to the share of the county's total population. Variations in percentages of adults below 138% FPL and children below 200% FPL could alter these estimates. Hospital charity cost data exclude certain hospitals, such as those exempt from reporting, hospitals that report by system, and others, resulting in a conservative estimate of unreimbursed charity costs. Medicaid extension to adults would not relieve all local unreimbursed costs due to ineligible adults, such as undocumented immigrants, people served with incomes above 138% FPL or health care for incarcerated adults other than inpatient hospital stays. 2016 is the first full year of implementation; the federal match rate falls to 95 percent in 2017 and to 90 percent by 2020. For full county-level data, see Appendix C, and for further notes and cautions in interpreting these data, see Appendix A, in "Smart, Affordable and Fair: Why Texas Should Extend Medicaid to Low-Income Adults," at http://www.mhm.org/images/stories/advocacy_and_public_policy/Smart%20Affordable%20and%20Fair_FNL_FULL.pdf.

Impact of Medicaid Extension and Local Spending for Health CareHouse District 148 - Representative Jessica Farrar
County
2014-2017 New Local Tax
Revenue (Adult Expansion)
2011 County Indigent
Healthcare & Unreimbursed Jail Healthcare
Costs
2011 Total Hospital District or City/County Unreimbursed
Healthcare Expenditures
2010 Total Hospital Charity
Care Costs
Total Unreimbursed Charity Care
Costs for Local Jurisdictions &
Hospitals
2014-2017 Adults Federal Funds
Limited Scenario
2014-2017 Adults Federal Funds
Moderate Scenario
2014-2017 Adults State
Funds Moderate Scenario
2014-2017 Adults Federal Funds
Enhanced Scenario
Statewide Total 2,101,392,352$ 258,927,030$ 2,544,037,688$ 1,836,673,862$ 4,380,711,550$ 14,274,023,031$ 22,962,552,386$ 1,283,318,611$ 31,030,479,514$
District Total 17,173,291$ 3,074,898$ 24,575,955$ 13,825,288$ 38,401,243$ 81,255,247$ 130,714,927$ 7,305,325$ 176,641,812$ Harris (4%) 17,173,291$ 3,074,898$ 24,575,955$ 13,825,288$ 38,401,243$ 81,255,247$ 130,714,927$ 7,305,325$ 176,641,812$
ANALYSIS BY BILLY HAMILTON CONSULTING
Extending Medicaid to Low-Income Adults Will Save Local Tax Dollars and Grow the Economy
Download this one-pager at www.texasimpact.org/Local-Taxpayers-Win-With-Medicaid Download the full report at www.mhm.org
Download the executive summary at www.texasimpact.org
For more information about the report, “Smart, Affordable and Fair” call Texas Impact at 512/472-3903 or email [email protected]

Impact of Medicaid Extension and Local Spending for Health CareHouse District 148 - Representative Jessica Farrar
County
2016 Adults <138% FPL Enrollees Moderate Scenario
2016 Adults Federal Funds
Moderate Scenario
2016 Adults State Funds Moderate Scenario
2016 Adults All Funds Moderate Scenario
2016 Children <200% FPL Enrollees Moderate Scenario
2016 Children Federal Funds
Moderate Scenario
2016 Children State Funds Moderate Scenario
2016 Children All Funds Moderate Scenario
2016 Adults & Children
All Funds Moderate Scenario
Statewide Total 1,004,771 7,615,086,733$ 292,887,951$ 7,907,974,684$ 550,189 1,500,495,384$ 769,325,576$ 2,269,820,960$ 10,177,795,644$
District Total 5,720 43,349,079$ 1,667,272$ 45,016,352$ 4,032 10,995,410$ 5,637,505$ 16,632,915$ 61,649,267$ Harris (4%) 5,720 43,349,079$ 1,667,272$ 45,016,352$ 4,032 10,995,410$ 5,637,505$ 16,632,915$ 61,649,267$ Note: New local tax revenues are an allocation of the statewide estimate based on the county share of state personal income and further allocated in partial counties according to the share of county population. Variations in personal income or the concentration of direct health care spending in parts of counties could alter these allocations. Remaining columns reflect allocations of statewide estimates according to the county share of adults below 138% FPL or children below 200% FPL, as applicable, and further allocated for partial counties according to the share of the county's total population. Variations in percentages of adults below 138% FPL and children below 200% FPL could alter these estimates. Hospital charity cost data exclude certain hospitals, such as those exempt from reporting, hospitals that report by system, and others, resulting in a conservative estimate of unreimbursed charity costs. Medicaid extension to adults would not relieve all local unreimbursed costs due to ineligible adults, such as undocumented immigrants, people served with incomes above 138% FPL or health care for incarcerated adults other than inpatient hospital stays. 2016 is the first full year of implementation; the federal match rate falls to 95 percent in 2017 and to 90 percent by 2020. For full county-level data, see Appendix C, and for further notes and cautions in interpreting these data, see Appendix A, in "Smart, Affordable and Fair: Why Texas Should Extend Medicaid to Low-Income Adults," at http://www.mhm.org/images/stories/advocacy_and_public_policy/Smart%20Affordable%20and%20Fair_FNL_FULL.pdf.

Impact of Medicaid Extension and Local Spending for Health CareHouse District 149 - Representative Hubert Vo
County
2014-2017 New Local Tax
Revenue (Adult Expansion)
2011 County Indigent
Healthcare & Unreimbursed Jail Healthcare
Costs
2011 Total Hospital District or City/County Unreimbursed
Healthcare Expenditures
2010 Total Hospital Charity
Care Costs
Total Unreimbursed Charity Care
Costs for Local Jurisdictions &
Hospitals
2014-2017 Adults Federal Funds
Limited Scenario
2014-2017 Adults Federal Funds
Moderate Scenario
2014-2017 Adults State
Funds Moderate Scenario
2014-2017 Adults Federal Funds
Enhanced Scenario
Statewide Total 2,101,392,352$ 258,927,030$ 2,544,037,688$ 1,836,673,862$ 4,380,711,550$ 14,274,023,031$ 22,962,552,386$ 1,283,318,611$ 31,030,479,514$
District Total 17,282,679$ 3,094,484$ 24,732,494$ 13,913,350$ 38,645,844$ 81,772,812$ 131,547,530$ 7,351,857$ 177,766,952$ Harris (4%) 17,282,679$ 3,094,484$ 24,732,494$ 13,913,350$ 38,645,844$ 81,772,812$ 131,547,530$ 7,351,857$ 177,766,952$
ANALYSIS BY BILLY HAMILTON CONSULTING
Extending Medicaid to Low-Income Adults Will Save Local Tax Dollars and Grow the Economy
Download this one-pager at www.texasimpact.org/Local-Taxpayers-Win-With-Medicaid Download the full report at www.mhm.org
Download the executive summary at www.texasimpact.org
For more information about the report, “Smart, Affordable and Fair” call Texas Impact at 512/472-3903 or email [email protected]

Impact of Medicaid Extension and Local Spending for Health CareHouse District 149 - Representative Hubert Vo
County
2016 Adults <138% FPL Enrollees Moderate Scenario
2016 Adults Federal Funds
Moderate Scenario
2016 Adults State Funds Moderate Scenario
2016 Adults All Funds Moderate Scenario
2016 Children <200% FPL Enrollees Moderate Scenario
2016 Children Federal Funds
Moderate Scenario
2016 Children State Funds Moderate Scenario
2016 Children All Funds Moderate Scenario
2016 Adults & Children
All Funds Moderate Scenario
Statewide Total 1,004,771 7,615,086,733$ 292,887,951$ 7,907,974,684$ 550,189 1,500,495,384$ 769,325,576$ 2,269,820,960$ 10,177,795,644$
District Total 5,756 43,625,196$ 1,677,892$ 45,303,088$ 4,057 11,065,447$ 5,673,414$ 16,738,860$ 62,041,949$ Harris (4%) 5,756 43,625,196$ 1,677,892$ 45,303,088$ 4,057 11,065,447$ 5,673,414$ 16,738,860$ 62,041,949$ Note: New local tax revenues are an allocation of the statewide estimate based on the county share of state personal income and further allocated in partial counties according to the share of county population. Variations in personal income or the concentration of direct health care spending in parts of counties could alter these allocations. Remaining columns reflect allocations of statewide estimates according to the county share of adults below 138% FPL or children below 200% FPL, as applicable, and further allocated for partial counties according to the share of the county's total population. Variations in percentages of adults below 138% FPL and children below 200% FPL could alter these estimates. Hospital charity cost data exclude certain hospitals, such as those exempt from reporting, hospitals that report by system, and others, resulting in a conservative estimate of unreimbursed charity costs. Medicaid extension to adults would not relieve all local unreimbursed costs due to ineligible adults, such as undocumented immigrants, people served with incomes above 138% FPL or health care for incarcerated adults other than inpatient hospital stays. 2016 is the first full year of implementation; the federal match rate falls to 95 percent in 2017 and to 90 percent by 2020. For full county-level data, see Appendix C, and for further notes and cautions in interpreting these data, see Appendix A, in "Smart, Affordable and Fair: Why Texas Should Extend Medicaid to Low-Income Adults," at http://www.mhm.org/images/stories/advocacy_and_public_policy/Smart%20Affordable%20and%20Fair_FNL_FULL.pdf.

Impact of Medicaid Extension and Local Spending for Health CareHouse District 150 - Representative Debbie Riddle
County
2014-2017 New Local Tax
Revenue (Adult Expansion)
2011 County Indigent
Healthcare & Unreimbursed Jail Healthcare
Costs
2011 Total Hospital District or City/County Unreimbursed
Healthcare Expenditures
2010 Total Hospital Charity
Care Costs
Total Unreimbursed Charity Care
Costs for Local Jurisdictions &
Hospitals
2014-2017 Adults Federal Funds
Limited Scenario
2014-2017 Adults Federal Funds
Moderate Scenario
2014-2017 Adults State
Funds Moderate Scenario
2014-2017 Adults Federal Funds
Enhanced Scenario
Statewide Total 2,101,392,352$ 258,927,030$ 2,544,037,688$ 1,836,673,862$ 4,380,711,550$ 14,274,023,031$ 22,962,552,386$ 1,283,318,611$ 31,030,479,514$
District Total 16,964,571$ 3,037,526$ 24,277,264$ 13,657,259$ 37,934,523$ 80,267,689$ 129,126,246$ 7,216,537$ 174,494,945$ Harris (4%) 16,964,571$ 3,037,526$ 24,277,264$ 13,657,259$ 37,934,523$ 80,267,689$ 129,126,246$ 7,216,537$ 174,494,945$
ANALYSIS BY BILLY HAMILTON CONSULTING
Extending Medicaid to Low-Income Adults Will Save Local Tax Dollars and Grow the Economy
Download this one-pager at www.texasimpact.org/Local-Taxpayers-Win-With-Medicaid Download the full report at www.mhm.org
Download the executive summary at www.texasimpact.org
For more information about the report, “Smart, Affordable and Fair” call Texas Impact at 512/472-3903 or email [email protected]

Impact of Medicaid Extension and Local Spending for Health CareHouse District 150 - Representative Debbie Riddle
County
2016 Adults <138% FPL Enrollees Moderate Scenario
2016 Adults Federal Funds
Moderate Scenario
2016 Adults State Funds Moderate Scenario
2016 Adults All Funds Moderate Scenario
2016 Children <200% FPL Enrollees Moderate Scenario
2016 Children Federal Funds
Moderate Scenario
2016 Children State Funds Moderate Scenario
2016 Children All Funds Moderate Scenario
2016 Adults & Children
All Funds Moderate Scenario
Statewide Total 1,004,771 7,615,086,733$ 292,887,951$ 7,907,974,684$ 550,189 1,500,495,384$ 769,325,576$ 2,269,820,960$ 10,177,795,644$
District Total 5,650 42,822,224$ 1,647,009$ 44,469,233$ 3,983 10,861,774$ 5,568,988$ 16,430,762$ 60,899,995$ Harris (4%) 5,650 42,822,224$ 1,647,009$ 44,469,233$ 3,983 10,861,774$ 5,568,988$ 16,430,762$ 60,899,995$ Note: New local tax revenues are an allocation of the statewide estimate based on the county share of state personal income and further allocated in partial counties according to the share of county population. Variations in personal income or the concentration of direct health care spending in parts of counties could alter these allocations. Remaining columns reflect allocations of statewide estimates according to the county share of adults below 138% FPL or children below 200% FPL, as applicable, and further allocated for partial counties according to the share of the county's total population. Variations in percentages of adults below 138% FPL and children below 200% FPL could alter these estimates. Hospital charity cost data exclude certain hospitals, such as those exempt from reporting, hospitals that report by system, and others, resulting in a conservative estimate of unreimbursed charity costs. Medicaid extension to adults would not relieve all local unreimbursed costs due to ineligible adults, such as undocumented immigrants, people served with incomes above 138% FPL or health care for incarcerated adults other than inpatient hospital stays. 2016 is the first full year of implementation; the federal match rate falls to 95 percent in 2017 and to 90 percent by 2020. For full county-level data, see Appendix C, and for further notes and cautions in interpreting these data, see Appendix A, in "Smart, Affordable and Fair: Why Texas Should Extend Medicaid to Low-Income Adults," at http://www.mhm.org/images/stories/advocacy_and_public_policy/Smart%20Affordable%20and%20Fair_FNL_FULL.pdf.