Embed Size (px)
Citation preview

Policy, Planning, and Research
WORKING PAPLRS.
Energy Strategy, Management,and Assssment
Industry and EnArgy DepartmentThe World BankFebruary 1989
WPS 110
Impact of Lower Oil Priceson Renewable Energy
TechnologiesErnesto Terraco,Matthew Mendis,
andKevin Fitzgerald
Falling oil prices are most likely to affect the economic viabilityof renewable energy technologies that compete directly in themodem sector as large-scale petroleum substitutes. Projects thatinvolve small-scale and rural applications are less likely tosuffer.
The Policy, Planni ig. and Research Cornplex distiibutes PPR Working Papers to dissaminate the findings of work in progrss and toencounge the exch ange of ideas among Bank staff and all others interested in development issues. These papers carry the namo ofthe authors. reflect only their views, and should be used and cited accordingly. The findings. interpretations, and conclusions an rheauthors' own. They ahould noc be autibuted to the World Bank, its Board of Directors, its management, or any of its manber counutes.
Pub
lic D
iscl
osur
e A
utho
rized
Pub
lic D
iscl
osur
e A
utho
rized
Pub
lic D
iscl
osur
e A
utho
rized
Pub
lic D
iscl
osur
e A
utho
rized

|Poliy, Planning, and Re arch
onrgy Strategy, Illanagement,and Asao"ment
The economic sensitivity of renewable energy * They are generally smaller, so fuel coststechnologies to changing oil prices is a function represent a smaller proportion of total costs inof a pr:ject's size and location. Renewable the conventional altemative.energy technologies are those that make use ofsolar, wind, and biomass resources. * Petroleum fuels are less available and cost
more in rural than in urban areas.Renewable energy technologies that com-
pete directly in the modem sector as large-scale * Biomass fueL- (such as wood for gasifiers)petroleum substitutes suffer the most from cost less in rural areas.falling oil prices. These include "dendothermal"power plants, fuel alcohol projects, bagasse Small-scale and "ural applications includeproduction schemes, biomass garifiers for biogas, biomass gasifiers for engine use, pho-process heat, wind farms, and industrial solar tovoltaic and wind water pumps, solar cropwater heating systems. dryers, and domestic solar water heaters. Some
of these technologies, such as wind pumps andThe economic viability of small- scale or domestic solar water heaters, are used exten-
remote (or rural) applications is less likely to be sively in many parts of the world.a problem because:
This paper, a product of the Household Energy Unit, Energy Strategy, Management,and Assessment Division, Industry and Energy Department, has also appeared as anIndustry and Energy Department Working Paper. Copies are available free from theWorld Bank, 1818 H Street NW, Washington DC 20433. Please contact JanineLittleford, room S2-274, extension 33627.
The PPR Working Paper Series disseminates the findings of work under way in the Bank's Policy, Planning, and ResearchComplex. An objective of the series is to get these rmdings out quickly, even if presentations are less than fully polished.The findings, interpretations, and conclusions in these papers do not necessarily represent official policy of the Bank.
Produced at the PPR Dissemination Center

Abstract
The impacts of reduced oil prices on the economic viability of selected technologies which utilizesolar, wind and biomass energy sources are examined. The technologies include dendrothermalpower plants, bagasse, fuel alcohol, wind electric, biomass gasifiers, solar water heaters, biogas,photovoltaic water pun'ps and wind pumps. Specific projects in each of these categories which wereestablished or planned when oil prices were above US$ 28/bbl are reviewed and their economicjustifications recalculated at a range of lower oil prices. The findings indicate that the economicsensitivity of renewable energy technologies to changing oil prices is mainly a function of scale andlocation of the project. Renewable energy technologies that compete directly in the modem sectoras large-scale petroleum substitutes, such as dendrothermal power plants and fuel alcohol projects,are the most adversely affected by falling oil prices. Remote and rural applications are less affectedbecause of their generally smaller sizes and, therefore, much lower proportion of fuel costs to totalcosts in the equivalent sized conventional alternative; the reduced availability and higher cost ofpetroleum fuels as compared to urban areas; and the lower cost of biomass fuels (eg. wood forgasifiers) in rural areas.

Table of Contents
Abstract ........................................................ i
Table of Contents .................................................. i
List of Tables ................................................. ini
List of Figures . ................................................... iii
I. INTRODUCIION: LOWER OIL PRICES .................................. 1
Overview: Categories Of Renewable Energy Applications ..................... 1
Actual Oil Price Changes . ........................................... 2
II. IMPACT ON SELECTED RENEWABLE ENERGY TECHNOLOGIES .... ........ 4
Dendrothermal Power Plants . ................................... 4
Bagasse .................................. 6
Fuel Alcohol .................................. 7
Wind Electricity Generation .................................. 9
Biomass Gasifiers ............. ..................... 11
Heat Gasifiers ................................... 11
Power Gasifiers ................................... 13
Solar Water Heating ................................... 14
Biogas .................................. 17
Photovoitaic and Wind Powered Water Pumping ........ ............ 18
III. CONCLUSIONS ............................................ 22
TECHNICAL ANNEX ............................................. 23
Retail Petroleum Price Changes .... ............................ 24
Fuel Alcohol Base Case Assumptions ......... .................... 27
Wind Electricity Generation . ................................... 28
Biomass Gasifiers ........................................... 29
Solar Water Heating ......................................... 31
Water Pumping Model Assumptions .......... .................... 33
List of Tables
Table 1 Generation Costs at Various Fuel Oil Prices ..... ................. c.
Table 2 Minimuir. Crude Price for Economic Viability of
Anhydrous Ethanol Distilleries in Brazil ..... ............. 9
Retail Petroleum Psice Changes ............................................. 24
List of Figures
Figure 1 Retail Price Changes in Current US Dollars ................ 2
Figure 2 Retail Price Changes in Constant Local Currency ................ 3
Figure 3 Wind vs. Oil-Based Generation Costs ............... .................. 10
Figure 4 Heat Gasifiers vs. Fuel Oil Boiler Costs ...... ................ .... 12
Figure 5 Generation Costs of Gasifiers vs. Diesel ....... ............... ... 13
Figure 6 Solar Hot Water Fuel Oil Boiler Retrofit .......................... ... 15
Figure 7 Solar Hot Water Electric Water Heater Retrofit ........ .. .............. 16
Figure 8 Village Water Supply Costs: PV, Wind & Diesel .............. 14
Figure 9 Irrigation Water Supply Cost: PV, Wind & Diesel ........ .. ............. 20
I. INTRODUCTION: LOWER OIL PRICES
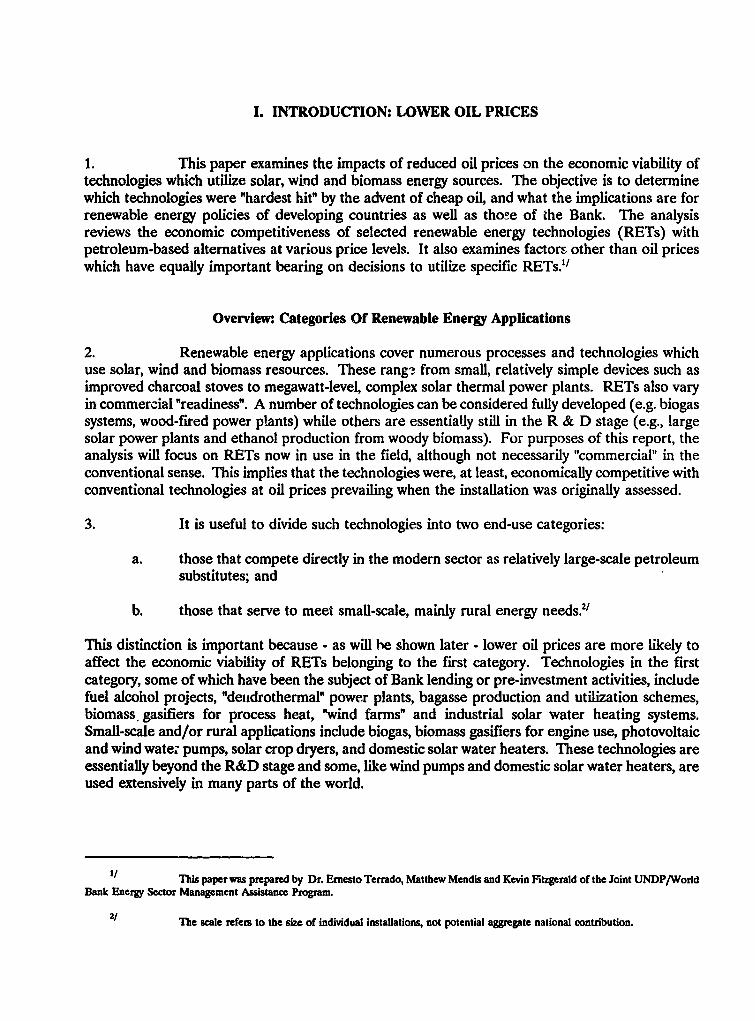
1. This paper examines the impacts of reduced oil prices on the economic viability oftechnologies which utilize solar, wind and biomass energy sources. The objective is to determinewhich technologies were "hardest hit" by the advent of cheap oil, and what the implications are forrenewable energy policies of developing countries as well as tho!e of the Bank. The analysisreviews the economic competitiveness of selected renewable energy technologies (RETs) withpetroleum-based altematives at various price levels. It also examines factors other than oil priceswhich have equally important bearing on decisions to utilize specific RETs.1'
Overview: Categories Of Renewable Energy Applications
2. Renewable energy applications cover numerous processes and technologies whichuse solar, wind and biomass resources. These range from small, relatively simple devices such asimproved charcoal stoves to megawatt-level, complex solar thermal power plants. RETs also varyin commercial "readiness". A number of technologies can be considered fully developed (e.g. biogassystems, wood-fired power plants) while others are essentially still in the R & D stage (e.g., largesolar power plants and ethanol production from woody biomass). For purposes of this report, theanalysis will focus on RETs now in use in the field, although not necessarily "commercial" in theconventional sense. This implies that the technologies were, at least, economically competitive withconventional technologies at oil prices prevailing when the installation was originally assessed.
3. It is useful to divide such technologies into two end-use categories:
a. those that compete directly in the modern sector as relatively large-scale petroleumsubstitutes; and
b. those that serve to meet small-scale, mainly rural energy needs.2/
This distinction is important because - as will he shown later - lower oil prices are more likely toaffect the economic viability of RETs belonging to the first category. Technologies in the firstcategory, some of which have been the subject of Bank lending or pre-investment activities, includefuel alcohol projects, "deiidrothermal" power plants, bagasse production and utilization schemes,biomass gasifiers for process heat, "wind farms" and industrial solar water heating systems.Small-scale and/or rural applications include biogas, biomass gasifiers for engine use, photovoltaicand wind wate; pumps, solar crop dryers, and domestic solar water heaters. These technologies areessentially beyond the R&D stage and some, like wind pumps and domestic solar water heaters, areused extensively in many parts of the world.
I/ This paper was prepared by Dr. Ernesto Terrado, Matthew Mendis and Kevin Fitzgerald of the Joint UNDP/ WorldBank Energy Sector Management Assistance Program.
2/ Ibe scale refers to the size of individual installations, not potential aggregate national contribution.

2
4. A summary of each renewable energy technology, including an assessment of thesensitivity of its economic viability to lower oil prices, is presented in Chapter 2. Conclusions andpolicy recommendations that can be drawn from this analysis are preserted in Chapter 3. Beforeproceeding to this discussion, however, it is useful to outline what has actually happened ininternational and domestic oil markets.
Actual Oil Price Changes
5. From November 1985 to July 1986 the average FOB price of crude oil on worldmarkets slid from above US$ 28/bbl to below US$ 11/bbl. Since mid 1986, crude oil FOB pricesremained relatively stable between US$ 15/bbl and US$ 18/bbl. As crude oil prices are projectedto continue within this range in the medium term, the general economic conclusions reached in thispaper are expected to be valid for some time to come.
Diesel & Fuel Oil Retail PriceChanges in Current US$ by Region
30% 9 Month Current US$ Price Change '85-'86
20% Diesel . Fu ... .
0% -1 0 % .,. .. . , .. .. ... ... , .. .. .. ..,. .. .. .. .,,, ... .. .. .
0 sia Africa Latin merica Asia Africa Ltin Anmerica
I 90 Least Drop _ Region Average C Most Drop
Source: see Annex
Figure 1 Retail Price Changes in Current US Dollars
6. Data collected from almost 20 developing countries indicate that most countriesmade only slight retail price adjustments in response to the -60% drop in international oil pricesbetween November, 1985 and July, 1986.3' In fact, a few countries actually raised nominal retailprices during this period. Figures 1 and 2 illustrate the magnitude of diesel and fuel oil retail price
3/ Retail petroleum product price changes from late 1985 to mid 1986 in fourteen developing countries are tabulatedin the appendix.

3
changes in three regions between late 1985 and mid-1986.'/ Measured in current US$ equivalents,Figure 1 shows that retail prices dropped 15 to 20%, on average, from November 1985 to Jul;, 986.Real price reduactions, shown in Figure 2, averaged 25 to 30% over the same period. There havebeen two important results from the pattern of only small reductions in local prices of importedfuels:
a. all petroleum product retail pr n the countries researched were above estimatedborder prices and;
b. fuel prices currently faced by investors have changed little in nominal terms.
Diesel & Fuel Oil Real Price Changesin Constant 1985 Currency by Region
9 Month Constant Priee Changes '85-'861 0%-Diesel Fuel Oil
-' °% 1 .... ... .... I .................. .... .. l.. -20% :::: . ........ -::: ... .... :::::::::::::::: ..... ......... ... ::::::1... ..
so0% -...., ..... .......... . . .... ... ............;. .... .. .... .. 0%
--60% Asia Africa iaUn America Asia Africa Latin America
I Deast Drop Region Average 7 Most Drop
Source: see Annex
Figure 2 Retail Price Changes in Constant Local Currency
7. Since the drop in international oil product prices have been much more dramaticthan retail price cuts, the financial viability of RETs has not been affected nearly as much as theeconomics have been. For this reason, the analyses of Chapter 2 focus on the economics ofrenewable energy technologies.
4/ Figures based on retail oil product price changes in fourteen countries (see Annex).
4
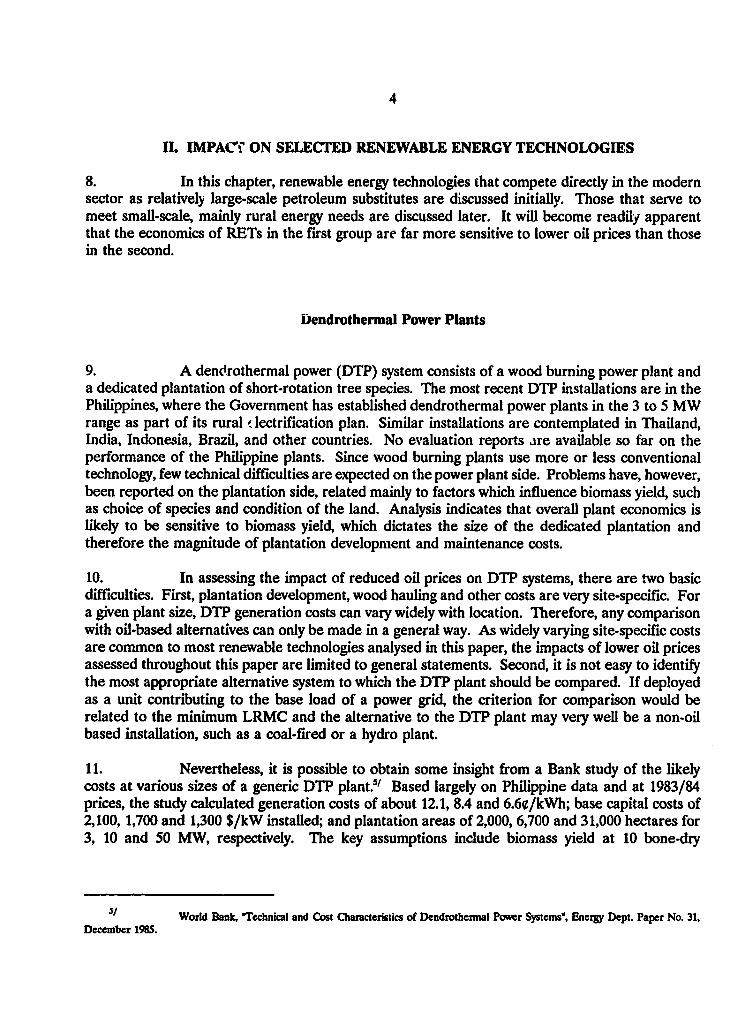
H. IMPACT ON SELECrED RENEWABLE ENERGY TECHNOLOGIES
8. In this chapter, renewable energy technologies that compete directly in the modernsector as relatively large-scale petroleum substitutes are discussed initially. Those that serve tomeet small-scale, mainly rural energy needs are discussed later. It will become readily apparentthat the economics of RETs in the first group are far more sensitive to lower oil prices than thosein the second.
iDendrothermal Power Plants
9. A dendrothermal power (DTP) system consists of a wood burning power plant anda dedicated plantation of short-rotation tree species. The most recent DTP installations are in thePhilippines, where the Government has established dendrothermal power plants in the 3 to 5 MWrange as part of its rural S lectrification plan. Similar installations are contemplated in Thailand,India, Indonesia, Brazil, and other countries. No evaluation reports are available so far on theperformance of the Philippine plants. Since wood burning plants use more or less conventionaltechnology, few technical difficulties are expected on the power plant side. Problems have, however,been reported on the plantation side, related mainly to factors which influence biomass yield, suchas choice of species and condition of the land. Analysis indicates that overall plant economics islikely to be sensitive to biomass yield, which dictates the size of the dedicated plantation andtherefore the magnitude of plantation development and maintenance costs.
10. In assessing the impact of reduced oil prices on DTP systems, there are two basicdifficulties. First, plantation development, wood hauling and other costs are very site-specific. Fora given plant size, DTP generation costs can vary widely with location. Therefore, any comparisonwith oil-based alternatives can only be made in a general way. As widely varying site-specific costsare common to most renewable technologies analysed in this paper, the impacts of lower oil pricesassessed throughout this paper are limited to general statements. Second, it is not easy to identifythe most appropriate alternative system to which the DTP plant should be compared. If deployedas a unit contributing to the base load of a power grid, the criterion for comparison would berelated to the minimum LRMC and the alternative to the DTP plant may very well be a non-oilbased installation, such as a coal-fired or a hydro plant.
11. Nevertheless, it is possible to obtain some insight from a Bank study of the likelycosts at various sizes of a generic DTP plant.5 ' Based largely on Philippine data and at 1983/84prices, the study calculated generation costs of about 12.1, 8.4 and 6.6e/kWh; base capital costs of2,100, 1,700 and 1,300 $/kW installed; and plantation areas of 2,000, 6,700 and 31,000 hectares for3, 10 and 50 MW, respectively. The key assumptions include biomass yield at 10 bone-dry
5/ World Bank, 'echnical and Cost Characteristics of Dendrothermal Power Systeme, Enetgy DepL Paper No. 31,December 1985.

5
tonnes/ha/yr and fuel oil price of 20¢/liter (roughly equivalent to a crude oil price of US$37/barrel which is close to 1983/84 Far East border prices).
12. The study compared the above DTP plants with stand-alon z diesel systems using fueloil. Even at a high 20e/liter, the electricity generation costs of a 3 MW diesel plant (7.7e/kWh)are substantially below the costs of a 3 MW DTP plant (12.19/kWh). The generation costs areroughly comparable (around 8e/kWh) at the 10 MW level. Thus, under the assumed parameters,including a fuel oil price of 20e/lt, DTP systems in isolation, such as on a remote island or in anarea not serviced by the grid, would be competitive with diesel systems at plant capacities above10 MW. At lower fuel oil prices, the comparative generation costs are shown in Table 1.
Table 1 Generation Costs at Various Fuel ORl Prices*e/kWh
Fuel Oil Price Diesel Dendro6
20 e/liter 7.9 e/kWh 8.40 e/kWh15 6.6 8.3410 5.4 8.275 4.1 8.20
* Costs for 10 MW plants operating 5500 hrs/yr.
13. The substantial drop in diesel generation cost as fuel oil prices fell below 1983/84levels has the effect of limiting economic competitiveness to larger scale DTP plants, making thisoption impractical due to greatly increased land area requirements and low load factors associatedwith larger systems. In fact, in small island or remote communities not served by the national gridwhere DTP systems are likely to be most useful, 10 MW is probably beyond existing and foreseeablepower demand. Because of this, it can be concluded that for cases approximating the parametersof the above study. current oil prices do not justify new investments in DTP plants.
14. As with most other RETs, however, a full economic analysis based on thecharacteristics of the particular location is necessary before a definite conclusion could be madeabout the viability of a DTP project. The analysis would include shadow pricing of labor, which isa highly intense input on the plantation side, determination of the opportunity cost of land, andquantification of long-term employment benefits accruing to people in the area. When assessingthe cost of alternatives, the economic or delivered cost of fuel oil at the site should also bedetermined. This could be considerably more than the international or border prices.
The smaU reduction in DI? generating cost is due to reduced truck fuel cost for wood hauling. Distance fromplantation border to power plant is 10.5 mn.

6
Bapasse
15. In recent years, interest has been renewed in making cane sugar mills energy self-sufficient and, thus, to produce surplus bagasse (the fibrous residue from cane crushing) forgenerating electricity to be used internally and for sale to the grid. Cane sugar mills exist in some80 countries and most are not energy efficient: at best, they recover just enough energy frombagasse to meet milling season needs. The investments required in "bagasse projects" are thosewhich considerably improve process steam economy and boiler efficiency, in effect obtaining thesame amount of energy with less bagasse fuel. Bagasse dryers, condensing turbo-generators,efficient juice heaters and pre-evaporators can increase thermal efficiency and decrease processsteam consumption considerably. Moreover, pelletizers and briquetting equipment can be used todensify surplus bagasse to be stored and transported safely and conveniently. This is espef-"'impor:3nt for ,ar-round electrical production where the markets for surplus energy are elet,utilities.
16. Davies Hamakua Sugar pioneered in this field with their mills in Hawaii. TheF.U.E.L. sugar miX in Mauritius has a'so installed, at the pilot level, equipment for generating anddensifying surplus bagasse, enabling it to sell year-round power to the grid. In 1985, the Bankconducted prefeasibility studies in Guyana and Ethiopia resulting in specific recommendations forbagasse projects in these countries.
17. In a typical bagasse project, economic return is based on revenues from sellingsurplus power and savings in internal use of petroleum fuels. In other cases, such as the projectproposed for Ethiopia, the surplus bagasse product was intended to displace fuelwood in homes andlater, to substitute for imported pulp and particle board feedstock. The impact of lower oil priceson project viability is fairly clear in the first case. It is less clear in the second case where thecommodity being displaced is not petroleum-based. The Guyana and Ethiopia studies illustrate thediffering potential impacts quantitatively.
18. Guyana's public electricity supply is almost totally dependent on imported petroleum.At present it suffers from a lack of generating capacity and system inefficiencies. Enmore, one ofthe country's 10 sugar mills, was chosen for a bagasse pilot project to demonstrate the feasibilityof making the mill independent of diesel which it now uses and, at the same time, generatingsurplus power from bagasse for feeding to the public grid. The investments total US$ 10.5 million,most of it by Guysuco for mill equipment and modifications, and partly by GEC for a 14 kmtransmission line, transformer, and control equipment. The benefits of the project would be savingsby Guysuco in diesel fuel (about 830,000 It/yr during the milling season) and avoided costs by GECin diesel fuel for 24 GWh/yr of peaking power to be supplied by the Enmore mill. Calculated atthe CIF value of diesel fuel at that time, which was " 5 ' 42/barreL the economic rate of return forthe project was an acceptable 21%. A drop in diesel fuel price by 25% reduces the ERR to 14%and, at half the 1985 price, the rate of return becomes only 5%. Thus, at present international oilprices, this particular project is not justified on the basis of fuel savings alone.
19. The Ethiopia project, proposed by an ESMAP study, consisted of investments in allthree Ethiopian sugar mills to enable production of about 100,000 tonnes/yr of surplus bagasse.

7
The current hydrop'wer surplus and power tariff structure does not make export of bagasse-basedenergy to the grid a viable option. The highest value end-use for surplus bagasse in the immediatefuture was determined to be as densified fuel for households and industry. Financial investmentsof US$ 12.2 million were required for the project which included densification facilities in each mill.
20. Unlike the Guyana case, the Ethiopian mills are fairly efficient. Only one of themills would obtain some internal savings in fuel oil. However, the most likely use of the densifiedbagasse would be as substitute for firewood, acute scarcity of which is being experienced byEthiopian households. Therefore, the benefits are mainly due to projected sales of densifiedbagasse which, if priced at 80% of the firewood price (to compensate for its less familiar, harderto ignite form), is thought to have a ready market. Under these conditions, the financial rate ofreturn is about 30%.
21. The economic value of firewood in Ethiopia is difficult to quantify but, consideringthe serious ecological impacts of massive deforestation which has occurred in the country, is likelyto be very high. Assuming that this value is at least as high as imported kerosene, the economicrate of return at 1985 prices would be a high 90%. Even with a 50% drop in kerosene importprice, the ERR would still be 43%. Therefore, for this particular project the impact of internationaloil prices on project viability is insignificant.
Fuel Alcohol
22. Ethyl alcohol (ethanol) is commonly produced by a fermentation/distillation processusing sugar cane juice or molasses (a by product of sugar refining) as feedstock. While otherfeedstocks, such as cassava, can be used, the technology for producing ethanol from cane ormolasses is better developed and more attractive economically because the cane by-product,bagasse, can be used as process fuel. Ethyl alcohol (ethanol) can be used as motor fuel in variousways. As nearly water-free or "anhydrouse ethanol, it can be blended with gasoline up to about 20%without decreasing the mileage yield of the gasohol product and without modifying normal gasolineengines. As hydrous ethanol, it can be used as a straight fuel in specially designed alcohol enginesor modified gasoline engines. The mileage yield of straight alcohol is about 75% that of gasoline.Presently, straight alcohol vehicles are used only in Brazil where an ambitious ethanol program hasbeen firmly established.
23. Since 1980, a number of countries have implemented fuel alcohol programs. Thelargest is that of Brazil where 10 billion liters of ethanol is currently produced for use as a blendand in straight alcohol cars. In Africa, plants in Malawi, Zimbabwe, Kenya, and Mali produceethanol from molasses to substitute for 3-15% of domestic gasoline demand. The IFC supportedthe Malawi project and submitted a proposal for a plant in Zambia while the small annexed

8
distillery in Mali was fir.anced with a World Bank loan. A recent Bank paper"' recommendedfurther assessment of proposed ethanol programs for Thailand and the Philippines.
24. In general, the viability of a fuel alcohol program increases when it is possible to uselower economic value molasses rather than cane as feedstock, the sugar mill is far from the coast,thereby reduci.g the value of molasses as an export commodity, and when the distillery can beann-xed to the sugar mill so that surplus bagasse can provide process energy for ethanol production.As the primary economic benefit of ethanol production is the displacement of imported gasoline,the economic rate of return of an ethanol project rises directly with the economic price of gasoline.Exchange rates a!&' affect economic viability, but less robustly because a strengthening localcurrency will reduce both gasoline import costs and export values of molasses and sugar. Additionalbenefits that should be accounted for in a fuli economic analysis include: employment, foreignexchange savings, and security of access to an indigenous transportation fuel.
25. To illustrate the impact of lower oil prices on fuel alcohol projects, it will besufficient to consider the case of anhydrous alcohol procauction from molasses (i.e., if projectjustification is lost for this case, so would it be for ethanol from cane). As with dendrothermalpower above, the economics of ethanol projects are very site specific. Hence, two representativeprojects will be analyzed: a proposal in Swaziland re-ently reviewed by the Bank and the Brazilianethanol program.
26. Three proposals for ethanol production in Swaziland were analyzed as part of theSwaziland Energy Assessment. The most promising proposal (by CDC/PEA for 65,000 lpd annexeddistillery at the Mhlume sugar mill) is designed to produce ethanol at 21¢/liter to meet 20% of agrowing national gasoline demand until i995 (details in Annex). If saving3 on imported gasolineare the only benefits counted in the economic analysis, the 22% drop in the actual landed price ofgasoline81, from 30e/l in mid-1985 to 24¢/l in July 1986, is enough to cut the project economic rateof return from 28.5% to 18%.
27. The approximate minimum real crude oil prices needed to justify the Braziliananhydrous ethanol program in economic terms are shown in Table 2 below9 /. Minimum crude oilbreak-even prices for hydrous import substitu:-on and ex.ort of hydrous ethanol average 25% and50% higher.
7/ Ody, A., ePrects for Etbanol ir Developing Countries, INDD2 Office Memorandum, 21 Februaiy 1985, WorldBank.
S/ The FOB price of gasoline in the Middle East market dropped 50% from October 1985 to July 1986, while due to
high transportation cogs and other levies, the landed cost of gasoline at Matsapha, Swaziland dropped only 22% over the same period.
9/ Draft Public Sector Investment Rcview Brazi, October 1986, LC2BR World Bank.

9
Table 2 Mlnlmum Crude Price for Economic Viability ofAnhydrous Ethanol Distilleries In Brazil
in Constant 1984 USS/barrel
Sa6 Paulo Northeast
Build New Distillery 23-28 24-34
Operate Existing Distillery 17-23 20-28
28. The CIF price of crude in November 1985 in Santos, Brazil was US$ 29.40/bbl. TheCIF Santos price had fallen below US$ 15/bbl by August, 1986 and was nearly US$ 17/bbl inFebruary, 1988. Hence, since mid 1986, the ethanol program in Brazil could be only marginallyjustified in a strict economic sense. Because of this the Government of Brazil has announced asuspension of further expansion in fuel alcohol distilling capacity.
29. As anhydrous ethanol substitutes for imported gasoline, the economic viability ofethanol production is robustly sensitive to the cost of imported gasoline. The Swaziland proposalsummarized above is for a plant designed to produce ethanol at roughly 21¢/liter, whilerepresentative production costs in Brazil range between 18e and 26e/liter.'° If the economic costof gasoline remains above these prices, all else being equal, ethanol production makes goodeconomic sense. Many proposed ethanol installations have been at locations far inland, where thetransport component of gasoline costs are high and the export value of molasses is low or nil.Consequently, at such installations (as in Swaziland), the actual landed cost of gasoline will not havedropped as much as the drop in international FOB prices. Hence, the Mhlume proposal stillappears viable using actual summer '86 gasoline import prices as delivered to Matsapha. whilecertain installations in Brazil are on the margin of economic justification.
Wind Electricity Generation
30. To properly assess the place of wind electricity generation capacity in an electricalgrid, planners must consider the uncertainty of wind power supply, daily and seasonal wind profilesand how they match load profiles, fuel savings due to use of wind turbines, as well as possibledeferrals of future capital investment in conventional generation capacity. Hence, the economicvalue of ",ind power is determined not so much by average cost considerations as by long runmarginal cost and wind time distribution characteristics.
IO/ SAR: Brazil Alcohol Rationalization and Efficiency Project, Industry Department, World Bank, 1985. Quoted costsare average 1983 costs of alcohol production in constant 1984 USS.

10
Grid-Connected Wind Turbine EconomicsAvg Cost: Wind vs. Fuel Oil Generation
cents/kWh
8-- 6m/sec -8
NON-ECONOMIC7 -
- 7m/seC --
6 / ~~~~ECONOMIC
45 15 25
Fuel Oil Price ($/bbl)Source: See Annex
Figure 3 Wind vs. Oil-Based Generation Costs
31. With this caveat in mind, a rough "order of magnitude" analysis can be conductedon electricity generation costs of wind vs. thermal. The results of such an analysis are shown inFigure 3 in which representative generation costs over a range of oil prices for a hypothetical grid,supplied exclusively by large base load fuel oil steam plants and smaller diesel oil gas turbinepeaking plants, are compared to estimated wind electricity generation costs."'/ Though actual costscan vary considerably, these generic cost estimates show that lower oil prices can significantlychange generation costs. A 50% drop in representative 1985 import prices of diesel oil (from 30e/lto 5l/l) and fuel oil (from US$ 30/bbl to US$ 15/bbl) could reduce electricity generation costssome 30%, from 8.3¢ to 5.8e/kWh. Of course, if a significant share of total demand is met by coal,gas, nuclear, or hydro capacity, the actual change in system generation costs due to lower oil priceswill be less than that depicted in Figure 3.
32. The wind electricity costs presented in Figure 3 are rough estimates, based on theactual costs of 100kW wind turbines in California wind farms, for a good wind regime (annualaverage windspeed of 6m/sec) and two excellent regimes (7 and 8m/sec). It is evident thatelectricity generated with an annual average windspeed of 6m/sec, not unlike the resource in themountain passes of California, would cost as much as electricity generated by an optimally run oil-
11/ Detailed assumptions are tabulated in the Annex Wind electricity costs are based on actual costs from Californiawind farms.

11
based system under estimated 1985 economic fuel prices of US$ 30/bbl fuel oil and 3O0/liter dieselfuel. At lower oil prices, only rare wind resources remain economically competitive with oil-basedgeneration on an average cost basis.
33. Moreover, as amply demonstrated in a recent Bank Energy Department Paper,"'unless the wind resource and demand peaks are closely matched, wind turbines displace primarilylow cost intermediate and base load capacity. Clearly, in an environment of economic oil pricesbelow US$ 15/bbl, wind-to-grid electricity generation would not be cost effective unless averageannual windspeeds exceed 6m/sec and the wind profile tightly corresponds to demand peaks.
Biomass Gasiriers
34. In biomass gasifiers, solid combustible biomass materials like wood, charcoal, ricehusks, or coconut shells, are thermochemically broken down into a combustible gas. Though theenergy content of this "producer gas" (4 to 7 MJ/m3 ) is usually far less than that of natural gas(35 MJ/m3 ), the economics of gasification were attractive enough throughout the early 1980's forindustrial and commercial process heat applications to become common in Brazil, Southeast Asia,and the South Pacific. Heat gasifiers, primarily large systems replacing fuel oil in industrialapplications, are commonly located in urban or peri-urban areas. Conversely, many ruralapplications are found for power gasiflers that burn the gas in internal combustion engines. Theseapplications primarily replace diesel oil in small engines used to generate electricity, pump water,or mil grain. Given these basic differences, the impact of changing oil prices on the economicviability of these systems must be viewed independently.
Heat Gasifiers
35. Biomass heat gasifiers are presently used to provide process heat in a wide varietyof applications including: tea, grain, and lumber drying; glass, tile, and brick manufacturing; cementproduction, food processing, and greenhouse heating. Heat gasifier systems, consisting essentiallyof a fuel feed system, reactor chamber, and gas burner, are commercially available in sizes from100kW to 10MW. The smaller, manually batch fed, systems are commonly used for crop drying,baking or other similar applications. The larger systems are automatically fed and are used toprovide heat for industrial kilns, boilers, driers and furnaces. As heat gasifiers can usually beretrofit to existing oil or natural gas burning equipment, the potential number of applications isextremely large. The main constraint to wide scale use of biomass heat gasifiers is posed by theirrequirement of an economic and reliable source of biomass fuel.
12/ Moreno, R., Guidelines for Assessing Wind Enerrv Potential Energy Department Paper #34, World Bank, January1987.

12
Heat Gasifier Retrofit EconomicsHeat Gasifiers vs Fuel Oil Boiler Costs
Cost of Steam (S/GJ) Fuel Oil Price ($/bbl)
a Economic Zone1
6 30
2- - Non-Economic Zone -to
0 10 20 30 40 50 60Wood Price ($/tonne)
1 7 = z ~~~~GASIFEER cosTsI
| 115.000 per GJ/hr '-- $25.000 per GJ/br --- M35000 per GJ/br|
Source: See Annex
Figure 4 Heat Gasifiers vs. Fuel Oil Boiler Costs
36. As with fuel alcohol programs above, the primary economic benefits of heat gasifiersaccrue from savings in imported petroleum fuels. Given the wide range of possible heat gasifierapplications, it is difficult to generalize on the economics of these systems. Nonetheless, a briefcost analysis of a generic heat gasifier retrofit to an oil-fired boiler illustrates the sensitivity of thistechnology to lower oil prices. Figure 4 shows the economic sensitivity of such a system to changesin oil prices, wood fuel prices, and gasifier capital cost estimates.'/ For a drop in fuel oil pricefrom US$ 30/bbl to US$ 15/bbl411 the break-even fuelwood price for a moderately priced heatgasifier system (US$ 25,000/GJ/hr) drops from US$ 30/tonne to near zero.
37. As the market for large scale heat gasifiers is generally in populated urban or ruralareas, where fuel oil is commonly available and alternate demands for wood fuels exist, thefuelwood price is usually above US$ 20/tonne. Moreover, as large scale heat gasifiers tend to befully mechanized, they commonly have capital costs at the high end of the range shown in Figure4. Conversely, small scale heat gcsifier systems such as those used for tea and copra drying, areusually located in more remote areas where the economic cost of fuel oil is relatively high while the
Source: Foley, G. and Barnard, G., Biomass Gasification in Deeloping Countries, Eanhscan, 1983. Gasifier costestimates summarized in Annex.
14/ Avert border prices for fuel oil dropped from S30435/bbl in November 1985 to S10-SlS/bbl in July 1986 forcountries with or near a por.
13
economic price of wood and biomass fuels c.an approach zero. In addition, small scale heat gasifiersare amongst the lowest cost systems shown in Figure 4 because they are often manually fed. Forthese reasons, the economic feasibility of large scale heat gasifiers will be affected first bydecreasing petroleum prices. Small scale installations in remote areas may continue to becompetitive because of access to and reliability of low cost biomass fuel supply and high transportcosts of petroleum fuels.
Power Gasifiers
38. Biomass power gasifiers from 5 kW to IMW are commercially available. A powergasifier systcm consists of a manual or automatic feed system, a reactor chamber, a gas clean upsystem and either a diesel or spark ignition engine. If a diesel engine is used, some diesel fuelstill must be used to induce ignition. Most commercially available power gasifiers are designed tooperate with a specific biomass fuel: wood, charcoal, rice husks or coconut husks. The analysisbelow focuses on wood and charcoal power gasifiers as these are the most common.
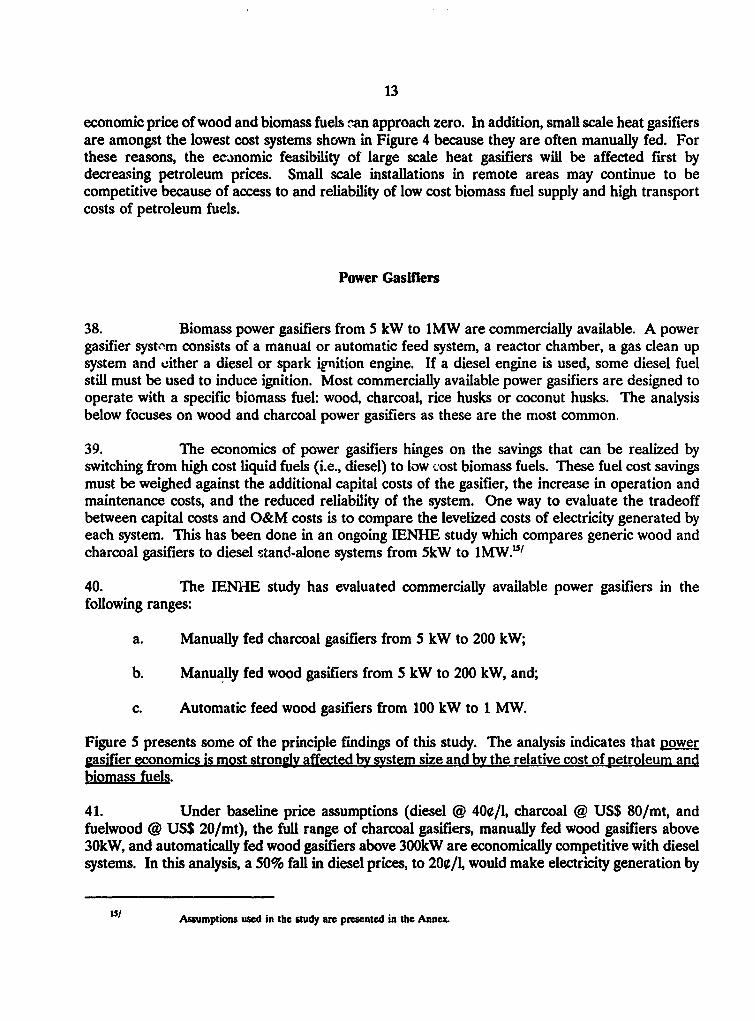
39. The economics of power gasifiers hinges on the savings that can be realized byswitching from high cost liquid fuels (i.e., diesel) to low cost biomass fuels. These fuel cost savingsmust be weighed against the additional capital costs of the gasifier, the increase in operation andmaintenance costs, and the reduced reliability of the system. One way to evaluate the tradeoffbetween capital costs and O&M costs is to compare the levelized costs of electricity generated byeach system. This has been done in an ongoing IENHE study which compares generic wood andcharcoal gasifiers to diesel stand-alone systems from 5kW to 1MW.'5'
40. The IENHE study has evaluated commercially available power gasifiers in thefollowing ranges:
a. Manually fed charcoal gasifiers from 5 kW to 200 kW;
b. Manually fed wood gasifiers from 5 kW to 200 kW, and;
c. Automatic feed wood gasifiers from 100 kW to 1 MW.
Figure 5 presents some of the principle findings of this study. The analysis indicates that powergasifier economics is most strongly affected by system size and by the relative cost of petroleum andbiomass fuels.
41. Under baseline price assumptions (diesel @ 40o/l, charcoal @ US$ 80/mt, andfuelwood @ US$ 20/mt), the full range of charcoal gasifiers, manually fed wood gasifiers above30kW, and automatically fed wood gasifiers above 300kW are economically competitive with dieselsystems. In this analysis, a 50% fall in diesel prices, to 20e/L would make electricity generation by
IS/ Assumptions used in the study are presented in the Annex.

14
Costs of Electricity ProductionSmall Stand-Alone Systems
Electricity Costs (S/kWh)
0.7 0.7 - POWrER SOURCE
I e0 Dise l e 4oc/I
0.6 Diesel * 200/1
\ & ~~~~~~~~~~Chortas 0 $80/mt0.5 Woodgae/m $20/mt
0.4 Wogea$0m
0.3>
0.2
10 t00 1000
INSTALLED CAPACITY (kW)Source: See Annex
Figure 5 Generation Costs of Gasifiers vs. Diesel
diesel cheaper than either charcoal or wood power gasifiers over the entire range of analysis.
42. With decreasing petroleum prices, it is clear that power gasifiers, like small-scaleheat gasifiers, will have a niche only in remote applications where the economic cost of diesel ishigh due to transport costs, where diesel supply is unreliable, and where there is a surplus ofbiomass fuels.
Solar Water Heating
43. The basic principle behind solar water heating (SWH) is simnple: by passing a coolfluid through small pipes imbedded in a black collector plate, exposed to the sun and housed intransparent glass, thermal energy is captured in the heated fluid. SWH designs depend on the enduse (industrial process heat, restaurant, hotel, or domestic hot water), load and solar resourceprofiles (daily and seasonal), and water temperature requirements. The solar collector itself is themost expensbie system component, commonly constituting over 50% of installed system cost. Asmost end uses require additional components, such as circulating pumps, temperature controllers,storage tanks, and heat exchangers, che cost of solar water heating can vary significantly with eachapplication.

15
44. Many developing countries have active solar water heating industries. Solar waterheaters for residential and small commercial installations are manufactured locally in Israel andJordan where as many as 1 in 5 homes use solar water heating. The SWH industries in Morocco,Tunisia, Egypt, Senegal, and Zimbabwe fabricate as well as import some collector components.Both India and Nepal have sound SWH industries supplying residential and commercial systems.Australia, Israel, France, USA, and Japan are major exporters of SWH technology and largedorr.estic markets exist in both Australia and the USA.
Industrial Sector SWH ApplicationIRR: Kenya Brewery Fuel Oil Retrofit
SWYH Internal Rate of Return
40%
30%
20%-
10% 0o%
0% I I ._ * * . _10 15 20 25 30 35 40 45
Fuel Oil Economic Cost ($/bbl)Source: See Annex
Figure 6 Solar Hot Water Fuel Oil Boiler Retrofit
45. Industrial applications of solar water heating in developing countries are limited toa few large pilot plants in the Middle-East and a few other countries. The brief analysis below,based on an ESMAP study of the potential for solar water heating in Kenya, illustrates that low oilprices can severely curtail the economic advantages of industrial SWH.
46. An ESMAP SWH study for Kenya, originally assessed at 1985 fuel prices, wasrecently reevaluated at borde.. prices of August, 1986.16/ The border price of fuel oil fell from US$16.75 to US$ 11.25/bbl over this period. Because all of the industrial SWH installations originally
16/ Joint UNDP/World Bank ESMAP Solar Water Heating Study, Kenya, December 1986. Assumptions and resultsof this report are summarized in the Annex.

16
proposed were only marginally viable, this drop caused over 90% to lose economic viability."7 'Conversely, even though the cost of electricity supply in Kenya fell from 5.5e/kWh in October 1985to 4.4¢/kWh in August 1986, all residential installations proposed in the original report (exclusivelyfor the displacement of electric water heating in upper income urban homes) were still found to beeconomically viable.
Residential Sector SWH ApplicationIRR: Electric Water Heater Retrofit
SWH Internal Rate of Return
s0% .
60% /
40%
20% -
0% I l l2 3 4 5 8 7 8 9 10
Economic Cost of Electricity (c/kWh)Source: See Annex
Figure 7 Solar Hot Water Electric Water Heater Retrofit
47. The economic sensitivity to fuel prices of two representative SWH installations inthe Kenya study are displayed in Figures 6 and 7. Under the assumptions used in the Kenyareport,18 ' it can be generally stated that if the economic price of displaced fuels remains above US$150/TOE (US$ 25/bbl fuel oil, 4e/kWh. or US$ 50/mt wood). state-of-the-art SWH installationsin locations with good solar resources may be cost effective. As the landed cost of fuel oil droppedto around US$ 10/bbl in JuJr 1986 and are below US$ 15/bbl as of February, 1988 for mostcountries with a port and the price of fuelwood rarely exceeds US$ 50/mt, SWH installations that
17/ For purposes of this paper, installations with an economic rate of return above 15% are considered economicallyviable.
18/ Economic rates of return were calculated by comparing the economic value of displaced fuels to SWH system costs
(including imported collectors and locally made balance of system components) calculated @ S103/m2 of colector area for industrialapplications and $126/m2 for al others over a 15 year lifetime at 10% discount rate.

17
displace these fuels may not be cost effective unless cheaper, domestically produced SWH systemsare available.
48. While the actual drop in fuel oil prices in Kenya has severely curtailed the economicviability of SWH systems that displace fuel oil, systems that displace electricity were barely affectedbecause generation costs did not change markedly and the economics of SWH retrofits for electricwater heaters are robust. State-of-the-art solar water heating systems sized for Kenyan conditionscost about 40 per kWh displaced. As electricity system costs commonly range from 3e-lOa/kWhfor hydro-power to 5e-20e/kWh for thermal generation. SWH systems can deliver hot water fordomestic uses at lower cost than electrical water heating in most places with a good solar resource.Nonetheless, this does not imply that SWH is the lowest cost water heating technology. ComparingSWH system costs to those of electric water heaters does not assure SWH a market niche if fueloil boiler retrofitting is cheaper.
Biogas
49. Biogas is the gaseous product (mainly methane) obtained in the anaerobic (oxygen-free) digestion of dung and other biomass wastes. About 6-7 million biogas digesters have beenbuilt in China,19/ about half a million in India, and a few thousands in other developing countries.A majority of the digesters use cattle or pig manure as feedstock. Most of the digesters now inoperation are 'family size", each unit yielding about 2 m3 of biogas daily and requiring dung fromat least 3 cattle or 6 pigs. The larger digesters are often built for institutions (schools, prisons, etc.),industries (slaughterhouses, breweries) and communities, where gas from a big digester is piped tothe kitchens of several families.
50. The costs of establishing and operating a biogas digester include capital investmentfor the digester, gasholder, pipes, and accessories; labor for construction, dung collection, andsystem operation; and the costs of water, land (for the installation), and the dung itself. Some ofthese items require cash outlays, others do not. The family-sized KVIC system in India, forexample, has a capital cost of about Rs 4250.
51. The first principal benefit is the fuel value of the gas. If used for cooking, it maydisplace kerosene, fuelwood, or dried dung. For lighting with a mantle lamp, it usually substitutesfor kerosene. As fuel for an internal combustion engine to obtain direct shaft power for flourmilling, water pumping, or electricity generation, it displaces diesel fuel, gasoline, or grid electricity.The slurry or dried sludge represents the second principal benefit ir. terms of its value as fertilizeror "soil conditioner". The value of the sludge is often assessed as equal to or even greater than thefuel value of the gas, depending on the particular installation.
19/ Taylor, RP., Decentralized Renewable Enerev Development in China: The State of the Art. World Bank StaffWorking Paper #535, 1982.
18
52. In the financial analysis, the flow of costs and benefits is evaluated over the digesterlifetime of 15-20 years. The value of gas in terms of substituted fuels is fairly easy to determine.However, valuation of sludge or slurry as fertilizer substitute has always been an itern ofdisagreement. Although the viability of a biogas installation can only be assessed on a case by casebasis, it is possible to make some general statements. Without subsidies, it is virtually impossibleto make a system financially viable on the basis of the fuel value of the gas alone. Counting thefertilizer value of the sludge, there may be some instances where acceptable financial rates ofreturns may be achieved. It may also be generally said that due to the scale factor, family-sizesystems are generally less viable than community-sized biogas systems. These statements are drawnfrom recent analyses done by many authors when petroleum product prices were high. Clearly, atcurrent (1986) oil prices, the financial viability of biogas systems in general has either remained thesame or worsened.
53. It must be kept in mind, however, that national policies for disseminating biogassystems are adopted not only on the basis of fuel substitution goals. There are indeed othereconomic benefits, including: destruction of pathogens in the raw dung, health benefits tohouseholds from using a smokeless fuel, reduction of pressure on the forests from fuetwoodcollection, employment generation, reduction of uncertainty in fuel supply, and reliance onindigenous rather than imported energy.?' For obvious reasons, there have been no generalagreements on how these externalities should be quantified and incorporated into the economicanalysis of biogas projects.
54. It is beyond the scope f the present analysis to make a judgement on the economicdesirability of biogas technology. The only task is to assess the potential impacts of lower pricesof competing petroleum fuels. As the preceding discussion clearly indicates, it has been difficultto justify biogas systems on the fuel value of the gas alone even when oil product prices were high.Therefore, lower oil prices would cause very little change in the financial viability of biogas systems.
Photovoltaic and Wind Powered Water Pumpingfor Village Water Supply and Irrigation
55. Wind power has been used for grinding grain for centuries. Water pumping bywindmills played a major role in the agricultural development of the American West and landreclamation in Holland. Relative to the history of wind power, photovoltaic technology or PV hasjust been born. Today's photovoltaics (solar cells) convert about 10% to 14% of the energy inincident sunlight into electricity. Falling production costs have recently made direct solar electricconversion competitive with diesel as a power source for remote power supply applications. WhilePV pumping systems require power conditioning equipment to convert direct current electric powerinto rotating mechanical power for the pump, most windpumps transfer the rotary motion of theblades directly to the pump via a mechanical shaft. Well designed wind machines can convert 25-
2D/ Conversely, equity and distributional concerns are raised by biogas technology. affluent households have moreopportunities to build biogas digesters than poorer people who would be deprived of dung otherwise available to them for conversionto dried fuel.

19
40% of the power in the wind into rotary power. In remote locations with mean monthly windspeedin excess of 3 m/sec, wind can be the most economic power source for water pumping.
56. Since 1979, significant operating experience with PV pumping has been gainedthrough UNDP and USAID funded projects. Major projects include the Mali Aqua Viva Program,Desert Development in Egypt, Solar Pumping in Botswana, Remote Village Water Supply in India,and the UNDP Pump Test Project. Small PV pumping systems are in place throughout theCarribean, Africa, South and Southeast Asia.
57. In the developing world, wind pumps are produced in Kenya, Ethiopia, Mall, SouthAfrica, India, Pakistan, China, Thailand, Philippines, Peru, Argentina and Brazil. Data on installedwindpump capacity has not been gathered on a global scale. Nonetheless, as over 50 knownwindpump manufacturers were operating globally in 1983 (20 for more than 20 years),2 '/ it is evidentthat the industry serves a significant global market.
Village Water Supply Power Source Costs20 Liters/capita, head = 40m
Power source costs only ($/m3)
Diesel 0 15c/l
1.2 I Diesel 0 45c/1
l \ind 0 3m/sec
W Wind 0 4mn/sec
0.9 _ 3< PV 0 4kWh/mt2
-0 PV@ S kWh/zn2
0.8-x
0.3. I
100 300 500 700 900 1100
Village Population
Figure 8 Village Water Supply Costs: PV, Wind & Diesel
21/ IT Power LTD, Wind Technology Assessment Study, Vol 1, pp 16, February, 1983.

20
58. Both wind and solar electric pumps convert low density power flows into pumpedwater, Conversely, a diesel pumpset is designed to convert a dense form of potential energy intoa relatively large mechanical torque on demand. The smallest diesel engines deliver about 2.5 kWof power at rated load, while many small-scale pumping applications could be satisfied with lessthan 500 Watts of power, four hours daily. Consequently, in many small village water supply andirrigation applications, diesel pumpsets supply only a fraction of the water they are rated to deliverover their lifetimes. Because of the technical lower limit to diesel pumpset size, photovoltaic andwindpumping technologies carve out an economically competitive niche in small scale mechanizedwater supply.
59. Figure 8 shows representative village water supply costs at 40m head provid5d bydiesel, photovoltaic, and wind energy sources." Because fuel accounts for only 5-20% of totalwater costs, the diesel cost curves are largely insensitive to fuel price changes. In comparison toPV pumpsets and windpumps, the hypotheticai 67% drop in diesel fuel price from 45e to 15¢/litermakes diesel pumping economically competitive with PV and wind at 12% and 21% smaller villagepopulations.
Irrigation Water Costs34 m3/ha/day Head = 8m
Power source costs only ($/m3)
0.5 _ f Diesel 0 l5c/1
- Diesel e 45c/1
0.4 Wi WFnd 0 3m/sec
Wl Wind 0 4m/sec
X x- pV O 4kWh/m20.3 \ PV @ 5kWh/m2
02 :
0.10 0.5 t 1.5 2
Irrigated Area (hectares)
Figure 9 Irrigation Water Supply Cost: PV, Wind & Diesel
22/ Water cost curves generated by the World Bank Handpump Model, Urban Water Supply Department. Water costsinclude annualized costs of each pumpset, the well, and storage. Assumptions for village water supply and irrigation models are presentedin the Annex.
21
60. Irrigation water costs at 8m head are shown in Figure 9. As above, a 67% drop indiesel fuel cost would maiw diesel economically competitive with PV and wind at 6% and 16%smaller irrigated plots. Clearly, the economic tradeoff between power sources for either waterpumping application is not significantly changed by a large drop in oil prices.
61. In actuality, the landed cost of diesel fuel in remote regions where these technologiesare cost effective has not changed nearly as much as international prices because of significantoverland transport costs.>' In addition, the operators of village water supply systems or smallpumps for irrigation often face retail fuel prices well above economic prices due to lack ofregulation in outlying areas.2 " For these reasons, the actual impact of lower international oil priceson village water supply has been far less than the extreme case assumed abovt f a 67% price dropfor diesel fuel.
62. Moreover, the final choice of pumping system is commonly based on more than justannual water costs. Other factors such as reliability, fuel availability, and ease of maintenance canrank as important as water costs. In areas where the supply of diesel fuel may be erratic or spareparts and skilled mechani - are scarce, photovoltaic and wind power systems may be the mostreliable power sources. lic- -ever, the need for financing can be significantly greater for PV andwind pumps. Hence, access to credit can become a major issue in the tradeoff between diesel andrenewable technologies for water pumping.
63. In sum, the impact of lower diesel fuel prices on the viability of PV and wind powerfor water pumping is relatively small because:
a. fuel costs constitute only a fraction of annualized water costs for small dieselpumpsets, and so, a large fuel price decrease results in only a small drop in annualwater cost for diesel pumped water;
b. large price decreases have not occurred in remote areas because falling import costsconstitute a small part of the final diesel fuel price when long overland transport isrequired, and;
c. other factors such as reliability, maintenance requirements, and access to credit canbecome as important as annualized water cost in the final decision between diesel,wind, and solar powered water pumping.
23/ Recent Bank reports cite a transportation margin on diesel fuel of up to 18t/liter for a 1500 kM overland haul inZaire and transport costs of 1Oe/liter for 1120 kM overland transport in Uganda. This indicates an average overland transportation costof roughly 10/tonne-km.
24/ Retail prices of small quantity purchases is often uncontrolled in remote regions. For example, the official retailprice of kerosene was SOe/liter below the actual market price in Kano City, Nigeria in 1980 [F.shwick. 19811.

22
III. CONCLUSIONS
Factors Influencing the Effect of Lower Oil Prices on RETs
64. The analyses presented in Chapter 2 indicate that, in general and with the discountrate used in Bank studies, the economic sensitivity of renewable energy technologies to lowerinternational oil prices can be a function of scale and location. Though lower oil prices reduce theeconomic viability of renewable energy technologies, high transpor costs and diseconomies of smallscale conventional alternatives make renewable technologies the most economic choice in somelocations.
65. Scale: Fuel costs generally compr:3e a larger percentage of total annualized systemcosts for large-scale petroleum-based conventional energy technologies than for small-scaleapplications. Hence, a marked decrease in fuel oil and diesel fuel prices reduces larg- scaleconventional energy costs significantly, while barely changing the total costs of smaller conventionalenergy technologies. Because of this, renewable energy technologies that compete directly in themodern sector as large-scale petroleum substitutes are most adversely affected by falling oil prices.
66. A concrete illustration of this general result can be seen in Table 1 and Figure 8.In Table 1, a 50% drop in fuel oil price (from 20 e/l to 10 e/l) would reduce the cost of electricitygenerated by a 10 MW diesel by over 30%. In Figure 8, a 67% drop in diesel fuel price (from 45¢/1 to 15 e/l) would reduce the cost of water, pumped by a 2.5 kW diesel for a village of 500, byless than 10%.
67. Location: RETs that are large-scale petroleum substitutes tend to be located closeto urban areas, while the smaller, stand-alone technologies are often used in rural and remoteapplications. The economic prices of petroleum fuels generally increase with distance from majorurban areas because of transportation and distribution costs. Likewise, the economic prices ofbiomass fucls generally decrease with distance from major urban areas due to increasing availabilityin rural areas. For these reasons, the economic viability of rural and remote RET applications isaffected less by falling international oil prices than large-scale, petroleum substitution RETs locatednear urban areas.
68. Two additional attributes of location serve to insulate the economics of small-scale,rural RET applications from the fail in oil prices. First, as shown in Figures 1 and 2, the regulatedfinancial prices of diesel fuel and fuel oil have not been reduced nearly as much as the drop ininternational FOB oil product prices. It has been noted that retail prices of small quantityconventional fuel purchases is often uncontrolled in remote iegions. Hence, operators of small-scale rural energy applications can face financial fuel prices well above regulated prices and farabove economic fuel costs. Second, a reliable supply of conventional fuels is much more commonin and near cities than in remote regions. Even though the economic analysis may show aparticular RET to be slightly more expensive than a conventional power source, an intermittentconventional fuel supply could well be enough to make the renewable application the appropriatechoice.

23
TECHNICAL ANNEX
Fuel Alcohol Base Case Assumptions .......................... 27
Wind Electricity Generation .......................... 28
Heat Gasifiers .......................... 29
Power Gasifiers .......................... 30
Solar Water Heating .......................... 31
Water Pumping Model Assumptions .......................... 33

SELECTED PETROLEUM PROUCT PRICE CHANGES: 1985 - 1986
ASIA
BANGLADESH b/ PAKISTAN c/ INDIA dt INDONESIA e/ PHILIPPINES f/
(July 86) (1985) (July 86) (July 85) (1986) (1985) (July 86) ('d0v 85) (June 86) (Jan 86)FIELS et lIIT It U UC -T'-US c PRs US C PRs US c Rs US c Rs US c Rp US c R. US C P US C P US C
Gasoline Prmiu liter 12.88 42.51 14.67 53.35 6.95 41.00 7.15 44.69 7.43 57.20 7.00 56.70 440 38.90 443 39.18 6.90 33.67 7.40 38.74Regular liter 385 34.04 385 34.28 6.53 31.85 7.03 36.81Kerosene liter 6.71 22.15 7.22 26.25 3.00 17.80 3.30 20.63 2.25 17.30 2.11 17.10 165 14.59 165 14.69 4.86 23.71 5.76 30.16LPG kg 9.08 29.97 8.40 30.55 4.06 31.20 3.62 29.30 7.44 36.29 9.74 50.99Notor diesel liter 6.71 22.15 7.22 26.25 3.85 22.90 4.25 26.s6 3.50 26.90 3.39 27.40 200 17.68 242 21.55 4.76 23.22 5.72 29.95Industrial diesel liter 200 17.68 220 19.59Fuel Oit Liter 4.70 15.51 5.46 19.85 1.55 9.20 1.62 10.09 200 17.68 220 19.59 2.82 13.76 4.12 21.57NATURAL GASDrestic mcf 44.88 148.12 40.80 148.36 18.09 107.55 18.00 112.50
AFRICA
ZAIRE g/ KENYA ht TANZANIA if SWAZILAN0 j/
(Aug 86) (Jan 86) (July 86) (Nov 85) (July 86) (Oct 85) (JuLy 86) (Nov 85)FUELS UtITS Z US c Z US F'Sh US c 1 Sh US c STSh US c T'Sh US c S c US c SW c US c
Gasoline Prmium titer 32.0 54.47 33.0 59.89 30.6s 72.98 19.65 115.59 73.0 33.18 99.0 37.67Regular titer 25.40 60.48 16.55 97.35 65.0 29.55 95.0 35.19Kerosene liter 23.0 39.15 25.4 46.10 3.47 21.68 4.n 28.61 11.45 27.26 7.50 44 12 59.0 26.82 81.0 30.00LPG kg 69.0 117.45 71.0 128.86 5.89 36.81 7.38 44.73 15.11 35.98 10.15 59.71 155.3 57.52Motor diesel liter 26.0 44.26 28.0 50.82 5.00 31.25 5.78 35.03 14.10 33.57 8.55 s0.29 61.0 27.73 83.0 30.74Irdistrial diesel liter 1.88 11.75 2.27 13.76 11.82 28.14 7.45 43.82 58.0 26.36 86.0 31.85Fuel Oit Liter 15.0 25.53 18.0 32.67 1.51 9.44 1.95 11.82 8.60 20.48 5.49 32.29
LATIN AMERICA
HAITI k/ COSTA RICA I/ BRAZIL u/ BELIZE n/ ECUADOR of
(Aug 86) (Sept 85) iAug 86) (Nov 85) (May 86) (Oct 85) (Apr 86) (1985) (July 86) (July 85)FUELS UNITS US c G USc C USc C USc CrS US Cr Usc BzS Us c BZS US c S. US c S. US cGasoline Preai.L titer 2.52 50.4 2.97 59.4 24.00 42.63 24.00 45.45 4.65 33.60 2.26 26.40 0.89 44.30 0.98 49.20 17.28 15.85 17.00 25.30Regular liter 0.86 43.10 0.96 47.80 13.25 12.15 13.20 19.70Kerosene liter 1.80 36.0 2.35 47.0 17.00 30.20 17.00 32.20 0.51 25.70 0.61 30.70 3.74 3.43 3.55 5.30LPG kg 10.67 9.78 10.33 15.40Motor diesel liter 2.S 41.0 2.97 59.4 19.00 33.75 19.00 35.98 3.02 21.82 1.58 18.46 0.70 34.80 0.76 37.80 10.65 9.77 10.40 15.50ildustrial diesel literFuel Oil liter 6.00 10.66 6.00 11.36 1.52 10.97 0.78 9.12 7.49 6.87 6.60 9.80

25
NOTES TO TABLE
1/ SOURCE: Petroleum product prices are quoted in local currency and are converted to US$at prevailing market exchange rates as noted. In coutries where no distinction is made betweengrades of gasoline or grades of diesel oil, prices for these products are listed as premium gasolineand motor diesel. For further product specification, such as gasoil in Africa, see notes for eachcountry.
2/ SOTJRCE: All prices from de Lucia and Associates, converted at Tk3O.3 = $1 (July '86)and Tk27.5 = $1 (1985). Fuel oil price is ex-depot.
3/ SOURCE: All petroleum prices from de Lucia and Associates. Fuel oil price = Rs1650/mt, assumed 6.7 bbl/mt. Prices converted to $US at Rs 16.82 = $1 (July '86) and Rs 16 =$1 (July '85). Natural gas prices, from EGYDI, World Bank, are for the first 7 mcf/monthconsumed at domestic rates.
4/ SOURCE: All prices from de Lucia and Associates, converted to $US at Rs 13 = $1 (1986)and Rs 12.35 = $1 (1985).
_/ SOURCE: World Bank Staff Appraisal Report #5942-IND, 11 April 1986 and World BankEconomic Memorandum #6201-IND, 20 May 1986. Petroleum product prices remained unchangedbetween 1 April 1985 and March 1986. These prices are reported as November 1985 prices andare converted to $US at 1123 Rp = $1. July 1986 prices announced by te Department of Mine andEnergy, Indonesia on 9 Ju;y 1986, were converted at 1131 Rp = $1.
6/ SOURCE: All prices from official Government price change announcements obtained fromEast Asia adn Pacific Country Programs Department, Philippines Division, World Bank andEGYD1, World Bank. Fuel oil price is wholesale. January 1986 prices are pre-election pricereductions. Average product prices before the price change of 25 January were 60 Centavos/literhigher. January 1986 prices converted to $US at 19.1P = $1; June 1986 prices at 2.05 P = $1.
7/ SOURCE: Eastern and Southern Africa, Country Programs Department, South CentrallDivision, World Bank. All prices are Reference Prices (without distribution margin) in Kinshasaand are, therefore, retail prices in Kinshasa. Diesel prices are for "gasoil" in Zaire. January 1986prices coverted to $US at 55.1 = $1; August 1986 prices at 58.75 Z = $1.
8/ SOURCE: 1985 prices from Kenya Solar Water Heating Project Green Cover, March 1986,World Bank. July 1986 prices were announced in the June 1986 Budget, Government of Kenva.Diesel fuel prices for "gasoil" in Kenya. Industrial diesel prices are for 2500 sec fuel oil andi tueloil prices are for 1000 sec fuel oil. November 1985 prices converted to $US at 16.5 Ksh = $ 1; July1986 prices at 16 Ksh = $1.

26
2/ SOURCE: Official announcement October 3, 1984 and Budget statement June 1986,Government of Tanzania. Official prices announced on October 3, 1984 were unchanged as ofApril 1986 for gasol'ne, kerosene and diesel. Hence, it is assumed that no significant retail pricechanges occurred between October 1984 and April 1986. 1985 prices converted to $US at $17 TSH1= $1 (Oct. '85 Avg); July 1986 prices at 42 Tsh = $1. Prices quoted for diesel are for "diesel gasoil" in Tanzania. 1985 LPG and heavy fuel oil prices are wholesale.
JQ/ SOURCE: 1985 prices from Swaziland Energ Assessment, Yellow Cover, World Bank. July1986 prices from personal communicatin with USAID regional economist for Southern Atrica.Prices quoted for diesel are for "bus rate" diesel fuel as almost all diesel pumps in the country areset at teh bus rate. Industrial diesel 1985 price is for "mid-duty" diesel fuel. November 1985 pricesconverted to $US at 2.7E = $1; July 1986 prices at 2.2 E = $1.
11/ SOURCE: September 1985 prices from Latin America and the Caribbean, Countr-yPrograms Department, World Bank. August 1986 prices form Shell OIl, Haiti (new prices effectiveMay 1986). Diesel prices are for "gasoil" in Haiti. All prices converted at G5 = $1.
i2/ SOURCE: August 1986 prices have not changed (in nominal colones/liter) since 1983, asper SDE Costa Rica. August 1986 prices converted to $US at 56.3 CRC = $1; November 1985prices at CRC 52.8 = $1.
13 SOURCE: Central Bank of Brazil, July 1986 Bulletin. Prices in Cr$/liter for gasoline anddiesel oil, and Cr$/kg for fuel oil, assumed to be residual with density of .94 kg/1. October 1985prices converted to $US at 8.56 Cr$ = $1; May 1986 at 13.84 Cr$ = $1. A price freeze onpetroleum products has been in effect since early 1986, but a new 28% tax has been imposed ongasoline on 25 July 1986. This tax is not reflected in the table.
14/ SOURCE: All prices from de Lucia and Associates, converted to $US at 2B$ = $1 for eachperiod.
15/ SOURCE: July 1985 local prices from Table 2.2, Ecuador Energy Assessment, December1985, World Bank. 22 July 1986 local orices quoted in Office memorandum of 31 July 1986 ofEGYD2, World Bank. Local prices converted to $US at official rates for July 1985: 67.175SUCRES = $1; and July 1986 = 109 SUCRES = $1 (before devaluation).

27
Fuel Alcohol Base Case Assumptions
69. Assumptions and results of the base case analysis for the Mhlume project include:
Original Revised(May 1985) (July 1986)
Discount Rate 10%Interest Rate 12%Exchange Rate E2.1 = US$ I
Plant Size (liters/day) 65,000Average Production ('000 liters/yr) 11,938Operation (days/year) 250Plant Life (years) 20Salvage Value 10%Recovery (liters alcohol/mt molasses) 250
Molasses Ex-mill price (US$ /mt) 24
Capital Cost (US$ million) 6.38Amortized Capital Cost (¢/liter/year) 7.16Variable and Fixed Costs
(excluding debt service) (e/liter) 12.68Economic Cost, Mhlume (e/liter) 19.84Transport to Matsapha (e/liter) 0.85
Ethanol Cost Matsapha (¢/liter) 20.69 20.69
Gasoline Import Parity 93 RON Matsapha (e/l) 28.09 21.81
Difference Between Gasoline Import Parityand Economic Production Costs (o/litcr) 7.40 1.12Savings on Fuel Oil and SFF Levies (e/liter) 1.69 1.69
Total Economic Cost Differential (e/liter) 9.09 2.81
Economic Rate of Return 28.5% 18.0%

28
Wind Electricity Generation
70. The wind generation costs quoted in Figure 3 are representative anualized costsderived from actual 1986 installed costs of 100 kW turbmes in California wind farms, estimatedO&M costs, and annual energy production at t25% capacity factor.Y'
71. The oil-based - -electricity generation costsshown in Figure 3 werederived by finding the least Hypothetical System Load Profilecost generation mix, of large % of Peak System Capacityfuel oil steam base load 1207plants and diesel oil gas 0%turbine peaking plants, tomeet a hypothetical load 80%duration curve atrepresentative 1985 fuel oil 80X
and diesel import prices(shown below) and at 40% -
fractions of those prices. Asfuel prices can change muchmore quickly than actual ___._. _._ .__generdtion capacity, this least o 2 4 6 8 10
cost generation mix win Hours/year @ % of Peak Capacity ('000)represent a lower bound toactual oil-based generationcosts for any given utility.
Thermal Plant Cost Assumptions400 MW 50 MW
Fuel Oil Steam Diesel Oil Gas TurbineCapital Cost
including Reserve ($/k%) 1,100 450Annual O&M (% of Cap) 2.5% 3%Lifetime (yrs) 25 15Annual cost @ 10% ($/kW) 148.50 72.50
Fuel Price US$ 30/bbl (20 e/l) 30 e/lThermal Efficiency 36% 28%Fuel Cost (e/kWh) 4.7 e/kWh 10.9o/kWh
25/ 'Study of the Potential for Wind Turbines in Developing Countries, Phase I Draft Report, for USDOE and theWorld Bank by Strategies Unlimited, December 1986.

29
Blomass Gasiflers
Heat Gasiflers
72. A recent Earthscan studyc' estimated the capital costs of heat gasifiers to vary fromUSS 15,000 to US$ 35,000 per GJ/hr of rated boiler output. The higher end of the rangerepresents highly mechanized systems while the lower end represents manually operated systems.The principle economic assumptions and results of this study are tabulated below.
Capital Cost ($/GJ/hr) 15,000 25,000 35,000Lifetime (years) 12 12 12Discount Rate 10% (CRF=.147) 10% 10% 10%Annualized Cap Cost ($/GJ/hr) 2,205 3,675 5,145O&M ($/yr) 1,500 2,500 3,500Fixed Costs ($/GJ) 1.85 2.85 3.95
Woodfuel Cost ($/mt) 20 20 20Energy Content (GJ/mt) 15 15 15Conversion Efficiency 65% 65% 65%Woodfuel Cost ($/GJ) 2.05 2.05 2.05
Total Costs ($/GJ) 3.9 4.9 6.0
73. By way of comparison, the conversion efficiency in a conventional fuel oil boiler isapproximately 85% and the energy content of fuel oil is 37.6 MJ/l. At 20o/iiter (US$ 31.75/bbl)the energy cost of fuel oil steam is roughly US$ 6.26/GJ. As the case presented in Figure 4 is fora heat gasifier retrofit to an existing fuel oil boiler, the total costs of the retrofit gasifier arecompared to the energy costs of the fuel oil boiler over a range of fuel oil prices.
26/ Foley, G. and Banard, G., Biomass Gasification in Deeloping Countries, Earthscan, 1983.

30
Power Gaslifers
74. In the IENHE analysis, estimates of installed cost, plant life, annual power output,efficiency, and O&M cost vary by technology and plant size. Some representative installed cost andplant life assumptions in the baseline comparison are tabulated below. The discount rate, fuelcosts, and load characteristic under which these technologies are compared is also specified.
Installed Cost Lifetime($/kW) (years)
50kW 500kW 50kW 500kW
High speed diesel 585 553 6 8Charcoal gasifier 910 - 5Wood gasifier (manual) 1300 - 5Wood gasifier (automatic) 2135 - 6
Discount rate 10%
High speed diesel fuel costs (e/l) 40Charcoal costs (S/mt) 80Wood fuel costs ($/mt) 20
Hi speed diesel energy content (MJ/1) 36Charcoal energy content (MJ/kg) 29Wood energy content (MJ/kg) 14Moisture content (w.b.) wood 30%
Load characteristic: 30 % of time: 80 % of rated load70 % of time: 30 % of rated load

31
Solar Water Heating
75. A recent ESMAP study of the Potential for Solar Water Heating in Kenya providesa unique case study on the impact of lower oil prices on the economic and financial viability ofsolar water heating (SWH) applications. The study originally assessed SWH systems using October,1985 fuel prices and was revised using August 1986 prices. Between October 1985 and August1986, petroleum product border prices in Kenya declined on average 32% and nominal retail priceswere reduced on average 20%.'l Economic and retail fuel prices as of October 1985 (used inoriginal study) and August 1986 (used in revision) are presented in Table Al.
TABLE Al*~ ~ ~ EOOI - I i I I
| ECONOMIC ECONOMIC i RETAIL i RETAIL I| |PRICE 85 IPRICE 86 IPRICE 85 IPRICE 861! FUEL | $US/TOE ! $US/TOE I $US/TOE |$US/TOE I|Gas Oil | 260 | 140 | 405 | 363 || Fuel Oil 1000 sec 120 | 81 | 144 | 108 || 2500 sec | 143 | 107 167 | 134 ||LPG | 321 | 276 | 410 | 347 || Kerosene | 321 | 193 | 320 | 240 || Charcoal | 151* | 161* | 151 | 161 ||Wood | 46* | 48* | 46 | 48 || Electricity | 222 | 178 l l lI Residential A l I | 251 | 267 |I Residential D l l | 145 | 154 || Commercial l I | 166 | 176 |i Industrial l l | 142 | 151 |l l__ _ _ _ 1 _ _ _ 1 _ __ l l_ _ l _ _
* Retail prices assumed as economic prices.1985 prices @ 17 KSH - $US1; 1986 prices @ 16 KSH - $US1.
76. The technical performance of optimal solar water heating systems was simulated inforty five sites. The average installed system cost was determined to be US$ 126/m2 while thesimpler systems used in industrial applications averaged US$ 103/m2 of collector area. A sampleof the original and revised economic evaluations are summarized in Table A2. The financial netpresent worth of each installation in the revised analysis is presented as an indication of the impactof lower retail oil prices on the viability of SWH systems from the consumer's perspective. In theoriginal report (1985), all applications had a positive net present worth.
27/ Real petroleum product retail price reductions averaged 21%. These prices are peculiar to Kenya and the followingsummary is not intended as a general model of the impact of lower oil prices on the economic viabitity of solar water heating.

32
Table A2
NPW @APPLICATION DISPLACED ERR ERR r-.25
FUEL 1985 1986 i-.13
| Mt. Kenya Safari Club | Fuel Oil 18 | 9 -37631| Nyali Beach Hotel | Fuel Oil I 21 | 11 | -52401| Diplomat Cafe | Electricity | >60 | 44 | 32551
| Kenya Brewery | Fuel Oil 1 15 | <5 I -154711| Elliot's Bakery | Gas Oil | >60 | 23 | 802161| Dandora Creamery | Fuel Oil 1 23 1 10 I -44041
| Health Center | Electricity | >60 | 30 | 65671| Health Center | Kerosene | >60 | >60 | 461721| University Dormitory | Gasoil | 45 | 14 | 3111841| Rural Dormitory | Wood | <15 | <5 | -23311
I Residential I Electricity 1 >60 ; 30 | l| Tariff A l l l I 8541| Tariff D l l l l 2901
77. In general, the applications which displace kerosene, electricity, and (marginally) gasoilstill appear favorable using revised 1986 fuel prices. Due to the extremely low prices of both fueloil and wood, SWH applications that displace these fuels Lo not appear to be cost effective. TableA2 shows that the economic rate of return for most applications displacing petroleum products hasdropped to less than 50% of the rate of return calculated at 1985 oil border prices. This significantreduction in economic viability is due solely to the 32% (on average) drop in petroleum productsborder prices.
78. From the consumer's perspective, the financial viability of the sample applications isindicated by the NPW column in Table A2.2 ' Installations with a negative net present worth arenot financially viable under the assumptions used. The NPW for the proposed Mt. Kenya SafariClub installation under 1985 retail prices of fuel oil (fuel saved) and electricity (pumping costs) wasUS$ 420. This compares with a NPW of -US$ 3763 using 1986 retail prices. The differencebetween these two indices of financial viability is due solely to the 25% drop in the retail price offuel oiL
28/ lbe NPW was calculated at discount rate of 25%, for systems financed @ 13% interest over 10 years, assuming noincrease in fuel prices, 25% duty on imported parts and no sales tax on solar equipment. A 20% premium on foreign exchange was usedthroughout the analyss.

33
Water Pumping Model Assumptions
Village Water Supply
79. Each system is sized to provide 20 liters of water/capita/day. This represents aminimal health standard daily water requirement.
Irrigation
80. Systems are sized to pump peak daily water demand Qmax = 1.76 x Q and Q 0 34m3 daily average per hectare. This peak ratio is derived from Kenyan irrigation practices asdescribed in Small-Scale Solar-Powered Pumping Systems: The Technology. Its Economics andAdvancement. UNDP/World Bank, June, 1983. Irrigation water costs include only the costs of thepumpset and well.
AR Systems
81. In water lifting applications, the daily hydraulic demand is measured by the volume-head product: m4 = daily water demand(m3 ) x lift(m). Since the size and cost of a pumping systemis directly related to the hydraulic demand it is designed to serve, water costs are commonlycompared over a range of hydraulic demands to determine where economic tradeoffs occur. Thecomputed water costs include annualized power source capital cost, fuel, O&M, and the costs ofstorage and wells.
82. Pumping systems are sized for a solar resource of SkWh/m2/day and winds of 4m/secduring the critical demand month. These assumptions represent a normal solar regime forequatorial countries and a good wind resource.
Discount rate 10%Period of analysis 20 yearsEuel inflation 0%
Useful lifemechanical equipment 10 yearsnon-mechanical equipment 20 years
Maintenance costsmechanical equipment 10% of capital costsnon-mechanical equipment 1% of capital costs
Diesel efficiency 7.5% fuel to hydraulic energy
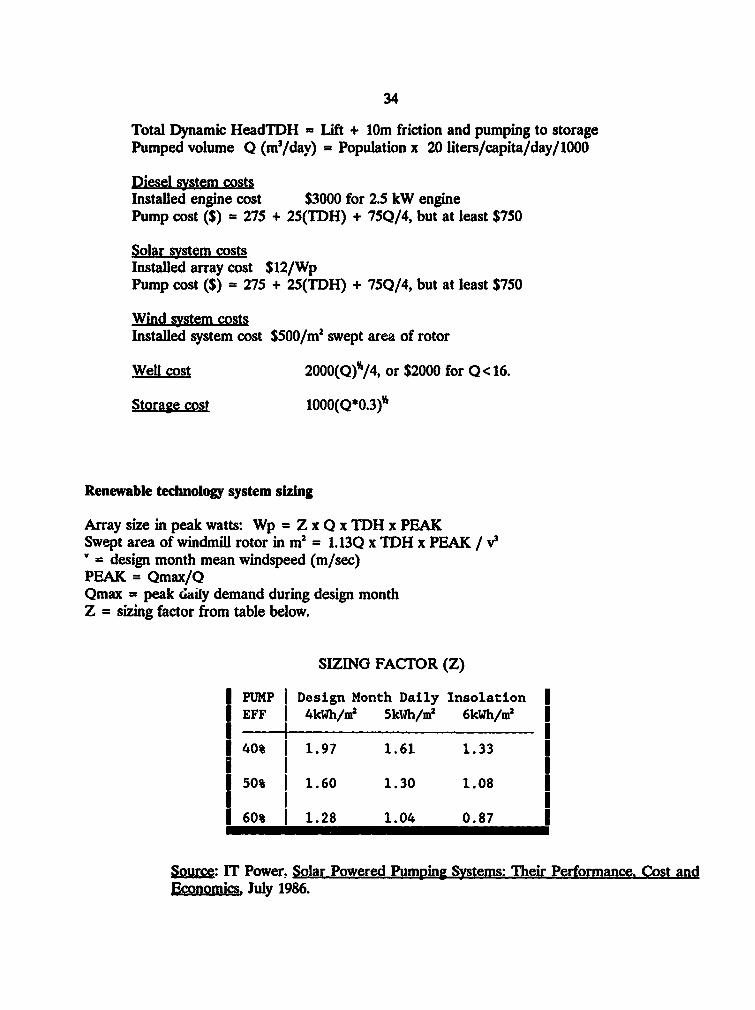
34
Total Dynamic HeadTDH = Lift + 10m friction and pumping to storagePumped volume Q (m3/day) = Population x 20 liters/capita/day/1000
Diesel system costsInstalled engine cost $3000 for 2.5 kW enginePump cost ($) = 275 + 25(TDH) + 75Q/4, but at least $750
Solar system costsInstalled array cost $12/WpPump cost ($) = 275 + 25(TDH) + 75Q/4, but at least $750
Wind stem costInstalled system cost $500/i 2 swept area of rotor
WelU cost 2000(Q)Y/4, or $2000 for Q< 16.
Storage cost l000(Q*0.3)
Renewable technology system sizing
Array size in peak watts: Wp = Z x Q x TDH x PEAKSwept area of windmill rotor in m2 = 1.13Q x TDH x PEAK / v3
' = design month mean windspeed (m/sec)PEAK = Qmax/QOmax = peak daily demand during design monthZ = sizing factor from table below.
SIZING FACTOR (Z)
| PUMP i Design Month Daily Insolation I| EFF I 4kWh/m0 SklWh/m2 6kWh/m0 l
40% I 1.97 1.61 1.33
50% I 1.60 1.30 1.08
I 60% I 1.28 1.04 0.87 I
Source: IT Power. Solar Powered Pumping Systems: Their Performance. Cost andEconomics July 1986.

PPR Working Paper Series
Title Author Date Contact
WPS89 Export Quota Allocations, Export
Earnings and Market Diversifications Taeho Bark September 1988 C. Cabana
Jaime de Melo 51539
WPS90 A Framework for Analysis of MineralTax Policy in Sub-Saharan Africa Robert F. Conrad September 1988 A. Bhalla
Zmarak M. Shalizi 60359
WPS91 Israel's Stabilization Program Nissan Liviatan September 1988 N. Liviatan61763
WPS92 A Model of Cocoa Replanting and New
Planting In Bahia, Brazil: 1966-1985 Pravin K. Trivedi September 1988 0. Gustafson33714
WPS93 The Effects of Education, Health and
Social Security on Fertility In
Developing Countries Susan H. Cochrane September 1988 S. Ainsworth
31091
WPS94 The World Bank's Population Lending
and Sector Review George B. Simmons September 1988 S. Ainsworth
Rushikesh Maru 31091
WPS95 International Trade and Imperfect
Competition: Theory and Application
to the Automobile Trade Junichl Goto September 1988 J. Epps33710
WPS96 The Private Sector and Fami!y PlanningIn Developing Countries Maureen A. Lewis September 1988 S. Ainsworth
Genevieve Kenney 31091
WPS97 Export-Promoting Subsidies and Whatto Do About Them Richard H. Snape September 1988 J. Sweeney
31021
WPS98 Diversification in Rural Asia Agriculture and Rural October 1988 S. Barghouti
Development Staff 38408
WPS99 Trade Policies and the Debt Crisis Sam Laird September 1988 S. Torrijos
Julio Nogues 33709
WPSIOO Public Infrastructure and Private
Sector Profitability and Productivity
in Mexico Anwar Shah September 1988 A. BhalIa
60359

PPR Working Paper Series
Title Author Date Contact
WPS1O1 Measuring the Impact of Minimum Wage
Policies on the Economy Luis A. Riveros
Ricardo Paredes October 1988 R. Luz61762
WPS102 Effects of the Multifibre Arrangement
(MFA) on Developing Countries:
A Survey Junichi Goto October 1988 J. Epps
33710
WPS103 lndustrial Portfolio Responses
to Macroeconomic Shocks: An
Econometr7c Model for LDCs Jemes Tybout October 19A8 C. Cabana
Teeho Bark 61539
WPSIC4 Economic Effects of Financial Crises Manuel Hinds October 1988 L. Hovsepian
32979
WPS105 Securing International Market Access Richard H. Snape October 1988 J. Sweeney
31021
WPS1O6 Energy Issues in the Developing World Mohan Munasinghe January 1989 M. Fernandez
Robert J. Saunders 33637
WPS107 A Review of World Bank Lending for
Electric Power Mohan Munasinghe January 1989 M. Fernandez
Joseph Giilling 33637Melody Mason
WPS108 Some Considerations in Collecting Data
on Household Energy Consumption L. Leitmann
WPS109 Improving Power System Efficiency inthe Developing Countries ThroughPerformance Contracting Philip Yates
WPSIIO Impact of Lower Oil Prices on
Renewable Energy Technologies Ernesto Terrado February 1989 J. LittlefordMatthew Mendis 33627Kevin Fitzgerald
WPSIII Recent World Bank Activities in Energy lndus;ry and Energy February 1989 M. Fernandez
Department 33637