Embed Size (px)
Citation preview

Impact of Linking into Global Value Chains on Indian Employment
Karishma Banga January 2017
CEP Working Paper 2017/1

ABOUT THE AUTHOR
Karishma Banga is a PhD student at the Global Development Institute, University of
Manchester, UK. Her research focuses on the implications of linking into global value
chains on upgrading and employment in Indian firms. She is also involved in research
projects at the Effective States and Inclusive Development (ESID) Research Centre. She
received a MPhil in Economics from the University of Cambridge and a Bachelor in
Economics from the University of Manchester.
The CEP Working Paper Series is published by the Council on Economic Policies (CEP) —
an international economic policy think tank for sustainability focused on fiscal,
monetary, and trade policy. Publications in this series are subject to a prepublication
peer review to ensure analytical quality. The views expressed in the papers are those of
the authors and do not necessarily represent those of CEP or its board. Working papers
describe research in progress by the authors and are published to elicit comments and
further debate. For additional information about this series or to submit a paper please
contact Council on Economic Policies, Seefeldstrasse 60, 8008 Zurich, Switzerland,
Phone: +41 44 252 3300, www.cepweb.org [email protected]

ABSTRACT
With global value chains (GVCs) speedily gaining prominence in defining the prevalent
economic context it has become vital to understand their implications on developing
economies. This study examines the industry-level impact of linking into GVCs for the
Indian labour market, spanning the period 1995-2011. Using methodologies of fixed
effects and Generalized Method of Moments (GMM) estimations, it analyses the
employment impact of foreign value added in output, foreign value added in exports
(backward linkages) and domestic value added in exports of intermediate goods and
services (forward linkages). The results show that while backward linkages in GVCs have
negatively impacted employment in India, forward linkages did not have any statistically
significant impact. The analysis includes manufacturing, services, agriculture and allied
activities.
TABLE OF CONTENTS
1 Introduction ....................................................................................................................... 1
2 Literature and Theoretical Framework .............................................................................. 3
2.1 Trade and Employment ............................................................................................. 3
2.2 Impact of Global Value Chains on Employment ........................................................ 4
2.3 Gaps in Literature and Motivation of Study .............................................................. 5
3 Trend Analysis .................................................................................................................... 6
3.1 Introduction ............................................................................................................... 6
3.2 Forward Linkages ....................................................................................................... 7
3.3 Backward Linkages ..................................................................................................... 8
3.4 Participation in Global Value Chains ......................................................................... 9
3.5 India and Global Value Chains: A Sectoral Analysis ................................................. 12
3.6 Trends in Employment in India ................................................................................ 14
4 Data and Methodology .................................................................................................... 15
4.1 Derivation of the Labor Demand Equation.............................................................. 15
4.2 Data Sources and Construction ............................................................................... 17
4.3 Methodology ........................................................................................................... 18
5 Empirical Framework and Results ................................................................................... 19
5.1 Results Using the ASI and the World Input-Output Database ................................ 19
5.2 Results Using the Trade in Value Added Database (TiVA) ....................................... 22
6 Summary and Conclusions ............................................................................................... 25
6.1 Summary .................................................................................................................. 25
6.2 Conclusions .............................................................................................................. 25
6.3 Limitations of Study ................................................................................................. 26
6.4 Scope for Future Research....................................................................................... 26
7 Bibliography ..................................................................................................................... 27
8 Appendix .......................................................................................................................... 32

1
1 INTRODUCTION
Very recently India has launched its “Make in India” national programme in an attempt to
productively integrate into the global economy. Following this, greater emphasis is being
placed on foreign and local investments to transform India into a global manufacturing
powerhouse. With the aim of improving employment rates and skill enhancement, this
programme is considered to be a big step in further integrating India into the global
economy, which is increasingly being defined by global value chains (GVCs).
Tracing its origins to the rise of Japan and the flying geese pattern of development in the
East Asian region in the 1950s, GVCs can be simply understood as fragmented and
dispersed economic activities, with different countries undertaking specialized tasks in the
production of a final good (Trimmer, 2014). Due to trade increasingly taking place in such
complex networks and given the challenges faced by developing countries in linking into
and upgrading within GVCs, the trade-led-development debate needs to be revisited. The
literature has traditionally captured the impact of integrating into value chains by using
trade data for manufacturing sectors to construct ratios for export and import penetration.
However, these ratios are riddled with the problem of double-counting, in which the value
of an intermediate product is captured more than once while crossing international
boundaries. The drawback of using such trade data is further highlighted in the present
economic context in which the share of trade in tasks is increasing and services are
occupying an important position in value chains (Deardoff, 2011).
For developing countries like India, raising industrial employment has always been a policy
challenge. The share of India’s manufacturing sector in employment was virtually stagnant
in the 1980s but grew in the 1990s, following the trade liberalisation reforms of 1991
(Goldar, 2000). However, over the last decade, there has been slow growth of
manufacturing employment, giving rise to serious concerns. The service sector has fared
better, with an increasing sectoral share in gross domestic product (GDP) and total
employment. With India launching national programmes, such as Make in India (2014), to
increase its participation in GVCs, it becomes important to understand how trade in GVCs
takes place and what its employment effects are.
To explain the increasingly fragmented nature of production and offshoring under GVCs,
Baldwin and Venables (2013) recently brought forward the theory of ‘Snakes and Spiders’.
Snake refers to a linear movement in which goods move in a sequential manner, with value
being added at each stage of production. A spider-like movement, on the other hand,
captures the coming together of different parts and components, in no particular order.
Most value chains demonstrate a combination of these two types of movements. The

2
structure of the value chains is decided by the interaction of two forces; differences in
international costs leading to dispersion of activities, and the unbinding costs of shipping,
management and coordination bind activities together. These forces can have important
implications for employment.
With an expanding labour share tied to trade in GVCs this study aims to empirically
estimate the impact of participation in GVCs on industry-level employment in India. It adds
to the existing literature in two important ways; first, it empirically estimates a dynamic
labour demand equation using industry-level data on value added trade and linkages in
GVCs for the time period 1995-2011 and secondly, analysis is not restricted to only the
manufacturing sector but also includes 19 services sub-sectors as well as agriculture and
allied activities.
The underlying data is based on several sources. First, the primary national database –
Annual Survey of Industries (ASI) – and tariff data from UN-COMTRADE are used to capture
the impact of input tariffs on manufacturing employment. However, since this database
does not capture the impact of value-added trade flows and excludes services from the
analysis, the second dataset – World Input-Output Tables (part of the World Input-Output
Database (WIOD)) – is used to measure the foreign value added content of output. Finally,
the OECD-WTO Trade in Value Added (TiVA) database is used to estimate the impact of
forward and backward linkages in GVCs on employment. The dependent variable used in
the labour demand equation is ‘total persons engaged’1 and analysis is undertaken for 35
sub-sectors in WIOD and 18 sub-sectors in TiVA, including service sectors. Depending on
the characteristics of the panel data, methodologies of Fixed Effects/Random Effects
models and Difference GMM have been applied. The standard autocorrelation tests and
the Sargan/Hansen test of over-identifying restrictions have been carried out to check the
validity of GMM estimations.
The structure of the study is as follows. Section 2 provides a brief literature review and the
theoretical considerations driving empirical work. Section 3 analyses the trends in foreign
value added (FVA) in gross exports, domestic value added (DVA) in exports of intermediate
goods and services, and participation in global value chains, to give a broad picture of
India’s economic position in GVCs. It then reports value added and employment trends at
the sectoral level in India. Section 4 derives the labour demand equation and discusses the
databases and methodologies used. Section 5 reports and analyses the empirical findings.
Section 6 concludes the study and explores the scope of future research in global value
chains.
1 Total persons engaged include workers, employees and all working proprietors actively engaged in work.

3
2 LITERATURE AND THEORETICAL FRAMEWORK
2.1 TRADE AND EMPLOYMENT
The debate on the employment impact of trade liberalisation spans several decades and is
nested in standard trade theories. According to the Stolper-Samuelson trade theorem,
more trade implies gains for the factor that is in abundance, i.e. a country engaging in
international trade enjoys comparative advantage in the abundant factor. Given that
labour is the abundant factor in most developing economies, higher exports should lead to
higher employment (Papageorgiou, Choksi and Michaely, 1990). Similarly, in the
Heckscher–Ohlin–Samuelson (HOS) framework, employment is directed from the import
sector to the more labour-intensive export sector. Contrary to the HOS theory, which
suggests that trade will increase the labour intensive part of output, some trade theories
suggest that trade increases demand for the scarce factor in developing countries. In
Feenstra and Hansen’s model of intra-industry trade (1996), factors of production are
skilled and unskilled labour and the authors’ results show that trade increases demand for
skilled labour.
The literature on the relationship between trade and employment reveals that the impact
of trade on employment is two-fold. First, trade liberalisation can encourage the import of
cheaper inputs, which may displace domestic labour. This effect of imported products
reducing labour demand is called the ‘substitution effect’ (Hasan, Mitra and Ramaswamy
2007; Rodrik, 1997). In contrast, cheaper imported inputs may boost output and exports,
thereby creating more employment (Sen, 2008). This is known as the ‘scale effect’. Some
case studies show significant gains of trade on employment (Kabeer and Mahmud, 2004;
Nadvi and Thoburn, 2004; Kien and Heo, 2008). However, it has been argued that trade
liberalization can lead to improved competitiveness and economies of scale only under
certain assumptions, such as that of perfect competition and constant returns to scale
holding true (Winters, 2000). In line with this, Rodriguez and Rodrik (1999) and Revenga
(1994) find long run GDP to actually rise in the presence of trade restrictions.
Jenkins and Sen (2007) use different approaches of measuring factor content, growth
accounting and econometric modelling to examine trade-employment links. They find that
while international trade has led to job creation in Bangladesh and Vietnam, it had adverse
employment impacts for Kenya, and possibly South Africa. They conclude that there may
be crucial differences in Asia and Africa when considering the impact of trade on
employment.

4
Studies have also differed with respect to the measure taken for trade liberalisation. For
example, Mitra and Ranjan (2010) take offshoring as measure of trade and examine the
effect of offshoring on a country’s unemployment rate. They find that offshoring of
economic activities reduces the overall unemployment rate, as long as there is perfect
mobility between sectors. Moreover, the productivity of domestic workers is found to
increase for complementary economic activities that were offshored. Other studies take
the fall in tariffs as a measure of trade liberalisation (Revenga, 1997, Harrison and Hanson,
1999) and find that even using the same measure, there is no consensus on employment
effects of trade.
The divergent research results may raise an important point: the effects of trade reforms
and liberalisation may be highly country specific.
2.2 IMPACT OF GLOBAL VALUE CHAINS ON EMPLOYMENT
It is only recently that global value chains have gained prominence in the theoretical and
empirical literature. Participation of a country in GVCs is defined by its engagement in a
particular part of the production process i.e. trade in intermediary goods and services.
With conventional tools of measuring trade riddled with the problem of double counting,
consideration of only trade in value added in GVCs creates an important distinction
between GVC trade effects from traditional trade effects.
The shift in focus on value added trade makes the analysis of the relationship between
trade and employment much more complicated than before. As brought forward by Jiang
and Milberg (2013), labour dimensions associated with foreign trade have expanded
beyond the domestic labour share in exports and foreign labour shares in imports to also
include foreign labour contained in exports, domestic labour in imports and third country
labour associated with a country’s imports. The issue gets more complicated since; (1)
labour market losses due to participation in GVCs are far more visible than gains and (2)
offshoring may result in more jobs but can significantly affect the composition of the
labour force (De Backer, 2011).
Taglioni and Winkler (2014) maintain that GVCs can benefit the labour market through
three main channels: (1) Demand effect; GVC participation increases demand for skilled
labour to provide specialized services such as R&D, branding etc., (2) Training effect; lead
firms in GVCs give training in technology and skill development to local participating firms,
thereby increasing their productivity and (3) Labour turnover effect; dispersion of
knowledge from the labour force of participating firms to other local firms.
5
It is important to note that, while integration within GVCs may help generate more
employment through productivity and scale effects, trade in GVCs has given way to a major
global reallocation of jobs. Labour intensive manufacturing activities have been outsourced
to developing countries with low-cost manpower, especially East Asia (World Bank, 2012).
There have also been significant changes in the labour force composition, post the spread
of GVCs (OECD, 2013). This change can now be measured with the availability of World
Input Output Tables. Using these, Jiang and Milberg (2013) find that the jobs created as a
result of trade in GVCs accrue more to low and medium skilled workers than to high-skilled
labour. Of the jobs globally generated by GVCs in 2009, they find that only 13% were for
high-skilled while 44% and 43% for medium and low skilled employees. This shift in labour
composition has been accompanied by downward pressure on wages and the bargaining
power of workers.
2.3 GAPS IN LITERATURE AND MOTIVATION OF STUDY
Several theories seek to explain the evolution of global value chains. Initially, GVC analysis
focused on the commercial dynamics between firms in different segments of the
production chain. Now, the GVC framework goes beyond manufacturing and agriculture to
include global services and draws attention to concepts of value creation, value
differentiation and capturing higher gains from participation (Gereffi and Kaplinsky, 2001).
While there continues to be a significant gap between the theoretical and empirical
literature related to GVCs, more attention is now being paid to labour in the global value
chain/global production network research (Barrientos, 2013; Barrientos et al., 2010;
Phillips and Sakamoto, 2011; Phillips et al., 2011). With the theoretical literature
increasingly focusing on the economic and social effects on workers in GVCs, an empirical
estimation of these impacts can provide useful insights.
The effects of participation may vary greatly across sectors, since GVCs in different sectors
employ a different mix of skilled and unskilled workers. Agriculture involves a large
proportion of small-scale and low-skill labour intensive production and a very small share
of high-skilled technology intensive work. In manufacturing, as we move to higher value
added activities (say from apparel to IT), the share of low-skilled and small-scale work falls
considerably (Barrientos et al., 2010). This raises an interesting empirical challenge of
examining employment impacts of GVCs across high and low value-added sectors.
Moreover, as shown by Baldwin’s (2012) Smiley Curve, higher value-added and higher
gains accrue to pre and post manufacturing services, as compared to the manufacturing
sector. With this gap increasingly widening, it is important to analyse service sectors as a

6
source of upgrading within value chains and providing quality employment. The study
therefore finds it apt to take into consideration both manufacturing and services sectors.
To analyse the labour market implications of GVCs, the study separately examines the
following measures: foreign value added in output, foreign value added in exports and
domestic value added in exports of intermediate goods and services. The TiVA database
uses the term ‘backward linkages’ to describe foreign value added in exports as a share of
gross exports and the term ‘forward linkages’ for domestic value added in exports of
intermediate products that become part of exports or consumption of a partner country,
as a share of gross exports (TiVA 2015). These linkages can have opposing impacts on
labour demand. The impact of higher backward linkages is expected to depend on the kind
of backward linkages formed. If the foreign value added in exports leads to increases in
total exports, by complementing the domestically available intermediate products and
skills, it may lead to a higher demand for labour in an industry. However, if it substitutes
domestic production, it can lead to lower labour demand. Forward linkages, on the other
hand, are expected to increase labour demand.
3 TREND ANALYSIS
3.1 INTRODUCTION
Table 3-1 shows that while world gross exports have increased substantially since 1995, the
gap between gross and value added amounts has risen as well. The 24% difference in gross
and value added exports in 2011 highlights the significant double counting occurring in
gross exports due to the increased internationalization of trade and flow of intermediate
goods and services across boundaries.
Table 3-1: World Gross and Value-Added Exports (1995-2011)
Year Worldwide Gross Exports
(USD Millions)
Value Added in Gross Exports
(USD Millions)
Gross Exports Overstated by
(%)
1995 5,746,092 4,690,197 18
2000 7,193,891 5,618,122 22
2005 11,327,230 8,717,891 23
2008 17,297,953 12,995,506 25
2009 13,836,157 10,689,493 23
2010 16,359,136 12,442,163 24
2011 19,168,055 14,425,076 25 Note: Calculations based on TiVA (August 2015)

7
3.2 FORWARD LINKAGES
In the TiVA (August 2015) database, forward linkage is defined as the domestic value added
(DVA) in gross exports of intermediate products, that can become part of exports or
consumption of a partner country, as a share of gross exports. It is important to note that
while gross exports have grown substantially, the growth of forward linkages has been
much slower. In fact, for many developing countries the share of DVA in gross exports of
intermediate goods and services has fallen considerably in the period 1995 to 2011. Figure
3-1 presents the growth of forward linkages for different countries and finds that in India,
forward linkages fell by almost 15 percentage points. Similar results can be seen for
Thailand, Vietnam, Chinese Taipei and Malaysia. The fall in forward linkages for the UK and
the US has been smaller, 5 and 3 percentage points respectively.
Figure 3-1: Growth in Forward Linkages from 1995 to 2011
Source: Calculations based on TiVA (August 2015).

8
3.3 BACKWARD LINKAGES
Analysis of the foreign value added (FVA) content of gross exports reveals an interesting
picture (Figure 3-2). In contrast to the trend in forward linkages, the FVA content of gross
exports has shown a substantial rise in many countries, including India. In the BRICS
countries, only China reports a fall of FVA share of gross exports (1.2 percentage points).
The FVA share in gross exports has increased by 3 percentage points in Brazil, 0.5
percentage points in Russia, 14.7 percentage points in India and 6.3 percentage points in
South Africa. Other countries with tangible increases in FVA share include Cambodia (24
percentage points), Korea (19.4 percentage points), Vietnam (14.9 percentage points), and
Malaysia (10 percentage points).
Figure 3-2: Growth in Backward Linkages from 1995-2011
Source: Calculations based on TiVA (August 2015).
9
3.4 PARTICIPATION IN GLOBAL VALUE CHAINS
A country can link into global value chains through backward and forward linkages. While
backward linkages is the FVA share in gross exports, as a share of gross exports, forward
linkages measure the DVA in exports of intermediate goods and services, as a share of
gross exports. Based on this, the TiVA database to define ‘participation in global value
chains’ as the sum of backward and forward linkages. Using this index, participation in
GVCs is computed and depicted in Table 3-2.
Table 3-2: Participation in GVCs using the TiVA database
Country Participation in GVCs (%)
Brunei Darussalam 92.91
Saudi Arabia 92.81
Russia 86.49
Columbia 84.82
Chinese Taipei 82.6
Australia 81.66
Malaysia 79.89
Singapore 79.71
South Africa 79.65
Canada 78.53
Mexico 76.97
Indonesia 75.93
United Kingdom 73.48
Thailand 73.16
Germany 72.5
Brazil 72.49
Japan 71.63
Viet Nam 71.55
China (People's Republic of) 69.54
India 69.19
France 68.02
United States 67.34
Hong Kong, China 65.95
Cambodia 61.84 Source: Calculations based on TiVA (August 2015).

10
It is important to note that this index may not be appropriate to use for making cross-
country comparisons of GVC participation. When considering domestic value added in
exports of intermediate products, this index lumps raw materials with conventional
intermediate goods and services, and as a result may exaggerate the forward linkage
measure for primary exporters. Consider the case of Saudi Arabia, which primarily exports
oil. TiVA considers oil exports of Saudi Arabia going into other countries’ exports as part of
Saudi Arabia’s forward linkages. Since it is a primary exporter, it is but natural that its
exports consumed or exported by a partner country will be significantly larger than other
countries. Therefore, when calculating the participation index using TiVA, Saudi Arabia and
other primary exporters are seen to be more linked into GVCs than countries like the US
and the UK.
Table 3-3: Share in GVC Value-Added
Country Share in GVC Value
Added (in %) China 9.63
United States 9.04
Germany 7.30
Japan 4.50
United Kingdom 3.82
Russia 3.50
France 3.39
Canada 2.89
Saudi Arabia 2.38
India 2.22
Taiwan 1.95
Mexico 1.88
Australia 1.86
Singapore 1.55
Brazil 1.50
Malaysia 1.49
Thailand 1.29
Indonesia 1.19
Hong Kong 0.58
Brunei Darussalam 0.08
Cambodia 0.03 Source: Calculations based on TiVA (August 2015).

11
Banga (2013) uses an alternative definition of ‘participation in GVCs’, based on a country’s
share in total value added trade. Based on this index, Banga (2013) finds that in 2009,
maximum value-added generated in GVCs accrued to the OECD countries (66%), with BRICs
lagging behind with 14%. Using TiVA 2015 and Banga’s calculation method, GVC
participation is calculated for 2011. Table 3-3 shows that advanced economies like the
United States, the United Kingdom, France and Germany have a higher share in value
added-trade than developing countries like India, Malaysia, Singapore, Brazil and Mexico.
The highest share of value-added created by GVCs accrues to China.
In addition, Banga (2013) proposes calculating a ratio of forward to backward linkages to
estimate the balance between forward and backward linkages. A ratio greater than one
implies that a country’s domestic value added in its exports of intermediate goods and
services is higher than its foreign value added content of gross exports. Using TiVA 2013,
Banga (2013) finds that this ratio is 0.93 for India in 2009, indicating that India linked into
the global economy more through backward than forward GVC participation.
An important distinction in the newer version of TiVA (August 2015) is that the forward
linkages are now defined as export of domestic value added in intermediate goods and
services to a third country, which can become part of exports or consumption of the third
country. The earlier version (2013) only included that part of value added exports of a
country which entered the exports of the partner country. As a result, for a given year, the
absolute value of forward linkage of many countries has significantly risen in the newer
version of TiVA as compared to the earlier one. Since there has been no change in the
reporting of backward linkages, calculations of the ratio of forward to backward linkage
may differ according to the database used.
Using TiVA (August 2015), it is found that while the ratio for India is greater than one for
the time period considered (Table 3-4), it has declined over time. We can observe from the
table below that while backward linkages for India have been growing over time, there has
not been much change in forward linkages.
Table 3-4: Ratio of Forward to Backward Linkage for India
Source: Calculations based on TiVA 2015
Type of
linkage 1995 2000 2005 2008 2009 2010 2011
Forward 44.1 45.4 47.1 45.6 44.7 46.5 45.0
Backward 9.3 11.2 17.4 22.6 20.9 22.3 24.1
Ratio 4.7 4.0 2.7 2.0 2.1 2.0 1.8

12
3.5 INDIA AND GLOBAL VALUE CHAINS: A SECTORAL ANALYSIS
Calculating forward linkages in agriculture, manufacturing and services, it is observed that
the forward linkages of manufacturing declined from 43% in 1995 to 37% in 2011, while
that of services rose from 41% to 52% (Figure 3-3). In contrast, the share of manufacturing
in backward linkages rose significantly from 13% to 36% and that of services doubled from
6% to 12% (Figure 3-4).
Figure 3-3: Forward Linkages by Sector
Source: Calculations based on TiVA (August 2015).
Figure 3-4: Backward Linkages by Sector
Source: Calculations based on TiVA (August 2015).
63%58%
43%
37%
41%
52%
0
10
20
30
40
50
60
70
%
DVA in exports of intermediate goods and services as
a share of gross exports
Agriculture, hunting,
forestry and fishing
Total Manufactures
Total Services
2%4%
13%
36%
6%
12%
0
5
10
15
20
25
30
35
40
1990 1995 2000 2005 2010 2015
%
FVA share in gross exports
Agriculture, hunting,
forestry and fishing
Total Manufactures
Total Services

13
Figure 3-5: Backward Linkages in Services
Source: Calculations based on TiVA (August 2015).
Disaggregating the increase in backward linkages into services between 1995 and 2011,
particular high increases are observed in Post and Telecommunications, R&D Activities, and
Transport and Storage respectively (Fig. 3-5).
Calculating the value added share of foreign and domestic services in gross exports, it is
found that the foreign services value added share in gross exports has gone up by roughly
8 percentage points for industrial exports and 4.5 percentage points for services exports
(Fig. 3-6). In contrast, the value-added share of domestic services has dropped a little over
time (Fig. 3-7).
Figure 3-6: Value Added from Foreign Services as a Share in Gross Exports
Source: Calculations based on TiVA (August 2015)
0 5 10 15 20 25
Wholesale and retail trade
Hotels and restaurants
Transport and storage
Post and telecommunications
Financial intermediation
Real estate activities
Renting of machinery and…
Computer and related activities
R&D and other business…
Backward Linkages growth in Commercial Services (in %)
1995
2011
0
2
4
6
8
10
12
14
Industry (Mining, Manufactures andUtilities)
Total Services
Foreign Services value added share in gross exports
1995
2011

14
Figure 3-7: Value Added by Domestic Services in Gross Exports
Source: Calculations based on TiVA (August 2015).
3.6 TRENDS IN EMPLOYMENT IN INDIA
To analyse the trends in employment in India, it is important to report some of the unique
characteristics of the Indian labour market. A large share of it comprises of the informal
sector, prevalent in both manufacturing and services. There are also significant labour
market rigidities in India due to strict labour market regulations (such as the strict hiring
and firing policy) and the minimum wage.
Since 1995, sectoral employment has shifted significantly from agriculture to services while
that of the manufacturing sector has remained more or less the same. By 2011
employment in services had increased by 7 percentage points, manufacturing by 1
percentage point, and quarrying and mining by 4 percentage point% (Figure 3-8)2.
Total employment in the formal manufacturing sector, considered in this study, has
remained almost stagnant. Labour intensive industries continue to be the following: food
products, textiles, basic metals, other non-metallic products and wearing apparels, which
are all also export-oriented industries.
2 These figures are for the formal sector.
0102030405060708090
Industry (Mining, Manufacturesand Utilities)
Total Services
Domestic Services value added share in gross exports
1995 2011

15
Figure 3-8: Change in Sectoral Employment
Source: Based on Socio Economic Accounts in WIOD
4 DATA AND METHODOLOGY
4.1 DERIVATION OF THE LABOR DEMAND EQUATION
In the derivation of the empirical model, this study closely follows Greenway et al (1998)
and Hasan et al (2007).
A Cobb Douglas production function is assumed. For industry i in period t it is given by:
, where is output, is the capital stock and represents units of labour
used in production. The efficiency of production is represented by , which captures the
impact of demand-shifting factors such as exports, imports, R&D etc. corresponds to
factors changing the efficiency of production and the shares of capital and labour are given
by and respectively.
For a profit-maximising firm, labour and capital inputs are used until the marginal product
of labour (MPL) = wage ( ) and the marginal product of capital (MPC) equals cost of
capital ( ).
Simultaneously solving these above equations yields the following expression for output of
the industry:
Qit = AgKa
itLb
itQ K L
A
g
a b
w
c

16
(1)
Taking logs of equation (1) and re-arranging terms gives us:
(2)
where , and
By allowing the efficiency of production ( ) to change over time, we get the following
expression:
, (3)
where , = time trend, = import penetration and = export penetration.
Now, substituting for in (2), we get:
(4)
with , , , and .
Since the labour market in India is quite rigid, it is important to augment equation (4) to
account for costs related to adjustment of employment. This can be done by estimating
the following general dynamic labour demand equation;
(5)
where, Lit is total employment in industry i at time t,wit is the average wage,Qit is
output produced by industry i in time t and li represents industry-specific fixed effects. In
first difference GMM estimation, (5) is estimated in first differences, to remove industry
specific fixed effects (li ).
This study uses equation 5 for empirical analysis, but makes a few important alterations
according to the main aim of the study: (1) instead of taking import penetration as an
explanatory variable, it examines the impact of FVA imports in output and FVA imports in
exports (backward linkages) on employment. Similarly, (2) instead of taking export
penetration, the study uses DVA in exports of intermediate goods (forward linkages). Lastly,
Qit = Ag aLitb
wit
c
æ
èç
ö
ø÷
a
Lb
it
LnLit = c 0+c 1Lnwit
c
æ
èç
ö
ø÷+ c 2Ln Qit( )
c0 = -gLnA+aLna -aLnb
a + b
æ
èç
ö
ø÷ c1 =
-a
a + bc 2=
1
a + b
A
Ait = ew 0TiMit
w1Xitw2
w0,w1,w2, > 0 T M X
Ait
LnLit = c0
* -j0T -j1LnMit -j2LnXit + c1Lnwi
c
æ
èç
ö
ø÷+ c2Ln Qit( )
c0
* = -aLna -aLnb
a + b
æ
èç
ö
ø÷
j0 =jw0, j1 =jw1, j2 =jw2
j =g
a + b
LnLit = li -j0T - j1 jLnMi,t- j
j
å - j2 jLnXi,t- jj
å + c0 jLnLi,t- jj
å + c1 jLnwi,t- j
j
å + c2 jLnQi,t- jj
å + eit

17
(3) the study uses the variable ‘gross value added’ rather than gross output. Gross value
added is obtained by subtracting intermediate inputs from output.
4.2 DATA SOURCES AND CONSTRUCTION
Annual Survey of Industries
The labour demand equation is first estimated using the primary national Indian database,
the Annual Survey of Industries (ASI). Using concordance tables provided by the Economic
and Political Weekly Research Foundation (EPWRF) database, a continuous time series of
relevant variables is obtained for 22 manufacturing industries at the 2-digit level, NIC-1998
the classification, for the period 1998-2011. These variables include total number of
persons engaged, gross value added and wages and salaries across all industries. To
construct the wage-, the sum of wages and salaries of persons engaged in each industry is
divided by the number of persons employed in that industry. The data is adjusted
according to 1993-1994 prices using the Wholesale Price Index (WPI). Data on average
tariff rates for Indian industries has been collected from WITS (TRAINS), using the ISIC
revision 3, which is then matched to the NIC 1998 classification using the concordance
tables.
WIOD
Input-output data is collected from World Input-Output Tables for 35 industries (including
services), compatible with the 2 digit ISIC revision 3 level. By breaking down imports into
country and industry specific categories, intermediate inputs can be traced back to the
country and industry of origin, thereby giving a clearer picture of trade flows. The data on
employment is collected using Socio-Economic Accounts, which gives continuous time-
series data for 35 industries for 1995-2009 for the variables total persons engaged, labour
compensation, gross value added and share in labour compensation according to skill level.
TiVA
To understand the impact of trade in global value chains, value added data is needed on
two types of trade flows: backward and forward linkages. The Trade in Value Added (TiVA)
database launched by the OECD and the WTO in 2013 provides the source for that. The
updated 2015 version of TiVA contains derived value added measures for 61 economies
(including 35 OECD members, EU28, and the BRICS countries) for the years 1995, 2000,
2005, 2008, 2009, 2010 and 2011. Data collected from TiVA is matched to Socio-Economic
accounts for 26 industries, using concordance matrices, and then used to analyse the

18
impact of increasing GVC linkages on employment across all sectors. While the updated
2015 version of TiVA (August, 2015) has much potential to be explored for understanding
multilateral trade flows, data is only available for discrete years, which may lead to small
sample estimation.
4.3 METHODOLOGY
Fixed Effects (FE) / Random Effects (RE) Models
To estimate the impact of reductions in tariffs on employment, both fixed and random
effects models are estimated. The fixed effects model is chosen for analysis on the basis of
the standard Hausman specification test, which gave a significant p value (0.00). The
appropriate R squared term is checked after model selection.
If estimating a dynamic model, it is important to note that there may be correlation
between then lagged dependent variable and the error term. In such a case, employing a
FE estimator can demean the variables and remove the individual specific fixed effects in
the error term, using the within transformation. However, there will still be a “non-
negligible correlation between the transformed lagged dependent variable and the
transformed error term” (Bond, 2002, p. 5). For dynamic panel data, especially with small T,
the FE estimators can thus be inconsistent. As a result, dynamic models are estimated
using GMM.
Arellano-Bond Difference GMM
To deal with inconsistent estimation in dynamic panel data models, Anderson and Hsiao
(1981) propose eliminating the individual effects (𝑎𝑖) in the error term (𝑢𝑖𝑡 = 𝑒𝑖𝑡 + 𝑎𝑖) by
first-differencing the data. Combining this approach with the GMM framework, developed
by Hansen (1982), Arellano and Bond (1991) proposed the first-difference (FD) GMM
estimator, widely employed in the literature since then to arrive at asymptotically efficient
estimators for dynamic panel data models.
The basic idea behind GMM estimation is to use all available moment conditions and to
minimize a weighted function of corresponding sample moments, by giving more weight to
moments that have lower variance. The optimal weighting matrix that yields the most
efficient estimator i.e. the estimator with the smallest covariance matrix, gives the two -
step first difference GMM estimator.

19
Applying FD-GMM to the labour demand model thus involves carrying out a first difference
transformation to get rid of the correlation between the lagged dependent variable and
the error term. Even after differencing, there is correlation between the lagged difference
employment term (𝐿𝑛𝐿𝑖,𝑡−1 − 𝐿𝑛𝐿𝑖,𝑡−2) and the transformed error term (𝑒𝑖,𝑡 − 𝑒𝑖,𝑡−1). To
deal with the problem of endogeneity arising due to this correlation, 𝐿𝑛𝐿𝑖,𝑡−2 and further
lags of employment can be chosen as instruments as long as there is no serial correlation.
To treat potential endogeneity between the covariates due to issues of reverse causality
and omitted variable bias, lagged values of endogenous variables can also be used as
instruments.
To estimate the impact of GVC linkages on employment, the study therefore uses FD-GMM
models to capture the ‘dynamic’ nature of trade flows and to deal with the problem of
endogenous covariates and fixed effects (Nickel 1981). The two-step GMM estimator is
estimated using the Windmeijer (2005) correction for standard errors in finite samples and
the following tests are carried out to check for the validity of GMM estimations:
1) Arellano-Bond’s standard autocorrelation test to check for no autocorrelation at AR(2).
If there is no second order autocorrelation, then 𝐿𝑛𝐿𝑖,𝑡−2 can be used as an
instrument.
2) Hansen’s test of over-identifying restrictions to test whether the instruments are
exogenous as a group. If the null hypothesis of strict exogeneity of instrumental
variables (overall validity of instruments) is rejected, then the instrumental variables
estimator is biased and inconsistent.
5 EMPIRICAL FRAMEWORK AND RESULTS
5.1 RESULTS USING THE ASI AND THE WORLD INPUT-OUTPUT DATABASE
Columns (1) and (2) of table 5-1 report the results of the fixed effects model, using ASI data,
without and with year dummies respectively. Similar results are obtained for Ln (Gross
Value-Added), with GVA being associated with higher employment. As expected, a higher
wage implies lower demand for labour and this effect is found to be significant in model (1).
Adding year dummies to model (1), we find that an increase in tariffs is negatively and
significantly related to employment. Since there is no dynamic term in models (1) and (2),
20
the coefficients can be interpreted as long-term elasticity3. The random effects model (3)
confirms the signs obtained in (1) and (2).
This analysis excludes services and using only tariffs as a measure of trade liberalization
may not provide a clear picture of the quantity of intermediate goods imported. Therefore,
using WIOD and difference GMM, columns (4) and (5) estimate the impact of FVA in output
on employment. Estimations are carried for the period 1995-2009 for 35 industries, which
include agriculture and other allied activities, 15 manufacturing industries and 19 services
sectors.
The lagged dependent variable is found to be significant across all models. Models (4) and
(5) find statistical significance for GVA and Wage, with the expected signs and similar
coefficients. These results can therefore be considered as robust. These models also pass
the autocorrelations tests and Hansen’s test of over identifying restrictions, with
respectively insignificant p values.
Model (4) results show that short run elasticity of employment with respect to GVA, wage
and FVA imports is 0.11, -0.11 and -0.02 respectively, while long run elasticity is estimated
at 0.68, -0.68 and -0.12 respectively. Employment is found to be more elastic with respect
to these variables in the long run as compared to the short run. Model (4) shows that the
higher the foreign value added in output, the lower is the employment in that industry. To
account for sector-specific effects, model (5) adds a sector dummy (=1 for non-
manufacturing sub-sectors) and an interaction term between the dummy and FVA in
output. It finds that the negative relationship between FVA in output and employment
does not change.
3 Long run elasticity is calculated using the formula: Short-run elasticity/ (One minus estimated coefficient of the lagged
dependent variable in the model). Short run elasticity is equal to estimated coefficients.

21
Table 5-1- impact of Foreign Value-Added in output on employment
MODEL FIXED
EFFECTS
(1)
FIXED
EFFECTS
(2)
RANDOM
EFFECTS
(3)
DIFF-
GMM
(4)
DIFF-
GMM
(5)
Ln(Employment(-1)) 0.84***
(10.9)
0.90***
(12.03)
Ln(Gross value added) 0.49**
(2.44)
0.52**
(2.27)
0.54***
(2.78)
0.11**
(2.03)
0.10**
(2.07)
Ln(wagerate) -0.15**
(-2.09)
-0.09
(-1.07)
-0.21***
(-2.48)
-0.11**
(-2.55)
-0.09***
(-2.62)
Ln(tariffs) -0.11
(-0.69)
-0.24**
(-2.03)
-0.07
(-1.57)
Ln(foreign value-added in
output)
-0.02***
(-2.69)
-0.02**
(-2.20)
Ln(Foreign value added in
output *sector dummy)
-0.005
(-0.23)
High skilled share in
compensation
-0.12
(-1.15)
Number of observations 308 308 308 438 438
Number of industries 22 22 22 35 35
Year dummy No Yes Yes Yes Yes
R squared 0.63 0.65 0.59
AR(2) 0.9 0.9
Hansen p-value 0.13 0.61
Standard errors Cluster
robust
Cluster
robust
Cluster
robust
Two-step
Cluster
robust
Two-step
Cluster
robust
Notes: The dependent variable is the natural log of Total Persons Engaged. Value of t statistics reported
in parenthesis. (*) significant at 10%, (**) at 5% and (***) at 1%. Models (1), (2) and (3) are based on ASI
data and (4) and (5) on WIOD. Time dummies used in estimation but coefficients not reported. Sector
dummy is a dummy variable equal to 1 for all non-manufacturing subsectors. High skilled share in
compensation is a control variable, accounting for the share of high skilled workers in total labour
compensation

22
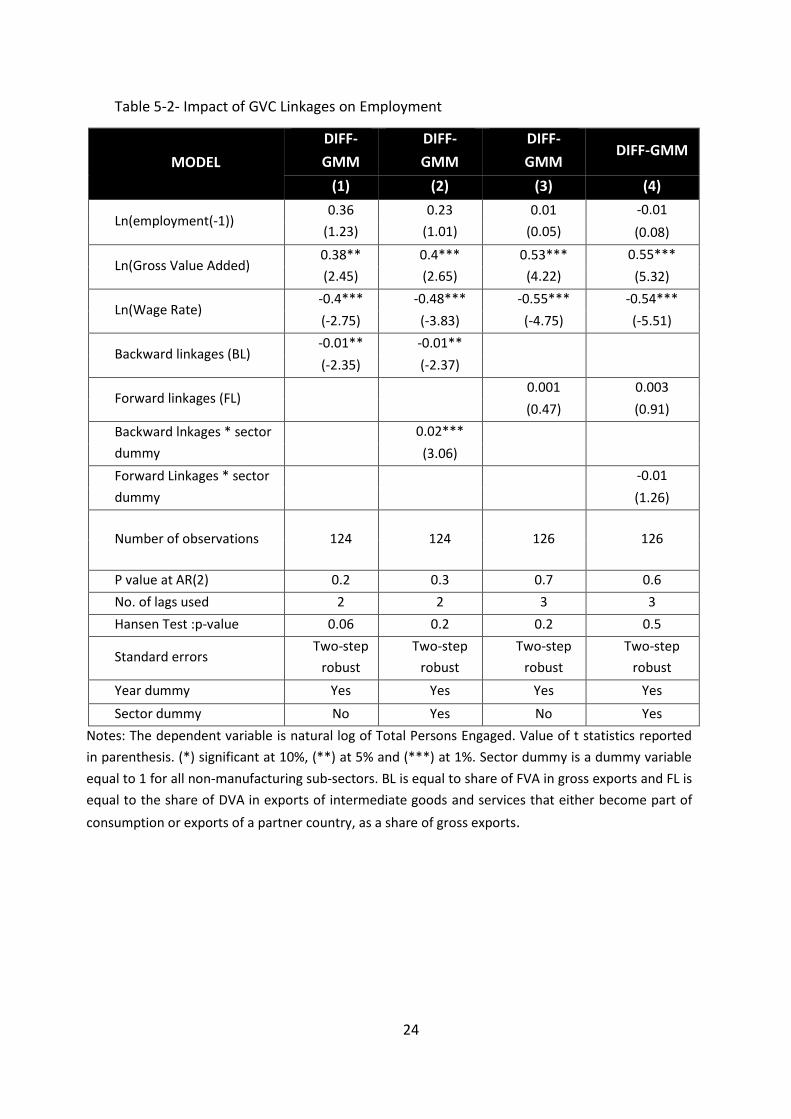
5.2 RESULTS USING THE TRADE IN VALUE ADDED DATABASE (TIVA)
Since the output produced using foreign inputs can either become part of consumption or
exports of the partner countries, it is important to analyse the employment impact of
foreign value added in gross exports and domestic value added in exports of intermediates.
This can be done by examining backward and forward GVC linkages respectively. Table 5-2
below uses the 2015 version of TiVA and measures the actual impact of backward and
forward linkages on employment of 26 sectors, including services.
Since theory highlights that employment can be quite persistent, and due to the existence
of strict hiring and firing policies in India, we estimate dynamic panel data models, that
include a lagged dependent variable on the right-hand side. All estimations in Table 5-2 are
based on Difference-GMM using the xtabond2 command, but use different specifications
to check for robustness.
Table 5-2 finds that the first lag of the dependent variable i.e. total number of persons
engaged in the previous period, is not statistically significant in explaining variation in the
dependent variable. However, we still employ Difference-GMM because not only does the
estimator allow us to control for possible persistency in employment but also enables us to
instrument right-hand side covariates with their lags, when they are suspected of
endogeneity in the presence of fixed effects. Other estimators in such a situation would
produce bias results. Thus, by using the GMM estimator, we correct for possible
endogeneity in the backward and forward linkage variables by instrumenting them with
their lagged values. We find that all model specifications in Table 5-2, pass the Hansen’s
test of over-identifying restrictions, with insignificant p values. There is also no
autocorrelation at the AR(2) level, confirmed by the insignificant p values reported below.
Ln(GVA) and Ln(Wagerate) variables are found to be significant across all models, with
expected signs and similar coefficients. These results can therefore be considered robust.
Model (1) finds a negative and statistically significant impact of backward linkage (BL) or
share of foreign value added in gross exports on employment. Model (2) adds a sector
dummy (=1 for non-manufacturing) and an interaction term and still finds backward
linkages to be negatively associated with employment. A higher share of foreign value
added in gross export of an industry is thus associated with lower employment for that
industry. Model (2) also finds that the negative effect of backward linkages on employment
is higher for the non-manufacturing sector as compared to manufacturing industries. One
plausible explanation for this can be that the impact on employment in services sectors is
also capturing the indirect impact on services used in exports of manufactured products,
such as pre and post manufacturing services. Backward linkages in the manufacturing

23
industries, on the other hand, capture FVA in exports of only the organised manufacturing
sector. Another explanation could be that processing trade in manufacturing sector may be
in play i.e. firms are being mainly involved in assembly activities. Increasing FVA in
manufacturing exports may be displacing domestic production, but might be increasing
processing exports and as a result the employment in manufacturing is less negatively
affected than in services.
Model (3) finds that forward linkages (DVA in exports of intermediate goods as a share of
gross exports) does not have a statistically significant or economically significant impact on
employment. Model (4) adds a sector dummy and interaction of forward linkages with the
sector dummy, but the impact of forward linkages on employment remains insignificant. In
understanding the reason behind this, an important limitation of the study is highlighted:
analysis is conducted based on data at the 2-digit level, which is fairly aggregated.
Examining the impact of forward and backward linkages on employment at a much more
disaggregated level, such as the firm-level, is important. However, analyzing trends in
India’s GVC linkages can provide some insights into the role of forward linkages in
promoting employment. The literature examining India’s integration into the global
economy suggests that, unlike other developing economies that have linked into GVCs by
providing labour intensive activities, India has developed pockets of specialisation in
relatively skill and capital intensive manufacturing and service sectors (OECD, 2014). India
has more backward than forward participation in the global economy, and its highest GVC
participation is in sectors such as chemicals, electrical equipment and machinery. It is
therefore quite plausible that forward linkages in Indian industries have increased in the
more capital intensive industries, rather than in the labour intensive sectors. Consequently,
the impact of increases in forward linkages has not been significant on overall employment.
However, as mentioned before, analysis needs to be conducted at a much more micro level
for examining this further.
24
Table 5-2- Impact of GVC Linkages on Employment
MODEL
DIFF-
GMM
DIFF-
GMM
DIFF-
GMM DIFF-GMM
(1) (2) (3) (4)
Ln(employment(-1)) 0.36
(1.23)
0.23
(1.01)
0.01
(0.05)
-0.01
(0.08)
Ln(Gross Value Added) 0.38**
(2.45)
0.4***
(2.65)
0.53***
(4.22)
0.55***
(5.32)
Ln(Wage Rate) -0.4*** -0.48*** -0.55*** -0.54***
(-2.75) (-3.83) (-4.75) (-5.51)
Backward linkages (BL) -0.01** -0.01**
(-2.35) (-2.37)
Forward linkages (FL) 0.001 0.003
(0.47) (0.91)
Backward lnkages * sector
dummy
0.02***
(3.06)
Forward Linkages * sector
dummy
-0.01
(1.26)
Number of observations 124 124 126 126
P value at AR(2) 0.2 0.3 0.7 0.6
No. of lags used 2 2 3 3
Hansen Test :p-value 0.06 0.2 0.2 0.5
Standard errors Two-step
robust
Two-step
robust
Two-step
robust
Two-step
robust
Year dummy Yes Yes Yes Yes
Sector dummy No Yes No Yes
Notes: The dependent variable is natural log of Total Persons Engaged. Value of t statistics reported
in parenthesis. (*) significant at 10%, (**) at 5% and (***) at 1%. Sector dummy is a dummy variable
equal to 1 for all non-manufacturing sub-sectors. BL is equal to share of FVA in gross exports and FL is
equal to the share of DVA in exports of intermediate goods and services that either become part of
consumption or exports of a partner country, as a share of gross exports.

25
6 SUMMARY AND CONCLUSIONS
6.1 SUMMARY
The main objective of this study was to estimate the impact of linking into global value
chains on employment in India. Empirical estimates are arrived for (a) impact of tariff
liberalisation on employment in the manufacturing sector; (b) the impact of change in
foreign value added in domestic production on domestic employment in all three sectors -
agriculture, manufacturing as well as services; and (c) the impact of backward and forward
linkages on employment in all three sectors of the Indian economy.
The impact of a change in import tariffs on employment (total persons engaged) was
estimated using a fixed effects model and lower import tariffs were found to be associated
with higher employment. Using Difference-GMM and the WIOD it is found that higher FVA
in output leads to lower employment. Lastly, the employment impact of backward and
forward linkages into global value chains was estimated using the TiVA database. The
results show a negative relationship between backward linkages and employment. This
negative effect is higher for non-manufacturing industries. Forward linkages are found to
have no statistically significant impact on employment.
6.2 CONCLUSIONS
With the impact of linking into global value chains on labour demand being multi-fold,
especially through backward linkages, it is important to analyse the type of backward and
forward linkages that a country should encourage. While forward linkages have the
potential to boost employment, backward linkages that displace domestic production can
have a negative effect. However, backward linkages (foreign value added in exports) that
are complementary to the existing domestic resources, technology and skill-level may
encourage more value-addition to exports, thereby leading to growth in employment.
Therefore, there is a need to take a cautious approach to linking into GVCs through
backward linkages. Policies have to be tailored to encourage backward linkages in those
industries where the imported intermediate products do not displace domestic supply
chains.

26
6.3 LIMITATIONS OF STUDY
The study has the following caveats: a) databases such as WIOD and TiVA give data on
trade flows at the 2 digit level only; further disaggregation of data may give interesting
results, and (b) the study has an important caveat in terms of focusing only on the trade
aspect of linking into GVCs, while foreign direct investments also forms an important
element of linking into GVCs given the role played by the lead firms.
In spite of the above limitations, the study fills an important gap in the existing literature
by undertaking an empirical estimation of the impact of linking into GVCs on employment
in India. It also contributes to the existing literature by estimating the impact on all sectors,
including services.
6.4 SCOPE FOR FUTURE RESEARCH
The empirical literature estimating the impact of linking into GVCs on an economy is still in
its infancy and provides a huge potential for undertaking further research. In particular,
future research areas will include the role of foreign direct investment in GVCs as well as
the impact of technological transfers and spillovers through GVCs. Moreover, linking into
GVCs may also have implications for labour markets in terms of changes in the composition
of the labour market, labour productivity, skilled and unskilled labour, wage differentials
between skilled and unskilled labour, etc. These need to be explored in detail and at the
most disaggregated level as possible. Whether linking into GVCs needs a different
approach in formulating industrial policy presents another interesting and important area
for further research.

27
7 BIBLIOGRAPHY
Akamatsu K. (1962). “A Historical Pattern of Economic Growth in Developing Countries.”
Journal of Developing Economies, pp. 3–25.
Amiti, M. & Konings, J. (2007). “Trade Liberalisation, Intermediate Inputs, and Productivity:
Evidence from Indonesia.” The American Economic Review, 97(5), pp.1611-38.
Anderson, T. W., & Hsiao, C. (1981). “Estimation of dynamic models with error
components.” Journal of the American Statistical Association, 76(375), 598-606.
Arellano, M., & Bond, S. (1991). “Some tests of specification for panel data: Monte Carlo
evidence and an application to employment equations.” The Review of Economic Studies,
58(2), 277-297.
Baldwin, R. (2012). “Global supply chains: Why they emerged, why they matter, and where
they are going.” London, Centre for Economic Policy Research.
Baldwin, R. & Venables, A. (2013). "Spiders and snakes: Offshoring and agglomeration in
the global economy," Journal of International Economics, Elsevier, vol. 90(2), pp. 245-254.
Banga, R. (2013). “Linking into Global Value Chains Is Not Sufficient: Do You Export
Domestic Value Added Contents?” Journal of Economic Integration, Vol.29 No.2, June
2014, pp. 267-297.
Banga, R. (2005). “Impact of Liberalization on Wages and Employment in Indian
Manufacturing Industries”, Working Paper No. 153, Indian Council for Research in
International Economic Relation
Banga, R. and Bathla, S. (2008), “Impact of Trade on Labour Markets in the Unorganised
Sector in India: An Empirical Approach”, paper prepared for UNCTAD, Centre for
Development Studies, Trivandrum.
Blundell, R., and Bond, S. (1998). “Initial conditions and moment restrictions in dynamic
panel data models.” Journal of Econometrics 87: 115–143.
Chandrasekhar, C. P., and Ghosh, J. (2016) “Tracking the Macroeconomy: Selections from
Macroscan”, 2001-05. Vol. 1. ICFAI Books, 2006.
Davis, R. D. & Mishra, P. (2007). “Stolper-Samuelson is Dead and Other Crimes of Both
Theory and Data”, Harrison A. (Ed.).
Deardorff, A.V. (2001). “International provision of trade services, trade and
fragmentation.” Journal of International Economics 9, pp. 233–248.

28
Dolan, Catherine and John Humphrey (2000), “Governance and trade in fresh vegetables:
the impact of UK supermarkets on the African horticulture industry.” Journal of
Development Studies 37 (2):147-176
Gereffi, Gary and Miguel Korzeniewicz, eds. (1994), “Commodity Chains and Global
Capitalism.” Westport, CT: Praeger.
Gereffi, Gary, John Humphrey, and Timothy Sturgeon (2005). “The governance of global
value chains.” Review of International Political Economy 12(1): 78-104.
Gereffi, Gary, John Humphrey, Raphael Kaplinsky, and Timothy Sturgeon (2001):
“Globalisation, value chains, and development.” IDS Bulletin 32(3): 1-8.
“Global Value Chains and Africa’s Industrialisation”, African Economic Outlook 2014
Robert C. Feenstra, Gordon H. Hanson (1996): “Globalization, Outsourcing, and Wage
Inequality”, American Economic Review, vol.86, no.2, May 1996, pp.240-245
Goldar, B. (2000), “Employment Growth in Organised Manufacturing in India”, Economic
and Political Weekly, 35(14): pp. 1191-95
Goldar, B. (2002) - “Trade Liberalization and Manufacturing Employment: The Case of
India”, Employment Paper no. 2002/34, International Labour Office, Geneva.
Goldar, Bishwanath. "Trade liberalisation and labour demand elasticity in Indian
manufacturing." Economic and Political Weekly (2009): 51-57.
Goldberg, P.K. and N. Pavnick, “Distributional effects of globalization in developing
countries,” Journal of Economic Literature, 2007, 45 (1)
Görg, Holger, 2011, “Globalization, Offshoring, and Jobs,” in Making Globalization Socially
Sustainable, edited by Marc Bacchetta and Marion Jansen (Geneva: International Labor
Organization and World Trade Organization).
Hamermesh, Daniel (1993): “Labor demand” Princeton, N.J.: Princeton University Press.
Harrison, Ann, and Gordon Hanson. "Who gains from trade reform? Some remaining
puzzles." Journal of development Economics 59.1 (1999): 125-154.
Hasan, Rana, Devashish Mitra, and Krishnarajapet V. Ramaswamy. "Trade reforms, labor
regulations, and labor-demand elasticities: Empirical evidence from India." The Review of
Economics and Statistics 89.3 (2007): 466-481.
Hoekman, Bernard, and L. Alan Winters. "Trade and employment: stylized facts and
research findings." World Bank Policy Research Working Paper 3676 (2005).
Humphrey, John, and Hubert Schmitz (2002): “Developing country firms in the world
economy: Governance and upgrading in global value chains.” INEF.

29
Humphrey, John, and Hubert Schmitz (2000): “Governance and upgrading: linking industrial
cluster and global value chain research”. Vol. 120. Brighton: Institute of Development
Studies.
Paul Krugman (1991): “Increasing Returns and Economic Geography”, The Journal of
Political Economy, Vol. 99, No. 3. (Jun., 1991), pp. 483-499.
Jiang, Xiao, and William Milberg. "Capturing the jobs from globalization: trade and
employment in global value chains." Available at SSRN 2259668 (2013).
Johnson, Robert C. "Five facts about value-added exports and implications for
macroeconomics and trade research." The Journal of Economic Perspectives (2014): 119-
142.
Johnson, Robert C., and Guillermo Noguera. "A portrait of trade in value added over four
decades." Unpublished paper, Dartmouth College (2014).
Jones, R. and H. Kierzkowski (1990), “The Role of Services in Production and International
Trade: A Theoretical Framework,” ch. 3 in Jones and Anne Krueger (eds.): The Political
Economy of International Trade (Blackwells).
Kabeer, N. and Mahmud, S. (2004): “Globalization, Gender and Poverty: Bangladeshi
Women Workers in Export and Local Markets”, Journal of International Development 16(1):
93–109.
Kaplinsky R. and Morris, M. (2001): “A Manual for Value Chain Research”,
www.ids.ac.uk/ids/global/ (accessed 2015)
Kien, Tran Nhuan, and Yoon Heo. "Impacts of trade liberalization on employment in
Vietnam: a system generalized method of moments estimation." The Developing
Economies , 47.1 (2009): 81-103.
Nadvi, K., and J.T. Thoburn (2004): “Vietnam in the global garment and textile value chain:
impacts on firms and workers”, Journal of International Development, special issue on
‘Globalisation, Production and Poverty’, forthcoming
Nickell, S. (1981): ”Biases in dynamic models with fixed effects.”, Econometrica 49, 1417–
1426.
OECD (2013), “Interconnected Economies: Benefiting from Global Value Chains”, Paris:
OECD Publishing.
Onaran, Özlem (2008) "The effect of foreign affiliate employment on wages, employment,
and the wage share in Austria."
Papageorgiou, Demetrios, et al. (1990): “Liberalizing foreign trade in developing countries:
the lessons of experience.” Vol. 39. No. 8. Washington, DC: World Bank, 1990.

30
Revenga, Ana L. (1992): "Exporting jobs?: The impact of import competition on
employment and wages in US manufacturing." The Quarterly Journal of Economics 255-
284.
Revenga, Ana. "Employment and wage effects of trade liberalization: the case of Mexican
manufacturing." Journal of labor Economics 15.S3 (1997): S20-S43.
Rodriguez, F., Rodrik, D. (1999): “Trade Policy and Economic Growth: A Skeptic’s Guide to
the Cross-National Evidence” Working Paper 7081, NBER
Rodrik, D. (1997): “Has Globalization Gone Too Far?” Institute for International Economics,
Washington, DC.
Roodman, David. "How to do xtabond2: An introduction to difference and system GMM in
Stata." Center for Global Development working paper 103 (2006).
Roodman, David (2014) "xtabond2: Stata module to extend xtabond dynamic panel data
estimator." Statistical Software Components.
Sen, Kunal (2008), “International Trade and Manufacturing Employment Outcomes in India
– A Comparative Study”, Research Paper No.2008/87, UNU-WIDER.
Sen, Kunal (2009), “International Trade and Manufacturing Employment: Is India Following
the Footsteps of Asia or Africa?”. Review of Development Economics, Vol. 13, Issue 4, pp.
765-777.
Slaughter, Matthew J. "International trade and labor–demand elasticities." Journal of
International Economics 54.1 (2001): 27-56.
Taglioni, D., Winkler, D. (2014): “Making Global Value Chains Work for Development.
World Bank”, Washington, DC.
https://openknowledge.worldbank.org/handle/10986/18421 License: CC BY 3.0 IGO.
Timmer, M. P., Dietzenbacher, E., Los, B., Stehrer, R. and de Vries, G. J. (2015), "An
Illustrated User Guide to the World Input–Output Database: the Case of Global Automotive
Production", Review of International Economics. 23: 575–605
TiVA (2015): “Background note and concepts”
http://www.oecd.org/sti/ind/TIVA_FAQ_Final.pdf
UNCTAD (2013): “Global value chains and development”
http://unctad.org/en/PublicationsLibrary/diae2013d1_en.pdf
Windmeijer, F. (2005): "A finite sample correction for the variance of linear efficient two-
step GMM estimators." Journal of econometrics 126.1: 25-51.
Winters, L. Alan. (2002): "Trade liberalisation and poverty: what are the links?." The World
Economy 25.9: 1339-1367.

31
WTO and IDE-JETRO (2011): “Trade patterns and global value chains in East Asia: From
trade in goods to trade in tasks” Website: www.ide.go.jp/English/

32
8 APPENDIX
Table 8-1: Output constrained labour demand with industry fixed effects using ASI.
Descriptive statistics:
VARIABLE Obs Mean
Std.
Dev. Min Max
Ln(GVA) 182 8.54 1.05 6.01 10.71
Ln(Wage rate) 182 -0.67 0.95 -2.72 2.08
Ln(BL) 178 2.46 0.96 -3.85 4.03
Ln(FL) 149 3.67 1.05 -4.61 4.58
Ln(Persons
engaged) 182 8.21 1.43 4.08 12.5
Correlation matrix
VARIABLE
Ln(GVA
)
Ln(Wage
Rate) Ln(BL) Ln(FL)
Ln(pers
ons
engage
d)
Ln(GVA) 1
Ln(Wage Rate) 0.28 1
Ln(BL) -0.37 0.13 1
Ln(FL) -0.02 0.008 -0.05 1
Ln(Persons
engaged) 0.55 -0.55 -0.48 -0.07 1
Table 8-2: GMM estimation of output-constrained labour demand equation using WIOD
Descriptive statistics:
VARIABLE Obs Mean
Std.
Dev. Min Max
Ln(GVA) 525 7.97 1.77 5.25 10.66

33
Ln(Wage Rate) 525 -0.94 0.88 -3.5 1.69
Ln(FVA
imports) 509 1.87 1.56 -3.5 5.34
Ln(DVA
exports) 418 3.67 1.05 -4.61 4.58
Ln(persons
engaged) 525 7.98 1.52 4.08 12.51
Correlation matrix
VARIABLE Ln(GVA)
Ln(Wage
Rate)
Ln(FVA
imports)
Ln(DVA
exports)
Ln(persons
engaged)
Ln(GVA) 1
Ln(Wage Rate) 0.07 1
Ln(FVA
imports) 0.3 0.14 1
Ln(DVA
exports) 0.19 -0.1 0.56 1
Ln(persons
engaged) 0.69 -0.51 0.11 0.22 1
Table 8-3: GMM estimation of labour demand equation using WIOD and TIVA
Descriptive statistics:
VARIABLE Obs Mean
Std.
Dev. Min Max
Ln(GVA) 308 8.59 1.11 3.85 10.92
Ln(Wage Rate) 308 -1.35 0.49 -3.36 1.03
Ln(Tariffs) 308 2.9 0.65 0.42 3.83
Ln(persons
engaged) 308 12.51 1.03 9.63 14.41

34
Correlation matrix:
VARIABLE
Ln(GVA
)
Ln(Wage
Rate)
Ln(Tarif
fs) Ln(persons engaged)
Ln(GVA) 1
Ln(Wage Rate) 0.36 1
Ln(Tariffs) -0.18 -0.35 1
Ln(persons
engaged) 0.72 -0.12 0.07 1