Embed Size (px)
Citation preview
Impact of Link Failures on VoIP Performance
International Workshop on Network and Operating System Support for Digital Audio and Video
(NOSSDAV)
C. Boutremans, G. Iannaccone and C. Diot
Sprint ATL
May 2002
Introduction
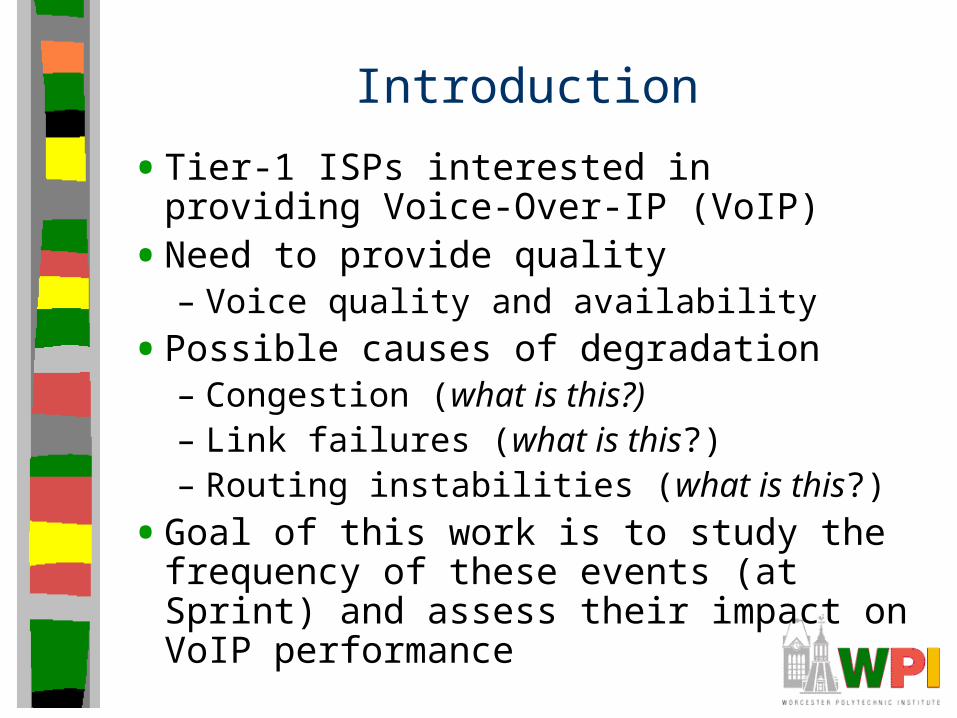
• Tier-1 ISPs interested in providing Voice-Over-IP (VoIP)
• Need to provide quality– Voice quality and availability
• Possible causes of degradation– Congestion (what is this?)– Link failures (what is this?)– Routing instabilities (what is this?)
• Goal of this work is to study the frequency of these events (at Sprint) and assess their impact on VoIP performance
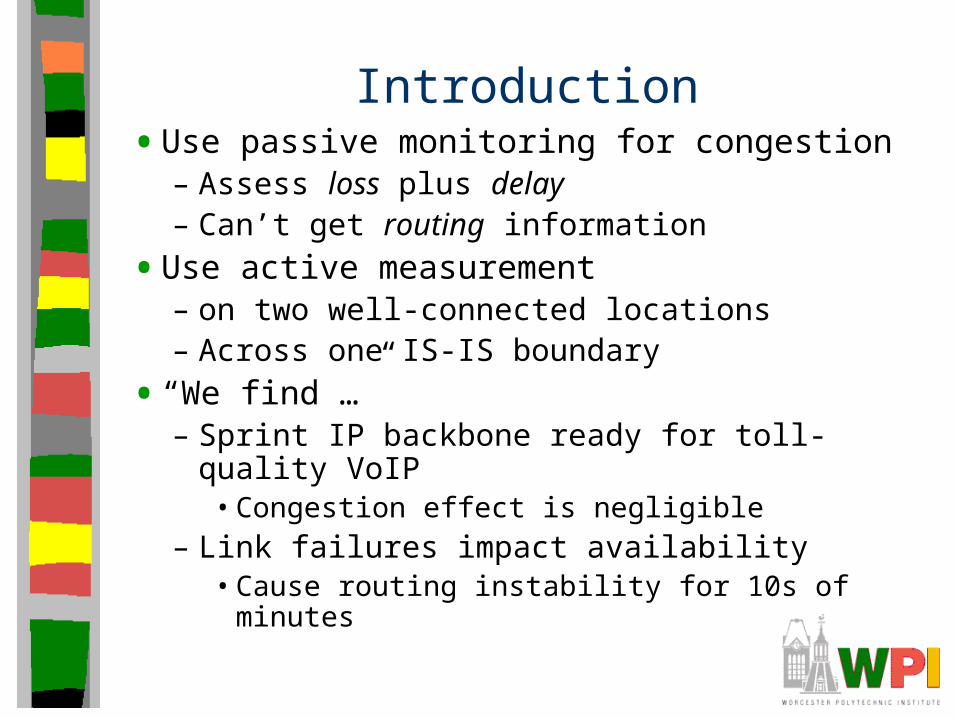
Introduction• Use passive monitoring for congestion
– Assess loss plus delay– Can’t get routing information
• Use active measurement– on two well-connected locations– Across one IS-IS boundary
• “We find …”– Sprint IP backbone ready for toll-quality VoIP
• Congestion effect is negligible– Link failures impact availability
• Cause routing instability for 10s of minutes
Outline
• Introduction (done)
• Related Work (next)
• Measurements
• Voice Call Rating
• Results
• Conclusion
Related Work
• Lots of work on delay and loss characteristics (mostly focus on delay)– But delay and loss alone not sufficient for
perceptual quality (PQ)
• Work that develops E-model (Cole et al.) to map network characteristics for voice to PQ– Use in evaluation of this paper
• Work using E-model that finds some backbones have toll-quality today– Do not investigate network or routing problems
Outline
• Introduction (done)
• Related Work (done)
• Measurements (next)
• Voice Call Rating
• Results
• Conclusion
Measurement
• Passive – Via Sprint infrastructure
• Active– Induce own data
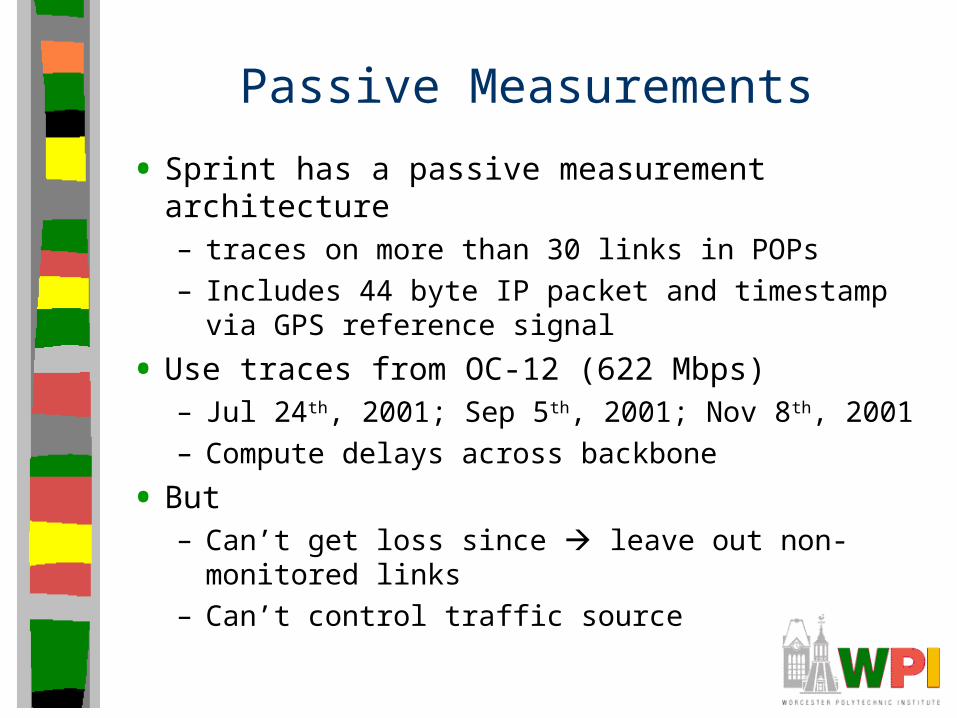
Passive Measurements
• Sprint has a passive measurement architecture– traces on more than 30 links in POPs
– Includes 44 byte IP packet and timestamp via GPS reference signal
• Use traces from OC-12 (622 Mbps)– Jul 24th, 2001; Sep 5th, 2001; Nov 8th, 2001
– Compute delays across backbone
• But– Can’t get loss since leave out non-monitored links
– Can’t control traffic source
Active Measurements
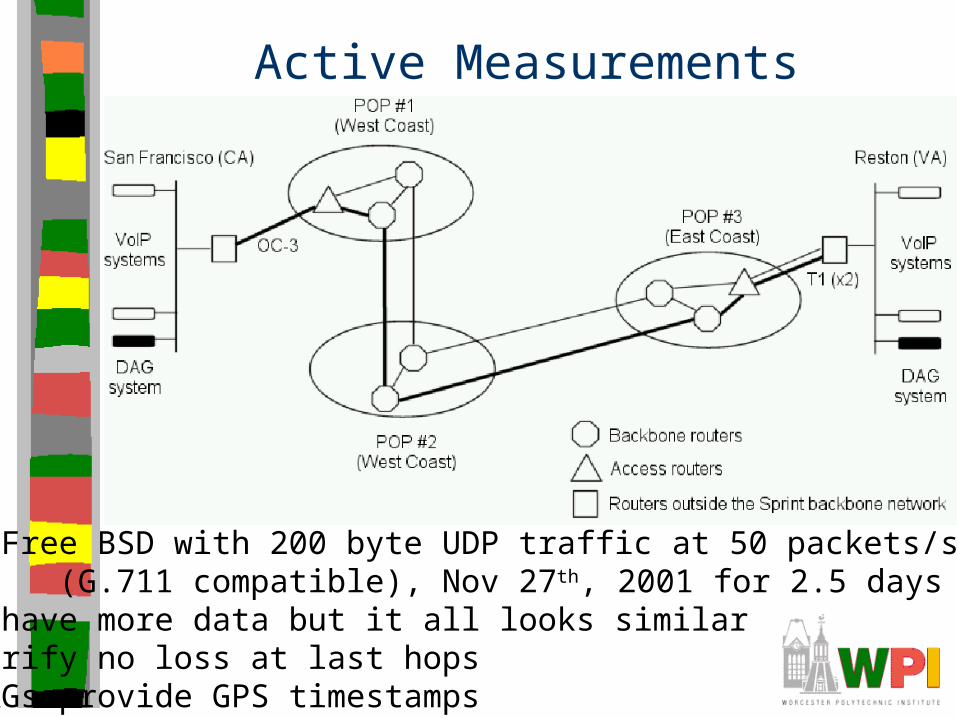
• Free BSD with 200 byte UDP traffic at 50 packets/second(G.711 compatible), Nov 27th, 2001 for 2.5 days
- have more data but it all looks similarVerify no loss at last hopsDAGs provide GPS timestamps
Routing Data• Capture IS-IS routing at POP #2
• Link-state– links assigned a weight
– router broadcasts link weights to other routers• In Link State PDU (LSP)• Periodically and when topology change
– When have path information from all, use SPF to construct route (called decision process)
• For some conditions (reboot), decision process can take minutes– Router sets paths “infinite” so not used for route
Outline
• Introduction (done)
• Related Work (done)
• Measurements (done)
• Voice Call Rating(next)
• Results
• Conclusion
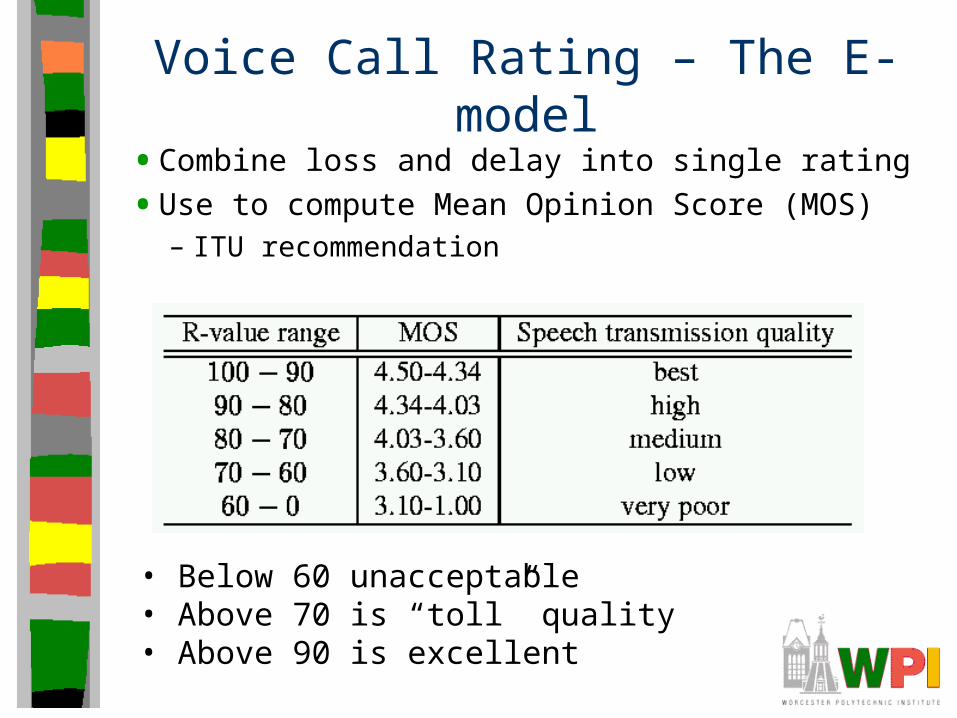
Voice Call Rating – The E-model
• Combine loss and delay into single rating
• Use to compute Mean Opinion Score (MOS)– ITU recommendation
• Below 60 unacceptable• Above 70 is “toll” quality• Above 90 is excellent
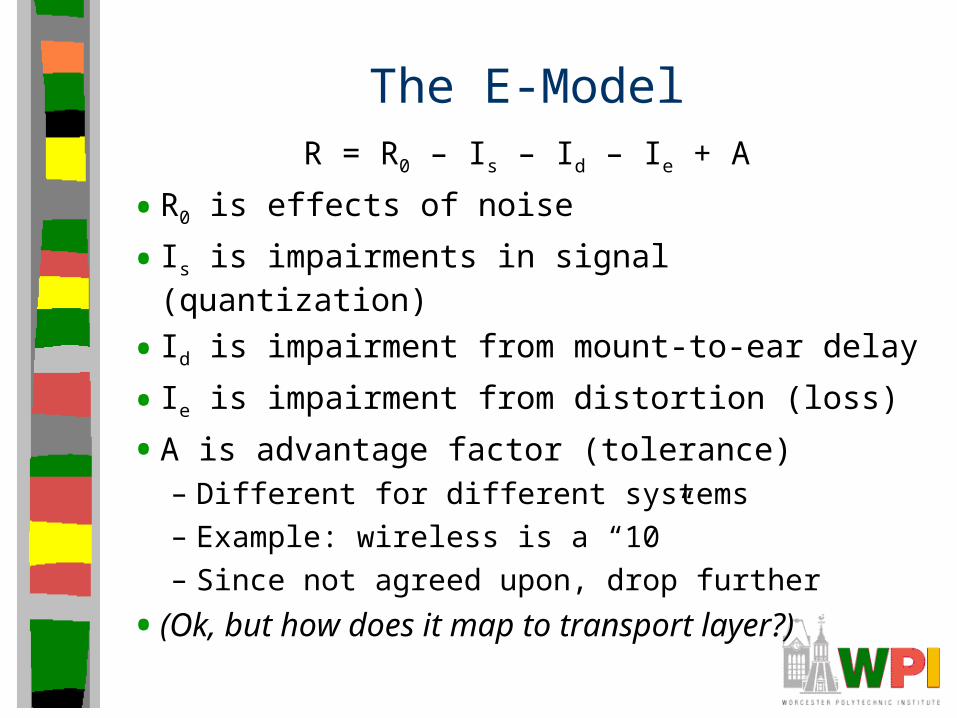
The E-ModelR = R0 – Is – Id – Ie + A
• R0 is effects of noise
• Is is impairments in signal (quantization)
• Id is impairment from mount-to-ear delay
• Ie is impairment from distortion (loss)
• A is advantage factor (tolerance)– Different for different systems
– Example: wireless is a “10”
– Since not agreed upon, drop further
• (Ok, but how does it map to transport layer?)
The E-model at the Transport Layer
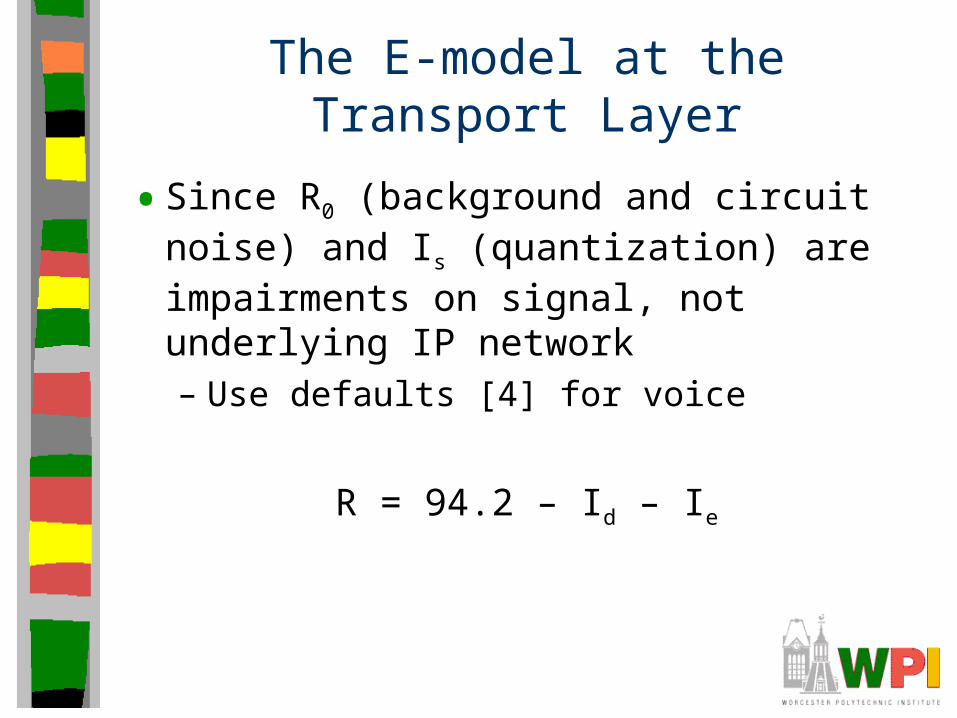
• Since R0 (background and circuit noise) and Is (quantization) are impairments on signal, not underlying IP network– Use defaults [4] for voice
R = 94.2 – Id – Ie
The E-model at the Transport Layer
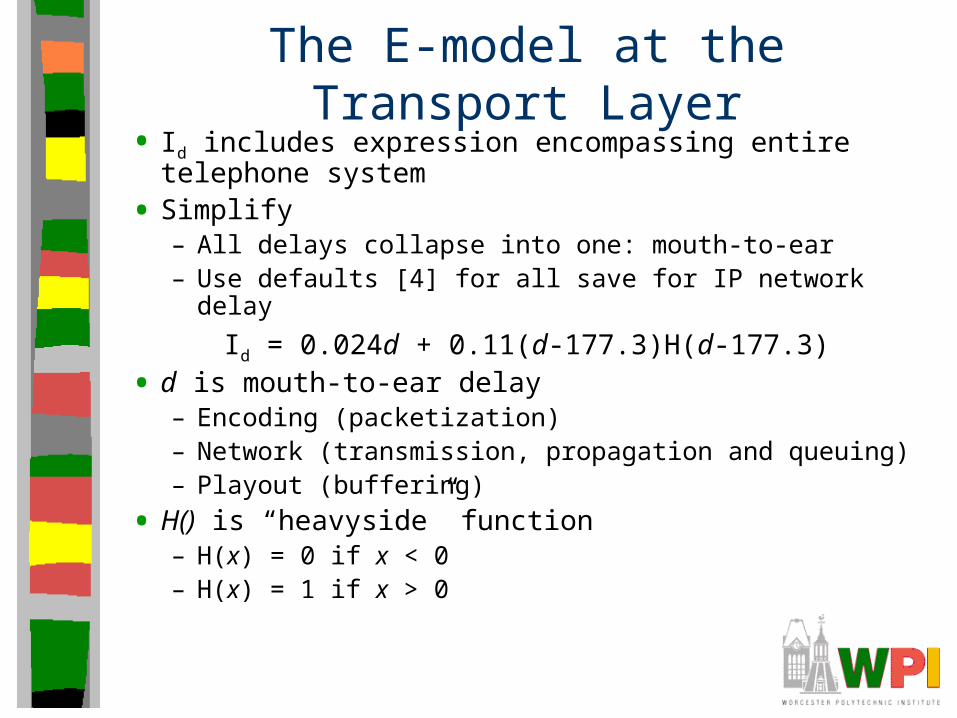
• Id includes expression encompassing entire telephone system
• Simplify– All delays collapse into one: mouth-to-ear– Use defaults [4] for all save for IP network delay
Id = 0.024d + 0.11(d-177.3)H(d-177.3)
• d is mouth-to-ear delay– Encoding (packetization)– Network (transmission, propagation and queuing)– Playout (buffering)
• H() is “heavyside” function– H(x) = 0 if x < 0– H(x) = 1 if x > 0
The E-model at the Transport Layer
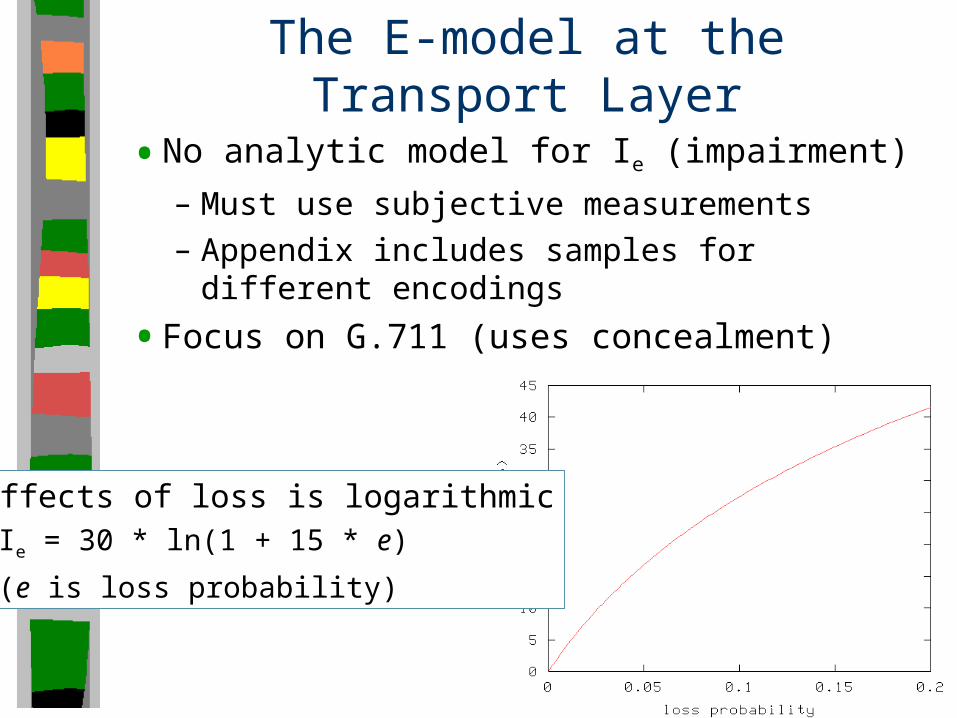
• No analytic model for Ie (impairment)
– Must use subjective measurements
– Appendix includes samples for different encodings
• Focus on G.711 (uses concealment)
• Effects of loss is logarithmic–Ie = 30 * ln(1 + 15 * e)
–(e is loss probability)
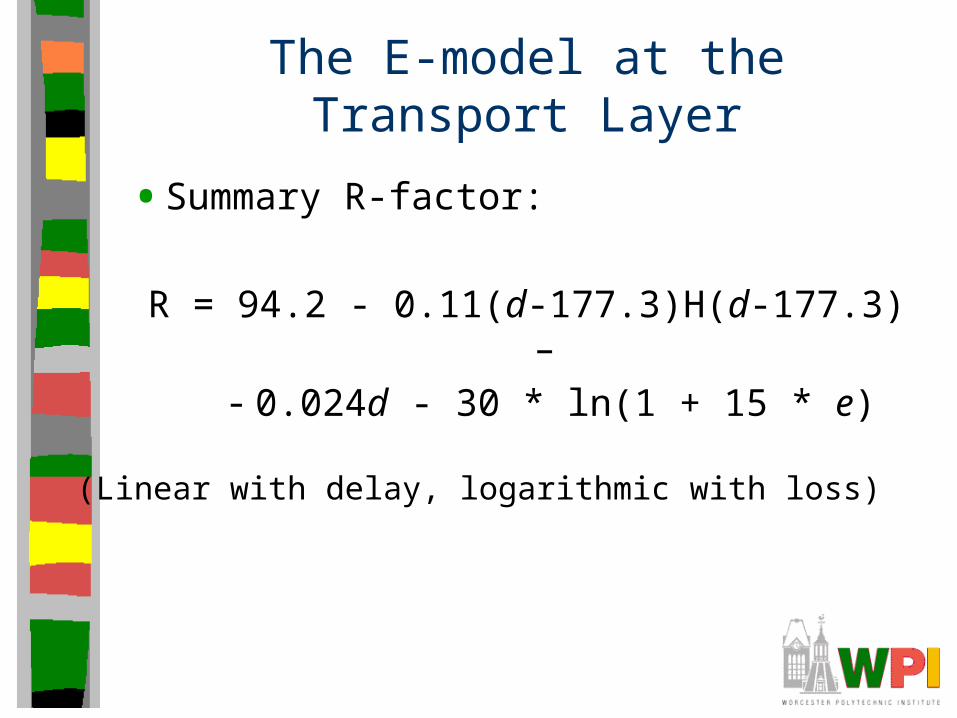
The E-model at the Transport Layer
• Summary R-factor:
R = 94.2 - 0.11(d-177.3)H(d-177.3) –- 0.024d - 30 * ln(1 + 15 * e)
(Linear with delay, logarithmic with loss)
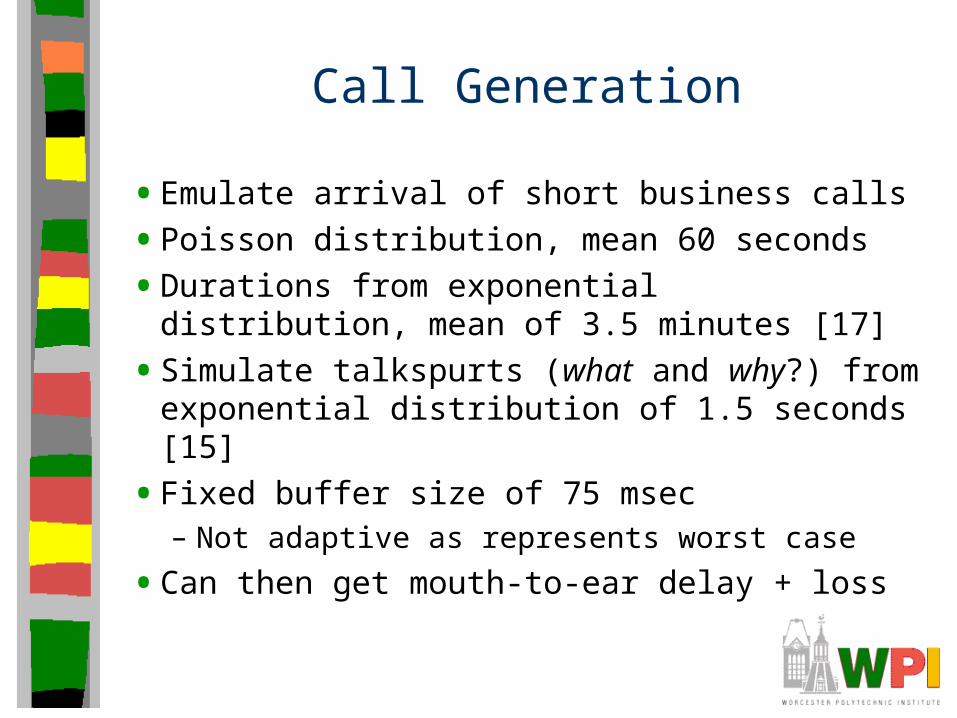
Call Generation
• Emulate arrival of short business calls
• Poisson distribution, mean 60 seconds
• Durations from exponential distribution, mean of 3.5 minutes [17]
• Simulate talkspurts (what and why?) from exponential distribution of 1.5 seconds [15]
• Fixed buffer size of 75 msec– Not adaptive as represents worst case
• Can then get mouth-to-ear delay + loss
Outline
• Introduction (done)
• Related Work (done)
• Measurements (done)
• Voice Call Rating(done)
• Results (next)– Delay– Failures– Voice Quality
• Conclusion
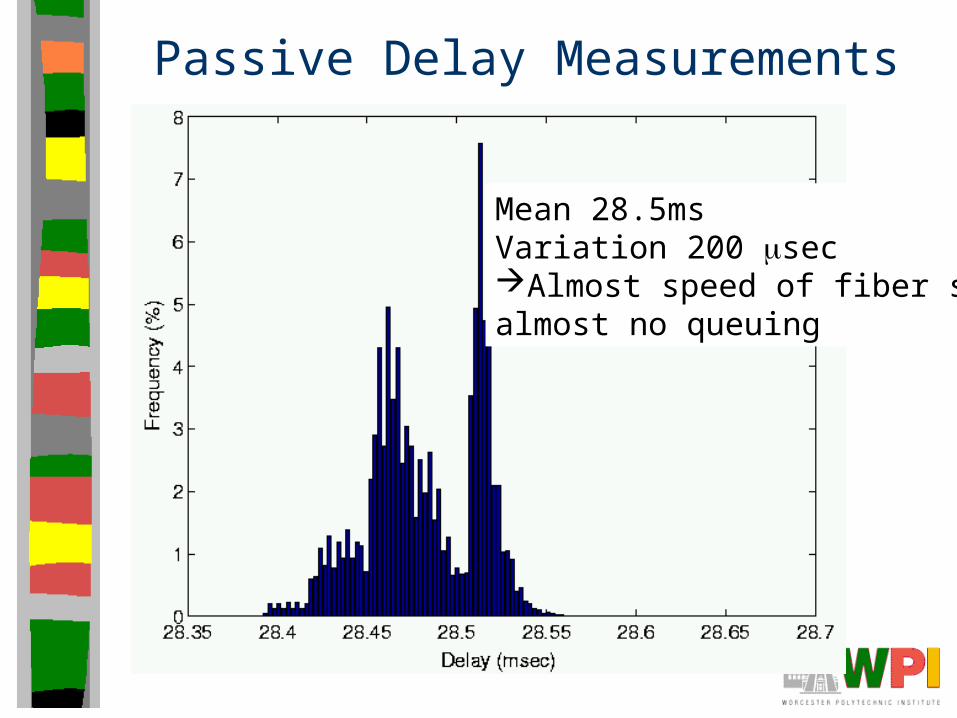
Passive Delay Measurements
Mean 28.5msVariation 200 secAlmost speed of fiber soalmost no queuing
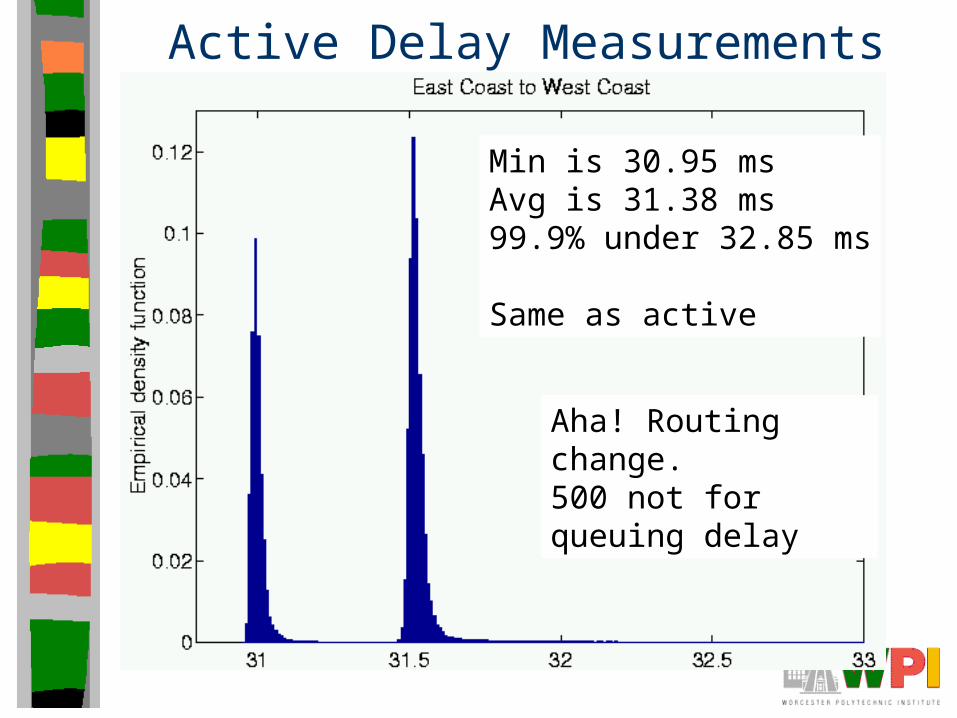
Active Delay Measurements
Min is 30.95 msAvg is 31.38 ms99.9% under 32.85 ms
Same as active
Aha! Routing change.500 not for queuing delay
Outline
• Introduction (done)
• Related Work (done)
• Measurements (done)
• Voice Call Rating(done)
• Results (next)– Delay (done)– Failures (next)– Voice Quality
• Conclusion
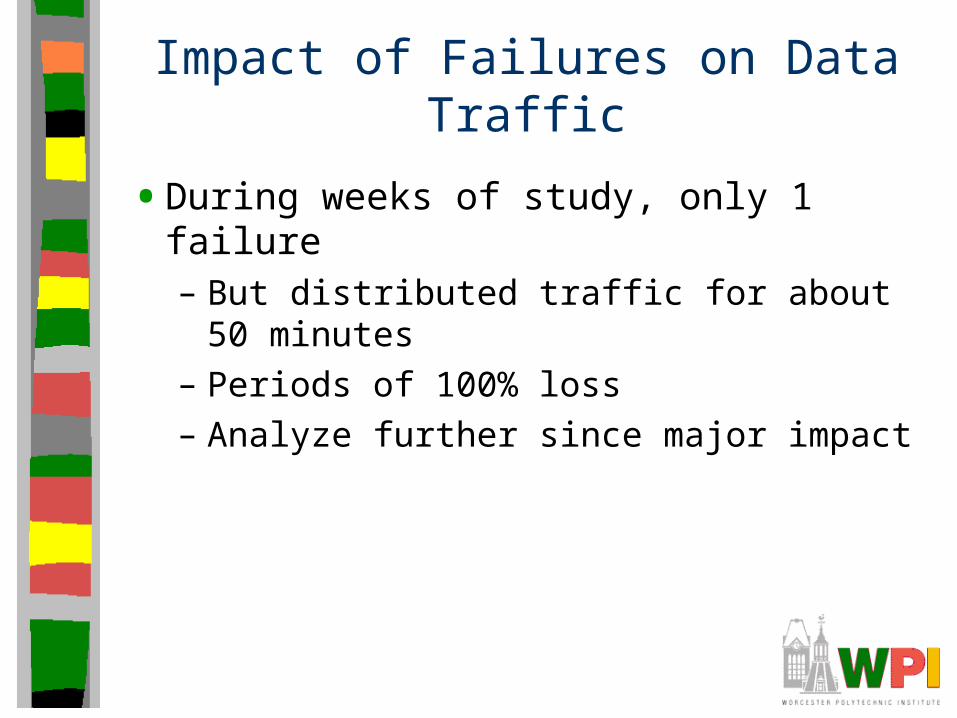
Impact of Failures on Data Traffic
• During weeks of study, only 1 failure– But distributed traffic for about 50 minutes
– Periods of 100% loss
– Analyze further since major impact
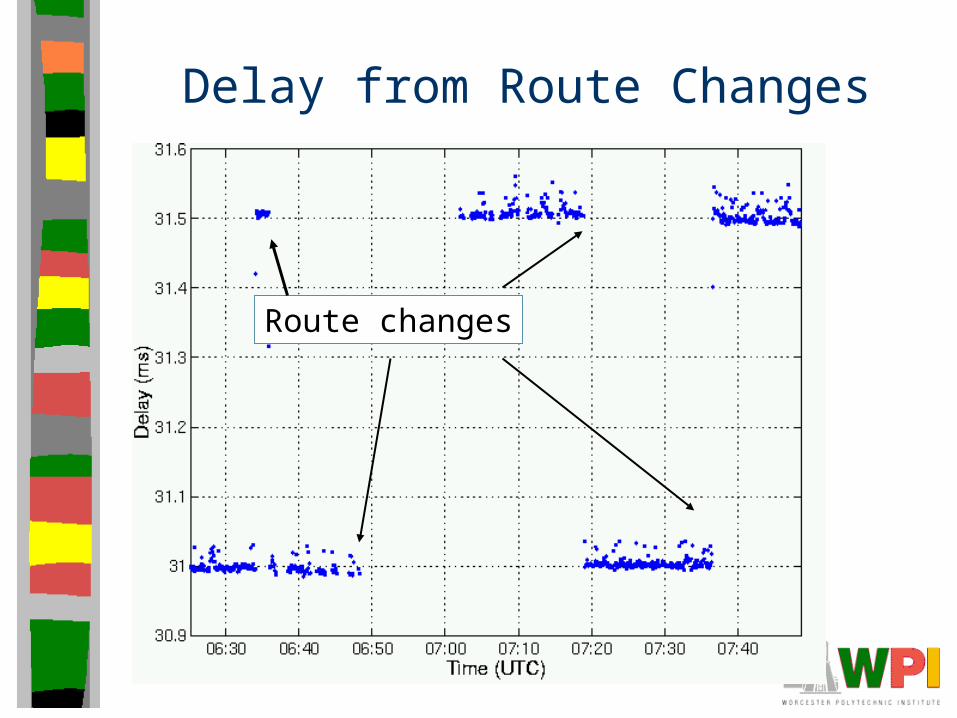
Delay from Route Changes
Route changes
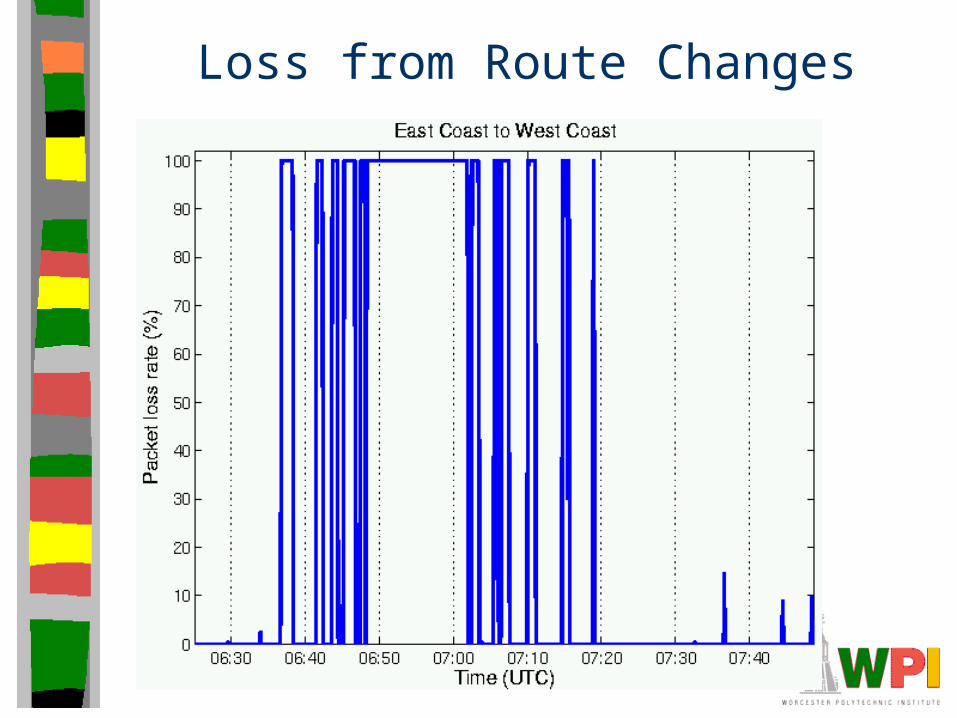
Loss from Route Changes
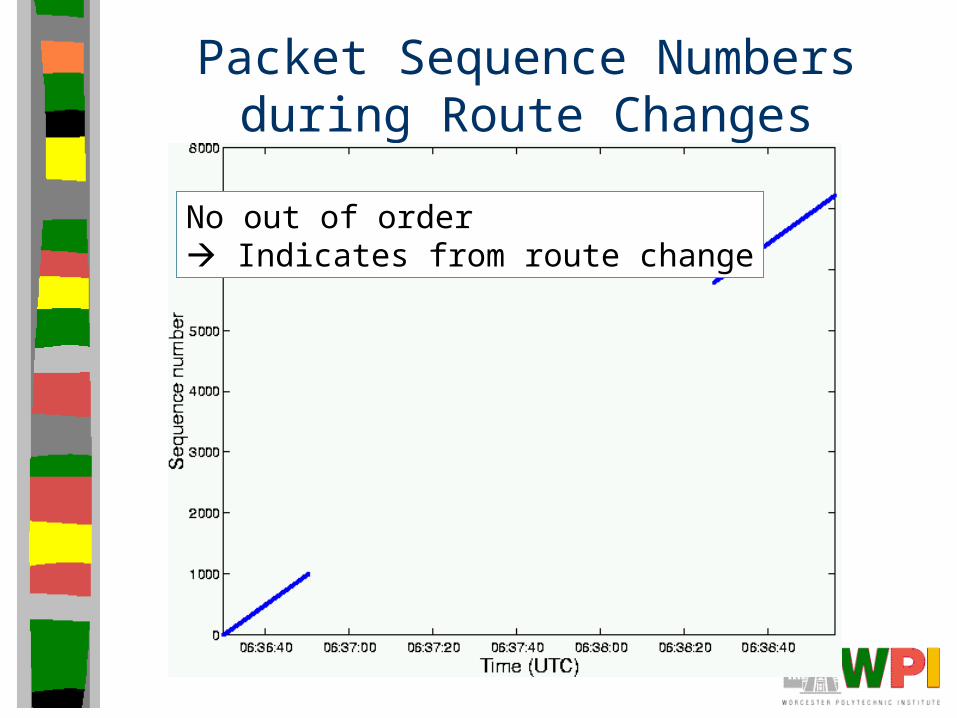
Packet Sequence Numbers during Route Changes
No out of order Indicates from route change
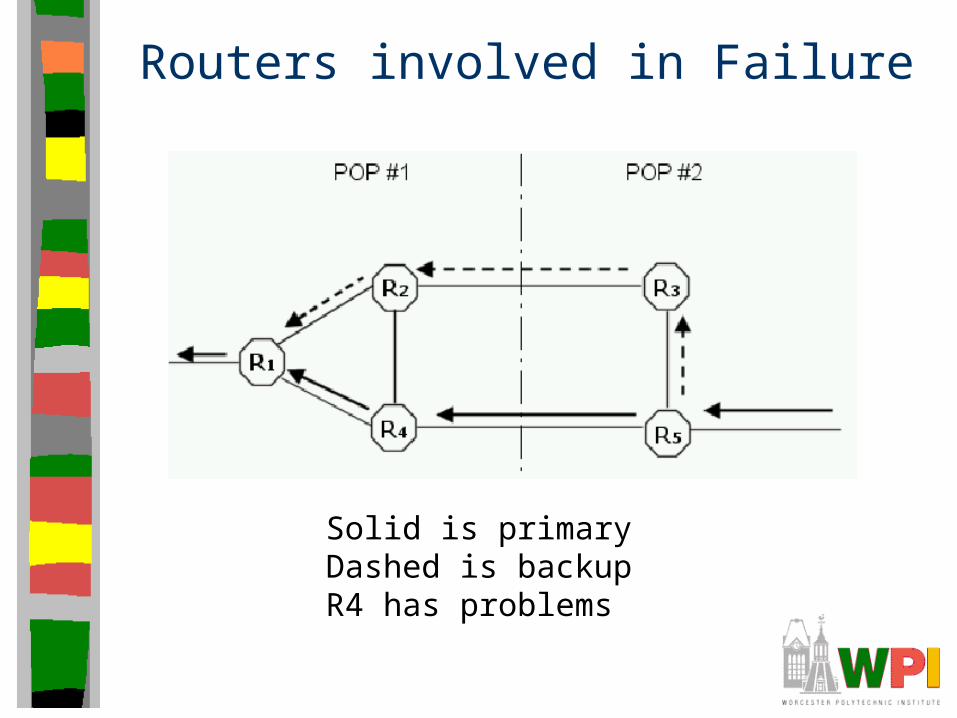
Routers involved in Failure
Solid is primaryDashed is backupR4 has problems
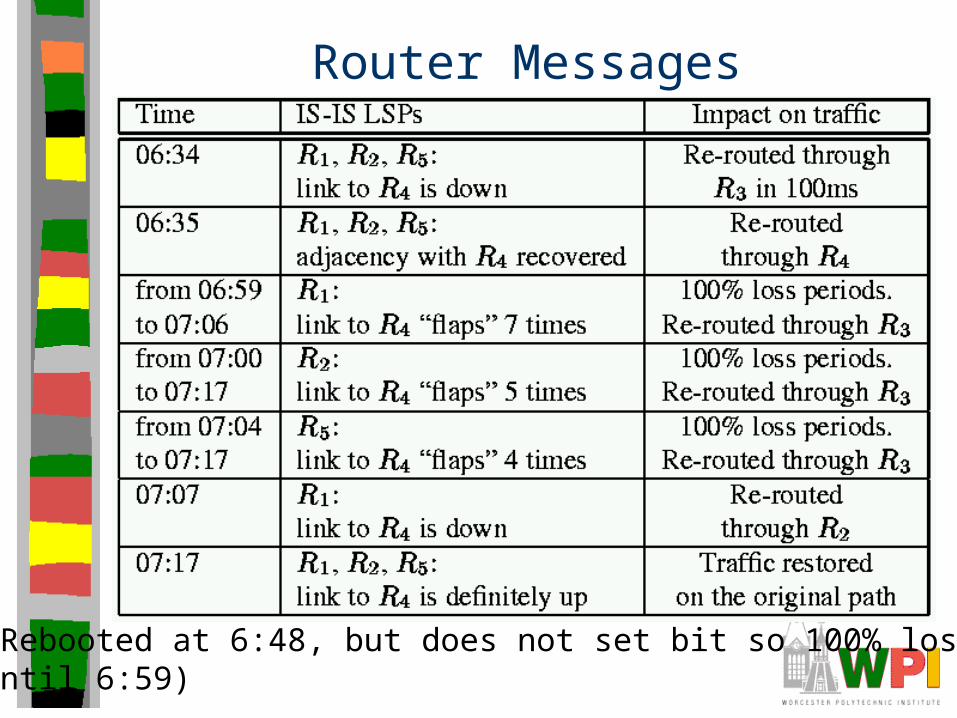
Router Messages
(Rebooted at 6:48, but does not set bit so 100% lossUntil 6:59)
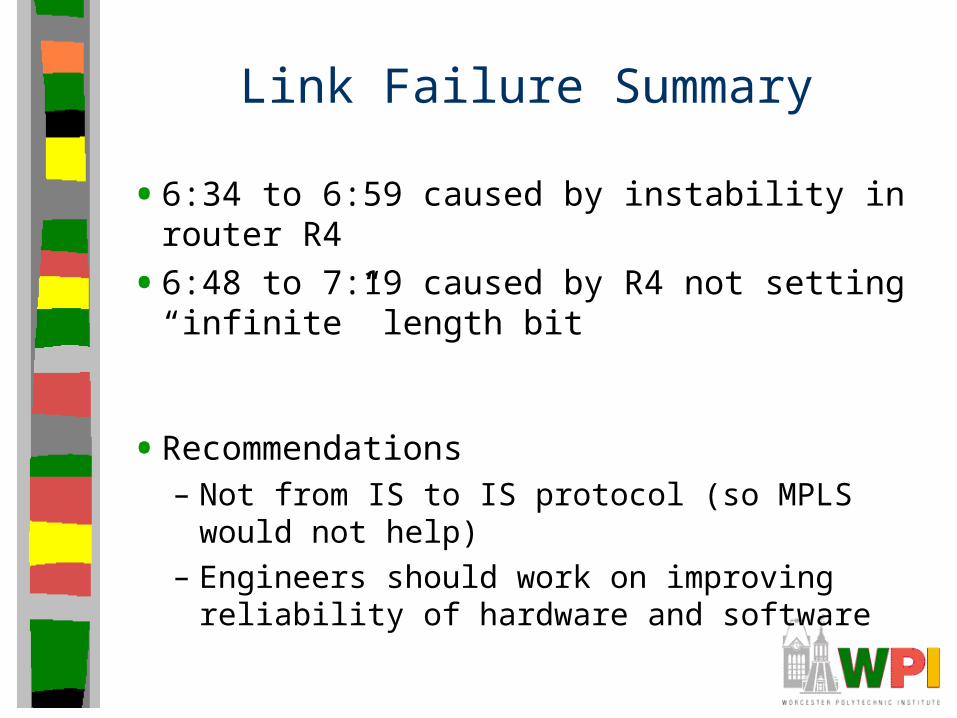
Link Failure Summary
• 6:34 to 6:59 caused by instability in router R4
• 6:48 to 7:19 caused by R4 not setting “infinite” length bit
• Recommendations– Not from IS to IS protocol (so MPLS would not
help)
– Engineers should work on improving reliability of hardware and software
Outline
• Introduction (done)
• Related Work (done)
• Measurements (done)
• Voice Call Rating(done)
• Results (next)– Delay (done)– Failures (done)– Voice Quality (next)
• Conclusion
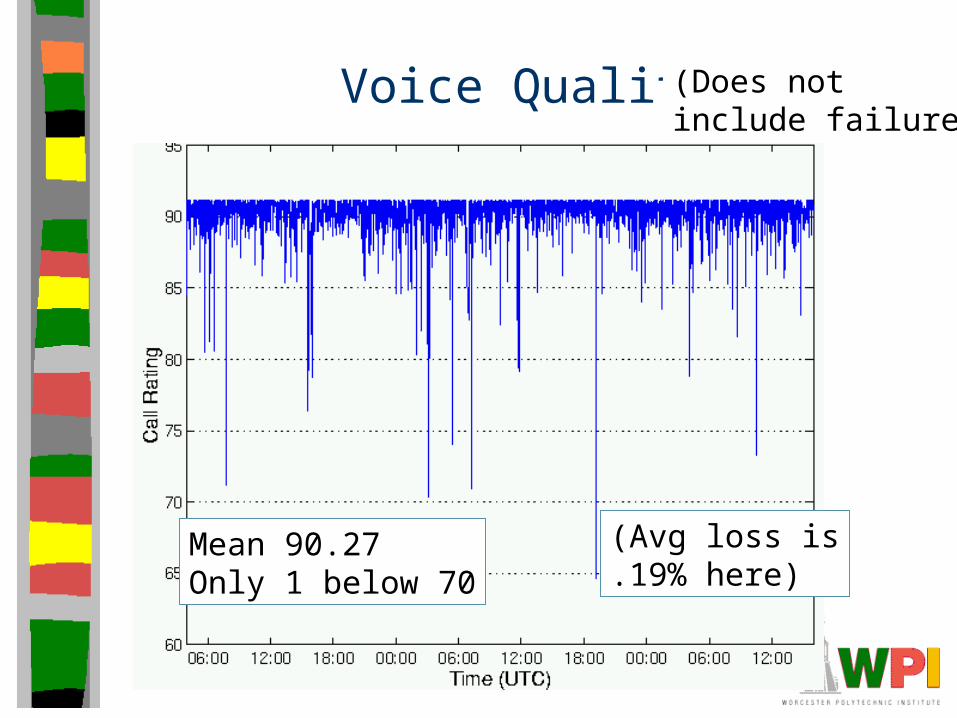
Voice Quality (Does notinclude failure)
Mean 90.27Only 1 below 70
(Avg loss is.19% here)
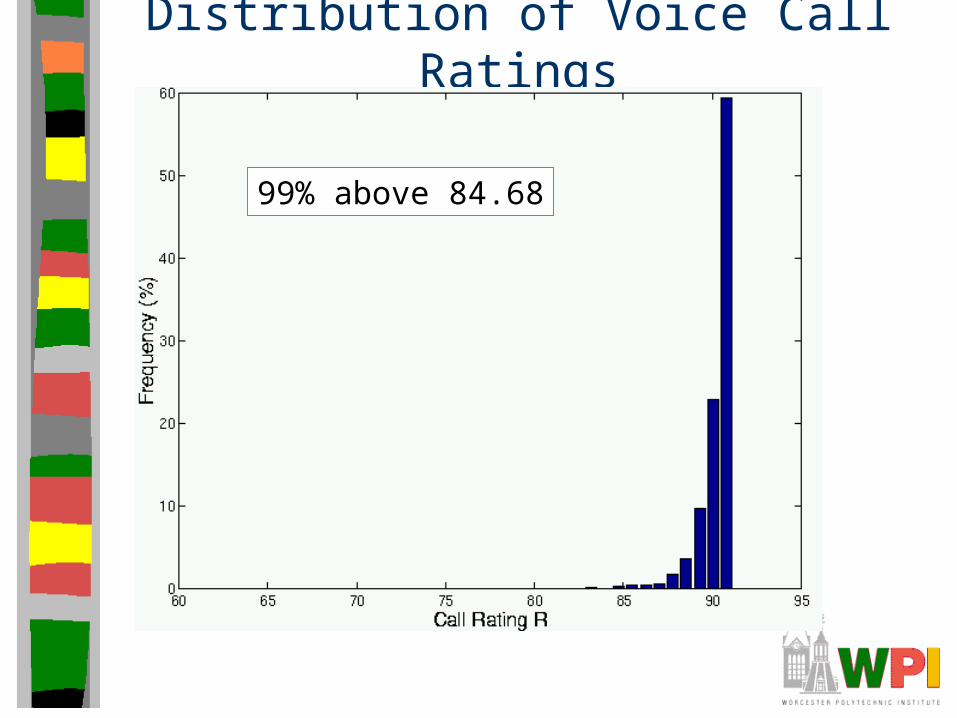
Distribution of Voice Call Ratings
99% above 84.68
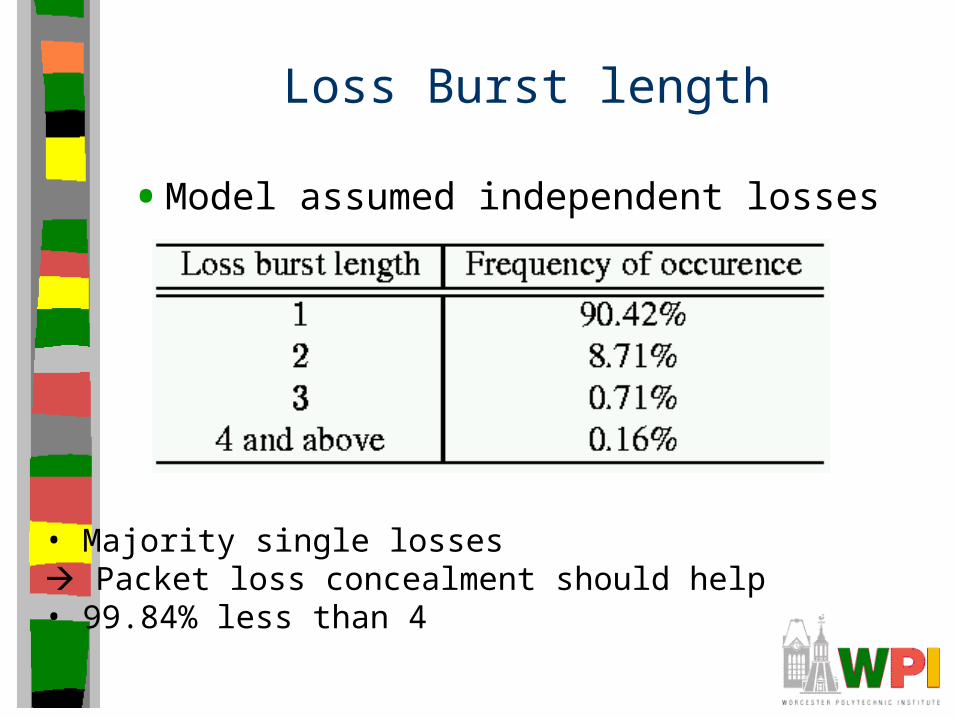
Loss Burst length
• Model assumed independent losses
• Majority single losses Packet loss concealment should help• 99.84% less than 4
Conclusion
• Evaluated VoIP over backbone via passive and active measurements
• Toll quality can be delivered– Delay and loss typical of traditional phone
systems
• Degradation mainly through link and router failures– Not from routing protocols but from equipment
– More important as hops increase
Future Work
• More experiments– Want overall likelihood of link failure
• Compare network availability with telephone availability– FCC defines standards that affect 90k lines for
more than 30 minutes
– Difficult to define for IP since no “lines”, customer count tough, and outage could be from non-network (ie- DNS) cause


![[VoIP] Cisco CallManager Basics (VoIP)](https://img.pdfslide.us/doc/110x75/55cf99c3550346d0339f0d92/voip-cisco-callmanager-basics-voip.jpg)