Embed Size (px)
Citation preview

IJLRET
International Journal of Latest Research in Engineering and Technology (IJLRET)
ISSN: 2454-5031
www.ijlret.com || Volume 02 - Issue 06 || June 2016 || PP. 89-108
www.ijlret.com 89 | Page
IMPACT OF LEASE FINANCE ON PRODUCTIVITY,
PROFITABILITY&EMPLOYMENT IN SMALL
MANUFACTURING FIRMS IN BANGLADESH: STUDY ON
UNITED LEASING COMPANY
Muhaiminul Islam
BBA, School of Management and Business Administration, Khulna University, Bangladesh
Sultana Nasira BBA, School of Management and Business Administration, Khulna University, Bangladesh
Sarker Towfiq Pritom BBA, School of Management and Business Administration, Khulna University, Bangladesh
1. Introduction
1.1 Background of the Study
Bangladesh is a small country but have a large population and a large market economy. Entrepreneurial activity
is growing and the economy is on rise. Spread of education; improve transportation and technological
advancement are fostering the growth aspiration of individual business FIRM. World financial organization like
Asian development bank, International Finance Corporation, Commonwealth Organization and such many
organizations came ahead to assist those small FIRMs to grow up.
The NBFIS sector in Bangladesh consisting primarily of the development financial institutions, leasing
enterprises, investment companies, merchant bankers etc. Non-bank financial sector is important to increase the
mobilization of term savings and for the sake of providing support services to the capital market. The focus of
this paper is to highlight impact of lease finance to strengthen the economic condition of small manufacturing
organizations and their dependent population i.e. labor, owner, supplier.
1.2 Objectives of the Study
To show the impact of lease finance on Productivity, Profitability and Employment in small manufacturing
FIRM.
1.4 Methodology
Sampling design:
The population is all the manufacturing enterprises taken loan from united leasing company ltd of Jessore office.
There are clients who reside and operate in Jessore, Satkhira or Khulna, Magura, Faridpur, Zhenaidah and
Narail districts. The three districts Khulna Jessore Satkhira have 78 manufacturing ventures. Among them 16
units were used as sample for the study.
Target population: Manufacturing organization of Jessore who was client of ULC
Sampling frame: Official lists and records with conversation and approval from office executives.
Sampling technique: Sample was selected based multistage sampling. Initially the sample frame produced
sample. Later research followed quota to represent FIRMs from all manufacturing categories. Then the Simple
Random sampling technique was adopted to select the sample.
Sample size: The nature of the research, level of homogeneity in population and dispersion factor suggests 20%
population‘s study of 16FIRMs. The sample comes off more than 12 categories of business units.Those were
arranged in lease agreement with ULC Jessore office till 2010.
Needed Information
I. Employee number before and after lease
IJLRET
International Journal of Latest Research in Engineering and Technology (IJLRET)
ISSN: 2454-5031
www.ijlret.com || Volume 02 - Issue 06 || June 2016 || PP. 89-108
www.ijlret.com 90 | Page
II. Change in Profit for a given scale of investment of BDT. 100
III. Change in Productivity (studied as the output- input ratio)
IV. Lease size
Data Collection:
I. Primary data are acquired through respondent survey, conversation to ULC official, new recruits and
trained officers in Jessore office ULC
II. Secondary data came through extensive literature study collected from online pdf articles, reports, and
web sites.
Survey technique:
The survey was primarily conducted in unstructured manner. As the respondents are of various group having
unique context needed to raise different and appropriate question so that they elicit needed information on the
topics stated above
Scaling technique:
The research sought data on ratio scale. The precise ratio scale produced exact score on changes on the variables
whether it were lease or impacts and changes. The ratio scale data were directly used to conduct parametric
Paired Sample t test.(Malhotra, 2009)
Data analysis tools
Standard deviation
Coefficient of variance
T- Test hypothesis analysis
Correlation analysis
Data interpretation
Through various table graph and figure the data will be interpreted.
1.5 Limitations
Analyzing data was full of difficulties due to inconsistency and insufficiency. The FIRMs under study were
quite different in counting the production output and reporting profit is some time confiscated due to the fear of
income tax.The respondents were needed to be explained first the terms and concepts. Moreover most of the
respondent was the owner or the Managing Director of the FIRM. They had time constraints in co-operating the
research as deeply as needed. Time allocation was considering both to maintain office activity and field
touring.The sample FIRMs responded with presence of the Relationship Manager. There remains a probability
that the responses are free of negativity. In this causal research for testing hypothesis extraneous variables
impact is assumed to be neutral. And thus the research can be defined as only a ‗before and after without control
design‘ (Kothari, 2010). The sample consists of 16 FIRMs. To get higher external validity sample could bit
larger. And to confirm sufficient internal validity an independent resourceful research could be more
appropriate. The internship research project lacked these resources.
2. Literature Review and Hypotheses Development 2.1 Literature Review Manufacturing sector in Bangladesh has been contributing at a consistent rate over the last decade to around 15
percent. SMEs in manufacturing and services combined have 19 percent share of GDP. A nationwide survey
claims that Micro, Small and Medium Enterprises (MSMEs) value addition accounts for 20 to 25 percent of
Bangladesh‘s GDP (Daniel, 2003).SMEs have historically played an important role in contributing to economic
development of many Countries around the world. Naturally all businesses start as small businesses or even start
out of small businesses initiated by individuals. (Mukole, 2010). By chronicle of success these FIRMs emerge
into big ventures. Bangladesh being a cyclone, disaster prone agricultural country independent since 1971 goes
through the same rule on economic up gradation. Throughout the global map we see the fact. One of the
significant characteristics of a flourishing and growing economy is a booming and blooming small and medium
enterprises sector. Small and medium enterprises play an important role in the development of a country
(Feeney and Riding, 1997). The importance of small business in the economy has been convincingly debated by
policy makers, researchers and economists for many decades (Neumark et al. 2008). In countries like
Bangladeshand many other developing countries where population rate is high, capital is scarce and skilled,
trained and education people few,the role of Small Industries is apprehended positively.For Bangladesh small

IJLRET
International Journal of Latest Research in Engineering and Technology (IJLRET)
ISSN: 2454-5031
www.ijlret.com || Volume 02 - Issue 06 || June 2016 || PP. 89-108
www.ijlret.com 91 | Page
FIRMs are important segment that employ people, creates job and money to poor workers. Manufacturing
FIRMs are more important as found other studies. the greatest potential of employment creation is among the
SMEs involved in manufacturing, SMEs in manufacturing are important for the developed countries as well
(Baldwin and Picot, 1994) since growth of SME in manufacturing sector creates disproportionate amount of net
employment because of its labor intensive character. (Mehnazand Munshi, 2005). The role of SME in
employment generation and poverty reduction has been well recognized in the PRSP (GOB, 2002). SMEs create
and retain most jobs, between 60 %-70 % in rich economies, even more in emerging economies. (OECD, 2006)
The history of the economic development of different countries of the world suggests that financial development
of the country start from banking financial institutions followed by the non banking financial institutions. But in
the later stage, the contribution of non-banking financial institutions becomes more eminent than the
BFIs(Monzur and Shahid ,2005).
Industrial development has had an important role in the economicgrowth of countries like China, the Republic
of Korea (Korea), TaiwanProvince of China (Taiwan), and Indonesia. Along with accelerated growth,poverty
rates have declined in many countries.(Kniivilä, 2007)
Bangladesh is independent since 1971. The country ever faced pressure of large population, scarcity of
resources and spread of modern education. As it walks on an agro economy industrial ventures are likely
associated with agriculture either as supplier or user. After 80‘s the government focused on industrialization of
the country and later it was apprehended that the Small and Medium scale industries can help the economy in
more effective way.Huge population of the country who are largely unskilled having two arms to work supports
expansion of small scale enterprise as small ventures are by nature labor intensive and operated in small area.
In third world countries like Bangladesh capital scarcity is a major problem in urbanization and economic
development. The current understanding of economic growth is largely based on the neoclassicalgrowth model
developed by Robert Solow (1956). In the Solowmodel, capital accumulation is a major factor contributing to
economicgrowth. Productivity growth – measured as an increase in output per worker– results from increases in
the amount of capital per worker, or capital accumulation(e.g. Fagerberg 1994)(Kniivilä, 2007). It is
apprehensible that Small Enterprise Finance can really improve the financing capacity and easing business for
small enterprises in Bangladesh.
The SME sector of India reported about 25% job losses during the recent global recession. However, it has been
one of the fastest to tide over the gloom with figures of job creation coming up on a steady pace, the analysis
said. This sector alone contributed almost 40 % of all jobs created in the economy thereafter - showing the
flexibility and adaptability of quick response. SMEs contributes to 45 per cent of the industrial output, 40 per
cent of exports, provides employment to nearly 60 million people and creates as many as 10 lakh jobs each year.
The SME sector also produces more than 8,000 different products annually not only for the Indian markets but
also international shores. Further push is being given to the SME sector in the areas such as pharma, food
processing, auto ancillary, IT, retails, textiles and garments, agro, nano technology, financial sector and service
sectors. It is probably the only sector with an employment potential at a low capital cost. More labor intensive,
the sector has consistently registered higher growth compared to the overall industrial sector. And owing to its
size, these units are more adaptable to the changing market scenario and show remarkable innovativeness in
each vertical. (Mahesh, 2010)
Industrialization is often essential for economic growth, and for long-runpoverty reduction. The pattern of
industrialization, however, impactsremarkably on how the poor benefit from growth. Pro-poor economic
andindustrial policies focus on increasing the economic returns to the productivefactors that the poor possess,
e.g. raising returns to unskilled labour,whereas policies promoting higher returns to capital and land tend
toincrease inequality, unless they also include changes in existing patterns ofconcentration of physical and
human capital and of land ownership. Use ofcapital-intensive methods instead of labour-intensive ones tends to
increaseincome disparities, as does the employment of skill-biased technologies, especiallywhere the level of
education is low and human capital concentrated.(Kniivilä, 2007). Also, the location of industrial facilities has
an impact on overall povertyreduction and inequality. As enterprises are often concentrated in urban areas
– Because of ready access to skilled labour force, better infrastructure, largermarkets and technological
spillovers (e.g. Lanjouw and Lanjouw, 2001),industrialization may increase inequality between urban and rural
areas.Promoting development of rural non-agricultural activities, like productionin small and medium-sized
enterprises (SMEs), may decrease this disparity.(Kniivilä, 2007)
In various writing like the above few, role of small and medium industries is established in economic
development of a country. However how are the small enterprises affected by lease finance as lease finance is
also apprehended for positive impact worldwide?Small and Medium Enterprises (SMEs) are accounting for 25
percent of GDP, 80 percent of industrial jobs, and 25 percent of the total labor force in Bangladesh (Shamsul
and Anwar, 2006). How much is the small industries activity influenced by finance mechanism. Atpresent 29

IJLRET
International Journal of Latest Research in Engineering and Technology (IJLRET)
ISSN: 2454-5031
www.ijlret.com || Volume 02 - Issue 06 || June 2016 || PP. 89-108
www.ijlret.com 92 | Page
leasing companies are working in Bangladesh. These enterprises are accommodating more than 30 million
people aged 15 years and above. Therefore, SME sector deserves more attention and focus to foster growth and
generate employment. (Mehnazand Munshi, 2005)
Jessore is one of sixty four cities of Bangladesh. It has importance to national economy for supplying goods and
material those are input in many of large industries. The city also produces the necessary auto parts, machine
tools needed for a vast market of southern region of the country It‘s assumed to be the nucleus of the greater
southern districts.As found in local studies the city got advancement in business sector during the British Reign.
Numbers of small and medium enterprises of different manufacturing category supplies necessary inputs to
many other businesses across the greater regions. Those small FIRMs engage worker and employees from
surrounding places. The FIRMs are also seemingly growing. Many empirical studies suggests that the Small and
medium enterprises supports job creation and revenue. It‘s also notable that numbers of financing companies
are opening branches over time. Lease financing has sail out since 1987 in Bangladesh. Small and med size
organizations financing is a strategic decision to maximize return.
the above findings help assume that Lease Finance is improving many FIRMs profitability, their productivity,
allocative efficiency as well contributing to the poverty reduction by employment creation by channeling value
toward a diverse chain to root level of people of Bangladesh. The report aim to test this assumption So This
report aims to find out whether as stated above, ULC‘s Lease finance puts positive impact on employment
creation, productivity and profitability to the business community of Jessore.
2.2 Hypothesis Development
Productivity Hypotheses
Null Hypotheses: h0,
Lease Finance did not improve productivity of small manufacturing units in Jessore region
Experimental Hypotheses: h1
Lease Finance did not improve productivity of small manufacturing units in Jessore region
Profitability Hypotheses:
Null Hypotheses:h0,
Lease Finance didn‘t improved profitability of small manufacturing FIRMs of Jessore region
Experimental Hypotheses: h1
Lease Finance improved profitability of small manufacturing FIRMs of Jessore region
Employment Hypothesis:
Null Hypotheses:h0,
Lease Finance didn‘t create new jobs in small manufacturing FIRMs of Jessore region
Experimental Hypotheses: h1
Lease Finance created new jobs in small manufacturing FIRMs of Jessore region
Variables for the study are as follows
Independent variables:
Loan amount
Dependent variable:
Employment
Profitability
Productivity
Parameters are
Before loan Employment ( J0) and after loan Employment ( J)
Before loan Profitability(Pf0) andafter loan Profitability (Pf)
Before loan Productivity (Pd0) and after loan Productivity (Pd)
3. Understanding Lease Finance 3.1 Definition of Lease
Lease finance is a way of financing where the person can arrange purchase of his needed equipment without
deploying the full amount of money. Commercial purchasing of large scale equipment be it machinery, vehicles,
machines are frequently conducted by leasing arrangements. Because of it merits the finance mechanism is
worldwide accepted. Bangladesh as one of least developed countries posses a wide prospect for lease finance

IJLRET
International Journal of Latest Research in Engineering and Technology (IJLRET)
ISSN: 2454-5031
www.ijlret.com || Volume 02 - Issue 06 || June 2016 || PP. 89-108
www.ijlret.com 93 | Page
services. Leasing is an international practice of financing for the expansion of business. A finance lease or
capital lease is a type of lease. It is a commercial arrangement where:
The lessee (customer or borrower) will select an asset (equipment, vehicle, software);
The lessor (finance company) will purchase that asset;
The lessee will have use of that asset during the lease;
The lessee will pay a series of rentals or installments for the use of that asset;
The lessor will recover a large part or all of the cost of the asset plus earn interest from the rentals paid
by the lessee;
The lessee has the option to acquire ownership of the asset (e.g. Paying the last rental, or bargain option
purchase price);
The finance company is the legal owner of the asset during duration of the lease. However the lessee has control
over the asset providing them the benefits and risks of (economic) ownership.
3.2 Understanding Small Enterprise
Industrial policies prior to 1999 divided the industrial sector into three categories — large, small and cottage.
The cut-off limit of these size categories was determined on the basis of the size of fixed assets. Thus, the
Industrial Policy 1991 defined ―Small Industry‖ as industrial undertakings whose total fixed investment
excluding the price of land, expenses for inland transportation and commissioning of machinery and appliances,
and duties and taxes, was limited to Tk. 30 million (US $800 thousand) including initial working capital, while
the upper limit on the investment level in ―Cottage Industry‖ was Tk. 500,000 (US $13 thousand). In contrast,
the Industrial Policy 1999 distinguished medium from large industry and defined the size categories in terms of
both capital and employment size. Thus,
Large Industry‖ was defined to include all industrial enterprises having 100 or more workers and/or having a
fixed capital of over Taka 300 million (US $6 million).
Medium industry covered enterprises employing between 50 and 99 workers and/or with a fixed capital
investment between Taka. 100-300 million (US $2-6 million).
‗Small Industry‖ meant enterprises having fewer than 50 workers excluding the cottage units and/or with a fixed
capital investment of less than Taka 100 million (US $2 million). ―Cottage Industry‖ covered household-based
units operated mainly with family labor. However, in the latest industrial policy announced in 2005, significant
changes have been brought about in the definition of the various size categories. In the Industrial Policy 2005, a
distinction has been made between manufacturing and non-manufacturing enterprises. In the case of the
manufacturing enterprises, sizes have been defined in terms of the value of the fixed assets while in the case of
the non-manufacturing enterprises the cut-off line has been identified in terms of employment size. Thus, large
industry is now defined as units with fixed capital of more than Tk. 100 million (US $1.6 million) excluding the
value of land and building while non manufacturing large enterprise is defined as units having more than 100
workers. Medium industry is defined as units with fixed capital of Tk. 15-100 million (US $246 thousand - $1.6
million) excluding the value of land and building while non 4 manufacturing medium enterprises are those with
employment size between 25 and 100 workers. Manufacturing enterprises with fixed assets of less than Tk. 15
million excluding the value of land and non-manufacturing enterprises with fewer than 25 workers are to be
treated as small enterprise. (Shamsul and Anwar,2006)
While the definition of SME has changed overtime in different Industrial Policy pronouncements, Bangladesh
Bureau of Statistics (BBS), which is the prime national organization responsible for generating and compiling
various types of statistics in the country has been consistently using an all together different classificatory
scheme. Thus, BBS defines enterprises having 10-49 workers as ―Medium‖ industries while those having 50 or
more workers are identified as ―Large‖ industries. For industrial GDP data, the medium and large industries are
lumped together under ―Large‖ category. The rest of the industrial enterprises including cottage industries are
grouped under the ―Small‖ category.
Numbers of companies are giving the service worldwide even in Bangladesh. As a nonbank financial institution
the united leasing company has established its name in Bangladesh business Community.
3.3 Origin of Lease Finance
Although leasing is often thought of as a modern day financing technique, indications are that leasing
transactions took place around 2000 B.C., when Sumerian FIRMers leased tools from temple priests. The basics
of leasing have changed little since that time. Over the years, the strength of the leasing industry has been its
resiliency and its ability to make the most of the changing business environment. (Lease Financing -
Comptroller's Handbook) .In Bangladesh IDLC started lease services in 1983 and then ULC in 1989. The
history of the economic development of different countries of the world suggests that financial development of
the country start from banking financial institutions followed by the non banking financial institutions. But in

IJLRET
International Journal of Latest Research in Engineering and Technology (IJLRET)
ISSN: 2454-5031
www.ijlret.com || Volume 02 - Issue 06 || June 2016 || PP. 89-108
www.ijlret.com 94 | Page
the later stage, the contribution of non-banking financial institutions becomes more eminent than the BFIs.
(Monzur &Shahid 2005).
3.4 Types of Lease
Many types of lease contracts are seen in practice, some of which are as follows:
(i) Financial Lease: A long term lease contract which extends over the whole useful life of an asset and which
cannot be cancelled is known as Financial Lease. The duration of the lease is almost equal to the useful life of
an asset. Thus whole investment is recovered by the lessor in case of Financial Lease. The lessee may be given
an option to purchase the asset at the expiration. Sometimes this type of lease is also known as capital lease. In
the Statement of Financial Accounting Standard No. 13, published by the U.S. Financial Accounting Standard
Board, a lease is regarded as a Capital Lease (or Financial Lease) if it meets any one of the following conditions:
(a) The lease transfers title to the asset to the lessee by the end of the lease period.
(b) The lease contains an option to purchase the asset at a bargain price.
(c) The lease period is equal to or greater than, 75 per cent of the estimated economic life of the asset.
(d) At the beginning of the lease, the present value of the minimum lease payments equals or exceeds 90 per
cent of the fair value of the leased property to the lessor.
If any of three conditions is met, the lessee is said to have received most of the economic benefits and risk
associated with the leased property. It is a very popular method and is a better alternative to raising finance
through debentures or bank loan. The asset is available for use to the lessee without arranging for the full value
of the asset. Under this form of lease, the lessee generally selects the asset and the lessor places an order for it
and gets the delivery. The lessor receives the invoice and makes payment for it, end he retains the ownership of
the asset. The lessor is not the manufacturer of or trading in specific assets or equipments. He simply provides
finance for whatever asset the lessee needs.
In financial lease, the maintenance and other related expenses are normally borne by the lessee. He also bears
the risk of obsolescence. Such type of leasing arrangement is also called ‗Close-end Lease‘, because it is non-
cancellable. Secondly, the lease rent is fixed in such a way that whole cost of the asset is recovered and in
addition, profit is made in such a way that a fixed rate of return in earned on capital invested.
(ii) Operating Lease: It is a type of lease in which asset is leased for a short period and the contract is
cancellable after giving notice of a fixed period, e.g. giving an office space on a 2 year lease cancellable on 60-
days notice. Similarly lease contracts for computers or office equipments may run for 3 to 5 years. Thus the
period of such type of lease is shorter than the asset‘s economic life. It is prevalent particularly in those
machines where technological changes are rapid.
In other words, an operating lease is one which does not satisfy any of the conditions mentioned above in
respect of Financial Lease. In this type of lease, the original cost of the asset cannot be recovered in a single
lease, because a single lease covers a period which is shorter than the useful life of the asset. The risk of
obsolescence remains with the lessor. Naturally, the shorter the period of the lease, the greater will be the lease
rentals. The lessor is also responsible for the insurance and other expenses.
The operating lease is generally preferred under following circumstances
(a) When the asset is likely to become obsolete within a short period.
(b) When the lessee is interested in overcoming his problems temporarily.
(iii) Sale and Lease Back: This is a very popular method of leasing. Under a sale and lease back lease, a firm or
individual who is the owner of an asset sells it to another party and the same asset is taken on lease from that
party. Thus the lessee gets money by selling the asset and at the same time, he continues to use the asset by
paying a fixed rental. Generally the parties interested in purchasing assets under such arrangement are insurance
companies, other financial institutions, institutional investors, banks and other specialized leasing companies.
The lessor gets the benefit of depreciation deductions, while the lessee gets the benefit of increased funds, which
he can use in business. Such arrangement has become very popular in the U.S.A. after the Second World War.
The owner of the asset can realize money by selling the asset and can also continue to use it in his own business.
The selling price is usually the fair market price. As such contracts were made at market price, the lessor used to
get high depreciation charges. So in India, in the budget presented to the Parliament on 22nd July, 1996, the
Finance Minister provided that the depreciation on such asset will be allowed only on depreciated value of such
an asset to the original owner, whatever may be its market value.
In most of lease back agreements the lessee is required to pay all maintenance expenses, property taxes, and
insurance and lease payments. In some cases, the lease arrangement allows the lessee to repurchase the Property
on termination of the lease.
IJLRET
International Journal of Latest Research in Engineering and Technology (IJLRET)
ISSN: 2454-5031
www.ijlret.com || Volume 02 - Issue 06 || June 2016 || PP. 89-108
www.ijlret.com 95 | Page
This type of lease is beneficial to both the parties. The lessee gets back the price of the asset by selling it-and so
his liquidity increases. The lessor gets the benefit of higher depreciation charges. Such arrangement is
particularly useful to companies facing shortage of liquidity.
(iv) Leveraged Leasing: This type of lease arrangement has become popular during last few years. It is
generally a popular method of financing expensive asset. It is generally used when the asset to be leased is a
very costly one and the lessor is not able to provide complete finance. He generally provides 25 per cent of the
cost of the asset, while the remaining amount is provided by the financier, who may be a bank or a financial
institution, mainly as a loan. Thus three parties are involved (a) the Lessor (b) the Lessee and (c) The Financier.
The position of the lessee is the same as in any other type of lease. He continues to make payment of rent during
the period of the lease and continues with the right to use the asset. But the position of a lessor is different. He
does not provide 100% finance. Generally 25% of the finance is provided by him and the remaining 75% is
provided by the financier to whom the asset remains mortgaged. Retail stores, office buildings, multi-purpose
industrial building and even complete shopping centers are frequently financed with this method.
(v) Service Lease: Under this arrangement the lessor provides not only the finance but also undertakes servicing
of the asset during the lease period. Computers copiers, trucks and other capital assets requiring maintenance are
general leased under contracts that provide maintenance or servicing of the asset during the lease period.
In case of service lease (a) the maintenance cost is included in lease rent. As the lessor is responsible for all
routine servicing and repairs; the lessee gets protection against any major breakdown. (b) In such leases, the
lease period is no sufficiently long to recover fully the original cost of the asset. This means that the lease period
is less than the service, life of the asset. (c) In most cases, the service lease can be cancelled | by the lessee by
giving notice of a fixed period. But provision is made, for penalty, if the lease is cancelled before its term.
(vi) Direct Leasing: In case of direct leasing, the lessee may lease directly from a manufacture. This is often
done in case of computers and office equipments. The asset may be purchased by a third party, who leases it to
the user, such lessors are finance companies, commercial banks, specialized leasing companies and also
individuals. Thus in the second case the lease is acquired through the third party. In certain cases, the lessor get
the benefit of large scale buying from manufacturer and this benefit is passed on to the lessee in the form of low
lease rent.
In addition to the above types of leasing there are certain other types as described below:
(vii) International or Cross-border Leasing: When a lease agreement is made between citizens of two
different countries, it is called International Leasing or Cross-border Leasing. The lessor and the lessee are from
different countries. There are very few such lease contracts, because they involve complex problems of law and
taxation. The U.S.A., Britain, countries of West Europe, Japan etc. started such leasing arrangements.
Particularly the costly war equipments like sub-marines etc. are obtained on such lease, e.g. India obtained three
atomic sub-marines from Russia on lease.
(viii) Medical Equipment Leasing: In fact, this is not a kind of lease, but is a method of giving very costly
medical equipments on lease. Some of the latest machines Millions of Taka, which an individual doctor or a
charitable hospital may not afford. Hence, special leasing companies have come into existence to lease such
costly machines and equipments.
(ix) Sales-Aid Leasing: When a manufacturer himself starts a Leasing Company and leases products
manufactured by him to customers, then it is sales-aid leasing. The leasing company aids the manufacturer in
selling. Of course, here again this is not a kind of lease, but is an arrangement by which products are leased by
the manufacturer.
From the above discussion, it becomes clear that there are mainly two types of leases vis. Financial Lease and
Operating Lease. Some authors describe direct leasing, sale and lease back as well as leveraged lease as a part of
Financial Lease.
3.5 Lease Finance Industry of Bangladesh
LeaseFinance Companies are termed as Non-Bank Financial Institutions (NBFIs). Non-Bank Financial
Institutions play a significant role in meeting the diverse financial needs of various sectors of an economy and
thus contribute to the economic development of the country as well as to the deepening of the country‘s
financial system. According to Goldsmith (1969), financial development in a country starts with the
development of banking institutions. As the development process proceeds, NBFIs become prominent alongside

IJLRET
International Journal of Latest Research in Engineering and Technology (IJLRET)
ISSN: 2454-5031
www.ijlret.com || Volume 02 - Issue 06 || June 2016 || PP. 89-108
www.ijlret.com 96 | Page
the banking sector. Both can play significant roles in influencing and mobilizing savings for investment. Their
involvement in the process generallymakes them competitors as they try to cater to the same needs. However,
they are also complementary to each other as each can develop its own niche, and thus may venture into an area
where the other may not, which ultimately strengthens the financial mobility of both. In relatively advanced
economies there are different types of non-bank financial institutions namely insurance companies, finance
companies, investment banks and those dealing with pension and mutual funds, though financial innovation is
blurring the distinction between different institutions. In some countries financial institutions have adopted both
banking and non-banking financial service packages to meet the changing requirements of the customers. In the
Bangladesh context, NBFIs are those institutions that are licensed and controlled by the Financial Institutions
Act of 1993 (FIA ‘93).
NBFIs give loans and advances for industry, commerce, agriculture, housing and real estate, carry
onunderwriting or acquisition business or the investment and re-investment in shares, stocks, bonds,debentures
or debenture stock or securities issued by the government or any local authority; carry onthe business of hire
purchase transactions including leasing of machinery or equipment, and use theircapital to invest in
companies.The importance of NBFIs can be emphasized from the structure of the financial system. In
thefinancial system of Bangladesh, commercial banks have emerged in a dominant role in mobilizingfunds and
using these resources for investment. Due to their structural limitations and rigidity ofdifferent regulations,
banks could not expand their operations in all expected areas and were confined
to a relatively limited sphere of financial services.
4. Analysis&Findings 4.1 Business Process of SampleFIRMs
Business means conversion of some of the resources in to some other things. Business is producing something
of value to someone using something usually with less cost. The input enters in the business system of the FIRM
and output is the result that comes out of the FIRM. The owner of the FIRM pays money to collect resources as
input. The money receives by selling the output to its ultimate customer is the revenue. More the difference in
these two components more the FIRM will face profit, and competitive gain and overall earning.
Before entering the analysis, it will be convenient to place here the input output list of the sample business units.
Table 4-1: Input and Output of samples
Seri
al Category General Input General Output
1 Brick field Labor, mud, truck, excavator Brick
2 Rice Mill Labor, raw paddy, machine, electricity Rice
3 Biscuit factory Wheat, nutrient elements, vehicle Biscuit
4 Fish FIRM
Hatchery Child fish, ponds, fertilizer, technology Fish
5 Cottage Transported goods and people Handicrafts
6 Machine works Skilled mechanist, tools, electricity, damaged
vehicle Machinery servicing
7 Transport Truck, bus, minibus, Load of goods Transportation
8 Cold storage Cooling machine, labor, big space, secured
maintenance Waste prone crops storage in tons
9 Hospital Medical equipment, lab technician, doctor,
nurse, medicine,
Patient care, diagnosing health
problem
10 Construction Skilled builder, worker, construction vehicle Buildings and establishments

IJLRET
International Journal of Latest Research in Engineering and Technology (IJLRET)
ISSN: 2454-5031
www.ijlret.com || Volume 02 - Issue 06 || June 2016 || PP. 89-108
www.ijlret.com 97 | Page
11 Foundry Plastic, metal chemicals, equipment, skill,
technology
PVC Pipe, tube well , iron metal
engine part
12 Printing Printing machine, papers, colors, Print of posters, banners, adds,
Table 4-1 illustrates the business process of various categories where studied FIRMs fall in. the input describe
the list of resources. The input and output related questions in the research were aimed to understand the
business process of the organization. Sound understanding of the business of the organization was seemed a key
factor to explore deep inside of the organization.
4.2 Survey Summary of the Sample FIRMs
The research on survey stage got visit on sixteen sample units. Those business ventures are established in
Jessore Khulna and Satkhira Districts. The raw data found against the questionnaire is tabulated in simple table
as below. One advance sorting has been conducted over the raw data. The serial has been produced here as the
size of the lease finance.
Table 4.2: Measures of Component for Each small FIRMs
Sample L A Pd0 Pd Δ Pd Pf0 Pf Δ Pf J0 J Δ J
FIRM 01 3 2 2.4 0.4 18 20 2 14 18 4
FIRM 02 4 1.8 2.1 0.3 18 21 3 17 21 4
FIRM 03 6 1.8 2.5 0.7 17 19 2 45 60 15
FIRM 04 6 1.7 2.2 0.5 15 17 2 35 45 10
FIRM 05 6 1.6 1.9 0.3 18 20 2 18 25 7
FIRM 06 7 1.8 2.2 0.4 14 16 2 20 26 6
FIRM 07 9 1.75 2.2 0.45 16 18 2 35 45 10
FIRM 08 10 2.1 2.5 0.4 14 16 2 20 26 6
FIRM 09 10 1.75 2.1 0.35 16 18 2 30 40 10
FIRM 10 12 2.4 2.6 0.2 15 17 2 50 70 20
FIRM 11 16 2.1 2.5 0.4 18 21 3 75 100 25
FIRM 12 18 1.8 2.4 0.6 16 19 3 17 25 8
FIRM 13 20 2 2.4 0.4 16 19 3 150 170 20
FIRM 14 22 1.7 2.2 0.5 15 18 3 145 166 21
FIRM 15 22 2 2.3 0.3 15 18 3 24 36 12
FIRM 16 23 1.8 2.2 0.4 16 20 4 140 165 25
Notes: the sixteen FIRMs are presented here as their lease size. The loan amounts started from 3 lacs and end
with 23 lacs.
LA: Lease Amount
Pd0: Productivity before the leased material started functioning
Pd : Productivity after the leased material started functioning
ΔPd: Change of productivity
Pf0 : Profitability before the leased material started functioning
Pf : Profitability before the leased material started functioning
Δ Pf: Change of profitability
J0 : Productivity before the leased material started functioning
J :Productivity before the leased material started functioning
Δ J : Change in Job in the FIRM
4.3 Concepts to advance the Analysis
The research objective was to show the impact of lease finance on productivity, profitability and employment of
small manufacturing sectors and to infer about the population from the studied sample.So Exploring the findings

IJLRET
International Journal of Latest Research in Engineering and Technology (IJLRET)
ISSN: 2454-5031
www.ijlret.com || Volume 02 - Issue 06 || June 2016 || PP. 89-108
www.ijlret.com 98 | Page
will be conducted on the three different segments- productivity, profitability and employment. Statistics that will
be performed on all there concepts are summarized below to start main operations of the analysis part.
Productivity
Productivity is a measure of output from a production process, per unit of input. For example, labor productivity
is typically measured as a ratio of output per labor-hour, an input. Productivity may be conceived of as a metric
of the technical or engineering efficiency of production. As such, the emphasis is on quantitative metrics of
input, and sometimes output. Productivity is distinct from metrics of allocative efficiency, which take into
account both the monetary value (price) of what is produced and the cost of inputs used, and also distinct from
metrics of profitability, which address the difference between the revenues obtained from output and the
expense associated with consumption of inputs. The research addressed 100 TK input could produce output of
200 TK. So output – input ration was 200/100 that equals 2. After the lease the ratio if were changed what was
the new one.
Profitability
Profitability address the difference between the revenues obtained from output and the expense associated with
consumption of inputs. This research uses the term ‗profitability‘ to mean the scope of getting profit by the
FIRMs. For convenience of response the question asked was ‗suppose each 100 TK input produced amount of
output that you could sell at certain TK and could make a profit of 20 TK after deducting all costs. If other costs
like tax and such remained same was the profit changed after did the leased machinery were adopted in the
business process. The response of the FIRM owner could have been negative or positive.
Job creation
Employee: In a FIRM people who works regularly. Who ever take a pay in the FIRM. Sometime it seems
ambiguous to count the part time employee and regular employee. The employee number presented here refers
the number of employees that can complete the tasks considering each worker time is full work day.
Loan Amount: the amount of money the business unit used to acquire the lease instrument or machine, vehicle
or whatever. ULC‗s amount were 60- 80 percent of that amount. Because the portion of self finance also had an
opportunity cost, the Acquisition installment and starting cost is referred as the loan amount.
Employee before loan: the number of employees before the leased financed tools reached to the business.
Employee after Loan: employment of the FIRM after at least one complete business cycle for any sort of
seasonal or special demand instrument. Employee average for the entire business cycle excluded from any other
distant cause for raising employee number like merging with another small supplier or producer.
Test Preconditions
In the hypothesis testing, all the tests are conducted at 95% significance level and are two-tailed tests. As the
samples are less than 30 and the observations of two categories come from a single set of respondents a paired
sample t test will be deployed to measure the difference between performances of the FIRMs in all three
categories before the loan and after the loan.
4. 4 Analysis of Hypothesis test on Productivity
Table 4-3: SPSS Output on Hypothesis test Productivity change
Paired Samples Statistics
Mean N Std. Deviation
Std. Error
Mean
Pair 1 Productivity before
lease 1.8813 16 .20320 .05080
Productivity after
lease 2.2938 16 .18786 .04697

IJLRET
International Journal of Latest Research in Engineering and Technology (IJLRET)
ISSN: 2454-5031
www.ijlret.com || Volume 02 - Issue 06 || June 2016 || PP. 89-108
www.ijlret.com 99 | Page
Paired Samples Correlations
N Correlation Sig.
Pair 1 Productivity before lease
& Productivity after
lease
16 .809 .000
Paired Samples Test
Paired Differences
t df
Sig. (2-
tailed) Mean
Std.
Deviation
Std.
Error
Mean
95% Confidence
Interval of the
Difference
Lower Upper
Pair 1 Productivity
before lease
-
Productivity
after lease
-.4125 .12179 .03045 -.4774 -.3476 -13.548 15 .000
At degrees of freedom, (32-2)/2, 15, 95% Confidence Interval gives us a table value of two tail t=2.1313. Our
computed t= 13.548. So computed value is greater than table value. The null hypothesis is rejected. So the
alternative hypothesis is accepted.So statistics says lease improves Productivity in manufacturing FIRMs in
Jessore region.
Mean of the after values 2.2938 is larger than the before value 1.8813 by .4124 with a Std. Deviation of
0.12179. So output table describes a certain change that occurred in productivities of the studied FIRMs.
Std. Error Mean
Standard Error of the mean or proportion refers the deviation in sampling distribution of the mean or the
proportion (Malhotra, 2009)
𝑆𝑡𝑑.𝐸𝑟𝑟𝑜𝑟 𝑀𝑒𝑎𝑛 = 𝑆𝑡𝑎𝑛𝑑𝑎𝑟𝑑 𝐷𝑒𝑣𝑖𝑎𝑡𝑖𝑜𝑛 𝑜𝑓 𝑡ℎ𝑒𝑚𝑒𝑎𝑛
𝑆𝑞𝑢𝑎𝑟𝑒 𝑟𝑜𝑜𝑡 𝑜𝑓 𝑠𝑎𝑚𝑝𝑙𝑒
Thus std error mean = .12179
4= .03045
Figure 4-1: Productivity rise% across FIRMs with lager lease
0
10
20
30
40
50
60
Far
m 0
1
Far
m 0
2
Far
m 0
3
Far
m 0
4
Far
m 0
5
Far
m 0
6
Far
m 0
7
Far
m 0
8
Far
m 0
9
Far
m 1
0
Far
m 1
1
Far
m 1
2
Far
m 1
3
Far
m 1
4
Far
m 1
5
Far
m 1
6
Pro
du
tili
ty R
ise%
Productivity Movement Accross Farms
Δ Pd%
L A lacs TK

IJLRET
International Journal of Latest Research in Engineering and Technology (IJLRET)
ISSN: 2454-5031
www.ijlret.com || Volume 02 - Issue 06 || June 2016 || PP. 89-108
www.ijlret.com 100 | Page
4.5 Regression Analysis Productivity
Table 4-4: SPSS Output on Hypothesis test Productivity change
Descriptive Statistics
Mean Std. Deviation N
Productivity rise % 22.3688 7.48079 16
Lease Amount Lac TK 12.1250 6.98451 16
Correlations
Productivity rise %
Lease Amount
Lac TK
Pearson Correlation Productivity rise % 1.000 -.029
Lease Amount Lac TK -.029 1.000
Sig. (1-tailed) Productivity rise % . .457
Lease Amount Lac TK .457 .
N Productivity rise % 16 16
Lease Amount Lac TK 16 16
Variables Entered/Removed(b)
Model Variables Entered Variables Removed Method
1
Lease Amount Lac TK(a) . Enter
a All requested variables entered.
b Dependent Variable: Productivity rise %
Model Summary
Model R
R
Square
Adjusted
R Square
Std. Error
of the
Estimate
Change Statistics
R
Square
Change
F
Change df1 df2
Sig. F
Change
1 .029(a) .001 -.071 7.74001 .001 .012 1 14 .914
a Predictors: (Constant), Lease Amount Lac TK
ANOVA(b)
Model
Sum of
Squares df Mean Square F Sig.
1 Regression .725 1 .725 .012 .914(a)
Residual 838.709 14 59.908
Total 839.434 15
a Predictors: (Constant), Lease Amount Lac TK
b Dependent Variable: Productivity rise %
Coefficients (a)
Model
Unstandardized
Coefficients
Standardized
Coefficients
t Sig.
95% Confidence
Interval for B Correlations
B
Std.
Error Beta
Lower
Bound
Upper
Bound
Zero-
order Partial Part

IJLRET
International Journal of Latest Research in Engineering and Technology (IJLRET)
ISSN: 2454-5031
www.ijlret.com || Volume 02 - Issue 06 || June 2016 || PP. 89-108
www.ijlret.com 101 | Page
1 (Constant) 22.750 3.972 5.727 .000 14.230 31.271
Lease
Amount
Lac TK
-.031 .286 -.029 -.110 .914 -.645 .582 -.029 -.029 -
.029
a Dependent Variable: Productivity rise %
𝑦 = 22.75- 0.031X
This equation describes a relationship in productivity and Lease Amount
Figure 4-2: Regression curve of productivity rise
4.6 Analysis on Hypothesis Test for Profitability
Table 4-5: SPSS Output on Hypothesis test Profitability change
Paired Samples Statistics
Mean N Std. Deviation
Std. Error
Mean
Pair 1 Profitability befor
lease 16.0625 16 1.38894 .34724
Profitability after
lease 18.5625 16 1.59034 .39758
Paired Samples Correlations
N Correlation Sig.
Pair 1 Profitability befor lease
& Profitability after
lease
16 .919 .000
Paired Samples Test
Paired Differences
t df
Sig. (2-
tailed) Mean
Std.
Deviation
Std.
Error
Mean
95% Confidence
Interval of the
Difference
19
19.5
20
20.5
21
21.5
22
22.5
23
0 20 40 60 80 100 120
pro
du
ctiv
ity
ris
e%
Lease size rise
Productivity falls slowly for the same farm
y
IJLRET
International Journal of Latest Research in Engineering and Technology (IJLRET)
ISSN: 2454-5031
www.ijlret.com || Volume 02 - Issue 06 || June 2016 || PP. 89-108
www.ijlret.com 102 | Page
Lower Upper
Pair 1 Profitability
befor lease
-
Profitability
after lease
-2.5000 .63246 .15811 -2.8370 -2.1630 -15.811 15 .000
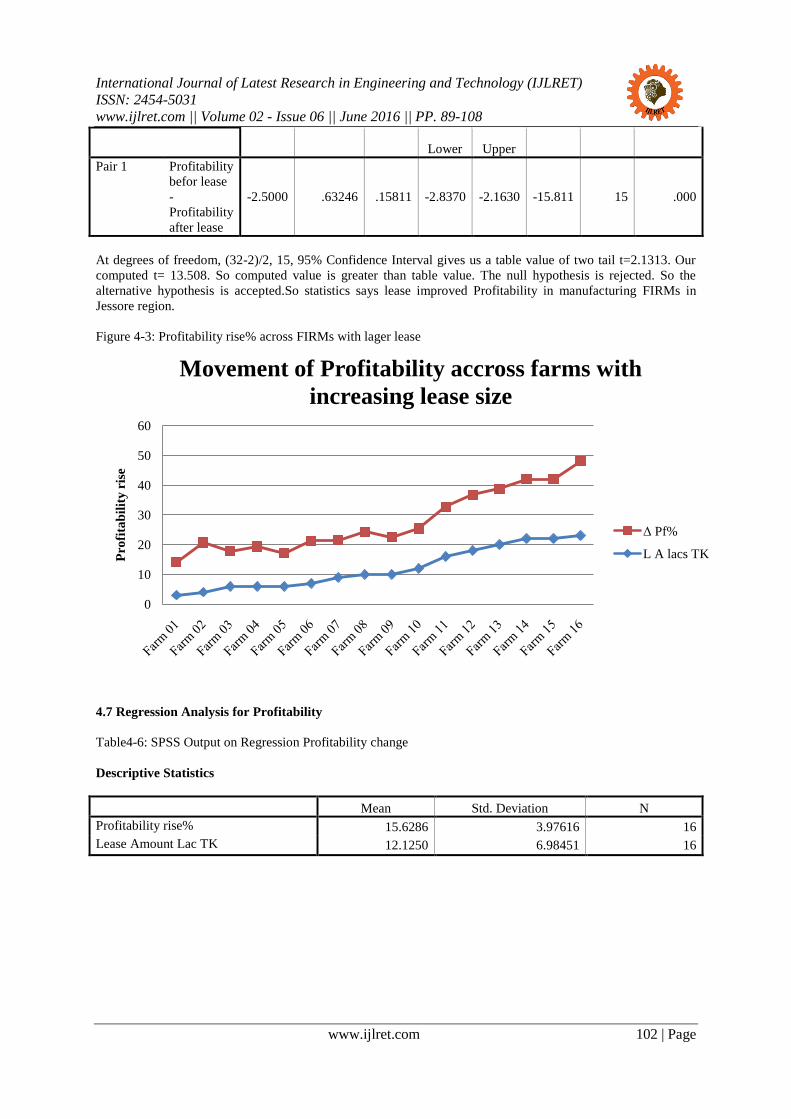
At degrees of freedom, (32-2)/2, 15, 95% Confidence Interval gives us a table value of two tail t=2.1313. Our
computed t= 13.508. So computed value is greater than table value. The null hypothesis is rejected. So the
alternative hypothesis is accepted.So statistics says lease improved Profitability in manufacturing FIRMs in
Jessore region.
Figure 4-3: Profitability rise% across FIRMs with lager lease
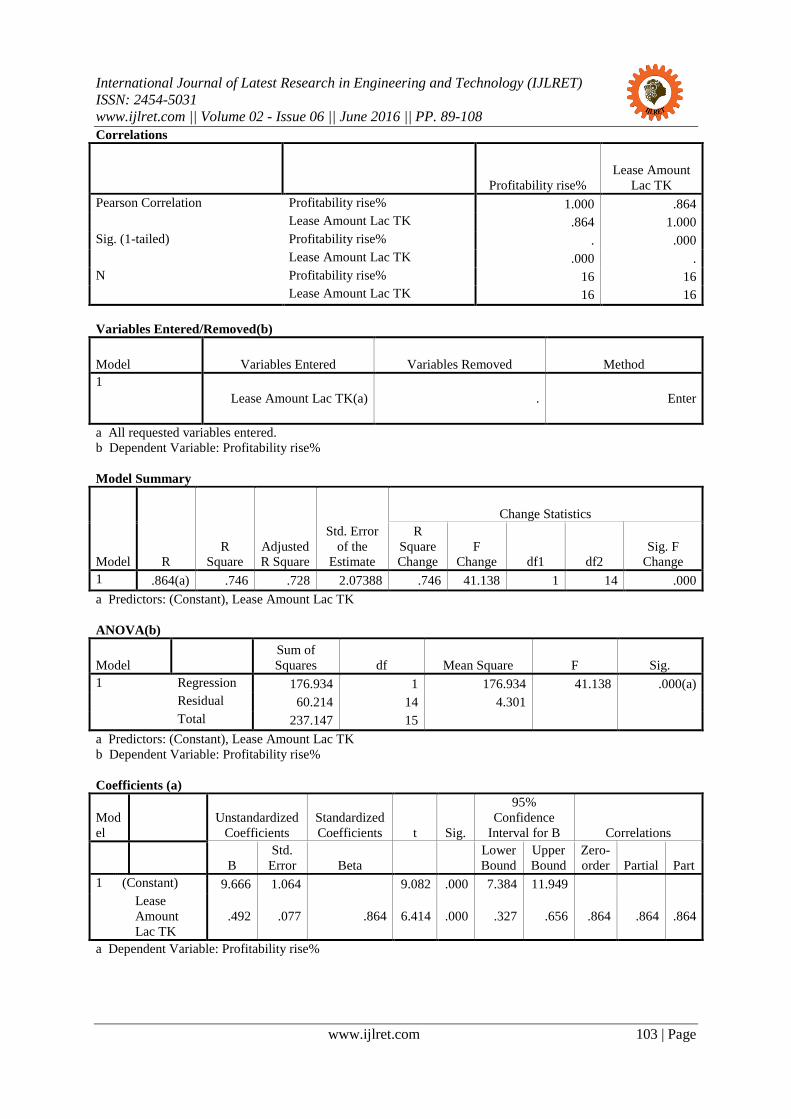
4.7 Regression Analysis for Profitability
Table4-6: SPSS Output on Regression Profitability change
Descriptive Statistics
Mean Std. Deviation N
Profitability rise% 15.6286 3.97616 16
Lease Amount Lac TK 12.1250 6.98451 16
0
10
20
30
40
50
60
Pro
fita
bil
ity
ris
e
Movement of Profitability accross farms with
increasing lease size
Δ Pf%
L A lacs TK
IJLRET
International Journal of Latest Research in Engineering and Technology (IJLRET)
ISSN: 2454-5031
www.ijlret.com || Volume 02 - Issue 06 || June 2016 || PP. 89-108
www.ijlret.com 103 | Page
Correlations
Profitability rise%
Lease Amount
Lac TK
Pearson Correlation Profitability rise% 1.000 .864
Lease Amount Lac TK .864 1.000
Sig. (1-tailed) Profitability rise% . .000
Lease Amount Lac TK .000 .
N Profitability rise% 16 16
Lease Amount Lac TK 16 16
Variables Entered/Removed(b)
Model Variables Entered Variables Removed Method
1
Lease Amount Lac TK(a) . Enter
a All requested variables entered.
b Dependent Variable: Profitability rise%
Model Summary
Model R
R
Square
Adjusted
R Square
Std. Error
of the
Estimate
Change Statistics
R
Square
Change
F
Change df1 df2
Sig. F
Change
1 .864(a) .746 .728 2.07388 .746 41.138 1 14 .000
a Predictors: (Constant), Lease Amount Lac TK
ANOVA(b)
Model
Sum of
Squares df Mean Square F Sig.
1 Regression 176.934 1 176.934 41.138 .000(a)
Residual 60.214 14 4.301
Total 237.147 15
a Predictors: (Constant), Lease Amount Lac TK
b Dependent Variable: Profitability rise%
Coefficients (a)
Mod
el
Unstandardized
Coefficients
Standardized
Coefficients t Sig.
95%
Confidence
Interval for B Correlations
B
Std.
Error Beta
Lower
Bound
Upper
Bound
Zero-
order Partial Part
1 (Constant) 9.666 1.064 9.082 .000 7.384 11.949
Lease
Amount
Lac TK
.492 .077 .864 6.414 .000 .327 .656 .864 .864 .864
a Dependent Variable: Profitability rise%

IJLRET
International Journal of Latest Research in Engineering and Technology (IJLRET)
ISSN: 2454-5031
www.ijlret.com || Volume 02 - Issue 06 || June 2016 || PP. 89-108
www.ijlret.com 104 | Page
Regression Line
𝑦 = 9.666 + 00.492X
Figure 4-4: Regression Curve for profitability rise with lease size
4.8 Analysis on Hypothesis Test for Job Creation by lease Finance
4.9
Table 4-7: SPSS Output on Hypothesis test Productivity change
Descriptive Statistics
N Minimum Maximum Mean Std. Deviation
Lease Amount 16 3.00 23.00 12.1250 6.98451
New Job Creation 16 4.00 25.00 13.1250 7.37451
Job rise par lac TK 16 .66 9.52 3.8239 2.62010
Valid N (list wise) 16
Paired Samples Statistics
Mean N Std. Deviation
Std. Error
Mean
Pair 1 Job before Loan 51.8750 16 48.72901 12.18225
Job after loan 64.8750 16 54.86575 13.71644
Paired Samples Correlations
N Correlation Sig.
Pair 1 Job before Loan &
Job after loan 16 .996 .000
Paired Samples Test
Paired Differences
t df
Sig. (2-
tailed) Mean
Std.
Deviation
Std.
Error
Mean
95% Confidence
Interval of the
Difference
Lower Upper
0
20
40
60
80
100
120
0 5 10 15 20 25 30 35 40 45 50 55 60 65 70 75 80 85 90 95 100
Pro
fita
blit
y o
f a
farm
Lease size
Lease size and profitability for a single farm
x
y

IJLRET
International Journal of Latest Research in Engineering and Technology (IJLRET)
ISSN: 2454-5031
www.ijlret.com || Volume 02 - Issue 06 || June 2016 || PP. 89-108
www.ijlret.com 105 | Page
Pair 1 Job
before
Loan -
Job after
loan
-13.0000 7.51887 1.87972 -17.0065 -8.9935 -6.916 15 .000
The SPSS Out put describes the reported job increase in FIRMs. Before-after paired sample t test gives
following SPSS Output.At degrees of freedom, (32-2)/2, 15, 95% Confidence Interval gives us a table value of
two tail t=2.1313. Our computed t= 6.916. So computed value is greater than table value. The null hypothesis is
rejected. So the alternative hypothesis is accepted.So statistics says lease improved job creation in
manufacturing FIRMs in Jessore region.
Figure 4-5: Employment rise% across FIRMs with lager lease
4.9 Regression Analysis for New Job creation by rise in Lease size
Table4-8: SPSS Output on Regression Analysis for New Job creation
Descriptive Statistics
Mean Std. Deviation N
New Job Creation 13.2500 7.26177 16
Lease Amount Lac TK. 12.1250 6.98451 16
Correlations
New Job
Creation
Lease Amount
Lac TK.
Pearson Correlation New Job Creation 1.000 .616
Lease Amount Lac TK. .616 1.000
Sig. (1-tailed) New Job Creation . .006
Lease Amount Lac TK. .006 .
N New Job Creation 16 16
Lease Amount Lac TK. 16 16
Variables Entered/Removed(b)
Model Variables Entered Variables Removed Method
01020304050607080
Jo
b r
ise
%
Employment creation accross farms
Δ J%
L A lacs TK

IJLRET
International Journal of Latest Research in Engineering and Technology (IJLRET)
ISSN: 2454-5031
www.ijlret.com || Volume 02 - Issue 06 || June 2016 || PP. 89-108
www.ijlret.com 106 | Page
1
Lease Amount Lac TK.(a) . Enter
a All requested variables entered.
b Dependent Variable: New Job Creation
Model Summary
Model R R Square Adjusted R Square Std. Error of the Estimate
1 .616(a) .379 .335 5.92238
a Predictors: (Constant), Lease Amount Lac TK.
ANOVA(b)
Model
Sum of
Squares df Mean Square F Sig.
1 Regression 299.955 1 299.955 8.552 .011(a)
Residual 491.045 14 35.075
Total 791.000 15
a Predictors: (Constant), Lease Amount Lac TK.
b Dependent Variable: New Job Creation
Coefficients (a)
Model
Unstandardized
Coefficients
Standardized
Coefficients
t Sig.
95%
Confidence
Interval for B Correlations
B
Std.
Error Beta
Lower
Bound
Upper
Bound
Zero-
order Partial Part
1 (Constant) 5.487 3.040 1.805 .093 -1.032 12.006
Lease
Amount
Lac TK.
.640 .219 .616 2.924 .011 .171 1.110 .616 .616 .616
a Dependent Variable: New Job Creation
𝑦 = 5.487 + 00.640X
Figure 4-6: Regression Curve for Job rise with lager lease
0
50
100
150
200
0 5
10
15
20
25
30
35
40
45
50
55
60
65
70
75
80
85
90
95
10
0
Jo
b R
ise
Lease size
Job Creation rises proportionally to lease size5.487 8.687 11.887 15.087
18.287 21.487 24.687 27.887
31.087 34.287 37.487 40.687
43.887 47.087 50.287 53.487
56.687 59.887 63.087 66.287
69.487
x

IJLRET
International Journal of Latest Research in Engineering and Technology (IJLRET)
ISSN: 2454-5031
www.ijlret.com || Volume 02 - Issue 06 || June 2016 || PP. 89-108
www.ijlret.com 107 | Page
Figure 4-7: Percentage Change of all three dependent and one Independent Variable
For entire sample the percentage changes are given on a single graph. It shows that changes follow each other.
5. Conclusion Lease Finance helps small FIRMs acquiring necessary equipment or establishing important sites. The FIRMs
under study took lease finance from ULC for purchasing equipment, machinery, vehicle or plant. Studied
manufacturing FIRMs were under any of twelve categories. They purchased vehicle for supply, delivery or both,
machineries for plant expansion, or stock raw materials to ensure fast supply in production process.
Around 69% respondent claimed their production goes other where for further business. The report revealed that
among 65% responded measured impact of their latest lease agreement on around 2000 families for being the
retailer, dealer or agent for outputs of those FIRMs. More than 200 jobs were created in those manufacturing
unit with a mean of 13.25 jobs per FIRM with a standard deviation of 7. 262.
In case of productivity measurement on average FIRMs responded 22% productivity rise with a standard
deviation of 7.5%. It is notable that the big deviation relates probably to the unique context of the FIRMs. Most
of the FIRMs were representing one unique sample of its own business chain.
About 13% profitability rise was observed on the later years of the lease agreement with a standard deviation of
3.2%. None of the organizations recognized negative growth. Some of the FIRMs had small change around 13%
while some reported big as much as 57%. Individual organizations‘ economic growth by productivity and
profitability provided them with competitive edge and also larger scope for profit making.
Financing helped those small enterprises adopt technology and innovation.It also impact on social wellbeing. In
sixteen FIRMs more than two hundred new jobs were created. It is assumable that equal numbers of families are
directly benefitted. Again in distribution process other two thousand more families are getting income by time or
place value of the production output by the sixteen enterprises. This change in employment will thus affect
poverty reduction in root level.
One further consideration the research availed was social impact of lease on peoples living and raising economic
strength. The leases are employing peoplewho had no job earlier. Around 2000 families were benefitted by
enhanced production or output in the manufacturing FIRMs those raise their income and buying capacity.
We can also assume that this sort of financing to small FIRMs will certainly enhance economic activity in rural
Bangladesh.How much of those rises are creditable to the lease arrangement may be discovered through further
advanced researches.
REFERENCES [1]. Baldwin, J. and Picot, G. (1994), ―Employment Generation by Small Producers in Canadian
Manufacturing Sector‖, Journal for Small Business Economics‖
[2]. Feeney, L. and Riding, A. (1997). ―Business Owners‘ Fundamental Tradeoff, Finance and the Vicious
Circle of Growth and Control‖. Canadian Business Owners, November issue.
[3]. Lanjouw, J.O. and Lanjouw, P. (2001), The rural non-FIRM sector: issues and evidence from developing
countries. Agricultural Economics, Vol. 26, pp. 1-23.
[4]. ―Lease Finance‖- Comptrollers‘ Hand Book, explored at http://www.comptrollershandbook.comon 12th
February 2011
020406080
100120140
Va
lues
of
dif
feren
t v
ari
ab
les
Joint view of movemt of all three Independent
variables accross farms
Δ J%
Δ Pf%
Δ Pd%
L A lacs TK
IJLRET
International Journal of Latest Research in Engineering and Technology (IJLRET)
ISSN: 2454-5031
www.ijlret.com || Volume 02 - Issue 06 || June 2016 || PP. 89-108
www.ijlret.com 108 | Page
[5]. Mahesh S., (2010) ―SME Drives the Largest Job Creation in India‖: ASSOCHAM, 13th
July 2010
[6]. Shamsul, A. M., and Anwar, U. M., (2004) ―59 SMEs in Bangladesh and Their Financing: An Analysis
and Some Recommendations‖, the Cost and Management, May–June, 2004
[7]. Mehnaz, R. and Munshi, S. (2005) ―Financing SMEs and its Effect on Employment Generation: A Study
of BRAC Bank‘s SME Lending‖, Research and Evaluation Division explored at www.bracresearch.org
on 18th
February 2011.
[8]. Monzur, H. and Shahid, U. (2002), ―Development of Non Bank Financial Institutions to Strengthen the
Financial System of Bangladesh‖
[9]. Mukole, K. (2010) ―Job creation versus job shedding and the role of SMEs in economic development‖.
[10]. Malhotra, N. K. (2008), Marketing Research, 5th
ed. prentice hall, India, pp- 464,465,478, 483
[11]. Kothari C. R. (2010), Research Methodology, Methods & Techniques, 2nd
ed, New Age International
Publications, pp-41.
[12]. Neumark D, Wall B, Zhang J (2008). Just the Fact. Small businesses and job creation: Do small
businesses create jobs? Public Policy Institute of California (PPCI). http://www.ppic.org explored on 17th
February 2011.
[13]. OECD: Financing SMEs and Entrepreneurs, Policy Brief (Paris, Nov. 2006) explored on 18th
February on
website: http://www.oecd.org/dataoecd/53/27/37704120.pdf


![Deposit taking NBFIs Business Rules Revised · 6 B. [Institutions in Money Market Intermediation and Securities Trading] viii. Discount Houses are companies that intermediate between](https://img.pdfslide.us/doc/110x75/5b500cd17f8b9a166e8da6d5/deposit-taking-nbfis-business-rules-6-b-institutions-in-money-market-intermediation.jpg)