Embed Size (px)
Citation preview
International Journal of Scientific and Research Publications, Volume 9, Issue 1, January 2019 498
ISSN 2250-3153
http://dx.doi.org/10.29322/IJSRP.9.01.2019.p8562 www.ijsrp.org
Impact of Land Use Changes on Wildlife Population in
The Kimbi-Fungom National Park, North West Region,
Cameroon.
Amos Fang Zeh,1 Nkwatoh Athanasius Fuashi
1, Melle Ekane Maurice
1
1 Department of Environmental science, University of Buea
DOI: 10.29322/IJSRP.9.01.2019.p8562
http://dx.doi.org/10.29322/IJSRP.9.01.2019.p8562
Abstract. Land use and land cover change is one of the major threats facing wildlife in the tropics today. This is mainly as a result of
human search for earth materials for sustenance, due to increasing human population. This study set out to evaluate the effect of land
use/land cover change on the population of wildlife in the Kimbi Fungom National Park with the main objective to assess the trend of
wildlife population change in the face of growing anthropogenic activities in this newly created national park of Cameroon. This study
employed both the use of satellite images, Biological and socioeconomic techniques. The land use/cover situations were examined for
three time periods for the past 30 years (1987 -2017) and the periods chosen were 1987, 2007 and 2017. We acquired images from
USGS using https://glovis.usgs.gov website. We downloaded 30m resolution landsat and 30m digital elevation model (DEM). They
included multispectral optical and radar-derived (SRTM DEMs) satellite data. Digital image-processing software ENVI 5.5 and GIS
software Arc GIS 10.2 were used for processing, analysis and integration of spatial data to reach the objectives of this study. The pixel
categorization
process was supervised by specifying to the computer algorithm; numerical descriptors of the various land cover types present in the
scene so as to be able to ascertain the type and spatial extent of various land use/land-cover types. In order to test the accuracy of the
classification, 42 ground truth points for each Land-use/Land cover class were randomly collected from the field using a GPS and
were entered into ArcGIS. Wildlife data were got through transect walk, concentrated searches, opportunistic encounter, the use of
questionnaires and interview. Results revealed a decrease in the forest from 49641.97ha (52.05%) in 1987 to 36198 (38%) in 2017.
This accounted for -13444 (-14.1%), giving an annual deforestation rate of 0.47%. Savanna increased from 28985.37ha (30.39%) in
1987 to 31045 (32.5%) in 2017. This gave a magnitude rate of 2060 (2.2%) giving an annual growth rate of 0.07%. Farmland and
fallow land increased from 9467.87ha (9.75%) in 1987 to 15096ha (15.8%) in 2017. This gave a magnitude change of 5628.1ha
(5.9%), with an annual rate of 0.2%. This change in land uses/land cover has affected the movement of wildlife, numbers and the
prevalence of human wildlife conflicts. It was discovered that some wildlife species have been locally extinct, such as the preuss
monkey and the moustache monkey. However, it was recommended amongst other things that involving local people in the
conservation process, maintaining the present habitats through controlled farming, grazing and illegal exploitation could help improve
wildlife in the park, thereby making the park a tourist destination.
Keywords: land use, change, deforestation, wild life population trend, human wildlife conflict.
International Journal of Scientific and Research Publications, Volume 9, Issue 1, January 2019 499
ISSN 2250-3153
http://dx.doi.org/10.29322/IJSRP.9.01.2019.p8562 www.ijsrp.org
1.0 Introduction
Land use and land cover changes represent a serious threat to ecosystem sustainability as naturally vegetated forms give way to
manmade vegetation (Robert et al. 1996, Fahrig L. 2003, Lambin, 2003, Lambin and Geist, 2007). Such conversion is known reduce
the availability of energy, water and nutrients supplies to ecosystems. On the other hand, it also facilitates the invasion of natural
system by exotic species (Kamusoko, Sutter et al, 2005, Kamusoko, 2007). The removal of native vegetation in most cases has
resulted not only in the loss of native species, but also in significant areas of original habitat, as well as its fragmentation.
Fragmentation from a general prospective is the selective removal of patches of native vegetation, leaving behind fragments of native
habitat that are not suitable to serve specific function such as nature reserves, protection for river banks or hunting areas (Saunders et
al. 1991, Laurance et al.,2002). Although habitats may be naturally patchy due to discontinuities in environmental factors (soil types,
elevation), anthropogenic fragmentation is a major concern for conservation due to its rate and extent (Laurance, 2002). Tropical
forest loss and fragmentation through increasing anthropogenic land uses have been advocated as the main causes of wild population
declines and extinction in almost all parts of the tropics (Turner 1996, Laurance et al. 2002). This is very common especially large
carnivores, large herbivores and birds (Turner and Corlett 1996, Corlett and Turner 1997). Land use conversion in any form is known
to have negatively affected species distribution and diversity gobally (Ottichilo et al,. 2001, Lambi and Takang, 2010). This negative
effects are among others increased mortality of individual moving between different patches, lower recolonisation rates of empty
patches and reduced local population sizes resulting in increased susceptibility to extinction (Fahrig, 1999, fahrig, 2003).
According to the Environment New Service report released in August 1999, “the current extinction rate is now approaching 1000
times the background rate and may climb to 10, 000 times the background rate during next century, if present trends continue a loss
that would easily equal those of past extinction”. The Millennium Ecosystem Assessment report released in March 2005 proposed that
human activities may cause an irreversible loss to biodiversity of Earth. Yoshioka et al.,(2014) proposed numerous reports that
recognized accelerated climate change impacts as threats to biodiversity like Millennium Ecosystem Assessment, 2005; Secretariat of
the Convention on Biological Diversity, 2006; United Nation Environmental Programme, 2007 and IUCN report 2011.Globally,
anthropogenic habitat loss and habitat fragmentation have been identified as among the main factors of global biodiversity problems
(Wilcox and Murphy 1985, Balmford et al. 2003).
Land use and associated changes play a key role in the distribution of wildlife population around the globe. Hassan et al. (2008)
showed that buffalo require a certain balance between the quality and quantity of forage available. In the Campo Ma’an National Park,
Bekhuis, De Jong & Prins (2008) indicated that monocotyledons associated with open areas (mainly savannah patches and logging
roads) contributed disproportionally to the diet of forest buffalo. Kingdon, (1982) noted that there is a relation between the density of
buffalo and their food and the absence of food resulting from land uses could results in the high migration of buffalos. Tchouto, (2004)
and Nkemtaji et al., (2017) in their collective studies showed that buffalos thrive well where there is forest and grassland. White
(1992) estimated a maximum density of buffalo at a single site in the Lope´ Reserve, where the vegetation was characterized by a
savanna forest mosaic and forest with a high density of monocotyledons. Primates have also been known to affected by land uses
changes where population richness is said to decrease with fragment size but in some isolated relatively small forest patches of less
than 50 km2, primate densities have been found to increase, possibly owing to the absence of main predators such as large cats and
birds of prey (González-Solís et al.,2001, Harcourt and Doherty, 2005). The persistence of primates in small fragmented forests
depends on their ability to cope with changes (Onderdonk and Chapman, 2000; Chaves et al., 2012).
International Journal of Scientific and Research Publications, Volume 9, Issue 1, January 2019 500
ISSN 2250-3153
http://dx.doi.org/10.29322/IJSRP.9.01.2019.p8562 www.ijsrp.org
Increasing land use resulting to habitat fragmentation and habitat loss is a major concern for wildlife conservation due to its rate and
extent (Laurance 2002). The most vital steps in designing effective conservation management strategies are the assessment of
population parameters such as size, density, and distribution of a species across the landscape. These are important baseline data
which can be utilized to assess conservation status and to measure success of conservation efforts over time (Krüger, 2006).
Population size and density are important for long‐term monitoring, and the distribution of individuals and their use of space are
informative in targeting key areas of protection (Deborah et al., 2013). Therefore, the management of wildlife in the Kimbi-Fungom
National park in the face of growing anthropogenic activities is important to understand the extent and consequences of increasing
land uses. It is for this reason that this study was undertaken in the Kimbi-Fungom National Park found in the Western Highland of
Cameroon with diverse vegetation types which have been identified as suitable habitats for many wildlife populations. These suitable
habitats are thought to be modified by the growing human activities in the park. These activities have shaped the wildlife population as
they are now limited to isolated habitats. This study therefore sets out to investigate how land use changes have affected the
population trend of wildlife throughout the park. This is in a bit to promote wildlife conservation as well as sustainable ecotourism in
the park.
From the above, the research generated the following questions; how has land uses changed in the Kimbi Fungom National Park?
What is the magnitude of land use/cover change in the park?, what are the causes of land use change in the park? what are the impacts
of land use change on wildlife population in the park. Based on these research questions, the following working objectives were
derived;
Objective of the study
The overall objective of this study was to evaluate the impacts of land use change on the population of wildlife in the Kimbi Fungom
National Park.
Specifically, this research set out;
To examine land use change from 1987 to 2017 in the KFNP
To evaluate the magnitude of land use change in the park
To determine the population trend of wildlife in the park
To identify the impact of land use changes on the population of wildlife
To suggest some conservation effort towards the improvement of the park.
2.0 Materials and Methods
2.1 Location of the study area
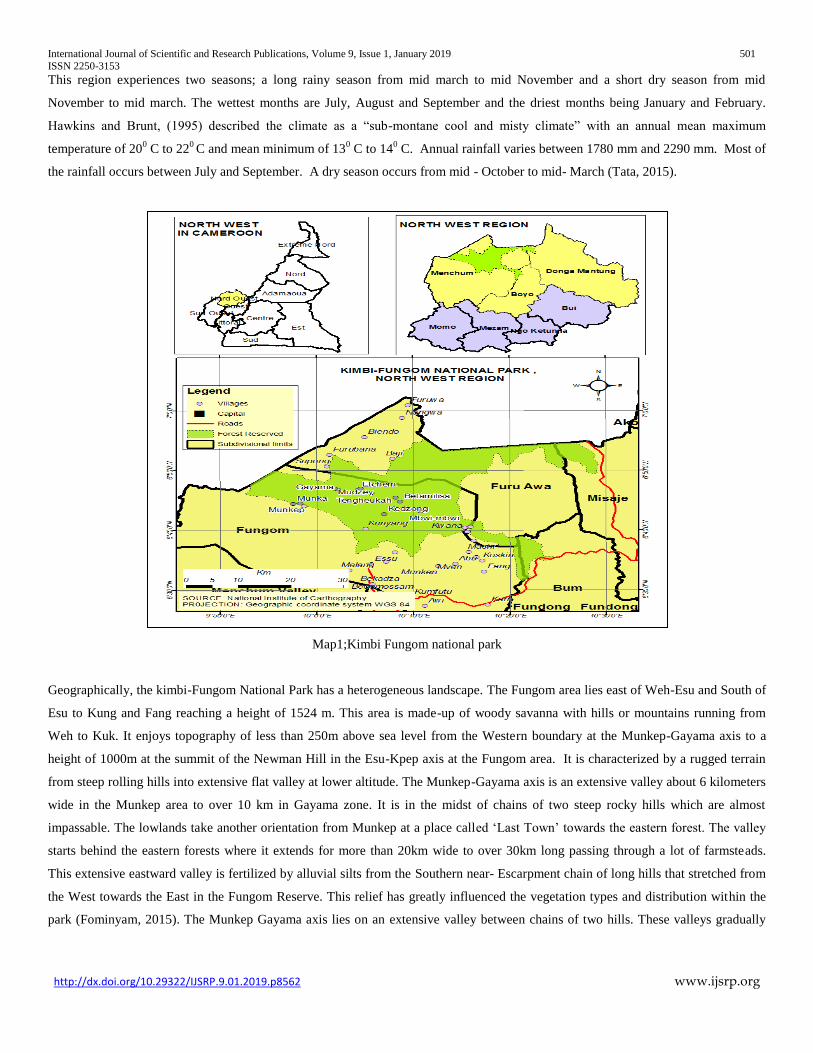
The Kimbi-Fungom national park is located between latitude 6.5-6.9° N and longitude 9.8-10.5° E in the North West Region of
Cameroon covering a total land surface of 95,380 hectares. This National Park is located in three divisions of the North West Region
of Cameroon cutting across four Sub divisions. These divisions are Menchum, Boyo and Dongo Mantung and found in the respective
sub divisions of Fungom and Fru Awa, Misaje and Bum. The Kimbi-Fungom National Park (K-FNP) is a newly created National Park
and the only national park in the region..
International Journal of Scientific and Research Publications, Volume 9, Issue 1, January 2019 501
ISSN 2250-3153
http://dx.doi.org/10.29322/IJSRP.9.01.2019.p8562 www.ijsrp.org
This region experiences two seasons; a long rainy season from mid march to mid November and a short dry season from mid
November to mid march. The wettest months are July, August and September and the driest months being January and February.
Hawkins and Brunt, (1995) described the climate as a “sub-montane cool and misty climate” with an annual mean maximum
temperature of 200 C to 22
0 C and mean minimum of 13
0 C to 14
0 C. Annual rainfall varies between 1780 mm and 2290 mm. Most of
the rainfall occurs between July and September. A dry season occurs from mid - October to mid- March (Tata, 2015).
Map1;Kimbi Fungom national park
Geographically, the kimbi-Fungom National Park has a heterogeneous landscape. The Fungom area lies east of Weh-Esu and South of
Esu to Kung and Fang reaching a height of 1524 m. This area is made-up of woody savanna with hills or mountains running from
Weh to Kuk. It enjoys topography of less than 250m above sea level from the Western boundary at the Munkep-Gayama axis to a
height of 1000m at the summit of the Newman Hill in the Esu-Kpep axis at the Fungom area. It is characterized by a rugged terrain
from steep rolling hills into extensive flat valley at lower altitude. The Munkep-Gayama axis is an extensive valley about 6 kilometers
wide in the Munkep area to over 10 km in Gayama zone. It is in the midst of chains of two steep rocky hills which are almost
impassable. The lowlands take another orientation from Munkep at a place called ‘Last Town’ towards the eastern forest. The valley
starts behind the eastern forests where it extends for more than 20km wide to over 30km long passing through a lot of farmsteads.
This extensive eastward valley is fertilized by alluvial silts from the Southern near- Escarpment chain of long hills that stretched from
the West towards the East in the Fungom Reserve. This relief has greatly influenced the vegetation types and distribution within the
park (Fominyam, 2015). The Munkep Gayama axis lies on an extensive valley between chains of two hills. These valleys gradually
International Journal of Scientific and Research Publications, Volume 9, Issue 1, January 2019 502
ISSN 2250-3153
http://dx.doi.org/10.29322/IJSRP.9.01.2019.p8562 www.ijsrp.org
protrude into near long rolling steep hills which are characterized by the woody vegetation. These hills are sandwich by gallery forests
which form the basis for the numerous tributaries in the park.
It is drained by a wide range of rivers and streams, notably the Kimbi, the Katsina Ala, and the Kendassamen rivers, along with
significant streams that include: the Batum, Akum, Bissaula, Kenda, yemene, Imia. These streams feed into the bigger ones that
eventually, through the Katsina Ala River , enter the river Benue, (Tata, 2015).
The soil types in this area include; acrisols, andosols (Black soils of volcanic landscapes), ferrasols (red and yellow tropical soils with
a high content of sequioxide), leptosol (shallow soil) and nitisols (deep, well-drained, red, tropical with a clayey subsurface), (Birdlife,
2010).
The vegetation is principally lowland tropical rainforest at the Fungom low altitude area of the park and gradually progress into
tropical deciduous forest to savanna and the grassland savanna. It has many tree species of economic values.
This park harbor many types of primates, ungulates, carnivores, a host of rodents, reptiles and amphibians. Endangered species such as
the Nigeria-Cameroon Chimpanzee (Pan troglodytes ellioti) and the pangolin (Smutsia gigantea) found in the park. Other primates
found include mona monkey (Cercopithecus mona), Putty-nosed monkey (cercopithecus nictitans) and baboons (Papio Anubis and P.
cynocephalus).
2.2 Methodology
2.2.1 Data Processing
Remotely sensed data are not free from internal and external errors such as radiometric and
geometric distortions; many of these errors are systematic and are most times corrected before
it gets to the users (Lambin (1999). However, the major pre-processing that was done on the images was enhancement. This was done
to increase the apparent distinction between the features in the scene in order to enable image classification process. Colour
composites and band rationing was the major enhancement techniques used in this work. Digital image-processing software ENVI 5.5
and GIS software Arc GIS 10.2 were used for processing, analysis and integration of spatial data to reach the objectives of this study.
Using ENVI 5.5 software, the images were rectified to a common Universal Transverse Mercator (UTM) projection/coordinate system
after which they were re-sampled to a common spatial resolution of 22m using nearest neighbour technique. After re-sampling was
done, the images were used to generate land-use/land-cover maps of the study area. In doing this, ENVI 5.5 software was used to
generate a false colour composite of each image. This was done by combing near infrared, red and green bands (i.e band 4, 3, 2) for
those images. This was done to enhance vegetation recognition, hence 44 chlorophyll in plants reflects very well in the near infrared
than the visible band (Curran, 1992). The false colour composite images were then imported into Arc GIS 10.2 for further processing
and classification.
2.2.2 Image Classification
International Journal of Scientific and Research Publications, Volume 9, Issue 1, January 2019 503
ISSN 2250-3153
http://dx.doi.org/10.29322/IJSRP.9.01.2019.p8562 www.ijsrp.org
2.2.2.1 Preliminary Image Classification
Prior to fieldwork, a preliminary image classification was carried out using unsupervised
classification where the Computer automatically categorize all the pixels in the images into
land-cover classes or themes based on their reflectance values. This means that the computer
was allowed to assign the image’s pixel to a defined number of classes based on their value in
different channels (i.e. no training areas used).
2.2.2.2 Supervised Classification
In classifying the images into various themes, the supervised approach to classification was
adopted using Arc GIS 10.2 software. The researcher supervised the pixel categorization
process by specifying to the computer algorithm; numerical descriptors of the various land cover types present in the scene so as to be
able to ascertain the type and spatial extent of various land use/land-cover types. To do this, representative sample sites of known
land-cover types, called training areas or training sites, were used to compile a numerical interpretation key that was used to describe
the spectral attributes for each feature type of interest. Each pixel in the data was then compared numerically to each category in the
interpretation key and 45 labeled with the name of the category it looks most like. This classification is a modification of Anderson,
Hardy, Roach and Witmer (1976) as shown in the table 3.1
2.2.2.3 Accuracy Assessment
In order to test the accuracy of the classification, 42 ground truth points for each Land-use/Land cover class were randomly collected
from the field using a GPS; these ground truth points were further inputted into ArcGIS environment where the Kappa tool was used
to test the accuracy of the 46classifications. The kappa coefficient according to Congalton, (1991) expresses the proportional reduction
in error generated by a classification process compared with the error of a completely random classification. A Kappa coefficient
value of 0.64 was obtained and this signifies that the classification accuracy was moderate (Anthony, Viera and Joanne, 2005).
2.2.3 Wildlife survey
The “Line transects technique as described by Burnham et al (1980), Buckland et al. (1993), Sunderland and Tchouto (1999),
Buckland et al., (2001) was employed. The line transect survey method has been widely used by several researchers on their study of
mammals, especially primates in Africa due to the nature of mammalian species and rugged terrain of most study areas in the
continent (Burnham, 1980, Arnold and Zuberbühler, 2008). A total of twenty 3 kilometers line transects were established in the park
with the aid of GPS. The transects were placed in the North-South direction and so followed the topography to avoid regular
obstruction from the step impassable rocky hills. Line transects have been the main method used to survey diurnal primates. This is
because they can be used to cover long distances relatively quickly and good methods have been developed to analyze the data
(Buckland et al., 2013). The trails were cut by an experienced hunter with minimal impact on the vegetation and swept clear of debris
to minimize noise during walks. We walked transects three times each, covering 3 kilometer transect in two hours. Along each
transect, within the range of 25m on both sides of the central line, a 100% search and recording of wildlife and was done. In large
fragments and dense woody savanna, we focused on concentrated searches once we were told about the presence of any particular
International Journal of Scientific and Research Publications, Volume 9, Issue 1, January 2019 504
ISSN 2250-3153
http://dx.doi.org/10.29322/IJSRP.9.01.2019.p8562 www.ijsrp.org
species. Once a species was encountered, a total count (Srivastava et al., 2001) was obtained. Intense searches were made in areas
where wildlife had been seen before or were noted to have been endemic. During the search and transect walk, all mammal sightings,
vocalizations, signs (dung, resting places, foot prints, carcasses, tracks and food remains) were recorded. Data recorded on transects
when species were encountered included: location (transect and meter marker), species, distance (m) from observer to primates,
perpendicular distance (m) from species to transect, height of species in the trees, activity, habitat type, number of individuals in
group, weather condition and time of day. This gave us a total of 274 km distance covered for the survey.
The study employed some socio economic techniques and Participatory Rural Appraisal tools such as focused group discussions, key
informant and historical time line. These socio-economic techniques make use of the random and the purposive sampling
methodology for the selection of villages and the respondents for interview. This was aimed to understand the inhabitant perception
about the threat posed by habitat fragment on primates in the National park and how they can be conserved in the face of growing
human occupation of the park.
A total of 20 villages are selected for the exercise, 8 of which are located in the park (Munkep, Munka, Gayama 1, Gayama 2, Etchem,
Kpep, Tenghukah and Nkang) while 12 were located some 1 to 6km from the park (Esu, Kimbi, Su-Bum, Gida-Jikum, Sabon-Gida,
Cha, Fungom, Mashi, Mundabili, Nkang, Nser, Badji and Turuwa ). The 20 villages were purposefully selected on the bases of (a) a
long history of agriculture and hunting (b) proximity of villages to the National Park and (c) the security situation of the villages. In
each of the 20 villages 35 questionnaires were distributed giving a total of 700 questionnaires. From this number, 556 were retained
giving a retention percent of 79.4%.
2.2.3 Selection of respondents
A set of questionnaire divided into three sections A, B, and C was used for the conduct of the study. Respondents to the questionnaire
were Staff of the Divisional delegations of Forestry and Wildlife, farmers, graziers, Village Chiefs, Village Traditional Council
members, hunters, None-Timber Forest Products (NTFPs) species harvesters/collectors, teachers, trappers, women, youths and other
forest users. These groups of respondents were targeted because they make life directly or indirectly from the park or protectors of the
park. Sections A and B of the questionnaire which was made up of open ended questions in conjunction with appropriate PRA tools,
gathered information on questions related to habitat use, number of farms, farm sizes, hunting activities, the trends of wildlife, time of
occupation of the park, willingness to surrender property to government, crop raiding activities, threats to wildlife and conservation
strategies. On the other hand, section C which was made up of a mixture of open ended and close questions in conjunction with
appropriate PRA tools, collected information on the potential effects of habitat fragmentation on the distribution of primates and the
most affected species, least and preferable conservable species in the park, isolation time.
Semi structured interviews and a series of focused group discussions were also conducted. Before field work proper, we identified
potential hunters and interviewed them with pictures of primates in the field. They identified the primates found or ever seen in the
park. An interview guide was produced and the types of primates were used for our interview throughout the period. Interviewees are
asked about types of primate presence, abundance, threats, crop raiding activities, and the occurrence of other primates in the area. We
also asked about the most preferable conservable primates and the least preferable conservable primates if they were made
conservators. Interviews conducted were done during the evening periods between 4 to 6 pm every day where respondents were at
home and in the morning and afternoon on market days and Sundays respectively. We used a systematic interview procedure to get
International Journal of Scientific and Research Publications, Volume 9, Issue 1, January 2019 505
ISSN 2250-3153
http://dx.doi.org/10.29322/IJSRP.9.01.2019.p8562 www.ijsrp.org
information from hunters and farmers. The Divisional delegate for forestry and wildlife in Menchum and the conservator, were also
interviewed on the status, conservation and future of prospect of primates in the park. A series of meeting were held with hunters and
farmers in farmsteads inside the park on the threats they are posting to wildlife and the best method to conserve wildlife, the last being
that held in Munkep and Gayama on June 8th
2018 chaired by the chief of Forestry for Fungom Sub Division accompanied by four
Eco guards from Kimbi.
The survey is guided by a hunter-farmer. These are people who are vest with the park. The entire field survey exercise was
constituted by a team of two knowledgeable farmers and two brave hunters, one eco guards, two field assistants, two Botanist, three
research students (master students from the University of Dschang) and 21 local people in the park. The team was trained on how to
identify and distinguish between different primate’s footprint, dung, feeding signs and nests. The Botanists duty was to identify plant
species during which was meant to aid in the description of the flora of the park. The first field assistant carried a pair of binoculars
and recording all observations in a data sheet, the second field assistant helped the team leader in searching for signs while the second
hunters helped as field guide based on their familiarity with the terrain. They were responsible for initially marking the survey track
(with machete cuts) and also acted as porter and the also as a guide. The eco-guard was responsible to legally guide the research team
and also because he was vest with the park and to scare (not kill) any animal found aggressive during the research period. The 21 local
people were either selected by the chiefs or elders to guide the team in particular farmsteads during concentrated searches of animals
and threats. Each village in the park provided 2 local guides who were used within their sphere of influence partly as demand by their
customs and partly because of fear of intrusion of different farmers into their farmlands. This was guided by a cover letter from the
paramount fon of Esu which was presented in all the farmsteads or villages in the park for security reason.
2.3 Data Analysis
To determine the Land-use/Land-cover of the area in 1987, 2007 and 2017 as well as to
determine the extent of vegetation cover in the area in 1987, 2007, and 2017 and each image
set were broadly classified into five different categories/polygons as on table 3.1. After the
classification was done, the area coverage (extent) of each land-use/land-cover type of the
four time periods was ascertained by constructing the histogram of each classified image.
To determine the land-use/land-cover change of the study area between 1987– 2017, the area
coverage (km2) of each classified land-use/land-cover type for these time period was extracted
from the images histograms prepared earlier, and the results was subsequently compared to
calculated the area (km2) and percentage change of each land-use/land-cover type.
The changes in square kilometer/hectare of a particular land-use/land-cover type were derived by
subtracting the former area coverage (km2) from the latter area coverage of that particular
land-use/land-cover type. Change in square kilometers = the latter area coverage of land-use/land-cover type of interest minus the
former area coverage of the same land-use/land-cover type (for example, the area coverage of vegetated land in 2007 minus the area
coverage of vegetated land in 1987). To get the percentage change of each land-use/land-cover type between 1987– 2017, the
observed change was divided by the base year (area coverage of the base year) multiplied by 100.
Percentage change of class = observed change (km2) X 100
International Journal of Scientific and Research Publications, Volume 9, Issue 1, January 2019 506
ISSN 2250-3153
http://dx.doi.org/10.29322/IJSRP.9.01.2019.p8562 www.ijsrp.org
Base year
To analyse the rate of vegetation change in the study area between 1987– 2017, the area, percentage and rate of vegetation change in
the study area were determined. The area coverage of vegetation in kilometres as derived from the classified image statistics was used.
The area change of vegetation was ascertained by subtracting the former area coverage of vegetation from the latter area coverage of
vegetation. The change in square kilometres (Observed change) = the area coverage of vegetation of the latter image minus the area
coverage of vegetation of the former image (i.e 1987-2017). Percentage change, was however determined by dividing observed
change by sum of changes multiplied by 100 Percentage change (trend) = Observed change X 100 Base year
In obtaining annual rate of change in vegetation, the percentage change of vegetation was
divided by the number of study year, 1987 – 2017(30yrs). Annual Rate of change = % change
No of study year. To determine the extent to which human activities have affected vegetation cover in the area, the landuse/land-cover
maps prepared from the images were used to assess changes in vegetated land and bare soil. This was done by overlaying (clipping)
the portion of the study area occupied by bare soil for each study year on the vegetated land of the base image of 1987 (Original
vegetation) so as to find out the amount of the original vegetation that was displaced by the bare soil in each study year. The resultant
map histogram was used to determine the aerial and percentage extent to which vegetated land has been displaced as a result of bare
soil.
Socio-economic data were compiled using the Microsoft Excel 2010 spread sheets and analyzed using SPSS version 20. Encounter
rate of identified of wildlife were calculated using Microsoft Excel 2010. The Encounter rate (ER) or index of Kilometric Abundance
(IKA) = Total number of objects or signs observed divided by the length (L) of transect (in kilometer).
ER= N /L
Where: N = Number of objects observed
L = Length of transect (Km)
results were presented in tables, charts and graphs
3 Results
3.1 Land use change 1987
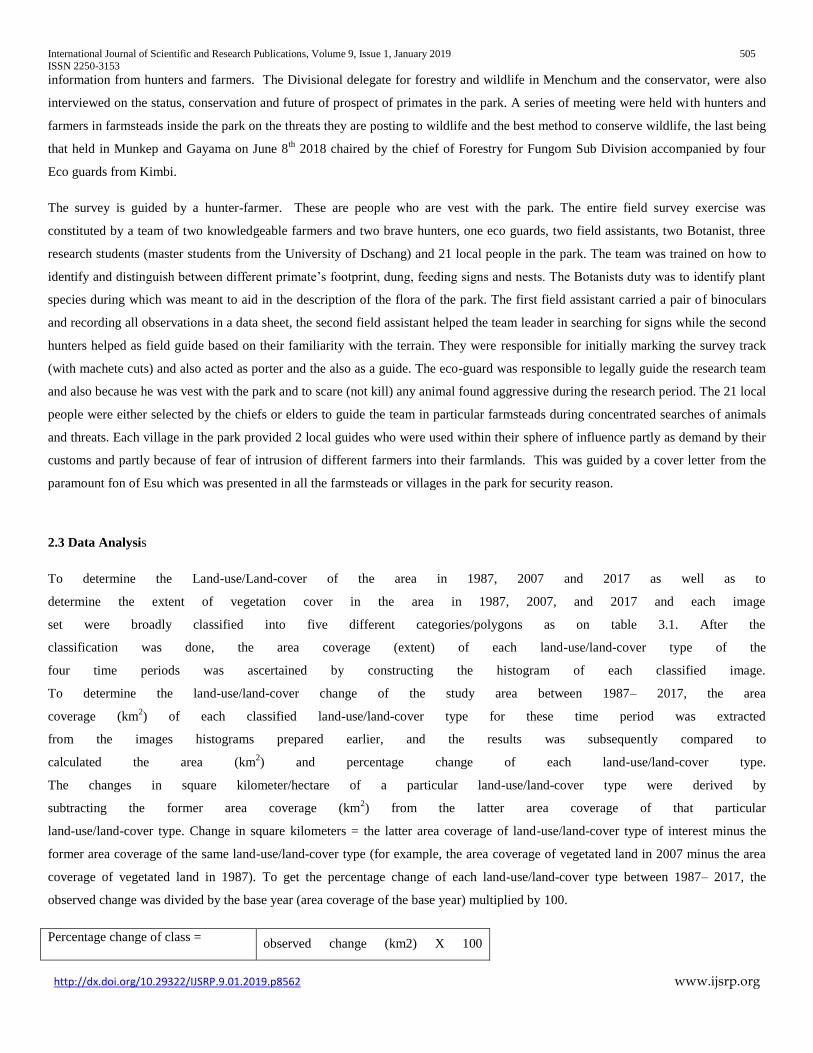
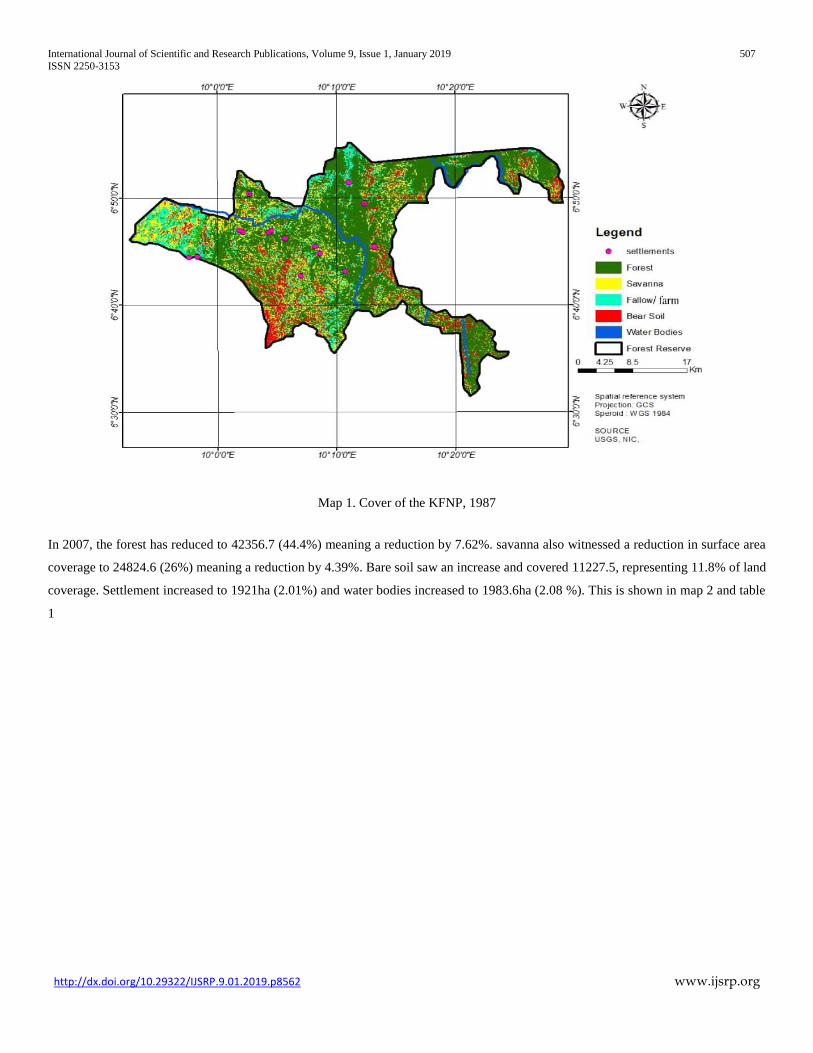
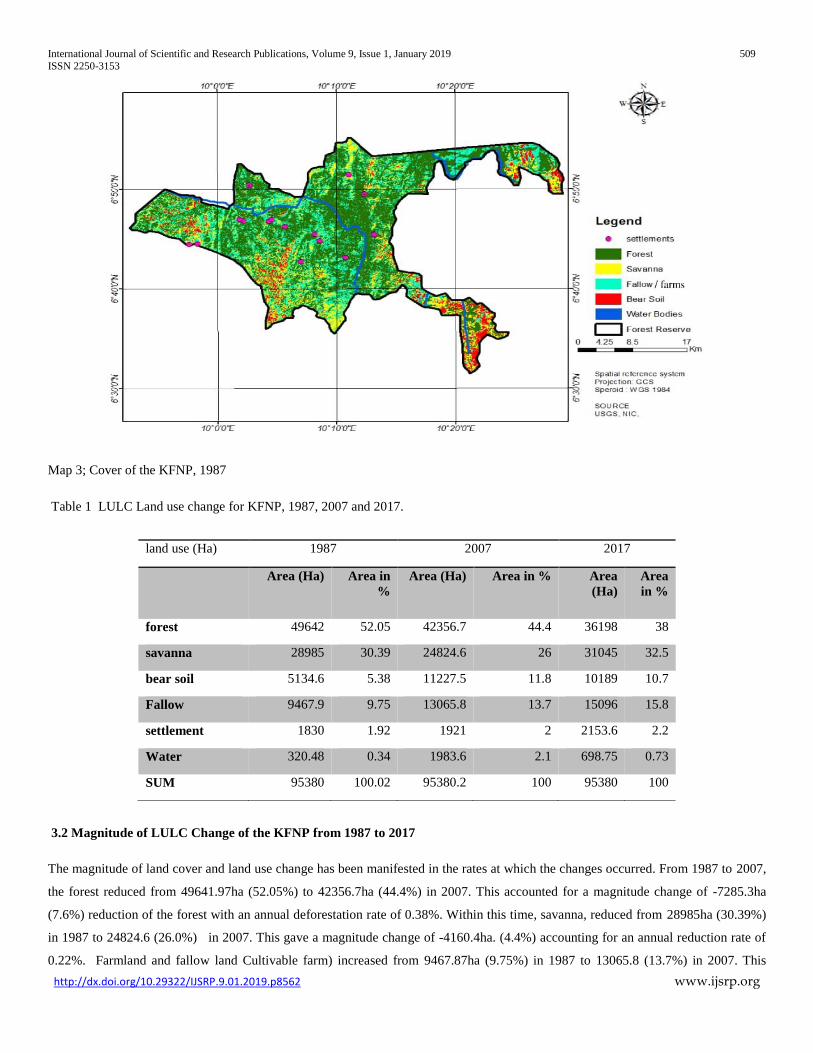
The assessment of land use status in 1987 showed that forest covered 49641.97 ha (52.05%) of the total land surface of the park. The
savanna was covered by 28985.37ha (30.39%) of the total land area. This was followed by farmland and fallow land which covered
9467.87 (9.75%) Bear soil covered 5134.58ha (5.38%) which was either degraded grazing lands or natural waste land. Settlement
covered 1830ha (1.92) while Water bodies covered 320.48ha (0.34%) of the total land surface. (Map 1 and table1)
International Journal of Scientific and Research Publications, Volume 9, Issue 1, January 2019 507
ISSN 2250-3153
http://dx.doi.org/10.29322/IJSRP.9.01.2019.p8562 www.ijsrp.org
Map 1. Cover of the KFNP, 1987
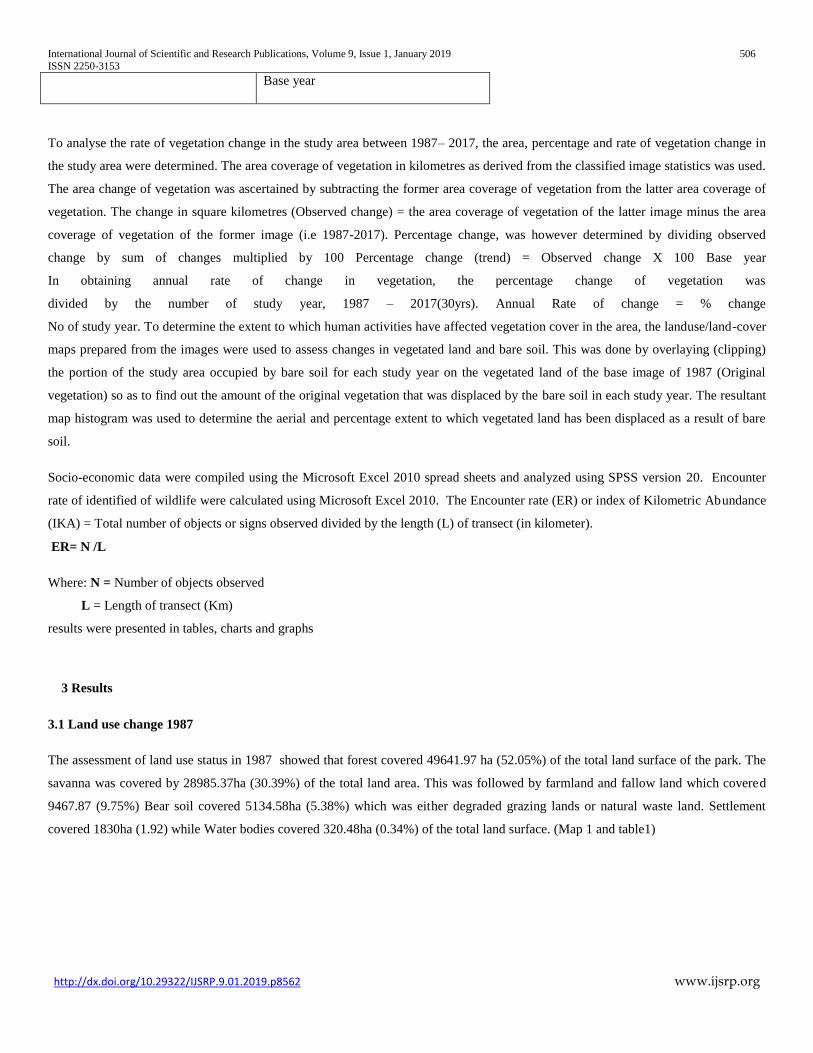
In 2007, the forest has reduced to 42356.7 (44.4%) meaning a reduction by 7.62%. savanna also witnessed a reduction in surface area
coverage to 24824.6 (26%) meaning a reduction by 4.39%. Bare soil saw an increase and covered 11227.5, representing 11.8% of land
coverage. Settlement increased to 1921ha (2.01%) and water bodies increased to 1983.6ha (2.08 %). This is shown in map 2 and table
1
International Journal of Scientific and Research Publications, Volume 9, Issue 1, January 2019 508
ISSN 2250-3153
http://dx.doi.org/10.29322/IJSRP.9.01.2019.p8562 www.ijsrp.org
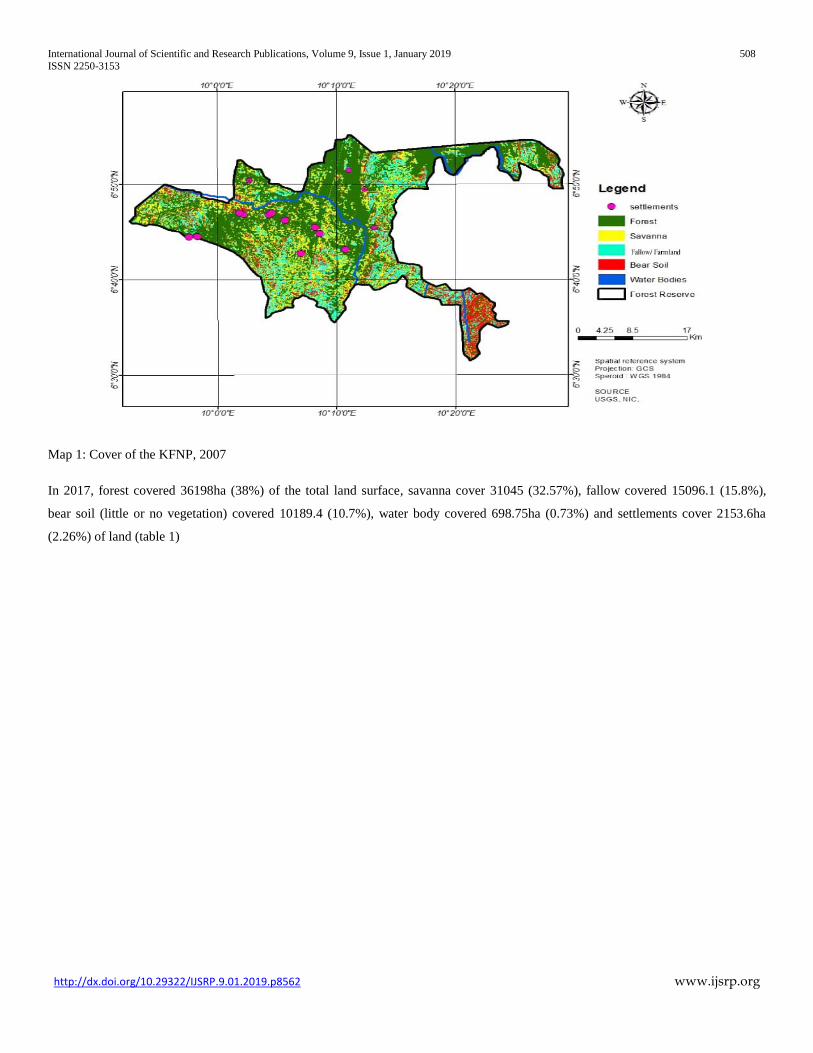
Map 1: Cover of the KFNP, 2007
In 2017, forest covered 36198ha (38%) of the total land surface, savanna cover 31045 (32.57%), fallow covered 15096.1 (15.8%),
bear soil (little or no vegetation) covered 10189.4 (10.7%), water body covered 698.75ha (0.73%) and settlements cover 2153.6ha
(2.26%) of land (table 1)
International Journal of Scientific and Research Publications, Volume 9, Issue 1, January 2019 509
ISSN 2250-3153
http://dx.doi.org/10.29322/IJSRP.9.01.2019.p8562 www.ijsrp.org
Map 3; Cover of the KFNP, 1987
Table 1 LULC Land use change for KFNP, 1987, 2007 and 2017.
3.2 Magnitude of LULC Change of the KFNP from 1987 to 2017
The magnitude of land cover and land use change has been manifested in the rates at which the changes occurred. From 1987 to 2007,
the forest reduced from 49641.97ha (52.05%) to 42356.7ha (44.4%) in 2007. This accounted for a magnitude change of -7285.3ha
(7.6%) reduction of the forest with an annual deforestation rate of 0.38%. Within this time, savanna, reduced from 28985ha (30.39%)
in 1987 to 24824.6 (26.0%) in 2007. This gave a magnitude change of -4160.4ha. (4.4%) accounting for an annual reduction rate of
0.22%. Farmland and fallow land Cultivable farm) increased from 9467.87ha (9.75%) in 1987 to 13065.8 (13.7%) in 2007. This
land use (Ha) 1987 2007 2017
Area (Ha) Area in
%
Area (Ha) Area in % Area
(Ha)
Area
in %
forest 49642 52.05 42356.7 44.4 36198 38
savanna 28985 30.39 24824.6 26 31045 32.5
bear soil 5134.6 5.38 11227.5 11.8 10189 10.7
Fallow 9467.9 9.75 13065.8 13.7 15096 15.8
settlement 1830 1.92 1921 2 2153.6 2.2
Water 320.48 0.34 1983.6 2.1 698.75 0.73
SUM 95380 100.02 95380.2 100 95380 100
International Journal of Scientific and Research Publications, Volume 9, Issue 1, January 2019 510
ISSN 2250-3153
http://dx.doi.org/10.29322/IJSRP.9.01.2019.p8562 www.ijsrp.org
indicated a magnitude change of 3597.9ha (3.8%) giving an annual growth rate of 0.2%. in the same line, bear soils increase from
5134.58ha (5.38%) from 1987 to 11227.5 (11.8%) in 2007. This accounted for a magnitude change of 6092.9ha (6.4%), giving an
annual growth rate of 0.32%. During this time, water bodies increased from 320.4775ha (0.34%) in 1987 to 1983.6 (2.04%). This
resulted to a magnitude change of 1663.3ha (1.71%) accounted for an annual rate of 0.09% while settlements from 1830ha (1.92) in
1987 to 1921in 2007. This gave a magnitude change of 91ha (0.09%).
Between 2007 and 2017, the magnitude of change was also very significant. Forest reduced from 42356.7 (44.4%) in 2007 to 36198
(38%) in 2017. This gave a magnitude change of --6158.7 (6.4%), giving an annual reduction rate of 0.64%. Savanna changed from
24824.6ha (26%) in 2007 to 31045ha (32.5%) in 2017. This gave a magnitude change of 6220.4ha (6.5%) with an annual rate of
0.65%. Farmland changed from 13065.8ha (13.7%) in 2007 to 15096 (15.8%). This gave a magnitude change of 2030.2ha (2.1%)
giving an annual rate of 0.21%. Bear soil change from 11227.5ha (11.8%) in 2007 to 10189 (10.7%) in 2017. This accounted for a
magnitude change of 1038.5 (1.1%), accounting for 0.11% annual change. water bodies changed from 1983.6ha (2.08%) in 2007 to
698.75ha (0.73) in 2017. This gave a magnitude change of -1284.85ha (1.35%) accounting for annual rate of 0.14% while settlement
increased from 1921ha (2.01%) in 2007 to 2153.6ha (2.26%) in 2017. This gave a magnitude change of 323.6ha (0.24%) with annual
rate of 0.02%.
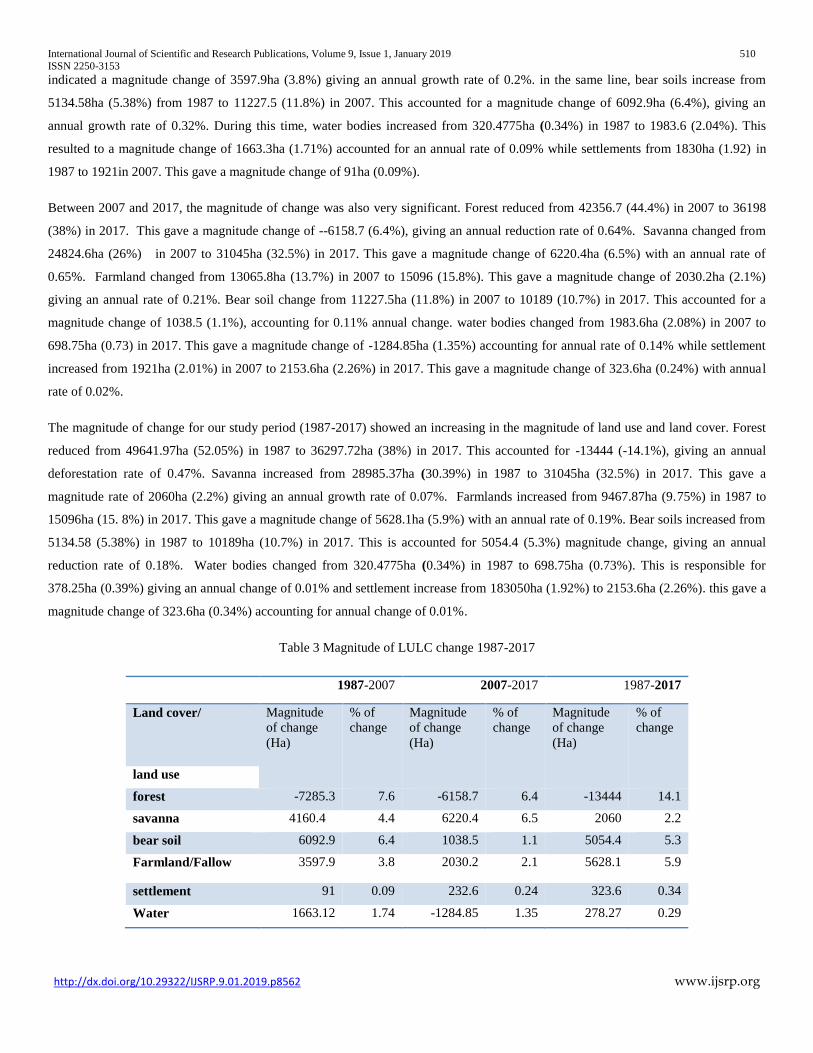
The magnitude of change for our study period (1987-2017) showed an increasing in the magnitude of land use and land cover. Forest
reduced from 49641.97ha (52.05%) in 1987 to 36297.72ha (38%) in 2017. This accounted for -13444 (-14.1%), giving an annual
deforestation rate of 0.47%. Savanna increased from 28985.37ha (30.39%) in 1987 to 31045ha (32.5%) in 2017. This gave a
magnitude rate of 2060ha (2.2%) giving an annual growth rate of 0.07%. Farmlands increased from 9467.87ha (9.75%) in 1987 to
15096ha (15. 8%) in 2017. This gave a magnitude change of 5628.1ha (5.9%) with an annual rate of 0.19%. Bear soils increased from
5134.58 (5.38%) in 1987 to 10189ha (10.7%) in 2017. This is accounted for 5054.4 (5.3%) magnitude change, giving an annual
reduction rate of 0.18%. Water bodies changed from 320.4775ha (0.34%) in 1987 to 698.75ha (0.73%). This is responsible for
378.25ha (0.39%) giving an annual change of 0.01% and settlement increase from 183050ha (1.92%) to 2153.6ha (2.26%). this gave a
magnitude change of 323.6ha (0.34%) accounting for annual change of 0.01%.
Table 3 Magnitude of LULC change 1987-2017
1987-2007 2007-2017 1987-2017
Land cover/ Magnitude
of change
(Ha)
% of
change
Magnitude
of change
(Ha)
% of
change
Magnitude
of change
(Ha)
% of
change
land use
forest -7285.3 7.6 -6158.7 6.4 -13444 14.1
savanna 4160.4 4.4 6220.4 6.5 2060 2.2
bear soil 6092.9 6.4 1038.5 1.1 5054.4 5.3
Farmland/Fallow 3597.9 3.8 2030.2 2.1 5628.1 5.9
settlement 91 0.09 232.6 0.24 323.6 0.34
Water 1663.12 1.74 -1284.85 1.35 278.27 0.29
International Journal of Scientific and Research Publications, Volume 9, Issue 1, January 2019 511
ISSN 2250-3153
http://dx.doi.org/10.29322/IJSRP.9.01.2019.p8562 www.ijsrp.org
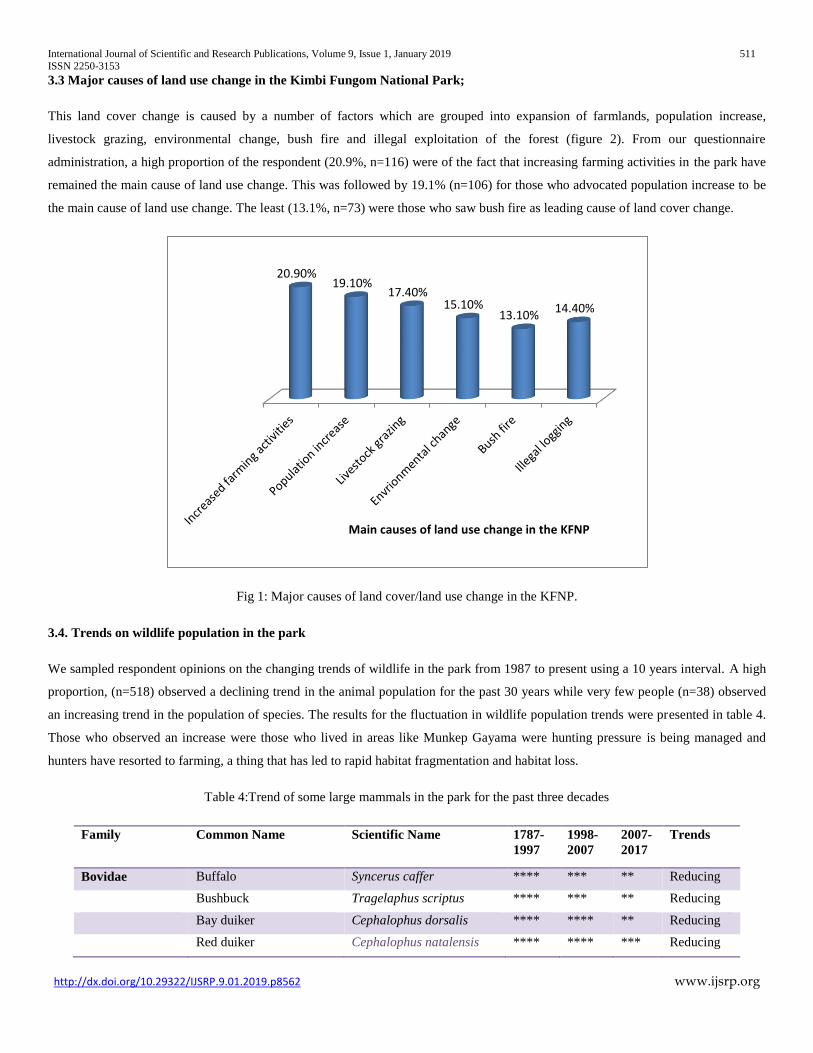
3.3 Major causes of land use change in the Kimbi Fungom National Park;
This land cover change is caused by a number of factors which are grouped into expansion of farmlands, population increase,
livestock grazing, environmental change, bush fire and illegal exploitation of the forest (figure 2). From our questionnaire
administration, a high proportion of the respondent (20.9%, n=116) were of the fact that increasing farming activities in the park have
remained the main cause of land use change. This was followed by 19.1% (n=106) for those who advocated population increase to be
the main cause of land use change. The least (13.1%, n=73) were those who saw bush fire as leading cause of land cover change.
Fig 1: Major causes of land cover/land use change in the KFNP.
3.4. Trends on wildlife population in the park
We sampled respondent opinions on the changing trends of wildlife in the park from 1987 to present using a 10 years interval. A high
proportion, (n=518) observed a declining trend in the animal population for the past 30 years while very few people (n=38) observed
an increasing trend in the population of species. The results for the fluctuation in wildlife population trends were presented in table 4.
Those who observed an increase were those who lived in areas like Munkep Gayama were hunting pressure is being managed and
hunters have resorted to farming, a thing that has led to rapid habitat fragmentation and habitat loss.
Table 4:Trend of some large mammals in the park for the past three decades
Family Common Name Scientific Name 1787-
1997
1998-
2007
2007-
2017
Trends
Bovidae Buffalo Syncerus caffer **** *** ** Reducing
Bushbuck Tragelaphus scriptus **** *** ** Reducing
Bay duiker Cephalophus dorsalis **** **** ** Reducing
Red duiker Cephalophus natalensis **** **** *** Reducing
20.90% 19.10%
17.40% 15.10%
13.10% 14.40%
Main causes of land use change in the KFNP
International Journal of Scientific and Research Publications, Volume 9, Issue 1, January 2019 512
ISSN 2250-3153
http://dx.doi.org/10.29322/IJSRP.9.01.2019.p8562 www.ijsrp.org
Suidae Bush Pig Potamochoerus larvatus *** *** *** Increasing
Pongidae Chimpanzee Pan troglodytes ellioti *** *** ** Reducing
Cercopithecidae Olive baboon Papio anubis **** **** **** Reducing
Patas monkey Cercopithecus sp. *** *** *** Reducing
Velvet monkey Chlorocebus pygerythrus **** **** *** Reducing
Mona monkey Cercopithecus mona *** *** *** Increasing
White nosed monkey Cercopithecus nictitans **** *** *** Increasing
Preuss monkey Cercopithecus preussi ** * * Extinct
Moustache monkey Cercopithecus cephus ** * * Extinct
Canidae Bush dog Lycaon pictus ** ** ** Reducing
Viverredae African civet Viverra civetta ** ** ** Reducing
Herpestidae Slender Mongoose Herpestes sanguinea *** *** ** Reducing
Hystricidae Porcupine Hystrix cristata **** *** ** Reducing
Thryonomyidae Cane rat Thryonomys swinderianus **** **** **** Stable
Procaviidae Rock Hyrax Procavia capensis **** *** ** Reducing
Hyena Hyaenidae ** ** ** Reducing
Manidae Pangolin Smutsia gigantea *** ** ** Reduced
****=very abundant ***= abundant, ** less abundant, * not present
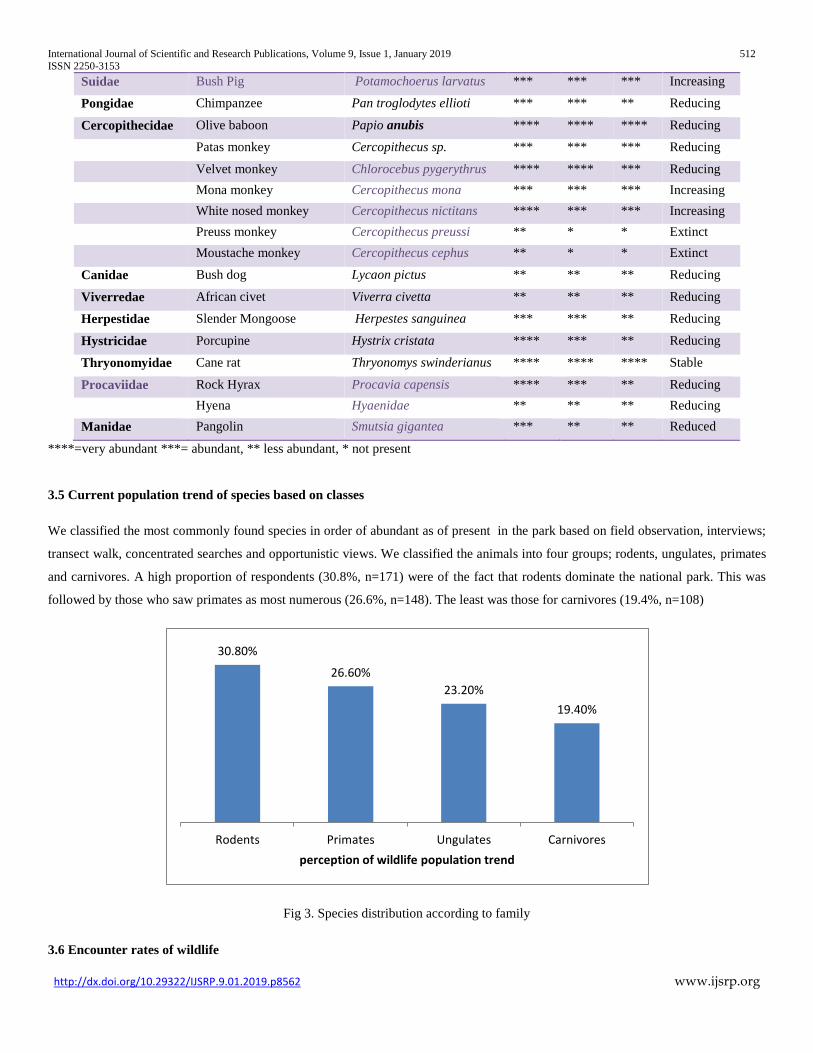
3.5 Current population trend of species based on classes
We classified the most commonly found species in order of abundant as of present in the park based on field observation, interviews;
transect walk, concentrated searches and opportunistic views. We classified the animals into four groups; rodents, ungulates, primates
and carnivores. A high proportion of respondents (30.8%, n=171) were of the fact that rodents dominate the national park. This was
followed by those who saw primates as most numerous (26.6%, n=148). The least was those for carnivores (19.4%, n=108)
Fig 3. Species distribution according to family
3.6 Encounter rates of wildlife
30.80%
26.60%
23.20%
19.40%
Rodents Primates Ungulates Carnivores
perception of wildlife population trend

International Journal of Scientific and Research Publications, Volume 9, Issue 1, January 2019 513
ISSN 2250-3153
http://dx.doi.org/10.29322/IJSRP.9.01.2019.p8562 www.ijsrp.org
A total of 274km distance was walked both in the line transect and concentrated searches. The encounter rates (n/L) of wildlife
calculated to give the current trends of wildlife in the park. This was through signs in different locations such as dung, clearings
(feeding signs), footprints and vocalizations. The highest encounter rate and density was gotten from cane rat (ER=0.76). This was
followed by baboons(ER=0.72). It was followed by Mona monkey and white nosed monkey(ER=0.56, 0.56 respectively. The least
encounter rates came from pangolin and chimpanzee (0.03 and 0.06 respectively).
Table; Encounter rate and densities of some large mammals in the park, 2018
Family Common Name Scientific Name Number ER
Bovidae Buffalo Syncerus caffer 25 0.09
Bovidae Bushbuck Tragelaphus scriptus 17 0.06
Bovidae Bay duiker Cephalophus dorsalis 19 0.07
Bovidae Red duiker Cephalophus natalensis 28 0.1
Suidae Bush Pig Potamochoerus larvatus 24 0.09
Pongidae Chimpanzee Pan troglodytes ellioti 16 0.06
Cercopithecidae Olive Baboon Papio anubis 170 0.62
Cercopithecidae Patas monkey Cercopithecus sp. 82 0.3
Cercopithecidae Velvet monkey Chlorocebus pygerythrus 122 0.45
Cercopithecidae Mona monkey Cercopithecus mona 131 0.48
Cercopithecidae White nosed monkey Cercopithecus nictitans 142 0.52
Canidae Bush dog Lycaon pictus 17 0.06
Viverredae African civet Viverra civetta 20 0.07
Herpestidae Slender Mongoose Herpestes sanguinea 100 0.36
Hystricidae Porcupine Hystrix cristata 27 0.1
Thryonomyidae Cane rat Thryonomys swinderianus 178 0.65
Procaviidae Rock Hyrax Procavia capensis 125 0.46
Manidae Pangolin Smutsia gigantea 8 0.03
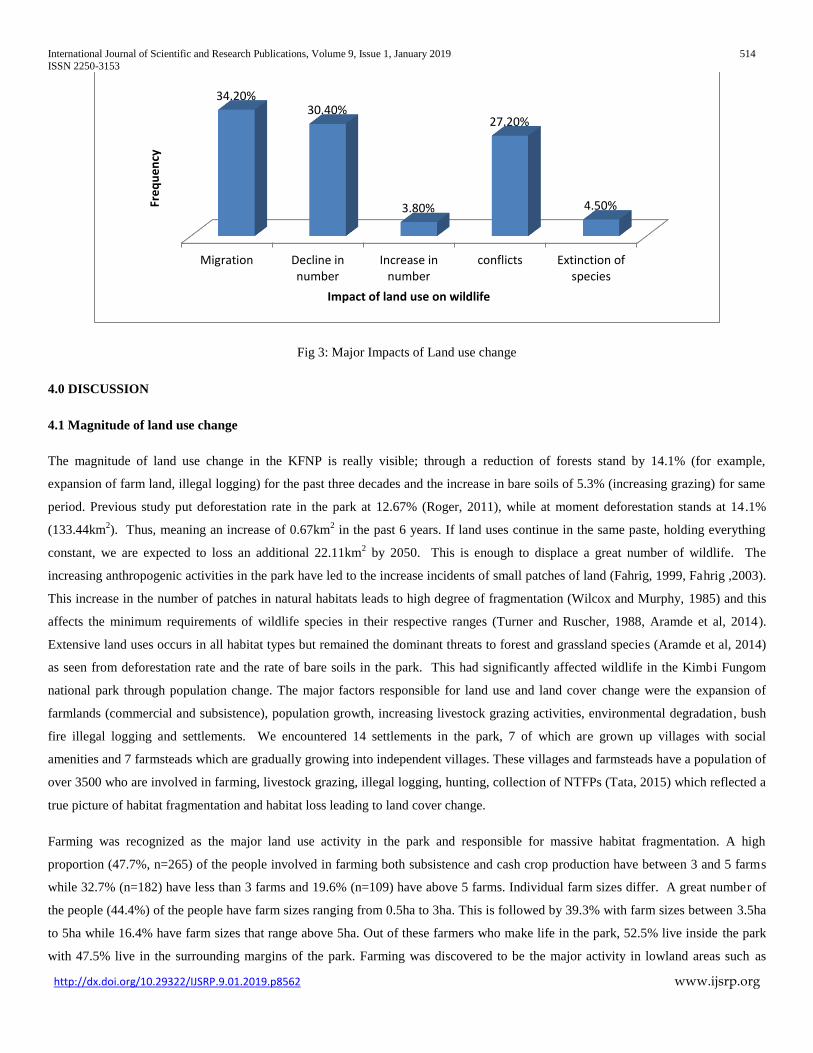
3.7 Impact of land use change on the population trends of primates
Five factors were discovered to have been the major impact of land use changes on the population of wildlife in the park. A high
proportion of respondent (34.2%, n=190) identified migration of species as a major consequence of land use changes. This was
followed by those who opined that decline in wildlife population is the major resultant effects of land use (30.4%, n=169). The least
were those who thought that land use change is leading to increase in wildlife population in the park.
International Journal of Scientific and Research Publications, Volume 9, Issue 1, January 2019 514
ISSN 2250-3153
http://dx.doi.org/10.29322/IJSRP.9.01.2019.p8562 www.ijsrp.org
Fig 3: Major Impacts of Land use change
4.0 DISCUSSION
4.1 Magnitude of land use change
The magnitude of land use change in the KFNP is really visible; through a reduction of forests stand by 14.1% (for example,
expansion of farm land, illegal logging) for the past three decades and the increase in bare soils of 5.3% (increasing grazing) for same
period. Previous study put deforestation rate in the park at 12.67% (Roger, 2011), while at moment deforestation stands at 14.1%
(133.44km2). Thus, meaning an increase of 0.67km
2 in the past 6 years. If land uses continue in the same paste, holding everything
constant, we are expected to loss an additional 22.11km2 by 2050. This is enough to displace a great number of wildlife. The
increasing anthropogenic activities in the park have led to the increase incidents of small patches of land (Fahrig, 1999, Fahrig ,2003).
This increase in the number of patches in natural habitats leads to high degree of fragmentation (Wilcox and Murphy, 1985) and this
affects the minimum requirements of wildlife species in their respective ranges (Turner and Ruscher, 1988, Aramde et al, 2014).
Extensive land uses occurs in all habitat types but remained the dominant threats to forest and grassland species (Aramde et al, 2014)
as seen from deforestation rate and the rate of bare soils in the park. This had significantly affected wildlife in the Kimbi Fungom
national park through population change. The major factors responsible for land use and land cover change were the expansion of
farmlands (commercial and subsistence), population growth, increasing livestock grazing activities, environmental degradation, bush
fire illegal logging and settlements. We encountered 14 settlements in the park, 7 of which are grown up villages with social
amenities and 7 farmsteads which are gradually growing into independent villages. These villages and farmsteads have a population of
over 3500 who are involved in farming, livestock grazing, illegal logging, hunting, collection of NTFPs (Tata, 2015) which reflected a
true picture of habitat fragmentation and habitat loss leading to land cover change.
Farming was recognized as the major land use activity in the park and responsible for massive habitat fragmentation. A high
proportion (47.7%, n=265) of the people involved in farming both subsistence and cash crop production have between 3 and 5 farms
while 32.7% (n=182) have less than 3 farms and 19.6% (n=109) have above 5 farms. Individual farm sizes differ. A great number of
the people (44.4%) of the people have farm sizes ranging from 0.5ha to 3ha. This is followed by 39.3% with farm sizes between 3.5ha
to 5ha while 16.4% have farm sizes that range above 5ha. Out of these farmers who make life in the park, 52.5% live inside the park
with 47.5% live in the surrounding margins of the park. Farming was discovered to be the major activity in lowland areas such as
Migration Decline innumber
Increase innumber
conflicts Extinction ofspecies
34.20% 30.40%
3.80%
27.20%
4.50% Fre
qu
en
cy
Impact of land use on wildlife
International Journal of Scientific and Research Publications, Volume 9, Issue 1, January 2019 515
ISSN 2250-3153
http://dx.doi.org/10.29322/IJSRP.9.01.2019.p8562 www.ijsrp.org
Munkep, Gayama, Mudzey, Etchem, Tengheukah, Mbwi Mbwi, Kedzuh and in the highland of Kedzong and was accounted for
13.99% of forest cover change in the study area with calculated from the satellite maps with an annual rate of 0.47 %. We encountered
over 800 farms in the park and interviews with park occupants and authorities confirmed that there are over 2000 cocoa and palms
farms in the park. This remained the greatest threats to wildlife in the park (Sainge, 2015). Global environmental change (soil
depletion, rainfall variability and droughts) in recent years have led to massive crop failures in other farmlands, thus pushing a
majority of the farmers in the lowlands of the park.
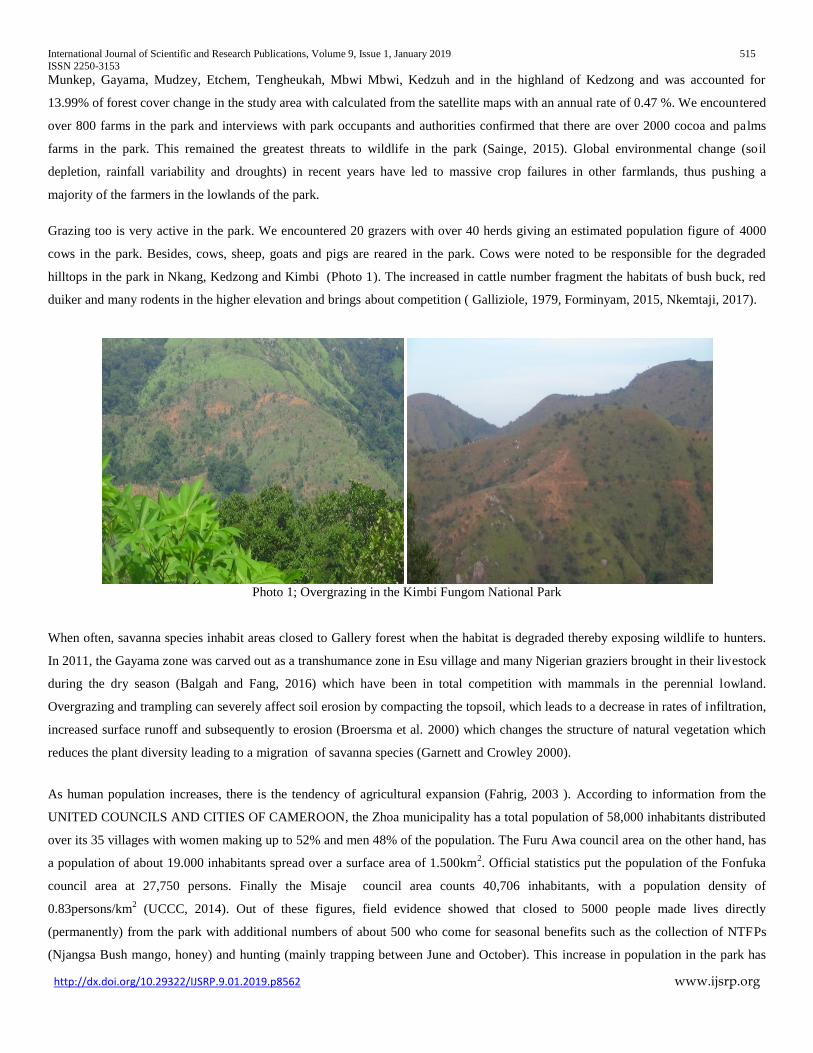
Grazing too is very active in the park. We encountered 20 grazers with over 40 herds giving an estimated population figure of 4000
cows in the park. Besides, cows, sheep, goats and pigs are reared in the park. Cows were noted to be responsible for the degraded
hilltops in the park in Nkang, Kedzong and Kimbi (Photo 1). The increased in cattle number fragment the habitats of bush buck, red
duiker and many rodents in the higher elevation and brings about competition ( Galliziole, 1979, Forminyam, 2015, Nkemtaji, 2017).
Photo 1; Overgrazing in the Kimbi Fungom National Park
When often, savanna species inhabit areas closed to Gallery forest when the habitat is degraded thereby exposing wildlife to hunters.
In 2011, the Gayama zone was carved out as a transhumance zone in Esu village and many Nigerian graziers brought in their livestock
during the dry season (Balgah and Fang, 2016) which have been in total competition with mammals in the perennial lowland.
Overgrazing and trampling can severely affect soil erosion by compacting the topsoil, which leads to a decrease in rates of infiltration,
increased surface runoff and subsequently to erosion (Broersma et al. 2000) which changes the structure of natural vegetation which
reduces the plant diversity leading to a migration of savanna species (Garnett and Crowley 2000).
As human population increases, there is the tendency of agricultural expansion (Fahrig, 2003 ). According to information from the
UNITED COUNCILS AND CITIES OF CAMEROON, the Zhoa municipality has a total population of 58,000 inhabitants distributed
over its 35 villages with women making up to 52% and men 48% of the population. The Furu Awa council area on the other hand, has
a population of about 19.000 inhabitants spread over a surface area of 1.500km2. Official statistics put the population of the Fonfuka
council area at 27,750 persons. Finally the Misaje council area counts 40,706 inhabitants, with a population density of
0.83persons/km2 (UCCC, 2014). Out of these figures, field evidence showed that closed to 5000 people made lives directly
(permanently) from the park with additional numbers of about 500 who come for seasonal benefits such as the collection of NTFPs
(Njangsa Bush mango, honey) and hunting (mainly trapping between June and October). This increase in population in the park has
International Journal of Scientific and Research Publications, Volume 9, Issue 1, January 2019 516
ISSN 2250-3153
http://dx.doi.org/10.29322/IJSRP.9.01.2019.p8562 www.ijsrp.org
been caused by global environmental change resulting from crop failures in other farmlands. The fertile lowlands of the park thus
remained the haven for agricultural potentials. Thus, in early 2018, the park received more than 100 new people forcefully displaced
by the social unrest in the North West and South West. These people have in turned embraced farming unintentional, thus swelling the
population of the park. This is manifested in the number of settlements in the park and the number of new houses and hurts in the park
with high room density (between 4 to 10 people per house). This affects wildlife population directly and indirectly or indirectly
(Olson, 2000)
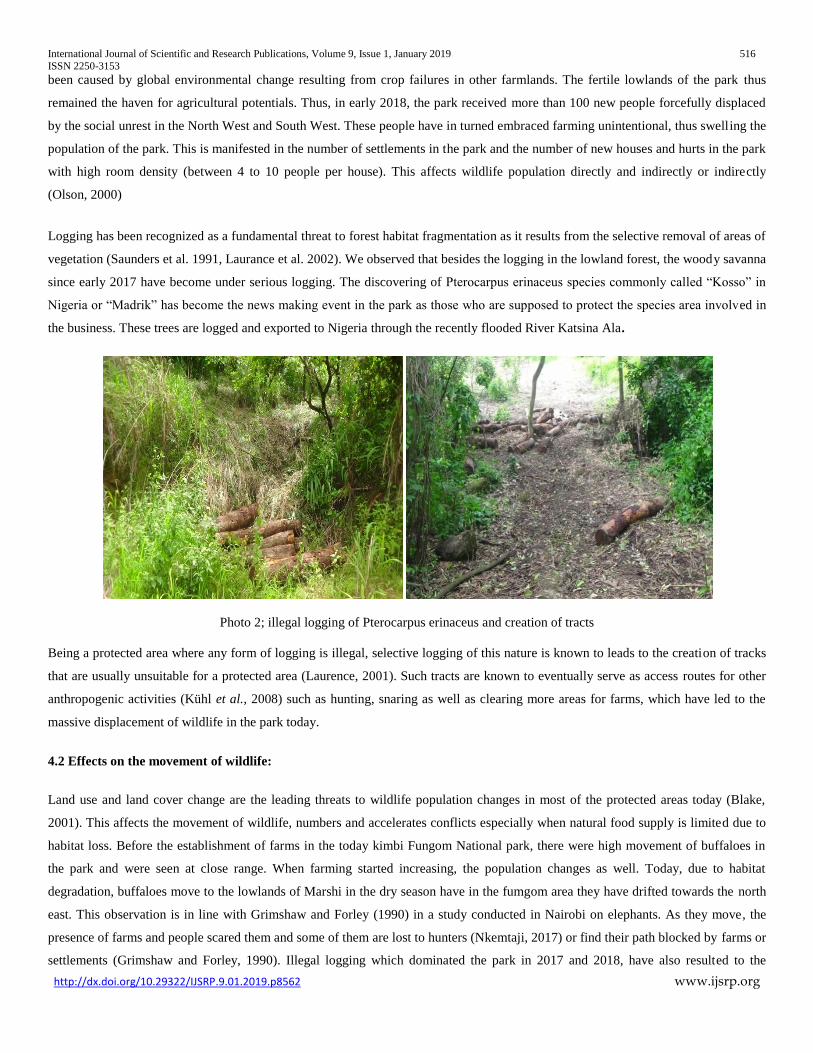
Logging has been recognized as a fundamental threat to forest habitat fragmentation as it results from the selective removal of areas of
vegetation (Saunders et al. 1991, Laurance et al. 2002). We observed that besides the logging in the lowland forest, the woody savanna
since early 2017 have become under serious logging. The discovering of Pterocarpus erinaceus species commonly called “Kosso” in
Nigeria or “Madrik” has become the news making event in the park as those who are supposed to protect the species area involved in
the business. These trees are logged and exported to Nigeria through the recently flooded River Katsina Ala.
Photo 2; illegal logging of Pterocarpus erinaceus and creation of tracts
Being a protected area where any form of logging is illegal, selective logging of this nature is known to leads to the creation of tracks
that are usually unsuitable for a protected area (Laurence, 2001). Such tracts are known to eventually serve as access routes for other
anthropogenic activities (Kühl et al., 2008) such as hunting, snaring as well as clearing more areas for farms, which have led to the
massive displacement of wildlife in the park today.
4.2 Effects on the movement of wildlife:
Land use and land cover change are the leading threats to wildlife population changes in most of the protected areas today (Blake,
2001). This affects the movement of wildlife, numbers and accelerates conflicts especially when natural food supply is limited due to
habitat loss. Before the establishment of farms in the today kimbi Fungom National park, there were high movement of buffaloes in
the park and were seen at close range. When farming started increasing, the population changes as well. Today, due to habitat
degradation, buffaloes move to the lowlands of Marshi in the dry season have in the fumgom area they have drifted towards the north
east. This observation is in line with Grimshaw and Forley (1990) in a study conducted in Nairobi on elephants. As they move, the
presence of farms and people scared them and some of them are lost to hunters (Nkemtaji, 2017) or find their path blocked by farms or
settlements (Grimshaw and Forley, 1990). Illegal logging which dominated the park in 2017 and 2018, have also resulted to the
International Journal of Scientific and Research Publications, Volume 9, Issue 1, January 2019 517
ISSN 2250-3153
http://dx.doi.org/10.29322/IJSRP.9.01.2019.p8562 www.ijsrp.org
blockage of many transhumance or migratory routes of animals leading to a North East drift of Buffaloes. Chimpanzee in the park
used to move freely in virgin forests as they vocalized regularly and were frequently seen especially at Munkep, Gayama, Etchem and
Mbwi-Mbwi (confirmed by 100% of hunters). The high abundant of chimpanzee in the 1980s in the park especially in the Fungom
forests have today occupied the almost impassable steep rocky gallery forests due to the destruction of the extensive lowland forest,
accompanied by illegal hunting in the park. The fragmentation of habitats eased the view or access of hunters to chimpanzee in the
patches where they occupied before the 2007. Other primates like velvet monkey, mona monkeys, baboons and patas monkey were
also frequently seen some years back in all the vegetation types as abundant food from the virgin forest kept them. Today, they are
seen in different time periods and movement has been limited to areas where food supply is possible. During harvesting periods (rainy
season), primates moved more regularly close to the farms (Chistine, 2003). During non harvest periods they move more frequently in
natural vegetations where food is available especially in steep gallery forest with high presence of food.
4.3 Impacts on the number of species
Field results saw a declining trend in wildlife population for the period under study. Though some people are of the fact that some
species have started increasing owing to the 2015 recognition of the Fungom area by the Cameroon government and the creation of
the KFNP, over 90% of the species have remained on the steady decline due to intensification of human activities. There has been a
gradual takeoff in the primate’s population as from 2015 in some parts of the park like Munkep and Gayama as gunshot is partly under
controlled and also due to the fact that primates have adapted to the steep gallery forests and the thick woody savanna (Onderdonk and
Chapman, 2000; Chaves et al., 2012). But this has not solved the problem to feel that primates are increasing because at least every
week a primate is killed in the park especially in areas where accessibility is really impossible. Thus, population of the primates is still
on a decline and the chimpanzee population has been the most affected. We recorded the presence of chimpanzee through nests and
callings (vocalization). A great number of callings were recorded out of the park. Our concentrated searches found 16 nests in the park
and 100% of hunters confirmed those chimpanzees are on a serious decline. Such observations were also made by Mvo, et al., (2016)
in their study of “Chimpanzee in Ethno-Primatological Practices in the KFNP and Kom-Wum forest reserves”. Most of the
chimpanzee nests were found in gallery forests with elevation above 1000m due to the massive presence of human activities in the
lowlands. This is similar to the a study conducted on gorillas a close relative to chimpanzee at Kagwene where gorillas occupied
higher elevation due to the presence of human activities at lower elevation of 401 to 550 m (Nkwatoh et al,.2017). The population of
patas monkey in the park is on a gradual increase. This is partly due to the fact that Patas monkey have the ability to survive in drier
habitats which provide them with a buffer against extinction (Lynne et al, 2007) and partly because of cultural believes that people
(especially herders) transformed into patas around the park. Thus many hunters do not kill patas and many local people do not eat
them.
The population of ungulates (especially buffaloes, bushbuck and duikers) is on a drastic decline due to the depletion of habitats
through grazing and expansion of farmlands. In addition to habitat problems, ungulates have also remained the most hunted animals in
the park leading to low encounter rates. These results were also got by Nkemtaji (2017) where he found a low encounter rate of
buffaloes and bushbuck in the park. Thus conservation effort should help spare the lives of these species. The population of pangolin
is on the decline and this was confirmed by 100% of hunters based on their bush meat trade. Pangolins were one of the species sold in
the market on weekly basis. But today, it is extremely difficult to see a pangolin. The population has drastically declined but hunters
are of the fact that the population is still high in some parts of the park. This information needs thorough verification because our
survey came across mainly signs and a carcass caught in the dry season of 2017. The inglorious hunting trips have been caught short
International Journal of Scientific and Research Publications, Volume 9, Issue 1, January 2019 518
ISSN 2250-3153
http://dx.doi.org/10.29322/IJSRP.9.01.2019.p8562 www.ijsrp.org
due to low return and also because of the continuous education on hunting. Their talk from long distance hunting, accompanied by a
less returned is forcing many hunters to abandon the job and turn towards farming. However, abandoning hunting or the reduction in
gun sounds have only camouflaged success in the conservation efforts of the officials of the Kimbi-Fungom national park who have
not quickly realized that agricultural expansion remained the greatest threat to wildlife ((Suleiman, 2014 ). Chimpanzee and pangolin
remained the highest endangered species in the park with the lowest encounter rates and population densities and need urgent
conservation effort to spare the remaining numbers.
Most importantly previous report indicated the presence of the Preuss, black and white colobus while hunters confirmed the presence
of the moustache monkey some years back. In the face of growing land uses. Our one year in the park did not come across such
species and hunters confirmed their existence three decades back. This is in contrast with widespread misconception about the
presence of these species by some researchers (Tata, 2015, Nkemtaji, 2017). Also, Ndenencho (2005), mentioned the presence of the
Black and white colobus, but our observation noticed that there might be some conception between the rumped putty nosed monkey
and black and white colobus. This species has not been sighted in the park and hunters confirmed that they have not come across them
or even their signs. They are either locally extinct or extirpated.
4.4 Impacts on Human Wild Conflict Situation
Land use changes have exposed the inhabitants of the Kimbi-Fungom national park to the risk of conflicts. These conflicts are either
through physical confrontation, crop raiding or property destruction. According to the conservator of the park, wildlife human
conflicts have resulted mainly from habitat destruction which has degraded food supply to wildlife especially large mammals. In the
Kimbi compartment, there has been buffalo-herder conflicts and buffalo-farmer crisis while in the Fungom zone, there has been a
series of buffalo-human confrontation and massive crop raiding from wildlife especially primates and rodents. Nearly all the farmers
(99% of respondents) have been victims of crop raid by wildlife. During planting and shooting, rodents raid the crops as well as
bushbuck, duikers and some birds. At maturity, primates take unguarded farms hostage causing more harm whenever they come in
contact with maize or groundnuts. These primates especially baboons invade farmlands especially maize and groundnuts which are the
indigenous stable food causing more damage in a single raid (Suleiman, 2014). Baboons have been reported to be the most notorious
crop raiders (Naughton-Treves, 1998). Maize and groundnut remain the highest crops which have suffered enormous in areas like
Kedzuh (with over 800 subsistence farmers) and Kedzong and it is indigenous stable food. These crop raids have been more intense
when primates have no opportunities to obtain food from the natural forest (Lamarque et al., 2009, Suleiman, 2014). Their movements
in search of food from one natural fragment to the other give them an intervening opportunity when they meet croplands on their
roads. That is why 100% of the respondents took baboon as the least preferable conservable species in the park and elsewhere and
prefer chimpanzee since they have never caused any destruction on their crops.
Physical confrontation has been recorded between hunters and buffaloes, hunter and chimpanzee and grazers and buffaloes. Cows
have been killed in the Kimbi compartments due to the intrusion of buffalos from the park into livestock herds especially in the dry
season in the Kimbi village in 2015. Hunters have been wounded by buffaloes in the Fungom area with the last case recorded in 2014
in Munkep where a wounded buffalo attacked a hunter in a forest beneath the park. Injuries were sustained in Kimbi by government
officials who went to evaluate the damage caused by a stray buffalo on a farm in 2016. The buffalo left the herd, invaded a farm
where it stayed there for weeks. The officials who came to evaluate the farm and to officially sell the buffalo to a hunter did not
International Journal of Scientific and Research Publications, Volume 9, Issue 1, January 2019 519
ISSN 2250-3153
http://dx.doi.org/10.29322/IJSRP.9.01.2019.p8562 www.ijsrp.org
achieve their mission as they were all scared by the buffalo in the thick grassy landscape. Human wildlife conflicts have thus remained
high in the park. This observation is very much similar to Thirgood, (2005) in Kenya where human wildlife remained paramount.
Respondents’ reaction to crop raiding activities
Crop raiding activities is one of the greatest deadlocks to the conservation of wildlife in the park. Crop raiders give farmers serious
problem and always give farmers a change of mind when crop fields are taken hostage by wildlife. Different people have different
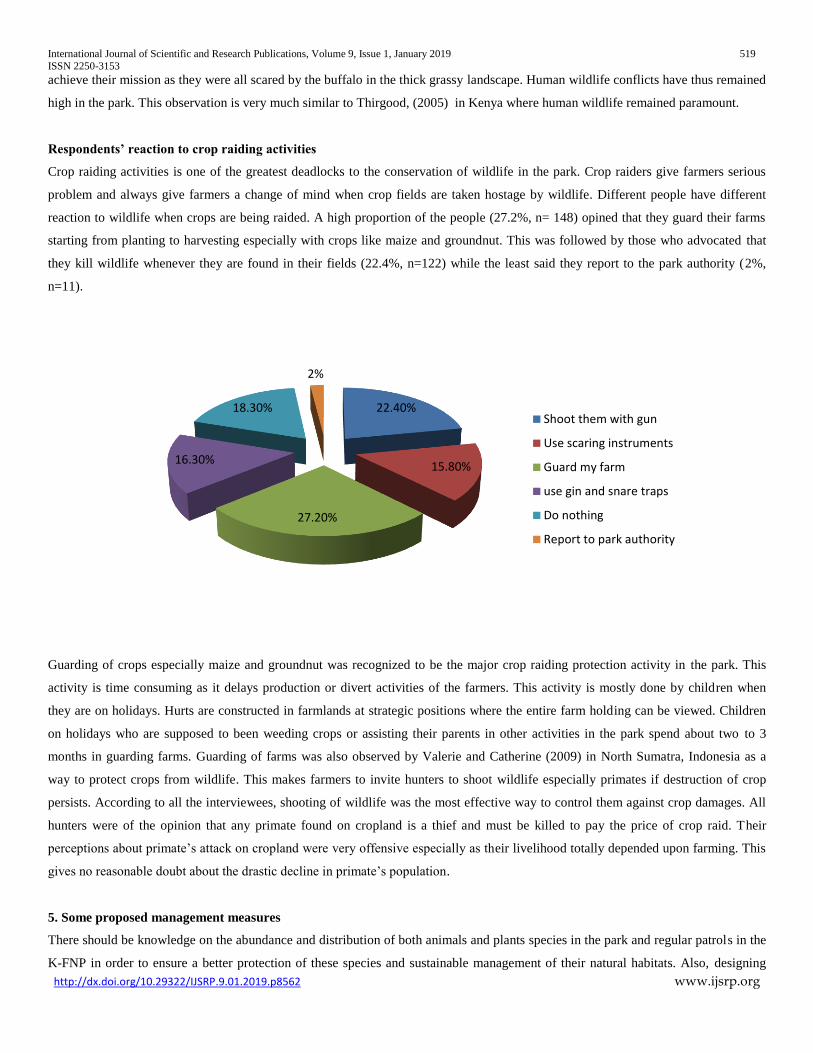
reaction to wildlife when crops are being raided. A high proportion of the people (27.2%, n= 148) opined that they guard their farms
starting from planting to harvesting especially with crops like maize and groundnut. This was followed by those who advocated that
they kill wildlife whenever they are found in their fields (22.4%, n=122) while the least said they report to the park authority (2%,
n=11).
Guarding of crops especially maize and groundnut was recognized to be the major crop raiding protection activity in the park. This
activity is time consuming as it delays production or divert activities of the farmers. This activity is mostly done by children when
they are on holidays. Hurts are constructed in farmlands at strategic positions where the entire farm holding can be viewed. Children
on holidays who are supposed to been weeding crops or assisting their parents in other activities in the park spend about two to 3
months in guarding farms. Guarding of farms was also observed by Valerie and Catherine (2009) in North Sumatra, Indonesia as a
way to protect crops from wildlife. This makes farmers to invite hunters to shoot wildlife especially primates if destruction of crop
persists. According to all the interviewees, shooting of wildlife was the most effective way to control them against crop damages. All
hunters were of the opinion that any primate found on cropland is a thief and must be killed to pay the price of crop raid. Their
perceptions about primate’s attack on cropland were very offensive especially as their livelihood totally depended upon farming. This
gives no reasonable doubt about the drastic decline in primate’s population.
5. Some proposed management measures
There should be knowledge on the abundance and distribution of both animals and plants species in the park and regular patrols in the
K-FNP in order to ensure a better protection of these species and sustainable management of their natural habitats. Also, designing
22.40%
15.80%
27.20%
16.30%
18.30%
2%
Shoot them with gun
Use scaring instruments
Guard my farm
use gin and snare traps
Do nothing
Report to park authority
International Journal of Scientific and Research Publications, Volume 9, Issue 1, January 2019 520
ISSN 2250-3153
http://dx.doi.org/10.29322/IJSRP.9.01.2019.p8562 www.ijsrp.org
awareness and educational programs, implementing effective communication channels between the local inhabitants, council, wildlife
managers and the government
Communities in and around the park should be educated on the important of wildlife management. This should be done through a
series of regular sensitization campaigns in the park. They should be placed on an annual rate based at enhancement development in
their communities. This should be facilitated by performing a cost-benefit analysis on wildlife management. For instance, the cost of
killing a pangolin to an individual and the benefit of protecting a pangolin to the community in terms of research and tourism was very
interesting.
Land use planning strategies should be developed and implemented. For instance, the issue of expanding farmlands in the park should
be handled through “limited use zone policy” where farmers are limited to their present farm holdings through farm intensification.
This will help in the prevention of further habitat loss thereby enhancing the population growth of wildlife. Also, the encroachment of
grazing activities in the park should be controlled and if grazing must take place in the park, grazing activities should be limited to
area with relative low animal population.
The park should be divided into compartments, based on wildlife hotspots and cold spots. Places with little or no wildlife should be
taken off the park while corridors with wildlife abundant should be incorporated into the park. For instance, the Western section of the
park (Fungom zone) with a high number of chimpanzees should be incorporated into the park while the North Eastern degraded part
of the park should be curved out of the park. This will facilitate management of the park.
Ecotourism activities should be promoted by implementing income generating micro- projects in order to divert local people attention
from hunting and the encroachment of farmlands in the park.
6. CONCLUSION
Land use and land cover change has been known to be the major threat to wildlife population change in many tropical landscapes.
This affects the population of wildlife negatively as the destruction of habitats could either lead to the migration of wildlife out of the
park leading to their concentration in very difficult landscape, thus making it very difficult for people to have access to them. This can
therefore lead to a decline in tourist potentials in the park, thereby defeating the purpose for park functionality. In recent times, there
has been heavy farming, grazing and illegal exploitation of trees. In the Fungom zone with it rugged terrain characterized by steep
rolling hills and heavily occupied extensive lowland, tourism may become very difficult since wildlife view is really difficult.
Primates are only heard vocalizing in steep gallery forests, chimpanzee sneeze in far off zones, west of the park, buffaloes are
concentrated at Mbwi-Mbwi and hyena footprints are viewed in sandy and muddy soils in the grassland. This makes conservation of
wildlife in the park very difficult. However, restoring habitats through controlled grazing, intensifying agriculture in the park and
involving the occupants of the park in the conservation process and most importantly identifying wildlife hotspots could yield fruits if
the Kimbi-Fungom National Park must be seen as a tourist destination.
References
Anderson, J.R., E.E. Hardy, J.T. Roach, and R.E. Witmer, (1976). A land use and land cover classification system for use with
remote sensor data. U.S. Geological Survey Professional Paper 964, 28 pp
International Journal of Scientific and Research Publications, Volume 9, Issue 1, January 2019 521
ISSN 2250-3153
http://dx.doi.org/10.29322/IJSRP.9.01.2019.p8562 www.ijsrp.org
Aramde Fetene, Kumelachew Yeshitela, Ruediger Prasse and Thomas Hilker (2014); Study of Changes in Habitat Type
Distribution and Habitat Structure of Nech Sar National Park, Ethiopia. Ecologia, Academic Journal. DOI:10.23923/ecologia
2014.1.15
Arnold, K., & Zuberbühler, K. (2008.). Meaningful call combinations in a non-human primate". Current Biology 18 (5): 202–203
Balgah Sounders Nguh, Amos Fang Zeh, Land Use Dynamics and Agro-pastoral Conflicts in Menchum Division, Cameroon,
Landscape Architecture and Regional Planning. Vol. 1, No. 1, 2016, pp. 1-12. doi: 10.11648/j.larp.20160101.11
Balmford A, Gaston KJ, Blyth S, James A, Kapos V. (2003). Global variation in terrestrial conservation costs, conservation
benefits, and unmet conservation needs. Proceedings of the National Academy of Sciences 100:1046–1050
Bekhuis, P.; Jong, C.B. de; Prins, H.H.T. (2008) Diet selection and density estimates of forest buffalo in Campo-Ma'an National
Park, Cameroon. African Journal of Ecology 46 (2008)4. - ISSN 0141-6707 - p. 668 - 675. https://doi.org/10.1111/j.1365-
2028.2008.00956.x
Birdlife International.(1997). Partial list of Mbi Crater Game Reserve bird list. Birds of West Africa forest vol.1.
BirdLife International (2010). Important Bird Areas factsheet: Mbi Crater Faunal Reserve - Mbingo forest. Downloaded from
http://www.birdlife.org on 12/04/2013.
Blake, S., I. Douglas-Hamilton, and W. B. Karesh. (2001). GPS telemetry of forest elephants in central Africa: results of a
preliminary study. African Journal of Ecology 39:178-186.
Broersma K, Krzic M, Newman RF, Bomke AA (2000) Effects of grazing on soil compaction
and water infiltration in forest plantations in the interior of British Columbia. In: Hollstedt C,Sutherland K, Innes T (eds)
From science to management and back: a science forum for southern interior ecosystems of British Columbia. Southern
Interior Forest Extension and Research Partnership, Kamloops, pp 89–92
Buckland, S. T., Anderson, D. R., Burnham, K. P., & Laake, J. L. (1993). Distance sampling, estimating abundance of biological
populations. London: Chapman & Hall.
Buckland, ST, Anderson, DR, Burnham, KP, Laake, JL, Borchers, DL & Thomas, L (2001)
Introduction to distance sampling: Estimating abundance of biological populations, New York, USA., Oxford University
Press.
Buckland, ST, Borchers, DL, Johnston, A, Henrys, PA & Marques, TA (2007) Line transect methods for plant surveys.
Biometrics, 63, 989-98.
Buckland, S. T., Anderson, D. R., Burnham, K. P., Laake, J. L., Borchers, D. L., & Thomas, L. (Eds). (2004). Advanced Distance
Sampling. Oxford: Oxford University Press
Burnham, K. P 91980). Estimation of Density from line transect sampling of Biological Population Wildlife Monograph 72:202.
Chapman CA, Peres CA (2001) Primate conservation in the new millennium: the role of
scientists. Evol Anthropol 10:16–33
Chapman CA, Naughton-Treves L, Lawes MJ, Wasserman MD, Gillespie TR (2007) Population
declines of Colobus in Western Uganda and conservation value of forest fragments. Int J Primatol 28:513–528
Chaves, O. M., Stoner, K. E., Arroyo-Rodríguez, V. (2012) Differences in diet between spider monkey groups living in forest
fragments and continuous forest in Lacandona, Mexico. Biotropica 44: 105–113. doi:10.1111/j.1744-7429.2011.00766.x.
Google Scholar | Crossref
Congalton Russell G. (1991); A Review of Assessing the Accuracy of Classifications of Remotely Sensed Data REMOTE
SENS. ENVIRON. 37:35-46
International Journal of Scientific and Research Publications, Volume 9, Issue 1, January 2019 522
ISSN 2250-3153
http://dx.doi.org/10.29322/IJSRP.9.01.2019.p8562 www.ijsrp.org
Deborah L. Moore and Linda Vigilant ( 2013) A population Estimate of Chimpanzees (Pan
troglodytes schweinfurthii) in the Ugalla Region Using Standard and Spatially Explicit Genetic Capture–Recapture Methods.
American Journal of Primatology. DOI: 10.1002/ajp.22237
Fahrig L (1999) Forest loss and fragmentation: which has the greater effect on persistence of
forest- dwelling animals? In: Rochelle JA, Lehmann LA, Wisniewski J (eds) Forest fragmentation; wildlife and management
implications. Leiden, The Netherlands, pp 87–95
Fahrig L (2003) Effects of habitat fragmentation on biodiversity. Annu Rev Ecol Evol Syst 34:487–515
Fominyam, N.C.T. (2015). Kimbi-Fungom National Park Presentation. March 2015. (Unpublished).Pioneer conservator. CUPGR-UK.
Forestry Engineer.
Franklin Nda, Nkemtaji & Angwafo, Tsi Evaristus & Christopher, Fominyam & Chuo, Mvo & Fotang, Chefor & Ashu, Bate &
Christian Ebua, Akwo. (2018). Status of Bushbuck (Tragelaphus scriptus) and Buffalo (Syncerus caffer) in the North and South
Eastern Parts of the Kimbi-Fungom National Park, North West Region of Cameroon. International Journal of Forest,
Animal and Fisheries Research. 2. 84-107. 10.22161/ijfaf.2.3.2.
Garnett ST, Crowley GM (2000) The action plan for Australian birds. Environment Australia, Canberra
González-Solís, J., Guix, J. C., Mateos, E., & Llorens, L. (2001). Population density of primates
in a large fragment of the Brazilian Atlantic Rainforest. Biodiversity and Conservation, 10, 1267–1282.
Grimshaw, lM. & Foley, C.A.H. (1991). Kilimanjaro Elephant Project 1990 Final Report. Friends of Conservation, London.
Harcourt AH, Doherty DA (2005) Species-area relationships of primates in tropical forest fragments: a global analysis. J Appl
Ecol 42:630–637
Hassan, A. S., Okuofu C. A. & Balogun, J. K. (2008 ) The Use Of Biological Index Of Pollution (Bip) In Assessing Quality Of
Rural Water Sources In Zaria, Nigeria. Science World Journal Vol 3 (No2) Www.Sciecnceworldjournal.Com
Kamusoko, C.; Aniya, M. Land use/cover change and landscape fragmentation analysis in the
Bindura district, Zimbabwe. Land Degrad. Dev. 2007, 18, 221–233
KINGDON, J. (2003). The Kingdon field guide to African mammals. - A&C Black Publishers Ltd., London, UK.
Krüger, J.-P. (2006). Forest conversion and soil degradation in the tropical lowland of eastern Bolivia: GIS-based analysis for
regionalization of soil degradation in the Santa Cruz Department.Dissertation, 173 pp. plus Appendix. Geographic Institute,
Department of Landscape Conservation, University of Göttingen, Germany.
Kühl, F. Maisels, M. Ancrenaz, E.A. Williamson (2008) Best Practice Guidelines for Surveys and Monitoring of Great Ape
Populations. IUCN SSC Primate Specialist Group, Gland, Switzerland (2008) Google Scholar
Lamarque, F., Anderson, J., Fergusson, R., Lagrange, M., Osei-Owusu, Y. and Bakker, L. Human-Wildlife conflict causes,
consequences and management strategies. FAO Forestry paper 157 2009
Lambi CM, Takang RT (2010) Land Use Dynamics on the Eastern Slopes of Mount Cameroon African Journal of Social Sciences,
AJOSS 1: 20-35.
Lambin Eric F. (1999): Monitoring forest degradation in tropical regions by remote sensing:
some methodological issues. Global Ecology and Biogeography (1999) 8, 191–198
International Journal of Scientific and Research Publications, Volume 9, Issue 1, January 2019 523
ISSN 2250-3153
http://dx.doi.org/10.29322/IJSRP.9.01.2019.p8562 www.ijsrp.org
Lambin E, Geist H (2007) Causes of Land-use and Land-cover Change. The Encyclopedia of Earth. Lambin EF, Geist HJ, Lepers
E (2003) Dynamics of Land-use and Land-cover Change in Tropical Regions. Annual Review of Environmental
Resources 28: 205- 241.
Laurance, W. F., D. Perez-Salicrup, P. Delamonica, P. M. Fearnside, S. D’Angelo, A.
Jerozolinski, L. Pohl, and T. E. Lovejoy. 2001. Rain forest fragmentation and the structure of Amazonian liana communities.
Ecology. 82: 105Ð116.
Laurance, W. F., T. E. Lovejoy, H. L. Vasconcelos, E. M. Bruna, R. K. Didham, P. C.
Stouffer, C. Gascon, R. O. Bierregaard, S. G. Laurance, and E. Sampaio. 2002. Ecosystem decay of amazonian forest
fragments: a 22- year investigation. Conserv. Biol. 16: 605Ð618.
Lynne A. Isbell1 and Janice Chism (2007). Distribution and Abundance of Patas Monkeys
(Erythrocebus patas) in Laikipia, Kenya. American Journal of Primatology 69:1223–1235
Millennium Ecosystem Assessment MEA (2005). Ecosystems and human wellbeing: Synthesis. Washington DC: Island Press.
Mvo Denis Chuo and Tsi Evaristus Angwafo (2016) Status of large mammals: case study of
gorilla (Gorilla gorilla diehi), chimpanzee (Pan troglodytes ellioti) and buffalo (Syncerus
caffer), Menchum South, NW Cameroon. International Journal of Environment, Agriculture and Biotechnology (IJEAB) Vol-
2, Issue-4, http://dx.doi.org/10.22161/ijeab/2.4.11
UCCC (UNITED COUNCILS AND CITIES OF CAMEROON), (2014).
Moses. Nsanyi. Sainge, 2016. Patterns of distribution and Endemism of Plants in the Cameroon Mountains: A case study of
Protected Areas in Cameroon: Rumpi Hills Forest Reserve (RHFR) and the Kimbi Fungom National Park (KFNP). Tropical Plant
Exploration Group (TroPEG) Cameroon.
Sutter, B., and G. Ritchison. 2005. Effects of grazing on vegetation structure, prey availability, and reproductive success of
grasshopper sparrows. Journal of Field Ornithology 76: 345– 351.
Naughton-Treves, L., A. Treves, C. Chapman and R. Wrangham. 1998. Temporal patterns of crop-raiding by primates: linking
food availability in croplands and adjacent forest. J. Appl. Ecol. 35: 596–606.
Ndenecho, E. N.,(2009). Ecological Planning and Ecotourism Development in Kimbi Game Reserve, Cameroon.Geography
Department, University of Yaounde I, ENS Annex Bambili, P.O. Box Bamenda North West Province, Cameroon. E-mail:
[email protected](© Kamla-Raj 2009 . J Hum Ecol, 27(2): 105-113 (2009)).
Nkwatoh Athanasius Fuashi Akenji Lesly Nji, Melle Maurice Ekane, Andrew Fowler and
Romanus Ikfuingei (2017) . Assessing the impact of seasonality on Cross River Gorilla Nest Construction at Kagwene
Gorilla Sanctuary, North-West Cameroon
Ojima, K. A. Galvin, B. L. Turner (1994) Global Impact of Land-Cover Change American Institute of Biological Sciences
Vol. 44, No. 5, pp. 300- 304.
Onderdonk DA, Chapman CA (2000) Coping with forest fragmentation: the primates of Kibale
National Park, Uganda. Int J Primatol 21:587–611
Ottichilo, W, de Leeuw, J. & Prins, H.H.T. (2001). Population trends of resident wildebeest [Connochaetes taurinus hecki
(Neumann)] and factors influencing them in the Maasai Mara ecosystem, Kenya. Biol. Conserv. 97, 271–282.
Peres, C.A. 1999a. General guidelines for standardizing line-transect surveys of tropical forest primates. Neotrop. Primates 7: 11–
16.
Peres, C.A. 1999b. Effects of subsistence hunting and forest types on the structure of Amazonian primate communities. In: Primate
Communities, J. G. Fleagle, C. Janson and K. E. Reed (eds.), pp. 268–283. Cambridge University Press, Cambridge.
Plumptre, A. J. and Reynolds, V. 1996. Censusing chimpanzees in the Budongo Forest, Uganda. Int. J. Primatol. 17: 85–99.
International Journal of Scientific and Research Publications, Volume 9, Issue 1, January 2019 524
ISSN 2250-3153
http://dx.doi.org/10.29322/IJSRP.9.01.2019.p8562 www.ijsrp.org
Richard T. Corlett (1999) Environmental forestry in Hong Kong: 1871-1997. Forest Ecology and Management 116 (1999) 93-105
Saunders DA, Hobbs RJ, Margules CR (1991) Biological consequences of ecosystem fragmentation: a review. Conserv Biol 5:18–
32
Srivastava, A., Das, J., Biswas, J., Buzarbarua, P., Sarkar, P., Bernstein, I.S. and Mohnot, S. M. 2001. Primate population decline in
response to habitat loss: Borajan Reserve Forest of Assam, India. Primates 42(4): 401– 406.
Tata, F.T. (2011). Stakeholder Participation in the Establishment of Biosphere Reserves:The Case of Local Communities in the
Proposed Kimbi-Dumbo-Nyos Conservation Zone, Cameroon. Discussion Paper presented by Dr. Thomas Fofung Tata at the
International Expert Workshop on Managing Challenges of Biosphere Reserves in Africa, Dresden, Germany, June 2011.
Tata, F.T. (2015). The Kimbi-Fungom National Park; -A situation report. Green works company Ltd. P.O. Box, Bamenda,
Cameroon<[email protected]>.
Tchouto, M.G.P. (2004) Plant diversity in a Central African rain forest, implications for
biodiversity conservation in Cameroon. PhD thesis, Wageningen University, Wageningen, The Netherlands.
Thirgood, S., Woodroffe, R. and Rabinowitz, A. eds. People and Wildlife: conflict or co existence. Cambridge Univ. Press London
2005
Thomas, S. C. 1991. Population densities and patterns of habitat use among anthropoid primates of the Ituri Forest, Zaire.
Biotropica 23: 68–83.
Tsi, E.A. (2006). Status of wildlife and its utilization in Faro and Benoué National Park North Cameroon: Case study of the Derby
Elands (Taurotragus derbianus) signs (Gray 1847) and African Wild Dog (Lycaam pictus) (Temminck 1820), Ph.D thesis
Turner, M.G. and Ruscher, C.L. 1988. Changes in the spatial patterns of land use in Georgia. Landscape Ecology 1: 241-251
Valerie Marchal and Catherine Hill (2009). Primate Crop-raiding: A Study of Local Perceptions in Four Villages in North Sumatra,
Indonesia. Primate Conservation 2009 (24): 107–116
Viera AJ, Garrett JM (2005). Understanding Interobserver Agreement: The Kappa Statistic. Fam Med 2005;37(5):360-363
Wilson MA, et al. (2004) The 1.8-A resolution crystal structure of YDR533Cp from Saccharomyces cerevisiae: a member of the
DJ-1/ThiJ/PfpI superfamily. Proc Natl Acad Sci U S A 101(6):1531-6
Wilcox D. D., Murphy B. A., (1985) Conservation strategy: the effects of fragmentation on extinction. Am. Nat., 125: 879-887.
Yoshioka, M. B. Takada,
and I. Washitani (2014). Landscape effects of a non-native grass facilitate source populations of a
native generalist bug, Stenotus rubrovittatus , in a heterogeneous agricultural landscape. Journal of Insect Science.
10.1093/jis/14.1.110
International Journal of Scientific and Research Publications, Volume 9, Issue 1, January 2019 525
ISSN 2250-3153
http://dx.doi.org/10.29322/IJSRP.9.01.2019.p8562 www.ijsrp.org