Embed Size (px)
Citation preview
Impact of ‘greening’ the Common Agricultural Policy:
evidence from selected countries based on CAPRI model
Adam Wąs 1, Katarzyna Zawalińska 2, Wolfgang Britz 3
1 Warsaw University of Life Sciences, Faculty of Economic Sciences, ul. Nowoursynowska
166, 02-787, Warsaw, Poland, tel. +48 22 59 342 18
email: [email protected]
2 IRWiR PAN, Institute of Rural and Agricultural Development, Polish Academy of Sciences
(IRWiR PAN), ul. Nowy Swiat 72, 00-330 Warsaw, Poland , tel. +48-22-6572-915,
email: [email protected]
3 Institute for Food and Resource Economics, University of Bonn, Nussallee 21, Haus 1,
Raum 1.004 Germany, tel. + 49 - 2 28 - 73 25 02, email: [email protected]
The paper was part of the organized session
“Assessing multiple dimensions of CAP environmental measures”
at the EAAE 2014 Congress ‘Agri-Food and Rural Innovations for Healthier Societies’
August 26 to 29, 2014
Ljubljana, Slovenia
Copyright 2014 by Adam Wąs, Katarzyna Zawalińska, and Wolfgang Britz. All
rights reserved. Readers may make verbatim copies of this document for non-commercial
purposes by any means, provided that this copyright notice appears on all such copies.

1
Abstract
This paper examines the potential impacts of the post 2013 EU Common
Agricultural Policy (CAP) reform, which aims to improve the environmental performance of
agriculture, called “greening” the CAP. Using the well-established CAPRI model, the
economic and environmental consequences of the reform on agriculture are estimated for
selected EU countries. The results indicate that ‘greening’ causes a decline in the area of the
main crops, increase crop prices and slightly intensify production on the remaining areas.
Farm income would increase, but due to the low intensity of agriculture - like in the Baltic
countries - this increase would be rather limited.
Key words: greening, sustainability of agriculture, Common Agricultural Policy reform,
CAPRI model
Introduction
The European Commission (EC) proposal for the reform of the CAP (Common
Agricultural Policy) after 2013 (EC, 2013) focused more on sustainability and the
environmental performance of agriculture than any former reform in the history. There are at
least three reasons behind it. Firstly, the problems around the CAP such as budgetary
instability and incompliance with World Trade Organization (WTO) rules have been rather
successfully resolved already within the earlier reforms so new goals are justified. Secondly,
there is a growing societal recognition of environmental externalities caused by agriculture
whereas environmental goals set by the European Commission such as preventing bio-
diversity loss are unlikely to be met. Thirdly, there is a wide-spread critique that the CAP
direct payments are not well targeted (Ferrer and Kaditi, 2008). Hence, the EC proposed
replacing existing direct payments under Pillar 1 with a basic payment topped up by an
additional payment conditional on farmers respecting certain “agricultural practices beneficial
for the climate and the environment” financed from 30% of the national Pillar 1 envelope
(EC, 2013).
The post 2013 CAP reform introduced three mandatory ‘greening’ activities
which have to be implemented at farm level: permanent grassland, crop diversification, and
ecological focus areas (EC, 2013). The requirements related to them are as follows:
i) permanent grassland (PG): Member States shall designate permanent grasslands
that are environmentally sensitive and that need strict protection including in peat
and wetlands. The ratio of the land under permanent grassland in relation to the
total agricultural area declared by the farmers may be reduced but not more than
5% compared to a reference ratio to be established in 2015.
ii) crop diversification: if arable land of the farmer covers between 10 and 30
hectares there shall be at least two different crops on that arable land and the main
crop shall not cover more than 75% of that land. For more than 30 hectares there
shall be at least three different crops and the main crop shall not cover more than
75% of that arable land and the two main crops together shall not cover more than
95%. Farms up to 10 ha are exempted.
iii) ecological focus areas (EFA): areas equivalent to at least 5% (after 2016 increase to
7% will be considered) of a farmer’s arable land is used for ecological purposes. Habitats and

2
features that would be eligible to fulfil the EFA requirement may include: fallow land,
terraces, landscape features, buffer strips, and areas afforested under Pillar 2.
The improvement in environmentally friendly agriculture could potentially also
help in fulfilment of a Baltic Sea Action Plan (BSAP) adopted by Helsinki Commission
(HELCOM) by all the coastal countries of the Baltic Sea and by the European Community in
November 2007 (HELCOM, 2007). The novelty of the BSAP approach is the focus on the
Baltic ecosystem instead of addressing only the pollution sources, on sector-by–sector bases.
However in literature addressing abatement of nutrient load to the Baltic Sea several measures
regarding agricultural practices are proposed as economically justified (Wulff, at al. 2014).
The main objective of this paper is to present a quantitative assessment, based
on a partial equilibrium model CAPRI1 - of both the economic and environmental
consequences of the new ‘greening’ measures in mid-term perspective of the year 2020. Thus
it contributes to the answer on a question if “greening” of CAP would bring environmental
benefits in the Baltic Sea countries2 which aim to comply with BSAP commitments and if so,
who would be the winners and losers. It involves a comparison of a baseline scenario - the
continuation of the current CAP - with a ‘greening’ scenario - featuring the requirements of
the post 2013 CAP reform. The paper adds to the existing literature on assessing effectiveness
of the policy measures which aim to reduce pressures from agriculture on the environment. It
is also related to issues of the sustainable development of agriculture, trade-offs between
economic and environmental interests, global warming, within the framework of the
environmental and economic impact of the post 2013 CAP reform.
The paper is structured as follows. The following section provides a brief
literature review on potential environmental and economic impact of CAP reform after 2013.
Next is a section on the methods used in the study, including the model specification,
selection of economic and environmental indicators for interpretation and defined scenarios.
The third section presents the results of the impact on agricultural land use, agricultural
production, prices, yields, nutrient surpluses, global warming potential, welfare, tax payers
costs, and other. In the final section conclusions are formulated.
Literature on post 2013 CAP reform
There is a lack of ex-ante studies analysing the environmental and economic
impacts of European Union post 2013 CAP reform, drafted the first time in October 2011
(EC, 2011a). Studies by Helming and Terluin (2011) and Van Zeijts, et al. (2011) indicated
that the reform would largely improve agricultural incomes in the new Member States, while
in the EU15 they would remain almost unchanged. The combination of direct payments and
environmental requirements would improve incomes in regions dominated by extensive
agricultural production, for example with permanent pasture systems, and will worsen results
in regions dominated by intensive agricultural production.
A study by Westhoek, et al. (2011) analysed the impact of the greening of the
CAP on the environment alone and concluded that the introduction of the obligation to
diversify cropping patterns would not have a significant impact on improving the quality of
the natural environment due to the fact that, according to the estimates, the need to comply
1 CAPRI (Common Agricultural Policy Regionalised Impact) model is an economic partial comparative static equilibrium
model for agriculture, which suits for ex-ante impact assessment of agricultural and international trade policies with a focus
on the European Union. It is described in Wikipedia and also has its own website: http://www.capri-model.org 2 Germany, however being a Baltic riparian country, has been omitted as its area of the country belonging to the Baltic
watershed is marginal.

3
with this requirement applies only to 2% of the arable area in the EU. According to these
authors, only the introduction of EFA as a kind of compulsory set-asides can help to increase
crop diversity, what might commit to biodiversity increase and reduce greenhouse gas
emissions in the EU, while increasing emissions outside the EU. These findings on the impact
of the 'greening' the CAP with regard to the crop diversification measures are also supported
by other studies, for example by Czekaj, Majewski and Wąs (2011).
For Poland, the impact of ‘greening’ was analysed with the use of a linear farm
optimisation model based on a sample of Polish farms selected from the FADN (Farm
Accountancy Data Network) – see Wąs, et al. (2012). The three requirements of greening
based on EC proposal (EC, 2011a) were investigated individually and jointly. Various types
of farms were defined according to the level of compliance with greening criteria related to
cropping structure. The results show that greening of the CAP leads to changes in the
cropping structure especially in monoculture and duo-culture farms. The required
diversification of the cropping structure and obligatory according to European Commission
proposition of ecological focus area (EFA) resulted in a decline of farm incomes by 3.8% on
average. Much greater losses of income are in monoculture farms with high quality soils
compared to a baseline scenario which assumes the continuation of the current CAP (Wąs, et
al. 2012).
Methodology – CAPRI model
The CAPRI model is a global comparative-static partial equilibrium model
with a strong focus on Europe, consisting of a supply and a market module (Britz and Witzke,
2012). The former covers EU27 countries plus Norway, Turkey and Western Balkans -
comprises independent aggregate non-linear programming models representing approximately
50 crop and animal activities of all farmers, in the version applied in this study it is for 280
administrative units at a regional level (NUTS II3). Each programming model maximises
regional agricultural income at given prices, subject to technical constraints for feeding,
young animal trade, fertiliser use, set-aside, a land supply curve and production quotas. For
the EU, the different coupled and de-coupled subsidies of Pillar 1 of the CAP, as well as
major ones from Pillar 2 – such as Less Favoured Area support, agri-environmental measures,
Natura 2000 support - are depicted there in details.
Prices for agricultural outputs in the programming models are rendered
endogenous based on sequential calibration (Britz, 2008) between the supply models and a
market model. The latter is a global spatial multi-commodity model covering 77 countries or
country aggregates in 40 trade blocks and about 50 agricultural and important first stage
processing products (vegetable cakes and oils, dairy, bio fuels). According to the concept of
the supply balance sheets of FAO (Food and Agriculture Organization of the United Nations),
market balances and trade flows are expressed in raw product equivalents and thus encompass
also processed products. The Armington approach adopted means that the products are
differentiated by origin, allowing the simulation of bilateral trade flows and related bilateral
as well as multilateral trade instruments (Armington, 1969). Trade instruments are not
expressed as ad-valorem equivalents, but as close as possible to the actual implementation, i.e.
there are ad-valorem, specific and compound tariffs and minimum import price regimes. The
model allows for the simultaneous presence of bi-lateral and multi-lateral tariff-rate quotas.
The behavioural equations are based on flexible functional forms and their parameterization
ensures regularity, which also allows for welfare analysis of the partial equilibrium changes.
3 NUTS - Nomenclature of territorial units for statistics: http://ec.europa.eu/eurostat/ramon/nuts/basicnuts_regions_en.html
4
CAPRI has been widely used for the analysis of the reforms of the Common Agricultural
Policy of the EU as well as of bi-lateral and multi-lateral trade liberalisation4.
In the current study, the baseline captures developments in exogenous variables
such as policy changes, population growth, Gross Domestic Product (GDP) growth and
agricultural market development for the year 2020. It is aligned with the global Aglink-
COSIMO baseline prepared by OECD (Organisation for Economic Co-operation and
Development) and FAO and thus includes the expected effects of bio fuel policies in OECD
and other countries (OECD/FAO, 2011). Specifically, it integrates simulation results from the
PRIMES energy model for the bio-fuel sector (Capros, et al. 2010). The baseline assumes a
status-quo policy, with current policies remaining in force while taking into account those
future changes that are already agreed and scheduled in the legislation. It therefore covers the
CAP Mid-Term Review, the reforms of the sugar markets, and the CAP Health Check, which
means further decoupling of direct payments, no set-aside obligation, increased modulation
phased in gradually by 2012 and milk quota phased out gradually in 20155.
Implementation of the ‘greening’ measures in the CAPRI model
In the framework of the CAPRI model the permanent grassland area to
maintain was set as a weighted average of 2003-2005 base years and of the 2020 baseline,
assuming that it would reflect approximately the current areas of permanent grasslands.
For the crop diversity measure, an analysis of single farm records from Farm
Accountancy Data Network (FADN) provided the basis to calculate changes in the Shannon
index. Crop diversity measure imposes land use constraints at farm level and is subject to
severe aggregation bias if regional or country level model and data are used for simulation
purposes. To avoid this problem, single farm FADN records for 2008 were linked with
CAPRI farm types through the Shannon diversity index. The link between the FADN and
CAPRI was done in two steps. In the first step, a land optimisation model was run for each
FADN farm unit to simulate the effect of the crop diversity constraints. The objective function
of the optimization model represented the minimization of the square difference between the
actual arable crop area and the simulated area subject to crop diversity constraints (i.e.
minimum 3 crops requirement, 70% upper threshold and 5% lower threshold share of arable
crops on total arable land) and land endowment constraint. Then, the Shannon index was
calculated for both actual land use data and simulated results. The Shannon index was
calculated for CAPRI farm types. The difference between the actual and the simulated values
of the Shannon index represents the land allocation adjustments that a farm need to undertake
to fulfil the crop diversity requirements. In the second step, the difference between the actual
and the simulated Shannon index obtained in the first step was introduced as a land use
constraint in the farm type module in CAPRI. For each farm type in CAPRI, crop diversity
measure is introduced as an adjustment of the arable crop area represented through the
simulated Shannon index relative to the baseline level of the Shannon index.
As for the ecological set-aside, the greening proposal of the European
Commission indicates 5% of land to be designated for ecological purposes. This measure
could include fallow land, buffer strips and landscape features and also set-aside areas. In the
GREEN scenario for CAPRI it is assumed that farmers are required to allocate at least 5% of
arable land, excluding permanent pasture, to ecological use.
4 See CAPRI homepage: www.capri-model.org 5 Our reference point differs from the standard CAPRI baseline due to removing feedstock demand in Germany for biogas
production.
5
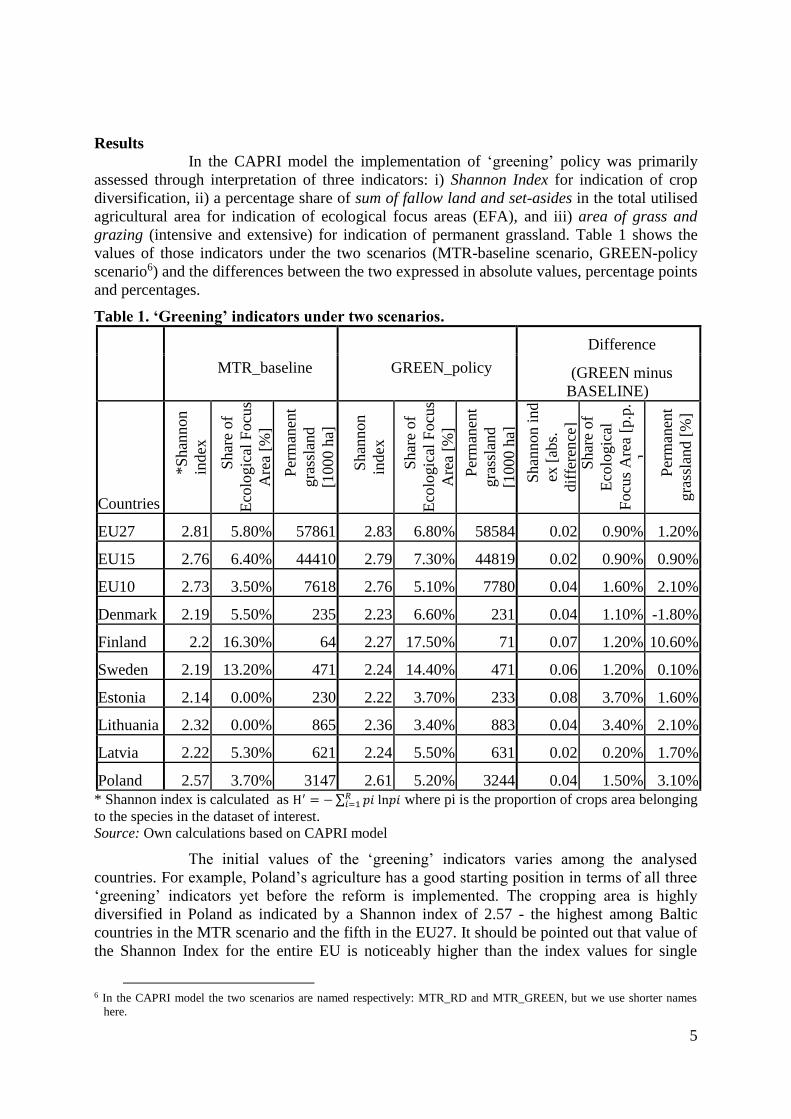
Results
In the CAPRI model the implementation of ‘greening’ policy was primarily
assessed through interpretation of three indicators: i) Shannon Index for indication of crop
diversification, ii) a percentage share of sum of fallow land and set-asides in the total utilised
agricultural area for indication of ecological focus areas (EFA), and iii) area of grass and
grazing (intensive and extensive) for indication of permanent grassland. Table 1 shows the
values of those indicators under the two scenarios (MTR-baseline scenario, GREEN-policy
scenario6) and the differences between the two expressed in absolute values, percentage points
and percentages.
Table 1. ‘Greening’ indicators under two scenarios.
MTR_baseline GREEN_policy
Difference
(GREEN minus
BASELINE)
Countries
*S
han
non
index
Shar
e of
Eco
logic
al F
ocu
s
Are
a [%
]
Per
man
ent
gra
ssla
nd
[1000 h
a]
Shan
non
index
Shar
e of
Eco
logic
al F
ocu
s
Are
a [%
]
Per
man
ent
gra
ssla
nd
[1000 h
a]
Shan
non
ind
ex [
abs.
dif
fere
nce
] S
har
e of
Eco
logic
al
Focu
s A
rea
[p.p
.
]
Per
man
ent
gra
ssla
nd [
%]
EU27 2.81 5.80% 57861 2.83 6.80% 58584 0.02 0.90% 1.20%
EU15 2.76 6.40% 44410 2.79 7.30% 44819 0.02 0.90% 0.90%
EU10 2.73 3.50% 7618 2.76 5.10% 7780 0.04 1.60% 2.10%
Denmark 2.19 5.50% 235 2.23 6.60% 231 0.04 1.10% -1.80%
Finland 2.2 16.30% 64 2.27 17.50% 71 0.07 1.20% 10.60%
Sweden 2.19 13.20% 471 2.24 14.40% 471 0.06 1.20% 0.10%
Estonia 2.14 0.00% 230 2.22 3.70% 233 0.08 3.70% 1.60%
Lithuania 2.32 0.00% 865 2.36 3.40% 883 0.04 3.40% 2.10%
Latvia 2.22 5.30% 621 2.24 5.50% 631 0.02 0.20% 1.70%
Poland 2.57 3.70% 3147 2.61 5.20% 3244 0.04 1.50% 3.10%
* Shannon index is calculated as H′ = − ∑ 𝑝𝑖 ln𝑝𝑖𝑅𝑖=1 where pi is the proportion of crops area belonging
to the species in the dataset of interest.
Source: Own calculations based on CAPRI model
The initial values of the ‘greening’ indicators varies among the analysed
countries. For example, Poland’s agriculture has a good starting position in terms of all three
‘greening’ indicators yet before the reform is implemented. The cropping area is highly
diversified in Poland as indicated by a Shannon index of 2.57 - the highest among Baltic
countries in the MTR scenario and the fifth in the EU27. It should be pointed out that value of
the Shannon Index for the entire EU is noticeably higher than the index values for single
6 In the CAPRI model the two scenarios are named respectively: MTR_RD and MTR_GREEN, but we use shorter names
here.
6
countries. This is because on a larger geographical area a higher number of different species is
cultivated which results in a lower shares of individual crops. Thus the values for big
aggregates EU27, EU15 and EU10 should not be directly compared with country level results.
The differences between the Baltic countries and the EU averages can be
explained by severe climatic conditions in Northern Europe, which limit the number of
available crops, and also by a relatively high level of specialisation and concentration on
farms in Denmark and Southern Sweden.
The share of EFA is highly diverse among the analysed countries. On average
there is more EFA in the EU 15, than in the EU 10, where agriculture is less intensive. The
main reason is large areas in Sweden and Finland, where the EFA share is much higher than
required. This could be related to worse climatic conditions and thus limited possibilities for
efficient crop growing on all agricultural lands. In Denmark the EFA share is slightly below
the EU15 average, whilst in Poland the share of EFA is above the EU10 average. In general,
in the case of the Baltic watershed, it should be noted that EFA share is higher in northern
countries.
The introduction of the GREEN scenario induces rather modest changes in the
Shannon index, however for the Baltic countries they are larger than for the entire EU. For
Poland it is at the level of the EU10 average (0.04) while the biggest changes are in Estonia
(0.08) and Finland (0.07). Nevertheless it has to be noted, that these are high aggregates - at a
country level. Looking at individual farm levels the observed changes are certainly larger. For
example, in Poland, which has the highest Shannon index among the analysed countries, it is
estimated based on Polish FADN that still about 9 per cent of Polish farms do not fulfil the
criteria for diversification.
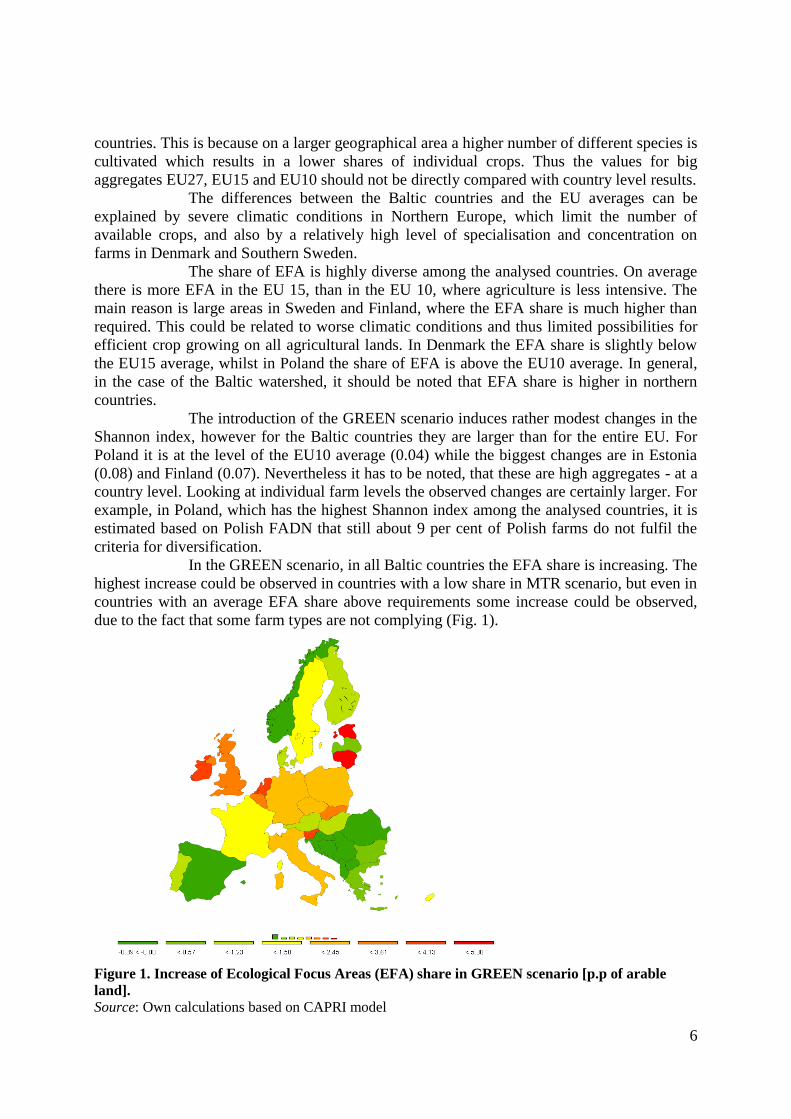
In the GREEN scenario, in all Baltic countries the EFA share is increasing. The
highest increase could be observed in countries with a low share in MTR scenario, but even in
countries with an average EFA share above requirements some increase could be observed,
due to the fact that some farm types are not complying (Fig. 1).
Figure 1. Increase of Ecological Focus Areas (EFA) share in GREEN scenario [p.p of arable
land]. Source: Own calculations based on CAPRI model
7
In the most of the Baltic countries a modest increase of permanent grassland
area could be observed. The growth of grasslands area in Poland, Lithuania, Latvia and
Estonia is twice higher than EU average. The only Baltic country with decreasing permanent
grasslands is Denmark. Swedish grasslands remains at the same level, while in Finland a
relatively high increase of grasslands area would be observed, due to a very low initial level.
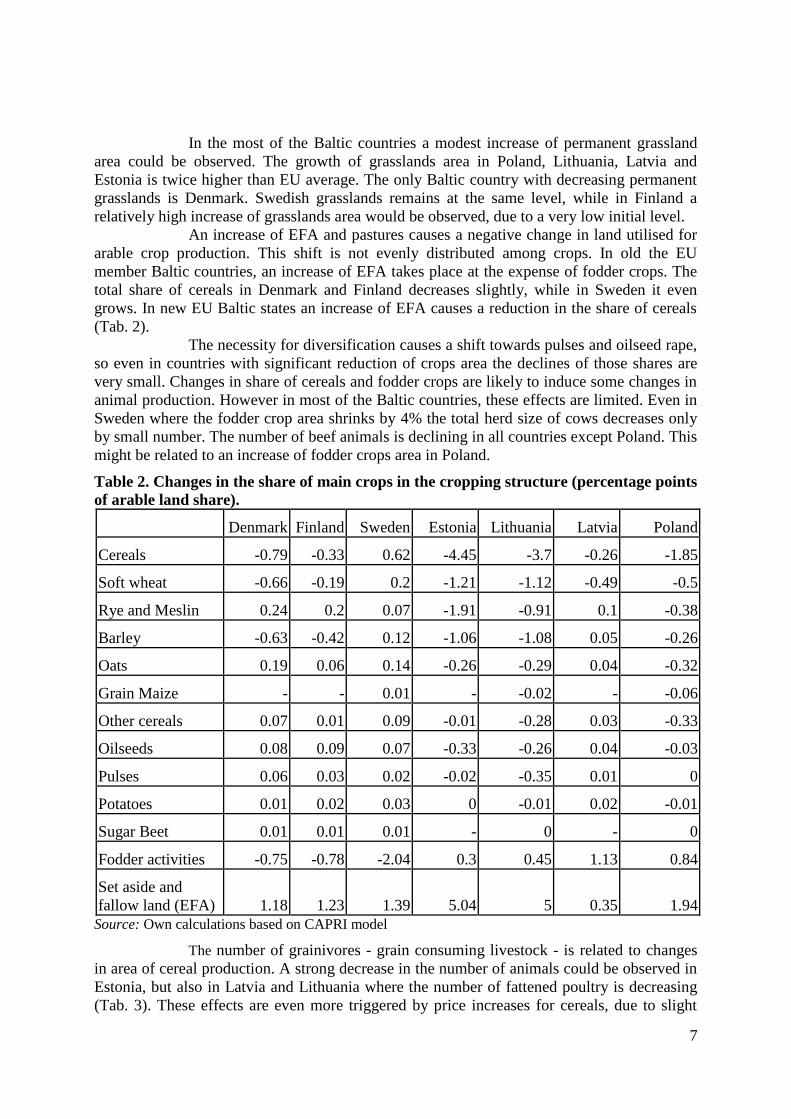
An increase of EFA and pastures causes a negative change in land utilised for
arable crop production. This shift is not evenly distributed among crops. In old the EU
member Baltic countries, an increase of EFA takes place at the expense of fodder crops. The
total share of cereals in Denmark and Finland decreases slightly, while in Sweden it even
grows. In new EU Baltic states an increase of EFA causes a reduction in the share of cereals
(Tab. 2).
The necessity for diversification causes a shift towards pulses and oilseed rape,
so even in countries with significant reduction of crops area the declines of those shares are
very small. Changes in share of cereals and fodder crops are likely to induce some changes in
animal production. However in most of the Baltic countries, these effects are limited. Even in
Sweden where the fodder crop area shrinks by 4% the total herd size of cows decreases only
by small number. The number of beef animals is declining in all countries except Poland. This
might be related to an increase of fodder crops area in Poland.
Table 2. Changes in the share of main crops in the cropping structure (percentage points
of arable land share).
Denmark Finland Sweden Estonia Lithuania Latvia Poland
Cereals -0.79 -0.33 0.62 -4.45 -3.7 -0.26 -1.85
Soft wheat -0.66 -0.19 0.2 -1.21 -1.12 -0.49 -0.5
Rye and Meslin 0.24 0.2 0.07 -1.91 -0.91 0.1 -0.38
Barley -0.63 -0.42 0.12 -1.06 -1.08 0.05 -0.26
Oats 0.19 0.06 0.14 -0.26 -0.29 0.04 -0.32
Grain Maize - - 0.01 - -0.02 - -0.06
Other cereals 0.07 0.01 0.09 -0.01 -0.28 0.03 -0.33
Oilseeds 0.08 0.09 0.07 -0.33 -0.26 0.04 -0.03
Pulses 0.06 0.03 0.02 -0.02 -0.35 0.01 0
Potatoes 0.01 0.02 0.03 0 -0.01 0.02 -0.01
Sugar Beet 0.01 0.01 0.01 - 0 - 0
Fodder activities -0.75 -0.78 -2.04 0.3 0.45 1.13 0.84
Set aside and
fallow land (EFA) 1.18 1.23 1.39 5.04 5 0.35 1.94
Source: Own calculations based on CAPRI model
The number of grainivores - grain consuming livestock - is related to changes
in area of cereal production. A strong decrease in the number of animals could be observed in
Estonia, but also in Latvia and Lithuania where the number of fattened poultry is decreasing
(Tab. 3). These effects are even more triggered by price increases for cereals, due to slight
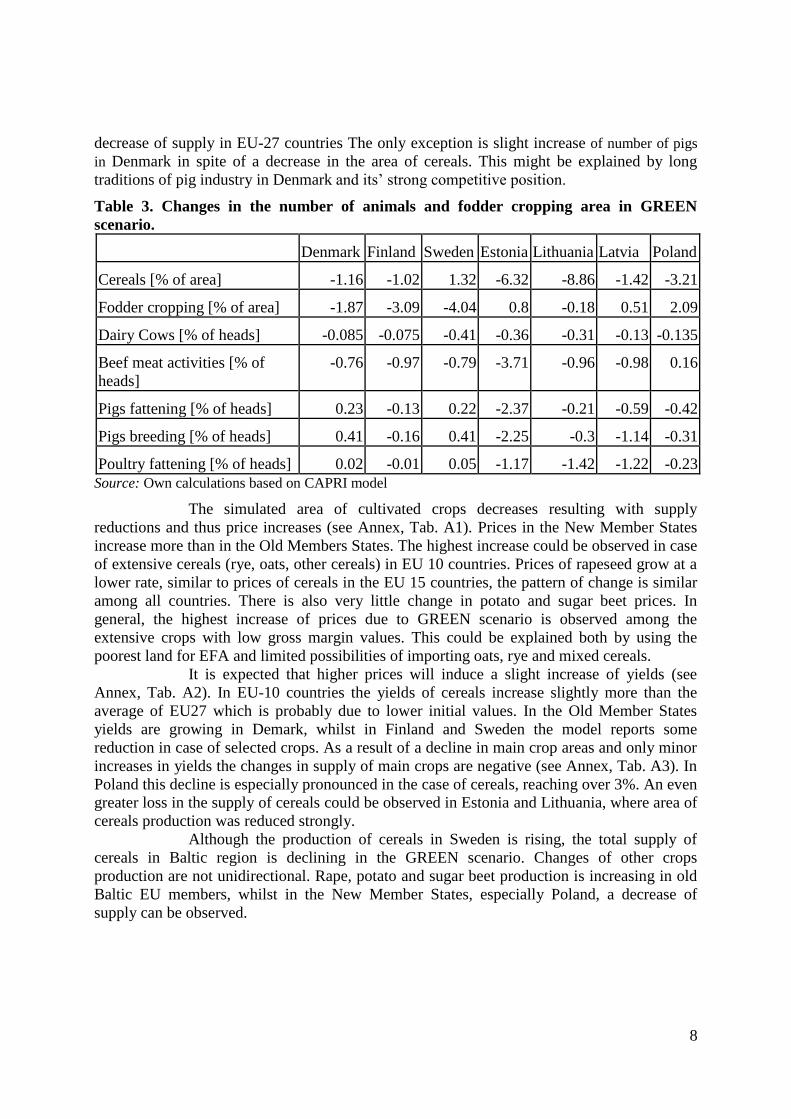
8
decrease of supply in EU-27 countries The only exception is slight increase of number of pigs
in Denmark in spite of a decrease in the area of cereals. This might be explained by long
traditions of pig industry in Denmark and its’ strong competitive position.
Table 3. Changes in the number of animals and fodder cropping area in GREEN
scenario.
Denmark Finland Sweden Estonia Lithuania Latvia Poland
Cereals [% of area] -1.16 -1.02 1.32 -6.32 -8.86 -1.42 -3.21
Fodder cropping [% of area] -1.87 -3.09 -4.04 0.8 -0.18 0.51 2.09
Dairy Cows [% of heads] -0.085 -0.075 -0.41 -0.36 -0.31 -0.13 -0.135
Beef meat activities [% of
heads]
-0.76 -0.97 -0.79 -3.71 -0.96 -0.98 0.16
Pigs fattening [% of heads] 0.23 -0.13 0.22 -2.37 -0.21 -0.59 -0.42
Pigs breeding [% of heads] 0.41 -0.16 0.41 -2.25 -0.3 -1.14 -0.31
Poultry fattening [% of heads] 0.02 -0.01 0.05 -1.17 -1.42 -1.22 -0.23
Source: Own calculations based on CAPRI model
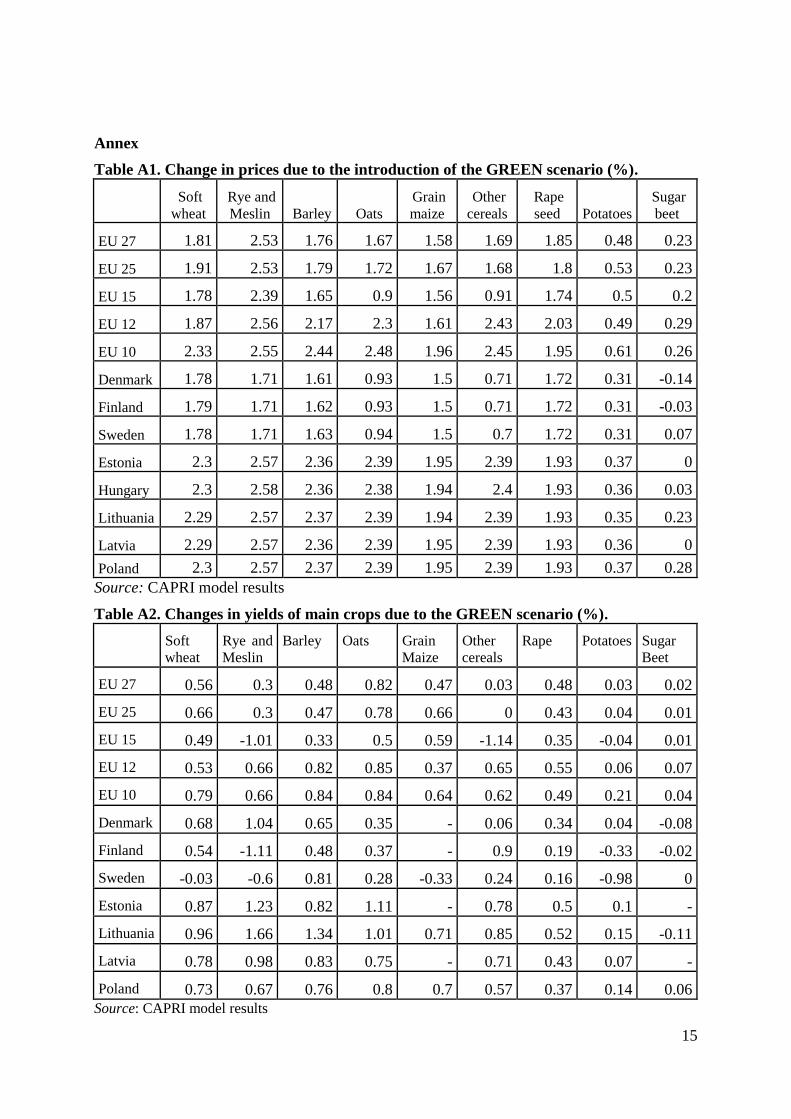
The simulated area of cultivated crops decreases resulting with supply
reductions and thus price increases (see Annex, Tab. A1). Prices in the New Member States
increase more than in the Old Members States. The highest increase could be observed in case
of extensive cereals (rye, oats, other cereals) in EU 10 countries. Prices of rapeseed grow at a
lower rate, similar to prices of cereals in the EU 15 countries, the pattern of change is similar
among all countries. There is also very little change in potato and sugar beet prices. In
general, the highest increase of prices due to GREEN scenario is observed among the
extensive crops with low gross margin values. This could be explained both by using the
poorest land for EFA and limited possibilities of importing oats, rye and mixed cereals.
It is expected that higher prices will induce a slight increase of yields (see
Annex, Tab. A2). In EU-10 countries the yields of cereals increase slightly more than the
average of EU27 which is probably due to lower initial values. In the Old Member States
yields are growing in Demark, whilst in Finland and Sweden the model reports some
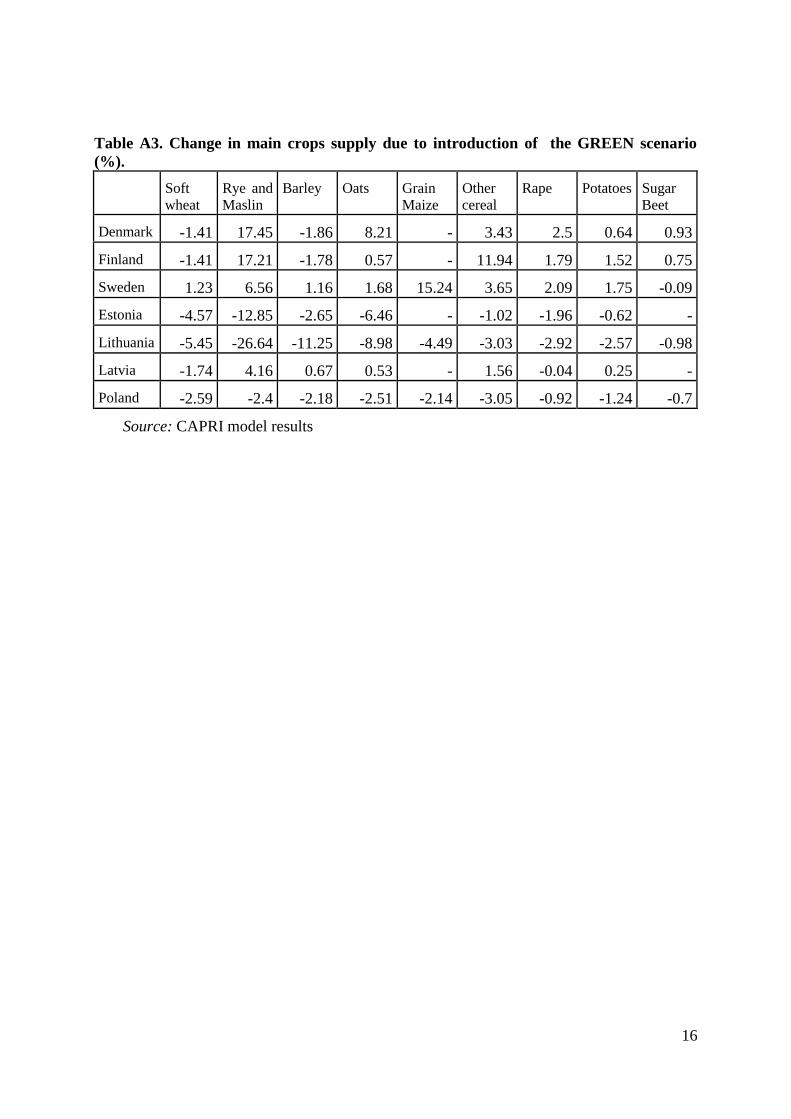
reduction in case of selected crops. As a result of a decline in main crop areas and only minor
increases in yields the changes in supply of main crops are negative (see Annex, Tab. A3). In
Poland this decline is especially pronounced in the case of cereals, reaching over 3%. An even
greater loss in the supply of cereals could be observed in Estonia and Lithuania, where area of
cereals production was reduced strongly.
Although the production of cereals in Sweden is rising, the total supply of
cereals in Baltic region is declining in the GREEN scenario. Changes of other crops
production are not unidirectional. Rape, potato and sugar beet production is increasing in old
Baltic EU members, whilst in the New Member States, especially Poland, a decrease of
supply can be observed.
9
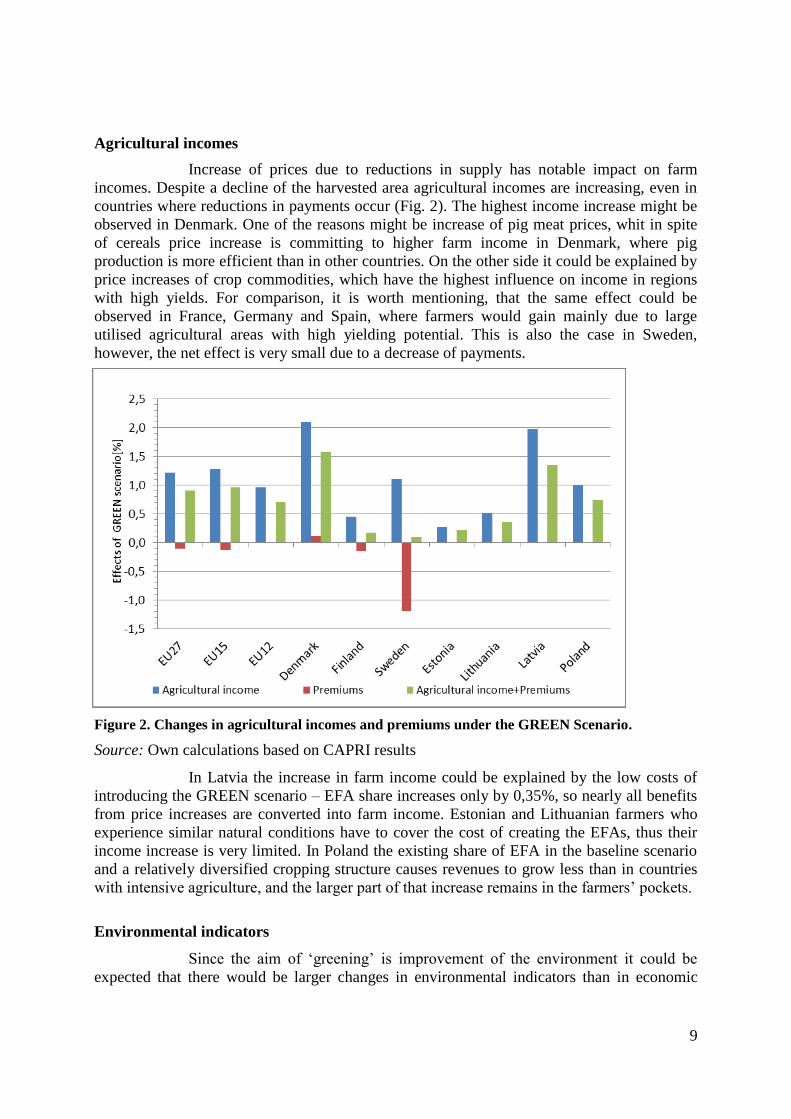
Agricultural incomes
Increase of prices due to reductions in supply has notable impact on farm
incomes. Despite a decline of the harvested area agricultural incomes are increasing, even in
countries where reductions in payments occur (Fig. 2). The highest income increase might be
observed in Denmark. One of the reasons might be increase of pig meat prices, whit in spite
of cereals price increase is committing to higher farm income in Denmark, where pig
production is more efficient than in other countries. On the other side it could be explained by
price increases of crop commodities, which have the highest influence on income in regions
with high yields. For comparison, it is worth mentioning, that the same effect could be
observed in France, Germany and Spain, where farmers would gain mainly due to large
utilised agricultural areas with high yielding potential. This is also the case in Sweden,
however, the net effect is very small due to a decrease of payments.
Figure 2. Changes in agricultural incomes and premiums under the GREEN Scenario.
Source: Own calculations based on CAPRI results
In Latvia the increase in farm income could be explained by the low costs of
introducing the GREEN scenario – EFA share increases only by 0,35%, so nearly all benefits
from price increases are converted into farm income. Estonian and Lithuanian farmers who
experience similar natural conditions have to cover the cost of creating the EFAs, thus their
income increase is very limited. In Poland the existing share of EFA in the baseline scenario
and a relatively diversified cropping structure causes revenues to grow less than in countries
with intensive agriculture, and the larger part of that increase remains in the farmers’ pockets.
Environmental indicators
Since the aim of ‘greening’ is improvement of the environment it could be
expected that there would be larger changes in environmental indicators than in economic
10
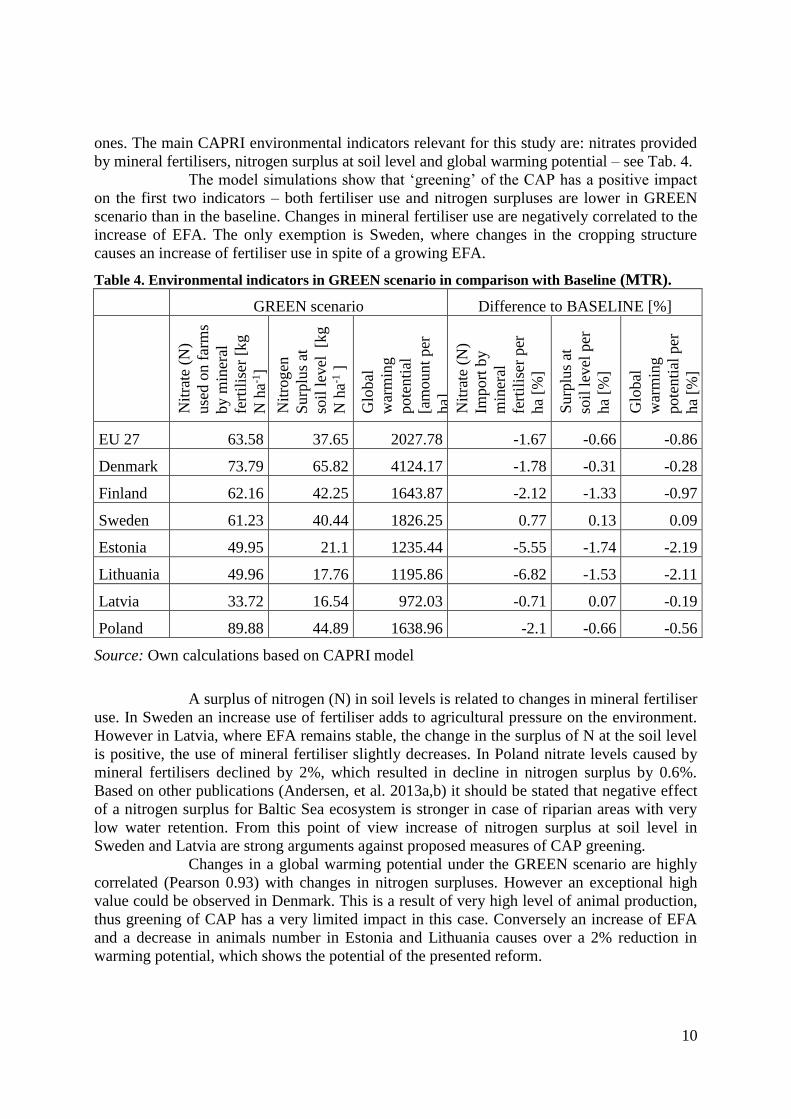
ones. The main CAPRI environmental indicators relevant for this study are: nitrates provided
by mineral fertilisers, nitrogen surplus at soil level and global warming potential – see Tab. 4.
The model simulations show that ‘greening’ of the CAP has a positive impact
on the first two indicators – both fertiliser use and nitrogen surpluses are lower in GREEN
scenario than in the baseline. Changes in mineral fertiliser use are negatively correlated to the
increase of EFA. The only exemption is Sweden, where changes in the cropping structure
causes an increase of fertiliser use in spite of a growing EFA.
Table 4. Environmental indicators in GREEN scenario in comparison with Baseline (MTR).
GREEN scenario Difference to BASELINE [%]
Nit
rate
(N
)
use
d o
n f
arm
s
by m
iner
al
fert
ilis
er [
kg
N h
a-1]
Nit
rogen
Surp
lus
at
soil
lev
el [k
g
N h
a-1 ]
Glo
bal
war
min
g
pote
nti
al
[am
ount
per
ha]
Nit
rate
(N
)
Import
by
min
eral
fert
ilis
er p
er
ha
[%]
Surp
lus
at
soil
lev
el p
er
ha
[%]
Glo
bal
war
min
g
pote
nti
al p
er
ha
[%]
EU 27 63.58 37.65 2027.78 -1.67 -0.66 -0.86
Denmark 73.79 65.82 4124.17 -1.78 -0.31 -0.28
Finland 62.16 42.25 1643.87 -2.12 -1.33 -0.97
Sweden 61.23 40.44 1826.25 0.77 0.13 0.09
Estonia 49.95 21.1 1235.44 -5.55 -1.74 -2.19
Lithuania 49.96 17.76 1195.86 -6.82 -1.53 -2.11
Latvia 33.72 16.54 972.03 -0.71 0.07 -0.19
Poland 89.88 44.89 1638.96 -2.1 -0.66 -0.56
Source: Own calculations based on CAPRI model
A surplus of nitrogen (N) in soil levels is related to changes in mineral fertiliser
use. In Sweden an increase use of fertiliser adds to agricultural pressure on the environment.
However in Latvia, where EFA remains stable, the change in the surplus of N at the soil level
is positive, the use of mineral fertiliser slightly decreases. In Poland nitrate levels caused by
mineral fertilisers declined by 2%, which resulted in decline in nitrogen surplus by 0.6%.
Based on other publications (Andersen, et al. 2013a,b) it should be stated that negative effect
of a nitrogen surplus for Baltic Sea ecosystem is stronger in case of riparian areas with very
low water retention. From this point of view increase of nitrogen surplus at soil level in
Sweden and Latvia are strong arguments against proposed measures of CAP greening.
Changes in a global warming potential under the GREEN scenario are highly
correlated (Pearson 0.93) with changes in nitrogen surpluses. However an exceptional high
value could be observed in Denmark. This is a result of very high level of animal production,
thus greening of CAP has a very limited impact in this case. Conversely an increase of EFA
and a decrease in animals number in Estonia and Lithuania causes over a 2% reduction in
warming potential, which shows the potential of the presented reform.
11
Welfare
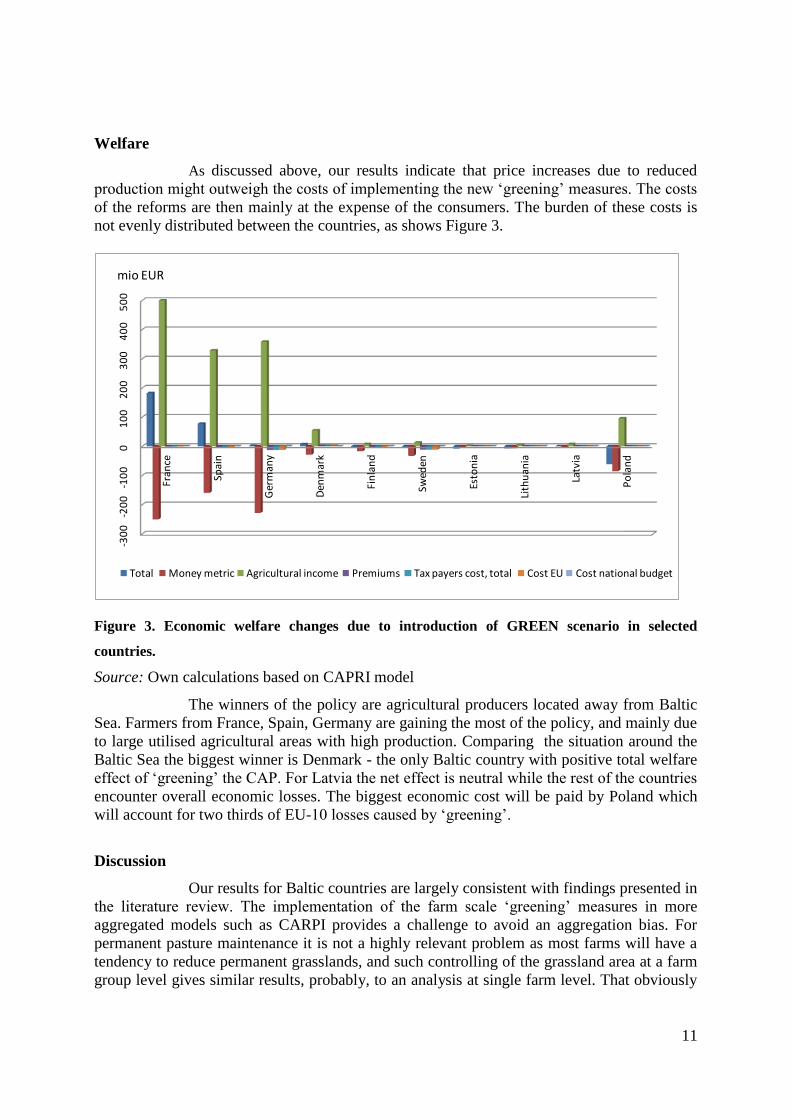
As discussed above, our results indicate that price increases due to reduced
production might outweigh the costs of implementing the new ‘greening’ measures. The costs
of the reforms are then mainly at the expense of the consumers. The burden of these costs is
not evenly distributed between the countries, as shows Figure 3.
Figure 3. Economic welfare changes due to introduction of GREEN scenario in selected
countries.
Source: Own calculations based on CAPRI model
The winners of the policy are agricultural producers located away from Baltic
Sea. Farmers from France, Spain, Germany are gaining the most of the policy, and mainly due
to large utilised agricultural areas with high production. Comparing the situation around the
Baltic Sea the biggest winner is Denmark - the only Baltic country with positive total welfare
effect of ‘greening’ the CAP. For Latvia the net effect is neutral while the rest of the countries
encounter overall economic losses. The biggest economic cost will be paid by Poland which
will account for two thirds of EU-10 losses caused by ‘greening’.
Discussion
Our results for Baltic countries are largely consistent with findings presented in
the literature review. The implementation of the farm scale ‘greening’ measures in more
aggregated models such as CARPI provides a challenge to avoid an aggregation bias. For
permanent pasture maintenance it is not a highly relevant problem as most farms will have a
tendency to reduce permanent grasslands, and such controlling of the grassland area at a farm
group level gives similar results, probably, to an analysis at single farm level. That obviously
-30
0-2
00
-10
00
10
02
00
30
04
00
50
0
Fran
ce
Spai
n
Ger
man
y
Den
mar
k
Fin
lan
d
Swed
en
Esto
nia
Lith
uan
ia
Latv
ia
Po
lan
d
mio EUR
Total Money metric Agricultural income Premiums Tax payers cost, total Cost EU Cost national budget

12
does not hold for the crop diversification measure in which we used an indirect measure via
the Shannon index derived from single farm records, these give more indicative results.
The highest level of uncertainty is linked to the EFA requirement, especially if
farmers would be allowed to update their entitlement to include existing landscape elements
such as hedge rows, rivers or streams or lines of trees. There is no data at EU level available
to quantify how much existing EFA area could be declared by farmers. This forces us to
assume that farmers would need to fallow existing arable land. Especially in regions with
fragmented landscapes and small plots, we would certainly overestimate the impact of the
measure if entitlement would be updated. Thus, our findings delineate rather the maximum
effect of that measure on production, prices, welfare and the analysed environmental
indicators. Generally it can be concluded that the ‘greening’ measures will to a certain extent
only prevent a further degradation of environmental status, especially in more extensive
regions were enough EFA elements could be included in the area eligible for the Single Farm
Payment.
The study is unable to analyse the global leakage effects on bio-diversity if
arable lands in the riparian Baltic countries decreased. There are also some, limited price
increases simulated for world markets which trigger moderate supply responses both at the
extensive margin, i.e. an increase in cropped land and thus possibly reduction in managed
forest or natural vegetation and at the intensive margin. This will certainly be to the detriment
of bio-diversity in non-EU regions.
Conclusions
The main effect of greening at EU level compared to a continuation of current
CAP measures is a reduction of arable lands, both due to an increase of fallowing land to
fulfil the EFA requirements, and sharper control of grassland conversion. The arable area
reduction decreases crop supply, which in turn increases prices in EU markets. The latter
leads to limited intensification effects seen by very moderate yield increases. Due to limited
import substitution with domestic sales (due to the still high border protection of the EU in
some key markets and the relatively inelastic demand for agricultural products, the price
increase offsets the negative effects of reduced output for farmers such that in most regions
agricultural income increases. This consequently means that the costs of the regulatory
instruments are to a large extent carried by the final consumer in form of a higher food bill.
However, compared to total consumer spending, the effect is very limited. Greening can
therefore be understood as a type of supply control measure working across all agricultural
sectors.
The results for the EU are adequate also for most of the Baltic countries.
However due to less intensive agricultural production benefits from prices increase are lower
than in other European countries. On the other hand, the cost of greening is seen to be
transferred to those countries based on the number of consumers experiencing higher prices.
There are a number of general conclusions for most of Baltic countries.
‘Greening’ measures reduce the main crops area which, despite a slight increase in yields, will
cause the decline in production and increase in prices of agricultural products. The price
increase is greater than the decrease in yields which, combined with a slight decrease in the
production inputs, increases the income generated by the farm sector.
Agricultural price increase causes a loss to the consumers, but the relative
change of 0.02% in their welfare may not be noticed by them. The scenario is in the most
countries virtually neutral for taxpayers. Key environmental indicators show some

13
improvement of the environmental status. Although ‘greening’ of the policy helps to some
extent in lowering the pressure stemming from farming onto environment, due to the
reduction in the main crop areas and hence a lower input use (such as fertilisers). Only in
Sweden it seems to induce a number of opposite effects, which is not favourable for Baltic
Sea ecosystem. The magnitude of the impact that ‘greening’ has on bio-diversity is not
straightforwardly measured in CAPRI model so cannot be assessed more comprehensively in
this study.
All in all, it could be concluded that CAP reform has limited impact on EU
agriculture. It is even more limited in countries with relatively extensive agriculture. It is
unlikely that this reform would support realization of the Baltic Sea Action Plan.
References
Andersen, H.E., Farkas, C., Abramenkoe, K., Lagzdinse, A., Thodsen, H. , Smitiene, A.,
Ennet, P. and Smedberg, E. et al. (2013a). Catchment functioning along gradients in climate
and anthropogenic pressure in the Baltic Sea drainage basin. RECOCA Final_Report.
Andersen, H.E., Stålnacke, P., Blicher-Mathiesen, G., Thodsen, H., Smedberg, E., Humborg,
C. and Mörth, C.M. (2013b). Nitrogen retention in river basins in the Baltic Sea drainage
basin (unpublished paper).
Armington, P.S. (1969). A Theory of Demand for Products Distinguished by Place of
Production. International Monetary Fund Staff Papers 16 1: 159–78.
Britz, W. (2008). Automated model linkages: the example of CAPRI. Agrarwirtschaft 57,
Heft 8 :363–367
Britz, W. and Witzke, P. (2012). CAPRI model documentation 2012. Internet resource,
available at: http://www.capri-model.org/docs/capri_documentation.pdf
Britz, W. and Hertel, T.W. (2011). Impacts of EU biofuels directives on global markets and
EU environmental quality: An integrated PE, global CGE analysis. Agriculture, Ecosystems
and Environment, 142 (1-2): 102–109.
Capros, P., Mantzos, L., DeVita, N. Tasios, A. and Kouvaritakis, N. (2010). Trends to 2030 -
update 2009. European Commission-Directorate General for Energy in collaboration with
Climate Action DG and Mobility and Transport DG, August 2010. Office for official
publications of the European Communities, Luxembourg, ISBN 978-92-79-16191-9.
Czekaj, S., Majewski, E. and Wąs, A. (2013). Impacts of Greening of the Common
Agricultural Policy on Financial Results of Cereal Farms in Poland After the Year 2013.
Visegrad Journal on Bioeconomy and Sustainable Development (upcomming).
Czekaj, S., Majewski, E. and Wąs, A. (2011). Koncepcja oszacowania skutków reform
Wspólnej Polityki Rolnej Unii Europejskiej (WPR) w perspektywie budżetowej 2014-2020.
In: Dopłaty bezpośrednie i dotacje budżetowe a finanse oraz funkcjonowanie gospodarstw i
przedsiębiorstw rolniczych, IERiGŻ-PIB, Warszawa.
EC (2011a). Legal proposals for the CAP after 2013 – Agriculture and rural development.
European Commission Proposal of 12 October 2011, Brussels.
14
EC (2011b). Common Agricultural Policy towards 2020 Impact Assessment, Annex 3: Direct
payments. Commission Staff Working Paper SEC(2011) 1153 final/2, DG Agriculture and
Rural Development, Brussels.
EC (2013). Regulation (EU) no 1307/2013 of the European Parliament and of the council of
17 December 2013 establishing rules for direct payments to farmers under support schemes
within the framework of the common agricultural policy and repealing Council Regulation
(EC) No 637/2008 and Council Regulation (EC) No 73/2009, Official Journal of the European
Union, December 2013, Brussels.
Ferrer, J.N. and Kaditi, E. (2008). The EU added value of agricultural expenditure – from
market to multifunctionality – gathering criticism and success stories of the CAP. Report by
Centre for European Policy Studies (CEPS), prepared for the European Parliament under the
following contract number: IP/D/BUDG/CONT/FWF/2006-072/lot 3/C1/SC 3, Brussels.
Helming, J.F.M. and Terluin, I.J. (2011). Scenarios for a CAP beyond 2013. Implications for
EU27 agriculture and the cap budget. Werkdocument 267, LEI Wageningen.
House of Commons (2012). Greening the Common Agricultural Policy. First Report of
Session 2012–13, House of Commons Environment, Food and Rural Affairs Committee,
London: The Stationery Office Limited.
Matthews, A. (2011). Post-2013 EU Common Agricultural Policy, Trade and Development.
A Review of Legislative Proposals. International Centre for Programme on Agricultural Trade
and Sustainable Development (ICTSD), Issue Paper 39:17.
OECD/FAO (2011). OECD-FAO Agricultural Outlook 2011-2020. OECD Publishing and
FAO. http://dx.doi.org/10.1787/agr_outlook-2011-en
Van Zeijts, H., Overmars, K., Van der Bilt, W., Schulp, N., Notenboom, J., Westhoek, H.,
Helming J., Terluin I. and Janssen, S. (2011). Greening the Common Agricultural Policy:
impacts on farmland biodiversity on an EU scale. PBL Netherlands Environmental
Assessment Agency, The Hague.
Wąs, A. (ed.) (2012). Impact of “Greening” of Common Agricultural Policy on Polish Farms.
IERiGZ, Warsaw.
Wulff, F., Humborg, C., Andersen, H.E., Blicher-Mathiesen, G., Czajkowski, M., Elofsson,
K., Fonnesbech-Wulff, A., Hasler, B., Hong, B., Jansons, V., Mörth, C-M., Smart, J.C.R.,
Smedberg, E., Stålnacke, P., Swaney, D.P., Thodsen, H., Was, A., Zylicz, T. (2014).
Reduction of Baltic Sea nutrient inputs and allocation of abatement costs within the Baltic
Sea catchment. AMBIO 43:p11–25.
Westhoek, H., Van Zeijts, H., Witmer, M., Van den Berg, M., Overmars, K., Van der Esch, S.
& Van der Bilt, W. (2012). Greening the CAP. An analysis of the effects of the European
Commission’s proposals for the Common Agricultural Policy 2014-2020. PBL Netherlands
Environmental Assessment Agency.
15
Annex
Table A1. Change in prices due to the introduction of the GREEN scenario (%).
Soft
wheat Rye and
Meslin Barley Oats Grain
maize Other
cereals Rape
seed
Potatoes Sugar
beet
EU 27 1.81 2.53 1.76 1.67 1.58 1.69 1.85 0.48 0.23
EU 25 1.91 2.53 1.79 1.72 1.67 1.68 1.8 0.53 0.23
EU 15 1.78 2.39 1.65 0.9 1.56 0.91 1.74 0.5 0.2
EU 12 1.87 2.56 2.17 2.3 1.61 2.43 2.03 0.49 0.29
EU 10 2.33 2.55 2.44 2.48 1.96 2.45 1.95 0.61 0.26
Denmark 1.78 1.71 1.61 0.93 1.5 0.71 1.72 0.31 -0.14
Finland 1.79 1.71 1.62 0.93 1.5 0.71 1.72 0.31 -0.03
Sweden 1.78 1.71 1.63 0.94 1.5 0.7 1.72 0.31 0.07
Estonia 2.3 2.57 2.36 2.39 1.95 2.39 1.93 0.37 0
Hungary 2.3 2.58 2.36 2.38 1.94 2.4 1.93 0.36 0.03
Lithuania 2.29 2.57 2.37 2.39 1.94 2.39 1.93 0.35 0.23
Latvia 2.29 2.57 2.36 2.39 1.95 2.39 1.93 0.36 0
Poland 2.3 2.57 2.37 2.39 1.95 2.39 1.93 0.37 0.28
Source: CAPRI model results
Table A2. Changes in yields of main crops due to the GREEN scenario (%).
Soft
wheat Rye and
Meslin Barley Oats Grain
Maize Other
cereals Rape Potatoes Sugar
Beet
EU 27 0.56 0.3 0.48 0.82 0.47 0.03 0.48 0.03 0.02
EU 25 0.66 0.3 0.47 0.78 0.66 0 0.43 0.04 0.01
EU 15 0.49 -1.01 0.33 0.5 0.59 -1.14 0.35 -0.04 0.01
EU 12 0.53 0.66 0.82 0.85 0.37 0.65 0.55 0.06 0.07
EU 10 0.79 0.66 0.84 0.84 0.64 0.62 0.49 0.21 0.04
Denmark 0.68 1.04 0.65 0.35 - 0.06 0.34 0.04 -0.08
Finland 0.54 -1.11 0.48 0.37 - 0.9 0.19 -0.33 -0.02
Sweden -0.03 -0.6 0.81 0.28 -0.33 0.24 0.16 -0.98 0
Estonia 0.87 1.23 0.82 1.11 - 0.78 0.5 0.1 -
Lithuania 0.96 1.66 1.34 1.01 0.71 0.85 0.52 0.15 -0.11
Latvia 0.78 0.98 0.83 0.75 - 0.71 0.43 0.07 -
Poland 0.73 0.67 0.76 0.8 0.7 0.57 0.37 0.14 0.06
Source: CAPRI model results
16
Table A3. Change in main crops supply due to introduction of the GREEN scenario
(%).
Soft
wheat Rye and
Maslin Barley Oats Grain
Maize Other
cereal Rape Potatoes Sugar
Beet
Denmark -1.41 17.45 -1.86 8.21 - 3.43 2.5 0.64 0.93
Finland -1.41 17.21 -1.78 0.57 - 11.94 1.79 1.52 0.75
Sweden 1.23 6.56 1.16 1.68 15.24 3.65 2.09 1.75 -0.09
Estonia -4.57 -12.85 -2.65 -6.46 - -1.02 -1.96 -0.62 -
Lithuania -5.45 -26.64 -11.25 -8.98 -4.49 -3.03 -2.92 -2.57 -0.98
Latvia -1.74 4.16 0.67 0.53 - 1.56 -0.04 0.25 -
Poland -2.59 -2.4 -2.18 -2.51 -2.14 -3.05 -0.92 -1.24 -0.7
Source: CAPRI model results