Embed Size (px)
Citation preview

Impact of Foreign Direct Investment on
Economic growth of Ethiopia
A Time Series Empirical Analysis, 1974-2011
Meskerem Daniel Menamo
Thesis for the degree of Master of Philosophy in
Environmental and Development Economics
Department of Economics
Unversity of Oslo
Januar, 2014

II
© Meskerem Daniel Menamo
2014
Impact of Foreign Direct Investment on Economic growth of Ethiopia
Meskerem Daniel Menamo
http://www.duo.uio.no/
Trykk: Reprosentralen, Universitetet i Oslo

III
Acknowledgements
Writing a master thesis is a challenge. What is certain is that this thesis would not exist
without the inspiration, knowledge, help and support from a large group of people. I wish to
thank everyone who have inspired and contributed to this process.
Foremost, I would like to express my deepest gratitude to my advisor Prof. Asbjørn Rødseth
for the continuous support of my research, for his patience, motivation, enthusiasm, and
immense knowledge. His guidance helped me in all the time of research and writing of this
thesis.
Besides my advisor I would also like to thank my parents and friends for supporting me and
bearing with me throughout this process, especially Meron Assefa, Duba Jarso, Tadesse
Balcha, Birehanu Addisu and Anbes Tenagne were always willing to help and give their best
suggestions. My research would not have been possible without their helps.
Finally, I would like to thank my fiancé Dr. Achenef Tesfahun . He was always there cheering
me up encouraging me, giving me insightful comments and stood by me through the good
times and bad.
Oslo, January 2014
Meskerem Daniel Menamo

IV
Table of Contents
Acknowledgements .................................................................................................................. III
Table of Contents ..................................................................................................................... IV
List of Abbreviations ................................................................................................................ VI
Abstract ................................................................................................................................. VIII
1. INTRODUCTION .............................................................................................................. 1
1.1. Background of the study .............................................................................................. 1
1.2. Research Questions ...................................................................................................... 2
1.3. Ethiopian Economy ..................................................................................................... 2
The Agricultural Sector ........................................................................................ 2 1.3.1.
The Industrial Sector ............................................................................................ 3 1.3.2.
The service sector ................................................................................................. 3 1.3.3.
Study area ............................................................................................................. 3 1.3.4.
Structure of the Thesis .......................................................................................... 5 1.3.5.
2. OVERVIEW OF ETHIOPIAN ECONOMY AND FDI PERFORMANCE AND
POLICES .................................................................................................................................... 6
2.1. The pre-1991 / The Socialist (Derg) Regime/ ............................................................. 6
2.2. The post -1991 EPRDF ................................................................................................ 7
2.3. Regulatory and institutional framework of FDI in Ethiopia ...................................... 10
The FDI regulatory framework .......................................................................... 11 2.3.1.
The FDI Institutional framework ....................................................................... 13 2.3.2.
2.4. Regional Distribution of FDI ..................................................................................... 14
2.5. Sectorial Distribution of FDI ..................................................................................... 15
2.6. Sectorial contributions for GDP ................................................................................ 18
3. LITRATURE REVIEW ................................................................................................... 19
3.1. Theoretical Review and Empirical evidences of FDI ................................................ 19
Why investing in developing countries? ............................................................ 20 3.1.1.
3.1.1.1. Low Labor Cost .................................................................................................. 20
3.1.1.2. Natural Resources .............................................................................................. 20
3.1.1.3. Level of Infrastructure ........................................................................................ 21
3.1.1.4. Political Stability ................................................................................................ 21
3.1.1.5. Principal Production Sites .................................................................................. 22
3.1.1.6. High Level of Government support and Investment Incentives ........................ 22

V
3.1.1.7. Little capital ........................................................................................................ 22
3.1.1.8. Trade liberalization ............................................................................................ 22
3.1.2 Why direct investment? ...................................................................................... 23
3.2 Theoretical Review and Empirical Evidence on Impact of FDI .................................... 24
4 ECONOMIC ANALYSIS ................................................................................................ 27
4.1 Model Proposed ......................................................................................................... 27
4.2 Measurements of Data ............................................................................................... 28
4.3 Data Source ................................................................................................................ 31
4.4 Unit Root ................................................................................................................... 32
5 EMPERICAL RESULTS AND DISCUSSION ............................................................... 33
5.1 Graphical representations of variables and their correlations ................................... 33
5.2 Summary of Findings and results .............................................................................. 35
6 CUNCLUSION AND RECOMMENDATION ............................................................... 43
REFERENCE ........................................................................................................................... 46
Appendix: ................................................................................................................................. 49
List of Figure
Figure 1.1: Ethiopia Regions ...................................................................................................... 4
Figure 2. 1: Foreign Direct Investment net inflow (% of GDP) ................................................ 9
Figure 2. 2: The distribution of FDI flow to Ethiopia by sectors from August-March 2011 ... 17
Figure 5. 1: GDP growth rate for all study years ..................................................................... 33
Figure 5. 2: GDP growth rate against FDI for all study years ................................................. 34
Figure 5. 3: GDP growth rate against GCF for all study years ................................................ 34
Figure 5. 4: GDP growth rate against FDI and GFCF for all years ......................................... 35
List of Tables
Table 5. 1: Type of model specifications tested ....................................................................... 36
Table 5. 2: Growth model estimation results at level with lnGDPRt as dependent Variable .. 37
Table 5. 3: Growth model estimation results at difference lnGDPRt as dependent Variable .. 39
Table 5. 4: Type of model specifications tested by including the interaction of FDI with
Liberalization (LIB) ................................................................................................................. 40
Table 5.5: Growth model regression result by including the interaction of FDI with
Liberalization at level, lnGDPRt is the dependent variable. .................................................... 41
Table 5. 6: Growth model estimation results at difference by making lnGDPGt as dependent
Variable .................................................................................................................................... 42

VI
List of Abbreviations
ADBG: African Development Bank Group
AFDB: African Development Bank
CPIA: Country Policy and Institutional Assessment
DBE: Development Bank of Ethiopia
DCs: Developed countries
DI: Domestic Investment
EEA: Ethiopian Economic Association
EIA: Ethiopian Investment Agency
EPA: Ethiopian Privatization Agency
EPRDF: Ethiopian People Revolutionary Democratic Front
EHPEA: Ethiopian Horticultural Producers & Exporters Association
FIAS: Foreign Investment Advisor Service
FDI: Foreign Direct Investment
FDRE: Federal Democratic Republic of Ethiopia
GIZ Gessellschaft fur Internationale Zusammenarbeit
GTP: Growth and Transformation Plan
IMF: International Monetary Fund
JVP: Joint-Venture Proclamation
LDCs: Less Developed countries
LPG: Liquefied Petroleum Gas
OECD: Organization for Economic Co-operation and Development

VII
OLS: Ordinary Least Square
MDGs: Millennium Development Goals
MOFED: Ministry of Finance and Economic Development
MNCs: multinational companies
PPESA: Public Enterprises Supervising Authority
PPER: Project Performance Evaluation Report
PM: Prime Minister
SAP: Structure Adjustment Program
WB: World Bank

VIII
Abstract
This paper measures the impact of foreign direct investment (FDI) on economic growth in
Ethiopia based on annual time series data over the period 1974 to 2011. It in particular
examines how FDI affects GDP growth, both directly and also conditioning on trade
liberalization that Ethiopia adopted in early 1990s.
I estimate three different growth model specifications to investigate these relationships using
Ordinary Least Square (OLS) method. Results show that two years lagged FDI has a positive
and statistically significant effect on contemporary economic growth. On the other hand, FDI
after trade liberalization has positive but statistically insignificant effect on economic growth.
Results further show that the positive impact of domestic investment on economic growth
becomes less when FDI assumes positive significant impact, implying the crowding out effect
of FDI on domestic investment. Other major determinants of economic growth that I
controlled in the estimated models show expected sign and statistical significance. Export and
absence of war and drought increase growth, whilst import remains insignificant. Results in
this study imply the need for the government to build infrastructure and invest in human
capital to avoid any lags in utilizing benefits of FDI. Besides, the government should be able
to create the right environment to realize benefit from spill over effects of between domestic
investment and FDI.

1
1.INTRODUCTION
1.1. Background of the study
Foreign Direct Investment (FDI) affects economic growth of developing countries positively
through transfer of capital, know-how, and technology (Li and Liu (2005)). It increases
activity not only in FDI beneficiary firms. The effect can spread to other firms in the country
and sectors through technology spillover, human and capital formation and increasing
competition, thus raising productivity for the whole economy. FDI can accelerate growth in
the ways of generating employment in the host countries, fulfilling saving gap and huge
investment demand and sharing knowledge and management skills through backward and
forward linkage in the host countries (Frenkel, Funke et al. (2004)). Some points which
supports the concept that FDI promotes growth are explained by, Agrawal and Khan (2011):
1. FDI acts as a vehicle for the transfer of advanced manufacturing technologies from
the Developed countries (DCs) to the Less Developed countries(LDCs),
2. FDI increases competition in the host country’s markets,
3. FDI helps the host countries improve their foreign exchange reserves (or balance-of-
payments position)by increasing exports,
4. FDI brings along with it the management know-how needed to run the facilities,
5. FDI provides the financial resources needed by the host country,
6. FDI enhances the training and employment opportunities for the people of the host
country,
7. FDI reduces the burden of imports on the host countries through import substitution,
8. FDI acts as catalyst for increasing domestic savings and investment.
As a result of these benefits, many developing countries, like Ethiopia, are now actively
seeking for promoting FDI by trying to create a favorable environment for it. Some of the
measures taken include economic and political reforms aiming at macroeconomic and
political stability, investment in infrastructure and human capital and liberalization of trade
(Haile and Assefa (2006)).
Ethiopia carried out major economic reforms in 1992. The country introduced and increased
ingenuousness by undertaking trade liberalization, removing trade barriers and promoting the
inflow of FDI.

2
1.2. Research Questions
The purpose of my study is to analyze the impact of FDI on economic growth of Ethiopia.
Accordingly the study tries to answer the following research questions.
1. How FDI changes the economic growth measured as change in real gross domestic product
(GDP) of the country after the current government Ethiopian People Revolutionary
Democratic Front (EPDRF) policy change applied? This explains how FDI affects the
country’s economic activity or GDP growth after implementing the policy reform on FDI
inflow to the country.
2. What is the sectorial distribution of FDI and its contribution for the country’s economic
growth? Which FDI sector has significant impact on economic growth of the country? How
the current government policy reform and limitation of sectorial distribution affects the
countries FDI inflow in that sector specifically?
1.3. Ethiopian Economy
The structure of the economy can be decomposed into three main sectors; the agriculture
sector, the industrial sector and the service sector. The following sections provide a brief
overview of these sectors.
The Agricultural Sector 1.3.1.
Agriculture is the backbone of the Ethiopian Economy. It accounts for over half of the GDP
and 85 percent of export earnings, the most important of which is coffee and is major sources
of employment for about 80% of the population. Agriculture is open for foreign investment
with a variety of packages of incentives. The sector, among others, is focused on export
development. It is also the most important foreign currency earner. The sector is also a
promising source of export diversification (Ministry of trade and Industry (2013)). However,
coffee still remains the most important foreign currency earner utilizing 600,000 hectares
under cultivation, that are mainly spread across the southern and south western highlands of
the country (AFDB/OECD (2008)). Ethiopia has gone a step further in creating due
recognition and value to its premium coffee through a fair trade initiative. Five major coffees,
namely, Harrar, Sidamo, Yirgacheffe, Limu and Nekemte brands are now trademarked.

3
The performance of the agriculture is mainly connected with suitable weather conditions.
Factors such as ; drought, traditional cultivation practices, lag fragmentation, low level of
fertilizer applications and high population growth rate are the prime problem of the sector
(EEA (2000)).
The Industrial Sector 1.3.2.
Ethiopia has one of fastest-rising non-oil economies in Africa. The industrial sector, which
mainly comprises of small and medium enterprises accounts for about 13 percent of GDP
(EIA report (2013)) and growth rate of the sector is very low compared to the agricultural
sector (Mamo (2008)). The industry and manufacturing sector supply consumer goods,
generate employment opportunities, absorb agricultural raw materials and earn foreign
exchange through exports. This sector comprises light manufacturing products such as
construction materials, metal and chemical products as well as basic consumer goods such as
food, beverages, leather, clothing and textiles. Production is concentrated in and around Addis
Ababa (the capital city) and mostly supplies to the domestic market, although the number of
exported goods is steadily growing.
To help the industrial sector to grow, the government is making intensive efforts to dismantle
barriers to investment and private sector participation caused by excessive regulation from
past regimes.
The service sector 1.3.3.
The service sector is the second largest sector after the agricultural (The Ethiopian Investment
Guide report (2013)). The service sector comprised of social services, real estate, trade, hotels
and restaurants, finance and transport and communication etc. In general, the Ethiopian
economy is highly dependent on the agriculture sector, and the role of industrial sector is
quite limited.
Study area 1.3.4.
The study area of my thesis focused on Ethiopia. Ethiopia is the oldest independent country in
Africa. It is located in the north-eastern part of Africa and bordered by Sudan and South
Sudan to the west, Eritrea to the North, Djibouti and Somalia to the east and Kenya to the

4
south. Ethiopia has two major seasons encompassing dry and wet seasons. The dry season
prevails from October through May and the wet season runs from June to September. Since
1995, Ethiopia is divided into nine ethnically-based regional states and two administration
cities (refer table 3 in the appendix). It is now more than two decades since Ethiopia started to
build market economy after 17 years (1974-1991) of a state centered and controlled economy
(CIA World Fact book).
Figure 1.1: Ethiopia Regions
Source: from Google (internet)

5
Structure of the Thesis 1.3.5.
This thesis is organized in six chapters. Chapter two reviews overview of Ethiopian economy.
Chapter three reviews related literature about determinants of FDI and impact of FDI on
economic growth. Chapter four describes the methodology and data sources. Chapter five
presents main findings of the study and results. Chapter six makes conclusion and provides
recommendations.

6
2.OVERVIEW OF ETHIOPIAN
ECONOMY AND FDI PERFORMANCE
AND POLICES
In this part I review the political regimes of Ethiopia and corresponding FDI policies, regional
and sectorial distributions of the country. It looks at Ethiopian Economy and FDI performance
from 1974 to 2011. The first part of this period, 1974-1991 (pre-1991), was the time of
socialist and military government. The second part of the period, from 1991-present (post
1991) is a civil government and it started with liberalization and the introduction of market
based economic policies. The current government considers FDI as part of the national
investment strategy.
2.1. The pre-1991 / The Socialist (Derg) Regime/
Immediately after Emperor Haile Selassie was overthrown; in September 1974, a Military
Committee (known as Derg) was established from several divisions of the Ethiopian Armed
forces. The government installed a socialist\Command\ economic system where market
system was deliberately repressed and socialization of the production and distribution process
followed. This led Ethiopia into the Socialism system. The land reform policy of Derg was
the major success history that earned credit to the socialist government and that was honored
by the masses. The Derg did not give any opening for privatization to domestic and foreign
investors, so the gap between domestic investments and saving remained wide in the pre-1991
period. According to UNCTAD (2002) investment policy review in Ethiopia report, in
between 1990 to 1997, gross domestic investment as proportion of GDP rose from 11.9
percent to 19.1 percent, while gross domestic saving remained the same rate. It would appear
therefore, there is a need of to fill this saving gap. This can be done by loans and development
assistance from multilateral agencies such as World Bank or private foreign investors.
According to Haile and Assefa (2006), the financial sources from multilateral agencies to
Sub-Saharan Africa have fallen. It has been reported that development assistance to Sub-
Saharan Africa declined from $ 17 billion to $ 10 billion (Haile and Assefa (2006)). Given
this FDI is the most important factor of foreign capital for these countries.

7
The economic performance of the pre 1991 period was characterized in three phases.
The first phase of the regime, 1974-1978, economic performance was poor due to the
emerging of new polices and the nationalization measures.
The second phase of the regime, 1978-1980, the economy began to recover and the
growth rate increased. This period was characterized by stability and benefited from
good weather. Agriculture product was increased.
The third phase of the regime, 1980-1985, the economy performed badly again.
Agricultural and manufacturing sectors were decline because of severe drought that
affected almost all regions of the country in between 1984-1985. The Economy
continued stagnates.
FDI plays an important role for economic growth of one country (Geda (2005)). However, in
1975 the Ethiopian regime had nationalized major industries. This scared off foreign private
investors had a great impact on the country’s economy (UNCTAD (2002)). In addition, the
problem of political instability, insecurity and the nationalization of major industrialization
severely discourage FDI inflow in to the country in these periods.
Realizing the importance of FDI, in 1983, Derg attempted the Joint Venture Proclamation
(JVP). The proclamation offered incentive such as, five years period income tax relief for new
project, import and export duty relief, tariff protection, and repatriation of profit and capital.
However, the proclamation failed to attract foreign investment, largely because foreign
businesses were uncertain to invest in a country whose government recently had nationalized
foreign industries without appropriate compensation. In 1989 the government revised the
1983 proclamation by allowing majority foreign ownership in many sectors, except in those
related to public utilities, banking and finance, trade, transportation and communication. Even
though Derg regime decreed this opportunities and mixed economy in 1990, the political
instability and extended civil war at the time further discourage the inflow of FDI to the
country. The political instability got worse and led to the over thought of the regime in 1991.
2.2. The post -1991 EPRDF
The post-1991 period begun, with the coming to power of Ethiopian People Revolutionary
Democratic Front (EPRDF) and the government removed the Derg regime that had ruled the
country for seventeen years. In contrast to the previous policy regime of hard and command
control, EPRDF initiated a wide range of reforms that covered the exchange rate, interest

8
rates, liberalization of trade, domestic production and distribution, devaluation of currency,
eliminating structural distortion, improving the country’s human capital and infrastructure as
well as poverty reduction.
In 1991 the regime adopted Structure Adjustment Program (SAP) as per recommendation of
the World Bank (WB) and International Monetary Fund (IMF). The government promised to
implement a series of policy reform measure in order to remove and change the command
economic system with market based economy, to open the economy into the world economy
and to encourage the wider participation of the private sectors in the development process of
the national (ADBG (2000)). Under SAP the country become more attractive for FDI and
made the domestic investors competitive.
The main objectives of the government were increasing the role of the private sector in the
economy and the privatization program was started in February in 1994. Since then, Ethiopian
Privatization Agency (EPA) has become the lead agency in carrying out the process of
privatization of public enterprises. One of the objectives of the EPA is to promote the
country’s economy development through encouraging the expansion of the private sector and
the transferring of the state owned enterprises to the private ownership. According to
Privatization and Public Enterprises Supervising Authority (PPESA) report, 14 enterprises
were privatized in 2007 in sector such as tourism, mining industry and agro-industry by
bringing the total number of public enterprises privatized to 247.
The promotion of small and micro finance enterprises is also critical to private sector
development. The government has been providing support to such enterprises in several areas
such as training, business skill, development, micro credit and information and marketing,
(AFDB/OECD (2008)).
Haile and Assefa (2006) described the specific measures taken to promote the export sector
and participation of the private sector include :
Deregulation of domestic prices
Devaluation of the national currency from 2,07 birr per dollar to 5 birr per dollar
Liberalization of trade and the foreign exchange rate.
Eliminating of export taxes except coffee
Lowering of maximum import duties from 230% to 60%
Simplification of export regulation and procedure
Provision of adequate incentives, strengthening and enhancing institutional support
for the export sector.

9
Figure 2.1 below shows the trend of FDI (% of GDP) from 1974 to 2011. Since 1992, FDI
starts to play its role and increase impacts for economic growth of Ethiopia following the
liberalization of trade policy. There were very small flow of FDI in the country during the
post 1991 period but after the EPRDF allow the inflow of FDI to the country it shows some
change.
Figure 2. 1: Foreign Direct Investment net inflow (% of GDP)
Source: Stata result based on WB data
FDI flows in Ethiopia increased in absolute terms with some fluctuations. The unstable
political environment is the main reason for the fluctuations. In the figure above it shown that
during the two years period of conflicts that Ethiopia had with Eretria (1998-2000) the inflow
of FDI had fallen to a large extent. Beside in 2005 and 2008 during the Ethiopian local
election crises time, the FDI extent also declined. By 2000/01 total investment accounted for
16 percent of GDP(Geda (2008)).
Liberalization of trade in 1992 made an impact for the country growth (Economic
commission for Africa, P83, (2002)). The reform as well as the government introduction of
investment guarantee scheme and incentives helped the county to got/get a higher level of
inflow of FDI. The FDI inflows to Ethiopia have been generally treading upward, through
with some volatility, since 1992. From 2003-2007, annual average inflow were $409 million
compared to $140 million over the 1998-2002 period (UNCTAD (2004)). This is because of
the investment proclamation was revised by including a higher level of incentives for foreign
investors.
02
46
FD
I(%
GD
P)
1974 1979 1984 1989 1994 1999 2004 2009Year

10
2.3. Regulatory and institutional framework of FDI in
Ethiopia
To improve the investment climate of the country and attract FDI inflow to Ethiopia, the
current government has made commendable effort through legislative and procedural reforms.
According to the Ethiopian Investment Agency (EIA) report, the investment proclamation
code has been revised more than three times to ensure the participation of more foreign
investment in various sectors of the economy since 1992. Major positive changes regarding
foreign investments have been introduced through Investment Proclamation No.280/2002 and
Regulations No.84/2003. As a result of the implementation of the above mentioned policies
and strategies, agricultural and industrial production, and export are growing steadily from
year to year both in terms of variety and volume.
Due to the investment-friendly environment created in the country, the inflow of FDI has
been increasing over the last eighteen years. China, India, Sudan, Germany, Italy, Turkey,
Saudi Arabia, Yemen, the United Kingdom Israel, Canada and the United States are the major
sources of FDI. Currently well-known Swedish clothing retailer H&M wants to set up shop in
Ethiopia. Nowadays Ethiopia has become attractive investment destination. According to
www.ethiopiainvestor.com the major reasons are:
Political and social stability;
Macro-economic stability and growing economy;
Adequate guarantees and protections;
Transparent laws and streamlined procedures;
Ample investment opportunities;
Abundant and trainable labor force;
Wide domestic, regional and international market opportunity;
Competitive investment incentive packages ;
Welcoming attitude of the people to FDI;
Pleasant climate and fertile soils; and
Low production cost

11
The FDI regulatory framework 2.3.1.
The current Ethiopian government investment Proclamation No. 691/2010 and Article 39 of
the Investment Proclamation No.769/2012 allowed foreign investors to invest in all economic
sectors, except those currently reserved for domestic private investors, state investment or
joint investment with government. (Table 2 in the appendix)
According to Federal Negarit Gazeta _ No. 4 November 29th
( 2012), the foreign investors are
encouraged to invest in some sectors privately in addition to joint investment with
government except, those currently reserved for domestic private and state investment. The
investment areas which are allowed for foreign investors include: (refer table 2 in the
appendix for more details)
Manufacturing
Agriculture
Hotel(must be star designated hotel)
Real estate development
Education and training
Health service
Architectural and engineering works including the consultancy service, for example
German owned company called GIZ (deutsche Gessellschaft fur Internationale
Zusammenarbeit); it is still active in Ethiopia.
Since the first proclamation issued in 1996, there are always a revised investment policy on:-
economic sector open to FDI; the financial limits and requirement for FDI; the financial
incentives and investment guarantee that are available in the country.
Financial requirement :- According to the Ethiopian investment Proclamation No.280/2002
(amended in 2008), a foreign investor, who invests on his own, except in consultancy services
and publishing, is required to invest not less than US$ 100,000 in cash and/or in kind for a
single project. However, if he invests in partnership with domestic investor(s), the minimum
capital required of him is US$ 60,000. The minimum capital required of a wholly foreign
investor investing in consultancy services or publishing is US$ 50,000, which may be in cash
and/or in kind. But this capital amount is lowered to US$ 25,000 if he invests in partnership
with domestic investor(s). A foreign investor reinvesting his profit or dividends, or exporting
at least 75% of his outputs, however, is not required to allocate a minimum capital.
The financial incentives for FDI: both domestic and foreign investors engaged on
investment areas are eligible for investment incentives. To encourage private investment and

12
increase inflow of foreign capital and technology to Ethiopia the government revised
proclamation policy. These are;
A. Exemption from import customs duty: - One hundred percent exemption from
the payment of import customs duties and other taxes levied on imports is granted
to an investor to import all investment capital goods, such as plant, machinery and
equipment, construction materials, as well as spare parts worth up to 15% of the
value of the imported investment capital goods.
B. Exemption from the payment of income tax: Any income derived from an
approved investment in new manufacturing, agro-industry and information and
communication technology (ICT) development or agriculture is exempted from the
payment of income tax, depending upon the volume of export and the location in
which the investment is made. Supplies at least 75 percent of his product or service
to an exporter, as a production or service input will be grant from 5 to 7 years
income tax exemption.
C. Carry forward of losses; Business enterprises that suffer losses during the tax
holiday period can carry forward such losses for half of the income tax exemption
period following the expiry of the exemption period.
The investment guarantee and protection; the investment report from EIA on February 11,
2013 stated that the investment guarantee and protection that the current investment
proclamation gave for foreign investors who would like to invest in the country. These are;
A. Guarantee against expropriation; Ethiopia is a member of the World Bank-affiliated
Multilateral Investment Guarantee Agency which issues guarantees against non-
commercial risks to enterprises that invest in signatory countries. The Investment
Proclamation 2002 provides investment guarantee against measures of expropriation
and nationalization that may only occur for public interest and in compliance with the
requirement of the law. Where such expropriations are made, the Government
provides adequate compensation corresponding to the prevailing market value of
property and such payment is effected in advance.
B. Remittance of funds; Foreign investors are granted to make principal and interest
payment of external loans, payments related to technology transfer agreement, profits
and dividend acquiring investment and proceeds from the sale or liquidation of an
enterprise out of Ethiopia in convertible foreign currency at the prevailing exchange
rate on the time of remittance.

13
The FDI Institutional framework 2.3.2.
Since 1992, EIA is the responsible agency that observes most aspects of FDI in Ethiopia. All
inward investments are monitored, managed, coordinated and promoted by EIA. EIA reports
to the Board of Investment (BOI) chaired by the prime minister. According to the Ethiopian
investment agency report the major EIA responsibilities include:
Promoting the country’s investment opportunities and conditions to foreign and
domestic investors;
Issuing investment permits, work permits, trade registration certificates and business
licenses;
Registering technology transfer agreements and export-oriented non-equity-based
foreign enterprise collaborations with domestic investors;
Negotiating and, upon government approval, signing bilateral investment promotion
and protection treaties with other countries;
Advising the government on policy measures needed to create an attractive investment
climate for investors; and
Assisting investors in the acquisition of land, utilities, etc., and providing other pre-
and post-approval services to investors
A number of other government agencies and private sector organizations are involved in
delivering and contributing to Ethiopian’s investment promotion effort alongside EIA. Based
on the proclamation 87/1994 the Ethiopian government established the EPA for privatization
of state owned enterprises. The main objectives of EPA are undertaking and implementing
programs of privatization. Other government agencies and authorities that are involved in the
attraction of FDI in to the country include; the Ministry of Trade and Industry, and agencies
associated with specific sectors such as mining and tourism, The Ministry of Foreign Affairs,
The development Bank of Ethiopia. The Regional Investment Promotion Agencies, known as
investment bureaus, also have important role in identifying, defining and promoting specific
investment project opportunities and in encouraging FDI inflow into their region (UNCTAD
(2002)). The implementation of EPA, EIA and other investment promotion and support
institutions are a step forward in the right direction. These help the system become more
efficient and effective.

14
2.4. Regional Distribution of FDI
From table 2.1 below, Addis Ababa (the capital city), Oromiya (the most populous region)
and Amhara regions take the largest share of FDI flows to Ethiopia. For the period from
August 22, 1992 to March 30, 2011 in terms of number of projects, Addis Ababa, Oromiya
and Amhara regions have attracted 49%, 28% and 3.5% of FDI inflows to Ethiopia
respectively. Conversely, Harari, Somalia, Afar and Benishangul-Gumze performance in
attracting FDI is very poor.
Table 2. 1: Regional Distribution of FDI inflows to Ethiopia,
August, 1992 to March, 2011
Region No. Of
Project Perent
Capital in '000'
Birr Percent
Per. Emp.
Addis Ababa 3 592 49,36778 82 582 965 22 145 794
Afar 36 0,494777 5 932 470 2 3 781
Amhara 253 3,477185 36 915 929 10 47 821
B.Gumze 70 0,962067 4 678 196 1 6 617
Dire Dawa 66 0,907092 23 955 614 6 8 637
Gambella 27 0,371083 6 322 402 2 6 204
Harari 6 0,082463 22 700 0,01 116
Multiregional 887 12,19076 78 103 373 21 359 373
Oromia 2 054 28,2298 118 713 901 32 253 533
SNNPR 190 2,611325 11 181 207 3 26 908
Somali 18 0,247389 620 196 0,17 2 340
Tigray 77 1,058274 3 354 365 1 6 855
Grand Total 7 276 100 372 383 317 100 867 979
Source: Own calculation from EIA data, Unpublished
The table shows that, FDI flows in Ethiopia are unevenly distributed among the regions, even
though the incentive system encourages foreign investors to invest in the least developed
regions. But when I compare the results from March 2005 EIA report of the regional
distribution of FDI in Gambela and B.Gumze regions, there is a recommendable change as
compared to current regional inflow of FDI. This is because of governments special benefit
including providing land free of any charge in addition to an infrastructural improvement of
the regions (EIA (2008)). Addis Ababa is the major destination of for FDI flows to Ethiopia,
as it has better infrastructure, stable political environment and better supplied of trained
manpower. Oromia Region is attracting because of the availability of natural resource and

15
market access (FIAS (2001)). The regional distribution of FDI imbalance cannot be only
increases by changing the investment incentives mechanism unless the government increases
market, infrastructure and skilled work force beside the investment incentives.
2.5. Sectorial Distribution of FDI
The FDI flows to Ethiopia are fairly diversified into three main sectors. These are: the
Primary, the secondary and the tertiary sectors. The primary sector includes all types of
agricultural activities and mining and quarrying. The secondary sector encompasses all kinds
of industrial activities. The tertiary sector includes real estate development, trade, hotel and
tourism, transport service, education, electricity generation, construction, and health service.
The summary report from EIA has processed a total of 7276 FDI projects in these sectors and
12 different regions, of which 5503 are pre- implementation, 514 under implementation and
1259 projects have become operational until March 30, 2011. Out of the 1259 FDI approved
and operation projects the Manufacturing and Real estate, machinery & equipment rental &
consultancy service accounted for the highest share, followed by Agriculture sectors
Table 2. 2: Foreign Direct Investment projects in Ethiopia in
different sectors from August 1992 to March, 2011.
Sector
Pre-
Implementation Implementation Operation Total
No. of
Project
No. of
Project
No. of
Project
No. of
Project
Agriculture 1 453 138 187 1 778
Manufacturing 1 693 168 475 2 336
Mining 32 5 9 46
Electricity generation & transmision 5 5
Education 123 14 36 173
Health 99 23 29 151
Hotels (including resort hotels, motels and lodges) and restaurants 340 42 64 446
Real estate, machinery & equipment rental & consultancy service 1 182 77 305 1 564

16
Tour operation, eco-tourism, cold storage service, etc. 225 14 34 273
Construction contracting including water well drilling 256 24 79 359
Others* 95 9 41 145
Grand Total 5 503 514 1 259 7 276
Source: Own calculation based on EIA data, 2011, Unpublished
Figure 2.2 shows that the distribution of FDI inflow in sectors to Ethiopia. Since 1992, it
shows a higher growth in the three sectors. Of which the secondary(manufacturing) sector and
the tertiary(service) sector accounted for about 41% and 32% of the total of FDI inflows to
Ethiopia from August 1992 to March 2011, while the Primary sector accounted 25%. Unlike
many Africa countries, FDI inflows to the mining and quarrying sub-sector are very small, as
the country does not have sufficient deposit of some important minerals like petroleum.
Others* sectors including recreation and amusement center, gymnasium, golf, import trade of
LPG and Bitumen, export trade of gold, etc. accounted for about 2% of the total FDI inflow in
sector to Ethiopia.

17
Figure 2. 2: The distribution of FDI flow to Ethiopia by sectors from
August-March 2011
Source: Own calculation based on Ethiopian investment Authority, Unpublished data
The degree of the manufacturing sector and service sector openness for FDI is increases than
FDI in agricultural sector. FDI in manufacture from China is very likely to be labor-intensive
sector investment, which will bring not only the massive employment opportunities, but more
importantly, institutional innovation experience and productive hard-working culture that
have contributed significantly to the industrial upgrade in China during the past decades to
Ethiopia (Fu (2012)). According to EIA, 50 Turkish textile and garment companies are
hoping to relocate factories to Ethiopia, with the support of Ayka Addis Textile and
Investment Group. Beside the manufacturing sector the government has done in this day to
get investors from the Middle East, private Indian investor and Asian countries to do more
large scale farming and exporting their food. But this has come with the criticism, because the
government is giving these lands by kicking people of the land.
25 %
32 %
41 %
2 %
Agriculture
Manufacturing
Real estate, machinery &equipment rental &consultancy service
Others*

18
2.6. Sectorial contributions for GDP
To maintain economic growth and transform rapidly, the country has implemented the five
year Growth and Transformation Plan (GTP) for the period 2010/11-2014/15. It is directed
towards achieving the Millennium Development Goals (MDGs), Ethiopia’s long term vision
and sustaining economic growth. The dominant development agenda of the GTP is to sustain
rapid, broad-based and equitable economic growth path witnessed during the past several
years and eventually end poverty. The GTP predicts an average annual economic growth of
11 to 14.9% over these years (http://www.mfa.gov.et).
Table 2. 3: Growth rate of real GDP in 2010/2011(percent)
Sectors
Base year (2009/10)
2010/11 Fiscal Year
Planned
Actual
Over all real GDP 10,6 11 11,4
Agricultural 7,6 8,5 9
Industry 10,8 14 15
Service 13,2 12,5 12,5
Source: Ministry of Finance and Economic Development
During 2010/11, the country has registered 11.4% real GDP growth rate surpassing the GTP
target of 11 percent. Particularly, the agriculture and industry sectors have registered growth
rates above their targets set for the year. Manufacturing sector is a leading and significant
sector for the country growth. This indicates that the openness of FDI for the sectors have a
positive impact for the country’s growth. These can be by increasing employment, standard of
living and poverty reduction.
GTP emphasizes enhancing the growth of the manufacturing sector to make it play a
significant (leading) role in the nation’s overall development endeavors. According to
Ministry of Finance and Economic development report , the GTP imagines among others
improved use of best practices and investment in rural roads, increase in electricity generation
capacity (for example: Grand Ethiopian Renaissance Dam), construction railway and
telecommunication network. This will help the country to have a higher amount of FDI flow
in to the rural regions and make the regional distribution of FDI balance.
19
3.LITRATURE REVIEW
As I described in the introduction part, impact of FDI in terms of building capital and human
formation, technological spillover, and increase competition and raise productivity has led for
the development of theoretical and empirical literatures which have focused on identifying the
possible determinants and impact of FDI. This section provides the theoretical and empirical
literature on FDI.
3.1. Theoretical Review and Empirical evidences of
FDI
The theoretical explanation of FDI is related with the traditional theories of International trade
that is based on countries comparative advantage and differences in factor endowment.
Ricardo’s theory of comparative advantage states that, specialization and free trade will bring
gains to both countries by engaging in international trade. Unlike absolute advantage, every
country may possess some sort of comparative advantage in some products it produces. A
firm source its supplies from other countries other than domestically can significantly benefit
if it sources its supplies from countries which have comparative advantage in their production.
The gains for the firm would be in the form of low prices and efficient supply due to the
country that export the products. The Heckscher-Ohlin (HO) theory explains that the source
of comparative advantage comes from its factor endowments, because the deference in factor
endowment mean different in autarky prices.
According to Mamo (2008), theories of FDI can be split into two groups; Micro level
determinates of FDI and Macro level determinants of FDI. The micro level theories of
determinates of FDI try to provide answer for the question why multinationals companies
(MNCs) prefer opening businesses in foreign countries rather than exporting or licensing their
product. The Macro levels of determinants of FDI clarify on the host countries situations that
determine the inflow of FDI. This chapter mainly provides the literatures about why is an
investment in developing countries, why a direct investment is needed and its impacts for host
country`s growth.

20
Why investing in developing countries? 3.1.1.
How and why does a firm become a multinational corporation? Why does a firm go to
developing countries and increasing its international involvement? High expected return in
developing countries can be the main reason for foreign investors which give incentives to
invest in developing countries. This can be extracted from developing countries in different
ways. These can be in terms of; low labor cost, level of infrastructure, political stability,
abundant of natural resource and others are expressed in detail below;
3.1.1.1. Low Labor Cost
Country's factor endowment is commonly understood as the amount of land, labor, capital,
and entrepreneurship that a country possesses and can exploit for different sectors. The
Rybczynski theorem (1955) explained that increasing the level of the labor supply will lead to
raise production of the good which uses that factor intensively. In China, foreign investors try
to benefit from cheap labor especially where production is labor intensive (Ali & Guo
(2005)). In addition to cheap labor, the out-put labor ratio (labor productivity) also determines
the inflow of FDI.
According to Ministry of Trade and Industry 2013 report; in Ethiopia, the labor force is
estimated at 40 million, and labor remains readily available and inexpensive. The cost of labor
is very low in Ethiopia with a wage of USD 2 a day for unskilled labor and average monthly
salary of USD 90 for a fresh graduate.
3.1.1.2. Natural Resources
It is the most important determinants of FDI. Dunning (1993) states, the need to secure
economic and reliable sources of mineral and primary products for the industrializing nations
of Europe and North America, natural resources were the major reason for the expansion of
FDI. Berhanu (1999) noted that, countries that have sufficient deposit of minerals can attract
foreign investors particularly those involved in exploitation of natural resources. Dunning
expressed in his theories of location advantages that, accessibility and low cost of natural
resource, adequate infrastructure, political and macroeconomic stability are basic factors that
should be fulfilled before engaging in cross border activities.

21
Ethiopia has a favorable climate, comparatively abundant land and labor as well as reasonably
good water resources that created ample opportunities for agriculture and flower farming
production (Ayelech and Helmsing (2010)). According to Ethiopia and Africa focus report;
the country has 122 billion cubic meter surface water, 2.6 billion cubic meter ground water,
12 river basins, 18 natural lakes including the Rift Valley lakes and a potential of 3.7 million
hectares irrigable land.
3.1.1.3. Level of Infrastructure
Infrastructure development has high importance for the expansion of FDI because efficient
and adequate infrastructure implies better access to natural resource and potential market.
According to Berhanu (1999), availability and reliability of telecommunication services,
developed and adequate road and air transport services, reliable water and electricity supply
facilities have paramount importance for the profitability of foreign companies and in
attracting FDI. Ethiopia to attract FDI develop ambition plan for infrastructure. The Grand
Ethiopian Renaissance Dam is an under-construction gravity dam on the Blue Nile River in
Ethiopia. The dam will be the largest hydroelectric power plant in Africa when completed.
3.1.1.4. Political Stability
The economic process of a country and in particularly the inflow of FDI into a country can be
disrupted by unsettled, implicit or explicit, internal or external political disputes and crises.
Whatever the economic environment the country has, without the political stability, it is very
difficult to get the country FDI. Political instabilities can delay FDI until the storm weather
away or diverts away for good (Birehanu and Kibre (2003)). In Ethiopia for example, after the
late Prime Minister (PM) of Ethiopia who has been in power for 20 years passed away
unexpectedly, there was a lot of investment fear but the current government followed the
constitution process and has been relatively stable again.
Asiedu (2002) findings indicates that FDI in Africa is not solely determined by availability of
natural resources and that can play an important role in directing FDI through trade reform,
macroeconomic and political stability, efficient institutions and improvement in
infrastructure.

22
3.1.1.5. Principal Production Sites
Ethiopia has globally competitive advantages in the production of roses in quality, freight
cost and production cost. According to a document published in 2001 by the Ethiopian
Institute of Biodiversity Conservation and Research Addis Ababa, the capital, with its
altitude, raised about 2000 meters, is the most suitable place for the production of high quality
roses. Besides its suitable weather, all the infrastructures like roads, power,
telecommunication and water have been advantaged for the investors in floriculture sector.
3.1.1.6. High Level of Government support and
Investment Incentives
FDI policy instruments used to attract foreign investors. This have some impact to determine
FDI but as explained in Asiedu (2004) the investment incentives by itself cannot be enough.
The host country should increase other determinants like infrastructure and market size.
3.1.1.7. Little capital
According to the neoclassical approach, the availability of little capital in the developing
countries makes its return to be increase. In this line of argument, capital moves from a
country where return on capital is low to a place where return on capital is high. This
approach is based on the perfect competition and risk aversion (Harrison, Dalkiran and Elsey
(2000)).
3.1.1.8. Trade liberalization
Most of literature’s focuses on the empirical relation between trade and growth. The findings
are mixed. Many studies find a connection between trade, or some other measure of openness,
and growth. Bajona, Gibson, Kehoe and Ruhl (2008) among others studied the theoretical
relationship between trade liberalization and growth. They concluded that trade liberalization
leads to higher productivity or higher rates of growth in real GDP (Bajona, Gibson, Kehoe
and Ruhl (2008)).

23
3.1.2 Why direct investment?
Direct investment is; investing directly in production in another country, either by buying a
company there or establishing new operations of an existing business. World Bank defines
FDI as when one individual or business owns 10% or more of a foreign company's capital. If
an investor owns less than 10%, it is considered as nothing more than an addition to his/her
stock portfolio. Even with just 10%, the investor usually has significant influence on the
company's management, operations and policies. For this reason, most governmental agencies
want to keep tabs on who is investing in their country's businesses (Delali (2003)).
One reason that foreign investors invest directly in the host county can be use of the countries
market size. The wealth and the development of the country can be used as a proxy to
measure the size of domestic market. The measure of the local market is per capital income
(PCI), which is an indicator of effective demand, is used to measure the size of the local
market. In addition to PCI, the GDP of a country and the population size are also used as an
indicator to measure the size of local market. The firm should be market seeking firms for
being the determinant of FDI (Root and Ahemed (1979)).
Asiedu (2002) conducted a study on 32 sub-Saharan African Countries and 39 non sub-
Saharan African countries over a period of 10 years (1988-1987). She argues that FDI inflows
in to sub-Saharan African countries are for market seeking. Asiedu (2004) argues that natural
resource and market size are the chief determinates of FDI.
The other reason why there is a direct investment in host country can be considered for the
advantage of exporting to third countries. Ito (2012) explained about export platform of FDI.
He states that “firms set up plants not only to supply the host country`s market but also the
host nation`s neighboring countries”. For example, many Tobacco companies have their
European headquarters and plants in Switzerland. The world`s largest Vanyl chrolide
monomer producer, Shinetsu chemical has its plants in Portugal and supplies its product to all
European countries.
Supply chain can be another reason for the question why there is a direct investment.
Common to all manufacturing companies is the need to control the flow of material from
suppliers, through the value adding processes and distribution channels, to customers. The
supply chain is the connected series of activities which is concerned with planning,
coordinating and controlling material, parts and finished goods from supplier to customer.

24
Traditionally, the flow of material has been considered only at an operational level. No
longer, however, can the potential of integrating the supply chain be ignored. Companies that
manage the supply chain as a single entity and ensure the appropriate use of tools and
techniques in order to meet the needs of the market will not get left behind in the fight for
survival (Stevens, (1989)).
3.2 Theoretical Review and Empirical Evidence on Impact
of FDI
Kevin panel data analysis indicates the effect of FDI on economic growth in 47 African
countries over the last two decades (1980–2000) and shows FDI exerts a positive impact on
growth in Africa. He also explained the causes for the flow of FDI in host countries like:
trained human capital and an attractive investment climate stemming from a developed
infrastructure, lower country risk and stable macro environment in countries. These results
confirm his hypothesis that foreign aid as well as domestic and foreign investment is effective
and growth enhancing only in a good policy environment. But, because Africa receives only a
small portion of FDI, foreign aid and domestic investment still account for a greater effect on
growth (Lumbila (2005)). Regression results reveal that corruption does not matter in the case
of FDI: countries where corruption is perceived to be high still benefit from a positive impact
of FDI on growth. FDI inflows are more strongly positively related to improvement in human
development when FDI policy restricts foreign investors from entering some economic
sectors and when it discriminates against foreign investors relative to domestic investors. The
relationship between FDI and improvement in human development is also more strongly
positive when corruption is low (Reiter and Kevin (2010)).
Lumbila (2005) argued also the amount of FDI directed to Sub-Saharan Africa (hereafter,
Africa) also increased significantly, reaching US$148 billion in the year 2000 against only
US$32 billion in 1980
Admas (2009) analyze by his study on impact of foreign direct investment (FDI) and
domestic investment (DI) on economic growth in Sub-Saharan Africa for the period 1990–
2003 that DI positively and significantly correlated with Economic growth. His study also
found that FDI initially has negative effect on DI and subsequently positive effect in the latter
periods for the countries studied. He concluded that the determinants of the FDI have the net

25
crowding out effect. The review of the literature and findings of the study indicate that the
continent needs a targeted approach to FDI, increase absorption capacity of local firms, and
cooperation between government and multinational enterprise (MNE) to promote their mutual
benefit.
By studying the effect of foreign direct investment (FDI) on economic growth in a cross-
country regression framework, utilizing data on FDI flows from industrial countries to 69
developing countries over the last two decades, Borenszteina, De Gregoriob and Lee (1998)
analyzed that, FDI is an important vehicle for the transfer of technology, contributing
relatively more to growth than domestic investment. Their study suggested that the host
country should have sufficient absorptive capability of the advanced technologies availability
for FDI contribution to host economy.
A time series study on impact of FDI in China and India shows a positive impact in economic
growth. According to the suggested result, growth in India and China is mainly depending on
trade liberalization policy by each country made in 1990s and the consequent upsurges inflow
of foreign capital to both these countries. In 1975, China was at equivalence with India in
GDP, yet 33% lower in its GDP per capita ($146 versus $220). But over the years China
developed more rapidly than India and surpassed India in terms of GDP per capita in 1984.
The study also investigate the reasons how china has grown more rapidly than India by
utilizing FDI (Agrawal and Khan (2011)).
After analyzing the data from 11 countries in East Asia and Latin America, using econometric
techniques such as unit root and co integration tests, Ram and Zhang (2002) provides
evidence that FDI promotes economic growth in countries with a liberalized trade regime, and
a workforce with higher job skills and education. According to Ram and Zhang (2002), FDI
provides ready access to the world markets and acts as a conduit for the host country to
participate in the globalization process (Ram and Zhang (2002)).
Using a panel data on 84 countries covering the period of 30 years from 1970 to 1999, Li and
Liu (2005) find that it is an increasingly endogenous relationship between FDI and growth,
especially since the mid-1980’s(Li and Liu (2005)).
By using cross-section data relating to a sample of forty-six developing countries
Balasuramanyam, Salisu and Sapsford investigates that, FDI plays in the growth process in
the context of developing countries characterized by differing trade policy regimes. The paper

26
tests the hypothesis advanced by Jagdish Bhagwati, and they concluded that, according to
which the beneficial effect of FDI, in terms of enhanced economic growth, is stronger in those
countries which pursue an outwardly oriented trade policy than it is in those countries
adopting an inwardly(Balasubramanyam, Salisu and Sapsford(1996)).
Borensztein, De Gregorio, and Lee used cross-country data for 1970–79 and 1980–89 to
study the FDI to growth connection and the possible complementarity between FDI and the
host country’s human capital. They investigated that the higher productivity of FDI holds
only when the host country has a minimum threshold stock of human capital and suggested
that “FDI contributes to economic growth only when a sufficient absorptive capability of the
advanced technologies is available in the host economy.” (Borensztein, De Gregorio and Lee
(1998)).
Several studies are focused on the case of developing countries and the major part of them
pressures on determinates of FDI. Which shows, how the host country should prepare its
home before guests are coming in? In addition several studies showed the significance and
positive effect of FDI on economic growth. Using multiple regression approach, I investigate
the effect of FDI for economic growth of Ethiopia. Time period is taken from 1974 to
2011.The thesis first proposes a growth model taking into account various factors that
promotes output (GDP). These factors are mainly identified by literature review parts.

27
4 ECONOMIC ANALYSIS
In this section I will bring more understanding on the empirical interaction of FDI with
economic growth performance on the Ethiopian economy. The empirical measures of the
extent and direction of linkages between FDI and economic growth generate mixed results of
positive, negative, or neutral effect of FDI on economic growth, as their methods, cases and
conditions of analysis differ. I will use econometric tools of time series data analysis.
Therefore, in this section, first, I will specify the basic and detailed models that will help me
to look the interactions between my variables of interest. At the next chapter, the data used in
this analysis followed by the estimation and explanation of the models specified and results
will be explaining.
4.1 Model Proposed
As noted in the previous chapters, the relationship between FDI and host country economic
growth has been explored empirically and theoretically by several researchers. The model that
I am using is broadly similar with Agrawal and Khan (2011). In macroeconomics aggregate
production functions are estimated to create a framework in which to distinguish how much
economic growth to attribute to change in the factor allocation and advancing technology. In
this section, I start from the standard production function and extend it by including my
variables of interest in order to test by what extent FDI explains growth in Ethiopia (FDI-
Growth linkage hypothesis). The importance of productivity factor A (which is a technology
or any other factor which affect long run growth in addition to Labor and Capital) is
augmented in the production function. To build the model I started with the basic production
function by augmenting A and the production technology to determine the growth in the
economy.
………………………………………. (1)
Where, Y denotes the levels of output produced (i.e. GDP). K denotes the input of fixed,
physical capital and L Denotes the input of labor force in the economy. A in the production
function is a productivity factor representing technological or organizational changes and
other factors that can raise output for given levels of K and L. A can increase the output that
can be made with unchanged inputs of labor and capital. A is not directly observable. It is

28
sometimes called the residual factor in growth. FDI may rise A, and raise output by bringing
better technology or organizational improvements. The challenge is to distinguish the effects
of FDI from the effects of other sources of improved efficiency in production. For this we
need to control for other variables that can affect A. It seems reasonable to assume that FDI in
period t may have a positive effect on output in all future periods, but that the effect on the
rate of growth dies out over time.
FDI affect economic growth through A (productivity factor) then the rate of change of
productivity given by:
This shows that the lagged growth rate of productivity when FDI is lagged. These helps one
to see the long run effect of FDI in the long run productivity. The impact of FDI for economic
growth cannot be immediately perceived it might take time to realize the effect.
K represents the fixed capital that has been accumulated through past investments in fixed
capital. FDI is one of the many possible sources for financing investment in fixed capital.
Hence, it may have an immediate effect on investment in fixed capital, especially if the
supply of capital from other sources is low.
GFCFt is a proxy measure of investment at time t. FDI*LIB denotes the interaction of FDI
with liberalization and DWD is dummy variable for Drought and War.
4.2 Measurements of Data
Y = Real Gross Domestic Product (GDP): Data are in constant 2005 U.S. dollars GDP at
purchaser's prices is the sum of gross value added by all resident producers in the economy
plus any product taxes and minus any subsidies not included in the value of the products.
Please refer in the appendix to see the growth rate during the study period.
LF = Labor force total: is the total supply of labor available for producing goods and
services in an economy during a specified period. According to the WB definition, Total labor
force comprises people ages 15 and older who meet the International Labor Organization

29
definition of the economically active population: all people who supply labor for the
production of goods and services during a specified period. It includes people who are
currently employed and people who are unemployed but seeking work as well as first-time
job-seekers. Not everyone who works is included, however. Unpaid workers, family workers,
and students are often omitted, and some countries do not count members of the armed forces
GFCF= Gross Fixed Capital Formation (% of GDP): WB defines Gross fixed capital
formation (formerly gross fixed domestic investment) consists of expenses on additions to the
fixed assets of the economy plus net changes in the level of inventories. Fixed assets include
land improvements (fences, ditches, drains, and so on); plant, machinery, and equipment
purchases; and the construction of roads, railways, and the like, including schools, offices,
hospitals, private residential dwellings, and commercial and industrial buildings. Inventories
are stocks of goods held by firms to meet temporary or unexpected fluctuations in production
or sales, and "work in progress."
FDI: Foreign direct investment, net inflows (% of GDP): WB defines FDI as the net
inflows of investment to acquire a lasting management interest (10 percent or more of voting
stock) in an enterprise operating in an economy other than that of the investor. A lasting
interest in an investment enterprise typically involves establishing warehouses, manufacturing
facilities, and other permanent or long-term organizations abroad. FDI can be divided in to
flow and stock of FDI. While the flow of FDI is based on current account inflows of foreign
capital for a year, stock is the total cumulated value of foreign-owned capital in a country. I
used in my empirical analysis part the net FDI inflow as percentage of GDP and these is
explained in figure 2.1 in chapter two. My interest of variable in my regression is FDI. FDI
consist a package of technology, management skill, capital, market access and others. If a
country has an access to have FDI inflow then helps the host country to create economies of
scale and linkage effect and raise productivity.
X (Export) and Import (M) are also included in the regression to measure the degree of
economic openness. According to WB definition the exports of goods and services represent
the value of all goods and other market services provided to the rest of the world. They
include the value of merchandise, freight, insurance, transport, travel, royalties, license fees,
and other services, such as communication, construction, financial, information, business,
personal, and government services. Data are in constant 2005 U.S. dollars and M defined as
Imports of goods and services represent the value of all goods and other market services

30
received from the rest of the world. They include the value of merchandise, freight, insurance,
transport, travel, royalties, license fees, and other services, such as communication,
construction, financial, information, business, personal, and government services. Data are in
constant 2005 U.S. dollars.
L= Liberalization: I included this variable to see the impact of policy dummy with the
interaction of FDI. As I explained in chapter two, Ethiopia has been introduced liberalization
policy since 1992 and a dummy variable is used to capture the effect of the policy change in
the economy. The dummy variable assumes the value of 0 for the period before the
liberalization policy applied (i.e. pre 1991) and 1 after the trade liberalization policy applied
(i.e. post 1991).
In all of the models, variables GDP, LF, X and M are first converted into natural log and then
into their growth rates and are denoted by lnGDPGR, lnGRLF, lnGRX, and lnGRM. And
following Balasubramanyam,Salisu and Sapsford (1996) FDI and GFCF as a percentage of
GDP and considered the natural log forms of these variables in all the models which are
denoted by lnFDI and lnGFCF in the model.
The study covers the period 1974-2011 and thus variables discussed have constituted time
series information. My variable of interest, FDI, affects economic growth both through fixed
capital formation and through increased productivity growth. The above the production
function takes the following general basic model form:
…………………………………………………………………………. (2)
The cofficents are the parameters of the econometric model, and they
describe the directions and strengths of the relationship between GDP and the factors used to
determine in the model (called Explanatory Variables). is the major coefficient of interest
that tells the percentage response in GDP growth for a percentage change in FDI (% GDP and
U is error term.
In Equation (3), I further modified the model by introducing more variables. Growth in
Ethiopia is susceptible to shocks like war and drought, and thus to control for these shocks I
introduce a natural log of the dummy variable of war and drought (lnDWD). I also introduced
a lagged dependent variable that captures the effect of correlation between the previous and

31
subsequent values of growth and helps for short run auto regression of the dependent variable.
It was first converted into natural log and then into growth rates and is denoted by lnGDPGRt-
1 in the model. In addition, one of the objectives of my empirical investigation is to examine
the effect of FDI on GDP growth conditional on the economic liberalization that Ethiopai
encounters in early 1990s. To take account of this effect, I introduced an interaction variable
between LIB and FDI in to my model, whose natural log form is denoted by lnFDI*LIB in the
model. Thus, Equation (3) adds more variables (lnDWD, lnGDPGRt-1 and lnFDI*LIB) into
Equation (2) as specified below:
………. (3)
The effect of FDI on growth is given by first derivative of GDPGR with respect to FDI. In
Equation (3), the effect of change in FDI on GDP growth depends both on FDI and LIB.
Thus, the major parameters in my model are the estimated values of β1 and β7. I expect these
determinants of GDP growth to be positive and statistically significant.
4.3 Data Source
The data set has been collected mainly from World Bank, United Nations Conference for
Trade and Development (UNCTAD) and National Bank of Ethiopia. I have chosen the data
source because it is the most reliable source of data and used by almost every researcher. On
the other hand, the databank from World Bank offers various data arrangement tools, as a
result required data can be arranged in desired format and direct excel file can be downloaded.
Frequency of dataset is annual and covers the time period of 1974-2011. All data used in the
estimation are in real terms at constant 2005 price and manipulated for use in terms of levels
or growth rates in empirical and descriptive analysis. Data inconsistency across sources was
the major challenge faced in the study, but maximum effort has been made. The data from
UNCTAD and World Bank have nearly similar data sets.

32
4.4 Unit Root
Before making any econometric estimation, it is necessary to conduct a unit root test to check
the stationarity of variables in my model. This helps to avoid the problem of spurious
regression and make meaningful estimations. I use Augmented Dicky Fuller test to check for
unit root or non-stationarity of the variables. And subsequently, I apply differencing if
variables are found non-stationary. GDPGRt and GDPGRt-1 are stationary, whilst all other
explanatory variables were first differenced to make them stationary. Table 4.1 below shows
all variables are stationary at first difference.
Table 4. 1: Augmented Dicky Fuller (ADF) unit root test result for
differenced variables
Variables
Diffenced
Computed ADF test
at lag length
Critical Values(lag 0) Critical Values(lag
1)
0 1 1 % 5 % 1 % 5 %
DFDI -8.697 -5.207 -3.696 -2.978 -3.702 -2.980
DGFCF -9.048 -4.078 -3.696 -2.978 -3.702 -2.980
DLF -13.507 -6.206 -3.730 -2.992 -3.736 -2.994
DX -8.909 -7.856 -3.696 -2.978 -3.702 -2.980
DM -17.239 -7.038 -3.696 -2.978 -3.702 -2.980
DFDI*LIB -8.869 -5.349 -3.696 -2.978 -3.702 -2.980
Source: Own computation using STATA and Note that: ‘D’ before each variable
represents ‘first difference’.

33
5 EMPERICAL RESULTS AND DISCUSSION
5.1 Graphical representations of variables and their correlations
Below using STATA I plot the graphs to show how the data looks like.
Figure 5. 1: GDP growth rate for all study years
The graph shows that GDP growth has a lot of noises and this can mainly be explained by the
absence and presence of extreme draughts and civil wars. For instance, the two lowest points
around 1985 and 1991 were because of historical drought locally known as wallo drought and
the regime change, respectively.
-10
-50
51
01
5
GD
PG
R
1970 1980 1990 2000 2010Year

34
Figure 5. 2: GDP growth rate against FDI for all study years
From the graph it is noticeable that there is different relationship between GDP and FDI
before and after 1991. That is mainly because of new government’s policy which liberalized
the trade. After 1991, though not very clear, it is possible to see a positive correlation between
GDP growth and FDI.
Figure 5. 3: GDP growth rate against GCF for all study years
This shows there is systematic correlation between GCF and GDP before 1991. When FDI
comes in 1992 they become less related to each other.
-10
-50
510
15
1970 1980 1990 2000 2010Year
GDPGR FDI
-10
010
20
30
1970 1980 1990 2000 2010Year
GDPGR GCF

35
Figure 5. 4: GDP growth rate against FDI and GFCF for all years
This graph is the presentation of GDP growth rate against both FDI and GFCF.
5.2 Summary of Findings and results
This section presents major findings and discussions. Data used in the study shows correlation
between GDP growth rate, FDI and GCF as depicted by Figure 5.4. GDP growth fluctuates
over the time considered, with most noticeable changes in 1985 due to major drought and
famine and early 1990s due to civil war in 1990s. As shown in the same graph, there are
positive correlation between GDP growth and FDI starting from 1991. It is further shown that
there is systematic correlation between GCF and GDP growth before 1991. However, once
FDI kicked in 1992, they became less related to each other.
I then consider econometric models to further study the relationship between GDP growth and
FDI, controlling for any variables that affect GDP growth. Table 5.1 below provides
information on each model used in the regression and intensions behind each model
specifications.
-10
010
20
30
1970 1980 1990 2000 2010Year
GDPGR GCF
FDI

36
Table 5. 1: Type of model specifications tested
Model Number Added Variable Rationale for the specification
Model-1 Basic regression (BR) Modeling for FDI-growth interaction test
Model-2 BR (+) FDIprGDP_1
To capture one year lagged effect of
FDI(%GDP)
on growth rate
Model-3 BR (+) FDIprGDP_2
To capture two year lagged effect of
FDI(%GDP)
on growth rate
The estimation of the growth model is undertaken both with unit root problem (non-stationary
variables) and without unit root problem (differenced variables) to control for non-stationary
variable estimation problem. First I presented the regression result witch has unit root and
followed by the differenced variable estimation, which deals with the stationary issues that is
discussed above.
Basic Model 1 in Table 5.2 shows GCF, export and dummy for war and drought (DWD) are
positive and significant at 1%, 5% and 1% level respectively, while import remains negative
and insignificant in all specifications. Negative impact of import is expected and could be
acceptable because of the fact that the country is suffering from terms of trade disadvantage
and negative trade balance, among major economic challenges of the country, are resultant
effects of such huge import. Export shows positive and significant results in all models of
specification. It is significant at 1% in model (3). This shows export is the higher
determinants of GDP and the degree of export orientation of the economy is more important
for foreign investors who trend to locate in the export sector.
Ethiopian economy is mainly agrarian, thus DWD has a positive long term impact on
economic growth in the country. Agriculture heavily depends on rainfall condition and results
in poor performance of the agricultural sectors which affects the whole economy adversely.
The following table shows the regression results in the above three models but the variables
are non-stationary.

37
Table 5. 2: Growth model estimation results at level with
lnGDPRt as dependent Variable
Explanatory variables at
level Basic Model 1 Basic Model 2 Basic Model 3
lnGDPR t_1
0,001 0.066 0.103
(0.919) (0.614) (0.394)
LnFDI
-0.114 -0.024 -0.219
(0.083)*** (0.028)** (0.010)*
LnFDI_1 0.010
(0.158)
0.003
(0.617)
LnFDI_2
0.017
(0.019)**
LnGFCF
0.144 0.120 0.074
(0.014)* (0.041)** (0.181)
lnLFR
-0.066 -0.038
(0.602)
0.023
(0.749) (0.360)
lnXR 0.007
(0.042)**
0.011
(0.017)**
0.106
(0.006)*
lnMR -0.001
(0.897)
-0.001
(0.839)
-0.003
(0.618)
lnDWD 0.065
(0.000)*
0.063
(0.000)*
0.0624
(0.000)*
R2 0.73 0.75 0.80
F Value 0.000 0.000 0.000
Source: Own computation Using STATA
Note: ***,** and * represent the significance of the coefficient at 10%,5% and 1% level
significance
As I tried to explain in the first chapter that A in equation (1) is not directly observable. The
effect of FDI through A is avoided in my estimation and I only estimate the effect of FDI on
the growth of Y directly. However, the major variable, FDI, explained by the consecutive
models of Table 5.2 above as the basic model shows, seems to support negative FDI- growth
interaction in Ethiopian economy. But, after a log it shows a positive and significant effect of
FDI on the growth process of Ethiopia. This means that FDI positively affects growth, but
only after some years rather than instantly.
Model 2 introduces one-year lagged FDI to the basic model and claim positive growth effect
on the economy but remain insignificant. By contrast, the third model with a two-year lag of
FDI shows a positive effect between lagged FDI and growth at a 5% level of significance.

38
Therefore, my empirical finding supports the positive interaction of FDI on economic growth
but it takes time to materialize and significantly affect the growth process in Ethiopia.
The important interpretations to be seen in this conditions that ; First, as model 3 show, when
the impact of FDI becomes positive and significant at 5% after two years lag, the effect of
domestic investment which is measured by gross fixed capital formation as percentage of
GDP (GFCF) become decreasing and insignificant in this period. The basic question should
be that FDI augments a host country’s domestic investment or crowds out domestic
investment? This could imply that the possibility that FDI crowds out domestic investment in
Ethiopia. Foreign investors are involved in sectors, which are already involved by domestic
investors. This is a huge disadvantage of FDI in the host country. In other words, no more
new sectors of investment are made solely by foreign investors. Foreign investment in the
country seems to exploit the comparative advantage of the country’s natural resource and
labor in better technology than adding new areas of involvement. FDI leads to more
investment in fixed capital and some of these goods are produced domestically, then FDI have
a short run demand effect on output. But, still the case is open for further research.
The results from table 5.3 below were derived from an estimation of the growth model using
data form non-stationary variables than at differenced (stationary variables). However, the
above results (from non-stationary variables) remain unchanged except minor relative
changes in values and significance levels, mainly on other variables of the model. Only the
explanatory variables are differenced because the GDPGRt and GDPGRt-1 are stationary
variables.

39
Table 5. 3: Growth model estimation results at difference
lnGDPRt as dependent Variable
Explanatory variables at
defference(D) Basic Model 1 Basic Model 2 Basic Model 3
lnGDPR t_1
0.742 0.714 0.855
(0.000)* (0.000)* (0.000)*
D.LnFDI
-0.023 -0.023 -0.020
(0.029)** (0.020)** (0.039)**
D.LnFDI_1 -0.009
(0.320)
-0.002
(0.845)
D.LnFDI_2
0.018
(0.053)**
D.LnGFCF
0.131 0.117 0.094
(0.017)** (0.038)** (0.115)
D.lnLFR
-0.023 -0.023
(0.872)
0.031
(0.824) (0.874)
D.lnXR
0.007 0.005
(0.094)***
0.006
(0.048)** (0.042)**
D.lnMR
-0.008 -0.001
(0.790)
-0.001
(0.905) (0.684)
D.lnDWD
0.070 0.068
(0.001)*
0.080
(0.000)* (0.001)*
R2 0.62 0.64 0.68
F Value 0.000 0.000 0.000
Source: Own computation Using STATA D. represent Difference
Note: ***, ** and * represent the significance of the coefficient at 10%,5% and 1% level
significance respectively .
One thing should be clear and remembered on interpreting regressions in first-differences.
While interpreting at level regression, I use a percentage change in the dependent variable
cause β percentage changes on the independent variable but, for regressions at difference, I
use a change in percentage change in the independent variable cause a percentage change on
the dependent variable. Estimation of the growth model as showed in the table above at
differenced variables still supports the positive FDI growth interaction after two years lag and
the results are almost similar to the above regression.
Two major differences of this model are notable: first, differenced regression assures the
positive and significant effect of last year GDPGR for the next year, which is explained to be
negative or insignificant in the level regression. Second, the effect of labor force is positive
but not significant. The result is acceptable in large populated country. In Ethiopia with high
unemployment and under-employment population, implying the marginal productivity of

40
labor is much lower as explained by low wage rates. An important consideration to be made
in relation to estimating the model given in equation (3) is to check the existence of unit root
which I explained it in the above chapters so I recommend the reader to see the impact of FDI
in economic growth of Ethiopia in the case of the deference regression result which is table
5.3 because all variables are difference and cleared from the unit root problem.
The second estimation shows of the regression equation (3) to see the impact of FDI with the
interaction of liberalization (LIB) for economic growth of Ethiopia. Table 5.4 below explains
the model specification. This model is developed mainly to capture the effect of trade policy
reform for economic growth of Ethiopia.
Table 5. 4: Type of model specifications tested by including the
interaction of FDI with Liberalization (LIB)
Model
Number Added Variable Rationale for the specification
Model-1
Basic regression (BR)
+FDI*LIB
Modeling for FDI and FDI*LIB-growth interaction
test
Model-2
BR (+)
FDIprGDP_1+FDI*LIB
To capture one year lagged effect of FDI(%GDP) and
the interaction of FDI with liberalization on growth
rate
Model-3
BR (+)
FDIprGDP_2+FDI*LIB
To capture two year lagged effect of FDI(%GDP) and
the interaction of FDI with liberalization on growth
rate
Liberalization on FDI indicates that on efficient environment that comes with liberalized
economy is likely to attract foreign investors (Borenstein, De Gregorio and Lee(1998)). To
induce more FDI in Ethiopia, the government needs to focus on improving the investment
climate through further measures of liberalization as well as creating efficient bureaucracy
that facilitates entry and speedy operation of foreign investors.
Equation (3) under model specification section tries to capture this fact using interaction term
between FDI and liberalization of trade in policy dummies (FDI*LIB). For the hypothesis to
get positive empirical support, the coefficient of the interaction term need to be positive and
significant. The estimation of the growth model is undertaken in both cases i.e. with unit root
problem (non-stationary variables) and without unit root (differenced variables) to control for
non-stationary variable estimation problem. First I present the regression result witch has unit

41
root and followed by the differenced variable estimation, which deals with the stationary
issues that is discussed above.
Table 5. 5: Growth model regression result by including the interaction of
FDI with Liberalization at level, lnGDPRt is the dependent variable.
Explanatory variables Basic Model 1 Basic Model 2 Basic Model 3
lnGDPR t_1
0.001 0.072 0.098
(0.995) (0.603) (0.436)
LnFDI
-0.013 -0.021 -0.022
(0.101)* (0.037)** (0.012)*
LnFDI_1 0.011
(0.164)
0.003
(0.662)
LnFDI_2
0.018
(0.022)*
LnGFCF
0.144 0.120 0.073
(0.016)** (0.046)** (0.193)
lnLFR
-0.066 -0.038
(0.613)
0.023
(0.747) (0.370)
lnXR
0.008 0.010
(0.019)**
0.011
(0.008)* (0.047)**
lnMR
-0.001 -0.001
(0.873)
-0.003
(0.599) (0.896)
lnDWD
0.065 0.0626
(0.001)*
0.063
(0.000)* (0.000)*
LnFDI*LIB 0.002
(0.975)
-0.002
(0.855)
0.002
(0.816)
R2 0.73 0.75 0.80
F Value 0.000 0.001 0.000
Source: Own computation Using STATA
Note: ***, ** and * represent the significance of the coefficient at 10%,5% and 1% level
significance respectively .
As shown in the table 5.6, below in the basic model, the interaction variable claims positive
sign for model (3) but remain insignificant. Two reasons may explain why the coefficient is
insignificant. First, the effect of FDI is negative at time t, as it has seen in both models. The
second may be the main factor and can be attributed to the multicolinearity of the data.
Table 5.5 below is derived from an estimation of the growth model using data form non-
stationary variables than at differenced (stationary variables). However, the above results
(from non-stationary variables) remain unchanged except minor relative changes in values
and significance levels, mainly on other variables of the model. The growth model result at
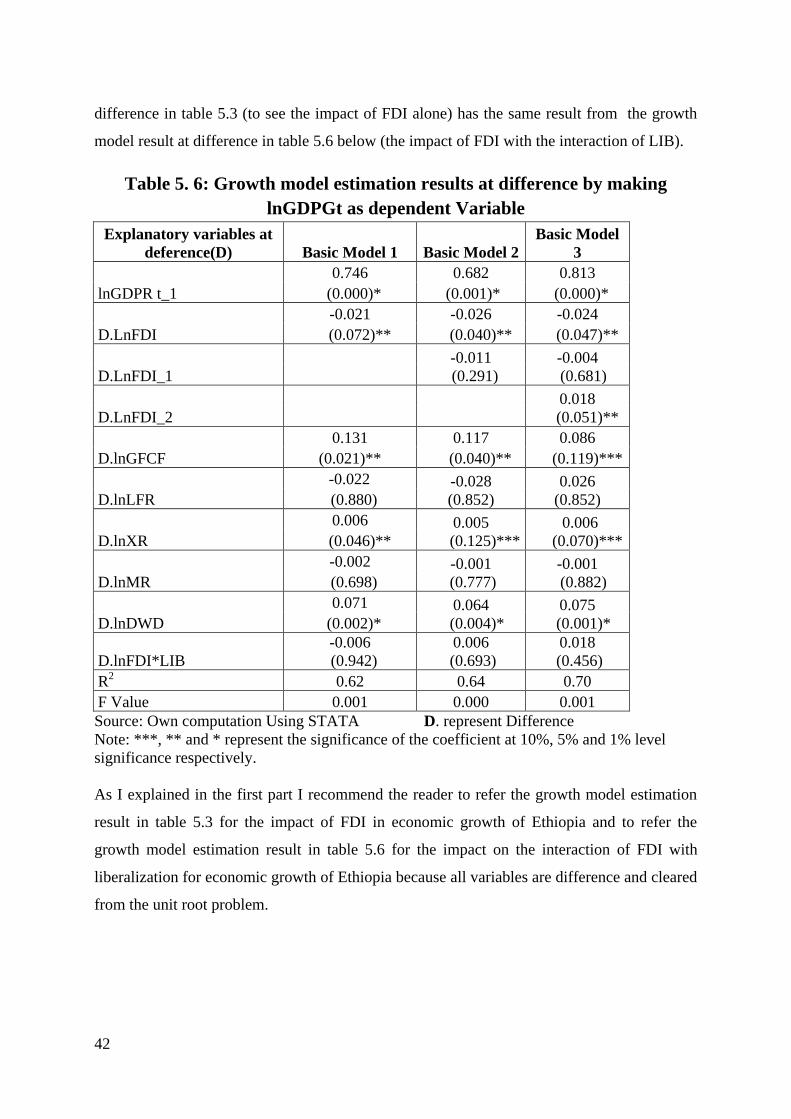
42
difference in table 5.3 (to see the impact of FDI alone) has the same result from the growth
model result at difference in table 5.6 below (the impact of FDI with the interaction of LIB).
Table 5. 6: Growth model estimation results at difference by making
lnGDPGt as dependent Variable
Explanatory variables at
deference(D) Basic Model 1 Basic Model 2
Basic Model
3
lnGDPR t_1
0.746 0.682 0.813
(0.000)* (0.001)* (0.000)*
D.LnFDI
-0.021 -0.026 -0.024
(0.072)** (0.040)** (0.047)**
D.LnFDI_1 -0.011
(0.291)
-0.004
(0.681)
D.LnFDI_2
0.018
(0.051)**
D.lnGFCF
0.131 0.117 0.086
(0.021)** (0.040)** (0.119)***
D.lnLFR
-0.022 -0.028
(0.852)
0.026
(0.852) (0.880)
D.lnXR
0.006 0.005
(0.125)***
0.006
(0.070)*** (0.046)**
D.lnMR
-0.002 -0.001
(0.777)
-0.001
(0.882) (0.698)
D.lnDWD
0.071 0.064
(0.004)*
0.075
(0.001)* (0.002)*
D.lnFDI*LIB
-0.006
(0.942)
0.006
(0.693)
0.018
(0.456)
R2 0.62 0.64 0.70
F Value 0.001 0.000 0.001
Source: Own computation Using STATA D. represent Difference
Note: ***, ** and * represent the significance of the coefficient at 10%, 5% and 1% level
significance respectively.
As I explained in the first part I recommend the reader to refer the growth model estimation
result in table 5.3 for the impact of FDI in economic growth of Ethiopia and to refer the
growth model estimation result in table 5.6 for the impact on the interaction of FDI with
liberalization for economic growth of Ethiopia because all variables are difference and cleared
from the unit root problem.

43
6 CUNCLUSION AND RECOMMENDATION
This paper studied the impact of Foreign Direct Investment (FDI) on economic growth of
Ethiopia. FDI affects economic growth of developing countries positively through transfer of
capital, know-how, and technology. It increases activity not only in FDI beneficiary firms but
also the effect can spread to other firms in the country and sectors through technology
spillover, human and capital formation and increasing competition, thus raising productivity
for the whole economy.
Trade liberalization in Ethiopia experienced after the Derg regime. The first part of this
period, 1974-1991 (pre-1991), was the time of socialist and military government. The second
part of the period, from 1991-present (post 1991) is a civil government and it started with
liberalization and the introduction of market based economic policies. These differences gave
me a good opportunity to see the role of different policy factors in explaining the performance
of the Ethiopian economy with respect to FDI and economic growth.
The descriptive part of the analysis examined the performance of the Ethiopian economy with
respect to foreign investment and different economic sectors impact for economic growth.
The structure of the Ethiopian economy is mainly classified into three main sectors, the
agriculture sector, the industrial sector and the service sector. Agriculture is the backbone of
the Ethiopian economy and major sources of employment for about 80% of the population.
The service sector is the second largest sector in the Ethiopian economy and industrial sector
fallows. The inflow of FDI in Ethiopia spread mainly in these three sectors.
Foreign direct inflow in the manufacturing sector and service sector is higher than the foreign
investment in the agricultural sector, as the country does not have sufficient deposit of some
important mineral like petroleum. To increase the involvements of foreign investors in the
agricultural sector the Ethiopian government providing different incentives to the foreign
investors. This includes giving large scale farming freely in the very fertilize soil areas. But
the government has done displacing the people on those lands to a much unfertilized soil
areas.
The Growth Transformation Plan (GTP) shows that foreign investors in manufacturing sector
have a positive impact on the economic growth in the country. During 2010/11 the country
has registered 11.4 % GDP growth rate in which the manufacturing and agriculture sectors

44
have registered growth rate above their targets set for the year. Manufacturing sector is a
leading and significant sector for Ethiopian economy. Current Ethiopian government is
increasing the investment in infrastructure in rural and urban roads, increase in electricity
generation capacity (for example: Grand Ethiopian Renaissance Dam), construction railway
and telecommunication network. This potentially helps the country to have a higher amount
of FDI inflow. But still the government policies in the institutional and financial areas need to
develop to realize the fruit from FDI.
The econometric analysis focused on the relationship between FDI and growth, and the
interaction of FDI with liberalization and growth. Estimating growth equations, I found
positive and significant effect of FDI on economic growth of Ethiopia but the effect come
after two year lag. The result suggests that it may take time for the outcome of FDI to be
realized, possibly can be due to the county`s poor infrastructure, limited human capital. The
lagged effect of FDI on the Ethiopian economy could be an indication that foreign investors
need time to build infrastructure and invest in human capital. This can be by giving training
and some workshop activities to meet there requirements before undertaking meaningful full
production. Therefore Ethiopia needs to increase the improved infrastructure and human
capital through investment in education (not only by opening a large number of universities in
all regional areas, but the quality of education should be considered) to internalize and fully
utilize the benefits of the foreign investment flows.
The growth model has also provided important intuitions on the possible crowding out effect
on domestic investment. The government should give more attention on the potential
crowding out effect on domestic investment. This can be done in a way that to create
competitive advantage and benefit from spillover effect and the countries should have a
higher absorptive capability of advanced technology to fully utilize of FDI benefit.
The econometrics analysis also focused on the interaction of FDI with trade liberalization and
the impact on economic growth. Liberalization with interaction of FDI has positive effect for
the economic growth but not significant.
Before deciding to presented the final regression results above I have tried different
estimations by including different other variables in addition to the current explanatory
variables in equation (2) and (3) in chapter four but the nature of the data is making the

45
estimation so difficult to make any conclusion in addition to a very few observations that are
not affected by war and drought and that is very difficult to make any firm conclusions.
46
REFERENCE
ADBG, Operation Evaluation Department (2000). Structural adjustement program in
Ethiopia. Project Performance Evaluation Report.
Adams, S. (2009). Foreign Direct investment, domestic investment, and economic growth in
Sub-Saharan Africa. Journal of Policy Modeling 31 (6), 939–949.
AFDB/OECD (2008). African Economic Outlook: Ethiopia. p. 301-313
Agrawal, G. and Khan, M.A. (2011). Impact of FDI on GDP: A Comparative Study of China
and India. International Journal of Business and Management, 6 (10), 71-79.
Ali, S. and Guo, W. (2005). Determinats of FDI in China. Journal of Global Business and
Technology, 1(2), 21-33.
Asiedu, E. (2002). On the determinants of Foreign Direct Investment to Developing
Countries: Is Africa Different? World Development. 30 (1), 107-119.
Asiedu, E. (2004). Policy Reform and Foreign Direct Investement in Africa: Absolute
Progress but Relative Decline. Developement Policy Review, 22 (1), 41-48.
Ayelech, T. M. and Helmsing, A.H.J. (2010). Endogenisation or enclave formation? The
development of the Ethiopian cut flower industry. Journal of Modern African Studies, 48
(01), 35-66.
Balasubramanyam, V.N., Salisu, M. and Sapsford, D. (1996). Foreign Direct Investment and
Growth in EP and IS Countries. The Economic Journal, 106 (434), 92-105.
Bajona, C., Gibson, M.J, Kehoe, T.J and Ruhl, K.J. (2008). Trade Liberalization, Growth,
and Productivity. Federal Reserve Bank of Minneapolis.
Berhanu, N. (1999). Foreign Direct Investement in Ethiopia. Alemayehu Geda (ed.)
Economic Focus, Vol. 2, No. 3.
Berhanu, N. and Kibre, M. (2003). International Competitiveness and the Business Climate
in Ethiopia. Ethiopian Economic Association Working Paper No. 1/2003.
Borensztein, E., De Gregorio, J. and Lee, J-W. (1998). How Does Foreign Direct Investment
Affect Economic Growth?. Journal of International Economics, 45 (1), 115-135.
Delali, A (2003). The Determinants and Impacts of Foreign Direct Investment. Munich
Personal RePEc Archive. Taken from http://mpra.ub.uni-
muenchen.de/3084/1/MPRA_paper_3084.pdf.
Dunning, J. H. (1993). Multinational Enterprises and the Global Economy. Addison Wesley.

47
EEA (2000). Annual Report on the Ethiopian Economy. Addis Ababa, Ethiopia: United
Printers.
EIA (2008). Ethiopian Investment Guide 2008. Addis Ababa, Ethiopia.
EIA (2013). Ethiopian Investement Guide 2013. Addis Ababa, Ethiopia. Taken from
http://www.ethemb.se/TEXT%20files/Investment_Guide%202013.pdf.
FIAS (2001). Foreign Investment Strategy Framework: Ethiopia. Washington D.C.
Frenkel, M., Funke, K. and Stadtmann, G. (2004). A panel analysis of bilateral FDI flows to
emerging economies. Economic Systems, 28 (3), 281–300.
Fu, X. (2012). Promoting Manufacturinf Foreign Direct Investement from China to Ethiopia.
Master thesis, Harvard University.
Geda, A. (2008). The political economy of growth in Ethiopia in Benno Ndulu, Stephen
A.O’connell, Jean_Paul Azam, Rober H.Bates, Augustin K. Fosu, Jan Willem Gunning and
Dominique Njinkeu (eds). The Political Economy of Growth in Africa: 1960-2000.
Cambridge: Cambridge University Press).
Haile, G. and Assefa, H. (2006). Determinants of Foreign Direct Investment in Ethiopia: A
time-series analysis. University of Westminster.
Harrison, A., Dalkiran, E. and Elsey, C. (2000). International Bussiness: Global Competition
from a European Perespective. Oxford University Press.
Ito T. (2012). Export platform Foreign Direct Investement: Theory and Evidence.Institute of
Developing Economies, Japan.
Li, X. and Liu, X (2005). Foreign Direct Investment and Economic Growth: An Increasingly
Endogenous Relationship. World Development, 33 (3), 393-407.
Lumbila, K.N. (2005). What Makes FDI Work? A Panel Analysis of the Growth Effect of
FDI in Africa. African Region Working Paper Series No. 80.
Mamo, S. (2008). Determinats of Foreign Direct Investement in Ethiopia. Master thesis,
Maastricht University.
Ram, R. and Zhang, K.H. (2002). Foreign Direct Investment and Economic Growth: Evidence
from Cross‐Country Data for the 1990s. Economic Development and Cultural Change, 51 (1),
205-215.
Reiter, S. L. and Kevin, S.H. (2010). Human Development and Foreign Direct Investment in
Developing Countries: The Influence of FDI Policy and Corruption. World Development, 38
(12), 1678-1691.

48
Root, F.R., and Ahmed, A.A. (1979). Emperical Determinats of manufacturing Direct Foreign
Investement in Developing Countries. Economic Developement and Cultural Change, 27 (4),
751-767.
Stevens, G.C. (1989). Integrating the Supply Chain. International Journal of Physical
Distribution and Logistics Management, 19 (8), 3-8.
UNCTAD (2002). Investement and innovation policy review: Ethiopia. United Nations, New
york and Geneva. Taken from http://unctad.org/en/docs/poiteipcm4.en.pdf.
UNCTAD (2004). Invetement and Innovation policy review in ethiopia. United Nations, New
York and Geneva. Taken from http://unctad.org/en/docs/iteiia20042_en.pdf.

49
Appendix:
Table 1: Areas of investment Reserved for Government and Domestic Investors.
1. Areas reserved exclusively for the government:
Postal services with the exception of courier services;
Transmission and supply of electrical energy through the integrated national grid
system; and
Passenger air transport services using aircraft with seating capacity of more than
20 passengers.
2. Areas reserved for Ethiopian nationals:
Banking, insurance and micro credit and saving services;
Travel and shipping agency services;
Broadcasting services; and
Air transport services using aircraft with a seating capacity of up to 20
passengers
3. Areas reserved for joint venture with the government
Manufacturing of weapons and ammunition and
Telecommunication service. (The Ethiopian telecommunication corporation
which is owned by Ethiopian government is replaced by Ethio Telecom on
December 2, 2010. The new company is also fully owned by the state, but
management is outsourced to France Telecom for two years.
4. Areas reserved for domestic investors:
Retail trade and brokerage;
Wholesale trade (excluding supply of petroleum and its by-products as well as
wholesale by foreign investors of their products locally produced);
Import trade (excluding Liquid Petroleum Gas(LPG), bitumen and up on the
approval from the Council of Ministers, material inputs for export products);
Export trade of raw coffee, chat, oil seeds, pulses, hides and skins bought from
the market and live sheep, goats and cattle not raised or fattened by the investor;
Construction companies excluding those designated as grade 1;
Tanning of hides and skins up to crust level;
Hotels(excluding star-designated hotels), motels, pensions, tea rooms, coffee
shops, bars, night clubs and restaurants excluding international and specialized
restaurants;
Travel agency, trade auxiliary and ticket selling services;
Car-hire and taxi-cabs transport services;
Commercial road transport and inland water transport services;
Bakery products and pastries for the domestic market;
Grinding mills;
Barber shops, beauty salons, and provision of smith workshops and tailoring
services except by garment factories;
Building maintenance and repair and maintenance of vehicles;
Saw milling and timber making;
Customs clearance services;
Museums, theaters and cinema hall operations;
Printing industries.
Source: EIA (Investment Proclamation No.769/2012)

50
Table 2: Ethiopia at a glance
Official Name Federal Democratic Republic of Ethiopia (FDRE)
Political system Federal system with multi-party system
Head of state President Dr. Mulatu Teshome
Head of government Prime Minister Hailemariam Dessalegn
Capital city Addis Abeba
Area 1.14 million square kilometres
Arable land 513,000 square kilometres (45%)
Irrigated land 34,200 square kilometres (3%)
Population Over 80.9 million (2010/11)
Population density 70.96 per sq. km(2010/11)
GDP per capita USD 382.20 (2010/11)
Source; EIA, 2013 report
Table 3. List of regions:
No Region name Population Capital
1 Addis Ababa(city admin.) and Capital city 2,739,551 N/A
2 Afar Region 1,411,092 Semera
3 Amhara Region 17,214,056 Bahirdar
4 Benishangul-Gumuz Region 670,847 Asosa
5 Dire Dawa (city admin.) 341,834 N/A
6 Gambela Region 306,916 Gambela
7 Harari Region 183,344 Harar
8 Oromia Region 27,158,471 Addis Ababa
9 Somali Region 4,439,147 Jijiga
10 Southern Nations, Nationalities, and Peoples' Region
15,042,531 Hawassa
11 Tigray Region 4,316,988 Mek'ele
Source: EIA 2013 report

51
Table 4: The Investment areas which is allowed for foreign investors
Manufacturing Industries including; food, beverage, textile and textile product,
leather and leather product, wood product, paper and paper product, chemical and
chemical product, basic pharmaceutical and rubber and plastic product, other non-
metallic mineral product, basic metal industry (excluding mining of the mineral),
fabricated metal products industry(excluding machinery and equipment), computer,
electronics and optical product, electrical product, machinery or equipment, vehicles,
trailers and semi-trailers industry.
Agriculture including; crop production, animal production
Hotel ; should be star designated hotel
Construction contracting ( must be grade 1 level)
Real estate development
Education and training
Health service
Source: Federal Negarit Gazeta _ No. 4 November 29th 2012,
I have tried to check the regression result between GDPGR and FDI_2(Two year lag) and
GFCF and FDI_2 after 1990. There is positive correlation between GDP and two years lagged
FDI. (please refer table 5 and 6 below). The point that the impact of FDI for economic growth
realized after two years lag support the argument that FDI contributed for economic growth of
Ethiopia but it takes time to use and enjoy the fruit. I also estimated the correlation between
FDI and GFCF for the period after 1990. The result showed that there is a positive correlation
between FDI and GFCF.
Table 5: Estimation result by doing GDPGR as dependent variable after year 1990.
Explanatory Variables R2
= 71 and F Value = 0.000
lnFDI_2 0.013
(0.024)**
Source: Stata result NB: * and ** are stationary at 1% and 5% respectively.
Table 5 shows that, there is positive correlation between GDP and two years lagged FDI.

52
Table 6: Estimation result by making GFCF as dependent Variable after year 1990.
Explanatory Variables R2
= 71 and F Value = 0.000
Ln FDI_2 2.044
(0.000)*
Source: Stata result NB: * and ** are stationary at 1% and 5% respectively