Embed Size (px)
Citation preview

Yosemite National ParkCalifornia
USA
Potential Impact of Fire Management on Carbon Emissions in Yosemite National Park
Leland Tarnay, Ph.D., National Park Service, Yosemite NP
Brett Davis, US Forest Service--Aldo Leopold Institute, Missoula, MT
Jan van Wagtendonk, U.S. Geological Survey, Yosemite NP

Yosemite National ParkCalifornia
USA
Talk Outline• GHG emissions, air quality, and fire-
related policies • Case study in S. Fork of the Merced
River (Yosemite NP)• Modeled and actual impacts on
landscape carbon stocks• Stock protection vs. emissions reduction• Conclusions
Yosemite National ParkCalifornia
USA
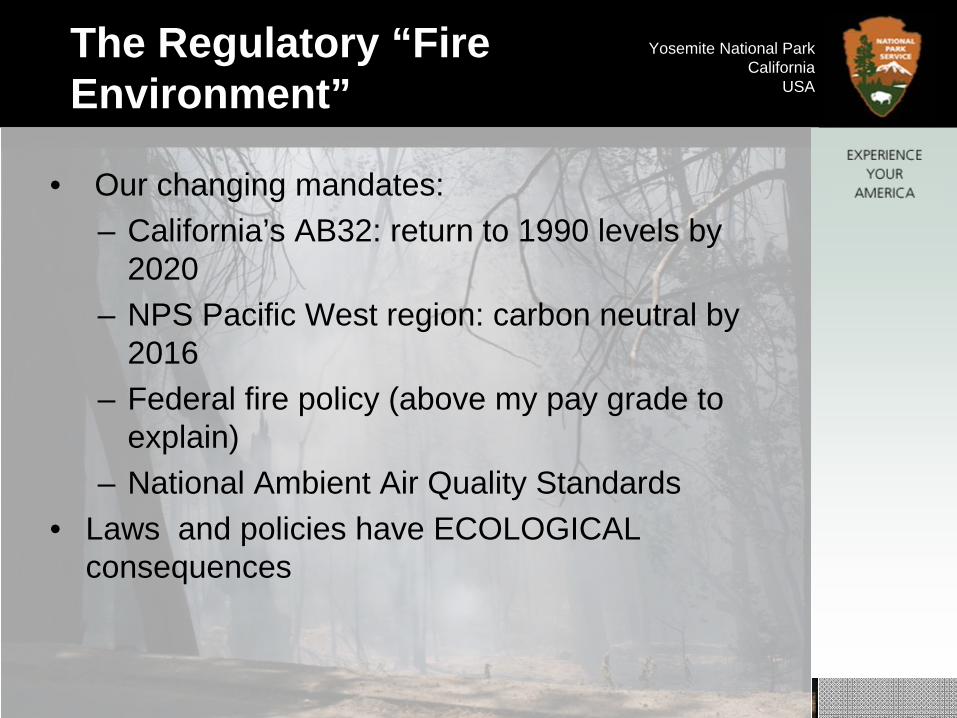
The Regulatory “Fire Environment”
• Our changing mandates:– California’s AB32: return to 1990 levels by
2020– NPS Pacific West region: carbon neutral by
2016– Federal fire policy (above my pay grade to
explain)– National Ambient Air Quality Standards
• Laws and policies have ECOLOGICAL consequences

Yosemite National ParkCalifornia
USAYosemite as Case Study
• Fire policy, and climate, have altered the Yosemite landscape
• Has it changed our carbon budgets?
Yosemite National ParkCalifornia
USA
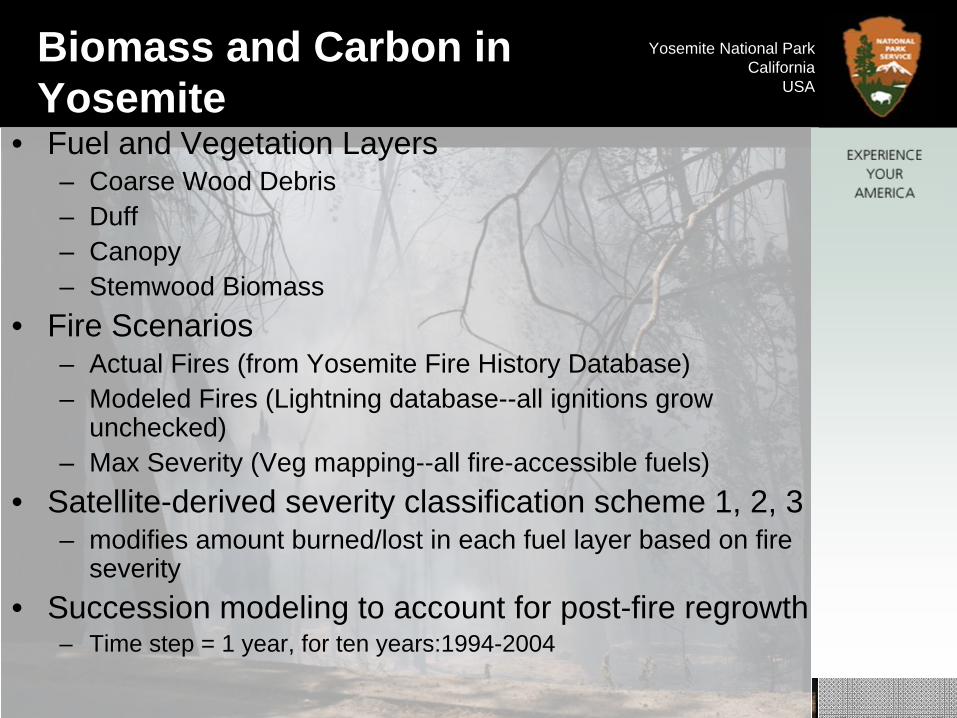
Biomass and Carbon in Yosemite
• Fuel and Vegetation Layers– Coarse Wood Debris– Duff– Canopy– Stemwood Biomass
• Fire Scenarios– Actual Fires (from Yosemite Fire History Database)– Modeled Fires (Lightning database--all ignitions grow
unchecked) – Max Severity (Veg mapping--all fire-accessible fuels)
• Satellite-derived severity classification scheme 1, 2, 3 – modifies amount burned/lost in each fuel layer based on fire
severity• Succession modeling to account for post-fire regrowth
– Time step = 1 year, for ten years:1994-2004

Yosemite National ParkCalifornia
USA
Yosemite Biomass Map Bottom Up vs. Top Down

Yosemite National ParkCalifornia
USA
Yosemite Biomass Map Bottom Up vs. Top Down

Yosemite National ParkCalifornia
USA
Yosemite Biomass Map Bottom Up vs. Top Down

Yosemite National ParkCalifornia
USA
The South Fork Merced Study Area
• Tools:– Fire Spread Modeling (FARSITE) to look at what fires
would have done • Historic meteorology• Fire history
– Succession Modeling• Bret Davis-S.Fork only
– Carbon/Stock Accounting• DBH, allometry, fuels and vegetation plots
• Goal: Preliminary look at consequences for carbon stocks of unregulated fire growth– Emissions scale proportionally with stock changes

Yosemite National ParkCalifornia
USA
Other Assumptions and Methods
• Sums of biomass only taken over areas that modeled burning covered
• No accounting for accumulation of stemwood, canopy, cwd, or duff after max post fire—– surface fuels do accumulate according to standard
values in Bret’s succession model…– This is an underestimate of fuel accumulation

Yosemite National ParkCalifornia
USA
Results: Adding it up

Yosemite National ParkCalifornia
USA
Results: Adding it up

Yosemite National ParkCalifornia
USA
Results: Adding it up

Yosemite National ParkCalifornia
USA
Results: Adding it up

Yosemite National ParkCalifornia
USA
Results: Adding it up

Yosemite National ParkCalifornia
USA
Results: Adding it up

Yosemite National ParkCalifornia
USASummary
• Most of the carbon in these fuels layers (mostly stemwood) appears “resistant” to historically modeled, unchecked fires
• The other part “vacations” in the atmosphere before coming back as biomass regrows
• These natural severity fires hardly touched the stemwood biomass; high severity did.
• Based on $400/acre fire use management costs, this translates to about to about $2 per ton CO2EQ to maintain the resistant biomass in place, assuming:
– Fire is unplanned fire (i.e., no active ignition)– Biomass C converts completely to CO2

Yosemite National ParkCalifornia
USA
Carbon Balance in a Warming Climate
3/3/2009
FLARE.exe.lnk

Yosemite National ParkCalifornia
USA
Carbon Balance in a Warming Climate
3/3/2009
FLARE.exe.lnk

Yosemite National ParkCalifornia
USA
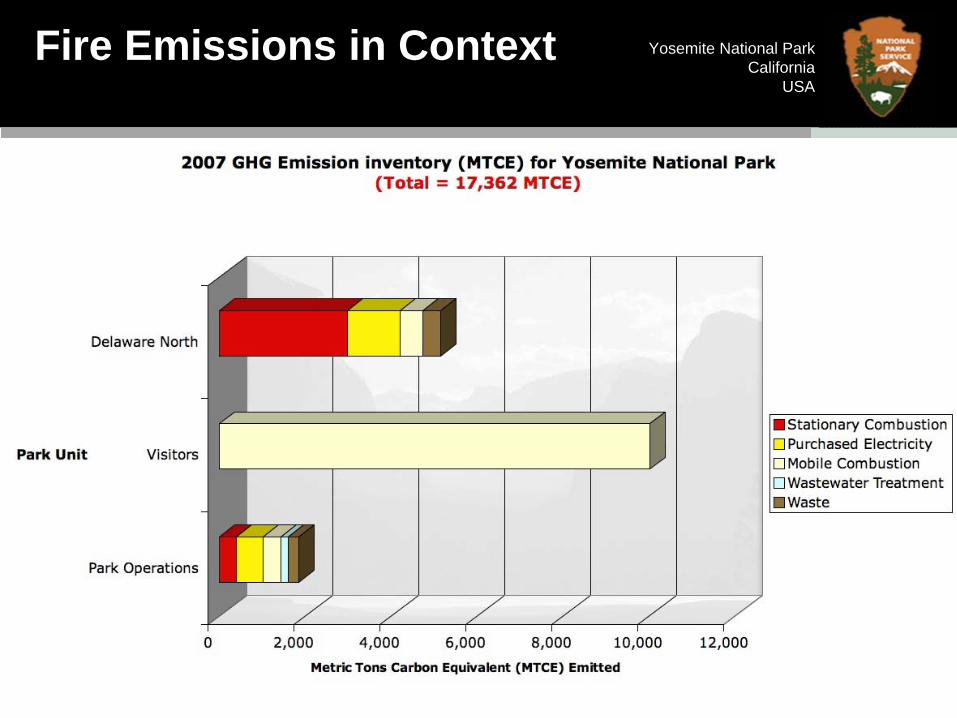
Fire Emissions in Context
• Yosemite lost ~42,000 Mg C from all forest fires in 2007, according to emission models
• Satellite data says Yosemite’s forest emitted 310,000 Mg C over that
• Total Yosemite stemwood biomass is about 58,000,000 Mg C
• Small changes in large stocks are still large
Yosemite National ParkCalifornia
USA
Fire Emissions in Context
• Yosemite lost ~42,000 Mg C from all forest fires in 2007, according to emission models
• Satellite data says Yosemite’s forest emitted 310,000 Mg C over that
• Total Yosemite stemwood biomass is about 58,000,000 Mg C
• Small changes in large stocks are still large

Yosemite National ParkCalifornia
USA
Conclusions
• Modeling fire could be one method for determining amount of “resistant” carbon in fire-dependant forests– i.e., how much of fire-caused stock reductions are relatively
permanent.
• Carbon stocks (and potential fire emissions) are vast compared to fluxes
• Warming landscapes tend to lose carbon; stocks in forested, fire-dependant landscapes may be especially vulnerable and unstable
• Fire emissions can swamp gains in other sectors– And to the extent they are preventable, should they count?
• What are the smoke tradeoffs? – Air pollutant emissions scale linearly with greenhouse gases

Yosemite National ParkCalifornia
USA
Acknowledgements
• Brett Davis and Jan van Wagtendonk, co-authors• Carol Miller--allometry• Peggy Moore—veg plots• Kent van Wagtendonk—GIS, map support