Embed Size (px)
Citation preview
Impact of Eye Tracking Analysis on Knowledge GainPrediction
Authored by: Ruth Okoilu AkintundeNorth Carolina State University
Reviewed by: Veronica CateteNorth Carolina State University
ABSTRACTKnowledge modeling as students interact with intelligenttutoring systems (ITS) has been performed using log filesfeaturing student’s performance, response time and knowl-edge component (KC). However, this approach leaves outstudent’s eye activity while learning, an important mode ofstudent interaction with these systems, which when com-bined with log files can improve knowledge modeling. Inthis study, we introduce a multi-modal student modelingframework that fuses two modalities: log files and eye track-ing records. We directly compared log files alone (LG), eyetracking records alone (ET) and late fusion (LF) of thetwo modalities to effectively predict learning gains. Thisresearch focuses on: i) a thorough pre-processing of raweye tracking data to extract useful eye actions such as fix-ations, saccade and blink, , ii) a comparison of two frame-works namely: Random Forests and Long Short Term Mem-ory networks (LSTM) for learning gain prediction, (iii) acomparison of two modalities namely: Log files and Eyetracking data for learning gain prediction and iv) an im-plementation of a dynamically reliable fusion scheme thatsignificantly improves the accuracy of student modeling out-comes in a multi-agent, adaptive hypermedia learning envi-ronment, Metatutor. Experiments conducted on log filesand eye tracking records generated as students interactedwith Metatutor, confirms that eye tracking is as good aslog files for student modeling and a multimodal fusion ofboth data streams significantly enhances this performance.Establishing that eye tracking can adequately model the de-tection of knowledge gain in college students, suggests thatthis modality could be explored in assessing learning in stu-dents with learning disorders such as autism and dyslexia,before an assessment test is administered. This improve-ment in student modeling can enhance personalization ineducational processes.
KeywordsKnowledge modeling, Eye tracking, Multi-modal learning,Recurrent Neural Networks, Late fusion
1. INTRODUCTIONHypermedia learning environments have been effective forassessing self-regulated learning (SRL) [1]. This assessmentis essential for the development of adaptive and personal-ized learning platforms. In this work, we explore the poten-tials of leveraging information about student eye actions andeye movement patterns to improve the accuracy of model-ing SRL. We use an hypermedia-based intelligent tutoringsystem (ITS) - Metatutor, as a case study.
1.1 Overview of MetatutorMetatutor is a multi-agent, adaptive hypermedia learningenvironment, designed to trace knowledge and model learn-ers’ SRL while learning about the human circulatory sys-tems. [1]. Metatutor uses instructional scaffolding, [12]one of the four ITS teaching strategies, the other three be-ing: socratic questioning, guided discovery and game-basedlearning [35]. Scaffolding is a learning process designed topromote a deeper learning by helping the learner figure outthe task at hand on their own. The Metatutor environmentcontains several hundreds of static images and paragraphsof learning materials as shown in Figures 1, 5 and 6. Asstudents interact with the system, they set important sub-goals relating to the knowledge they wish to acquire. Fourpedgogical agents guide students through a 2 hour learningsession and engage in a tutorial dialogue in order to scaffoldstudents’ choice of appropriate sub-goals. These agents in-clude: Gavin, Pam, Mary and Sam. Gavin the Guide intro-duced students to the session, and administered self-reportquestionnaires, as well as pre- and post-tests. Pam the Plan-ner provided feedback regarding the student’s proposed sub-goal. Mary the Monitor prompted students to engage inmetacognitive monitoring strategies, such as judgment oflearning [JOL], feeling of knowing [FOK], content evaluation[CE], and monitoring progress towards goals [MPTG]. Samthe Strategizer prompted students to create summaries, andprovided them feedback on whether the summary was toolong, too short, or done correctly. [39] The system recordsstudent performance (correct/incorrect) on each step (i.e.question), student response time on each step (i.e. timespent on each question) as well as pre-test and post-testscores. These information are contained in the log files. Eye-Tracking data was recorded using an SMI iView RED at arate of 120 frames per second. Students were seated 70 cmfrom the monitor, which was “47 x 30” cm, and has a screenresolution of 1680 x 1050 pixels. The eye-tracker capturesstudents’ gaze patterns and actions as they view differentregions of the screen at each section of the study [39]. A
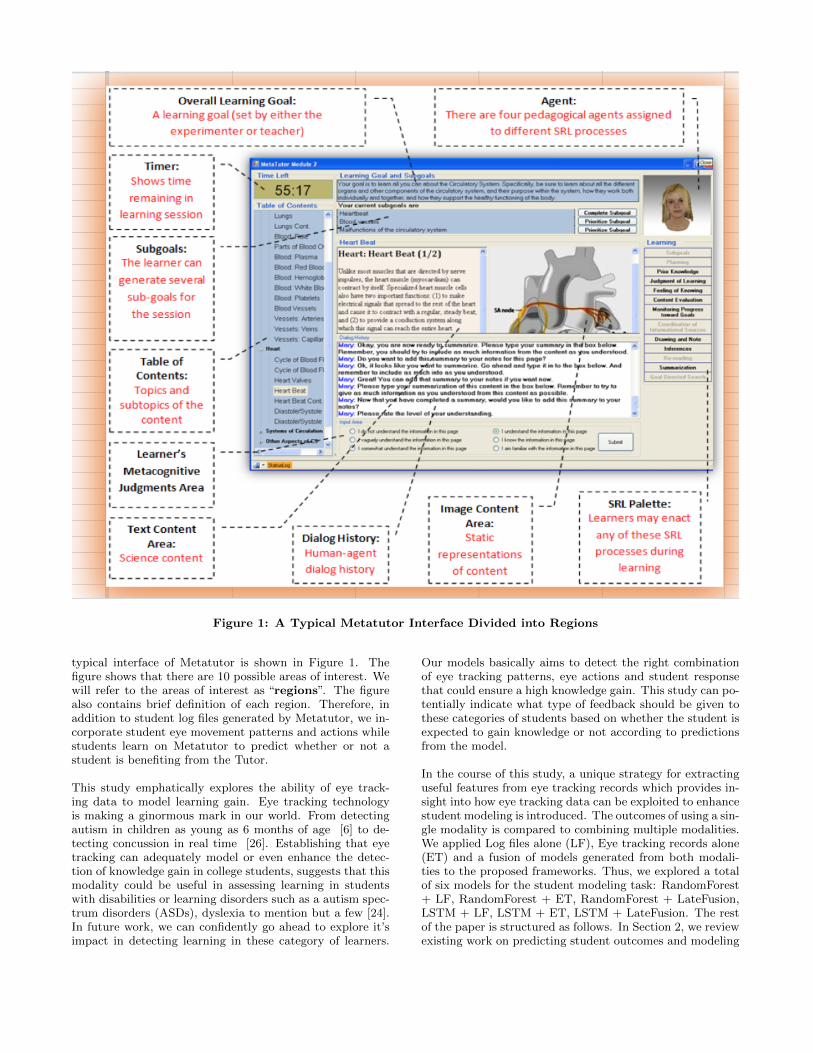
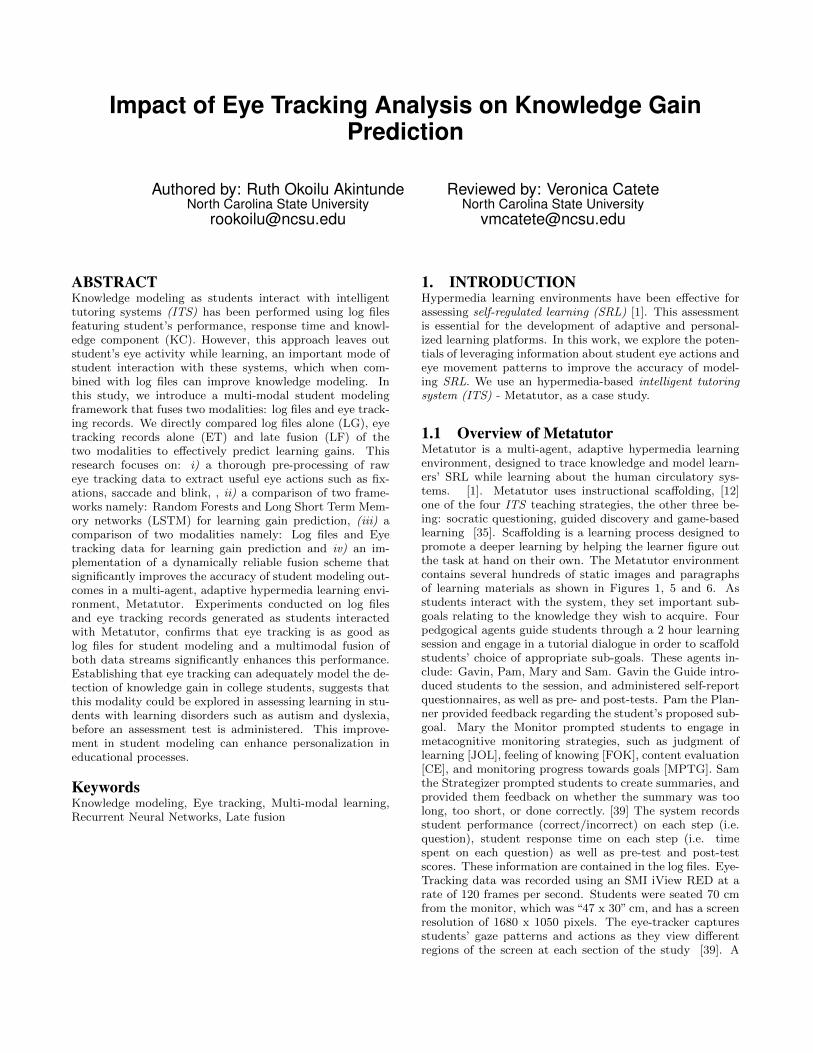
Figure 1: A Typical Metatutor Interface Divided into Regions
typical interface of Metatutor is shown in Figure 1. Thefigure shows that there are 10 possible areas of interest. Wewill refer to the areas of interest as “regions”. The figurealso contains brief definition of each region. Therefore, inaddition to student log files generated by Metatutor, we in-corporate student eye movement patterns and actions whilestudents learn on Metatutor to predict whether or not astudent is benefiting from the Tutor.
This study emphatically explores the ability of eye track-ing data to model learning gain. Eye tracking technologyis making a ginormous mark in our world. From detectingautism in children as young as 6 months of age [6] to de-tecting concussion in real time [26]. Establishing that eyetracking can adequately model or even enhance the detec-tion of knowledge gain in college students, suggests that thismodality could be useful in assessing learning in studentswith disabilities or learning disorders such as a autism spec-trum disorders (ASDs), dyslexia to mention but a few [24].In future work, we can confidently go ahead to explore it’simpact in detecting learning in these category of learners.
Our models basically aims to detect the right combinationof eye tracking patterns, eye actions and student responsethat could ensure a high knowledge gain. This study can po-tentially indicate what type of feedback should be given tothese categories of students based on whether the student isexpected to gain knowledge or not according to predictionsfrom the model.
In the course of this study, a unique strategy for extractinguseful features from eye tracking records which provides in-sight into how eye tracking data can be exploited to enhancestudent modeling is introduced. The outcomes of using a sin-gle modality is compared to combining multiple modalities.We applied Log files alone (LF), Eye tracking records alone(ET) and a fusion of models generated from both modali-ties to the proposed frameworks. Thus, we explored a totalof six models for the student modeling task: RandomForest+ LF, RandomForest + ET, RandomForest + LateFusion,LSTM + LF, LSTM + ET, LSTM + LateFusion. The restof the paper is structured as follows. In Section 2, we reviewexisting work on predicting student outcomes and modeling
knowledge gain. Section 3 describes the frameworks used forthe study. Data pre-processing, which gives insight to howthe log files were converted into time steps and the strategicfeature extraction performed on the eye tracking files are dis-cussed in Section 4. Section 5 describes fusion schemes andimplementation. Experimental configurations are discussedin Section 6 while Section 7 and 8 provide results, conclu-sions and some thoughts regarding future possible directionsof study.
2. RELATED WORKThere have been a number of studies to successfully cap-ture the human cognitive process in intelligent tutoring sys-tems. We review existing knowledge modeling approachesthat used single modalities such as student’s response time,performance (correct/incorrect), and knowledge componentor subgoal, gaze information as well as existing efforts toincorporate gaze data in enhancing student modeling.
2.1 Student modeling using Single ModalityThe evidence of effective student modeling is the ability toimprove predictive accuracy of student knowlegde gain dur-ing learning interactions [2]. Pre-test scores are obtainedbefore learning begins while post-test scores are obtained atthe end of the learning process. If a post-test score is higherthan the pre-test the student has likely benefited from thesystem.
2.1.1 Using Log FilesThe studies in [8, 25, 20, 21] use components of the log filesfor student modeling, however different modeling techniqueswere employed. [8] employs Bayesian Knowledge Tracing(BKT) to infer students’ knowledge states mainly from stu-dents performance (i.e. correct or incorrect answer) on eachstep. BKT and it’s variants can be considered a very popularmethod for modeling student learning [25]. [25] comparedBKT and LSTM for predicting both student performanceand learning gain. [20] proposed that using performancealone for modeling knowledge gain could be noisy. There-fore, they combined performance and student response timefor student modeling. [21] incorporated student responsetime and tutor instructional interventions into student mod-eling. [32] introduced deep knowledge tracing (DKT) as abetter modeling technique after comparing RNNs with BKTfor student modeling.
2.1.2 Using Eye Tracking[4] uses eye tracking to infer learning by dividing the screen
into areas of interest (AOI) and using the following fea-tures: rate of fixations, number of fixations, duration oflongest fixation and proportion of time, per AOI. [24] useseye tracking to find attention focus in children withautism and dyslexia. The work also provides a compre-hensive definition of eye movement types such as fixationand saccade. [31] discusses eye-blink rate as a measure totrack changes in working memory during task performanceand shows that eye blinks indicate the reallocation ofmental resources. [16] uses eye tracking records to trainsaliency model which enables applications that automati-cally take into account a notion of human perception i.e.where humans look when they stare at a scene and whatpart of the scene they are interested in.
2.2 Multiple Modalities For Student modelingA study by Deng et al. shows that incorporating eye track-ing patterns with haptics in game-based learning environ-ments provides the opportunity to analyze the learning pro-cess [9]. They used saccades which aligns the high acuitypart of the retina, on the most informative aspect of thescene, they detect areas on the scene important to each userand enhance serious games. [11] shows that incorporatinggaze data such as fixations per second into student mod-eling can contribute to a new generation of student modelsfor game-based learning environments.
These existing works show that incorporating eye trackinghas been found to improve cognitive process detection, how-ever, its effects on instructional scaffolding learning environ-ments are yet to be explored in detail. We will explore theimpacts of single mode and multimodal analysis on studentmodels for scaffolding learning environments. A novel as-pect to this work is the chosen method of analysis. Whileexisting works which use eye tracking data such as [4] em-ploy traditional machine learning methods, we explore neu-ral networks in order to leverage the high predictive capabil-ity of these methods. Also, we chose neural network modelsover the popular method for student modeling (BKT), forthe following reasons. Firstly, BKT places a student in astate based on their performance (correct/incorrect). Thisis binary and just takes one variable whereas, in this workmultiple variables come to play as we will see in subsequentsections. However, neural network models such as LSTM al-low multivariate inputs as long as each variate can be vector-ized. [25]. Secondly, neural network models do not requireexplicitly encoded domain concepts. Lastly, they have beenshown to outperform standard BKT for student knowledgemodeling [32, 29]. Furthermore, unlike existing works, weelaborately explored the effects of using eye tracking dataalone for student modeling and in addition to this, we fusedthe scores from both modalities to produce a more robustmodel.
2.3 Quantized Learning GainPredicting learning gain is an important task which mod-els student interaction with ITS and helps detect if stu-dent is benefiting from a tutoring system or not. Learninggain has evolved over the years. The concept of learninggain is formally defined as the difference between the skills,competencies, content knowledge and personal developmentdemonstrated by students at two points in time - before thelearning process and after the learning process [27]. Manystudies used Learning Gain (LG) which is calculated as LG= post - pre, where pre and post refer to a student’s pre-testand post-test scores [23]. Normalized Learning Gain (NLG)is an improved variant of LG which was proposed to ensurea consistent analysis over a population with different levelsof proficiency. NLG = post - pre /1 - pre [30] where 1 is themaximum score for pre- and post-tests. One limitation ofNLG is that a negative NLG could occur when a student getshigher pretest score than post-test score. Thus, NLG can beproblematic for students with high pretest scores and a de-cline in post-test score. Therefore, we used a measurementcalled Quantized Learning Gain (QLG) [20] to determinewhether a student has benefited from a learning environ-ment. QLG was introduced in [20]. To calculate a stu-dent’s QLG, students were first divided into“low”,“medium”
and “high” performance groups depending on whether theyscored below the 33rd percentile, between the 33rd and 66thpercentile, or higher than the 66th percentile in pretest re-spectively [25]. The same procedure was repeated for post-test. Once a student’s pre- and post-test performance groupsare recorded, a “low” QLG is assigned to the students whoeither moved from a higher performance group in the pretestto a lower performance group in the post-test, or stayed ata “low” or “medium” group while a “high” QLG is assignedto students who moved from a lower performance group inthe pretest to a higher performance group in the post-test orremained in a “high” performance group. This is therefore abinary prediction task (0 or 1) which determines if studentwill benefit from Metatutor. Where 0 means student has alow QLG and does not benefit while 1 means student has ahigh QLG and benefits.
In summary, we investigate two important research ques-tions regarding learning gain prediction: 1) Can studentseye patterns and actions alone, while studying, model stu-dent knowledge gain? 2) Does multi-modal analysis performbetter for the task of learning gain prediction? We basicallycompare the effectiveness of single data modality versus mul-tiple modalities for predicting student knowledge gain.
3. METHODSWe compare the use of Random Forests (RF) and LongShort Term Memory (LSTM). Random forest is a robustlearning method that builds many small, weak decision treesin parallel and combines the trees to form a single, stronglearner by taking the majority vote. In practice, randomforests are often found to be very accurate learning algo-rithms. [5, 3]
Figure 2: LSTM Architecture
Long Short Term Memory (LSTM) [15] is a special typeof deep learning model. LSTM is a variant of RecurrentNeural Network (RNN) [7, 28] and was introduced to solvesome limitations of RNN such as vanishing and explodinggradient [15]. LSTMs like RNNs are effective in capturingunderlying temporal structures in time series data. Theyfeed the data from previous hidden states as an additional
input into the current iteration building up memory basedon past events. However, in addition, it prevents loss of in-formation through time using tanh activation, specific cellsand gates to preserve information over long distances un-like RNN which lacks these features [18]. This makes LSTMsuitable for modeling dynamic information in student mod-eling which involves long series of steps. LSTM is useful forlong-time intervals and modeling complicated rules withoutmany assumptions or prior knowledge from human experts.The LSTM cell is a specifically designed unit of logic thatwill help reduce the vanishing gradient problem. The timedependence and effects of previous inputs are controlled byan interesting concept called a forget gate, which determineswhich states are remembered or forgotten. Two other gates,the input gate and output gate, are also featured in LSTMcells. As shown in Figure 2, we stack 4 LSTM layers on topof each other, making the model capable of learning higher-level temporal representations.
4. DATA PRE-PROCESSINGDuring the study, log files and eye-tracking data were col-lected from 64 college students. However, in a data vali-dation process described in [4], some participants were dis-carded as a result of eye-tracking errors that generated in-valid gaze samples. This was necessary because the missingdata makes it difficult to draw reliable inferences from theseparticipants’ attention patterns. The validation process re-sulted in discarding 16 users [4]. Seven other participantswere removed because they were missing key pieces of dataleaving a total of 41 for the actual classification study. Thedataset therefore consists of log file and eye tracking recordsof 41 students who interacted with Metatutor. Before learn-ing students are required to take a pre-test to measure eachstudent’s prior knowledge. While learning on the system,students are asked to read passages, interact with diagramsand answer multiple choice quizzes. Afterwards, the stu-dents take a post-test. Quantized knowledge gain is thencalculated as described in section 2. This is our groundtruth. At each time step, the following information are col-lected: student response time, performance on each step,subgoal (i.e. knowledge component (KC) or skill requiredfor each step), these make up the log files, while left and rightgaze movement, corresponding coordinates on the screen aswell as eye action (such as fixation, blinking and saccade)make up the eye tracking records.
4.1 Log FilesWe processed these features into an appropriate format foranalysis. We will henceforth refer to “log files” as “LF”.The whole process of learning with Metatutor (after tak-ing the pre-test) lasted a little over 2 hours. During thistime, students were presented with an introductory videoto the system, they set two sub-goals with the assistanceof Pam the Planner. They were then presented with a fewmore introductory videos, and when those were completed,they began the learning session. During leaning, studentscould have chosen which pages to navigate to, they couldhave read the text and viewed the diagrams, or they couldhave engaged in different cognitive (e.g. take notes, sum-marize) and metacognitive (e.g., JOL, CE) SRL processes[39]. Also, during the learning session, student took quizzesto evaluate their knowledge of a topic. They could also takenote and make summaries which can be revised before the
quiz. For the current study, a step is known as a quiz. Stu-dents took an average of 43 multiple choice quizzes. Timespent on each step was recorded. We will call this featurethe “response time” or “speed”. We perform discretizationusing normal distribution on the “response time” to groupeach student into either, slow, fast or normal categories foreach step. Slow group includes time values that are greaterthan one standard deviation above the mean, fast group in-cludes time values that are less than one standard deviationbelow the mean, while normal includes the remaining timevalues. A student might be in the slow group in one stepand be in the normal or fast group in other steps based onstudent speed in answering the question at that step.
4.1.1 Outlier RemovalGrouping of students into fast, normal or slow group foreach question type was done after removing outlying timevalues. The quizzes were timed and as a result outlying val-ues resulting from student’s need to use the bathroom orstep out for other reasons occurred in the dataset. Therewas a need to identify whether longer time spent on a quizwas due to lack of knowledge of the question or absence ofthe student at the moment. We compared two methods foroutlier removal. The first method was Standard Deviations(SD) around the mean while the second was Median Ab-solute Deviation (MAD) around the median. The formerwas proven to produce a skewed result firstly because it de-pends on the mean and standard deviation whose values arestrongly impacted by outliers. The second reason is thatit assumes that the distribution is normal even with out-lying values [19, 36]. Using the latter, the high values ofoutliers neither significantly influence the median value northe Median Absolute Deviation (MAD). In addition, whenstudents were grouped using outlier free dataset producedby both methods, the former failed to produce a normaldistribution while the latter achieved the desired result.
4.1.2 FeaturesIn addition to speed, we extracted student performance (cor-rect/incorrect) on each step as well as the subgoals or skillthey acquired while interacting with the system before thatstep. Therefore speed, performance and subgoal are the fea-tures we selected for assessing student learning. These 3features have been effective for student modeling. [20, 25,37]. The resulting dataset from LF is therefore of a timeseries nature such that each student has a sequence of ob-servations. For example, if student answered 50 quizzes, hewould have 50 observations in the dataset. Each studenthas different sequence length as a result of varying numberof questions answered.
4.2 Eye TrackingWe also extracted useful features from the “eye trackingfiles”, which we will henceforth refer to as the “ET”.
During the process of interacting with Metatutor environ-ment, eye tracking records for each section of the processwas recorded. As explained earlier, the learning sections in-clude times where student was watching a tutorial video,reading text and image content, answering quizzes, takingnotes, making summaries, answering questionnaires to men-tion but a few. For the purpose of this study, we only ex-tracted eye tracking records where students were studying
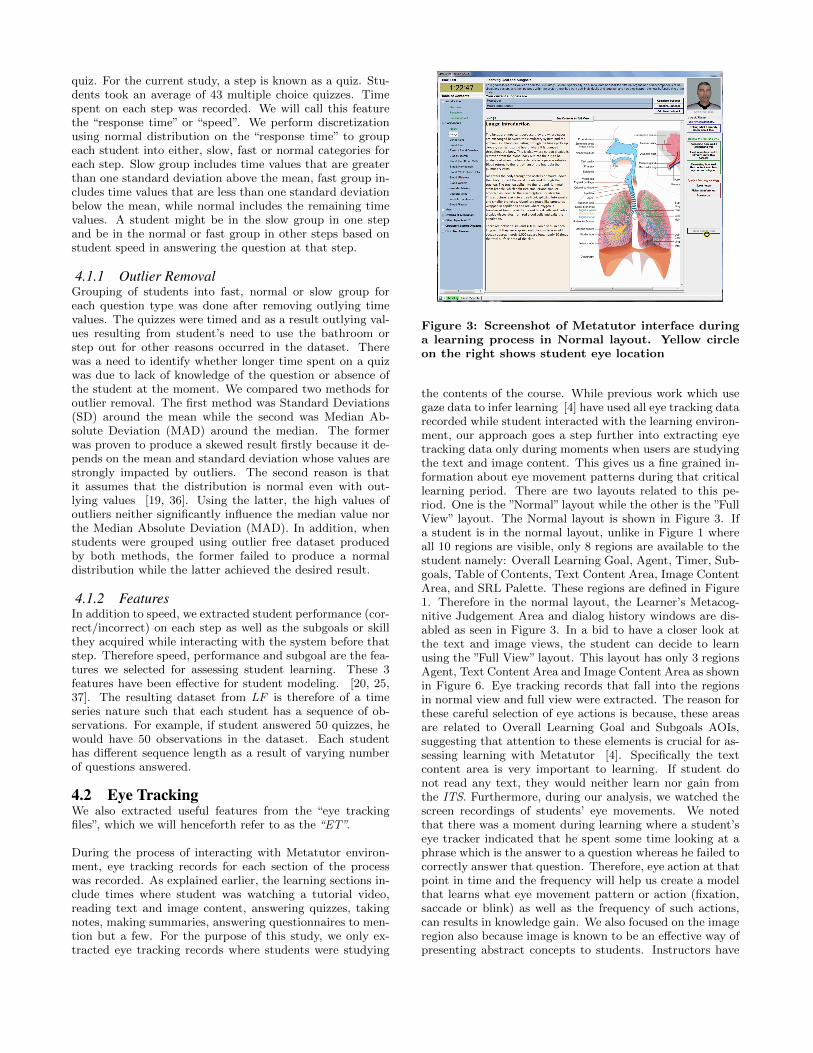
Figure 3: Screenshot of Metatutor interface duringa learning process in Normal layout. Yellow circleon the right shows student eye location
the contents of the course. While previous work which usegaze data to infer learning [4] have used all eye tracking datarecorded while student interacted with the learning environ-ment, our approach goes a step further into extracting eyetracking data only during moments when users are studyingthe text and image content. This gives us a fine grained in-formation about eye movement patterns during that criticallearning period. There are two layouts related to this pe-riod. One is the ”Normal” layout while the other is the ”FullView” layout. The Normal layout is shown in Figure 3. Ifa student is in the normal layout, unlike in Figure 1 whereall 10 regions are visible, only 8 regions are available to thestudent namely: Overall Learning Goal, Agent, Timer, Sub-goals, Table of Contents, Text Content Area, Image ContentArea, and SRL Palette. These regions are defined in Figure1. Therefore in the normal layout, the Learner’s Metacog-nitive Judgement Area and dialog history windows are dis-abled as seen in Figure 3. In a bid to have a closer look atthe text and image views, the student can decide to learnusing the ”Full View” layout. This layout has only 3 regionsAgent, Text Content Area and Image Content Area as shownin Figure 6. Eye tracking records that fall into the regionsin normal view and full view were extracted. The reason forthese careful selection of eye actions is because, these areasare related to Overall Learning Goal and Subgoals AOIs,suggesting that attention to these elements is crucial for as-sessing learning with Metatutor [4]. Specifically the textcontent area is very important to learning. If student donot read any text, they would neither learn nor gain fromthe ITS. Furthermore, during our analysis, we watched thescreen recordings of students’ eye movements. We notedthat there was a moment during learning where a student’seye tracker indicated that he spent some time looking at aphrase which is the answer to a question whereas he failed tocorrectly answer that question. Therefore, eye action at thatpoint in time and the frequency will help us create a modelthat learns what eye movement pattern or action (fixation,saccade or blink) as well as the frequency of such actions,can results in knowledge gain. We also focused on the imageregion also because image is known to be an effective way ofpresenting abstract concepts to students. Instructors have
reported that their use of images in the has improved thelearning process [14].
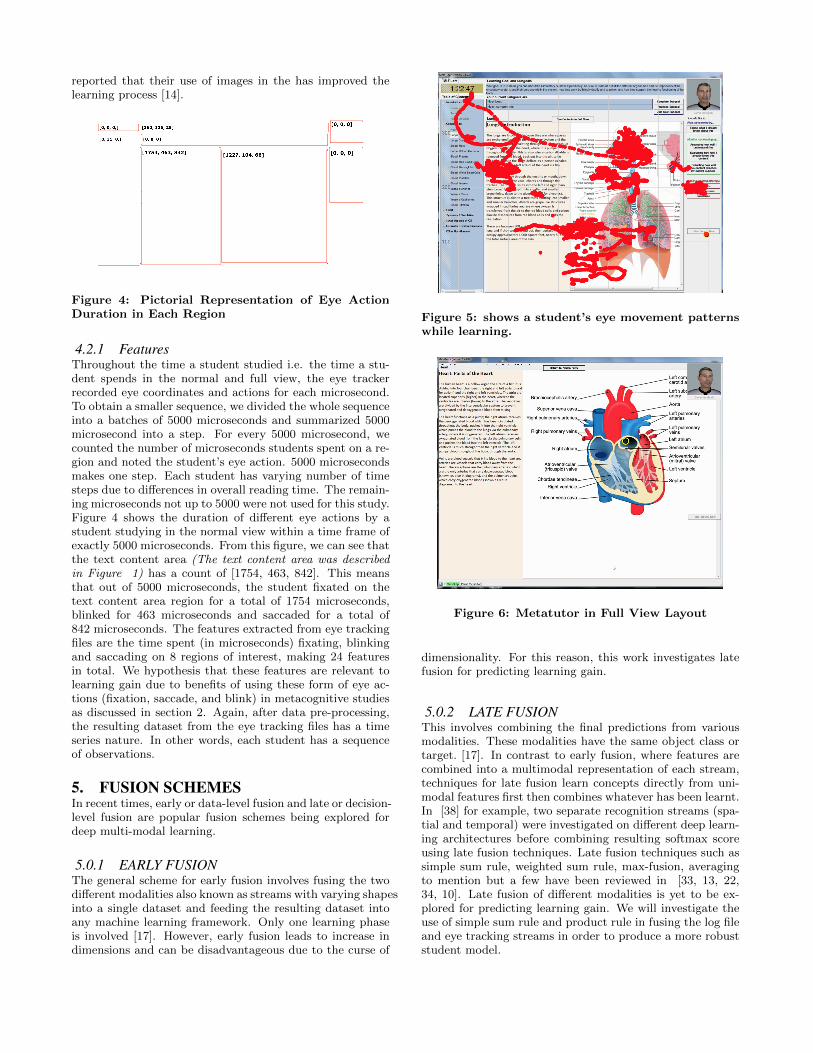
Figure 4: Pictorial Representation of Eye ActionDuration in Each Region
4.2.1 FeaturesThroughout the time a student studied i.e. the time a stu-dent spends in the normal and full view, the eye trackerrecorded eye coordinates and actions for each microsecond.To obtain a smaller sequence, we divided the whole sequenceinto a batches of 5000 microseconds and summarized 5000microsecond into a step. For every 5000 microsecond, wecounted the number of microseconds students spent on a re-gion and noted the student’s eye action. 5000 microsecondsmakes one step. Each student has varying number of timesteps due to differences in overall reading time. The remain-ing microseconds not up to 5000 were not used for this study.Figure 4 shows the duration of different eye actions by astudent studying in the normal view within a time frame ofexactly 5000 microseconds. From this figure, we can see thatthe text content area (The text content area was describedin Figure 1) has a count of [1754, 463, 842]. This meansthat out of 5000 microseconds, the student fixated on thetext content area region for a total of 1754 microseconds,blinked for 463 microseconds and saccaded for a total of842 microseconds. The features extracted from eye trackingfiles are the time spent (in microseconds) fixating, blinkingand saccading on 8 regions of interest, making 24 featuresin total. We hypothesis that these features are relevant tolearning gain due to benefits of using these form of eye ac-tions (fixation, saccade, and blink) in metacognitive studiesas discussed in section 2. Again, after data pre-processing,the resulting dataset from the eye tracking files has a timeseries nature. In other words, each student has a sequenceof observations.
5. FUSION SCHEMESIn recent times, early or data-level fusion and late or decision-level fusion are popular fusion schemes being explored fordeep multi-modal learning.
5.0.1 EARLY FUSIONThe general scheme for early fusion involves fusing the twodifferent modalities also known as streams with varying shapesinto a single dataset and feeding the resulting dataset intoany machine learning framework. Only one learning phaseis involved [17]. However, early fusion leads to increase indimensions and can be disadvantageous due to the curse of
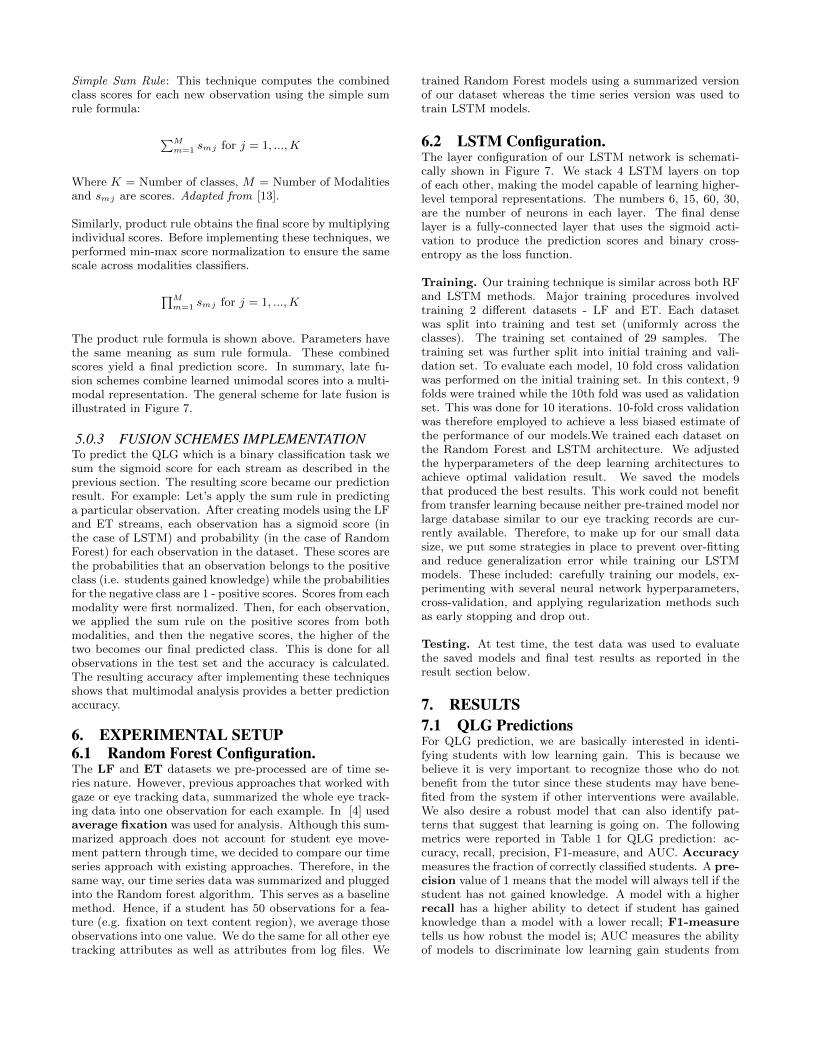
Figure 5: shows a student’s eye movement patternswhile learning.
Figure 6: Metatutor in Full View Layout
dimensionality. For this reason, this work investigates latefusion for predicting learning gain.
5.0.2 LATE FUSIONThis involves combining the final predictions from variousmodalities. These modalities have the same object class ortarget. [17]. In contrast to early fusion, where features arecombined into a multimodal representation of each stream,techniques for late fusion learn concepts directly from uni-modal features first then combines whatever has been learnt.In [38] for example, two separate recognition streams (spa-tial and temporal) were investigated on different deep learn-ing architectures before combining resulting softmax scoreusing late fusion techniques. Late fusion techniques such assimple sum rule, weighted sum rule, max-fusion, averagingto mention but a few have been reviewed in [33, 13, 22,34, 10]. Late fusion of different modalities is yet to be ex-plored for predicting learning gain. We will investigate theuse of simple sum rule and product rule in fusing the log fileand eye tracking streams in order to produce a more robuststudent model.
Simple Sum Rule: This technique computes the combinedclass scores for each new observation using the simple sumrule formula:
∑Mm=1 smj for j = 1, ...,K
Where K = Number of classes, M = Number of Modalitiesand smj are scores. Adapted from [13].
Similarly, product rule obtains the final score by multiplyingindividual scores. Before implementing these techniques, weperformed min-max score normalization to ensure the samescale across modalities classifiers.
∏Mm=1 smj for j = 1, ...,K
The product rule formula is shown above. Parameters havethe same meaning as sum rule formula. These combinedscores yield a final prediction score. In summary, late fu-sion schemes combine learned unimodal scores into a multi-modal representation. The general scheme for late fusion isillustrated in Figure 7.
5.0.3 FUSION SCHEMES IMPLEMENTATIONTo predict the QLG which is a binary classification task wesum the sigmoid score for each stream as described in theprevious section. The resulting score became our predictionresult. For example: Let’s apply the sum rule in predictinga particular observation. After creating models using the LFand ET streams, each observation has a sigmoid score (inthe case of LSTM) and probability (in the case of RandomForest) for each observation in the dataset. These scores arethe probabilities that an observation belongs to the positiveclass (i.e. students gained knowledge) while the probabilitiesfor the negative class are 1 - positive scores. Scores from eachmodality were first normalized. Then, for each observation,we applied the sum rule on the positive scores from bothmodalities, and then the negative scores, the higher of thetwo becomes our final predicted class. This is done for allobservations in the test set and the accuracy is calculated.The resulting accuracy after implementing these techniquesshows that multimodal analysis provides a better predictionaccuracy.
6. EXPERIMENTAL SETUP6.1 Random Forest Configuration.The LF and ET datasets we pre-processed are of time se-ries nature. However, previous approaches that worked withgaze or eye tracking data, summarized the whole eye track-ing data into one observation for each example. In [4] usedaverage fixation was used for analysis. Although this sum-marized approach does not account for student eye move-ment pattern through time, we decided to compare our timeseries approach with existing approaches. Therefore, in thesame way, our time series data was summarized and pluggedinto the Random forest algorithm. This serves as a baselinemethod. Hence, if a student has 50 observations for a fea-ture (e.g. fixation on text content region), we average thoseobservations into one value. We do the same for all other eyetracking attributes as well as attributes from log files. We
trained Random Forest models using a summarized versionof our dataset whereas the time series version was used totrain LSTM models.
6.2 LSTM Configuration.The layer configuration of our LSTM network is schemati-cally shown in Figure 7. We stack 4 LSTM layers on topof each other, making the model capable of learning higher-level temporal representations. The numbers 6, 15, 60, 30,are the number of neurons in each layer. The final denselayer is a fully-connected layer that uses the sigmoid acti-vation to produce the prediction scores and binary cross-entropy as the loss function.
Training. Our training technique is similar across both RFand LSTM methods. Major training procedures involvedtraining 2 different datasets - LF and ET. Each datasetwas split into training and test set (uniformly across theclasses). The training set contained of 29 samples. Thetraining set was further split into initial training and vali-dation set. To evaluate each model, 10 fold cross validationwas performed on the initial training set. In this context, 9folds were trained while the 10th fold was used as validationset. This was done for 10 iterations. 10-fold cross validationwas therefore employed to achieve a less biased estimate ofthe performance of our models.We trained each dataset onthe Random Forest and LSTM architecture. We adjustedthe hyperparameters of the deep learning architectures toachieve optimal validation result. We saved the modelsthat produced the best results. This work could not benefitfrom transfer learning because neither pre-trained model norlarge database similar to our eye tracking records are cur-rently available. Therefore, to make up for our small datasize, we put some strategies in place to prevent over-fittingand reduce generalization error while training our LSTMmodels. These included: carefully training our models, ex-perimenting with several neural network hyperparameters,cross-validation, and applying regularization methods suchas early stopping and drop out.
Testing. At test time, the test data was used to evaluatethe saved models and final test results as reported in theresult section below.
7. RESULTS7.1 QLG PredictionsFor QLG prediction, we are basically interested in identi-fying students with low learning gain. This is because webelieve it is very important to recognize those who do notbenefit from the tutor since these students may have bene-fited from the system if other interventions were available.We also desire a robust model that can also identify pat-terns that suggest that learning is going on. The followingmetrics were reported in Table 1 for QLG prediction: ac-curacy, recall, precision, F1-measure, and AUC. Accuracymeasures the fraction of correctly classified students. A pre-cision value of 1 means that the model will always tell if thestudent has not gained knowledge. A model with a higherrecall has a higher ability to detect if student has gainedknowledge than a model with a lower recall; F1-measuretells us how robust the model is; AUC measures the abilityof models to discriminate low learning gain students from
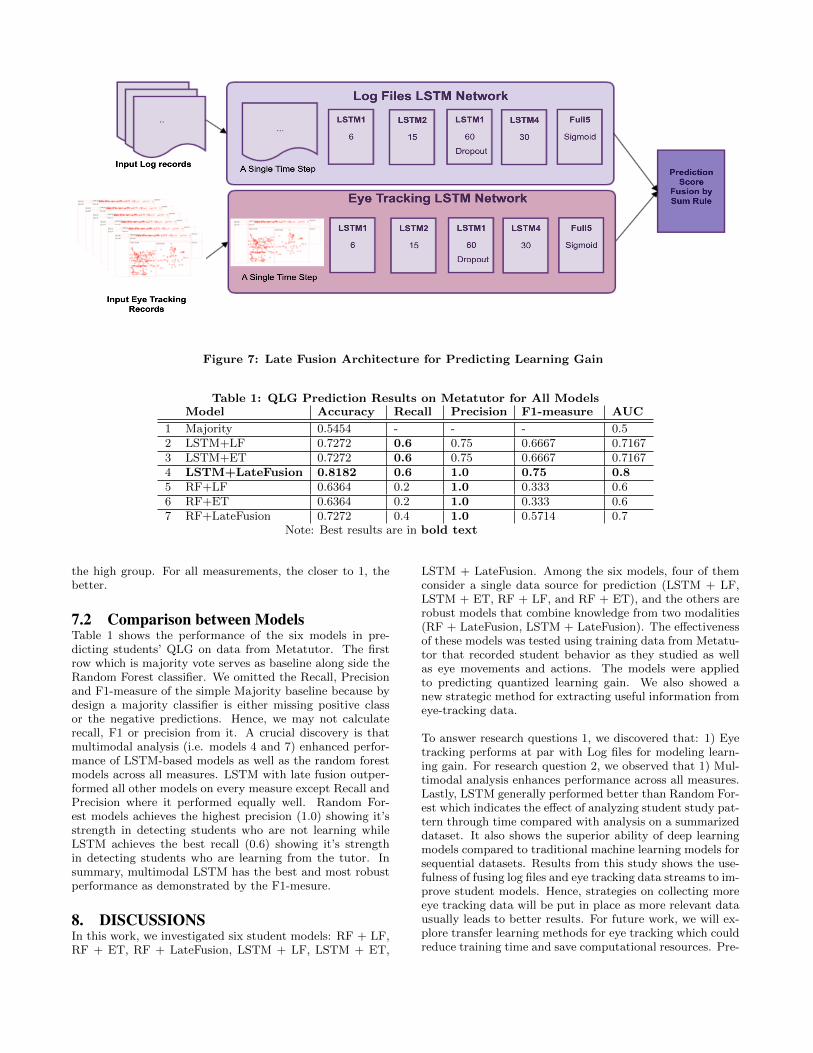
Figure 7: Late Fusion Architecture for Predicting Learning Gain
Table 1: QLG Prediction Results on Metatutor for All ModelsModel Accuracy Recall Precision F1-measure AUC
1 Majority 0.5454 - - - 0.52 LSTM+LF 0.7272 0.6 0.75 0.6667 0.71673 LSTM+ET 0.7272 0.6 0.75 0.6667 0.71674 LSTM+LateFusion 0.8182 0.6 1.0 0.75 0.85 RF+LF 0.6364 0.2 1.0 0.333 0.66 RF+ET 0.6364 0.2 1.0 0.333 0.67 RF+LateFusion 0.7272 0.4 1.0 0.5714 0.7
Note: Best results are in bold text
the high group. For all measurements, the closer to 1, thebetter.
7.2 Comparison between ModelsTable 1 shows the performance of the six models in pre-dicting students’ QLG on data from Metatutor. The firstrow which is majority vote serves as baseline along side theRandom Forest classifier. We omitted the Recall, Precisionand F1-measure of the simple Majority baseline because bydesign a majority classifier is either missing positive classor the negative predictions. Hence, we may not calculaterecall, F1 or precision from it. A crucial discovery is thatmultimodal analysis (i.e. models 4 and 7) enhanced perfor-mance of LSTM-based models as well as the random forestmodels across all measures. LSTM with late fusion outper-formed all other models on every measure except Recall andPrecision where it performed equally well. Random For-est models achieves the highest precision (1.0) showing it’sstrength in detecting students who are not learning whileLSTM achieves the best recall (0.6) showing it’s strengthin detecting students who are learning from the tutor. Insummary, multimodal LSTM has the best and most robustperformance as demonstrated by the F1-mesure.
8. DISCUSSIONSIn this work, we investigated six student models: RF + LF,RF + ET, RF + LateFusion, LSTM + LF, LSTM + ET,
LSTM + LateFusion. Among the six models, four of themconsider a single data source for prediction (LSTM + LF,LSTM + ET, RF + LF, and RF + ET), and the others arerobust models that combine knowledge from two modalities(RF + LateFusion, LSTM + LateFusion). The effectivenessof these models was tested using training data from Metatu-tor that recorded student behavior as they studied as wellas eye movements and actions. The models were appliedto predicting quantized learning gain. We also showed anew strategic method for extracting useful information fromeye-tracking data.
To answer research questions 1, we discovered that: 1) Eyetracking performs at par with Log files for modeling learn-ing gain. For research question 2, we observed that 1) Mul-timodal analysis enhances performance across all measures.Lastly, LSTM generally performed better than Random For-est which indicates the effect of analyzing student study pat-tern through time compared with analysis on a summarizeddataset. It also shows the superior ability of deep learningmodels compared to traditional machine learning models forsequential datasets. Results from this study shows the use-fulness of fusing log files and eye tracking data streams to im-prove student models. Hence, strategies on collecting moreeye tracking data will be put in place as more relevant datausually leads to better results. For future work, we will ex-plore transfer learning methods for eye tracking which couldreduce training time and save computational resources. Pre-
training eye tracking models that can generalize when usedfor transfer learning with new ITS environments is also animportant area to explore. Finally, we hope to explore eyetracking for modeling learning in students with learning dis-orders. We anticipate results which can detect learning asearly as possible (using only eye actions) in the first few min-utes of student’s interaction with the tutor. This will enableus improve learning gain even before any quiz or academictest is administered.
9. REFERENCES[1] J. A. C. A. . G. A. Azevedo, R. Use of hypermedia to
convey and assess self-regulated learning. B.Zimmerman D. Schunk (Eds.), Handbook ofself-regulation of learning and performance, 13(pp.102–121), 2011.
[2] J. Beck and X. Xiong. Limits to accuracy: how wellcan we do at student modeling? In Proceedings of the6th International Conference on Educational DataMining, Memphis, Tennessee, USA, July 6-9, 2013,pages 4–11, 2013.
[3] G. Biau. Analysis of a random forests model. J. Mach.Learn. Res., 13(1):1063–1095, Apr. 2012.
[4] D. Bondareva, C. Conati, R. Feyzi-Behnagh, J. M.Harley, R. Azevedo, and F. Bouchet. Inferring learningfrom gaze data during interaction with an environmentto support self-regulated learning. In ArtificialIntelligence in Education - 16th InternationalConference, AIED 2013, Memphis, TN, USA, July9-13, 2013. Proceedings, pages 229–238, 2013.
[5] L. Breiman. Random forests. Machine Learning,45(1):5–32, 2001.
[6] K. Chawarska, S. Macari, and F. Shic. Decreasedspontaneous attention to social scenes in 6-month-oldinfants later diagnosed with autism spectrumdisorders. Biological Psychiatry, 74(3):195 – 203, 2013.Oxytocin and Autism.
[7] A. Cleeremans, D. Servan-Schreiber, and J. L.McClelland. Finite state automata and simplerecurrent networks. Neural Comput., 1(3):372–381,Sept. 1989.
[8] A. T. Corbett and J. R. Anderson. Knowledge tracing:Modelling the acquisition of procedural knowledge.User Model. User-Adapt. Interact., 4(4):253–278, 1995.
[9] S. Deng, J. A. Kirkby, J. Chang, and J. Zhang.Multimodality with eye tracking and haptics: A newhorizon for serious games? Int. J. Serious Games,1(4), 2014.
[10] B. Do. Some deep learning late fusion techniquesbased on the score of observations. 2017.
[11] A. Emerson, R. Sawyer, R. Azevedo, and J. C. Lester.Gaze-enhanced student modeling for game-basedlearning. In Proceedings of the 26th Conference onUser Modeling, Adaptation and Personalization,UMAP 2018, Singapore, July 08-11, 2018, pages63–72, 2018.
[12] R. Feyzi-Behnagh and R. Azevedo. The effectivenessof a pedagogical agent’s immediate feedback onlearners’ metacognitive judgments during learningwith metatutor. In Intelligent Tutoring Systems - 11thInternational Conference, ITS 2012, Chania, Crete,Greece, June 14-18, 2012. Proceedings, pages 651–652,
2012.
[13] B. Gokberk and L. Akarun. Comparative analysis ofdecision-level fusion algorithms for 3d face recognition.In 18th International Conference on PatternRecognition (ICPR 2006), 20-24 August 2006, HongKong, China, pages 1018–1021, 2006.
[14] M. Hall. Teaching with images. 2013.
[15] S. Hochreiter and J. Schmidhuber. Long short-termmemory. Neural Comput., 9(8):1735–1780, Nov. 1997.
[16] T. Judd, K. A. Ehinger, F. Durand, and A. Torralba.Learning to predict where humans look. In IEEE 12thInternational Conference on Computer Vision, ICCV2009, Kyoto, Japan, September 27 - October 4, 2009,pages 2106–2113, 2009.
[17] U. Knauer and U. Seiffert. A comparison of late fusionmethods for object detection. In IEEE InternationalConference on Image Processing, ICIP 2013,Melbourne, Australia, September 15-18, 2013, pages3297–3301, 2013.
[18] Y. LeCun, Y. Bengio, and G. E. Hinton. Deeplearning. Nature, 521(7553):436–444, 2015.
[19] e. a. Leys, C. Detecting outliers: Do not use standarddeviation around the mean, use absolute deviationaround the median. In Journal of Experimental SocialPsychology, 2013.
[20] C. Lin and M. Chi. A comparisons of bkt, RNN andLSTM for learning gain prediction. In ArtificialIntelligence in Education - 18th InternationalConference, AIED 2017, Wuhan, China, June 28 -July 1, 2017, Proceedings, pages 536–539, 2017.
[21] C. Lin, S. Shen, and M. Chi. Incorporating studentresponse time and tutor instructional interventionsinto student modeling. In Proceedings of the 2016Conference on User Modeling Adaptation andPersonalization, UMAP 2016, Halifax, NS, Canada,July 13 - 17, 2016, pages 157–161, 2016.
[22] C. C. Lip and D. A. Ramli. Comparative study onfeature, score and decision level fusion schemes forrobust multibiometric systems. In Frontiers inComputer Education [International Conference onFrontiers in Computer Education, ICFCE 2011,Macao, China, December 1-2, 2011], pages 941–948,2011.
[23] R. E. A. LUCKIN. Beyond the code-and-countanalysis of tutoring dialogues. In Artificial intelli-gence in education: Building technology rich learningcontexts that work, pages 158, 349, 2007.
[24] J. Lustig. Identifying dyslectic gaze pattern :Comparison of methods for identifying dyslecticreaders based on eye movement patterns. Master’sthesis, KTH, School of Computer Science andCommunication (CSC), 2016.
[25] Y. Mao and C. M. Lin, C. Deep learning vs. bayesianknowledge tracing: Student models for interventions.In Journal of Educational Data Mining Oct, 2018,pages 536–539, 2018.
[26] L. S. W. J. E. F. . G. J. Maruta, J. A unified scienceof concussion. Annals of the New York Academy ofSciences, 1208((1)):58–66, 2010.
[27] G. B. H. E. F. M. MCGRATH, C. H. andC. MANVILLE. Learning gain in higher education. InISanta Monica, CA: RAND Corporation., 2015.
[28] T. Mikolov, M. Karafiat, L. Burget, J. Cernocky, andS. Khudanpur. Recurrent neural network basedlanguage model. In INTERSPEECH 2010, 11thAnnual Conference of the International SpeechCommunication Association, Makuhari, Chiba, Japan,September 26-30, 2010, pages 1045–1048, 2010.
[29] S. Minn, Y. Yu, M. C. Desmarais, F. Zhu, and J. Vie.Deep knowledge tracing and dynamic studentclassification for knowledge tracing. CoRR,abs/1809.08713, 2018.
[30] H. E. B. K. E. MITCHELL, C. M. and J. C.LESTER. Recognizing effective and student- adaptivetutor moves in task-oriented tutorial dialogue. InFLAIRS Conference, 2012.
[31] R. Paprocki and A. Lenskiy. What does eye-blink ratevariability dynamics tell us about cognitiveperformance? In Frontiers in Human Neuroscience.Volume 11, ISSN=1662-5161, page 620, 2017.
[32] C. Piech, J. Bassen, J. Huang, S. Ganguli, M. Sahami,L. J. Guibas, and J. Sohl-Dickstein. Deep knowledgetracing. In Advances in Neural Information ProcessingSystems 28: Annual Conference on NeuralInformation Processing Systems 2015, December 7-12,2015, Montreal, Quebec, Canada, pages 505–513, 2015.
[33] D. Ramachandram and G. W. Taylor. Deepmultimodal learning: A survey on recent advances andtrends. IEEE Signal Process. Mag., 34(6):96–108,2017.
[34] N. H. C. Ramli Dzati Athiar and I. K. Anuar.Comparative study on feature, score and decision levelfusion schemes for robust multibiometric systems. InWorld Applied Sciences Journal, Volume 12, pages2160–2167, 2011.
[35] S. D. A. U. F. RAnjali. B. Raut, Uroojussama andA. Anwari. Game based intelligent tutoring system. InInternational Journal of Engineering Research andGeneral Science Volume 3, Issue 2, March-April, 2015ISSN 2091-2730, 2015.
[36] P. Rosenmai. Using the median absolute deviation tofind outliers. 2013.
[37] D. L. SCHNIPKE and D. J. SCRAMS. Exploringissues of examinee behavior: Insights gained fromresponse-time analyses. In In Computer-based testing:Building the foundation for future assess- ments, C.N. Mills, M. T. Potenza, J. J. Fremer, and W. C.Ward, Eds. Lawrence Erlbaum Associates Publishers,Mahwah, NJ, US, 237–266., 2002.
[38] K. Simonyan and A. Zisserman. Two-streamconvolutional networks for action recognition invideos. CoRR, abs/1406.2199, 2014.
[39] M. Taub and R. Azevedo. Using eye-tracking todetermine the impact of prior knowledge onself-regulated learning with an adaptivehypermedia-learning environment. In IntelligentTutoring Systems - 13th International Conference,ITS 2016, Zagreb, Croatia, June 7-10, 2016.Proceedings, pages 34–47, 2016.

![Dynamic Image Prediction Using Principal Component and ... · teer breath hold, beam tracking, tracking with fiducial or infrared markers etc [2]. Long-term breath. -hold tech-](https://img.pdfslide.us/doc/110x75/5eb7d3c1cc13dd14e9599e65/dynamic-image-prediction-using-principal-component-and-teer-breath-hold-beam.jpg)