Embed Size (px)
Citation preview
Impact of Excess Auditor Remuneration
on the Cost of Equity Capital around
the World
OLE-KRISTIAN HOPE*TONY KANG**WAYNE B. THOMAS***YONG KEUN YOO****
This study examines the relation between excess auditor remunerationand the implied required rate of return (IRR hereafter) on equity capitalin global markets. We conjecture that when auditor remuneration isexcessively large, investors may perceive the auditor to be economicallybonded to the client, leading to a lack of independence. This perceivedlack of independence increases the information risk associated with thecredibility of financial statements, thereby increasing IRR. Consistentwith this notion, we find that IRR is increasing in excess auditor
*Rotman School of ManagementUniversity of Toronto**Barry Kaye College of BusinessFlorida Atlantic University***Michael F. Price College of BusinessUniversity of Oklahoma****Korea University Business SchoolKorea UniversityThis paper was previously titled ‘‘International Evidence on the Association between Excess
Auditor Remuneration and the Implied Required Rate of Return.’’ We thank an anonymous reviewer,Holly Ashbaugh, Donal Byard, Paul Chaney, Zhihong Chen, Mark Clatworthy, Gus De Franco,Paquita Friday, Stephan Hollander, Clive Lennox, Sue McCracken, Shiva Shivakumar, Heidi Vander-bauwede, Larry Weiss, and an anonymous referee. We also thank seminar participants at AmericanUniversity, Baruch College, Brock University, Cardiff Business School, Chulalongkorn University,Florida Atlantic University, Korea University, Norwegian School of Economics and Business Admin-istration, Norwegian School of Management, Oklahoma State University, Seoul National University,Tilburg University, University of Colorado at Boulder, University of Tennessee, University of Wash-ington at Tacoma, University of Western Australia, HKUST-SMU Accounting Research Camp (Sin-gapore), AAA IAS Mid-year meeting (Los Angeles), Global Issues in Accounting Conference at theUniversity of North Carolina (Chapel Hill), London Business School Summer Symposium (London),AAA annual meeting (Washington, D.C.), 18th Asian-Pacific Conference on International AccountingIssues (Kapalua), and 17th Conference on Financial Economics and Accounting (Atlanta) for helpfulcomments on various versions of this paper.
Hope acknowledges the financial support of the Deloitte Professorship and the Social Sciencesand Humanities Research Council of Canada. Kang is grateful to the Wharton-SMU Research Centerat Singapore Management University for financial support. Yoo was supported by the Korea ResearchFoundation Grant funded by the Korean Government (MOEHRD, Basic Research Promotion Fund).
177
remuneration, but only in countries with stronger investor protection.Finding evidence of a relation only in stronger investor protection coun-tries is consistent with the more prominent role of audited financialstatements for investors’ decisions in these countries. In settings inwhich investors are less likely to rely on audited financial statementsand instead rely on alternative sources of information (i.e., in countrieswith weaker investor protection), the impact of client-auditor bondingshould have less of an effect on investors’ decisions.
1. Introduction
In this paper, we hypothesize that audits can affect the perceived credibility
of financial statements and therefore can have an effect on firms’ implied
required rate of return (IRR) on equity capital. Presumably, audits lower firms’
IRR by providing assurance to investors that reported amounts are reliable. How-
ever, when auditors’ fees represent excess payment for services, investors may
perceive that the auditor has an economic bond with the client. This bonding,
whether real or just perceived, could reduce investors’ beliefs that the auditor
will act independently, thereby weakening the perceived credibility of financial
statement information and increasing information risk. To test this idea, we
examine the relation between excess auditor remuneration and IRR.
Furthermore, we expect the relation between auditor remuneration and
IRR to vary across countries. Research shows that supporting country-level
factors (e.g., securities regulation) play a role in firms’ IRR. For example, Hail
and Leuz (2006) show that firms in countries with stronger investor protection
tend to have lower IRR. Their findings suggest that firm-level governance
(e.g., audited financial statements) cannot fully substitute for weaknesses in
country-level institutions. When country-level institutions are weaker, firm-
level governance has less ability to affect investors’ decisions, as it lacks cred-
ibility (Doidge, Karolyi, and Stulz [2007]). In contrast, when country-level
institutions are stronger, factors that affect the perceived credibility of audited
financial statements (e.g., excess auditor remuneration) will be more meaning-
ful to investors. For this reason, we expect the positive relation between excess
auditor remuneration and IRR to be more significant in countries with stronger
investor protection.
We measure excess auditor remuneration as the residuals from a regression
of total remuneration on an extensive number of firm- and country-level charac-
teristics expected to influence auditor fees. Our model explains 72 percent of the
variation in total auditor remuneration. Following extant research, we measure
IRR as the average estimate from four ex ante cost of equity capital models. The
evidence suggests that excess auditor remuneration relates positively to IRR and
is consistent with our notion that the increase in IRR occurs because investors
perceive excess auditor remuneration to represent economic bonding between the
178 JOURNAL OF ACCOUNTING, AUDITING & FINANCE
auditor and the client. We also find that the relation between excess auditor
remuneration and IRR varies with the degree of investor protection across coun-
tries. Specifically, we find a positive relation between excess auditor remunera-
tion and IRR in stronger investor protection countries, but we find no relation in
weaker investor protection countries. This finding supports the greater role of
firm-specific governance through audits in countries with stronger legal systems
(Francis, Khurana, Martin, and Pereira [2006]). To the extent that investors rely
on audited financial statements, IRR will be more sensitive to the perceived
quality of the audit. When audited financial statements do not play a primary
role in investors’ decisions (i.e., in countries with weaker investor protection),
the quality of the audit will have less of an impact on IRR.
Our results are robust to including an extensive set of control variables.
Specifically, in addition to controlling for other audit properties (auditor size
and auditor industry specialization), we control for country-level investor pro-
tection and disclosure scores, year and industry effects, risk-free interest rates,
and six other firm-level variables (firm size, book-to-market ratio, market beta,
price momentum, idiosyncratic risk, and analysts’ earnings forecast dispersion).
In addition, we subject our tests to a number of sensitivity and specification
checks. With respect to auditor remuneration, we investigate audit fees versus
nonaudit fees for a sample of U.K. and U.S. firms, we examine positive and
negative excess fees separately, we control for potential simultaneity between
IRR and auditor remuneration, and we examine changes in excess fees. We test
whether our results are sensitive to our particular measure of investor protec-
tion and to different ways of averaging the four ex ante cost of equity capital
measures that make up IRR. Our conclusions are robust to these and several
other tests.
In Section 2, we discuss the background for this study and develop hypothe-
ses. In Section 3, we explain the empirical models. In Section 4, we describe the
sample. In Section 5, we discuss the main results and our robustness tests.
Finally, in Section 6, we provide conclusions.
2. Background and Hypotheses Development
Our study focuses on two research questions: (1) To what extent does audi-
tor remuneration relate to firms’ IRR? (2) Does this relation vary based on the
strength of investor protection in the firm’s country of domicile?
The link between auditor remuneration and IRR can be understood by first
considering the role of an audit and its impact on information risk. Audits lend
credibility to accounting information by providing independent verification of
manager-prepared financial statements (e.g., Simunic and Stein [1987]). Levitt
(2000), among others, argues that investors cannot be expected to trust a com-
pany’s reported financial information without confidence in the auditor’s objec-
tivity and fairness. An audit’s ability to improve the credibility of financial
179IMPACT OF EXCESS AUDITOR REMUNERATION
accounting information lowers investors’ perceived information risk (e.g., Boone,
Khurana, and Raman [2005]). However, to the extent that investors perceive the
audit to be deficient (e.g., lacking auditor independence), the credibility of financial
information will decrease and information risk will increase. As this information
risk may not be diversified away, the firm’s cost of equity capital will increase
(Bhattacharya, Daouk, and Welker [2003]; Easley and O’Hara [2004]; Francis,
LaFond, Olsson, and Schipper [2004]; Lambert, Leuz, and Verrecchia [2007]).
We examine the role that auditor remuneration may have on the relation
between audits and information risk. A line of research starting with DeAngelo
(1981) suggests that an auditor’s incentive to compromise independence relates
to how economically significant the client is to the auditor. This research argues
that an auditor concerned about the possible loss of fee revenue is less likely to
object to management’s accounting choices because of his economic bond with
the firm. DeAngelo states that ‘‘the existence of client-specific quasi-rents to in-
cumbent auditors . . . lowers the optimal amount of auditor independence’’ (1981,
113). Survey evidence reported by Nelson, Elliott, and Tarpley (2002) and Trom-
peter (1994) provide support for this argument; the more economically dependent
the auditor is on the client, the more likely the auditor is to succumb to client
pressure.1
As a test of DeAngelo’s statements, Magee and Tseng (1990) develop a mul-
tiperiod model and find that the auditor’s value of incumbency presents a threat
to independence under a set of reasonable circumstances. In particular, because
many accounting standards require auditor judgment, the potential for differential
judgments by different auditors gives rise to the possibility that a positive value
of incumbency could lead an auditor to approve a report that, in the auditor’s
judgment, may be viewed as an audit failure (Magee and Tseng [1990, 317]).
Therefore, if high auditor remuneration creates economic bonding and a conse-
quent lack of independence, investors’ perceptions of reduced credibility will
increase information risk and ultimately raise the firm’s cost of equity capital.
As a result, we expect to observe a positive relation between excess auditor
remuneration and IRR.2
As a measure of the potential economic bond between the auditor and the
client, we develop a model of excess auditor remuneration using total fees
charged by the auditor. One reason for not using the ratio of audit to nonaudit
1. Prior research yields inconsistent conclusions regarding the association between auditor feesand measures of accruals quality. On the one hand, Gul, Chen, and Tsui (2003) and Ahmed, Duell-man, and Abdel-Meguid (2006) find a positive association between discretionary accruals and fees.In addition, Choi, Kim, and Zang (2005) conclude that auditors’ incentives to compromise audit qual-ity differ systematically for more profitable clients (with positive abnormal fees) in relation to lessprofitable clients. On the other hand, Ashbaugh, LaFond, and Mayhew (2003) and Chung and Kalla-pur (2003) do not find such a positive relation. These mixed findings provide additional motivationfor why we focus on investors’ perceptions in this study.
2. Consistent with our prediction, Mansi, Maxwell, and Miller (2004, 756) argue that ‘‘audit qual-ity contributes to the credibility of financial disclosure, and . . . reduces the cost of [debt] capital.’’
180 JOURNAL OF ACCOUNTING, AUDITING & FINANCE
fees is that nonaudit fee data are not publicly available for most countries. We
do not expect this choice to have a material impact on our conclusions as Hansen
and Watts (1997) and Reynolds and Francis (2001) argue that audit and nonaudit
fees should create similar incentives to the auditor. For example, Reynolds and
Francis (2001) note that fee dependence is inherent in auditor-client contracting
and that the strength of the economic bond tends not to depend on whether the
source of fees is auditing or nonauditing (e.g., consulting).3 We discuss a robust-
ness check to determine whether our inference is sensitive to using different fee
types (i.e., audit vs. nonaudit) using a sample of U.K. and U.S. firms that have
detailed auditor remuneration data available. We state our first hypothesis (in al-
ternative form)[include alternative form in H1?] as follows:
H1: The implied required rate of return on equity capital increases with
excess auditor remuneration.
Our next hypothesis examines how the relation between IRR and auditor
remuneration varies with the degree of investor protection in a firm’s country of
domicile. This issue relates to a large literature that documents substantial cross-
country differences in the legal protection of investors’ rights (e.g., La Porta,
Lopez-de-Silanes, Shleifer, and Vishny [1997, 1998, 2000]) and the demand for
financial accounting information (e.g., Ball, Kothari, and Robin [2000]; Barniv,
Myring, and Thomas [2005]). In general, the demand for financial accounting in-
formation increases as the strength of a country’s investor protection increases.4
One reason for this higher demand, according to Bushman and Smith (2001), is
that the effectiveness of accounting information in limiting expropriation of minor-
ity investors is likely to be greater when investors have stronger legal protection.5
In other words, when investor protection is stronger, accounting information can
play a more prominent role in corporate governance mechanisms. Accordingly,
research has shown that investor protection is positively associated with the quality
of financial reporting (e.g., Hung [2000]; Ball, Kothari, and Robin [2000]).
With respect to the role of auditing, Bushman and Smith (2001) argue that
the economic benefits of financial accounting disclosures increase with the rigor
3. Reynolds and Francis (2001) also note that the level of nonaudit fees for audit clients is usu-ally rather small and that as of 1999, only 3 percent of clients who purchase consulting services fromBig 5 auditors have nonaudit (i.e., consulting) fees that exceed audit fees. They argue that these datasuggest that audit fee dependence on large clients is a far more pervasive threat to auditor independ-ence than the incremental effects of consulting fee dependency.
4. Clatworthy (2005) documents that financial analysts and fund managers in stronger investorprotection countries perceive the annual report to be more useful than do analysts and fund managersin weaker investor protection countries.
5. Reese and Weisbach (2002, 66) note the importance of legal regime as follows: ‘‘An implicitbut often unrecognized part of any financial contract is the ability of a legal system to enforce it.The quality of legal protection affects the ability of parties to expropriate resources from one anotherex post, and thus influences the contracts that will be observed ex ante. Differences across countriesin the quality of protection they provide claimholders should, by this logic, lead to observable differ-ences in financial contracting.’’
181IMPACT OF EXCESS AUDITOR REMUNERATION
with which the reported numbers are audited (see also Hope [2003]). Ball (2001)
goes one step further and argues that in countries with a weaker legal infrastruc-
ture, the role of accounting and auditing in contracting is minimal.6 Consistent
with these arguments, Doidge, Karolyi, and Stulz (2007) find evidence that the
net payoffs of improved firm-level governance structures are inherently lower in
countries with weaker legal institutions because the governance structures lack
credibility. Francis, Khurana, and Pereira (2003) find that higher-quality auditing
is more likely to exist in countries with stronger investor protection.7 Further-
more, Francis et al. (2006) show that the demand for auditing is greater in coun-
tries with stronger legal systems. This occurs because the credibility of an audit,
as a governance mechanism, requires supporting country-level institutions.8
When those country-level institutions are stronger, investors tend to rely more on
an audit to assess the quality of financial statement information. When those
country-level institutions are weaker, investors rely on alternative sources of in-
formation (e.g., Ball [2001]), and variation in the quality of the audit is less rele-
vant to their decisions.9
To summarize, when investor protection is stronger, investors rely to a
greater extent on financial accounting information. The greater reliance on
accounting information causes investors’ decisions to be more sensitive to
changes in the perceived credibility of audited financial statements. If investors
view higher auditor remuneration as creating economic bonding between the
auditor and the client (thus increasing information risk), investors are more likely
to respond by requiring a higher cost of equity capital in stronger investor pro-
tection countries. In contrast, when investors are less likely to rely on audited fi-
nancial statements (i.e., in countries with weaker investor protection), the impact
of auditor-client bonding is naturally less important to investors’ decisions. In
these countries, investors rely more heavily on other sources of information, and
variation in the credibility of audited financial statements is less meaningful. This
suggests a reduced relation between excess auditor remuneration and IRR in
weaker investor protection countries. Our second hypothesis (in alternative form)
[does not appear to be stated in alternative form] follows:
6. In theory, it is conceivable that the opposite may hold. That is, country-level institutions andfirm-level governance mechanisms such as auditing could be substitutes. However, as detailed in thissection, empirical research supports the notion that these factors primarily are complements ratherthan substitutes.
7. Francis et al. (2003) also find that higher-quality accounting and auditing are positively asso-ciated with financial market development, but only in countries whose legal systems are conducive tothe protection of investors.
8. Consistent with these arguments, Fan and Wong (2005) find that the payoffs to adoptingindependent audits in East Asia are limited. They argue that the opaque business environment inthese countries limits the effectiveness of the audit function and that the external audit loses itsvalue when an auditor’s adverse opinion does not result in significant consequences (given weakerlegal enforcement).
9. Choi, Kang, Kwon, and Zang (2005) show that audit quality has less of an influence on ana-lysts’ earnings forecasts accuracy in weaker investor protection environments.
182 JOURNAL OF ACCOUNTING, AUDITING & FINANCE
H2: The positive association between the implied required rate of return on
equity capital and excess auditor remuneration increases with the strength
of country-level investor protection.
3. Research Design
To test our hypotheses, we estimate the following regression (firm and time
subscripts omitted):
where the variables are defined as follows:
Implied Required Rate of Return (IRR): Since expected (or ex ante) cost of
equity capital is not directly observable, recent studies rely on observable meas-
ures of IRR to examine its determinants (e.g., Khurana and Raman [2004]; Hail
and Leuz [2006]).10 We estimate IRR using four models: two implementations of
the Ohlson (1995) residual income valuation model (hereafter RIV model), the
Ohlson and Juettner-Nauroth (2005) model (hereafter OJ model), and the PEGmodel (a specific form of the OJ model). For all four models, the idea is to sub-
stitute price and analysts’ earnings forecasts into a valuation equation and to
back out IRR as the internal rate of return that equates current stock price and
the expected future sequence of residual incomes or abnormal earnings (Hail and
Leuz [2006]). Because it is not clear which implementation of the valuation
model is superior in terms of deriving at a more reliable IRR, and to reduce mea-
surement error in the estimates, we use the average of the four IRR measures
(e.g., Boone, Khurana, and Raman [2005]; Hail and Leuz [2006]).11 Appendix A
provides a detailed discussion of the measurement of IRR for each model.
Excess Auditor Remuneration (ExcessFee): Our approach to computing
excess auditor remuneration follows extant research (e.g., Frankel, Johnson, and
Nelson [2002]; Choi, Kim, and Zang [2005]; Hope and Langli [2008]). That is,
we regress total auditor fees (TotFee) on a large number of explanatory variables
and use the residuals from this regression as our proxy for excess fees.12 The ex-
planatory variables control for normal fees charged by the auditor for a given
10. Gebhardt, Lee, and Swaminathan (2001) and Botosan and Plumlee (2005) point out thattests of the relevance of information for asset valuation require measures of ex ante rather than expost returns (see also Fama and French [1997]; Vuolteenaho [2002]).
11. As an alternative, we use the first principal component of the four individual IRR estimatesand find results that are consistent with (and stronger than) those reported.
12. To be specific, for auditor fees, we use the natural log of total auditor remuneration. Asdescribed above, this measure includes fees for both audit and nonaudit services. We obtain consist-ent results when we scale total auditor remuneration by lagged total assets.
183IMPACT OF EXCESS AUDITOR REMUNERATION
level of effort and risk. We are interested in identifying abnormal fees related to
economic rent (i.e., threat to independence).
For the explanatory variables, we include two auditor variables—auditor size
(Big4) and auditor industry specialization (IndSpec)—and eleven firm varia-
bles—log of market value of equity (lnSize), log of book-to-market ratio (lnBM),
log of sales revenues (lnSales), leverage (Lev), return on equity (ROE), indicator
variables for long-term capital issuance (either debt or equity, CapIssue), for
non-zero foreign operations (ForOps), for discontinued operations (DiscOps), for
acquisitions (Acq), a variable measuring intangible asset intensity defined as in-
tangible assets scaled by total assets (Intangible), and the sum of inventories and
accounts receivable scaled by total assets (InvRec).13
We estimate ExcessFee separately for stronger and weaker investor protec-
tion countries.14 As an additional control for country-level factors, we include a
country-level variable that proxies for the extent of litigation auditors face in a
particular economy, the Wingate index (see Choi and Wong [2007]).15 Finally,
we control for both time period (year) and industry affiliation (two-digit Standard
Industry Codes [SICs]) through indicator variables. We estimate eq. (2) and use
the error term (u) as our measure of ExcessFee.
Hypothesis 1 would be supported if the coefficient on ExcessFee (b1) in eq.
(1) is positive and significant. To test Hypothesis 2, we split the sample into
stronger and weaker investor protection groups and test whether the coefficient
on ExcessFee is more positive in stronger investor protection countries than in
weaker investor protection countries.
The remaining variables in eq. (1) control for other factors potentially
related to IRR. We are interested in the relation between ExcessFee and IRR,
beyond any other factors identified in previous research. For this purpose, we
control for auditor type, auditor industry specialization, investor protection, and
disclosure levels. We include an extensive list of other control variables to miti-
gate the concern that our findings, if any, are merely driven by omitted risk
13. We use the natural logarithm of market value of equity, book-to-market ratio, and sales rev-enues. Using logs of all firm-level variables or not using logs for any variables has no effect on ourinferences. All variables used in the study, except for ratios and indicator variables, are translatedinto Special Drawing Rights. We also consider the effect of client size nonlinearities by adding inter-action terms with client size (lnSize) to our ExcessFee model. There is no noticeable change in theadjusted R2 of the ExcessFee model with this specification, and no inferences are affected.
14. Results are similar and no inferences affected when we instead estimate ExcessFee using apooled model.
15. As an alternative to the Wingate index, we have used InvPro or country fixed effects andfind results similar to those reported.
184 JOURNAL OF ACCOUNTING, AUDITING & FINANCE
proxies. To establish a link between cost of equity capital and a variable of inter-
est (e.g., excess auditor remuneration), it is imperative to control for known risk
factors. Specifically, we include six (nonauditing) firm-level control variables
and one country-level variable: firm size, book-to-market ratio, market beta,
price momentum, idiosyncratic risk, analysts’ earnings forecast dispersion, and
risk-free interest rate (a country-level variable that varies by year). In addition,
we control for year and industry effects.
Auditor Type (Big4): To control for the insurance risk effect of auditing
(Khurana and Raman [2004]), we include auditor type (Big 4 versus non–Big 4)
in our tests.16 Given their ‘‘deep pockets,’’ Big 4 auditors offer more insurance
for the client (e.g., Palmrose [1988]; Dye [1993]).17 Prior literature further sug-
gests that large auditors tend to provide higher-quality audits to reduce litigation
risk and to protect their brand-name reputation (e.g., Becker, DeFond, Jiambalvo,
and Subramanyam [1998]). Big4 equals one if the auditor is a Big 4 audit firm,
and zero otherwise.18
Auditor Industry Specialization (IndSpec): DeAngelo (1981) notes that the
ability of an auditor to detect material error in the financial statements is a func-
tion of auditor competence, and auditors that specialize in an industry are likely
to be more competent. To the extent that investors’ expectations about any mate-
rial omissions or misstatements decline as the auditor specializes in a particular
industry, their perceived level of information risk will decrease. This suggests
that investors’ perceived level of information risk might be lower when the audi-
tor specializes in the industry the client firm operates in, ceteris paribus. IndSpecis measured as the number of clients in that auditor-country-industry-year combi-
nation divided by total number of clients of that auditor in that country-year
combination.19
Investor Protection (InvPro): We use the Legal Enforcement variable from
La Porta et al. (1998) to proxy for the level of investor protection in a country.
It is measured as the mean score across three legal variables: (1) the efficiency
of the judicial system, (2) an assessment of the rule of law, and (3) the corrup-
tion index. All three variables range from zero to ten. This proxy for investor
protection has been used in several recent studies (e.g., Leuz, Nanda, and
Wysocki [2003]; DeFond, Hung, and Trezevant [2007]; Ding, Hope, Jeanjean,
and Stolowy [2007]). For example, Leuz, Nanda, and Wysocki (2003) find that
16. Khurana and Raman (2004) find that U.S. firms audited by Big 4 auditors have lower IRRthan those not audited by the Big 4, but they do not find this association in other developed commonlaw countries (i.e., Australia, Canada, and the United Kingdom). They interpret their results to implythat Big 4 auditors provide high-quality audits mainly to avoid costly lawsuits.
17. The insurance effect refers to the investor’s ability to recover from auditors the lossessustained by relying on audited financial statements that contain misrepresentations (Menon andWilliams [1994]).
18. We use Big4 to refer to both the current four largest audit firms as well as their predeces-sors during our sample period (i.e., the Big 6).
19. We use the membership within the broadest industry category (‘‘Sector’’) among the threelevels of I/B/E/S industry classifications.
185IMPACT OF EXCESS AUDITOR REMUNERATION
earnings management (measured at the country level) is decreasing in investor
protection. Holding other factors constant, we expect a negative association
between InvPro and IRR.
Corporate Disclosure (CIFAR): Hail and Leuz (2006) find that corporate dis-
closures reduce cost of equity capital across countries by reducing information
asymmetry among stakeholders and hence the equity risk premium demanded by
investors. To control for this factor, we include country-level CIFAR index
scores (CIFAR [1995]), which capture both voluntary and mandatory disclosure
levels.20 We expect a negative coefficient on CIFAR.
Firm Size (lnSize): Penman (2004) discusses the importance of liquidity in
explaining the cost of equity capital, and Amihud and Mendelson (1986) argue
that firm size proxies for liquidity. Firm size is further identified as a risk proxy
by Fama and French (1995). We therefore use the natural log of market value of
equity as the risk proxy for liquidity and expect a negative association between
IRR and market value of equity.
Book-to-Market Ratio (lnBM): Fama and French (1993) suggest that lnBMmay proxy for a ‘‘distress factor,’’ because financially distressed firms are likely
to have high lnBM. Fama and French (1992) and Lakonishok, Shleifer, and
Vishny (1994) document a positive association between lnBM and realized stock
returns. lnBM also captures differences in accounting rules between regimes
(Joos and Lang [1994]; Hail and Leuz [2006]). Following Gebhardt, Lee, and
Swaminathan (2001), Gode and Mohanram (2003), and Hail and Leuz (2006),
we thus consider the natural log of book-to-market ratio as one of our risk prox-
ies, and we predict a positive association with IRR.21
Market Beta (Beta): The Capital Asset Pricing Model predicts a positive
association between a firm’s beta and its cost of equity capital, and consequently
we include Beta to control for systematic risk (and expect its coefficient to be
positive). We estimate Beta by regressing monthly stock returns against the
world stock market index in the sixty months preceding the current period.22 We
use the MSCI (Morgan Stanley Capital International) World Index as the meas-
ure of the stock market performance around the world.23
Stock Price Momentum (Mom): Because our IRR estimates rely on analysts’
earnings forecasts, which are known to be sluggish in incorporating information
20. The CIFAR (1995) index is based on the inclusion/exclusion of eighty-five financial state-ment items, divided into the following seven categories: (1) general information, (2) income state-ment, (3) balance sheet, (4) funds flow statement, (5) accounting policies, (6) stockholders’information, and (7) supplementary information. Within each group, CIFAR computes the percentageof availability of the variable in the annual report of the company. See Hope (2003) for extensive va-lidity tests of the CIFAR scores. For our study, we use the average total CIFAR score per country.
21. No inferences are affected if we include the growth rate estimated using analysts’ one- andtwo-year ahead earnings forecasts as an additional control variable for growth.
22. To estimate Beta, we require at least twenty-four monthly observations be available.23. Using the MSCI World Index assumes that the capital markets in our sample countries are
integrated, which may not be the case. No inferences are affected by excluding Beta as a controlvariable. In addition, as discussed below, we also control for idiosyncratic risk in our regressions.
186 JOURNAL OF ACCOUNTING, AUDITING & FINANCE
contained in stock prices, we control for stock price momentum (Guay, Kothari,
and Shu [2005]). Guay, Kothari, and Shu (2005) suggest that if analysts are
delayed in incorporating good (bad) news contained in recent stock returns, the
IRR estimates are systematically biased downward (upward). This leads us to
predict a negative coefficient on Mom, which is the stock return over the previ-
ous twelve months.
Idiosyncratic Risk (IdRisk): While Beta measures systematic risk, Lehmann
(1990) and Malkiel and Xu (1997), among others, present evidence on the impor-
tance of idiosyncratic risk (IdRisk). Therefore, we include IdRisk as a potential
risk factor in our tests. Our measure of IdRisk is the variance of residuals from
the market model regressions (Lehman 1990). If idiosyncratic risk is priced, we
expect a positive coefficient on IdRisk.
Forecast Dispersion (Disp): Following Gebhardt, Lee, and Swaminathan
(2001) and Botosan and Plumlee (2005), we consider the dispersion in analysts’
earnings forecasts as a potential risk proxy and expect Disp to be positively
related to IRR. We measure the dispersion of forecasts as the standard deviation
of the one-year-ahead earnings forecasts scaled by the absolute mean of these
forecasts as of September of each year. We obtain the mean forecast from the
Institutional Brokerage Estimate System (I/B/E/S) Summary File.
Risk-Free Interest Rate (RFRate): IRR can vary across countries because of
differences in the risk-free interest rate. We control for this by including the
Treasury Bill rates or government bond yields from Global Insight and Interna-
tional Monetary Fund (IMF) International Financial Statistics as a proxy for the
risk-free interest rate. We expect a positive association between RFRate and IRR.
Finally, we include indicator variables for time period (year) and industry
affiliation (two-digit SIC codes) in all models. Fama and French (1997) show
that firms’ cost of equity capital can vary systematically across industries. We
include year indicators to account for possible year-to-year variations in the IRR.
Sample and Descriptive Statistics
Our empirical analysis is based on a sample of firms from fourteen countries
from 1995 to 2003. We extract accounting data from Compustat North America
(U.S. firms) and Compustat Global (non-U.S. firms); stock price, analysts’ earn-
ings forecasts, and industry identification code from I/B/E/S (all firms); and
stock returns from Center for Research in Security Prices (CRSP) (U.S. firms).
We use the exchange rate data from IMF International Financial Statistics. In
September of each year,24 we select firm-years that satisfy the following criteria:
(1) nonfinancial firm; (2) financial statement data available from Compustat;(3) stock price, consensus one-year-ahead and two-year-ahead analysts’ earnings
forecasts, industry identification code, and number of shares data available from
24. This criterion follows Frankel and Lee (1999).
187IMPACT OF EXCESS AUDITOR REMUNERATION
I/B/E/S; (4) consistency of currency codes between Compustat Global and I/B/E/
S, and between adjacent years; (5) stock return data available from CRSP or cal-
culated from Compustat Global;25 (6) all of the risk proxies available; (7) book
value of equity is positive; (8) positive values for the means of one-year-ahead
and two-year-ahead analysts’ earnings forecasts;26 (9) country-level variables
available; and (10) necessary auditor data available from Compustat North Amer-
ica for U.S. firms and Compustat Global for non-U.S. firms.27 This process
yields a final sample of 9,008 firm-year observations (3,273 distinct firms) from
fourteen countries.28
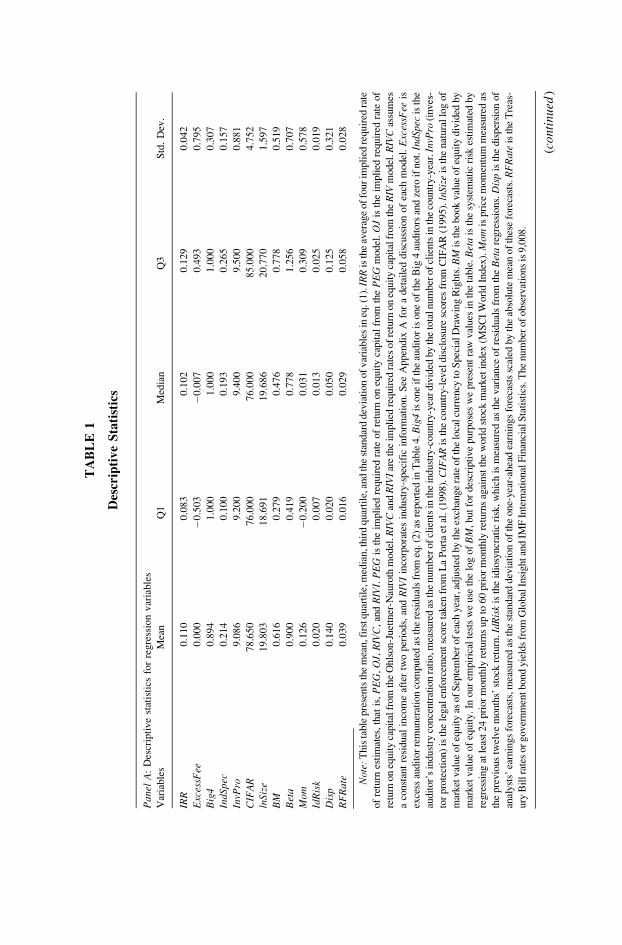
Descriptive statistics are reported in Table 1. Panel A shows that IRR has a
mean and median of 0.110 and 0.102, respectively.29,30 The mean and median of
ExcessFee are 0.000 (by construction) and �0.007, respectively. Big4 has a mean
of 0.894, indicating that 89.4 percent of our sample firms have a Big 4 auditor.
IndSpec has a mean value of 0.214, meaning that the auditors in our sample are
engaged in approximately five industries on average in a country.
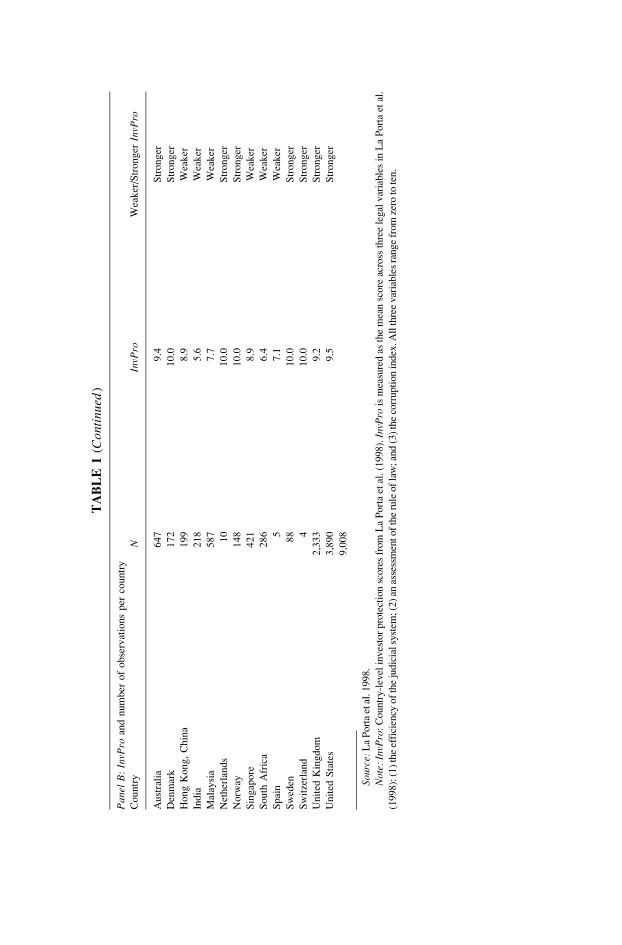
Panel B of Table 1 reports descriptive statistics for InvPro and the number
of observations per country. We classify Australia, Denmark, the Netherlands,
Norway, Sweden, Switzerland, the United Kingdom, and the United States as
stronger investor protection countries. We classify Hong Kong (China), India,
Malaysia, Singapore, South Africa, and Spain as weaker investor protection
countries. While the distinction between stronger and weaker investor protection
is a continuum, we determine a cutoff that leaves adequate sample size for the
weaker investor protection group.31 Many of the countries with the weakest in-
vestor protection scores as reported in La Porta et al. (1998) do not require
25. We calculate sum-dividend stock returns for non-U.S. firms from the data of stock pricesand dividends extracted from Compustat Global.
26. As noted by Gode and Mohanram (2003), empirical implementation of the OJ model (andthus also the PEG model) requires this condition.
27. Unfortunately, data on auditor remuneration are not widely available in commercial data-bases. Auditor remuneration data are available for U.S. publicly traded companies in Compustat from2001. As one of our sensitivity analyses, we report results for a subsample of U.K. and U.S. firmsthat have both audit and nonaudit fee data available.
28. We adjust all per share numbers for stock splits and stock dividends using I/B/E/S adjust-ment factors. Also, when I/B/E/S indicates that the consensus forecast for that firm-year is on a fullydiluted basis, we use I/B/E/S dilution factors to convert those numbers to a primary basis. Further-more, to mitigate the effects of outliers, we winsorize IndSpec, lnSize, lnBM, Beta, Mom, IdRisk,lnSales, Lev, ROE, Intangible, and InvRec at the first and ninety-ninth percentiles and Disp at theninety-ninth percentile of the pooled distribution. Other variables are categorical in nature and do notexhibit extreme observations.
29. For illustrative purposes, the mean IRR is highest in South Africa (0.156) and India (0.140),and lowest in the Netherlands (0.096). The United States has an IRR of 0.103.
30. Unreported statistics show that the IRR estimates from the four models are quite close toeach other. Specifically, the means of IRR from the RIVC, RIVI, OJ, and PEG model are 0.082,0.117, 0.127, and 0.113, respectively, which is close to that reported in previous research (e.g., Chen,Jorgensen, and Yoo [2004]). In addition, all four estimates are positively and significantly correlatedwith each other (Pearson correlations between 0.47 and 0.96).
31. If we restrict the sample to countries that have at least 100 observations (leaving ten coun-tries) and classify the top (bottom) five countries as stronger (weaker) investor protection, results arevery similar to those reported.
188 JOURNAL OF ACCOUNTING, AUDITING & FINANCE
TA
BL
E1
Des
crip
tiv
eS
tati
stic
s
Pan
elA
:D
escr
ipti
ve
stat
isti
csfo
rre
gre
ssio
nv
aria
ble
s
Var
iab
les
Mea
nQ
1M
edia
nQ
3S
td.
Dev
.
IRR
0.1
10
0.0
83
0.1
02
0.1
29
0.0
42
Exc
essF
ee0
.00
0�
0.5
03
�0
.00
70
.49
30
.79
5
Big
40
.89
41
.00
01
.00
01
.00
00
.30
7
IndS
pec
0.2
14
0.1
00
0.1
93
0.2
65
0.1
57
InvP
ro9
.08
69
.20
09
.40
09
.50
00
.88
1
CIF
AR
78
.65
07
6.0
00
76
.00
08
5.0
00
4.7
52
lnSi
ze1
9.8
03
18
.69
11
9.6
86
20
.77
01
.59
7
BM
0.6
16
0.2
79
0.4
76
0.7
78
0.5
19
Bet
a0
.90
00
.41
90
.77
81
.25
60
.70
7
Mom
0.1
26
�0
.20
00
.03
10
.30
90
.57
8
IdR
isk
0.0
20
0.0
07
0.0
13
0.0
25
0.0
19
Dis
p0
.14
00
.02
00
.05
00
.12
50
.32
1
RF
Rat
e0
.03
90
.01
60
.02
90
.05
80
.02
8
Not
e:T
his
table
pre
sents
the
mea
n,f
irst
quar
tile
,med
ian,t
hir
dquar
tile
,and
the
stan
dar
ddev
iati
on
of
var
iable
sin
eq.(
1).
IRR
isth
eav
erag
eof
four
impli
edre
quir
edra
te
of
retu
rnes
tim
ates
,th
atis
,P
EG
,O
J,R
IVC
,an
dR
IVI.
PE
Gis
the
impli
edre
quir
edra
teof
retu
rnon
equit
yca
pit
alfr
om
the
PE
Gm
odel
.O
Jis
the
impli
edre
quir
edra
teof
retu
rnon
equit
yca
pit
alfr
om
the
Ohls
on-J
uet
tner
-Nau
roth
model
.RIV
Can
dR
IVI
are
the
impli
edre
quir
edra
tes
of
retu
rnon
equit
yca
pit
alfr
om
the
RIV
model
.RIV
Cas
sum
es
aco
nst
ant
resi
dual
inco
me
afte
rtw
oper
iods,
and
RIV
Iin
corp
ora
tes
indust
ry-s
pec
ific
info
rmat
ion.
See
Appen
dix
Afo
ra
det
aile
ddis
cuss
ion
of
each
model
.E
xces
sFee
is
exce
ssau
dit
or
rem
uner
atio
nco
mpute
das
the
resi
dual
sfr
om
eq.(2
)as
report
edin
Tab
le4.B
ig4
isone
ifth
eau
dit
or
isone
of
the
Big
4au
dit
ors
and
zero
ifnot.
IndS
pec
isth
e
audit
or’
sin
dust
ryco
nce
ntr
atio
nra
tio,m
easu
red
asth
enum
ber
of
clie
nts
inth
ein
dust
ry-c
ountr
y-y
ear
div
ided
by
the
tota
lnum
ber
of
clie
nts
inth
eco
untr
y-y
ear.
InvP
ro(i
nves
-
tor
pro
tect
ion)
isth
ele
gal
enfo
rcem
ent
score
taken
from
La
Port
aet
al.(1
998).
CIF
AR
isth
eco
untr
y-l
evel
dis
closu
resc
ore
sfr
om
CIF
AR
(1995).
lnSi
zeis
the
nat
ura
llo
gof
mar
ket
val
ue
of
equit
yas
of
Sep
tem
ber
of
each
yea
r,ad
just
edby
the
exch
ange
rate
of
the
loca
lcu
rren
cyto
Spec
ialD
raw
ing
Rig
hts
.BM
isth
ebook
val
ue
of
equit
ydiv
ided
by
mar
ket
val
ue
of
equit
y.In
our
empir
ical
test
sw
euse
the
log
of
BM
,but
for
des
crip
tive
purp
ose
sw
epre
sent
raw
val
ues
inth
eta
ble
.B
eta
isth
esy
stem
atic
risk
esti
mat
edby
regre
ssin
gat
leas
t24
pri
or
month
lyre
turn
sup
to60
pri
or
month
lyre
turn
sag
ainst
the
worl
dst
ock
mar
ket
index
(MS
CI
Worl
dIn
dex
).M
omis
pri
cem
om
entu
mm
easu
red
as
the
pre
vio
us
twel
ve
month
s’st
ock
retu
rn.Id
Ris
kis
the
idio
syncr
atic
risk
,w
hic
his
mea
sure
das
the
var
iance
of
resi
dual
sfr
om
the
Bet
are
gre
ssio
ns.
Dis
pis
the
dis
per
sion
of
anal
yst
s’ea
rnin
gs
fore
cast
s,m
easu
red
asth
est
andar
ddev
iati
on
of
the
one-
yea
r-ah
ead
earn
ings
fore
cast
ssc
aled
by
the
abso
lute
mea
nof
thes
efo
reca
sts.
RF
Rat
eis
the
Tre
as-
ury
Bil
lra
tes
or
gover
nm
entbond
yie
lds
from
Glo
bal
Insi
ghtan
dIM
FIn
tern
atio
nal
Fin
anci
alS
tati
stic
s.T
he
num
ber
of
obse
rvat
ions
is9,0
08.
(co
nti
nu
ed)
Pan
elB
:In
vPro
and
nu
mb
ero
fo
bse
rvat
ion
sp
erco
un
try
Co
un
try
NIn
vPro
Wea
ker
/Str
on
ger
InvP
ro
Au
stra
lia
64
79
.4S
tro
ng
er
Den
mar
k1
72
10
.0S
tro
ng
er
Ho
ng
Ko
ng
,C
hin
a1
99
8.9
Wea
ker
Ind
ia2
18
5.6
Wea
ker
Mal
aysi
a5
87
7.7
Wea
ker
Net
her
lan
ds
10
10
.0S
tro
ng
er
No
rway
14
81
0.0
Str
on
ger
Sin
gap
ore
42
18
.9W
eak
er
So
uth
Afr
ica
28
66
.4W
eak
er
Sp
ain
57
.1W
eak
er
Sw
eden
88
10
.0S
tro
ng
er
Sw
itze
rlan
d4
10
.0S
tro
ng
er
Un
ited
Kin
gd
om
2,3
33
9.2
Str
on
ger
Un
ited
Sta
tes
3,8
90
9.5
Str
on
ger
9,0
08
Sour
ce:
La
Port
aet
al.1
998.
Not
e:In
vPro
:C
ountr
y-l
evel
inves
tor
pro
tect
ion
score
sfr
om
La
Port
aet
al.
(1998).
InvP
rois
mea
sure
das
the
mea
nsc
ore
acro
ssth
ree
legal
var
iable
sin
La
Port
aet
al.
(1998):
(1)
the
effi
cien
cyof
the
judic
ialsy
stem
;(2
)an
asse
ssm
entof
the
rule
of
law
;an
d(3
)th
eco
rrupti
on
index
.All
thre
evar
iable
sra
nge
from
zero
tote
n.
TA
BL
E1
(Con
tinu
ed)
public disclosure of auditor remuneration and therefore do not make our sample.
This works against us finding support for Hypothesis 2.
As is common when using samples from different countries, sample sizes
vary greatly across countries (Table 1, Panel B). We deal with this issue in the
following ways. First, our focus is not on each country per se, but rather auditor
remuneration and the level of investor protection in a given country. Thus we
pool observations from different countries into stronger and weaker investor pro-
tection groups for our tests of Hypothesis 2. Second, in addition to ordinary least
squares (OLS), we report results using country-weighted least squares (WLS),
where the weight is inversely proportional to the number of observations per
country. Using WLS ensures that uneven country representation in our sample
will not bias our results toward countries that are more heavily represented.
Third, we report results of alternative sample choices in which we require a min-
imum number of observations per country. Finally, given that the United States
accounts for such a large portion (43 %) of the sample, we repeat tests excluding
U.S. observations.
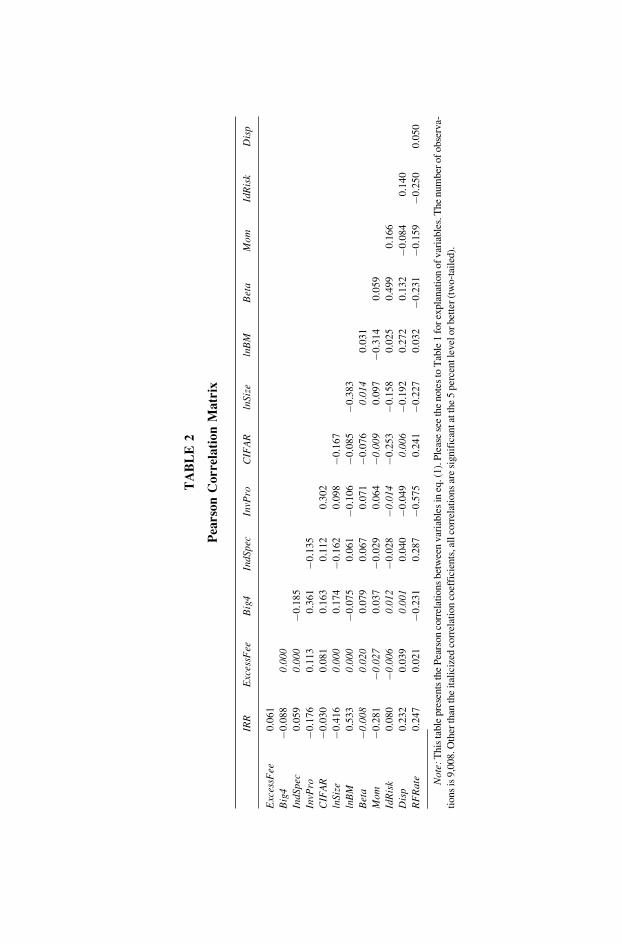
A Pearson correlation matrix of the regression variables is shown in Table 2.
IRR is significantly positively correlated with ExcessFee. This finding provides
univariate support for Hypothesis 1. IRR is negatively correlated with Big4,
InvPro, CIFAR, lnSize, and Mom and is positively correlated with lnBM, IdRisk,
Disp, and RFRate. These correlations are in the predicted direction. IRR is posi-
tively correlated with IndSpe and is not significantly correlated with Beta. By
construction, ExcessFee is uncorrelated with the variables included in the Excess-Fee model in eq. (2). Correlation results should be interpreted cautiously as they
do not control for differences in firm characteristics over time or in the cross
section. Consequently, we now turn to multivariate test results.
5. Results
In this section, we first provide results of ‘‘validity tests’’ of our IRR meas-
ure. Then we discuss our model to compute ExcessFee before presenting results
of our hypotheses tests. Finally, we subject our results to a battery of sensitivity
analyses. Reported significance levels are two-sided and based on Newey-West
standard errors that correct for both heteroskedasticity and autocorrelation
(Newey and West [1987]).
5.1 IRR Estimates and Risk Proxies
The purpose of this section is to validate the IRR measure by showing that it
relates to proxies capturing various sources of risk. As in Botosan (1997), Boto-
san and Plumlee (2005), and Hail and Leuz (2006), we regress IRR on risk prox-
ies that have been used in prior literature. Results are presented in Table 3. With
the exception of Beta, which is not significant, all variables are highly significant
and have signs that are consistent with theory or prior research. Overall, the
191IMPACT OF EXCESS AUDITOR REMUNERATION
TA
BL
E2
Pea
rso
nC
orr
ela
tio
nM
atr
ix
IRR
Exc
essF
eeB
ig4
IndS
pec
InvP
roC
IFA
Rln
Size
lnB
MB
eta
Mom
IdR
isk
Dis
p
Exc
essF
ee0
.06
1
Big
4�
0.0
88
0.00
0
IndS
pec
0.0
59
0.00
0�
0.1
85
InvP
ro�
0.1
76
0.1
13
0.3
61
�0
.13
5
CIF
AR
�0
.03
00
.08
10
.16
30
.11
20
.30
2
lnSi
ze�
0.4
16
0.00
00
.17
4�
0.1
62
0.0
98
�0
.16
7
lnB
M0
.53
30.
000
�0
.07
50
.06
1�
0.1
06
�0
.08
5�
0.3
83
Bet
a�
0.00
80.
020
0.0
79
0.0
67
0.0
71
�0
.07
60.
014
0.0
31
Mom
�0
.28
1�
0.02
70
.03
7�
0.0
29
0.0
64
�0.
009
0.0
97
�0
.31
40
.05
9
IdR
isk
0.0
80
�0.
006
0.01
2�
0.0
28
�0.
014
�0
.25
3�
0.1
58
0.0
25
0.4
99
0.1
66
Dis
p0
.23
20
.03
90.
001
0.0
40
�0
.04
90.
006
�0
.19
20
.27
20
.13
2�
0.0
84
0.1
40
RF
Rat
e0
.24
70
.02
1�
0.2
31
0.2
87
�0
.57
50
.24
1�
0.2
27
0.0
32
�0
.23
1�
0.1
59
�0
.25
00
.05
0
Not
e:T
his
table
pre
sents
the
Pea
rson
corr
elat
ions
bet
wee
nvar
iable
sin
eq.(
1).
Ple
ase
see
the
note
sto
Tab
le1
for
expla
nat
ion
of
var
iable
s.T
he
num
ber
of
obse
rva-
tions
is9,0
08.O
ther
than
the
ital
iciz
edco
rrel
atio
nco
effi
cien
ts,a
llco
rrel
atio
ns
are
signif
ican
tat
the
5per
centle
vel
or
bet
ter
(tw
o-t
aile
d).
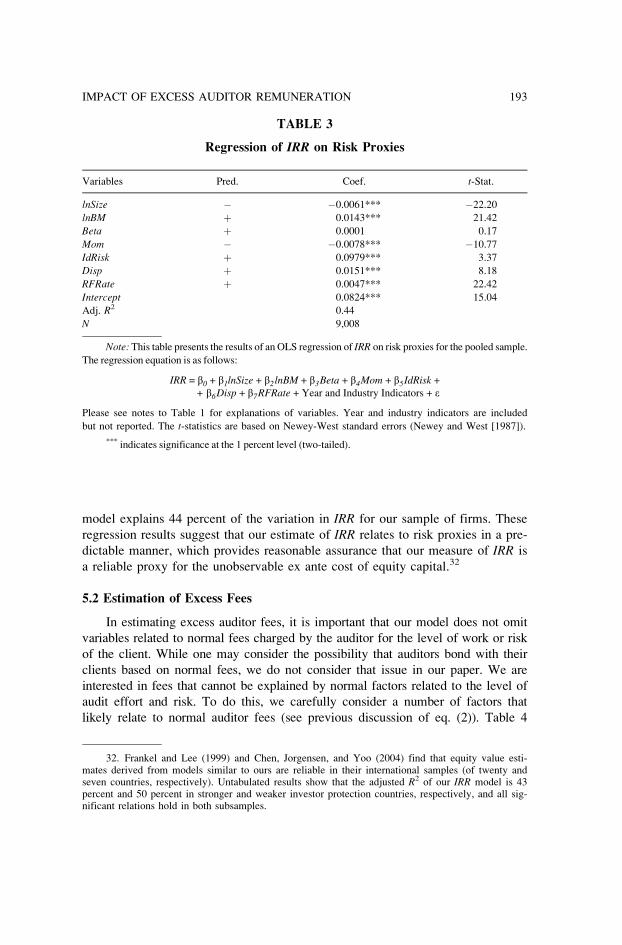
model explains 44 percent of the variation in IRR for our sample of firms. These
regression results suggest that our estimate of IRR relates to risk proxies in a pre-
dictable manner, which provides reasonable assurance that our measure of IRR is
a reliable proxy for the unobservable ex ante cost of equity capital.32
5.2 Estimation of Excess Fees
In estimating excess auditor fees, it is important that our model does not omit
variables related to normal fees charged by the auditor for the level of work or risk
of the client. While one may consider the possibility that auditors bond with their
clients based on normal fees, we do not consider that issue in our paper. We are
interested in fees that cannot be explained by normal factors related to the level of
audit effort and risk. To do this, we carefully consider a number of factors that
likely relate to normal auditor fees (see previous discussion of eq. (2)). Table 4
TABLE 3
Regression of IRR on Risk Proxies
Variables Pred. Coef. t-Stat.
lnSize � �0.0061*** �22.20
lnBM þ 0.0143*** 21.42
Beta þ 0.0001 0.17
Mom � �0.0078*** �10.77
IdRisk þ 0.0979*** 3.37
Disp þ 0.0151*** 8.18
RFRate þ 0.0047*** 22.42
Intercept 0.0824*** 15.04
Adj. R2 0.44
N 9,008
Note: This table presents the results of an OLS regression of IRR on risk proxies for the pooled sample.
The regression equation is as follows:
Please see notes to Table 1 for explanations of variables. Year and industry indicators are included
but not reported. The t-statistics are based on Newey-West standard errors (Newey and West [1987]).
*** indicates significance at the 1 percent level (two-tailed).
32. Frankel and Lee (1999) and Chen, Jorgensen, and Yoo (2004) find that equity value esti-mates derived from models similar to ours are reliable in their international samples (of twenty andseven countries, respectively). Untabulated results show that the adjusted R2 of our IRR model is 43percent and 50 percent in stronger and weaker investor protection countries, respectively, and all sig-nificant relations hold in both subsamples.
193IMPACT OF EXCESS AUDITOR REMUNERATION
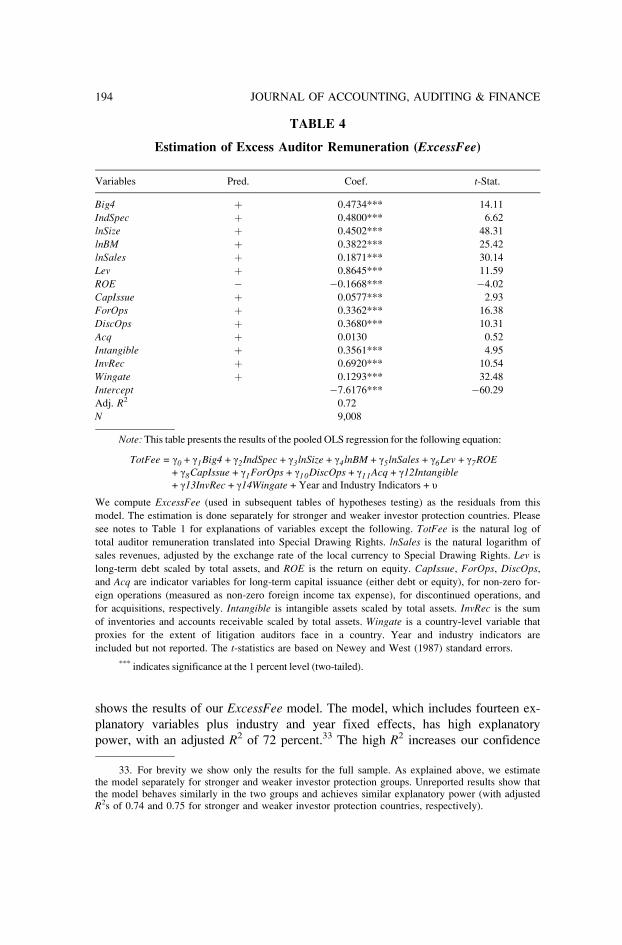
shows the results of our ExcessFee model. The model, which includes fourteen ex-
planatory variables plus industry and year fixed effects, has high explanatory
power, with an adjusted R2 of 72 percent.33 The high R2 increases our confidence
TABLE 4
Estimation of Excess Auditor Remuneration (ExcessFee)
Variables Pred. Coef. t-Stat.
Big4 þ 0.4734*** 14.11
IndSpec þ 0.4800*** 6.62
lnSize þ 0.4502*** 48.31
lnBM þ 0.3822*** 25.42
lnSales þ 0.1871*** 30.14
Lev þ 0.8645*** 11.59
ROE � �0.1668*** �4.02
CapIssue þ 0.0577*** 2.93
ForOps þ 0.3362*** 16.38
DiscOps þ 0.3680*** 10.31
Acq þ 0.0130 0.52
Intangible þ 0.3561*** 4.95
InvRec þ 0.6920*** 10.54
Wingate þ 0.1293*** 32.48
Intercept �7.6176*** �60.29
Adj. R2 0.72
N 9,008
Note: This table presents the results of the pooled OLS regression for the following equation:
We compute ExcessFee (used in subsequent tables of hypotheses testing) as the residuals from this
model. The estimation is done separately for stronger and weaker investor protection countries. Please
see notes to Table 1 for explanations of variables except the following. TotFee is the natural log of
total auditor remuneration translated into Special Drawing Rights. lnSales is the natural logarithm of
sales revenues, adjusted by the exchange rate of the local currency to Special Drawing Rights. Lev is
long-term debt scaled by total assets, and ROE is the return on equity. CapIssue, ForOps, DiscOps,
and Acq are indicator variables for long-term capital issuance (either debt or equity), for non-zero for-
eign operations (measured as non-zero foreign income tax expense), for discontinued operations, and
for acquisitions, respectively. Intangible is intangible assets scaled by total assets. InvRec is the sum
of inventories and accounts receivable scaled by total assets. Wingate is a country-level variable that
proxies for the extent of litigation auditors face in a country. Year and industry indicators are
included but not reported. The t-statistics are based on Newey and West (1987) standard errors.
*** indicates significance at the 1 percent level (two-tailed).
33. For brevity we show only the results for the full sample. As explained above, we estimatethe model separately for stronger and weaker investor protection groups. Unreported results show thatthe model behaves similarly in the two groups and achieves similar explanatory power (with adjustedR2s of 0.74 and 0.75 for stronger and weaker investor protection countries, respectively).
194 JOURNAL OF ACCOUNTING, AUDITING & FINANCE
that we are appropriately controlling for a large amount of the normal fees. If we
had obtained a low R2, then our model would be more likely to suffer from omit-
ted variables, as a large portion of auditor remuneration should be normal. We are
comforted by the fact that auditor remuneration relates to the fee determinant vari-
ables in the expected direction. As predicted, auditor remuneration is significantly
and positively associated with Big4, IndSpec, lnSize, lnBM, lnSales, Lev, CapIssue,
ForOps, DiscOps, Intangible, InvRec, and Wingate, and is negatively related to
ROE. As explained above, our model controls for year and industry fixed effects
(not shown in Table 4).34
We can never rule out the possibility that our ExcessFee measure contains a
normal component, but the high explanatory power of the model provides rea-
sonable evidence that we appropriately capture excess fees. In addition, we report
several other sensitivity tests on this issue later in the paper. These tests further
increase our confidence that our model is well specified and that its conclusions
are reliable.
5.3 Results of Hypotheses Tests
5.3.1 Tests of Hypothesis 1
We first examine whether excess auditor remuneration can explain differen-
ces in IRR, after controlling for risk proxies previously introduced into the model
and controlling for other audit properties and country-level investor protection
and disclosure scores. As discussed, we are interested in testing whether excess
fees reduce investors’ perceptions of auditor independence, leading to diminished
credibility of financial information and increased information risk.
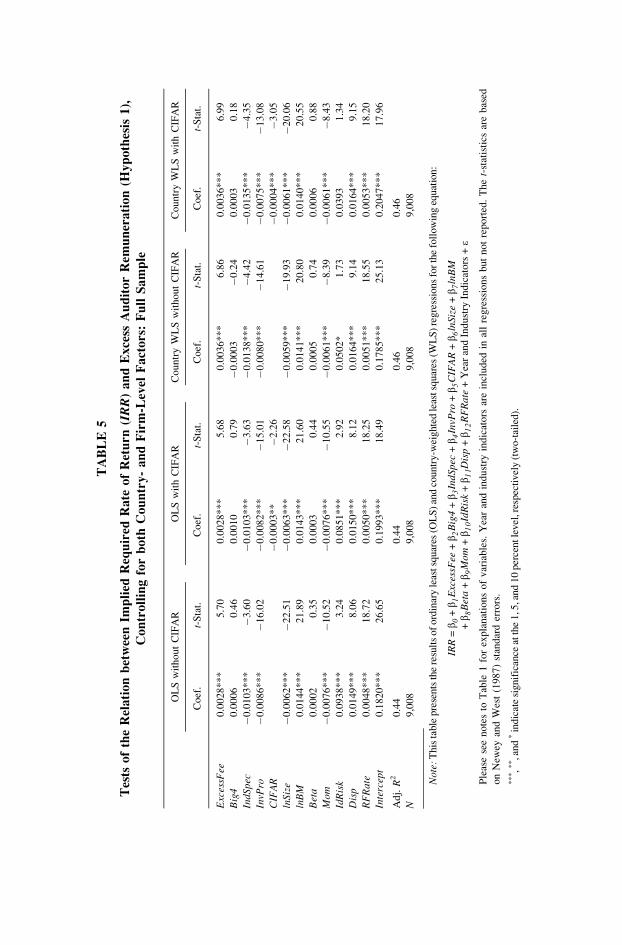
Results for the full sample of firms are presented in Table 5. We present
four sets of results: (1) OLS excluding CIFAR, (2) OLS including CIFAR, (3)
WLS excluding CIFAR, and (4) WLS including CIFAR. The potential advantage
of using WLS versus OLS is discussed earlier and relates to differences in sam-
ple sizes across countries. The motivation for including and exluding CIFARscores relates to their potential lack of relevance to our sample period. These
scores are generated based on disclosures in the early 1990s, and disclosure prac-
tices may have changed between then and our sample period.
The first column shows results of OLS regressions that exclude CIFAR. The
risk proxies continue to be significant in the predicted direction (with the excep-
tion of Beta). IndSpec is significantly negatively associated with IRR, suggesting
34. One would expect the cross-sectional variation of normal fees to be greater than the cross-sectional variation in excess fees. Consistent with this expectation, we find that the differencebetween the third and first quartile for normal fees is more than twice as large as it is for ExcessFee.We would also expect excess fees to be relatively constant across years for a given firm. For firmsthat have multiple observations, we determine the extent to which the sign of their ExceeFee remainsthe same in the following year. We find that 82 percent of firms keep the same sign of excess feesfrom one year to the next. These results give us additional confidence that ExcessFee captures remu-neration other than normal fees related to effort and risk.
195IMPACT OF EXCESS AUDITOR REMUNERATION
TA
BL
E5
Tes
tso
fth
eR
ela
tio
nb
etw
een
Imp
lied
Req
uir
edR
ate
of
Ret
urn
(IR
R)
an
dE
xce
ssA
ud
ito
rR
em
un
era
tio
n(H
yp
oth
esi
s1
),
Co
ntr
oll
ing
for
bo
thC
ou
ntr
y-
an
dF
irm
-Lev
elF
act
ors
:F
ull
Sa
mp
le
OL
Sw
ith
ou
tC
IFA
RO
LS
wit
hC
IFA
RC
ou
ntr
yW
LS
wit
ho
ut
CIF
AR
Co
un
try
WL
Sw
ith
CIF
AR
Co
ef.
t-S
tat.
Co
ef.
t-S
tat.
Co
ef.
t-S
tat.
Co
ef.
t-S
tat.
Exc
essF
ee0
.00
28
**
*5
.70
0.0
02
8*
**
5.6
80
.00
36
**
*6
.86
0.0
03
6*
**
6.9
9
Big
40
.00
06
0.4
60
.00
10
0.7
9�
0.0
00
3�
0.2
40
.00
03
0.1
8
IndS
pec
�0
.01
03
**
*�
3.6
0�
0.0
10
3*
**
�3
.63
�0
.01
38
**
*�
4.4
2�
0.0
13
5*
**
�4
.35
InvP
ro�
0.0
08
6*
**
�1
6.0
2�
0.0
08
2*
**
�1
5.0
1�
0.0
08
0*
**
�1
4.6
1�
0.0
07
5*
**
�1
3.0
8
CIF
AR
�0
.00
03
**
�2
.26
�0
.00
04
**
*�
3.0
5
lnSi
ze�
0.0
06
2*
**
�2
2.5
1�
0.0
06
3*
**
�2
2.5
8�
0.0
05
9*
**
�1
9.9
3�
0.0
06
1*
**
�2
0.0
6
lnB
M0
.01
44
**
*2
1.8
90
.01
43
**
*2
1.6
00
.01
41
**
*2
0.8
00
.01
40
**
*2
0.5
5
Bet
a0
.00
02
0.3
50
.00
03
0.4
40
.00
05
0.7
40
.00
06
0.8
8
Mom
�0
.00
76
**
*�
10
.52
�0
.00
76
**
*�
10
.55
�0
.00
61
**
*�
8.3
9�
0.0
06
1*
**
�8
.43
IdR
isk
0.0
93
8*
**
3.2
40
.08
51
**
*2
.92
0.0
50
2*
1.7
30
.03
93
1.3
4
Dis
p0
.01
49
**
*8
.06
0.0
15
0*
**
8.1
20
.01
64
**
*9
.14
0.0
16
4*
**
9.1
5
RF
Rat
e0
.00
48
**
*1
8.7
20
.00
50
**
*1
8.2
50
.00
51
**
*1
8.5
50
.00
53
**
*1
8.2
0
Inte
rcep
t0
.18
20
**
*2
6.6
50
.19
93
**
*1
8.4
90
.17
85
**
*2
5.1
30
.20
47
**
*1
7.9
6
Ad
j.R
20
.44
0.4
40
.46
0.4
6
N9
,00
89
,00
89
,00
89
,00
8
Not
e:T
his
table
pre
sents
the
resu
lts
of
ord
inar
yle
astsq
uar
es(O
LS
)an
dco
untr
y-w
eighte
dle
astsq
uar
es(W
LS
)re
gre
ssio
ns
for
the
foll
ow
ing
equat
ion:
Ple
ase
see
no
tes
toT
able
1fo
rex
pla
nat
ion
so
fv
aria
ble
s.Y
ear
and
ind
ust
ryin
dic
ato
rsar
ein
clu
ded
inal
lre
gre
ssio
ns
bu
tn
ot
rep
ort
ed.
Th
et-
stat
isti
csar
eb
ased
on
New
eyan
dW
est
(19
87
)st
and
ard
erro
rs.
***,*
*,a
nd
*in
dic
ate
signif
ican
ceat
the
1,5
,and
10
per
centle
vel
,res
pec
tivel
y(t
wo-t
aile
d).
that auditors with industry expertise (and thus higher competence) may be better
at reducing information risk than other auditors. Big4 is not significantly related
to IRR. InvPro is negative and significant. Our focus, however, is on ExcessFee,
which is positive and significant at the 1 percent level. This result is consistent
with Hypothesis 1 and the univariate finding. The finding supports the notion
that the stronger the potential economic bond between the audit firm and its cli-
ent, the greater the risk perceived by investors and hence the higher the required
rate of return on equity capital.
The second column repeats the analysis after adding the control for country-
level disclosure, CIFAR. CIFAR is significantly negatively related to IRR, con-
sistent with greater disclosure reducing the cost of capital. More important,
ExcessFee continues to be significantly positively associated with IRR. The thrid
and fourth columns (with and without CIFAR, respectively) show that excess
remuneration is even more strongly positively associated with IRR when using
WLS.
The conclusion from these regression results is that excess auditor remunera-
tion, which proxies for the extent of economic bonding (and hence reduced audi-
tor independence), is significantly positively associated with our ex ante proxy
for the cost of equity capital, IRR. These results support Hypothesis 1.
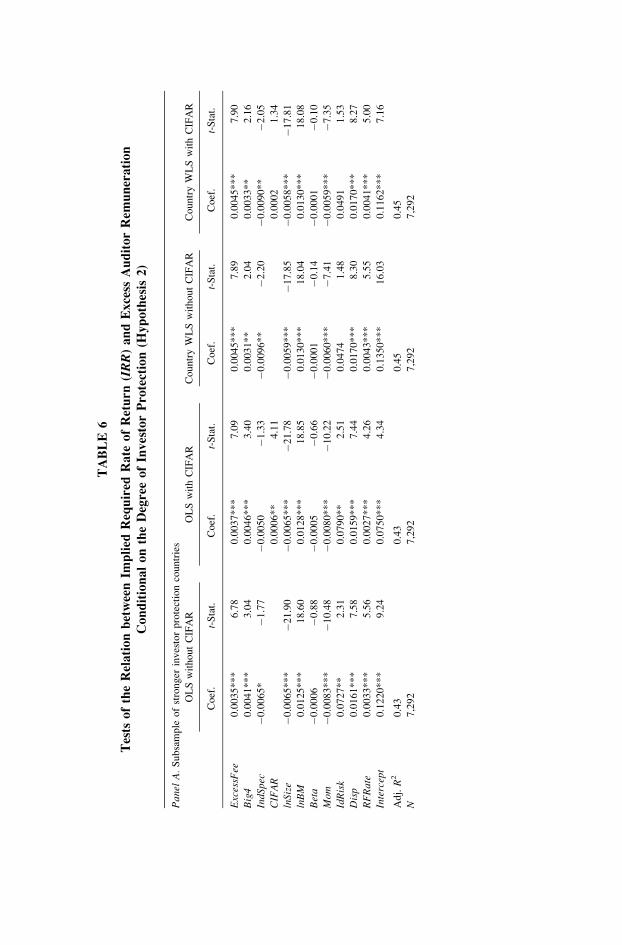
5.3.2 Tests of Hypothesis 2
We next split the sample based on investor protection and test whether
ExcessFee has a differential relation with IRR in stronger versus weaker investor
protection countries. The regression results for each subsample are reported in
Table 6. We later report sensitivity analyses regarding both our proxy for inves-
tor protection and our classification of firms into stronger and weaker countries.
Panel A of Table 6 shows that for all four regression specifications for the
stronger investor protection group (OLS and WLS, excluding and including
CIFAR), ExcessFee is positively and significantly related to IRR. Conversely,
Panel B shows that in all four models for the weaker investor protection group,
the coefficient on ExcessFee is small and not significant. Furthermore, for all
four tests, the coefficient on ExcessFee is significantly larger for the stronger inves-
tor protection group than for the weaker investor protection group, with t-statistics
between 2.46 and 3.75.35,36
35. In the reported results, we split the sample based on stronger versus weaker investor protec-tion. As a sensitivity analysis, we add InvPro to the regressions and let InvPro vary within eachgroup. Results are consistent with those reported in Table 6.
36. To further ensure that our results are not affected by the fact that significantly more obser-vations are included in the stronger than in the weaker investor protection group, we randomly selectthe same number of observations from the stronger investor protection group as we have observationsfor the weaker investor protection group (i.e., N ¼ 1,716) and repeat the tests. Results are very simi-lar to those reported and suggest that sample size differences do not explain our tabulated results.
197IMPACT OF EXCESS AUDITOR REMUNERATION
TA
BL
E6
Tes
tso
fth
eR
ela
tio
nb
etw
een
Imp
lied
Req
uir
edR
ate
of
Ret
urn
(IR
R)
an
dE
xce
ssA
ud
ito
rR
em
un
era
tio
n
Co
nd
itio
na
lo
nth
eD
egre
eo
fIn
ves
tor
Pro
tect
ion
(Hy
po
thes
is2
)
Pan
elA
.S
ub
sam
ple
of
stro
ng
erin
ves
tor
pro
tect
ion
cou
ntr
ies
OL
Sw
ith
ou
tC
IFA
RO
LS
wit
hC
IFA
RC
ou
ntr
yW
LS
wit
ho
ut
CIF
AR
Co
un
try
WL
Sw
ith
CIF
AR
Co
ef.
t-S
tat.
Co
ef.
t-S
tat.
Co
ef.
t-S
tat.
Co
ef.
t-S
tat.
Exc
essF
ee0
.00
35
**
*6
.78
0.0
03
7*
**
7.0
90
.00
45
**
*7
.89
0.0
04
5*
**
7.9
0
Big
40
.00
41
**
*3
.04
0.0
04
6*
**
3.4
00
.00
31
**
2.0
40
.00
33
**
2.1
6
IndS
pec
�0
.00
65
*�
1.7
7�
0.0
05
0�
1.3
3�
0.0
09
6*
*�
2.2
0�
0.0
09
0*
*�
2.0
5
CIF
AR
0.0
00
6*
*4
.11
0.0
00
21
.34
lnSi
ze�
0.0
06
5*
**
�2
1.9
0�
0.0
06
5*
**
�2
1.7
8�
0.0
05
9*
**
�1
7.8
5�
0.0
05
8*
**
�1
7.8
1
lnB
M0
.01
25
**
*1
8.6
00
.01
28
**
*1
8.8
50
.01
30
**
*1
8.0
40
.01
30
**
*1
8.0
8
Bet
a�
0.0
00
6�
0.8
8�
0.0
00
5�
0.6
6�
0.0
00
1�
0.1
4�
0.0
00
1�
0.1
0
Mom
�0
.00
83
**
*�
10
.48
�0
.00
80
**
*�
10
.22
�0
.00
60
**
*�
7.4
1�
0.0
05
9*
**
�7
.35
IdR
isk
0.0
72
7*
*2
.31
0.0
79
0*
*2
.51
0.0
47
41
.48
0.0
49
11
.53
Dis
p0
.01
61
**
*7
.58
0.0
15
9*
**
7.4
40
.01
70
**
*8
.30
0.0
17
0*
**
8.2
7
RF
Rat
e0
.00
33
**
*5
.56
0.0
02
7*
**
4.2
60
.00
43
**
*5
.55
0.0
04
1*
**
5.0
0
Inte
rcep
t0
.12
20
**
*9
.24
0.0
75
0*
**
4.3
40
.13
50
**
*1
6.0
30
.11
62
**
*7
.16
Ad
j.R
20
.43
0.4
30
.45
0.4
5
N7
,29
27
,29
27
,29
27
,29
2
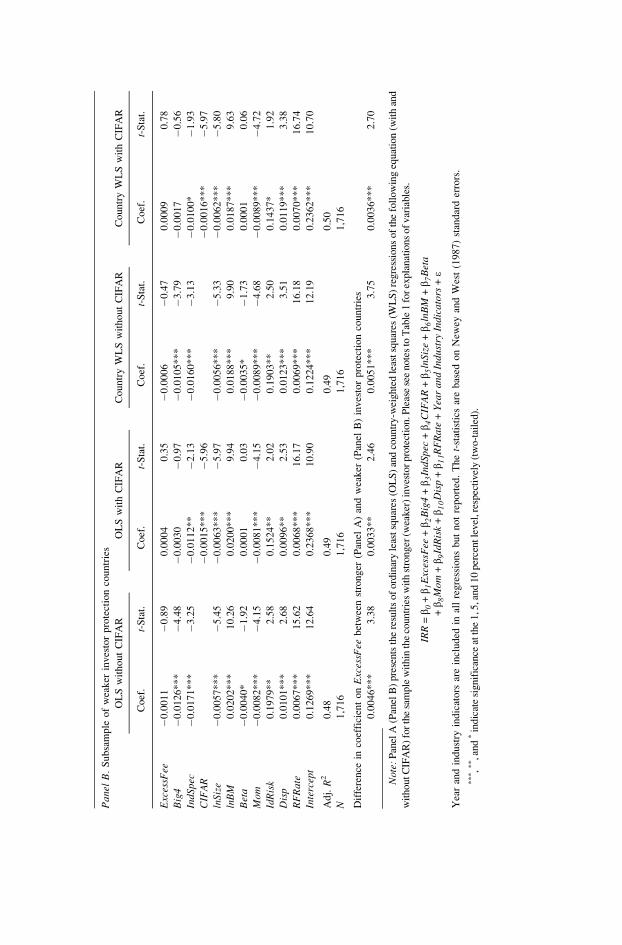
Pan
elB
.S
ub
sam
ple
of
wea
ker
inv
esto
rp
rote
ctio
nco
un
trie
s
OL
Sw
ith
ou
tC
IFA
RO
LS
wit
hC
IFA
RC
ou
ntr
yW
LS
wit
ho
ut
CIF
AR
Co
un
try
WL
Sw
ith
CIF
AR
Co
ef.
t-S
tat.
Co
ef.
t-S
tat.
Co
ef.
t-S
tat.
Co
ef.
t-S
tat.
Exc
essF
ee�
0.0
01
1�
0.8
90
.00
04
0.3
5�
0.0
00
6�
0.4
70
.00
09
0.7
8
Big
4�
0.0
12
6*
**
�4
.48
�0
.00
30
�0
.97
�0
.01
05
**
*�
3.7
9�
0.0
01
7�
0.5
6
IndS
pec
�0
.01
71
**
*�
3.2
5�
0.0
11
2*
*�
2.1
3�
0.0
16
0*
**
�3
.13
�0
.01
00
*�
1.9
3
CIF
AR
�0
.00
15
**
*�
5.9
6�
0.0
01
6*
**
�5
.97
lnSi
ze�
0.0
05
7*
**
�5
.45
�0
.00
63
**
*�
5.9
7�
0.0
05
6*
**
�5
.33
�0
.00
62
**
*�
5.8
0
lnB
M0
.02
02
**
*1
0.2
60
.02
00
**
*9
.94
0.0
18
8*
**
9.9
00
.01
87
**
*9
.63
Bet
a�
0.0
04
0*
�1
.92
0.0
00
10
.03
�0
.00
35
*�
1.7
30
.00
01
0.0
6
Mom
�0
.00
82
**
*�
4.1
5�
0.0
08
1*
**
�4
.15
�0
.00
89
**
*�
4.6
8�
0.0
08
9*
**
�4
.72
IdR
isk
0.1
97
9*
*2
.58
0.1
52
4*
*2
.02
0.1
90
3*
*2
.50
0.1
43
7*
1.9
2
Dis
p0
.01
01
**
*2
.68
0.0
09
6*
*2
.53
0.0
12
3*
**
3.5
10
.01
19
**
*3
.38
RF
Rat
e0
.00
67
**
*1
5.6
20
.00
68
**
*1
6.1
70
.00
69
**
*1
6.1
80
.00
70
**
*1
6.7
4
Inte
rcep
t0
.12
69
**
*1
2.6
40
.23
68
**
*1
0.9
00
.12
24
**
*1
2.1
90
.23
62
**
*1
0.7
0
Ad
j.R
20
.48
0.4
90
.49
0.5
0
N1
,71
61
,71
61
,71
61
,71
6
Dif
fere
nce
inco
effi
cien
to
nE
xces
sFee
bet
wee
nst
ron
ger
(Pan
elA
)an
dw
eak
er(P
anel
B)
inv
esto
rp
rote
ctio
nco
un
trie
s
0.0
04
6*
**
3.3
80
.00
33
**
2.4
60
.00
51
**
*3
.75
0.0
03
6*
**
2.7
0
Not
e:P
anel
A(P
anel
B)
pre
sents
the
resu
lts
of
ord
inar
yle
ast
squar
es(O
LS
)an
dco
untr
y-w
eighte
dle
ast
squar
es(W
LS
)re
gre
ssio
ns
of
the
foll
ow
ing
equat
ion
(wit
han
d
wit
houtC
IFA
R)
for
the
sam
ple
wit
hin
the
countr
ies
wit
hst
ronger
(wea
ker
)in
ves
tor
pro
tect
ion.P
leas
ese
enote
sto
Tab
le1
for
expla
nat
ions
of
var
iable
s.
Yea
ran
din
du
stry
ind
icat
ors
are
incl
ud
edin
all
reg
ress
ion
sb
ut
no
tre
po
rted
.T
he
t-st
atis
tics
are
bas
edo
nN
ewey
and
Wes
t(1
98
7)
stan
dar
der
rors
.
***,*
*,a
nd
*in
dic
ate
signif
ican
ceat
the
1,5
,and
10
per
centle
vel
,res
pec
tivel
y(t
wo-t
aile
d).
The results reported in this section support Hypothesis 2 and suggest that
investors view economic bonding as more serious in high investor protection
countries than in low investor protection countries. Our findings are consistent
with the arguments in Bushman and Smith (2001), Ball (2001), Francis, Khurana,
and Pereira (2003), and Francis et al. (2006) that auditing plays a lesser role in
environments that lack the ‘‘enabling’’ country-level institutions. In other words,
it is primarily in environments in which those country-level institutions are stron-
ger that investors tend to rely on an audit to assess the quality of financial state-
ment information. Thus, the negative effect of bonding between the auditor and
client firm is perceived as relatively more detrimental in stronger investor protec-
tion countries.
In addition to providing support for our second hypothesis, the results
reported above can be interpreted as lending additional support to our findings
for Hypothesis 1. That is, although our excess fee model includes a large number
of variables and exhibits high explanatory power, it is always possible that our
model does not fully control for normal fees. In this case, the positive relation
between ExcessFee and IRR may relate to IRR representing an additional
‘‘work’’ variable. Firms with higher IRR are riskier and therefore normally
require more audit effort, and more audit effort leads to higher fees. While this
reasoning still leads to a positive relation between ExcessFee and IRR as pre-
dicted by Hypothesis 1, causality is in the opposite direction to that discussed. If
our finding for ExcessFee reflects issues related to effort and risk for which we
do not fully control in the ExcessFee model, the same should hold in both stron-
ger and weaker investor protection countries. The fact that we observe a signifi-
cantly stronger relation in countries in which we predict a stronger relation
increases our confidence in the results and conclusions.
5.4 Robustness Tests
Although we report several specifications of our models above, in this sec-
tion, we subject our findings to a number of further robustness and specification
checks. In particular, we report on sensitivity analyses related to our test vari-
able (ExcessFee), our partitioning variable (InvPro), and several other robust-
ness tests.37
5.4.1 Auditor Remuneration
Given the importance of ExcessFee in our tests, we discuss results of five
different sensitivity analyses related to auditor remuneration.
5.4.1.1 Audit versus nonaudit fees. Table 7 reports the results for a sample
of 533 U.K. and 1,562 U.S. observations that have available data for both audit
37. For brevity, we tabulate only the results of the first sensitivity analysis. Other robustnessresults are available from the authors upon request.
200 JOURNAL OF ACCOUNTING, AUDITING & FINANCE
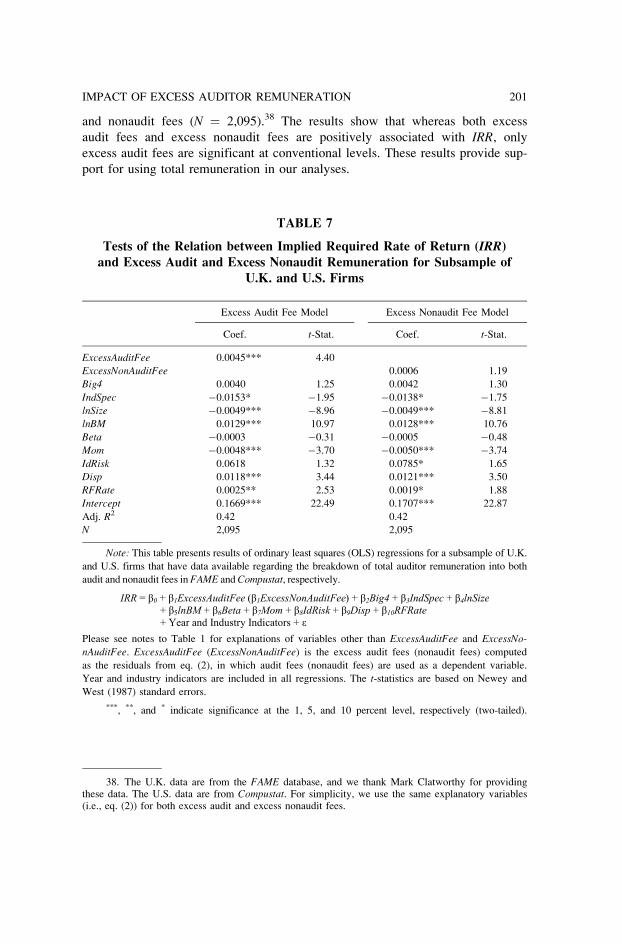
and nonaudit fees (N ¼ 2,095).38 The results show that whereas both excess
audit fees and excess nonaudit fees are positively associated with IRR, only
excess audit fees are significant at conventional levels. These results provide sup-
port for using total remuneration in our analyses.
TABLE 7
Tests of the Relation between Implied Required Rate of Return (IRR)
and Excess Audit and Excess Nonaudit Remuneration for Subsample of
U.K. and U.S. Firms
Excess Audit Fee Model Excess Nonaudit Fee Model
Coef. t-Stat. Coef. t-Stat.
ExcessAuditFee 0.0045*** 4.40
ExcessNonAuditFee 0.0006 1.19
Big4 0.0040 1.25 0.0042 1.30
IndSpec �0.0153* �1.95 �0.0138* �1.75
lnSize �0.0049*** �8.96 �0.0049*** �8.81
lnBM 0.0129*** 10.97 0.0128*** 10.76
Beta �0.0003 �0.31 �0.0005 �0.48
Mom �0.0048*** �3.70 �0.0050*** �3.74
IdRisk 0.0618 1.32 0.0785* 1.65
Disp 0.0118*** 3.44 0.0121*** 3.50
RFRate 0.0025** 2.53 0.0019* 1.88
Intercept 0.1669*** 22.49 0.1707*** 22.87
Adj. R2 0.42 0.42
N 2,095 2,095
Note: This table presents results of ordinary least squares (OLS) regressions for a subsample of U.K.
and U.S. firms that have data available regarding the breakdown of total auditor remuneration into both
audit and nonaudit fees in FAME and Compustat, respectively.
Please see notes to Table 1 for explanations of variables other than ExcessAuditFee and ExcessNo-
nAuditFee. ExcessAuditFee (ExcessNonAuditFee) is the excess audit fees (nonaudit fees) computed
as the residuals from eq. (2), in which audit fees (nonaudit fees) are used as a dependent variable.
Year and industry indicators are included in all regressions. The t-statistics are based on Newey and
West (1987) standard errors.
***, **, and * indicate significance at the 1, 5, and 10 percent level, respectively (two-tailed).
38. The U.K. data are from the FAME database, and we thank Mark Clatworthy for providingthese data. The U.S. data are from Compustat. For simplicity, we use the same explanatory variables(i.e., eq. (2)) for both excess audit and excess nonaudit fees.
201IMPACT OF EXCESS AUDITOR REMUNERATION
5.4.1.2 Potential simultaneity between IRR and auditor remuneration. We
have implicitly assumed that auditor remuneration is not affected by the firm’s
cost of equity capital. This may not be the case and we deal with the issue that
IRR and auditor remuneration may be simultaneously determined by estimating a
two-stage least squares (2SLS) model. In the first stage, we regress total auditor
remuneration on all the variables previously included in eq. (2) as well as IRR.
Untabulated results show that IRR does not load significantly as an explanatory
variable for auditor remuneration. More important, controlling for this potential
simultaneity does not alter the result in the second-stage equation: auditor remu-
neration is positively associated with IRR at the 1 percent level. This result sug-
gests that our finding is not confounded by possible simultaneity between IRRand excess auditor remuneration.
5.4.1.3 Separate estimations with positive and negative ExcessFee. If
ExcessFee appropriately captures economic rents associated with perceived lack
of independence, then we are more likely to observe a positive relation between
ExcessFee and IRR when ExcessFee is positive. Bonding is less likely to occur
for any level of negative ExcessFee. Therefore, a relation between ExcessFeeand IRR is expected when ExcessFee is negative. If ExcessFee captures addi-
tional work required for riskier clients, then the positive relation between Excess-Fee and IRR should hold whether ExcessFee is positive or negative. Under this
scenario, negative ExcessFee would simply suggest lower fees charged for a less
risky client. The more negative ExcessFee, the less risky the firm and the less
work required of the auditor.39
We reestimate eq. (1) separately for positive and negative values of Excess-Fee. For the subsample with positive values of ExcessFee, we find a positive
and significant (at the 1 percent level) coefficient on ExcessFee. In contrast, for
the subsample with negative values of ExcessFee, we find a negative and insig-
nificant coefficient on ExcessFee. Finding a significant relation only for the posi-
tive ExcessFee subsample supports our main conclusions that excess auditor
remuneration influences IRR.40 An economic bond between the auditor and the
client is more likely to occur when excess auditor remuneration is positive. As
the extent of positive excess remuneration increases, so too does the strength of
the auditor-client bonding. Because negative excess fees are not expected to cre-
ate auditor-client bonding, IRR should not vary with the extent of negative
39. As an example of this test in prior research, see Choi, Kim, and Zang (2005). They findthat audit quality (measured as unsigned discretionary accruals) is negatively associated with abnor-mal audit fees for the subsample of clients with positive abnormal fees. For the subsample of clientswith negative abnormal fees, no association is found.
40. As an alternative test, we have ranked observations into quintiles based on the magnitudeof ExcessFee. We then omit the middle quintile (as it is hard to argue that very small positive excessfees give rise to different incentives than very small negative excess fees), and compare the top andbottom two quintiles. We find similar results as those reported in the text.
202 JOURNAL OF ACCOUNTING, AUDITING & FINANCE
excess remuneration. ExcessFee does not appear to be capturing additional audit
work related to IRR.
5.4.1.4 Potential effects of the Sarbanes-Oxley Act of 2002. Sarbanes-
Oxley Act of 2002 (SOX) came into effect in 2002 and may have affected audi-
tor fees, especially in the United States (and possibly elsewhere). Consistent with
that possibility, untabulated statistics show that mean auditor fees are signifi-
cantly higher in the post-SOX period (2002–2003) than in the pre-SOX period
(1995–2001). Recall, however, that both our models for excess fees and IRR al-
ready include year controls. Nevertheless, to control for the potential effects of
SOX, we estimate excess fees separately in the pre- and post-SOX periods and
repeat the tests. Again, no inferences are changed.
5.4.1.5 Controlling for last year’s auditor fees. As a final test related to
auditor remuneration, we repeat the analyses after controlling for last year’s audi-
tor fees in the excess fee model (which effectively makes it a changes specifica-
tion). Requiring data on lagged fees reduces the sample to 5,831 observations.
ExcessFee continues to be significantly and positively associated with IRR in this
smaller sample, and the association is significant (insignificant) for stronger
(weaker) investor protection countries.
5.4.2 Investor Protection
Next, we test the robustness of our Hypothesis 2 result to the choice of in-
vestor protection measure. In particular, following Francis et al. (2006), we
replace InvPro with the level of economic development, measured as gross
domestic product (GDP) per capita per country. As an alternative, we employ the
security regulation measure used in Hail and Leuz (2006) instead of InvPro.
Untabulated results show that our inferences for both Hypothesis 1 and Hypothe-
sis 2 are unaltered. ExcessFee continues to be positively and significantly associ-
ated with IRR after controlling for economic development (security regulation).
The coefficient on ExcessFee for the higher economic development (security reg-
ulation) sample is positive and significant, whereas the coefficient for the lower
economic development (security regulation) sample is insignificant (and the dif-
ference in coefficients is significant at the 1 percent level).
5.4.3 Other Robustness Tests
5.4.3.1 Further controls for sample size differences across countries. We
conduct additional analyses to confirm that our Hypothesis 2 results are not
driven by sample size differences across countries. We first restrict the sample to
countries that have at least 100 observations (leaving ten countries) and classify
the top (bottom) five countries as stronger (weaker) investor protection. As a
203IMPACT OF EXCESS AUDITOR REMUNERATION
second test, because the United States has the highest number of observations
and is included in the stronger investor protection group, we repeat the analysis
excluding the United States. No inferences are affected in these two sensitivity
tests.41
5.4.3.2 Alternative control for sample period difference. Although we
include year indicators in all our regressions and report results excluding U.S.
observations, our U.S. sample covers only years 2001 to 2003 due to auditor remu-
neration data availability. This limitation can raise a concern that the U.S. sample
is not comparable to the other samples. To this end, we reestimate our main regres-
sion using only observations from years 2001 to 2003. In this subsample of obser-
vations that represents all fourteen of our sample counries, our results remain
robust.
5.4.3.3 Excluding firms cross-listed in the United States. All non-U.S.
firms that cross-list in the United States are exposed to the U.S. legal system
(e.g., Hope, Kang, and Zang [2007]). Thus, as a sensitivity analysis, we exclude
all such firms from our sample. This reduces our sample size to 8,754 observa-
tions.42 Results are similar to those reported and no inferences are affected.
5.4.3.4 Alternative controls for auditor type. As alternative controls for
auditor type, we first reestimate the regressions using only firms that are audited
by Big 4 auditors (N ¼ 8,057).43 Second, we control for potential endogeneity in
Big4 using an auditor selection model similar to the one in Khurana and Raman
(2004). No inferences are affected in these sensitivity analyses.
5.4.3.5 Controls for analysts’ forecast bias and forecast accurcay. First,
we include forecast bias as an additional control variable in our regressions. Sec-
ond, we compute analysts’ forecast accuracy-weighted IRR estimates, giving
more weight to observations with higher forecast accuracy and reducing the
influence of estimates of inputs with relatively noisy inputs (see Hail and Leuz
[2006]). For both robustness checks, inferences are unaffected.
Collectively, the evidence presented in Tables 5–7 and the additional sensi-
tivity analyses described above suggest that excess auditor remuneration is
41. We also compute results for the U.S. sample alone (untabulated). The estimated coefficienton ExcessFee is positive (0.005) and significant at the 1 percent level (and is significantly greaterthan the coefficient for the weaker investor protection group).
42. The percentage reduction in the sample size is almost identical between stronger andweaker investor protection countries. Specifically, the sample excluding cross-listed firms includes7,083 and 1,671 observations from stronger and weaker investor protection countries, respectively.
43. We repeat the analysis for firms that switch (do not switch) auditor. Untabulated resultsshow that ExcessFee is positive and significant in both subsamples, mitigating concerns that ourresults may be due to inadequate control for auditor switching.
204 JOURNAL OF ACCOUNTING, AUDITING & FINANCE
positively associated with IRR and that this effect is more pronounced in stronger
investor protection countries.
6. Conclusion
Using a sample drawn from firms in fourteen countries, this study examines
the relation between excess auditor remuneration and the IRR on equity capital
in global markets. We test whether IRR is affected by excess auditor remunera-
tion through an information risk effect. We further investigate whether the
strength of the relation between IRR and excess auditor remuneration varies sys-
tematically with the degree of investor protection in the economy.
Our evidence shows that (1) excess auditor remuneration is positively associ-
ated with IRR and (2) the positive relation between IRR and excess auditor
remuneration is stronger in countries that have stronger investor protection envi-
ronments. These results are robust to the inclusion of an extensive set of control
variables and to several sensitivity analyses.
We advance the literature in two important aspects. First, our evidence shows that
investors demand higher rates of return for firms with abnormally high auditor remu-
neration, consistent with the general investor view that excess auditor remuneration
represents economic bonding between the auditor and the client. Such bonding leads
to a less independent audit, which reduces the role of the audit in minimizing informa-
tion risk. Second, we show that this effect varies with the degree of investor protection
in a country. The findings are consistent with the arguments in Ball (2001), Bushman
and Smith (2001), Francis, Khurana, and Pereira (2003), and Francis et al. (2006) that
auditing plays a reduced role in environments that lack the ‘‘enabling’’ country-level
institutions. In other words, it is primarily in environments in which those country-
level institutions are stronger that investors tend to rely more on an audit to assess the
quality of financial statement information. Thus, the negative effect of bonding
between the auditor and the client firm is perceived as relatively more detrimental in
stronger investor protection countries.
Although we subject our findings to a battery of robustness tests, our find-
ings should be interpreted cautiously. First, as is common in this line of research,
it is difficult to prove causality. That is, we establish a strong case for a positive
association between excess auditor remunerarion and the ex ante cost of equity
capital (controlling for potential simultaneity between the two as well as control-
ling for last year’s fees), but our tests cannot prove that increases in (excess)
auditor remuneration cause an increase in IRR. Second, although our choice of
investor protection variable has been used in prior research, it could proxy for
some unknown country factor. However, we report results using alternative prox-
ies for investor protection, and we control for country-level disclosure scores.
Third, although we subject our measure of IRR to a number of sensitivity analy-
ses, it could still be measured with error. Finally, our sample size is constrained
by the availability of auditor remuneration. Thus, we cannot claim that our
results would necessarily generalize to a broader set of firms.
205IMPACT OF EXCESS AUDITOR REMUNERATION
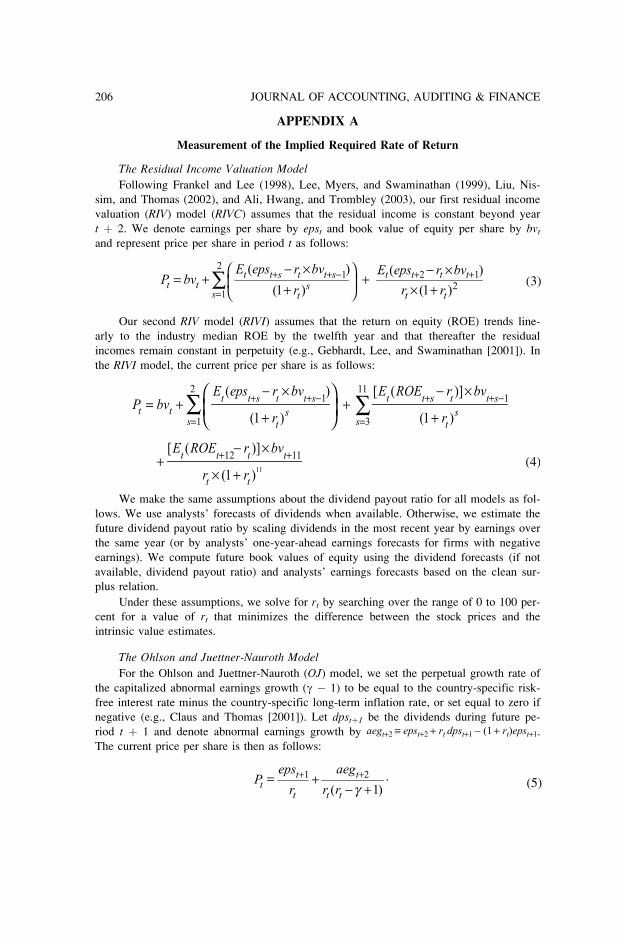
APPENDIX A
Measurement of the Implied Required Rate of Return
The Residual Income Valuation Model
Following Frankel and Lee (1998), Lee, Myers, and Swaminathan (1999), Liu, Nis-
sim, and Thomas (2002), and Ali, Hwang, and Trombley (2003), our first residual income
valuation (RIV) model (RIVC) assumes that the residual income is constant beyond year
t þ 2. We denote earnings per share by epst and book value of equity per share by bvt
and represent price per share in period t as follows:
Our second RIV model (RIVI) assumes that the return on equity (ROE) trends line-
arly to the industry median ROE by the twelfth year and that thereafter the residual
incomes remain constant in perpetuity (e.g., Gebhardt, Lee, and Swaminathan [2001]). In
the RIVI model, the current price per share is as follows:
We make the same assumptions about the dividend payout ratio for all models as fol-
lows. We use analysts’ forecasts of dividends when available. Otherwise, we estimate the
future dividend payout ratio by scaling dividends in the most recent year by earnings over
the same year (or by analysts’ one-year-ahead earnings forecasts for firms with negative
earnings). We compute future book values of equity using the dividend forecasts (if not
available, dividend payout ratio) and analysts’ earnings forecasts based on the clean sur-
plus relation.
Under these assumptions, we solve for rt by searching over the range of 0 to 100 per-
cent for a value of rt that minimizes the difference between the stock prices and the
intrinsic value estimates.
The Ohlson and Juettner-Nauroth Model
For the Ohlson and Juettner-Nauroth (OJ) model, we set the perpetual growth rate of
the capitalized abnormal earnings growth (g � 1) to be equal to the country-specific risk-
free interest rate minus the country-specific long-term inflation rate, or set equal to zero if
negative (e.g., Claus and Thomas [2001]). Let dpstþ1 be the dividends during future pe-
riod t þ 1 and denote abnormal earnings growth by .
The current price per share is then as follows:
206 JOURNAL OF ACCOUNTING, AUDITING & FINANCE
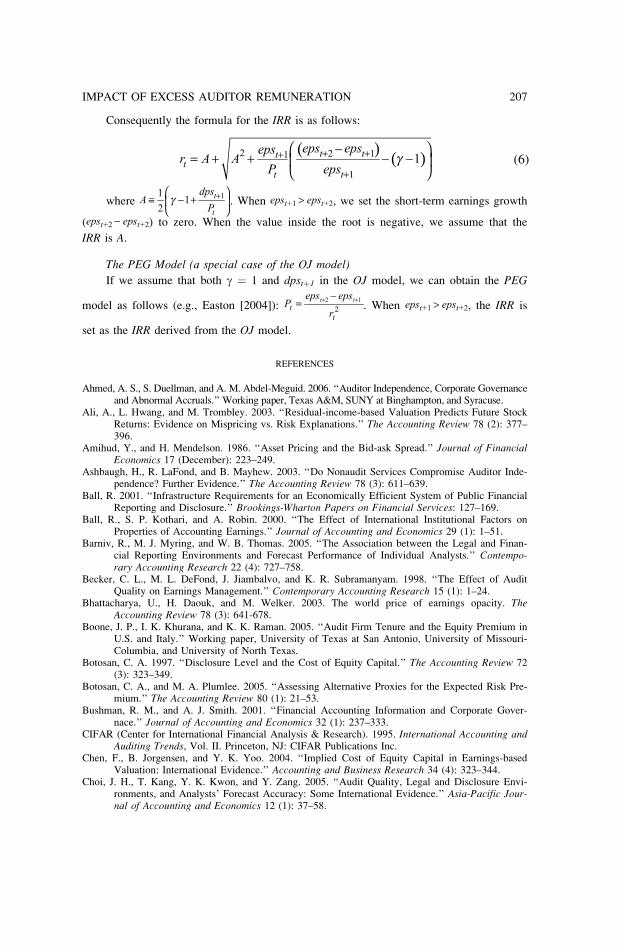
Consequently the formula for the IRR is as follows:
where . When , we set the short-term earnings growth
( ) to zero. When the value inside the root is negative, we assume that the
IRR is A.
The PEG Model (a special case of the OJ model)
If we assume that both g ¼ 1 and dpstþ1 in the OJ model, we can obtain the PEG
model as follows (e.g., Easton [2004]): . When , the IRR is
set as the IRR derived from the OJ model.
REFERENCES
Ahmed, A. S., S. Duellman, and A. M. Abdel-Meguid. 2006. ‘‘Auditor Independence, Corporate Governanceand Abnormal Accruals.’’ Working paper, Texas A&M, SUNY at Binghampton, and Syracuse.
Ali, A., L. Hwang, and M. Trombley. 2003. ‘‘Residual-income-based Valuation Predicts Future StockReturns: Evidence on Mispricing vs. Risk Explanations.’’ The Accounting Review 78 (2): 377–396.
Amihud, Y., and H. Mendelson. 1986. ‘‘Asset Pricing and the Bid-ask Spread.’’ Journal of FinancialEconomics 17 (December): 223–249.
Ashbaugh, H., R. LaFond, and B. Mayhew. 2003. ‘‘Do Nonaudit Services Compromise Auditor Inde-pendence? Further Evidence.’’ The Accounting Review 78 (3): 611–639.
Ball, R. 2001. ‘‘Infrastructure Requirements for an Economically Efficient System of Public FinancialReporting and Disclosure.’’ Brookings-Wharton Papers on Financial Services: 127–169.
Ball, R., S. P. Kothari, and A. Robin. 2000. ‘‘The Effect of International Institutional Factors onProperties of Accounting Earnings.’’ Journal of Accounting and Economics 29 (1): 1–51.
Barniv, R., M. J. Myring, and W. B. Thomas. 2005. ‘‘The Association between the Legal and Finan-cial Reporting Environments and Forecast Performance of Individual Analysts.’’ Contempo-rary Accounting Research 22 (4): 727–758.
Becker, C. L., M. L. DeFond, J. Jiambalvo, and K. R. Subramanyam. 1998. ‘‘The Effect of AuditQuality on Earnings Management.’’ Contemporary Accounting Research 15 (1): 1–24.
Bhattacharya, U., H. Daouk, and M. Welker. 2003. The world price of earnings opacity. TheAccounting Review 78 (3): 641-678.
Boone, J. P., I. K. Khurana, and K. K. Raman. 2005. ‘‘Audit Firm Tenure and the Equity Premium inU.S. and Italy.’’ Working paper, University of Texas at San Antonio, University of Missouri-Columbia, and University of North Texas.
Botosan, C. A. 1997. ‘‘Disclosure Level and the Cost of Equity Capital.’’ The Accounting Review 72(3): 323–349.
Botosan, C. A., and M. A. Plumlee. 2005. ‘‘Assessing Alternative Proxies for the Expected Risk Pre-mium.’’ The Accounting Review 80 (1): 21–53.
Bushman, R. M., and A. J. Smith. 2001. ‘‘Financial Accounting Information and Corporate Gover-nace.’’ Journal of Accounting and Economics 32 (1): 237–333.
CIFAR (Center for International Financial Analysis & Research). 1995. International Accounting andAuditing Trends, Vol. II. Princeton, NJ: CIFAR Publications Inc.
Chen, F., B. Jorgensen, and Y. K. Yoo. 2004. ‘‘Implied Cost of Equity Capital in Earnings-basedValuation: International Evidence.’’ Accounting and Business Research 34 (4): 323–344.
Choi, J. H., T. Kang, Y. K. Kwon, and Y. Zang. 2005. ‘‘Audit Quality, Legal and Disclosure Envi-ronments, and Analysts’ Forecast Accuracy: Some International Evidence.’’ Asia-Pacific Jour-nal of Accounting and Economics 12 (1): 37–58.
207IMPACT OF EXCESS AUDITOR REMUNERATION
Choi, J. H., J. B. Kim, and Y. Zang. 2005. ‘‘The Association between Audit Quality and AbnormalAudit Fees.’’ Working paper, Hong Kong University of Science and Technology, Hong KongPolytechnic University, and Singapore Management University.
Choi, J. H., and T. J. Wong. 2007. ‘‘Auditors’ Governance Functions and Legal Environments: AnInternational Investigation.’’ Contemporary Accounting Research 24 (1): 13–46.
Chung, H., and S. Kallapur. 2003. ‘‘Client Importance, Non-audit Services, and Abnormal Accruals.’’The Accounting Review 78 (4): 931–955.
Clatworthy, M. 2005. Transnational Equity Analysis. London: John Wiley & Sons.Claus, J., and J. Thomas. 2001. ‘‘Equity Premia as Low as Three Percent? Evidence from Analysts’
Earnings Forecast for Domestic and International Stock Market.’’ The Journal of Finance 56(October): 1629–1666.
DeAngelo, L. E. 1981. ‘‘Auditor Size and Audit Quality.’’ Journal of Accounting and Economics 3(December): 183–199.
DeFond, M., M. Hung, and R. Trezevant. 2007. ‘‘Investor Protection and the Information Content ofAnnual Earnings Announcements: International Evidence.’’ Journal of Accounting and Eco-nomics 43 (1): 37–67.
Ding, Y., O.-K. Hope, T. Jeanjean, and H. Stolowy. 2007. ‘‘Differences between Domestic Account-ing Standards and IAS: Measurement, Determinants and Implications.’’ Journal of Accountingand Public Policy 26 (1): 1–38.
Doidge, C., A. Karolyi, and R. Stulz. 2007. ‘‘Why Do Countries Matter So Much for Corporate Gov-ernance?’’ Journal of Financial Economics 86 (1): 1–39.
Dye, R. A. 1993. ‘‘Auditing Standards, Legal Liability, and Auditor Wealth.’’ Journal of PoliticalEconomy 101 (5): 887–914.
Easley, D., and M. O’Hara. 2004. ‘‘Information and the Cost of Capital.’’ Journal of Finance 59 (Au-gust): 1553–1584.
Easton, P. D. 2004. ‘‘PE Ratios, PEG Ratios, and Estimating the Implied Expected Rate of Return onEquity Capital.’’ The Accounting Review 79 (January): 73–95.
Fama, E. F, and K. R. French. 1992. ‘‘The Cross-section of Expected Stock Returns.’’ Journal ofFinance 47 (2): 427–465.
———. 1993. ‘‘Common Risk Factors in the Returns on Stocks and Bonds.’’ Journal of FinancialEconomics 33 (1): 3–56.
———. 1995. ‘‘Size and Book-to-Market Factors in Earnings and Returns.’’ Journal of Finance 50(1): 131–155.
———. 1997. ‘‘Industry Costs of Equity.’’ Journal of Financial Economics 43 (2): 153–193.Fan, J. P. H., and T. J. Wong. 2005. ‘‘Do External Auditors Perform a Corporate Governance Role
in Emerging Markets? Evidence from East Asia.’’ Journal of Accounting Research 43 (1):35–72.
Francis, J. R., I. K. Khurana, and R. Pereira. 2003. ‘‘The Role of Accounting and Auditing in Corpo-rate Governance and the Development of Financial Markets around the World.’’ Asia-PacificJournal of Accounting and Economics 10: 1–30.
Francis, J., R. LaFond, P. Olsson, and K. Schipper. 2004. ‘‘Costs of Equity and Earnings Attributes.’’The Accounting Review 79 (4): 967–1010.
Francis, J. R., I. K. Khurana, X. Martin, and R. Pereira. 2006. ‘‘The Role of Firm-Specific Incentivesand Country-Level Factors in the Voluntary Demand for Independent Audits.’’ Working paper,University of Missouri-Columbia.
Frankel, R. M., and C. M. C. Lee. 1998. ‘‘Accounting Valuation, Market Expectation, and Cross-sectional Stock Returns.’’ Journal of Accounting and Economics 25 (June): 283–319.
———. 1999. ‘‘Accounting Diversity and International Valuation.’’ Working paper, University ofMichigan.
Frankel, R. M., M. F. Johnson, and K. K. Nelson. 2002. ‘‘The Relation between Auditors’ Feesfor Nonaudit Services and Earnings Management.’’ The Accounting Review 77 (Supplement):71–105.
Gebhardt, W., C. M. C. Lee, and B. Swaminathan. 2001. ‘‘Toward an Implied Cost of Capital.’’ Jour-nal of Accounting Research 39 (June): 135–176.
Gode, D. K. K., and P. Mohanram. 2003. ‘‘Inferring the Cost of Capital Using the Ohlson-JuettnerModel.’’ Review of Accounting Studies 8 (4): 399–431.
Guay, W., S. P. Kothari, and S. Shu. 2005. ‘‘Properties of Implied Cost of Capital Using Analysts’Forecasts.’’ Working paper, University of Pennsylvania, MIT, and Boston College.
208 JOURNAL OF ACCOUNTING, AUDITING & FINANCE
Gul, F. A., C. J. P. Chen, and J. S. L. Tsui. 2003. ‘‘Discretionary Accounting Accruals, Managers’Incentives, and Audit Fees.’’ Contemporary Accounting Research 20 (3): 441–464.
Hail, L., and C. Leuz. 2006. ‘‘International Differences in the Cost of Equity Capital: Do Legal Insti-tutions and Securities Regulation Matter?’’ Journal of Accounting Research 44 (3): 485–531.
Hansen, S. C., and J. S. Watts. 1997. ‘‘Two Models of the Auditor-Client Interaction: Tests withUnited Kingdom Data’’ Contemporary Accounting Research 14 (2): 23–50.
Hope, O.-K. 2003. ‘‘Disclosure Practices, Enforcement of Accounting Standards and Analysts’ Fore-cast Accuracy: An International Study.’’ Journal of Accounting Research 41 (2): 235–272.
Hope, O.-K., T. Kang, and Y. Zang. 2007. ‘‘Bonding to the Improved Disclosure Environment in theUnited States and the Capital Market Consequences.’’ Journal of Contemporary Accountingand Economics 3 (2): 1–33.
Hope, O.-K., and J. C. Langli. 2008. Auditor Independence in a Private Firm and Low LitigationRisk Setting.’’ Working paper, University of Toronto and Norwegian School of Management.
Hung, M. 2000. ‘‘Accounting Standards and Value Relevance of Earnings: An International Analy-sis.’’ Journal of Accounting and Economics 30 (3): 401–420.
Joos, P., and M. Lang. 1994. ‘‘The Effects of Accounting Diversity: Evidence from the EuropeanUnion.’’ Journal of Accounting Research 32 (3): 141–168.
Khurana, I., and K. Raman. 2004. ‘‘Litigation Risk and the Financial Reporting Credibility of Big 4Versus Non-Big Audits: Evidence from Anglo-American Countries.’’ The Accounting Review79 (2): 473–495.
Lakonishok, J., A. Shleifer, and R. Vishny. 1994. ‘‘Contrarian Investment, Extrapolation, and Risk.’’Journal of Finance 49 (5): 1541–1578.
Lambert, R., C. Leuz, and R. Verrecchia. 2007. ‘‘Accounting Information, Disclosure, and the Costof Capital.’’ Journal of Accounting Research 45 (2): 385–420.
La Porta, R., F. Lopez-de-Silanes, A. Shleifer, and R. Vishny. 1997. ‘‘Legal Determinants of ExternalFinance.’’ Journal of Finance 52 (3): 1131–1150.
———. 1998. ‘‘Law and Finance.’’ The Journal of Political Economy 106 (6): 1113–1155.———. 2000. ‘‘Investor Protection and Corporate Governance.’’ Journal of Financial Economics 58
(1-2): 3–27.Lee, C. M. C., J. Myers, and B. Swaminathan. 1999. ‘‘What Is the Intrinsic Value of the Dow?’’ The
Journal of Finance 54 (October): 1693–1741.Lehmann, B. N. 1990. ‘‘Residual Risk Revisited.’’ Journal of Econometrics 45 (1–2): 71–97.Leuz, C., D. Nanda, and P. Wysocki. 2003. ‘‘Earnings Management and Investor Protection: An
International Comparison.’’ Journal of Financial Economics 69 (3): 505–527.Levitt, A. 2000. ‘‘Renewing the Covenant with Investors.’’ Speech by the SEC chairman at New
York University Center for Law and Business, New York, NY.Liu, J., D. Nissim, and J. Thomas. 2002. ‘‘Equity Valuation Using Multiples.’’ Journal of Accounting
Research 40 (March): 135–172.Magee, R. P., and M.-C. Tseng. 1990. ‘‘Audit Pricing and Independence.’’ The Accounting Review 65
(2): 315–336.Malkiel, B. G., and Y. Xu. 1997. ‘‘Risk and Return Revisited.’’ Journal of Portfolio Management 23
(Spring): 9–14.Mansi, S., W. Maxwell, and D. Miller. 2004. ‘‘Does Auditor Quality and Tenure Matter to Investors?
Evidence from the Bond Market.’’ Journal of Accounting Research 42 (4): 755–793.Menon, K., and D. D. Williams. 1994. ‘‘The Insurance Hypothesis and Market Prices.’’ The Account-
ing Review 69 (2): 327–342.Nelson, M., J. Elliott, and R. Tarpley. 2002. ‘‘Evidence from Auditors about Managers’ and Auditors’
Earnings Management Decisions.’’ The Accounting Review 77 (Supplement): 175–202.Newey, W. K., and K. D. West. 1987. ‘‘A Simple, Positive Semi-definite Heteroskedasticity and
Autocorrelation Consistent Covariance Matrix.’’ Econometrica 55 (3): 703–708.Ohlson, J. A. 1995. ‘‘Earnings, Book Values, and Dividends in Security Valuation.’’ Contemporary
Accounting Research 11 (Spring): 661–687.Ohlson, J. A., and B. E. Juettner-Nauroth. 2005. ‘‘Expected EPS and EPS Growth as Determinants of
Value.’’ Review of Accounting Studies 10 (2–3): 349–365.Palmrose, Z-V. 1988. ‘‘An Analysis of Auditor Litigation and Audit Service Quality.’’ The Account-
ing Review 63 (1): 55–73.Penman, S. H. 2004. Financial Statement Analysis and Security Valuation, 2nd ed. New York, NY:
McGraw-Hill.
209IMPACT OF EXCESS AUDITOR REMUNERATION

Reese, W., and M. Weisbach. 2002. Protection of Minority Shareholder Interests, Cross-listings in theUnited States and Subsequent Equity Offerings.’’ Journal of Financial Economics 66 (1): 65–104.
Reynolds, J. K., and J. R. Francis. 2001. ‘‘Does Size Matter? The Influence of Large Clients onOffice-Level Auditor Reporting Decisions.’’ Journal of Accounting and Economics 30 (De-cember): 375–400.
Simunic, D., and M. T. Stein. 1987. Product Differentiation in Auditing: A Study of Auditor Choicein the Market for Unseasoned New Issues. Vancouver, B.C.: Canadian Certified GeneralAccountants’ Research Foundation.
Trompeter, G. 1994. ‘‘The Effect of Partner Compensation Schemes and Generally AcceptedAccounting Principles on Audit Partner Judgment.’’ Auditing: A Journal of Practice & Theory13: 56–68.
Vuolteenaho, T. 2002. ‘‘What Drives Firm-Level Stock Returns?’’ Journal of Finance 57 (1): 233–264.
210 JOURNAL OF ACCOUNTING, AUDITING & FINANCE