Embed Size (px)
Citation preview
Impact of Energy Crops on World markets
Alastair Dickie
Director, Crop Marketing, HGCA
If we want biofuels, …
• are we going to starve?
• can Food and Fuel from agriculture co-exist?
• will we damage the Environment?
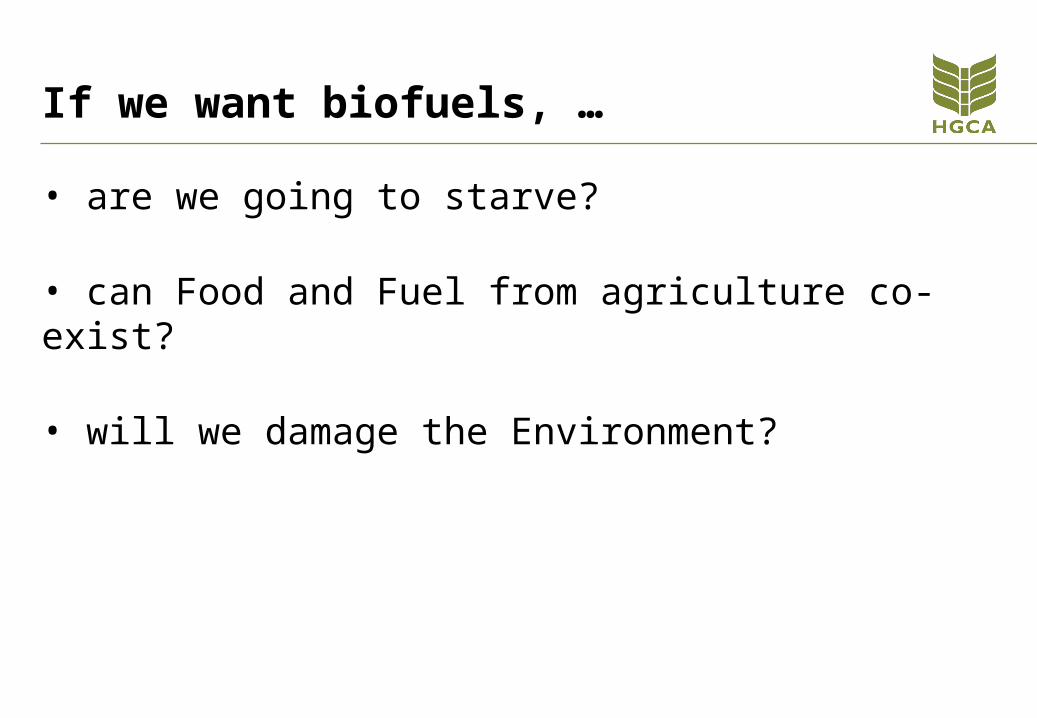
Source: HGCA/DTI
UK Road Transport Fuel Use- Greener, more efficient. But still growing
10
15
20
25
30
35
40
1970
1972
1974
1976
1978
1980
1982
1984
1986
1988
1990
1992
1994
1996
1998
2000
2002
2004
M t
on
ne
s
Petrol Diesel
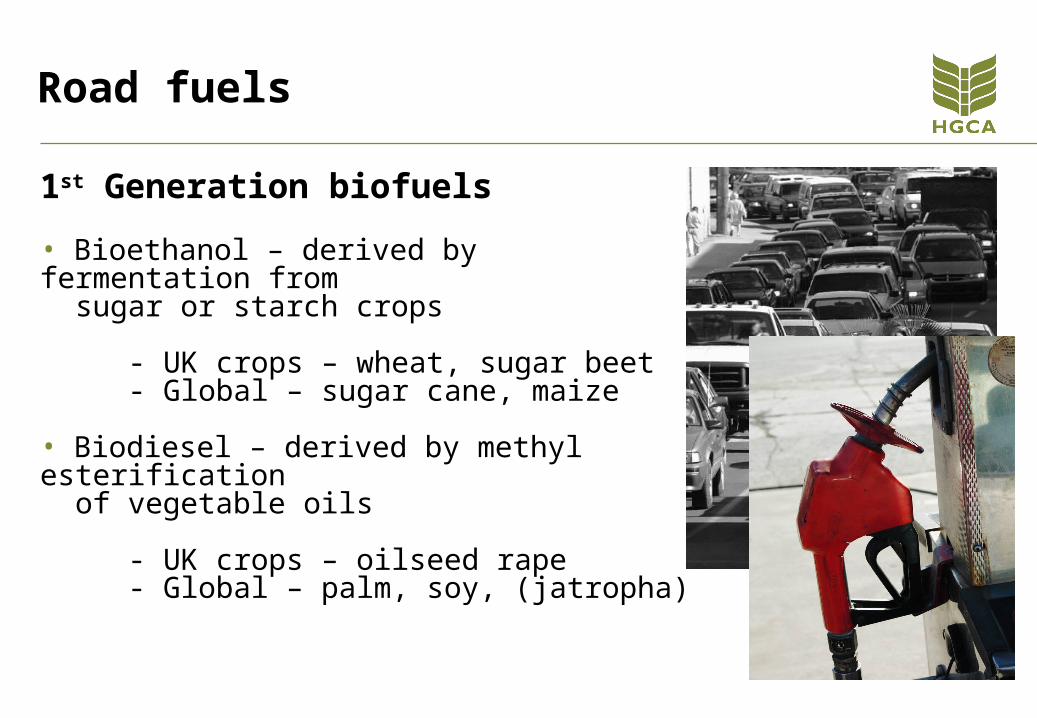
Road fuels
1st Generation biofuels
• Bioethanol – derived by fermentation from sugar or starch crops
- UK crops – wheat, sugar beet- Global – sugar cane, maize
• Biodiesel – derived by methyl esterification of vegetable oils
- UK crops – oilseed rape- Global – palm, soy, (jatropha)
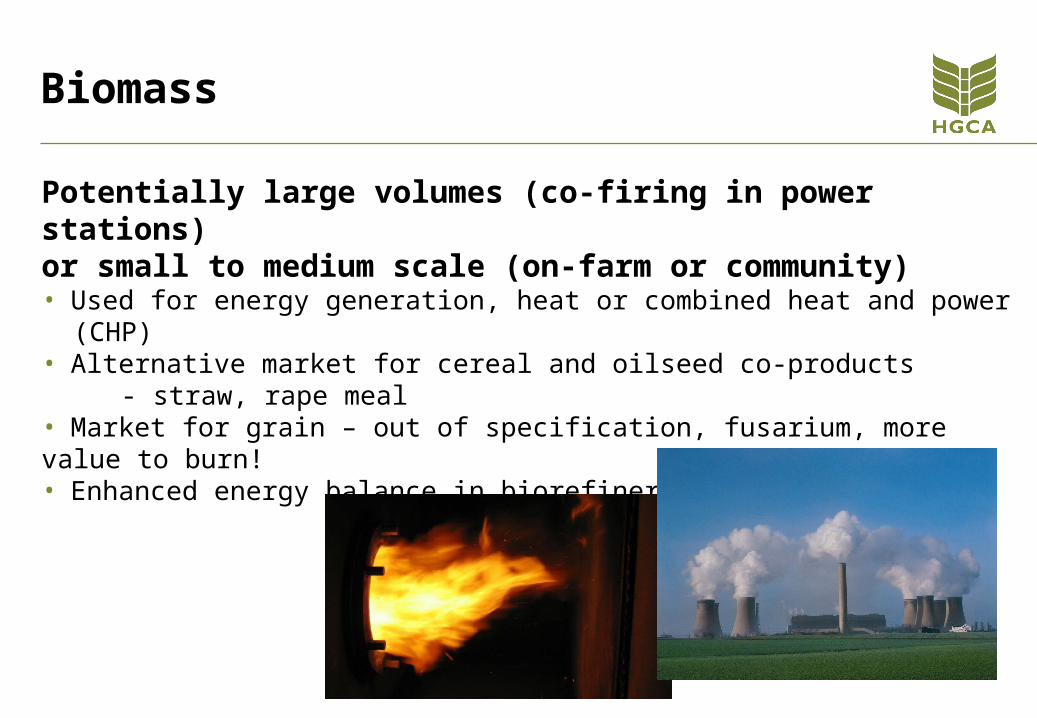
Biomass
Potentially large volumes (co-firing in power stations)or small to medium scale (on-farm or community)• Used for energy generation, heat or combined heat and power (CHP) • Alternative market for cereal and oilseed co-products
- straw, rape meal• Market for grain – out of specification, fusarium, more value to burn!• Enhanced energy balance in biorefinery
EU and World positions
EU• The 5.75% obligatory inclusion rate will require the equivalent of
24 MT of grain • Grain surplus 10-25 MT • 4M Ha in setaside plus land coming out of sugar production
World• Interest mainly with bioethanol• Brazil and US are leading producers in ethanol• US Energy Policy Act 2005
- Renewable Fuel Standard (Sec. 1501) 7.5 billion gallons by 2012
• Large biodiesel interest in EU only

World Fuel ethanol productionM
illi
on
lit
res
Brazil
US
Canada
EU
World
Source: FO Lichts
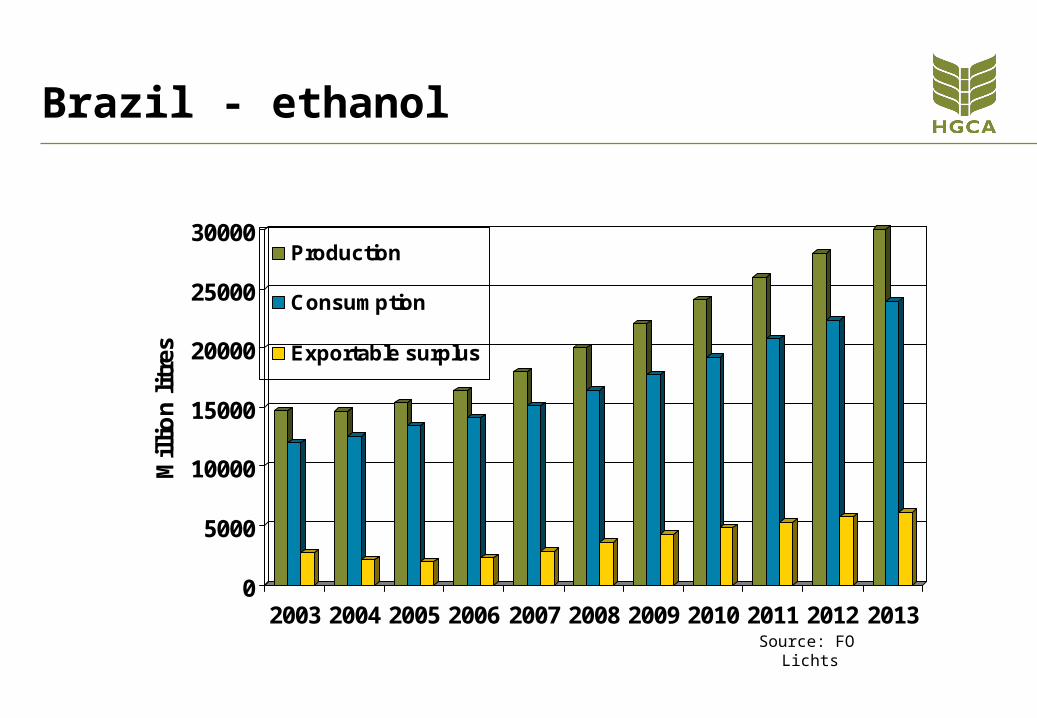
Brazil - ethanol
0
5000
10000
15000
20000
25000
30000
Mil
lio
n l
itre
s
2003 2004 2005 2006 2007 2008 2009 2010 2011 2012 2013
Production
Consumption
Exportable surplus
Source: FO Lichts
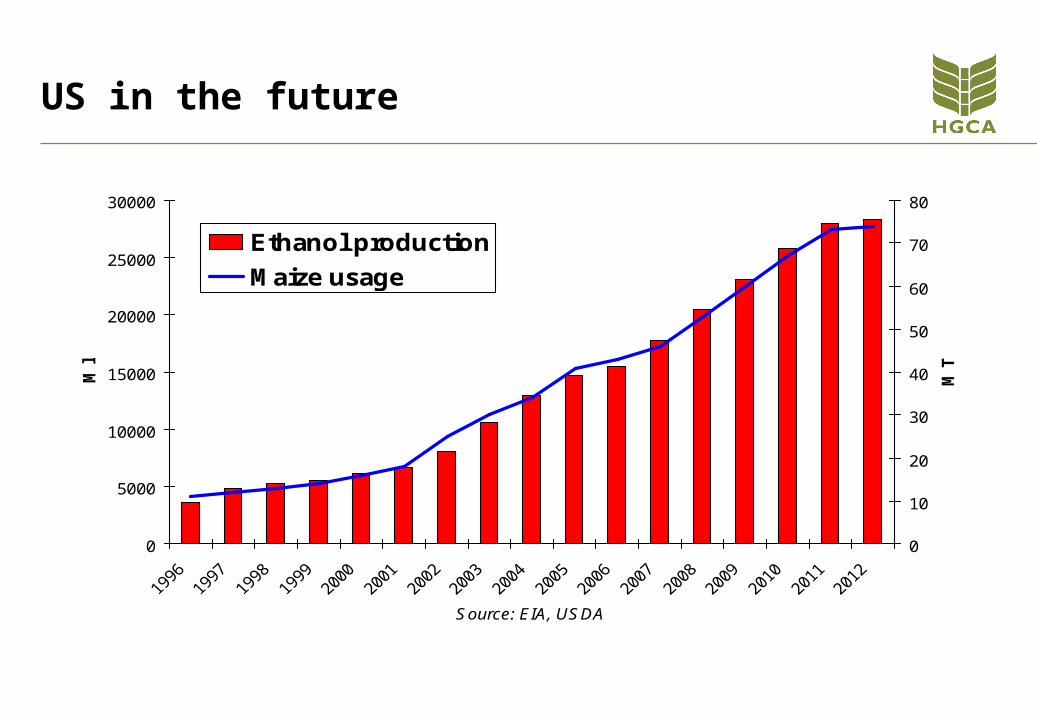
US in the future
0
5000
10000
15000
20000
25000
30000
Source: EIA, USDA
M l
0
10
20
30
40
50
60
70
80
M T
Ethanol production
Maize usage

Future Ethanol Consumption
Projected Fuel Ethanol Consumption. Source: IEA
0
20000
40000
60000
80000
100000
120000
140000
1975 1980 1985 1990 1995 2000 2005 2010 2015 2020
Year
Mill
ion
Lit
res
Brazil US & Canada EU World

EU biodiesel production
0
1000
2000
3000
4000
5000
6000
7000
2002 2003 2004 2005 2006
Source: EBB
Mt
Others
Czech Republic**
United Kingdom
Austria
Italy
France
Germany
The RTFO (UK)
Renewable Transport Fuels Obligation• Similar concept to Renewables Obligation in the power sector
• Requires 5% volume of all UK fuel sold on UK forecourts should originate from a renewable source by 2010, starting 2008
• 20 fold increase on current UK sales
• Budget announced immediate levels of Obligation volume
- 2.5 % at start (April 2008)- 3.75% 2009- 5% 2010

UK Biofuel Production capacity
0
500
1000
1500
2000
2500
'000 tonnes
2005
/06
2006
/07
2007
/08
2008
/09
2009
/10
2010
/11
Biodiesel
Bioethanol
Source: Industry and HGCA
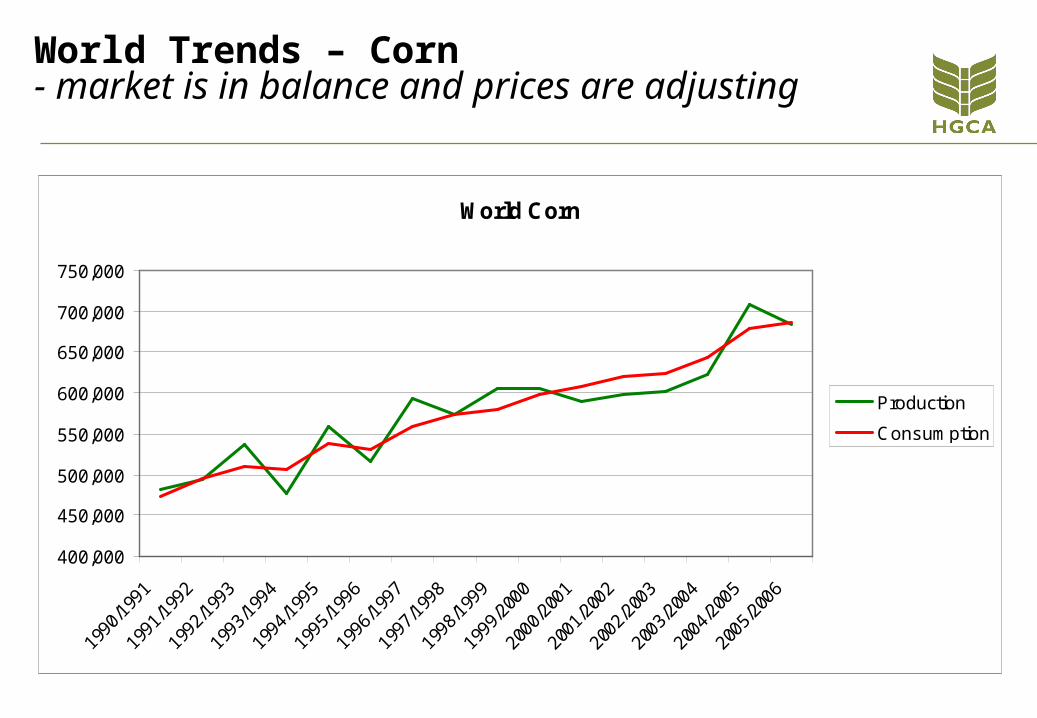
World Corn
400,000
450,000
500,000
550,000
600,000
650,000
700,000
750,000
Production
Consumption
World Trends – Corn- market is in balance and prices are adjusting
400,000
450,000
500,000
550,000
600,000
650,000
700,000
750,000
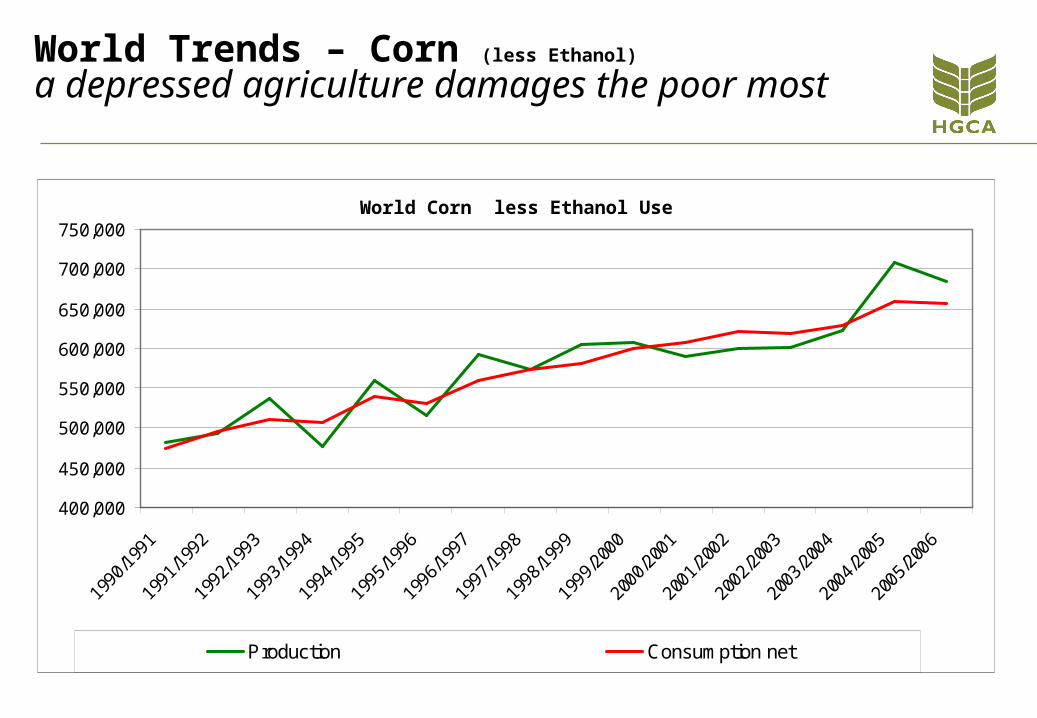
Production Consumption net
World Corn less Ethanol Use
World Trends – Corn (less Ethanol)
a depressed agriculture damages the poor most

Source: HGCA
Bio-fuel and petroleum price linked – new market dynamics to manage
050
100150200250300350400450
Apr-05
Jul-05
Oct-05
Jan-06
Apr-06
Jul-06
Oct-06
US
cen
ts p
er
gall
on CBOT ethanol NYMEX petroleum
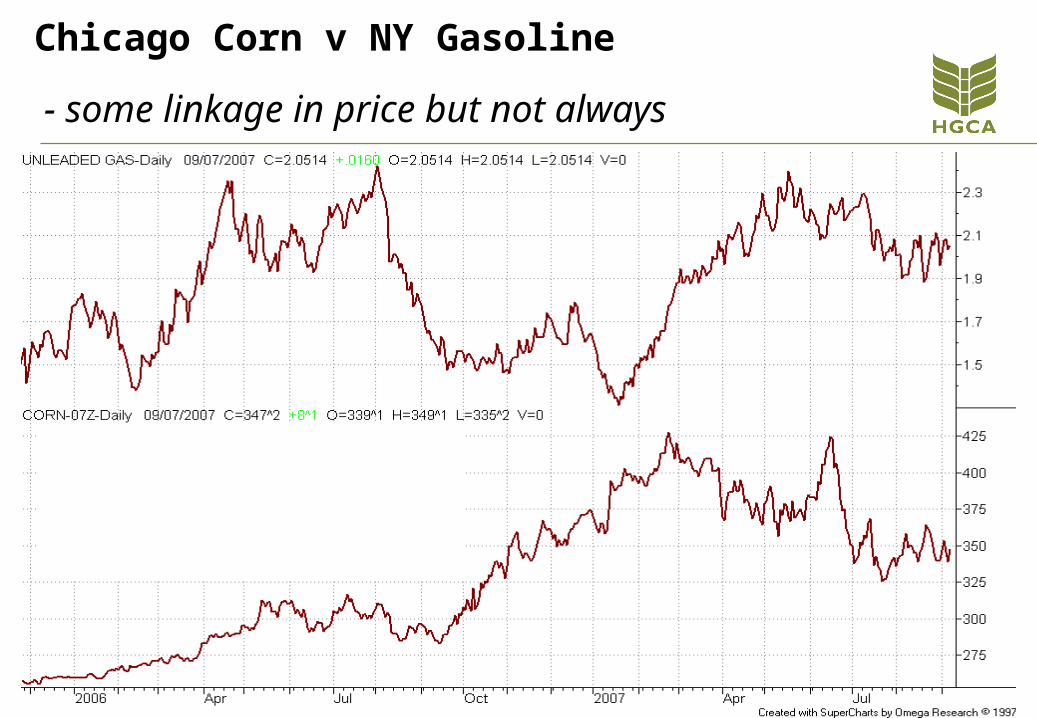
Chicago Corn v NY Gasoline
- some linkage in price but not always

Chicago Bean oil v NY Diesel - demand leakage gives price influence

-20
-10
0
10
20
30
40
50
60
70
80
Wo
rld
wh
ea
t e
nd
sto
cks M
to
nn
es
90
110
130
150
170
190
210
230
250
270
290
CB
OT
SR
W w
he
at fu
ture
s $
pe
r to
nn
e
Production response World wheat price at sowing
Source: USDA/HGCA/SAC
High forward prices - will lead to a global supply response

IranKey Exporters Key Importers
Key EU Importers New Exporters
Poor people can grow grain- export possibilities from new areas
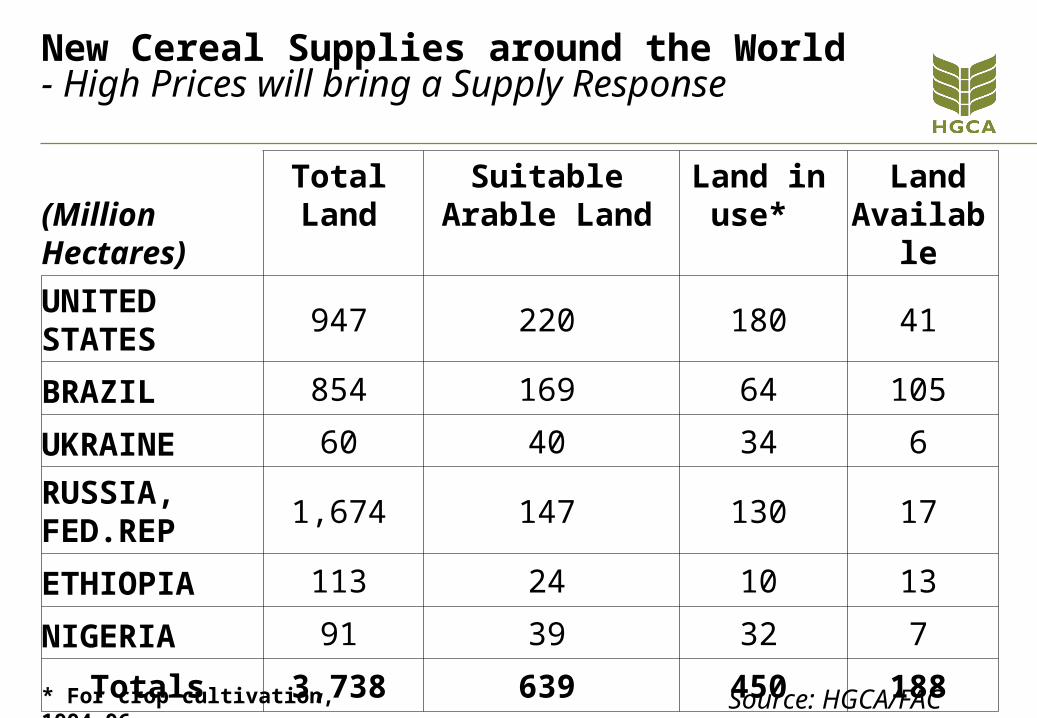
New Cereal Supplies around the World- High Prices will bring a Supply Response
(Million Hectares)
Total Land
Suitable Arable Land
Land in use*
Land Available
UNITED STATES
947 220 180 41
BRAZIL 854 169 64 105
UKRAINE 60 40 34 6
RUSSIA, FED.REP
1,674 147 130 17
ETHIOPIA 113 24 10 13
NIGERIA 91 39 32 7
Totals 3,738 639 450 188* For crop cultivation, 1994-96 Source: HGCA/FAC

So let’s answer the questions!• Are we going to starve?No we are going to increase the production of cereals and oilseeds to meet the new demands. This will involve cropping on land previously idle.
• Can Food and Fuel from agriculture co-exist?Of course they can, fuel crops and food crops will be balanced by the distribution of market prices so that supply & demand are balanced
• Will we damage the Environment?This is a more challenging question. As more land is drawn into production we have to beware of abuse to eco-systems and carbon efficiency
… let’s work together to improve our world
Thank you