Embed Size (px)
Citation preview

Research Study No. 2012/01
Impact of Emerging Marketing Channels in Agricultural Marketing – Benefits to Producer–
Seller and Marketing Costs and Margins of Agricultural Commodities in Haryana
Usha Tuteja Subhash Chandra
Agricultural Economics Research Centre University of Delhi
Delhi -110 007
July, 2012

i
Contents
Chapter No.
Title Page No.
Chapter-1
Introduction Traditional vis-à-vis Emerging Marketing Channels Objectives Literature Survey Research Methodology Analytical Framework Organization of the Study
1-13
Chapter-2
Status of Agricultural Marketing in India and Haryana Introduction APMC Act in India: Marketing of Agricultural Produce in Haryana
14 - 30
Chapter-3
Selected Districts, Fruit and Vegetable Crops and EMC (Reliance Fresh): A Background Introduction Section-1 Selected Districts Section-2 Reliance Fresh: A Background Section-3 Status of Fruit and Vegetable Crops in Haryana
31 - 64
Chapter-4
A Comparison of Economics, Price Spread and Marketing Efficiency of Selected Crops under Traditional vis-à-vis Emerging Marketing Channels Introduction Section-1 Socio-economic Characteristics of Sample Households Section-2 Economics of Selected Crops Section-3 Price Spread and Marketing Efficiency of Tomato and Muskmelon Section-4 Perceptions of Farmers on Marketing of Tomato and Muskmelon
65 - 104
Chapter-5
Summary and Conclusions Introduction Objectives Main Findings Policy Implications
105 – 114
Bibliography
115 – 117

1
Chapter-1
INTRODUCTION
Agriculture contributes around 15 per cent to Gross Domestic Product (GDP) of
India but its performance is vital for inclusive growth since it provides livelihood security
to more than 50 per cent of work force. Traditionally, India’s agriculture development
has been based on protected policy environment, which included controls on market,
pricing, trade, storage, transport, and quantitative restrictions on foreign trade. The
policy was primarily intended to attain long term food security and stabilize agricultural
prices. During 1970s, huge public investments were made on irrigation, research and
extension to augment food production by increasing cropped area and productivity. The
‘Green Revolution” technology initially introduced in resource endowed areas in late
1960s spread into other parts of the country during 1980s. The agricultural sector
observed spectacular growth of over 4 per cent per annum during 1980-81 to 1989-90.
However, this growth optimism did not last as growth of agricultural GDP declined to
less than 3 per cent per year during the 1990s. The poor growth recorded further
platued to 1.8 per cent per year during the Tenth Five Year Plan period (2002-2007). It
is estimated around 3 per cent per year during the Eleventh Five Year Plan period
(2007-2012). Several factors including slowdown in public investment, low yield growth,
declining water table, environmental problems and marketing constraints led to poor
performance. Higher and sustainable growth in agriculture is possible through reforms
in general and marketing reforms in particular.
During the 1950s, producers of agricultural commodities were exploited by
intermediaries. In order to eliminate exploitation of farmers from market functionaries
and traders and to provide remunerative prices for their produce, the Government of
India passed the Agricultural Produce Marketing Act, 1963. Since then, all rural markets
across the country are being governed by this Act. All the governments in States and
Union Territories were directed by the Centre to implement the APMC Act, 1963 in their
respective states to safeguard the interest of farmers. Consequently, all sale/purchase
activities have been channelized through regulated markets and licensed traders.

2
The economic reforms initiated in the early nineties and the WTO agreement in
1995 has changed the environment and priorities for the agricultural sector in the
country. Also, there has been an effort to liberalize agriculture trade and markets since
2002. Nonetheless, growth of agriculture has been a serious concern in the post reform
period.
Despite policy changes in liberalizing border measures related to agriculture
trade, the private entry and investment in this sector has been limited. The government
interventions in agricultural markets cover wide range of activities. However, a series of
domestic market reforms were introduced since 2000 to improve the efficiency of the
marketing system and to attract private investment. These included reform of
Agriculture Produce Marketing Regulation (APMR) Act, futures market, direct marketing,
private markets and contract farming. Since then, several domestic and multinational
firms have entered into marketing and processing of agricultural products.
India endeavors to revolutionize agriculture, especially horticulture in order to
provide nutritional security to the poor and vulnerable sections of the population.
Horticulture is gradually emerging as an important opportunity both for the farmers and
corporate sector. The corporate sector is primarily engaged in collection, retail and post
harvest value addition. Since, this sector includes a wide range of fruits, vegetables,
spices, medicinal and aromatic plants, it has huge potential for the future. The unique
feature of horticulture has attracted the attention of corporate sector which is developing
innovating models for its development.
As a result, corporate houses such as Reliance, Godrej, Birla, Bharti, ITC etc,
forayed into horticulture sector. These ventures are expected to make best efforts to
create infrastructure such as cold storage and cold chain, processing, retailing and
exports. These have also started collecting horticultural products like grapes, mangoes,
pomegranate mushrooms, baby corn, broccoli, cauliflower, cucurbits and leafy
vegetables. But most of these ventures are at a modest scale and hence, there is vast
scope to increase the business.

3
Special care is needed in development of horticultural sector due to inherent
constraints like perishability. The markets of horticultural products in the country lack a
systematic approach of supply management. Mostly growers realize a fraction of the
price paid by the consumer. A sizeable fraction of the price is cornered by the
functionaries/traders or lost in the long marketing chain. This is due to lack of availability
of infrastructure. Moreover, all stake holders beginning from growers to consumers are
not well integrated. The post harvest losses in case of horticultural crops range between
30-40 per cent. These are primarily due to inefficient handling, transportation and lack of
storage. Thus, efficient cold storage and cold chain are essential which is grossly
inadequate to meet the growing demand in future.
The objective with which the regulated markets were established in the 1950s
needs to be reviewed. The marketing system has to respond effectively to the changing
requirements in the domestic and international markets. The role of state should change
from controller of the market to regulator/facilitator for ensuring competition in the
marketing system. With gradual liberalization of the markets, it is expected that the
country would witness flurry of activities by the private traders. In general, output
markets are characterized by large number of sellers and small number of middle men
/traders. Their collusion affects the interest of farmers by lowering the price. Agricultural
input markets for seeds, pesticides and machinery are controlled by a few dominant
players. There should be an effective policy to ensure efficient functioning of agricultural
markets which would deliver efficient outcomes thus, protect the interests of both
producers and consumers.
1.1 Traditional vis-à-vis Emerging Marketing Channels
Manifold changes have been introduced in the marketing of agricultural produce
after the enactment of the APMC Act, 1963. The two important policy changes i.e.
introduction of economic reforms in early nineties and the WTO agreement in 1995
have changed incentive structure in the agricultural sector in India. The government

4
intervention in the marketing of agricultural produce, private entry, future markets, direct
marketing and investment emerged as the issues of serious concern.
The government of India intervenes in the agricultural markets to achieve twin
objectives of food security and price stability. It operates through measures such as
procurement and distribution, fixing MSP for important agricultural commodities, price
support, commercial purchases and input subsidies. This environment has helped the
producers but marketing efficiency in agriculture still remains low. As a result, producers
and consumers remained losing partners. Consumer pay higher prices for agricultural
commodities while producers receive lower prices leading to low profitability in
agriculture.
India’s traditional agricultural marketing system has experienced significant
changes during the past one decade. The emergence of private players is one of these
developments. They are expected to spend heavily on the back end infrastructure, from
farm to store shelves. This would help to minimize the wastage of farm produce which is
estimated to be as high as 30%. Although, India is the second largest producer of fresh
produce, about Rs. 1 trillion worth of production is lost in wastage and a significant per
cent of this is avoidable wastage. Also, a huge gap between retail and wholesale prices
means that removing intermediaries will reduce retail prices.
The corporate led fresh food retailing has been emerging fast in the urban areas.
They are helping in strengthening the retail supply chain. It is anticipated that farmers
supplying to corporate will not only get higher prices but quality of their produce will also
include.
Most of the retail chains in Delhi are sourcing 30-40% of their requirement from
farmers in states around Delhi. As a result, farmers are provided an alternative
marketing arrangement with these corporate. Sometimes, these farmers also learn
better agricultural practices from the experts appointed by these companies, thus
leading to a better quality of produce. It is expected that these Emerging Marketing

5
Channels (EMCs) will bring improved quality and better after sales services and will be
beneficial to the consumers as well as producers.
1.2 Objectives:
A beginning has been made in creating infrastructure by the government and
private sectors. The government has launched several programmes to encourage
cultivation of horticultural crops. The progress is however, slow and inadequate. There
is a great need to harness the potential of this sector with long term vision through joint
efforts of government, public and private sectors.
In view of immense potential of horticulture in India due to varied agro climatic
conditions, it is imperative to compare benefits to producers, marketing costs and
margins by selling horticulture produce through traditional and emerging marketing
channels. The research input on the related issues is an urgent need to draw in future
course for the development of this sector through innovative models. In order to achieve
this objective, this study seeks to analyse the related issues. The specific objectives of
the study are as under:
(i) to determine the share of the farmer in the consumer’s rupee in an emerging
marketing channel vis-a-vis traditional marketing channel;
(ii) to compute the degree of marketing efficiency and incidence of post harvest
losses in emerging marketing channel vis-à-vis traditional marketing channel;
(iii) to analyse the market practices and services of agencies involved in the
emerging marketing channel and observe if they are superior to that of
traditional channels;
(iv) to indicate the constraints faced by farmers and different market functionaries
in the emerging marketing channel as compared to the traditional marketing
channel.

6
The Reliance Fresh has been selected as a case study to analyse the emerging
marketing channel and compare it with traditional marketing channel for tomato and
muskmelon in Haryana.
1.3 Literature Survey:
Much of discussion in the literature in recent times has been around the
marketing reforms in agriculture. Numerous seminars, conferences, workshops and
studies pointed out pros and cons of organized food retail and direct purchase of
agricultural commodities from farmers in order to reduce gap between prices paid by the
consumers and prices received by the producers. Some studies have shown that
corporate involvement in farming through direct purchase is a source of advantage for
all stake holders. A recent study has revealed that growers received at least 20% higher
prices from organized retail in comparison to traditional channel. But, the production and
price risks were entirely born by the producers (Bathla & Singh, 2011). Another study
(Minten et al, 2010) has mentioned that price difference offered by modern retail chain
was not very different. Thus, in view of market imperfections, organized food retail may
not provide higher prices to farmers and lower prices to consumers. The major issues
concerning benefits of the TMC and EMC to all stake holders are related to increasing
efficiency in the supply chain of agricultural commodities. On the other hand, it is
contended that organized food retail may not provide higher prices to farmers and lower
prices to consumers. At the outset, we review a few macro level studies (Acharya, 1998,
2011; Dev, 2007; Hashim, 2009 and Deshpande and Gopalappa, 2003) and then
survey other related studies.
Acharya, (1998 and 2011), has evaluated the performance of the existing
marketing system, institutions and policy in accelerating agricultural development in the
country. The article and book contain an incisive analysis with special emphasis on
marketing functions, institutions, efficiency, costs and margins, government efforts in the
development of agricultural marketing and market research.

7
Dev (2007) has examined macro reforms needed for achieving higher and
sustainable growth in agriculture, including the “Second Green Revolution” through crop
diversification and development of processing. It discusses the market reforms needed
for achieving higher agricultural growth and food security. The paper also examines role
of other agricultural and non-farm policies. Basically, domestic market reforms involve
removing all controls relating to domestic trade and processing. However, recent
experience on hoarding of wheat and pulses indicate that some kind of regulation is
necessary on storage limits. On WTO and globalization, the government has to be
vigilant about the international price fluctuations. The government plans to have a
second ‘green revolution’ by diversifying agriculture in crop sector and allied activities.
There is a lot of demand for high value products like fruits, vegetables, milk and meat
products. Marketing of these products is the major problem apart from credit and
extension. Other issues for agriculture development are land and water management,
research and extension, input supply including credit and development of rural non-farm
sector.
The presidential address by Hashim (2009) states that efficiency of market,
possibility of its discovery and its expansion depends on hardcore physical
infrastructure. The most crucial of which are roads (transport links) and electricity.
Electricity supply to rural areas, excepting some regions, is inadequate. Cold storage do
not work. Transport links in rural India are weak and therefore, cost of transporting
perishables is prohibitive. Fortunately, communication system has improved.
Infrastructure, efficient information system and availability of credit can go a long way in
developing markets for agricultural produce without which the next phase of agricultural
development will remain stunted.
Deshpande and Gopalappa (2003) advised to establish an effective price
monitoring system including market information kiosks involving information on prices,
quality, international trade centres and technology. Statistical system and database
should be strengthened to improve the coverage and quality of agricultural marketing
related information and to reduce the time lag in its availability. Cooperatives and group
8
marketing by farmers should be encouraged. Market intervention system either by
private agencies or by the state agencies. PRIs, NGOs and Self-Help Groups be
effectively involved in improving awareness about post harvest handling methods and
creation and maintenance of infrastructure at primary market level. A selective MIS
needs to be put in place for commodities, which are not covered by the minimum price
support programme.
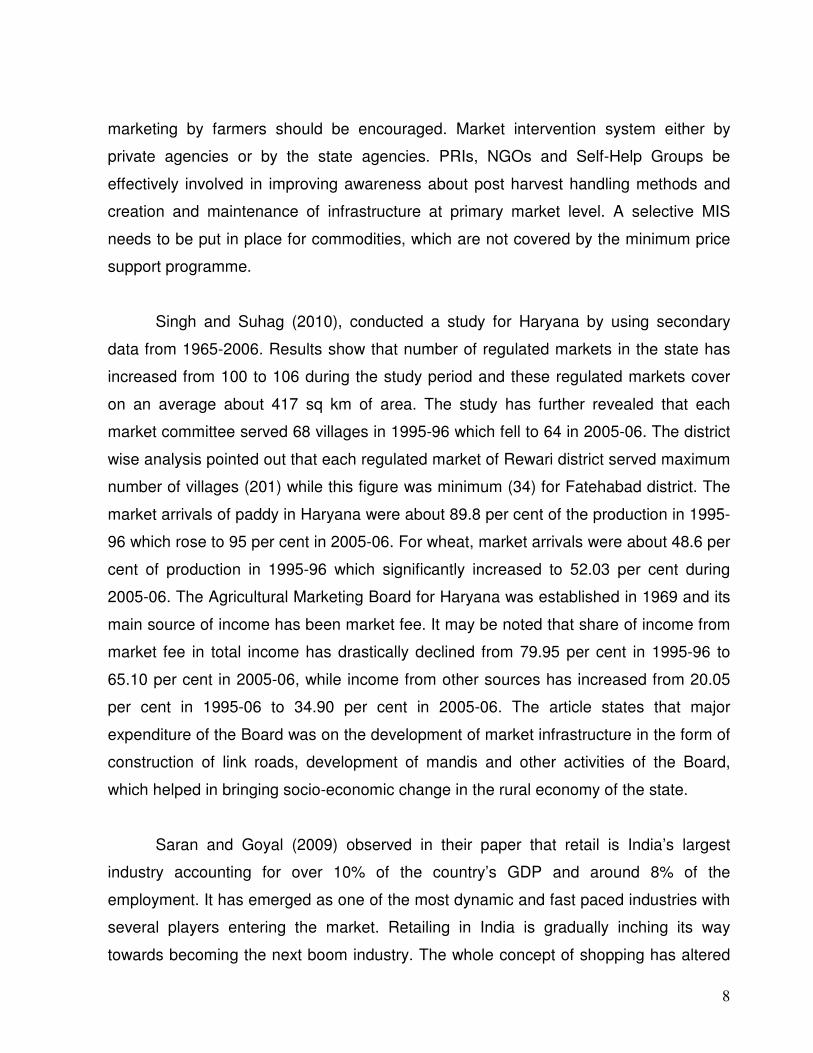
Singh and Suhag (2010), conducted a study for Haryana by using secondary
data from 1965-2006. Results show that number of regulated markets in the state has
increased from 100 to 106 during the study period and these regulated markets cover
on an average about 417 sq km of area. The study has further revealed that each
market committee served 68 villages in 1995-96 which fell to 64 in 2005-06. The district
wise analysis pointed out that each regulated market of Rewari district served maximum
number of villages (201) while this figure was minimum (34) for Fatehabad district. The
market arrivals of paddy in Haryana were about 89.8 per cent of the production in 1995-
96 which rose to 95 per cent in 2005-06. For wheat, market arrivals were about 48.6 per
cent of production in 1995-96 which significantly increased to 52.03 per cent during
2005-06. The Agricultural Marketing Board for Haryana was established in 1969 and its
main source of income has been market fee. It may be noted that share of income from
market fee in total income has drastically declined from 79.95 per cent in 1995-96 to
65.10 per cent in 2005-06, while income from other sources has increased from 20.05
per cent in 1995-06 to 34.90 per cent in 2005-06. The article states that major
expenditure of the Board was on the development of market infrastructure in the form of
construction of link roads, development of mandis and other activities of the Board,
which helped in bringing socio-economic change in the rural economy of the state.
Saran and Goyal (2009) observed in their paper that retail is India’s largest
industry accounting for over 10% of the country’s GDP and around 8% of the
employment. It has emerged as one of the most dynamic and fast paced industries with
several players entering the market. Retailing in India is gradually inching its way
towards becoming the next boom industry. The whole concept of shopping has altered

9
the format and consumer buying behavior, ushering in a revolution in shopping in India.
In a developing country like India, a major portion of consumer spending goes into basic
amenities, particularly food products. The food retailing sector is at an inflexion point
where growth of organized retail and consumption by the population is going to take a
higher growth trajectory. A large number of young working population, nuclear families
in urban areas, along with increasing working-women population and emerging
opportunities in the service sector are going to be the key growth drivers of the
organized food retail sector in India. Owing to the requirement of heavy initial
investment, break even is difficult to achieve and many of the players have not tasted
success so far due to erratic supply. However, future is promising. The market is
growing. Government policies are becoming more favourable and emerging
technologies are facilitating operations.
According to Singh (2011) linking small primary producers with markets is
indentified as one of the major issues in policy and practice in improving livelihoods for
millions of poor farming households in India like other developing countries. There are
several alternative marketing channels in India which are making attempt to link farmers
with markets. These channels existed in the pre-supermarket expansion period and still
co-exist with modern food retail chains. This paper also examines the inclusiveness and
effectiveness of the fruit and vegetable retail chains in linking farmers with the
consuming markets with the help of a case study of two non-private retail chains
(HOPCOMS and MDFVL’s SAFAL). It compares and contrasts organization and the
functioning of the two retail chains from a smallholders perspective. At the end, this
paper book highlights major issues emerging from the case studies and suggestions for
more effective and inclusive interface and role of the alternative food retail chains.
Arora (2010) in his paper on food retail suggests that the Indian food retail is
going to be the major driving force for the retail industry growing at the rate of 30%. The
changing life style, taste, higher disposable income, growing need for convenience,
higher aspirations among youth, exposure to the western lifestyle and increasing
number of working women have revolutionized the food retail scenario in the country.

10
More and more corporate houses such as HLL, ITC, Godrej and Reliance are now
making inroads into food retail, with some even exploring the integrated approach via
agribusiness and food processing. Huge proliferation is expected from the corporate
players, which will help entire retail pie to grow. Entrenched players such as Subhiksha,
Food Bazaar and Spencer’s Daily are also tapping into backward linkages, while trying
to match their expanding geographies with retail formats.
Singh and Toppo (2010) conducted a study based on forty sampled farmers in
Kanke Block of Ranchi district of Jharkhand during 2005-06. The average cost of
cultivation per hectare of kharif and rabi tomato was estimated as Rs.26011 and
Rs.23523, respectively. The average productivity per hectare was 100 quintals and 96
quintals in these seasons. This crop fetches Rs.16963 and Rs.20303 as net profit per
hectare in kharif and rabi seasons. The cost return ratio was 1:1.86 for tomato in the two
seasons. It was further observed that selected farmers were disposing tomatos through
three marketing channels. Marginal farmers preferred to sell their produce through
channels I, while small farmers sold their produce through all these channels. At the
overall level, 40 per cent of them sold their produce through channel-III, 35 per cent
through channel-I and 25 per cent through channel-II.
Dileep et al. (2002) conducted a study on contract farming of tomato cultivation.
The major findings of this article indicate that holding size of the sample contract
farmers was important. Farmers informed that processing firms favoured large farmers
while selecting for contract. The cost incurred, yield and gross returns obtained by the
contract farmers were almost double than that of non-contract farmers. Among various
categories of farmers, large contract farmers obtained higher net returns followed by
small and medium ones. The functional analysis revealed that there is a substantial
scope to increase production of tomato through making judicious use of critical inputs
particularly, fertilizer, irrigation and plant protection chemicals. The contract farming
system for tomato considerably reduced yield uncertainty and completely removed price
uncertainty among farmers, whereas it was very high in case of non-contract farmers.
The average price received by the non-contract farmers was much higher than contract

11
price for tomato. The price received through direct sale to the consumers was the
highest followed by retailers and wholesalers in the case of non-contract farmers.
Transportation charges formed major component of marketing cost, which was severely
felt by the farmers. Also, cut in weight, rejection of the produce, lower contract price,
lack of adequate number of processing units were found to be the major constraints in
the marketing of tomato.
In brief, all the reviewed studies appeared to be useful and informative. The
concerns raised are wide ranging, but none of the above studies has looked into details
of costs, price spread and marketing efficiency of traditional vis-à-vis emerging
marketing channels. The present study aims to fill this gap.
1.4 Research Methodology:
The methodology adopted for the selection of study area, sampling design, data
collection and analytical framework used in the light of specific objectives of the study is
discussed in this section. The study was conducted in the state of Haryana. It is based
on published and un-published sources of secondary and primary data. The relevant
information about the state and districts was obtained from various issues of the
Statistical Abstract of Haryana, Government of Haryana, Panchkula. The required
preliminary information regarding the agricultural marketing in Haryana was obtained
from the officials of the Haryana State Agricultural Marketing Board, Panchkula. The
districts and crops for the study were decided in consultation with them. Meetings with
the HSAMB officials and the APMC market officials were useful and informative.
The scope of the study is confined to two horticultural crops i.e. one fruit
(muskmelon) and one vegetable (tomato). Three districts namely, Gurgaon, Sonepat
and Kurukshetra with the presence of Traditional Marketing Channel (TMC) and
Emerging Marketing Channel (EMC) were selected for in-depth study. The Reliance
Fresh was selected as Emerging Market Channel. A questionnaire was canvassed to
the farmers selling their produce through these channels. An effort was made to cover

12
all farm size categories in the sample. These were divided into marginal (less than one
hectare) small (1-2 hectares), medium (2-4 hectares), and large (more than 4 hectares).
The primary data pertaining to the year 2010-11 were collected from 200 farmers (100
TMC + 100 EMC). In view of the main objective of the study, it is found necessary to
compare the price, cost and economics of the selected crops and benefits of Emerging
Marketing Channel to the farmers and consumers. The detailed sampling design of the
study is given below;
Crop Traditional Marketing Channel
(No. of Farmers)
Emerging Marketing
Channel
(No. of Farmers)
Tomato 50 50
Muskmelon 50 50
The sample size for other intermediaries is as follows:
Particulars Traditional Marketing Channel Emerging Marketing Channel
Intermediary 5 5
Retailer 5 5
Consumer 5 5
1.5 Analytical Framework
The study is analytical in nature and therefore, simple measures such as percentages,
shares and compound growth rates have been utilized to derive results. The methodology
followed for each aspect is different. For measuring the growth rates of area, production and
yield of fruit and vegetable crops at the all India and state level for available period, the semi-log
equation of the form log y = a + bt was used where -
y = area/production/yield of the crop
a = intercept
b = slope
t = time

13
The marketing efficiency is computed by using the formula given by Acharya,
2011. The formulation is as under:-
MME = FP ÷ (MC+ MM)
Where,
MME = Modified Measure of Marketing Efficiency
FP = Net Price Received by the Farmers
MC = Total Marketing Cost
MM =Total Net margins of Intermediaries
1.6 Organization of the Study:
At the outset, literature survey, objectives and research methodology of the study
are presented in Chapter-1. Next Chapter is devoted to the analysis of the status of
APMC Act in India and Haryana. Chapter-3 deals with background of the selected
districts, horticultural crops in Haryana and the Reliance Fresh. The issues related to
marketing of muskmelon and tomato are discussed in Chapter-4. The findings of the
study and policy implications are presented in the final chapter.

14
Chapter-2
Status of Agricultural Marketing in India and Haryana
Introduction
During the 1960s and 1970’s, India’s agricultural policy was framed with the
objective of attaining food security and price stability. These policies were based on
controls on marketing, pricing, storage, transport, and quantitative restrictions on trade.
Public investment in the agriculture sector, spurred by “The Green Revolution” of the
1960s, and agriculture grew by over 4 percent per annum in the 1980s. This rate,
however, was not sustainable. A slowdown in public investment, low yield growth, and
environmental problems including declining water table led to poorer agricultural
performance in the 1990s. During this period, domestic economic reforms and the WTO
Agreement on agriculture constituted two important policy changes. The impact of the
economic reforms was indirect by raising per capita income which led to change in food
consumption pattern. The WTO Agreement brought about some tariff reforms through
liberalizing agricultural trade, by removal of quantitative restrictions on imports. India’s
focus on liberalizing agricultural trade is partially set out in the Tenth Five Year Plan
(2002-07). The strategies to raise agricultural output included increasing crop intensity
adoption of modern technology to increase productivity and diversification of cropping
pattern.
India has an Agricultural Produce Market Regulation Act (APMRA) in which every
regulated market has a market committee where farmers, traders, commission agents,
local bodies and the state government are represented. Prices are fixed through an
open auction in a transparent manner in front of an official of the auction committee.
The main criticism of regulated markets is that they do not reduce the long chain of
intermediaries between the farmer and the consumer, which adds to the cost of
agricultural commodities to consumers on the one hand, and decreases returns for
farmer on the other.

15
2.1 APMC Act in India:
Agricultural Marketing is covered under State List in Article 245 of Constitution of
India. The State Agriculture Produce Marketing (Regulation and Development) Act
promoted by respective state government regulates the agriculture marketing within the
state, divides the entire state into various notified areas and delegates the responsibility
for regulating agricultural markets in respective areas to specific APMCs. The biggest
hindrance in providing a modern and suitable marketing system had been limiting
provisions in the State Agriculture Produce Marketing (Regulation and Development)
Act. A state APMC Act divides the entire state into various notified areas to the specific
APMCs. Essentially, the state APMC Act treats agricultural marketing to be a localized
subject confined to a specific notified area and, therefore, it endeavors to create a
mechanism to regulate sale of agricultural produce grown in that area by the farmers to
the traders located within such notified area. In fact, it goes to the extent of prohibiting
the end-users and processors located elsewhere from buying from the farmers directly
in the absence of license from respective Agricultural Produce Market Committee
(APMC).
Over the last sixty years, growth in the agriculture sector in India had been
phenomenal but Agricultural Marketing sector could not keep pace with the changing
pattern of production, distribution, processing and retail marketing. Due to evolution of a
fragmented Agricultural Marketing System in the country under the Regulatory
Framework of the State APMC Acts, a robust common national market for agricultural
commodities could not take shape so far and a strong need is being felt to facilitate
such development through a Central intervention. The need of development of an
integrated National Market for agricultural commodities has been emphasized on
several occasions. This is presently being tried to be achieved in a limited manner by
making the amendments in State APMC laws on the basis of the Model Act and Model
Rules circulated by the Central Government, but some states are hesitant to amend
their Marketing Regulations.
16
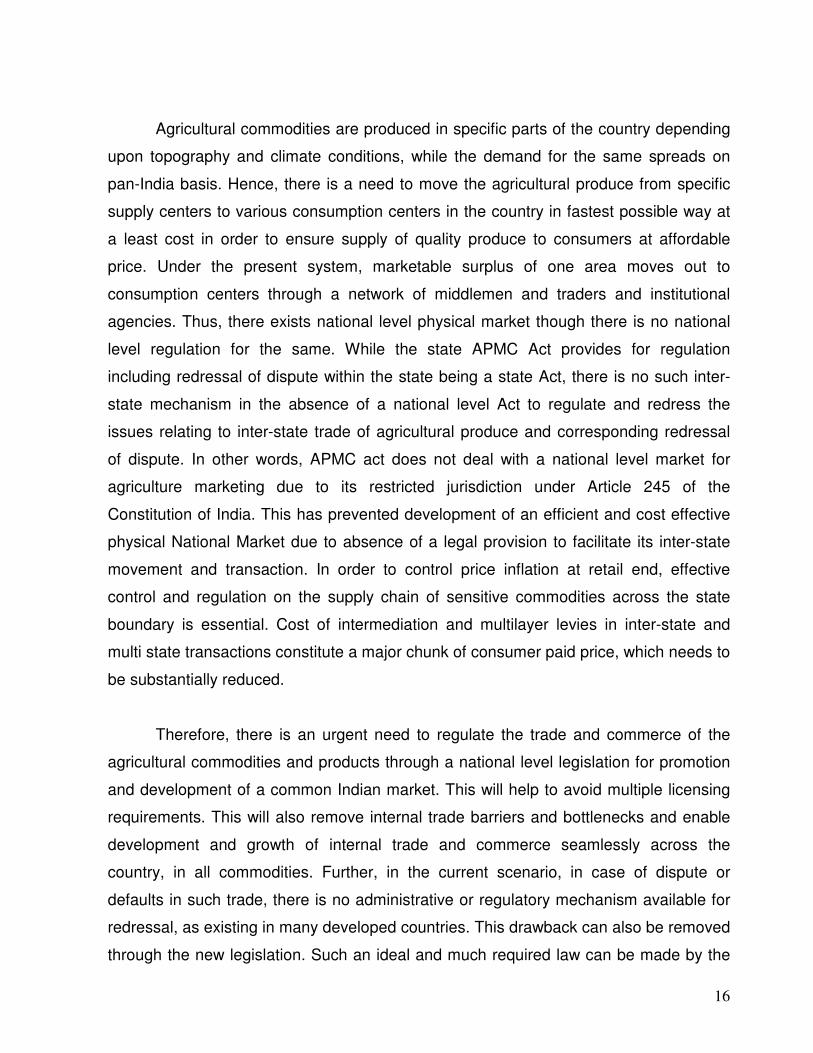
Agricultural commodities are produced in specific parts of the country depending
upon topography and climate conditions, while the demand for the same spreads on
pan-India basis. Hence, there is a need to move the agricultural produce from specific
supply centers to various consumption centers in the country in fastest possible way at
a least cost in order to ensure supply of quality produce to consumers at affordable
price. Under the present system, marketable surplus of one area moves out to
consumption centers through a network of middlemen and traders and institutional
agencies. Thus, there exists national level physical market though there is no national
level regulation for the same. While the state APMC Act provides for regulation
including redressal of dispute within the state being a state Act, there is no such inter-
state mechanism in the absence of a national level Act to regulate and redress the
issues relating to inter-state trade of agricultural produce and corresponding redressal
of dispute. In other words, APMC act does not deal with a national level market for
agriculture marketing due to its restricted jurisdiction under Article 245 of the
Constitution of India. This has prevented development of an efficient and cost effective
physical National Market due to absence of a legal provision to facilitate its inter-state
movement and transaction. In order to control price inflation at retail end, effective
control and regulation on the supply chain of sensitive commodities across the state
boundary is essential. Cost of intermediation and multilayer levies in inter-state and
multi state transactions constitute a major chunk of consumer paid price, which needs to
be substantially reduced.
Therefore, there is an urgent need to regulate the trade and commerce of the
agricultural commodities and products through a national level legislation for promotion
and development of a common Indian market. This will help to avoid multiple licensing
requirements. This will also remove internal trade barriers and bottlenecks and enable
development and growth of internal trade and commerce seamlessly across the
country, in all commodities. Further, in the current scenario, in case of dispute or
defaults in such trade, there is no administrative or regulatory mechanism available for
redressal, as existing in many developed countries. This drawback can also be removed
through the new legislation. Such an ideal and much required law can be made by the

17
Government of India, only if agricultural marketing is made a central subject or a subject
under the concurrent list. However, in the present circumstances, the subject of ‘market’
being a state subject under the Constitution, a limited purpose Central Legislation is
possible to be achieved without causing any conflict with the provisions of existing state
APMR Acts or other state laws.
Notification of rules is important for operationalising the provisions of the Act. In
order to guide the States/U.T.s for framing of APMC Rules, Ministry of Agriculture
framed the Model APMC Rules, 2007 and circulated to all States/U.T.s. Model APMC
Rules embody provisions, regarding contract farming, regulation of trading, levy of
market fees and its collection, establishment and functioning of private market
yard/private market/private e-market, consumer/farmer market and direct market, etc.
Under contract farming, provisions for its registration, model agreement, recording the
agreement and dispute settlement and appeal mechanisms are also provided.
So far, six states (Andhra Pradesh, Rajasthan, Maharashtra, Orissa, Himachal
Pradesh and Karnataka) have framed the APMC Rules for implementing the provisions
of their respective state APMC Act. Three states, viz Madhya Pradesh, Haryana and
Mizoram have partially framed the rules. Haryana has notified the Rules for contract
farming only while Mizoram has notified the rule of single point levy of market fee.
Madhya Pradesh has framed the rules for direct marketing/special license for more than
one market and contract farming only. Unless the corresponding APMC. Rules are
framed and notified, various provisions of the APMC Act cannot be operationalised in
the state and the market reforms may remain unrealized. Some of the states have
imposed restrictions which are not provided in Model APMC Rules such as states of
Andhra Pradesh, Maharashtra and Karnataka prescribing minimum investment
requirement for setting up of private markets and states of Gujarat, Orissa and
Karnataka providing for minimum distance criteria for private markets from existing
APMCs. In Gujarat, minimum distance requirement is 5 kms while in Orissa, it is 1 km.
In Karnataka, such restriction is for Bengaluru only for foodgrains, pulses, spices, etc,
and private markets handling these commodities would not be established within the

18
radius of 25 kms from the existing market. The other restrictions are compulsory
registration of contract farming, short validity of licenses for private mandies (H.P.). The
states of Assam, Gujarat, Madhya Pradesh, Haryana and Uttrakhand have not notified
the APMC rules. Those states have already notified the APMC rules for review and
make the provision in conformity with the Model Rules. Hence, it is urgent to align the
APMC Rules keeping in mind the Model Rules.
To sum up, in order to provide competitive choices of marketing to farmers and to
encourage private investment for the development of market infrastructure and
alternative marketing channels, a Model Act on agricultural marketing was formulated
and circulated to the states/UTs by the Ministry of Agriculture in 2003 to guide them on
the removal of barriers and monopoly in the functioning of agricultural markets.
Seventeen states have already amended the APMC Act as per provisions of the Model
Act. Seven states have also notified APMC Rules under their Act. Details regarding
present status are indicated in Table 2.2.
Contract Farming:
States need to make the provisions under contract farming as suggested under
the Model Act. Furthermore, it should be ensured that disputes may be settled within 15
days and the decretal amount of appeal should not be more than 10 per cent of the
amount of goods purchased under contract farming. Appeal should be disposed off
within 15 days instead of 30 days. APMC should not be the authority for
registration/dispute settlement under contract farming. The district level authority may
be set up for registration of contract farming and no market fee should be levied under
it.

19
Table 2.1
Progress of Reforms in Agricultural Markets (APMC Act) as on 31.10.2011
Sl. No.
Stage of Reforms Name of State/Union Territory
1 States/UTs where APMC Act reforms have been done for Direct Marketing; Contract Farming and Markets in Private/ Cooperative Sectors.
Andhra Pradesh, Arunachal Pradesh, Assam, Goa, Gujarat, Himachal Pradesh, Jharkhand, Karnataka, Maharashtra, Mizoram, Nagaland , Orissa, Rajasthan, Sikkim, Uttrakhand and Tripura
2 States/UTs where APMC Act reforms have been done partially
a) Direct Marketing: NCT of Delhi, Madhya Pradesh and Chhattisgarh b) Contract Farming: Chhattisgarh, Madhya Pradesh, Haryana, Punjab and Chandigarh
3 States/UTs where there is no APMC Act and hence not requiring reforms
Bihar*, Kerala, Manipur, Andaman & Nicobar Islands, Dadra & Nagar Haveli, Daman & Diu, and Lakshadweep
4 States/UTs where APMC Act already provides for the reforms
Tamil Nadu
5 States/UTs where administrative action is initiated for the reforms
Meghalaya, Haryana, J&K, West Bengal, Puducherry, NCT of Delhi and Uttar Pradesh.
Note: * APMC Act is repealed w.e.f. 1.9.2006. Source: Ministry of Agriculture, Government of India, New Delhi
Regulation of Trading:
Model Act suggested that states need to provide the provision of registration in
place of licensing for market functionaries and unified single registration should be
issued by the Director or independent authority designated there of market functionaries
desirous to trade in more than one market area. Producer-seller should not be forced to
sell their produce through commission agent and producer-seller willing to sell their
produce directly to the buyer should be facilitated by the market committee in terms of
infrastructure and service both.
Transparent Auction System:
Transparent Auction System through an electronic platform and immediate cash
settlement with seller needs to be provided in all the mandies. Also, states are required

20
to make provisions for single point levy of market fee as suggested in Model Act. A
commodity once having been subjected to market fee in the first transaction anywhere
in the state or in other state should not be subjected to payment of market fee in
subsequent transactions. However, user charges may be levied in such cases.
Check Posts/Gates set up to recover market fee under APMC regulations in states
such as Gujarat and Orissa must be done away the immediate effect as they serve
impediments in smooth supply and distribution of agricultural produce across the state
and country.
2.2 Marketing of Agricultural Produce in Haryana
Now we analyse marketing of agricultural produce in Haryana.
The Royal Commission on Agriculture (1928) pointed out that there was no
common yardstick to measure the quality of produce, the weights and measures were
un-standardized and the private market operators exploited the farmers. It
recommended enactment of market legislation to curb rampant malpractices and realize
better returns. In that context, the Haryana state being a part of undivided Punjab
enacted the Punjab Agriculture Produce Markets Act, 1939. This act was further
amended in 1961 and operational in the state as per Manual of Haryana State
Agricultural Produce Marketing Law published by Haryana State Agricultural Marketing
Board, Panchkula. According to model APMC rules, 2007 circulated by the Ministry of
Agriculture, Government of India, Haryana has notified the rules for contract farming
only under the state APMC Act. Under this act, all the markets of the state have been
regulated. The transactions in these markets are conducted under set rules on
regulations. A large number of market committees were set up by the state government
to supervise the functioning of agricultural produce markets. The Haryana State
Agricultural Marketing Board was established in 1969 under this market Act to guide,
supervise and control the market committees of the state for better and efficient
marketing of agricultural produce.

21
Table-2.2
STATUS OF REGULATED MARKETS IN HARYANA (2009-10)
District Number of
Regulated
markets
Number of Sub-
yards
Average number of
villages served per
regulated market
Average area served
per regulated market
(Sq.Kms.)
Ambala 7 9 69 225
Panchkula 3 3 75 299
Yamunanagar 7 10 88 253
Kurukshetra 7 13 58 219
Kaithal 7 16 39 331
Karnal 10 8 42 254
Panipat 5 4 36 254
Sonepat 3 9 107 707
Rohtak 3 4 49 582
Jhajjar 2 3 126 917
Faridabad 2 3 69 358
Palwal 4 1 N.A. N.A.
Gurgaon 4 4 88 346
Mewat 4 3 N.A. N.A.
Rewari 2 6 200 791
Mahendragarh 4 8 92 465
Bhiwani 7 9 63 683
Jind 6 10 51 450
Hissar 6 22 45 664
Fatehabad 7 15 35 360
Sirsa 6 18 54 713
Total 106 178 64 417
Source: Statistical Abstract of Haryana, 2009-10
It is evident from Table 2.2 that Haryana has unevenly spread net work of
regulated markets across the districts. The highest number of regulated markets was
observed in Karnal district while Jhajjar, Faridabad and Rewari districts have shown as
low as two markets each. In the table, information is also presented on average number
of villages served per regulated market. In Rewari, each regulated market covered 200
villages that is too high. It implies that most of the farmers have to carry their agricultural
produce for sale to far off to the regulated market which increased cost of transport,
wastage of energy and time.

22
The Haryana State Agricultural Marketing Board (HSAMB) has been facilitating
and addressing the marketing problems of farmers in Haryana.
Objectives
• Add and get better value for the farmer’s produce.
• Set up efficient marketing services.
• Integrate diversification of crops and promote judicious and profitable use of land
resources.
• Introduce knowledge and technology based interventions.
• Improve skill sets and awareness of the farmers.
• Develop quality control and standards in agriculture sector.
The primary objective of the Board was to set up a modern integrated marketing
infrastructure, improve accessibility to the markets and to provide the farmers with
opportunities to achieve better value for their produce. Now adopting a philosophy of
“Samridh Kissan, Hamari Pehchan”, this organization endeavours to assist farmers,
thus helping them to reap a rich future by achieving better value. Hence, Haryana State
Agriculture Marketing Board with 3000 employees, headed by a chairman and a Chief
administrator as CEO, strives for one solitary aim to support, promote and enhance the
agriculture production and marketing keeping interest of the farmers in mind.
The vision of the HSAMB is to bring ample number of opportunities and set up
efficient and knowledge based marketing systems and services to increase the net
income in the agriculture segment. In turn, creating a prosperous and progressive
farmer.
The Chain Reaction (Marketing Network)
In 1969, there were only 58 Market Committees and 60 Sub-yards in the State. The
farmers had to travel long distances to sell their produce. Today, HSAMB has come a
long way, after dedicating 37 years to the welfare of the farmers. There are

23
• 106 Market Committees
• 178 sub-yards
• 181 Purchase Centres
To further facilitate marketing there are provisions for the following:
• 30 Subzi Mandies,
• 25 fodder Markets
• 33 Cotton Mandies
have been established in the state. As a result, today farmers don’t have to travel
more than 8 kms on the average to sell their produce.
In the mandis, the Board provides facilities like
• Shops for traders, dealers, etc.
• Individual platforms for commission agents
• Covered sheds
• Kiosks
• Kissan Rest Houses
• Drinking Water
• Tower Lights
• Washrooms
• Sewerage/drainage, etc.
Connectivity:
HSAMB has also systematically strengthened its construction wing and has been
pioneer in construction of link roads and approach roads of the state. Initially, 65% of
the market fee was deposited with PWD for this purpose. Since 1989, the
construction wing of the Board has taken up the construction of the roads. The
Board has constructed 9333 kms of roads as on 31.3.2007, with sole objective of
providing better connectivity to the mandis. As a result, every village is connected by
more than two roads.

24
Storage Capacity:
The Board has established Covered Shed Storage Capacity of 7,97,300 MT. The
food storage capacity of Godowns is 4,26,850 MT. In addition, 22 covered sheds are
under construction with additional storage capacity of 12850 MT.
Incentives & Welfare Schemes:
Financial Assistance to the Victims of Agricultural Operations:
This scheme commenced in July, 1990 provides special assistance to the
accident stricken victims of an agricultural operation. Under this scheme, an amount
of Rs. 50,000/- is given to the grief stricken family of the victim and upto Rs. 30,000/-
is given to the victim. The Board has already disbursed a sum of Rs. 27.39 crore
granted to 15572 victims upto 31st March 2007.
Krishak Uphar Yojna:
Krishak Uphar Yojna seeks to encourage farmers to bring their produce to the
mandi. Under the modified Krishak Uphar Yojna, 4244 farmers will get a cash prize
of Rs. 5000/- each annually, against 836 prizes earlier. Under new scheme, it is
ensured that farmers of each Market Committee get a chance to win one special
prize of Rs. 20,000/- and many others. HSAMB spends about Rs. 2.5 crore on this
scheme annually.
Works Undertaken with Central Assistance:
Development/renovation of Cotton Markets under TMC
Fifteen Cotton Markets have been completed/renovated with the assistance of
Technology Mission on Cotton, Ministry of Textiles, Government of India with a cost
of Rs. 21.91 crore. TMC has given an assistance of Rs. 11.05 crore.
25
Computerization:
With the assistance of the Directorate of Marketing & Inspection Department,
Ministry of Agriculture, Government of India, computers in 106 Market Committees
and 25 sub yards have been provided. Necessary basic training/software training
has already been imparted to about 1000 officers and field staff. Information on daily
arrivals is being sent by all Market Committees to AGMARK NET.
New Initiatives and Schemes:
Modernization and Remodeling of Existing Markets:
In phase one, markets are being modernized and remodeled with a budget of
500 million rupees. Pack Houses, cooling & ripening chambers, sorting/grading
lines, etc. are being provided besides promoting agri-business activities through
Agri-Business & Information Centres (ABICs).
Setting up of Agri-Business & Information Centres:
Two ABICs have been opened at Sirsa and Hisar. These provide information on
market, agronomic practices and organize seminars, workshops, buyer-seller meets,
etc. These centres also house the Agriculture Development Officers and provide
regular training to farmers and help in improving the quality of the agricultural
products. It is planned to have ABICs at all District Headquarters in the next three
years.
Contract Farming:
Necessary amendments have been made in the Punjab agricultural Produce
Markets Act to introduce contract farming.
Setting up of Modern Fruits & Vegetables Markets:
New Modern Fruit and Vegetable Markets will provide separate retail and wholesale
sections with better facilities for the convenience of consumers, market information,
storage facilities and cooling chambers.

26
Farmer’s Marketing Assistance Scheme:
Scheme has been formulated recently to adopt practices for value addition. Under
this scheme, assistance for grading/sorting and packing material and transportation
is provided.
Setting up of Farmers’ Markets:
In order to provide opportunity to the farmers for selling their produce directly to the
consumers and realize better prices, a network of farmer’s markets is being set up.
Special Commodity Hubs:
With the help of NHM, Special Commodity Hubs of potato, tomato, kinnow are being
developed where all facilities of grading, sorting, packaging, etc. will be provided.
Export Promotion:
The board has launched export promotion policy which seeks to provide technical
and financial assistance to the farmers for upgrading the quality of produce and take
up value addition activities. It promotes formation of grower’s groups/ societies for
this purposes. An Export Promotion council is also proposed to be created.
Setting-up of Lab Facilities:
In order to increase competitiveness of the grower’s produce, a network of labs for
quality testing and certification is being created in PPP mode.
Strengthening training for the Farmers:
Training of the growers in post harvest management and marketing has been taken
up in a big way this year. First batch of master trainers is already out. The Board
seeks to train 2000 farmers every year.

27
Proposed Mega Projects:
World Class Terminal Market:
HAS proposed to set up a world class terminal market of fruits and vegetables at Rai
30 km. from Delhi. This market will cater to not only Delhi but to whole of Northern
India.
Flower Market of International Standards:
It is also proposed that flower market catering whole of North India and Delhi is to be
set up near Delhi. It will also have export facility centre.
Joint approach and Steps taken for Marketing, Export of Fruits, Flowers and
Vegetables:
In addition, state of Haryana has taken up a number of steps for marketing,
export of fruits, flowers and vegetables. During the year 2010-11, production of
fruits, flowers, vegetables, spices, mushroom and medicinal plants was 374675,
61320, 4372730, 70540,7720,588 MT respectively.
Fresh fruits, flowers and vegetables are highly perishable and for interstate
domestic marketing and export, we farmers quality produce and use of Post Harvest
Management infrastructure for bulk storage. In this direction, state government has
taken initiatives as under:
A. Effort for quality production and productivity enhancement:
1. Establishment of Centre of Excellence for Vegetables:
Due to shrinking cultivable area, vertical farming and productivity enhancement is
to be taken up on a large scale. In this direction, department has taken an
initiative and has established a Centre of Excellence for Vegetable (CEV) Crops
at Gharounda, Karnal in the year 2010-11 under Indo-Israel Project Centre of

28
Excellence for Vegetables at a cost of 6 crore. It demonstrates quality vegetable
seedling production and quality produce of cherry, tomato, capsicum of different
colours and cucumber in poly houses and shed net. In addition, open cultivation
of vegetables is also going on under drip and Micro Sprinklers to demonstrate the
optimum use of water and enhancement of productivity and quality.
2. Establishment of Centre of Excellence for Fruits:
The Centre of excellence for fruits has been established at Managiana (Sirsa).
The total cost would be Rs. 9.70 crore. At the centre, different cultivars of citrus,
mango, guava have been demonstrated. In addition, olive plantation has also
been done.
3. Establishment of Front Line Demonstration Centre (FLDC)
On the pattern of CEV, Gharaunda, 12 front line demonstration centres under
NHM at the cost of Rs. 300 lac are going to be established at district Head
Quarters in the State to disseminate the latest technology to the farmers. In these
centers, quality vegetable seedlings, cherry, tomato, capsicum and cucumber will
also be produced. In addition, different vegetables under drip and Micro
Sprinklers will be grown.
4. Establishment of Vegetable Seedling Production Unit
2 vegetable seedling production units at the cost of Rs. 208 lac will be
established to provide quality vegetable seedlings of different vegetables to the
farmers in the state to enhance productivity and quality.
5. Intervention of New Technology:
Different schemes have been launched in the state for increasing productivity
and quality. The interventions are: use of Micro Irrigation system, use of soluble
fertilizer, Integrated Nutrietent Management (INM) and Integrated Pest
Management (IPM), use of hybrid vegetable seeds, horticulture mechanization,
use of packing material, etc.

29
B. Effort for PHM Infrastructure:
1. Pack House:
During the first phase, 11 pack houses have been established for packing fruits,
flowers and vegetables, which are nearing completion. In second phase,
establishment of 18 pack houses is planned.
2. Modernization of 11 fruit & vegetable wholesale markets with
CC plate forms, garbage disposal system and refrigerated vans.
3. Terminal Market Complex at Ganaur is under progress at the cost of Rs. 1230
crore. This will be a point for storage and marketing, export of fruits, flowers and
vegetables. This is the largest terminal market complex in the Asia.
4. Establishment of National Institute of Food Technology Entrepreneurship &
Management (NIFTEM) under the Ministry of Food Processing and Industries,
Government of India, New Delhi.
The vision of NIFTEM is to be an International Center of Excellence, which
integrates all aspects of food Technology, Entrepreneurship, Research and
Management and be recognized as the focal point for catalyzing the growth of
the food processing industry in India with respect to global scenario.
NIFTEN would play a pivotal role in developing food standards, quality,
accreditation and certification; keeping a repository of international and national
standards and also advising the Government on the matters related to
International Food standards. This Centre will be established in 100 acre area in
Sonepat district in Haryana.
In addition, some organizations like Mother Dairy are engaged in assisting the
farmers in producing good quality fruit and vegetables. The state government has

30
already amended the APMC Act to make provision for contract farming to encourage
diversification of crops.
At the end, Government of Haryana is making substantial efforts to improve the
scenario related to marketing aspects of agriculture produce. But, immediate efforts to
further reform the Act is the need of hour.

31
Chapter-3
Selected Districts, Fruit and Vegetable Crops and EMC
(Reliance Fresh):
A Background
Introduction:
After presenting research methodology adopted for the selection of study area,
sampling design, data collection and analytical framework used in the light of specific
objectives of the study in Chapter-1, we provide a brief background of the selected
districts, the Reliance Fresh and status of fruit and vegetable crops in the state of
Haryana in this chapter which is divided into three sections. One section is devoted to
each aspect.
Section-1
Selected districts
SONEPAT
Sonepat comprises three sub-divisions namely, Ganaur, Sonepat and Gohana
and covers seven blocks. It was carved out of Rohtak and was made a full-fledged
district in 1972. Sonepat is the largest tehsil in the district followed by Gohana.
Sonepat with an area of 2,13,080 hectares lies in the south-east of the state of
Haryana, north of the Union Territory of the Delhi and is bounded by the districts of
Rohtak, Jind and Panipat. The district shares an inter-state boundry with district Meerut
of Uttar Pradesh. The river Yamuna runs along the eastern boundary of the district and
separates it from Uttar Pradesh. The entire district is a part of the Punjab plain, but area
is not leveled at several places. The soil is fine loam of rich colour. Some areas,
however, have sandy soil and others are comprised of Kallar. The plain has a gradual

32
slope to the south and east. The district is divided into three regions – the Khadar, the
upland plain and the sandy region.
The climate of district Sonepat is dry with an extremely hot summer and a cold
winter. The weather becomes comparatively mild during the monsoon period (July to
September). The post-monsoon months October and November constitute a transition
period, prior to the onset of winter. The cold season starts towards the later half of
November when day and night temperatures fall rapidly. January is the coldest month
when mean daily minimum temperature is 6 to 70C. During the summer months of May
and June, maximum temperature sometimes reaches 470C. Temperature drops
considerably with the advancement of monsoon in June.
Humidity is considerably low during the greater part of the year. The district
experiences high humidity only during the monsoon period. The period of minimum
humidity (less than 20%) is between April and May. The annual rainfall varies
considerably from year to year. However, the maximum rainfall is experienced during
the monsoon season, which reaches its peak in the month of July. In fact, the monsoon
period accounts for 75% of the annual rainfall in the district.
According the 2001 Census, total population of district was 1279 thousand
persons (6.05% of the state). Of this, urban population formed a small part and was
around 25%. The district is primarily rural in nature and main activity of the people is
agriculture. The rural population of the district was 958 thousand persons. The male and
female ratio was about 839. Total workers in Sonepat according to 2001 Census
comprised of 36.26% cultivators, 16.71% agricultural labourers and remaining 47% as
non-agricultural workers.
Sonepat, comprising of Sonepat, Gohana and Ganaur sub divisions, has 343
villages. The irrigated area by canals and tubewells is 2,86,504 acres and un-irrigated/
rainfed area is 43,979 acres. Water logging is a serious problem affecting the
productivity of land. The problem of water logging is imminent. There has been an

33
alarming rise in the water table during the last two decades, especially in the areas
adjoining canals.
The soil in the district Sonepat is rich and quite suitable for all types of
agricultural crops as well as forest cover. The types of soil may be classified according
to textures as: 1.Sandy (Raitali), 2.Sandy loam (Bhuri), 3.Loam (Rausli), 4.Clay loam
(Karti) & 5. Clay (Dakar). The main soil of the district is a good alluvial loam with
sufficient moisture and is mostly rausli in texture.
The main river system in the district comprises of river Yamuna and the canals
flowing out of it. There is no perennial river in the district. The underground water
resources differ from area to area. The depth of the water table is the lowest in the
Khader area along the Yamuna, where it is below 10 ft. It increases from 30 to 40 ft. in
some of the Western and South Eastern part of the district. The ground water in some
areas is saline and brackish. The ground water conditions indicate that the district faces
the problem of occurrence of brackish water and water logging in eastern parts of the
district.
Foodgrains followed by vegetables are the main crops grown in the district
Sonepat. The yield rate of foodgrains is slightly lower than the state. This is despite the
fact that fertilizer consumption per hectare in the district is higher than the state level.
Infrastructure in the district comprises banks, primary agriculture cooperative
credit societies and regulated markets. The road length per lakh population was 110
kilometers against 128 kilometers in Haryana (Table-3.1).
KURUKSHETRA:
Kurukshetra is a place of great historical and religious importance, revered all
over the country for its sacred associations. It was here that the battle of Mahabharta
was fought and Lord Krishna preached his philosophy of “KARMA” as enshrined in the
34
Holy Geeta to Arjuna at Jyotisar. Kurukshetra is situated in the north eastern part of
Haryana and is surrounded by Ambala district in the north, Karnal in the north eastern
side, Yamunanagar district in the east and Kaithal district in the west. It is situated on
the Grand Trunk Road and main Ambala Delhi Railway Line. The district has been
divided into 2 subdivisions namely Thanesar and Pehowa. It has five development
blocks viz., Thanesar, Pehowa, Ladwa, Babain & Shahabad. It has 4199 villages, all of
which are electrified and linked with metalled pucca roads.
The land is totally plain with slope from north east to south and south eastern
direction. The climate is extremely hot and dry in summer and the temperature touches
450C in the month of May and June. It is hot and humid in the rainy season (July,
August and early September) while it is extremely cold in the months of November to
February and temperature goes down to as low as 40C. District has average rainfall of
740 mm. The land of district Kurukshetra is plain and fertile. Soils are medium to heavy
in texture and pH varies from 7.5 to 8.9. The alluvial clay loam soil is ideal for crops
grown in the district.
In Kurukshetra district, tubewells are the main source of irrigation. The entire net
sown area is irrigated. This is much higher than the state average of 82%. The gross
irrigated area is 270000 ha. which constitutes 5.1% of state’s total gross irrigated area.
The cropping intensity of the district was found 183. Out of the total irrigated area,
majority is irrigated by canals and remaining is irrigated by tube wells. Around 89% of
the geographical area is cultivated. The percentage of net sown area to total cultivable
area is 99.3% which is much higher than state average of 93.1%.
There are 14995 tractors, 11833 harrows, 2688 zero till seed cum fertilizer drills,
7280 power threshers, 300 combine harvesters, 14943 sprayers, 139 dusters, 478
straw reapers, 2 laser levelers, 2 bed planters in the district. In cropping pattern,
foodgrains covered 86.72% followed by fruits and vegetables covering 5.37% of the
GCA during 2009-10. The per hectare productivity of foodgrains in the district is higher
than the state level.

35
Table-3.1
Major Indicators Related to Population and Agriculture in the selected Districts in Haryana
S. N Particulars Sonepat Kurukshetra Gurgaon Haryana
I Population
Population (2001) (‘000) 1279175 825454 870539 21144564 Rural 957800 609943 560836 15029260
% of Rural Population 74.88 73.89 64.42 71.08 Urban 321375 215511 309703 6115304
% of Urban Population 25.12 26.11 35.58 28.92
Population Density (per sq. km) 603 540 612 478 Sex Ratio 839 866 850 861
% of SC Population to Total Population 18.09 20.52 14.75 19.35
Rural Literacy Rate 2001 (percent) 44.16 41.45 40.71 37.5 II Agricultural Workers (% to total workers) 2001
Cultivators 36.26 23.7 31.09 36.03 Agricultural Labourers 16.71 22.73 9.2 15.26
Agricultural Workers 52.97 46.43 40.29 51.29
Non-Agricultural Workers 47.03 53.57 59.71 48.71 III Land Use
% of Net Area Sown to Geographical Area 72.77 89.29 69.17 82.22
Average size of Holdings (2000-01) 1.6 2.36 1.77 2.32
Percentage of Gross Area Irrigated to Total Cropped Area (2008-09) 98.3 100 94.8 85.3
Percent of Net Irrigated Area to Net Area Sown (2008-09) 96.1 100 92.8 80.5
Cropping Intensity (%) 2008-09 194.19 182.66 137.35 181.76
IV Area under major crops (percent to GCA): 2008-09
Total Cereals 85.45 86.42 78.51 68.26 Total Pulses 1.86 0.29 0.61 2.83
Total Foodgrains 87.31 86.72 79.12 71.09 Total Oilseeds 0.80 2.12 12.81 8.12
Sugarcane 1.93 4.12 0.00 1.39
Cotton 0.20 0.00 0.00 7.02 Fruits and Vegetables 4.47 5.37 6.44 1.99
V Productivity of Important Crops (kg/ha): 2008-09 Total Cereals 3513 3852 3240 3606
Total Pulses 1214 1000 1000 965
Total Foodgrains 3464 3842 3223 3501 Total Oilseeds 1250 1983 1870 1727
Sugarcane 6810 6088 0 5752
Cotton Negligible Negligible Negligible Negligible VI Input Use
Fertilizer (kg/ha) (2008-09) 285.82 369.33 146.61 208.56 Hives Coverage (2008-09) 83.44 85.73 91.97 88.45
Number of Tractors (per 000 ha of NSA) (2008-09) 80 92 63 72
Electricity use in Agriculture (% to total in 2008-09 31.43 73.38 33.37 39.45 VII Credit Societies, Bank and Roads
No. of Primary Agriculture Cooperative Societies 33 49 33 628 No. of Banks per lakh population 0.01 0.01 0.03 10.13
Total Road Length per lakh Population (2008-09) 109.84 142.47 81.9 127.94
VIII Regulated Markets
No. of Regulated Markets per lakh ha of Net Sown Area (2008-09) 2 5 5 3
Source: Statistical Abstract Haryana, 2009-10

36
The level of fertilizer consumption per hectare was also observed higher than
the state. Around 33% of electricity is used for agricultural purposes. The road
length per lakh population was found above the state. There are five regulated
markets under the APMC.
GURGAON:
Gurgaon district falls in the southern most region of the state of Haryana. Its
headquarter is at Gurgaon. Gurgaon falls under National Capital Region. It lies in
between 27° 39’ and 28° 32’25’’ latitude, and 76° 39’ 30’’ and 77° 20’ 45’’ longitude.
Its boundary touches Rajasthan and south Delhi and it makes Gurgaon to be an
important strategically located place. On its north, it is bounded by the district of
Jhajjar & the Union Territory of Delhi; Faridabad district lies to its east. On south, it
shares boundary with Mewat whereas Rewari lies in its west.
The district comprises of hills with irregular and diverse nature of topography.
Two ridges i.e. Firojpur Jhirka-Delhi ridge forms the western boundary and Delhi
ridge forms the eastern boundary of the district. These hills are continuation of
Aravalli hills. The north-western part of the district is covered with sand dunes lying
in the western direction due to southwestern winds. The extension of the Aravalli
hills and the presence of sand dunes collectively form the diverse physiography of
the district. The drainage of the district is typical in arid and semi-arid areas. It
comprises of large depressions and seasonal streams. Important depressions of the
district are Khalilpur lake, Chandani lake, Sangel-Ujhina lake, Kotla dahar lake and
Najafgarh lake. Sahibi and Indrani are two important seasonal streams of the
district.
The alluvium in the area comprises silt, sand, gravel, clay and kankar. It has
been divided into older alluvium and newer alluvium. The old alluvium is present in
the most part of the district. It comprises of poor silt, sand, gravel and clay. The silt
constitutes fine wind blown variety along with kankar. The presence of kankar in the

37
formation reduces the pore spaces, which in turn reduces the capacity to store and
transmit water thus making them poor water bearing formations. The recent
alluvium covers the eastern part of the area, east of the Sohna ridge. It comprises
mainly stream laid silt, sand clay and calcareous modules. It is also found in the
west of Sohna ridge where streams have deposited in the form of discontinuous
bands and at the foothill slopes.
In Gurgaon, temperature begins to increase from February and rises rapidly
till May. May and June are the hottest months with mean daily temperature about
400C and the mean minimum daily temperature of about 250C. The daily mean
maximum temperature varies from 21.40C in January to 400C in May. From April
onwards, hot westerly dust ladden winds cause heat wave conditions and weather
of the district becomes intensely hot and unpleasant. With the advancement of
monsoon currents into the district by the end of June, there is appreciable drop in
day temperature and the weather becomes comparatively cool in the day. After the
withdrawal of the monsoon in the middle of September, day temperature remains
high but night temperature begins to drop progressively. The fall in temperature of
day and night are rapid from October to January. January is the coldest month.
During the cold weather season, district is affected by cold waves in association
with the western disturbances.
The normal rainfall in the district is about 578 mm spread over monsoon
months. The southwest monsoon sets in the last week of June and withdraws
towards the end of the September and contributes about 80% of the annual rainfall.
July and August are the wettest months. 20% of the annual rainfall occurs during
the non-monsoon months in the wake of thunder storms and western disturbances.
Rainfall distribution in the district is quite uneven which increases from 450 mm in
the south at Farukhnagar to 750 mm in the east.
Gurgaon is considered as the most densely populated district of Haryana.
According to the Census 2001, total population of Gurgaon district was 871

38
thousand persons. Out of which 471 thousand were males and 400 thousand were
females. The rural population of Gurgaon district was around 64% and the urban
population was around 36%. The density of population was 850 persons per sq km
in the district. The occupational structure of the population revealed their social,
cultural and educational levels. The higher work participation rate may reflect larger
opportunities of employment available in the district. The occupational structure of
the district indicated that share of cultivators and agricultural labourers in total
workers was observed around 31 and 9% respectively. Non-agricultural workers
constituted around 60% of total workers. Like state, foodgrains are the major crops
which occupied 79% of GCA. In addition, around 13% of GCA was observed under
oilseeds. The productivity of foodgrain crops in the district was lower than the state
level while vice versa was true in case of oilseeds (Table-3.1).
The fertilizer consumption was 147 kg/ha that is much lower than the state
level. Other infrastructural facilities such as banks, primary agricultural cooperative
societies were common like other districts of Haryana. It is surprising that road
length per lakh population was found lowest among the selected districts for the
study.
Section-2
Reliance Fresh: A Background
We have mentioned in Chapter-1 that fruits and vegetables under the
Traditional Marketing Channel are marketed through the regulated APMC markets
and distributed across the consumption centres through a chain of intermediaries,
starting from producers to commission agents, wholesalers, traders,
retailers/vendors and finally to consumers. The problems and constraints in the
traditional marketing system are leading to emergence of super markets and
organized food retail chains such as the Reliance Fresh in urban locations. Now, we
present a brief background of the Reliance Fresh.

39
Reliance Retail Limited (RRL), a subsidiary of RIL (Reliance Industries
Limited), was set up to lead Reliance Group’s foray into organized retail. The RF, a
wholly owned subsidiary of RRL was born in November, 2006 with its first store in
Hyderabad. RF was evolved from Ranger Farms which wholesaled Fresh Fruits and
Vegetables (FFV) to push-cart vendors and other bulk customers.
Reliance Retail today ushered in a new retail culture in the National Capital
Region by opening nine western-style food stores as it hoped to become the
preferred supplier of their push-cart vendors and kirana stores. The launch of nine
Reliance Fresh stores in Noida, Greater Noida, Gurgaon, Ghaziabad and Faridabad
took the number of such outlets that sell fruits, vegetables, groceries and dairy
products to 49 in the country with an investment of close to Rs 3,000 crore.
Reliance Fresh stocks fresh fruits and vegetables, staples, fast moving
consumer goods and dairy products. The stores are already selling over 1,000
tonnes of fresh produce daily and also 250 categories of commodities. The
company is approaching farmers directly for the procurement of produce, seeking to
reduce sizable wastage that occurs through the traditional supply chain.
All RF outlets deal in fruits and vegetables (F&V). RF had 700 stores in India
and 110 in National Capital Region (NCR) alone, by early 2009. All the RF stores
were owned stores and varied in size. Number of F&V Stock Keeping Units (SKU)
per store ranged between 65 and 70, occupying about 15-25% of store apace. Each
of the RF stores was managed by one store manager and 18 store staff working in
two shifts. The average footfalls in weekdays were around 400 while on week-ends
increased to 600. The City Processing Centre (CPC) for F&Vs was located in
Naroda. The F&Vs were classified into 8-10 product categories; leafy vegetables,
tropical F&Vs, basic vegetables, cuts and sprouts, melons, mangoes, apple and
citrus fruits, etc. Only 2% of its FFVs were cut and packed. All city indents were
consolidated and demands placed by the Cost Per Click (CPC) to the Collection
Centre (CC).

40
The share of sales of F&Vs in total sale of RF stores was about 2.5%. On an
average, a RF outlet sold one tonne of F&V/day which was 0.5 tonne/day earlier.
The RF claimed that its share in organized F&V retail was 50%. The employees at
the store trained specifically for F&Vs were called F&V champions’. Although, stores
sold pre-packed vegetables like tomato, onions, potatoes, cut vegetables and other
imported items. It was difficult to sell them as they had to be declared “Best before”
and their “Expiry dates” were to be mentioned. For tomato, potato and onion, prices
are expected to be lower in the stores than un-organized retailers. The product
promotion was done through leaflets, banners and bi-weekly promotional schemes.
The Reliance food processing solutions Pvt. Ltd. was another arm of Reliance
Industries Ltd, which was into wholesaling and export. It focused on selected Stock
Keeping Units (SKUs) like onions, grapes, etc. Sometimes, it supplied to the RF
stores. More recently, a ‘market down’ strategy has been used in all the stores to
clear the unsold F&Vs at lower price. After that, unsold F&Vs were dumped. The RF
stores also stocked their own private label in staples and food under ‘Reliance
Select” label.
During the time of harvest, CC in-charge posted the ‘offer price’ based on
which farmers decided whether or not to supply their produce by comparing the
revenue realization (gross price net of transaction costs) from alternative channels.
Agreements were reached wholly on the basis of oral assurances. Thus, without
contracts or similar committed obligations to lock in farmer supply, CC managers
faced a messy task of matching supply and demand. RF procured F&Vs of ‘A
Grade’ only. It paid higher price at their dispatch door in return for better quality, but
with efficiencies in logistics and handling, the effect of these cost on final
(supermarket shelf) prices is discounted (vis-à-vis the fragmented transactional
arrangements of wet markets). Some farmers mentioned that the entry of super
markets into their local growing areas had been good for prices. The weighted
average price paid by RF as percentage of that paid by traders was higher in most
of the vegetables.

41
Since RF procured only A grade of the produce, farmers had to bear cost of
finding an alternative buyer for the rejected produce. Rejection rates for grapes and
green beans were less than 2%, as compared to 23% in tomatoes. Though RF paid
a premium for ‘A’ grade tomatoes, but growers run a greater risk of having their
produce rejected. Farmers also undertook sorting and grading, prior to delivery
which imposed an additional cost on growers, but farmers did not have to pay
commissions or’ unloaded fees’ unlike in mandi. Deliveries at CCs were subjected
only to visual tests (checking for damage from insects, disease, etc) and
requirement that produce met the criterion of uniformity of size. Thus, the role of
quality parameters in supermarkets procurement remained quite rudimentary
Section-3
Status of Fruit and Vegetable Crops in Haryana
Economy of Haryana is largely agriculture based and the state is viewed as
grain bowl of India, being one of the largest contributors of food grains to the central
pool. Moreover, it ranks first in the country in the export of Basmati rice. Green
revolution in the state has been synonymous with farm mechanization, development
of irrigation infrastructure and use of fertilizers. Consequently, overall productivity
per unit of land has risen significantly.
Dominance of wheat and paddy rotation in the crop pattern of Haryana has
started creating problems such as soil degradation. Significantly; water table is
receding with each passing year due to over exploitation of water. Both these crops
are input intensive and therefore, cause imbalance in nutritional structure of soil and
pollute the underground water. To overcome these problems, horticulture can play
an important role through diversifying land use pattern.

42
Diverse agro-climatic conditions of the state are conducive for cultivation of
horticultural crops including fruits like citrus, grapes, mango, guava, etc. Since, one
third of the state territory falls within the geographical coverage of the National
Capital Region, there is a tremendous scope for commercial cultivation of vegetable
crops, fruits, flowers, etc. In addition, establishment of agro-processing industries
has a good potential. Especially, owing to its proximity to Delhi, there is vast
potential for processing of fruits and vegetables.
In view of this background, we first present the status of horticultural crops in
Haryana in terms of area, production and yield during 2007-08, 2008-09 and 2009-
10. In addition, we present statistics related to horticultural crops at the crop and
district level.
Status of Horticultural Crops in Haryana
Agricultural economy of Haryana is foodgrains based with 66.7 per cent of
GCA under their cultivation. Wheat followed by paddy has been observed as the
most important cereal crops with 36.7 and 15.9 per cent of GCA in the state during
the triennium ending 2008-09. In addition, mustard and cotton are also grown on
sizeable proportion (10.4 and 8.9 per cent) of GCA. It is essential to mention that
area under pulses became as low as 2.7 per cent of GCA during the reference
period.
We have presented information on status of Haryana in all India area under
fruits and vegetables from 1996-97 to 2004-05 in Table-3.2. It is evident that share
of this state in all India area under fruits was less than 1 per cent throughout these
years despite higher potential. Moreover, it grew at the rate of 2.91 per cent per
annum during this period.
A look at the share of Haryana in all India area under vegetables reveals a
far better status. It constituted 1.71 per cent of all India area during 1996-97 and

43
reached to 3.08 per cent in 2004-05. The annual growth rate of area under
vegetables was commendable and crossed 10 per cent mark. These figures
indicate a distinct achievement of the state. When fruits and vegetables are clubbed
together, Haryana showed 1.28 per cent share in all India area during 1996-97
which reached to 1.98 per cent during 2004-05. The area expansion appeared to be
commendable by indicating a growth rate of 9.5 per cent per year during the above-
mentioned period.
Table-3.2 Area under Fruits and Vegetables in Haryana
Year
Fruits Vegetables Fruits and vegetables
Area (000 ha)
Per cent of all India
Area (000 ha)
Per cent of all India
Area (000 ha)
Per cent of all India
1996-97 21.8 0.61 94.5 1.71 116.3 1.28
1997-98 23.9 0.65 96.8 1.73 120.7 1.30
1998-99 26.2 0.70 120 2.05 146.2 1.52
1999-00 28.6 0.75 135 2.25 163.6 1.67
2000-01 30.7 0.79 141.7 2.27 172.4 1.70
2001-02 31.3 0.78 150.4 2.44 181.7 1.79
2002-03 31.9 0.84 163.1 2.68 195 1.97
2003-04 31.6 0.68 203.9 3.23 235.5 2.14
2004-05 24.1 0.49 207.8 3.08 231.9 1.98
Growth rate 2.91 10.71 9.5
Source: CMIE, 2008-09

44
Table-3.3
Percentage of GCA under Horticultural crops in Haryana
District Percentage of GCA Ambala 5.07
Panchkula 2.09 Yamunanagar 2.05 Kurukshetra 3.30
Kaithal 0.38 Karnal 1.15 Panipat 2.00 Sonepat 2.56 Rohtak 0.87 Jhajjar 0.42
Faridabad 2.00 Gurgaon 1.77 Rewari 0.33
Mahendragarh 0.59 Bhiwani 0.08
Jind 0.56 Hissar 0.71
Fatehabad 0.57 Sirsa 0.68
Haryana 1.11 Source: Ministry of Agriculture, Government of India, New Delhi
Figure:1
0
1
2
3
4
5
6
Percentage of GCA under Horticultural crops in Haryana
Percentage
of GCA

45
Table- 3.4
District wise Share in Area under Horticultural crops in Haryana
Sl. No. District Fruits and Vegetables
1 Panchkula 2.74
2 Ambala 7.72
3 Yamunanagar 9.85
4 Kurukshetra 5.77
5 Kaithal 1.68
6 Karnal 8.82
7 Panipat 5.73
8 Sonepat 8.68
9 Rohtak 3.73
10 Jhajjar 3.24
11 Faridabad 2.97
12 Narnaul 2.64
13 Rewari 1.31
14 Gurgaon 10.98
15 Bhiwani 3.44
16 Hissar 2.90
17 Fatehabad 3.73
18 Sirsa 4.53
19 Jind 3.40
20 Mewat 4.05
21 Palwal 2.10
State 100.00
Source: Ministry of Agriculture, Government of India, New Delhi

46
Figure:2
Only 1.11 per cent of GCA was devoted to horticultural crops in Haryana
during 2007-08. A district-wise scenario presented in Table-3.3 indicates that
highest share of total cropped area was devoted to horticultural crops in Ambala
followed by Kurukshetra and Sonepat. Gurgaon and Faridabad were lagging behind
these districts despite their close proximity to Delhi. In contrast, there are districts
such as Rewari which exhibited around 1 per cent of total cropped area under
horticultural crops.
Although, agro climatic conditions of Haryana are suitable for growing
horticultural crops, progress of horticulture in terms of area devoted has been rather
slow and does not commensurate with the availability of excellent natural and
efficient human resources. In fact, higher yields and better returns through assured
marketing from wheat-rice cropping system has been one of the major reasons for
reluctance of the farmers to shift to fruit crops which have a long gestation period. In
the past, public policy, at state and central levels has paid inadequate attention to
the development of horticultural crops. Now, policy makers have realized growth
potential of horticultural crops and proactive steps have been undertaken by the
Distirct wise Share in Area under Horticultural
Crops in Haryana
Panchkula
Ambala
Yamunanagar
Kurukshetra
Kaithal
Karnal
Panipat
Sonipat
Rohtak
Jhajjar
Faridabad
Narnaul
Rewari
Gurgaon
Bhiwani
Hissar
Fatehabad
Sirsa
Jind
Mewat
Palwal

47
Government through implementation of programmes like the National Horticulture
Mission.
Having analysed share of horticultural crops in allocation of acreage at the
district level, it would be useful to examine the share of each district in total area
under these crops. Table3.3 suggests that Gurgaon is leading with more than 10
per cent share in the overall area. Further, share of Yamunanagar (9.85 per cent),
Karnal (8.82 per cent), Sonepat (8.68 per cent), Ambala (7.72 per cent),
Kurukshetra (5.77 per cent) and Panipat (5.73 per cent) was observed more than 5
per cent. These districts together formed more than 60 per cent of the state area
under horticultural crops during 2009-10 (Table 3.4).
Composition of Horticultural Crops:
Horticultural crops comprise a large variety of crops including fruits,
vegetables, spices, flowers, medicinal and aromatic plants. In view of the large
genetic base available, crops adapt to diverse conditions of soil and climate Table-
3.5 presents share of individual crops in total area and production of horticultural
crops in Haryana. The scenario is dominated by vegetables. The share of
vegetables in area and production of horticultural crops was as high as 82.57 and
90.31 per cent respectively. Fruits occupied second rank with 11.38 per cent share
in area and 6.83 per cent share in production. A low contribution in production
indicates low productivity of fruit crops in the state. Increase in productivity has to
come from crop improvement as well as enhanced cropping intensity.
Spices are well known as appetizers. These are also considered essential in
the culinary art all over the world. Some of the spices possess anti-oxidant
properties and others are used as preservatives. India is the largest producer as
well as consumer of spices in the world. Even in Haryana, there is no cuisine
without addition of one or more spices. Spices formed around 4 per cent of area
under horticultural crops and contributed 1.44 per cent to total production. The low
contribution in production could be due to low yield.

48
Table-3.5 Share of Fruits, Vegetables, Spices, Floriculture, Medicinal and Aromatic Plants in
Total Area under Horticultural Crops in Haryana during 2009-10
Sl. No.
Crop
Share
Area Production
1
Fruits
11.38
6.83
2
Vegetables
82.57
90.31
3
Spices
4.08
1.44
4
Floriculture
1.70
1.36
5
Medicinal & Aromatic plants
0.28
0.06
Total
100.00
100.00
Source: Ministry of Agriculture, Government of India, New Delhi Figure:3
Share of Fruits, Vegetables, Spices, Floriculture,Medicinal and
Aromatic Plants in Total Area under Horticultural Crops in
Haryana during 2009-10
Fruits
Vegetables
Spices
Floriculture
Medicinal & Aromatric plants

49
In Haryana, floriculture is getting popular among the farmers. These are being
grown in peri-urban areas and 1.70 per cent of area under horticultural crops was
devoted to flowers. Medicinal and aromatic plants are not popular in Haryana and a
marginal share of total area under horticultural crops was devoted to them.
Share of Individual Vegetable and Fruit Crops in Total Area under these
Crops:
Since vegetable and fruit crops together constituted around 94 per cent of
area and 97 per cent of production of horticultural crops in Haryana, it would be
useful to examine share of individual crops in total area allocation. Table-3.6 reveals
that citrus (33.38 per cent), mango (22.01 per cent) and guava occupied around 75
per cent of area devoted to fruit crops in the state. Next ranking fruits are mango,
ber and aonla. Fruits such as grapes and litchi does not appear to be popular
among farmers and therefore, proportion of area under these crops is less than one
per cent.
Vegetables form core of the horticultural crops in Haryana. Among vegetables,
cucurbits (22.67 per cent), cauliflower (8.54 per cent), leafy vegetables (8.34 per
cent), potato (7.66 per cent), tomato (7.51 per cent) and radish (7.25 per cent) are
the main crops grown in the state and constituted more than 60 per cent of area
under vegetables during 2009-10. On the other hand, arbi among vegetables
indicated as low as 0.12 per cent of area under total vegetable crops in Haryana.

50
Table-3.6
Share of Different Varieties of Fruits and Vegetables in Total Area under
Fruits and Vegetables during 2009-2010
Sl. No. Particulars Percentage Share
Fruits
1 Mango 22.01
2 Guava 18.86
3 Citrus 33.38
4 Ber 8.62
5 Grape 0.12
6 Aonla 5.05
7 Chiku 2.53
8 Litchi 0.59
9 Peach/Pear/Plum 1.63
10 Other 7.20
Total 100.00
Vegetables
1 Potato 7.66
2 Onion 6.13
3 Tomato 7.51
4 Radish 7.25
5 Carrot 5.78
6 Cabbage 4.07
7 Cauliflower 8.54
8 Chillies 3.96
9 Okra 5.28
10 Brinjal 4.31
11 Cucurbits 22.67
12 Arbi 0.12
13 Peas 3.52
14 Leafy vegetables 8.34
15 Other 4.86
Total 100.00 Source: Ministry of Agriculture, Government of India, New Delhi

51
Figure:4
0
5
10
15
20
25
30
35M
an
go
Gu
ava
Citr
us
Be
r
Gra
pe
Ao
nla
Ch
iku
Lit
chi
Pe
ach
Oth
er
Share of Different Fruits in Total Area under Fruits during 2009-2010
0
5
10
15
20
25
Po
t ato
On
ion
To
ma
toR
ad
ish
Ca
r ro
tC
ab
ba
ge
Ca
ul if
l ow
er
Ch
i lli e
sO
kra
Br i
nja
lC
uc
urb
itsA
rbi
Pe
as
Le
afy
ve
g.
Oth
ers
Share of Different Varities of vegetables in Total Area Under Vegetables during 2009-
2010
Series1

52
Change in Area and Production of Horticultural Crops:
It may be noted that time series detailed data on individual vegetable and
fruit crops are available since 2007-08. Therefore, we are unable to calculate
growth rates of area and production. Instead, we have computed percentage
change in area and production of individual vegetable and fruit crops between 2007-
08 and 2009-10. Results presented in Table-3.7 indicate that citrus fruits are most
prominent gainers in area and production (68.46 and 47.11 per cent) during the
reference period. Next is chiku which has shown an increase 39.63 per cent in area
and 50.82 per cent in production during this period. Guava also gained significantly
in area as well as in production. On the other hand, grapes are the biggest losers in
area as well as in production. The extent of loss was 42.53 per cent in area and
34.19 per cent in production. In terms of area, another loser crop was aonla despite
an increase of 6.89 per cent in production. Litchi and peaches group indicated
positive gains in area but production losses were as high as 35.49 and 31.30 per
cent, respectively.
Among vegetables, leafy vegetables, tomato and potato indicated more than
15 per cent increase in area and production between 2007-08 and 2009-10.
Particularly, increase in production of tomato and potato was impressive by
indicating more than double production in case of potato and almost five times in
case of tomato. It could be possible due to increase in yield rates. The similar
pattern of gains has been noticed in case of cucurbits, cabbage and cauliflower.
Okra emerged as a special case with 7 per cent increase in area and less
than 1 per cent gain in production.
District-wise Scenario of Area, Production and Yield of Fruit Crops:
After analyzing change in area and production of vegetables and fruit crops at
the state level, it would be prudent to analyse the scenario at the district level.
The information related to area, production and yield of fruit crops in 2007-08 to

53
2009-10 is presented in Table-3.8 Yamunanagar and Sirsa were the leading
districts in area under fruit crops cultivation and together accounted for 37 per cent
of total cultivated area. Ambala, Narnaul, Bhiwani and Faridabad showed more than
5 per cent share in overall area under fruit crops
during 2007-08. Further, share of Yamunanagar in state acreage under fruit crops
has declined from previous level in 2007-08 while it has increased in the case of
Sirsa district in
Table-3.7
Percentage Change in Area and Production of Horticultural Crops between 2007-2008 and 2009-2010
Sl. No. Particulars Percentage Change
Area Production
Fruits
1 Mango 5.52 8.20
2 Guava 27.46 32.58
3 Citrus 68.46 47.11
4 Ber 1.74 1.16
5 Grape -42.53 -34.19
6 Aonla -14.32 6.89
7 Chiku 39.63 50.82
8 Litchi 4.74 -35.49
9 Peach/Pear/Pulam 3.52 -31.30
10 Other 1.70 124.38
Total 23.33 26.42
Vegetables
1 Potato 15.81 40.49
2 Onion 3.90 5.02
3 Tomato 17.85 87.73
4 Radish 9.13 9.60
5 Carrot 5.50 4.91
6 Cabbage 7.76 42.99
7 Cauliflower 6.06 39.38
8 Chillies 11.54 3.17
9 Okra 7.00 0.70
10 Brinjal -3.68 -17.56
11 Cucurbits 2.77 30.24
12 Arbi -2.95 -3.72
13 Peas 5.86 -9.23
14 Leafy vegetable 28.72 13.65
15 Others 39.59 7.49
Total 9.57 22.69
Source: Ministry of Agriculture, Government of India, New Delhi

54
2009-10. As far as, share of these leading districts in production of fruits is
concerned, it as declined from 17.57 per cent in 2007-08 to 16.13 per cent in 2009-
10 in Yamunanagar. While, it has increased from 19.93 per cent to 24.01 per cent in
Sirsa district during the same period due to improvement in productivity. It is
interesting to note that yield rate of fruits was observed highest in Panipat district
during 2007-08 which is a low ranking district in terms of area allocation. Second
rank was attained by Hissar and third by Kaithal. After two years, Kaithal and
Gurgaon attained first and second ranks in productivity of fruit crops during 2009-
10.
In Table-3.9, we have compared district-wise status of vegetable crops in
terms of area, production and productivity during 2007-08, 2008-09 and 2009-10.
The spatial pattern of area allocation presented in this Table suggests that Karnal,
Sonepat, Gurgaon, Ambala and Yamunanagar together constituted almost 50 per
cent of total area under vegetable cultivating in the state during 2007-08. After one
year, share of Gurgaon dropped marginally while share of Yamunanagar increased
by almost one per cent. Yamunanagar also contributed highest share in production.
During 2009-10, share of Gurgaon has increased while vice versa was observed in
case of Yamunanagar. It is surprising that yield rates of vegetable crops were
observed highest in Narnaul, a lowering ranking district in area and production. Next
was Yamunanagar which maintained its rank in area, production and yield.
The level of productivity of vegetable crops changed after one year in 2009-
10 and Kurukshetra became a leader in terms of yield rates of vegetable crops.
Panchkula shifted from third rank to second rank by indicating an increase in
productivity from 14.82 to 17.31 tonnes/ha. To conclude, performance of vegetable
crops in Haryana in terms of productivity was appreciable which has risen from
11.93 tonnes/ha in 2007-08 to 13.36 tonnes/ha in 2009-10.

55
Table-3.8 District wise Area, Production and Yield of Fruit Crops in Haryana (2007-2008 to 2009-2010)
Sl No. District 2007-08 2008-09 2009-10
Area (ha)
Production (tonnes)
Yield (tonnes/ha)*
Area (ha)
Production (tonnes)
Yield (tonnes/ha)
Area (ha)
Production (tonnes)
Yield (tonnes/ha)
1 Panchkula 1533
(4.56)* 6865
(2.86)* 4.48 (19)*
500 (3.85)*
3650 (7.60)*
7.30 (1)*
1629 (3.93)*
9514 (3.13)*
5.84 (16)*
2 Ambala 1940 (5.77)
12498 (5.20)
6.44 (14)
608 (4.68)
1232 (2.56)
2.03 (15)
2193 (5.29)
15551 (5.12)
7.09 (11)
3 Yamunanagar 6862
(20.42) 42240 (17.57)
6.16 (15)
2035 (15.66)
12009 (25.00)
5.90 (2)
7511 (18.12)
49032 (16.13)
6.53 (13)
4 Kurukshetra 980
(2.92) 6618 (2.75)
6.75 (12)
978 (7.53)
3870 (8.06)
3.96 (6)
1065 (2.57)
6774 (2.23)
6.36 (14)
5 Kaithal 337
(1.00) 3557 (1.48)
10.55 (3)
319 (2.46)
894 (1.86)
2.80 (10)
333 (0.80)
4120 (1.36)
12.37 (1)
6 Karnal 1895 (5.64)
12963 (5.39)
6.84 (11)
1551 (11.94)
8091 (16.84)
5.22 (4)
2087 (5.03)
18694 (6.15)
8.96 (9)
7 Panipat 668
(1.99) 7322 (3.05)
10.96 (1)
156 (1.20)
490 (1.02)
3.14 (8)
707 (1.71)
6359 (2.09)
8.99 (7)
8 Sonepat 1262 (3.75)
10185 (4.24)
8.07 (7)
1526 (11.74)
3957 (8.24)
2.59 (11)
1419 (3.42)
14372 (4.73)
10.13 (5)
9 Rohtak 945
(2.81) 4816 (2.00)
5.10 (17)
462 (3.56)
1068 (2.22)
2.31 (13)
1293 (3.12)
9629 (3.17)
7.45 (10)
10 Jhajjar 1154 (3.43)
6667 (2.77)
5.78 (16)
193 (1.49)
330 (0.69)
1.71 (17)
1511 (3.65)
9153 (3.01)
6.06 (15)
11 Faridabad 955
(2.84) 9110 (3.79)
9.54 (4)
312 (2.40)
188 (0.39)
0.60 (20)
687 (1.66)
7807 (2.57)
11.36 (3)
12 Narnaul 420
(1.25) 2934 (1.22)
6.99 (9)
665 (5.12)
1385 (2.88)
2.08 (14)
1485 (3.58)
3484 (1.15)
2.35 (21)
13 Rewari 390
(1.16) 2717 (1.13)
6.97 (10)
170 (1.31)
300 (0.62)
1.76 (16)
490 (1.18)
2781 (0.92)
5.68 (18)
14 Gurgaon 1379 (4.10)
10080 (4.19)
7.31 (8)
449 (3.46)
1063 (2.21)
2.37 (12)
1298 (3.13)
15129 (4.98)
11.66 (2)
15 Bhiwani 1973 (5.87)
10001 (4.16)
5.07 (18)
260 (2.00)
875 (1.82)
3.37 (7)
2622 (6.33)
6321 (2.08)
2.41 (20)
16 Hisar 1812 (5.39)
19225 (8.00)
10.61 (2)
622 (4.79)
946 (1.97)
1.52 (18)
2412 (5.82)
15936 (5.24)
6.61 (12)
17 Fatehabad 1701 (5.06)
14723 (6.12)
8.66 (6)
675 (5.19)
3700 (7.70)
5.48 (3)
1908 (4.60)
20029 (6.59)
10.50 (4)
18 Sirsa 5528
(16.45) 47923 (19.93)
8.67 (5)
433 (3.33)
1817 (3.78)
4.20 (5)
7919 (19.10)
72978 (24.01)
9.22 (6)
19 Jind 973
(2.89) 6441 (2.68)
6.62 (13)
455 (3.50)
1350 (2.81)
2.97 (9
890 (2.15)
7976 (2.62)
8.96 (8)
20 Mewat 903
(2.69) 3515 (1.46)
3.89 (20)
626 (4.82)
825 (1.72)
1.32 (19)
1247 (3.01)
4003 (1.32)
3.21 (19)
21 Palwal NA NA NA NA NA NA 744
(1.79) 4278 (1.41)
5.75 (17)
Total 33610 (100)
240400 (100)
7.15
12995 (100)
48040 (100) 3.70
41450 (100)
303920 (100)
7.33
*Figures in parenthesis indicate percentage share of the district and rank of the district in yield
Source: Ministry of Agriculture, Government of India, New Delhi

56
Table-3.9
District wise Area, Production and Yield of Vegetable Crops in Haryana (2007-2008 to 2009-2010)
Sl.No. District 2007-08 2008-09 2009-10
Area (ha)*
Production (tonnes)*
Yield (tonnes/ha)*
Area (ha)*
Production (tonnes)*
Yield (tonnes/ha)*
Area (ha)*
Production (tonnes)*
Yield (tonnes/ha)*
1 Panchkula 7600 (2.77)
112664 (3.44)
14.82 (3)
7000 (2.35)
113683 (2.92)
16.24 (1)
7750 (2.58)
134176 (3.34)
17.31 (2)
2 Ambala 24250 (8.83)
253325 (7.73)
10.45 (16)
25558 (8.58)
278679 (7.16)
10.90 (18)
24225 (8.05)
294878 (7.33)
12.17 (16)
3 Yamunanagar 21503 (7.83)
335882 (10.25)
15.62 (2)
26975 (9.04)
345001 (8.86)
12.79 (13)
26192 (8.71)
362600 (9.02)
13.84 (4)
4 Kurukshetra 13225 (4.82)
188401 (5.75)
14.25 (6)
19865 (6.66)
313042 (8.04)
15.76 (2)
18700 (6.22)
327180 (8.14)
17.50 (1)
5 Kaithal 6588 (2.40)
64091 (1.96)
9.73 (19)
6049 (2.03)
83538 (2.15)
13.81 (7)
5410 (1.80)
71470 (1.78)
13.21 (9)
6 Karnal 26965 (9.82)
271374 (8.28)
10.06 (17)
28337 (9.50)
403041 (10.35)
14.22 (6)
28116 (9.35)
371374 (9.24)
13.21 (10)
7 Panipat 16175 (5.89)
233093 (7.11)
14.41 (4)
15610 (5.23)
214640 (5.51)
13.75 (9)
18900 (6.28)
214451 (5.33)
11.35 (18)
8 Sonepat 26691 (9.72)
313512 (9.57)
11.75 (12)
26800 (8.98)
369949 (9.50)
13.80 (8)
28295 (9.40)
369344 (9.19)
13.05 (12)
9 Rohtak 6250 (2.28)
77168 (2.35)
12.35 (10)
8897 (2.98)
95868 (2.46)
10.78 (20)
11460 (3.81)
113129 (2.81)
9.87 (21)
10 Jhajjar 8425 (3.07)
104025 (3.17)
12.35 (9)
9343 (3.13)
118531 (3.04)
12.69 (14)
9576 (3.18)
126870 (3.16)
13.25 (8)
11 Faridabad 11276 (4.11)
151969 (4.64)
13.48 (7)
13725 (4.60)
186929 (4.80)
13.62 (10)
9482 (3.15)
118166 (2.94)
12.46 (13)
12 Narnaul 5187 (1.89)
83403 (2.55)
16.08 (1)
6396 (2.14)
79120 (2.03)
12.37 (15)
7542 (2.51)
75614 (1.88)
10.03 (20)
13 Rewari 4010 (1.46)
57569 (1.76)
14.36 (5)
4021 (1.35)
57281 (1.47)
14.25 (5)
4002 (1.33)
54354 (1.35)
13.58 (5)
14 Gurgaon 37745 (13.75)
395085 (12.06)
10.47 (15)
37642 (12.61)
413627 (10.62)
10.99 (17)
36294 (12.06)
574302 (14.28)
15.82 (3)
15 Bhiwani 11270 (4.10)
130359 (3.98)
11.57 (13)
9613 (3.22)
117166 (3.01)
12.19 (16)
9145 (3.04)
98514 (2.45)
10.77 (19)
16 Hisar 8520 (3.10)
105464 (3.22)
12.38 (8)
8760 (2.94)
94912 (2.44)
10.83 (19)
7515 (2.50)
90539 (2.25)
12.05 (17)
17 Fatehabad 10050 (3.66)
99568 (3.04)
9.91 (18)
10854 (3.64)
155694 (4.00)
14.34 (4)
10875 (3.61)
146121 (3.63)
13.44 (6)
18 Sirsa 6048 (2.20)
72985 (2.23)
12.07 (11)
7380 (2.47)
97635 (2.51)
13.23 (11)
7575 (2.52)
99433 (2.47)
13.13 (11)
19 Jind 10150 (3.70)
112024 (3.42)
11.04 (14)
10825 (3.63)
159857 (4.11)
14.77 (3)
10745 (3.57)
144066 (3.58)
13.41 (7)
20 Mewat 12652 (4.61)
115139 (3.51)
9.10 (20)
14780 (4.95)
195237 (5.01)
13.21 (12)
12614 (4.19)
154454 (3.84)
12.24 (15)
21 Palwal NA NA NA NA NA NA 6447 (2.14)
79685 (1.98)
12.36 (14)
Total 274580 (100)
3277100 (100) 11.93
298430 (100)
3893430 (100) 13.05
300860 (100)
4020720 (100) 13.36
*Figures in parenthesis indicate percentage share of the district and rank of the district in yield
Source: Ministry of Agriculture, Government of India, New Delhi

57
Changes in Area and Production of Fruit Crops:
So far, we have analysed area, production and yield of vegetable and fruit
crops at the state and district levels. The importance of change in area and
production of fruit crops at the district level has overwhelming importance for
analyzing development of these crops. When we look at percentage change in area
and production of fruit crops between 2007-08 and 2009-10, Narnaul, Sirsa, Rohtak,
Hissar, Bhiwani, Mewat and Jhajjar exhibited more than 20 per cent increase in
area under fruit crops. The overall, increase in area in Haryana between 2007-08
and 2009-10 was observed 23.33 per cent. This indicates growing popularity of fruit
crops in agriculture in Haryana. Like area, increase in production during the
reference period is impressive. Fruit production in Haryana grew by 26.42 per cent
in this period. Among the districts, highest increase was observed in Rohtak (99.4
per cent). Other districts with impressive increase were Sirsa, Karnal, Gurgaon,
Sonepat, Panchkula, Jhajjar and Ambala (Table-3.10).
Table-3.10 Percentage Change in Area and Production of Fruit Crops between 2007-2008
and 2009-2010
Sl No. District Percentage Change
Area Production
1 Panchkula 6.26 38.59
2 Ambala 13.04 24.43
3 Yamunanagar 9.46 16.08
4 Kurukshetra 8.67 2.36
5 Kaithal -1.19 15.83
6 Karnal 10.13 44.21
7 Panipat 5.84 -13.15
8 Sonepat 12.44 41.11
9 Rohtak 36.83 99.94
10 Jhajjar 30.94 37.29
11 Faridabad -28.06 -14.30
12 Narnaul 253.57 18.75
13 Rewari 25.64 2.36
14 Gurgaon -5.87 50.09
15 Bhiwani 32.89 -36.80
16 Hissar 33.11 -17.11
17 Fatehabad 12.17 36.04
18 Sirsa 43.25 52.28
19 Jind -8.53 23.83
20 Mewat 38.10 13.88
21 Palwal NA NA
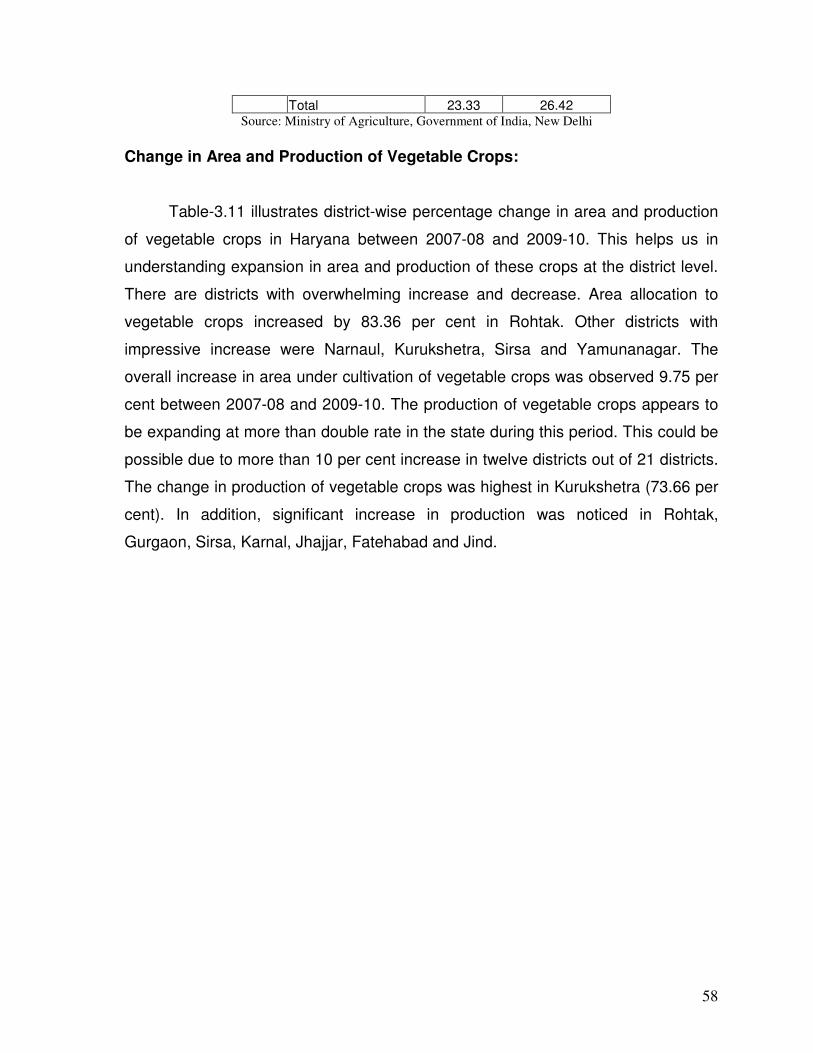
58
Total 23.33 26.42 Source: Ministry of Agriculture, Government of India, New Delhi
Change in Area and Production of Vegetable Crops:
Table-3.11 illustrates district-wise percentage change in area and production
of vegetable crops in Haryana between 2007-08 and 2009-10. This helps us in
understanding expansion in area and production of these crops at the district level.
There are districts with overwhelming increase and decrease. Area allocation to
vegetable crops increased by 83.36 per cent in Rohtak. Other districts with
impressive increase were Narnaul, Kurukshetra, Sirsa and Yamunanagar. The
overall increase in area under cultivation of vegetable crops was observed 9.75 per
cent between 2007-08 and 2009-10. The production of vegetable crops appears to
be expanding at more than double rate in the state during this period. This could be
possible due to more than 10 per cent increase in twelve districts out of 21 districts.
The change in production of vegetable crops was highest in Kurukshetra (73.66 per
cent). In addition, significant increase in production was noticed in Rohtak,
Gurgaon, Sirsa, Karnal, Jhajjar, Fatehabad and Jind.

59
Table-3.11
Percentage Change in Area and Production of Vegetable Crops between 2007-2008 and 2009-2010
Sl No. District Percentage Change
Area Production
1 Panchkula 1.97 19.09
2 Ambala -0.10 16.40
3 Yamunanagar 21.81 7.95
4 Kurukshetra 41.40 73.66
5 Kaithal -17.88 11.51
6 Karnal 4.27 36.85
7 Panipat 16.85 -8.00
8 Sonepat 6.01 17.81
9 Rohtak 83.36 46.60
10 Jhajjar 13.66 21.96
11 Faridabad -15.91 -22.24
12 Narnaul 45.40 -9.34
13 Rewari -0.20 -5.58
14 Gurgaon -3.84 45.36
15 Bhiwani -18.86 -24.43
16 Hissar -11.80 -14.15
17 Fatehabad 8.21 46.75
18 Sirsa 25.25 36.24
19 Jind 5.86 28.60
20 Mewat -0.30 34.15
21 Palwal NA NA
Total 9.57 22.69 Source: Ministry of Agriculture, Government of India, New Delhi
Area, Production and Yield of Major Vegetables:
Before concluding this chapter, it would be useful to examine district-
wise scenario regarding area, production and yield of important vegetables which
contribute at least 10 per cent in total area and production of vegetable crops in the
state. On the basis of this criterion, we have included five vegetables, namely
potato, tomato, cauliflower, cucurbits and leafy vegetables (Table-3.12).
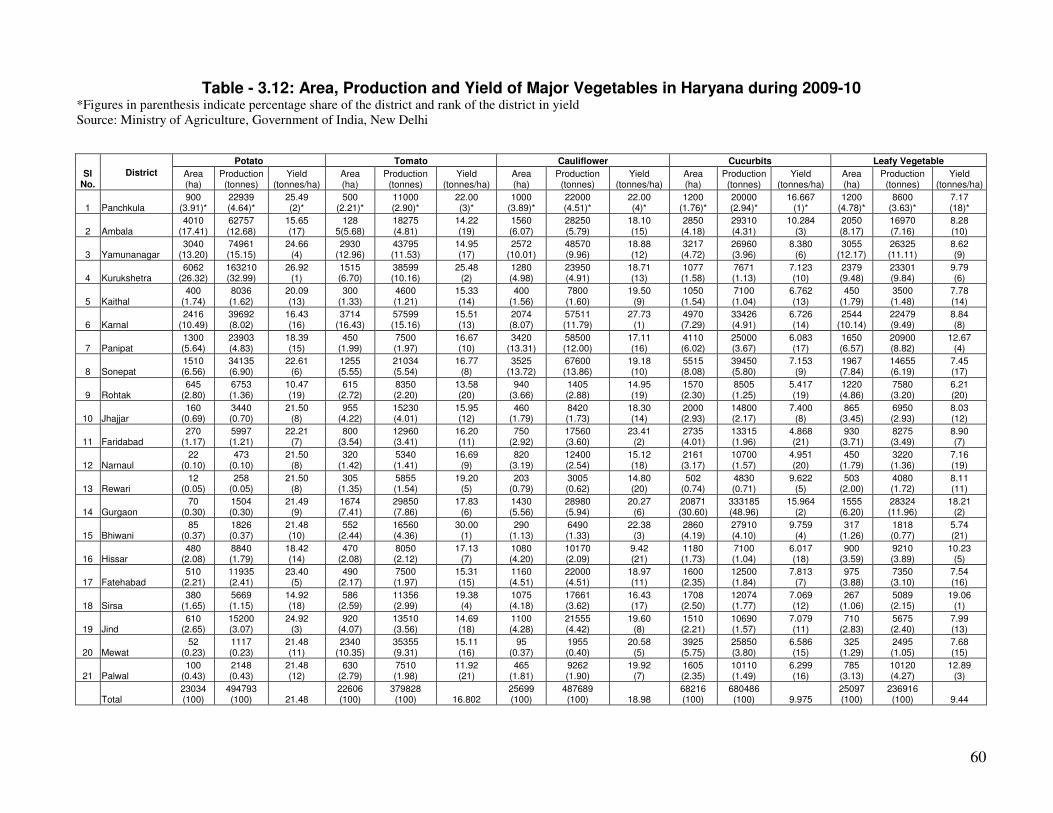
60
Table - 3.12: Area, Production and Yield of Major Vegetables in Haryana during 2009-10 *Figures in parenthesis indicate percentage share of the district and rank of the district in yield
Source: Ministry of Agriculture, Government of India, New Delhi
Sl No.
District
Potato Tomato Cauliflower Cucurbits Leafy Vegetable
Area (ha)
Production (tonnes)
Yield (tonnes/ha)
Area (ha)
Production (tonnes)
Yield (tonnes/ha)
Area (ha)
Production (tonnes)
Yield (tonnes/ha)
Area (ha)
Production (tonnes)
Yield (tonnes/ha)
Area (ha)
Production (tonnes)
Yield (tonnes/ha)
1 Panchkula 900
(3.91)* 22939 (4.64)*
25.49 (2)*
500 (2.21)*
11000 (2.90)*
22.00 (3)*
1000 (3.89)*
22000 (4.51)*
22.00 (4)*
1200 (1.76)*
20000 (2.94)*
16.667 (1)*
1200 (4.78)*
8600 (3.63)*
7.17 (18)*
2 Ambala 4010
(17.41) 62757 (12.68)
15.65 (17)
128 5(5.68)
18275 (4.81)
14.22 (19)
1560 (6.07)
28250 (5.79)
18.10 (15)
2850 (4.18)
29310 (4.31)
10.284 (3)
2050 (8.17)
16970 (7.16)
8.28 (10)
3 Yamunanagar 3040
(13.20) 74961 (15.15)
24.66 (4)
2930 (12.96)
43795 (11.53)
14.95 (17)
2572 (10.01)
48570 (9.96)
18.88 (12)
3217 (4.72)
26960 (3.96)
8.380 (6)
3055 (12.17)
26325 (11.11)
8.62 (9)
4 Kurukshetra 6062
(26.32) 163210 (32.99)
26.92 (1)
1515 (6.70)
38599 (10.16)
25.48 (2)
1280 (4.98)
23950 (4.91)
18.71 (13)
1077 (1.58)
7671 (1.13)
7.123 (10)
2379 (9.48)
23301 (9.84)
9.79 (6)
5 Kaithal 400
(1.74) 8036 (1.62)
20.09 (13)
300 (1.33)
4600 (1.21)
15.33 (14)
400 (1.56)
7800 (1.60)
19.50 (9)
1050 (1.54)
7100 (1.04)
6.762 (13)
450 (1.79)
3500 (1.48)
7.78 (14)
6 Karnal 2416
(10.49) 39692 (8.02)
16.43 (16)
3714 (16.43)
57599 (15.16)
15.51 (13)
2074 (8.07)
57511 (11.79)
27.73 (1)
4970 (7.29)
33426 (4.91)
6.726 (14)
2544 (10.14)
22479 (9.49)
8.84 (8)
7 Panipat 1300 (5.64)
23903 (4.83)
18.39 (15)
450 (1.99)
7500 (1.97)
16.67 (10)
3420 (13.31)
58500 (12.00)
17.11 (16)
4110 (6.02)
25000 (3.67)
6.083 (17)
1650 (6.57)
20900 (8.82)
12.67 (4)
8 Sonepat 1510 (6.56)
34135 (6.90)
22.61 (6)
1255 (5.55)
21034 (5.54)
16.77 (8)
3525 (13.72)
67600 (13.86)
19.18 (10)
5515 (8.08)
39450 (5.80)
7.153 (9)
1967 (7.84)
14655 (6.19)
7.45 (17)
9 Rohtak 645
(2.80) 6753 (1.36)
10.47 (19)
615 (2.72)
8350 (2.20)
13.58 (20)
940 (3.66)
1405 (2.88)
14.95 (19)
1570 (2.30)
8505 (1.25)
5.417 (19)
1220 (4.86)
7580 (3.20)
6.21 (20)
10 Jhajjar 160
(0.69) 3440 (0.70)
21.50 (8)
955 (4.22)
15230 (4.01)
15.95 (12)
460 (1.79)
8420 (1.73)
18.30 (14)
2000 (2.93)
14800 (2.17)
7.400 (8)
865 (3.45)
6950 (2.93)
8.03 (12)
11 Faridabad 270
(1.17) 5997 (1.21)
22.21 (7)
800 (3.54)
12960 (3.41)
16.20 (11)
750 (2.92)
17560 (3.60)
23.41 (2)
2735 (4.01)
13315 (1.96)
4.868 (21)
930 (3.71)
8275 (3.49)
8.90 (7)
12 Narnaul 22
(0.10) 473
(0.10) 21.50
(8) 320
(1.42) 5340 (1.41)
16.69 (9)
820 (3.19)
12400 (2.54)
15.12 (18)
2161 (3.17)
10700 (1.57)
4.951 (20)
450 (1.79)
3220 (1.36)
7.16 (19)
13 Rewari 12
(0.05) 258
(0.05) 21.50
(8) 305
(1.35) 5855 (1.54)
19.20 (5)
203 (0.79)
3005 (0.62)
14.80 (20)
502 (0.74)
4830 (0.71)
9.622 (5)
503 (2.00)
4080 (1.72)
8.11 (11)
14 Gurgaon 70
(0.30) 1504 (0.30)
21.49 (9)
1674 (7.41)
29850 (7.86)
17.83 (6)
1430 (5.56)
28980 (5.94)
20.27 (6)
20871 (30.60)
333185 (48.96)
15.964 (2)
1555 (6.20)
28324 (11.96)
18.21 (2)
15 Bhiwani 85
(0.37) 1826 (0.37)
21.48 (10)
552 (2.44)
16560 (4.36)
30.00 (1)
290 (1.13)
6490 (1.33)
22.38 (3)
2860 (4.19)
27910 (4.10)
9.759 (4)
317 (1.26)
1818 (0.77)
5.74 (21)
16 Hissar 480
(2.08) 8840 (1.79)
18.42 (14)
470 (2.08)
8050 (2.12)
17.13 (7)
1080 (4.20)
10170 (2.09)
9.42 (21)
1180 (1.73)
7100 (1.04)
6.017 (18)
900 (3.59)
9210 (3.89)
10.23 (5)
17 Fatehabad 510
(2.21) 11935 (2.41)
23.40 (5)
490 (2.17)
7500 (1.97)
15.31 (15)
1160 (4.51)
22000 (4.51)
18.97 (11)
1600 (2.35)
12500 (1.84)
7.813 (7)
975 (3.88)
7350 (3.10)
7.54 (16)
18 Sirsa 380
(1.65) 5669 (1.15)
14.92 (18)
586 (2.59)
11356 (2.99)
19.38 (4)
1075 (4.18)
17661 (3.62)
16.43 (17)
1708 (2.50)
12074 (1.77)
7.069 (12)
267 (1.06)
5089 (2.15)
19.06 (1)
19 Jind 610
(2.65) 15200 (3.07)
24.92 (3)
920 (4.07)
13510 (3.56)
14.69 (18)
1100 (4.28)
21555 (4.42)
19.60 (8)
1510 (2.21)
10690 (1.57)
7.079 (11)
710 (2.83)
5675 (2.40)
7.99 (13)
20 Mewat 52
(0.23) 1117 (0.23)
21.48 (11)
2340 (10.35)
35355 (9.31)
15.11 (16)
95 (0.37)
1955 (0.40)
20.58 (5)
3925 (5.75)
25850 (3.80)
6.586 (15)
325 (1.29)
2495 (1.05)
7.68 (15)
21 Palwal 100
(0.43) 2148 (0.43)
21.48 (12)
630 (2.79)
7510 (1.98)
11.92 (21)
465 (1.81)
9262 (1.90)
19.92 (7)
1605 (2.35)
10110 (1.49)
6.299 (16)
785 (3.13)
10120 (4.27)
12.89 (3)
Total 23034 (100)
494793 (100) 21.48
22606 (100)
379828 (100) 16.802
25699 (100)
487689 (100) 18.98
68216 (100)
680486 (100) 9.975
25097 (100)
236916 (100) 9.44

61
Table 3.13 Area, Production and Yield of Major Fruits in Haryana during 2009-10
Sl No.
District Mango Guava Citrus Ber
Area (ha)
Production (tonnes)
Yield (tonnes/ha)
Area (ha)
Production (tonnes)
Yield (tonnes/ha)
Area (ha)
Production (tonnes)
Yield (tonnes/ha)
Area (ha)
Production (tonnes)
Yield (tonnes/ha)
1 Panchkula 900
(3.91)* 22939 (4.64)*
25.49 (2)*
500 (2.21)*
11000 (2.90)*
22.00 (3)*
1000 (3.89)*
22000 (4.51)*
22.00 (4)*
1200 (1.76)*
20000 (2.94)*
16.667 (1)*
1 Panchkula 950
(10.41)* 4090
(6.33)* 4.31 (16)*
196 (2.51)*
1718 (3.08)*
8.77 (7)*
75 (0.54)*
180 (0.18)*
2.40 (19)*
2 (0.06)*
5 (0.01)*
2.50 (20)*
2 Ambala 1257
(13.78) 8416
(13.03) 6.70 (14)
385 (4.93)
2735 (4.90)
7.10 (11)
154 (1.11)
640 (0.65)
4.16 (16)
6 (0.17)
30 (0.08)
5.00 (18)
3 Yamunanagar 5419
(59.39) 36708
(56.85) 6.77 (13)
516 (6.60)
1846 (3.31)
3.58 (20)
52 (0.38)
700 (0.71)
13.46 (5)
0 (0.00)
0 (0.00)
0.00 (0)
4 Kurukshetra 430
(4.71) 2154 (3.34)
5.01 (15)
249 (3.19)
510 (0.91)
2.05 (21)
7 (0.05)
125 (0.13)
17.86 (3)
5 (0.14)
60 (0.17)
12.00 (6)
5 Kaithal 1
(0.01) 9
(0.01) 9.00 (12)
135 (1.73)
2000 (3.58)
14.81 (1)
15 (0.11)
300 (0.31)
20.00 (2)
45 (1.26)
700 (1.97)
15.56 (3)
6 Karnal 629
(6.89) 8853
(13.71) 14.07
(3) 686
(8.78) 4167 (7.46)
6.07 (13)
30 (0.22)
428 (0.44)
14.27 (4)
65 (1.82)
753 (2.12)
11.58 (8)
7 Panipat 181
(1.98) 1810 (2.80)
10.00 (4)
348 (4.45)
1870 (3.35)
5.37 (16)
12 (0.09)
348 (0.35)
29.00 (1)
61 (1.71)
680 (1.91)
11.15 (10)
8 Sonepat 91
(1.00) 894
(1.38) 9.82 (5)
623 (7.97)
7896 (14.14)
12.67 (2)
30 (0.22)
224 (0.23)
7.4 7(9)
417 (11.67)
2235 (6.28)
5.36 (17)
9 Rohtak 32
(0.35) 301
(0.47) 9.41 (9)
481 (6.15)
3705 (6.64)
7.70 (9)
26 7(1.93)
1643 (1.67)
6.15 (11)
321 (8.98)
3055 (8.59)
9.52 (13)
10 Jhajjar 8
(0.09) 75
(0.12) 9.38 (10)
495 (6.33)
2813 (5.04)
5.68 (15)
322 (2.33)
1825 (1.86)
5.67 (14)
277 (7.75)
2400 (6.74)
8.6 6(14)
11 Faridabad 25
(0.27) 376
(0.58) 15.04
(2) 353
(4.52) 3611 (6.47)
10.23 (4)
166 (1.20)
1770 (1.80)
10.66 (7)
76 (2.13)
900 (2.53)
11.84 (7)
12 Narnaul 0
(0.00) 0
(0.00) 0.00 (0)
99 (1.27)
810 (1.45)
8.18 (8)
1186 (8.57)
320 (0.33)
0.27 (20)
97 (2.71)
1414 (3.97)
14.58 (4)
13 Rewari 1
(0.01) 9
(0.01) 9.00 (12)
87 (1.11)
555 (0.99)
6.38 (12)
126 (0.91)
425 (0.43)
3.37 (17)
161 (4.50)
1117 (3.14)
6.94 (15)
14 Gurgaon 2
(0.02) 19
(0.03) 9.50 (7)
539 (6.90)
5630 (10.08)
10.45 (3)
253 (1.83)
1483 (1.51)
5.86 (13)
205 (5.74)
4220 (11.86)
20.59 (1)
15 Bhiwani 24
(0.26) 226
(0.35) 9.42 (8)
26 1(3.34)
1245 (2.23)
4.7 7(17)
1314 (9.50)
350 (0.36)
0.27 (20)
202 (5.65)
3200 (8.99)
15.84 (2)
16 Hissar 34
(0.37) 329
(0.51) 9.68 (6)
614 (7.85)
2300 (4.12)
3.75 (19)
1191 (8.61)
7322 (7.45)
6.15 (12)
302 (8.45)
4000 (11.24)
13.25 (5)
17 Fatehabad 3
(0.03) 47
(0.07) 15.67
(1) 359
(4.59) 2711 (4.85)
7.55 (10)
1048 (7.57)
12821 (13.04)
12.23 (6)
198 (5.54)
1950 (5.48)
9.85 (11)
18 Sirsa 0
(0.00) 0
(0.00) 0.00 (0)
282 (3.61)
2716 (4.86)
9.63 (5)
7064 (51.05)
65114 (66.22)
9.22 (8)
302 (8.45)
3475 (9.77)
11.51 (9)
19 Jind 24
(0.26) 226
(0.35) 9.42 (8)
352 (4.50)
3250 (5.82)
9.23 (6)
182 (1.32)
1140 (1.16)
6.26 (10)
271 (7.58)
2605 (7.32)
9.61 (12)
20 Mewat 3
(0.03) 28
(0.04) 9.33 (11)
431 (5.51)
1815 (3.25)
4.2 1(18)
187 (1.35)
505 (0.51)
2.70 (18)
363 (10.16)
1643 (4.62)
4.53 (19)
21 Palwal 1
1(0.12) 0
(0.00) 0.00 (0)
326 (4.17)
1937 (3.47)
5.94 (14)
156 (1.13)
670 (0.68)
4.29 (15)
198 (5.54)
1140 (3.20)
5.76 (16)
Total 9125 (100)
64570 (100) 7.08
7817 (100)
55840 (100) 7
13837 (100)
98333 (100) 7.11
3574 (100)
35582 (100) 10
*Figures in parenthesis indicate percentage share of the district and rank of the district in yield
Source: Ministry of Agriculture, Government of India, New Delhi

62
We begin with potato which is the dominant vegetable crop in Haryana.
Kurukshetra followed by Ambala and Yamunanagar are the leading districts and
together constituted more than 50 per cent of total area in the state. Gurgaon and
Faridabad exhibited marginal share despite having proximity to the Capital city of Delhi.
The share of Kurukshetra in total production of potato in the state is around one third
due to yield advantage. Among the leading districts, Ambala has shown lower
contribution in production in comparison to its share in total acreage because of
relatively lower level of yield. It is essential to mention that only seven districts
experienced yield rates above the state level. It implies that there is a vast scope of
yield improvement in the lagging districts.
In order of importance, tomato is the next vegetable grown in Haryana, Karnal,
Yamunanagar, Mewat and Gurgaon districts are leading producers of tomato and
formed around 50 per cent of total tomato area in the state. On the other hand, Rewari,
Narnaul and Kaithal have shown less than 2 per cent share in the overall area. Again,
four districts namely, Karnal, Yamunanagar, Mewat and Gurgaon contributed around 50
per cent to total tomato production in the state. It is may be pointed out that Bhiwani
attained first rank in productivity. Other two districts with higher productivity were
Kurukshetra and Panchkula.
The pattern of cauliflower area and production is quite different as shown in Table
3.11. There is a clear cut case of geographical concentration. Cauliflower production is
found concentrated primarily in Sonepat, Panipat, and Karnal. These districts
contributed around 35 per cent in area and 38 per cent in total production of cauliflower
in the state Rewari and Mewat reported the lowest share in area and production. Yield
rate of cauliflower was observed highest in Karnal during the year 2009-10.
Cucurbits production is concentrated in Gurgaon with 48.96 per cent contribution
in the state. It is higher than its share in area allocation due to higher level of
productivity. All other districts show relatively lower contribution in area as well as in
production.
63
As shown in Table-3.12, most of the leafy vegetables production is
concentrated in Gurgaon, Kurukshetra, Kaithal, Karnal and Panipat. Each one of them
contributed around 10 per cent in overall area allocation. Gurgaon emerged as
exception by showing almost 6 per cent share in area and around double contribution in
production due to relatively higher yield rates in comparison to other leading districts.
Among lower contributing districts, Sirsa is exemplary where contribution in production
was double than area allocation due to exceptionally high yield rates.
In a nutshell, geographical pattern of area, production and yield of major
vegetable crops grown in Haryana was found quite different. In many cases,
contribution of a particular district varied significantly in area allocation and production.
Pattern of Area, Production and Yield of Major Fruit Crops:
After presenting the pattern of above mentioned indicators for major five
vegetable crops grown in Haryana, we will examine the same for fruit crops. The
criterion adopted for selection of vegetables i.e. at least 10 per cent contribution in the
state in terms of area and production has been also applied in this case. On the basis of
this criterion, we have included four fruits namely, mango, guava, citrus and ber in the
district-wise analysis. This information is presented in Table-3.13.
Mango production is concentrated in Yamunanagar by indicating around 57 per
cent contribution in overall production of the state. Other important districts are Ambala
and Karnal which contributed around 27 per cent. Thus, these three districts together
produced around 84 per cent of mangoes in Haryana. In these cases, share in area
allocation was higher than production except Karnal which contributed almost double in
production due higher yield rates. But, leading districts in productivity were Fatehabad,
Faridabad and Karnal.

64
Next fruit crop in order of importance in terms of production, guava is largely
grown in Karnal, Sonepat, Hissar, Gurgaon, Yamunanagar, Jhajjar and Rohtak. These
districts showed around 50 per cent of overall area allocation in the state. Further,
Sonepat is leading in production despite being second ranking district in terms of area
allocation. It could be possible due to higher level of productivity that is next to Kaithal.
Most of the districts in the state showed less than 5 per cent contribution to the
production of guava in the state.
The pattern of citrus production is quite different as shown in Table-3.12. It is
heavily concentrated in Sirsa district. This district alone contributed 66.22 per cent to
the total production in the state with 51.05 per cent share in area allocation. Fatehabad
and Hissar are also important and these together exhibited around 20 per cent share in
production of the state during 2009-10. It may be noticed that none of these districts is
leading in productivity. Panipat with marginal share in area and production exhibited the
highest productivity which is almost three times in comparison to Sirsa, a leading district
in production and area allocation under citrus crops during 2009-10.

65
Chapter-4
A Comparison of Economics, Price Spread and Marketing Efficiency of Selected Crops under Traditional vis-à-vis Emerging Marketing Channels
Introduction
In the earlier Chapters, we have discussed about the APMC Act and its
implementation in Haryana. This Chapter is devoted to the results of field survey
regarding various aspects related to disposal of tomato and muskmelon through
Traditional Marketing Channel (TMC) and Emerging Marketing Channel (EMC) during
the reference year 2010-11. It is divided into four sections. Section-1 deals with socio-
economic characteristics of selected farmers while Section-2 focuses on economics,
operational cost and labour utilization. Section-3 presents survey results regarding price
spread and marketing efficiency. The perceptions of farmers regarding selection of
marketing channel and other related issues have been discussed in the final section.
Section-1
Socio-economic Characteristics of Sample Households
The issues related to agricultural marketing at the micro level considered for
analysis in this study are complex and cannot be taken up for investigation in isolation
without regard for some of the basic characteristics of the sampled households. We
have included those characteristics that have a definite bearing on production and
marketing decisions of the farmers. Specifically, we will look into demographic details
such as caste, family size, level of education and ownership of assets by the selected
households under TMC and EMC during the year 2010-11. The other major
characteristics such as land owned, leased in, leased out and irrigation status are
covered as important correlates of the main theme.
We begin with presenting the distribution of surveyed households in the selected
categories under TMC and EMC. These are presented in Table 4.1. It is indicated that
marginal and small farmers together constituted 68 and 46% of tomato cultivating
households using TMC and EMC. The medium and large categories formed at least
10% of the sample in each case. The case of muskmelon growers under TMC and EMC
was found different since marginal plus small categories of farm households were
observed around 32 and 44%, respectively. It is evident from these results that nature

66
of tomato and muskmelon cultivation in Haryana was found small farm based like Indian
farming. Further, these results substantiate that involvement of small holders in fruit
and vegetable cultivation was relatively higher due to availability of family labour and
expected higher returns by opting for these crops as alternative to foodgrain crops.
Table-4.1
Distribution of Sampled Farmers by Farm size
(Percentage)
Sl. No.
Classification Tomato Muskmelon
TMC EMC Total TMC EMC Total 1 Marginal (< 1 ha) 52 36 44 20 24 22
2 Small (1-2 ha) 16 10 13 12 20 16
3 Medium (2-4 ha) 14 24 19 22 24 23
4 Large (4 and above) 18 30 24 46 32 39
5 Total 100 100 100 100 100 100 Source: Field survey
If we look at the religion of sampled tomato growers under TMC and EMC
groups, it may be observed that all of them were Hindu. The case of muskmelon
growers was however little different. The muslims formed 16 and 26% of sampled
households in this case. The largest percentage of tomato cultivators belonged to
general category followed by OBC and SC households under TMC as well as EMC. On
the other hand, OBC households were observed 50 and 44% respectively among
surveyed muskmelon cultivators. The sizable proportion of OBC farm households in the
sample implies ownership of land by OBC households in Haryana. Among tomato
cultivators, 96 and 100% TMC and EMC farm households owned a ration card. Of
these, 42 and 50% of households in each group had an APL card during the reference
year. The scenario was almost similar for muskmelon growers since above 90% of
surveyed farm households owned a ration card. However, share of the APL card
holders in the sample was found slightly different.

67
Table 4.2 Socio –Economic Characteristics of Sampled Households-Tomato
Particulars Tomato
TMC EMC A. Religion and Caste of Farm Household
%Hindu households 100.00 100.00
%Muslim households 0.00 0.00
%SC households 54.00 40.00
%ST households 2.00 0.00
%OBC households 22.00 38.00
%Other households 22.00 22.00 B. Household Characteristics
% Of households owning a ration card 96.00 100.00
% Of APL households 42.00 50.00
% Of BPL households 44.00 50.00
% Of households with Pucca Dwelling 100.00 96.00
% Of household with kuccha and semi-kuccha Dwelling 0.00 4.00
% Of households owning telephone (landline) 2.00 4.00
% Of households owning at least one mobile phone 76.00 88.00
% Of households owning a Computer 0.00 6.00
% Of households owning an Internet 0.00 0.00
% Of households owning Internet as well as Computer 0.00 0.00 C. Head of the Household
Average age of the head (years) 42.78 42.06
% Female headed households 0.00 0.00
Years of average education of the head 6.18 7.24 D. Education of the household members (% to total)
Average education of the household members(years) 6.00 6.48
% members upto primary education 18.78 17.98
% members upto matriculate education 34.29 41.23
% members upto graduation education 19.18 16.23
% members with post-graduation 0.00 0.88 E. Transport, Farm and Storage assets
% of households owning Bullock Cart 16.00 20.00
% of households owning Tractor 22.00 36.00
% of households owning Trolly 14.00 18.00
% of households owning Harvester 0.00 0.00
% of households owning Bicycle 60.00 76.00
% of households owning Motorcycle 34.00 48.00
% of households owning Four-wheeler 10.00 12.00
% of households owning Tiller 8.00 6.00
% of households owning Pumpset 34.00 42.00 F. Landholdings
Maximum size of the land holding (ha) 18.00 22.80
Minimum size of the land holding (ha) 0.40 0.40
Median size (ha) 0.81 2.02
% Owned land 100.00 100.00
% Leased-in land 31.79 47.93
% Leased-out land 3.83 2.22
% Farmers with irrigating facility (from Groundwater) 100.00 100.00
Source: Ibid

68
Table 4.3 Socio-Economic Characteristics of Sampled Households – Muskmelon
Particulars Muskmelon
TMC EMC A. Religion and Caste of Farm Household
%Hindu households 84.00 74.00
%Muslim households 16.00 26.00
%SC households 14.00 18.00
%ST households 0.00 0.00
%OBC households 50.00 44.00
%Other households 36.00 38.00 B. Household Characteristics
% Of households owning a ration card 90.00 96.00
% Of APL households 44.00 40.00
% Of BPL households 34.00 44.00
% Of households with Pucca Dwelling 88.00 76.00
% Of household with kuccha and semi-kuccha Dwelling 12.00 24.00
% Of households owning telephone (landline) 12.00 8.00
% Of households owning at least one mobile phone 92.00 82.00
% Of households owning a Computer 10.00 18.00
% Of households owning an Internet 10.00 6.00
% Of households owning Internet as well as Computer 00.00 2.00 C. Head of the Household
Average age of the head (years) 43.44 42.12
% Female headed households 0.00 0.00
Years of average education of the head 7.70 6.5 D. Education of the household members (% to total)
Average education of the household members(years) 5.78 5.04
% members upto primary education 17.20 25.17
% members upto matriculate education 32.97 30.42
% members upto graduation education 16.85 10.84
% members with post-graduation 0.72 1.40 E. Transport, Farm and Storage assets
% of households owning Bullock Cart 30.00 24.00
% of households owning Tractor 54.00 40.00
% of households owning Trolly 48.00 36.00
% of households owning Harvester 6.00 4.00
% of households owning Bicycle 78.00 74.00
% of households owning Motorcycle 76.00 72.00
% of households owning Four-wheeler 16.00 12.00
% of households owning Tiller 8.00 8.00
% of households owning Pumpset 30.00 34.00 F. Landholdings
Maximum size of the land holding (ha) 26.32 26.32
Minimum size of the land holding (ha) 0.40 0.40
Median size (ha) 3.24 2.02
% Owned land 60.34 60.14
% Leased-in land 39.66 39.52
% Leased-out land 0.00 0.00
% Farmers with irrigating facility (from Groundwater) 100.00 100
Source: Ibid

69
The age of the head of the household plays an important role in adoption of
technology and diversification of farming. The average age of the head of household
was around 42-43 years among tomato cultivators. The same was observed in the case
of muskmelon growers under both the channels. The female headed households were
non-existent in the sample. The educational level of head of the household is an
indicator of better organizational set up and efficient use of available farm resources.
Particularly, educational status of the head of the households affects the farm
management techniques which in turn leads towards the optimum use of available farm
resources and accelerates the agricultural production and farm income. Survey results
point out that head of sampled households attended school for less than 10 years in all
cases. This is indicative of overall poor attainment in terms of education by the head of
households.
Education is a catalytic factor in attaining efficiency in managing because higher
level of education provides management skills and capacity to improve and innovate.
Among the selected households, average education of the family members ranged
between 5-6 years in case of tomato as well as muskmelon growers under TMC and
EMC. More than half of the family members attained primary and matriculate level of
education. It is unfortunate that only 19 and 16% family members in both groups of
tomato growing households attained education upto graduation level. In case of
muskmelon growers, proportion of family members with graduation level of education
was around 17 and 11% respectively.
The ownership of house is one of the key determinants of economic status of the
households. The economic standing of a household can be further judged from the type
of the house, they live in and amenities available to them. In our sample, more than 90
per cent had pucca house. Among amenities, mobile phone was found popular. The
share of households occupying a computer and internet was observed low.
Land and other resources influence the level and pattern of farm management in
farm households. We have collected data on major transport, farm and storage assets

70
of the surveyed households. We have earlier discussed about education. Now, we will
focus our attention on assets. These include tube-well, tractor, trolley, harvester,
bicycle, motor-cycle and pumpset. It may be observed that bicycle followed by motor-
cycle, pumpset and tractor were found the major assets owned by the largest
percentage of sampled tomato growers. The similar pattern may be noticed in the case
of muskmelon producers too.
We had also sought information about maximum, minimum and medium size of
land in addition to land owned, leased in, leased out and availability of groundwater
facility. All the tomato cultivators owned land while in case of muskmelon growers, more
than half of the sampled farmers owned land and this proportion ranged around 60%
under TMC and EMC.
Table 4.4 presents the detailed information about the main characteristics of
head of the households surveyed in the selected districts of Haryana. It may be noticed
that average age of the head of households varied between 35 and 50 years in different
categories of the farmers. None of them crossed 55 years and this is true for TMC as
well as EMC tomato and muskmelon growers. It may be further observed that small
farmers among the EMC tomato growers were the youngest while the same category
had the highest age under the TMC group. The same table also provides information
about the average education of head of households. It is unfortunate that there are
instances of attending education for less than five years that is below primary level and
inadequate for innovative farming. When different categories are compared in this
regard, large farmers were found better equipped in terms of education. TMC farmers
growing tomato attended school for ten years and that was found highest among all
categories. A look at the average size of family of selected categories of farmers reveals
that average size of family was around five members. However, it was eight members
for small muskmelon producers in TMC group.

71
Table 4.4
Age, Education and Main Occupation of Head of the Sampled Households Sl. No. Characteristics
Tomato Muskmelon
A Average Age of Head TMC EMC Total TMC EMC Total 1 Marginal 42.42 42.00 42.25 37.90 38.67 38.32
2 Small 50.25 35.00 44.38 36.67 36.50 36.56
3 Medium 36.72 40.50 39.11 45.55 43.08 44.26
4 Large 41.89 45.73 44.29 46.61 47.50 46.97
B Average Education of Head (Years)
1 Marginal 5.62 5.33 5.50 7.90 5.50 6.59
2 Small 4.13 8.60 5.85 6.83 7.10 7.00
3 Medium 5.71 7.58 6.89 7.91 3.83 5.78
4 Large 10.00 8.80 9.25 7.74 8.88 8.21 C Average Family Size ( No.) 1 Marginal 4.92 4.33 4.68 4.40 4.67 4.55
2 Small 4.75 5.40 5.00 7.67 5.40 6.25
3 Medium 4.86 4.58 4.68 5.27 5.08 5.17
4 Large 5.00 4.53 4.71 5.70 7.19 6.31 D Main Occupation (% to total) 1 Marginal a Agriculture 100.00 100.00 100.00 90.00 100.00 95.45
b Allied 0.00 0.00 0.00 10.00 0.00 4.55
c Others 0.00 0.00 0.00 0.00 0.00 0.00 2 Small a Agriculture 100.00 80.00 92.31 100.00 90.00 93.75
b Allied 0.00 20.00 7.69 0.00 10.00 0.00
c Others 0.00 0.00 0.00 0.00 0.00 6.25 3 Medium a Agriculture 100.00 100.00 100.00 90.90 83.33 86.96
b Allied 0.00 0.00 0.00 9.09 0.00 0.00
c Others 0.00 0.00 0.00 0.00 16.67 13.04 4 Large a Agriculture 100.00 93.33 95.83 86.96 87.50 87.18
b Allied 0.00 0.00 4.17 4.35 6.25 5.13
c Others 0.00 6.67 0.00 8.69 6.25 7.69 5 Total a Agriculture 100.00 96.00 98.00 90.00 90.00 90.00 b Allied 0.00 2.00 1.00 6.00 2.00 3.00
c Others 0.00 2.00 1.00 4.00 8.00 7.00 Source: Ibid

72
We had also sought information about the main occupation of the head of the
sampled households. The occupation has been divided into agriculture, allied and
others. It may be noticed from Table 4.4 that all marginal farmers except TMC
muskmelon growers showed agriculture as the main occupation. The record of head of
small farm households with agriculture as the main occupation was slightly better. As a
result, around 20 and 10% respectively among EMC tomato and muskmelon growers
indicated allied activities as the main occupation. The medium and large farmers also
had very high proportion of heads with agriculture as main occupation. The involvement
of large sampled farmers in allied activities was 4 and 5% respectively. At the aggregate
level also, most of the head of surveyed households were again in agriculture. Allied
activities and other occupations constituted a small proportion among tomato and
muskmelon growers.
Land Holding Pattern and Irrigation Status
Land details are important because they indicate the economic and social status
of the farmer. The details of land owned and operated by tomato and muskmelon
growers and their tenancy status are presented in Table 4.5.
We begin with average size of operational holding which is an important factor in
augmenting agricultural income, marketable surplus and for adoption of improved farm
management practices. The average size of holding for tomato growers as well as
muskmelon producers was around 3 and 5 hectares. TMC households operated 2.34
hectares and 5.85 hectares respectively while EMC farm households operated around 4
and 5 hectares. The overall net operated area by tomato and muskmelon growers was
mostly 3 and 5 hectares respectively during the reference year.
The tenancy status of the farmer is an important factor in determining his
involvement in agriculture. In our sample, large majority were owner cultivators. A
fraction of cultivated land was found leased in and leased out. The system of leasing in
was found common among EMC tomato growers. The TMC tomato growers also leased

73
in on an average nearly 1 ha of land. The system of leasing in was also prevalent
among muskmelon growers and they leased in around 2 ha of area. The leasing out of
land was not found popular among the sampled farmers. It was totally non-existent
among muskmelon growers. However, tomato growers leased out a negligible area.
Table 4.5
Area Owned, Leased-in, Leased-out and Irrigation Status of Sampled Farms (ha)
Land Details
Tomato Muskmelon
TMC EMC Total TMC EMC Total
Total Owned Land
Dry Land 0.00 0.00 0.00 0.00 0.00 0.00
Pumpset Irrigated 1.21 0.86 1.03 1.68 2.59 2.13
Electric Tubewell Irrigated 0.43 1.14 0.78 1.92 0.27 1.09
Total Irrigated 1.63 2.00 1.82 3.60 2.86 3.23
Total Land 1.63 2.00 1.82 3.60 2.86 3.23
Leased-in land
Dry Land 0.00 0.00 0.00 0.00 0.00 0.00
Pumpset Irrigated 0.52 1.38 0.95 0.96 1.31 1.13
Electric Tubewell Irrigated 0.29 0.54 0.41 1.30 0.57 0.94
Total Irrigated 0.81 1.92 1.36 2.26 1.88 2.07
Total Land 0.81 1.92 1.36 2.26 1.88 2.07
Leased-out land
Dry Land 0.00 0.00 0.00 0.00 0.00 0.00
Pumpset Irrigated 0.08 0.01 0.04 0.00 0.00 0.00
Electric Tubewell Irrigated 0.02 0.08 0.05 0.00 0.00 0.00
Total Irrigated 0.10 0.09 0.09 0.00 0.00 0.00
Total Land 0.10 0.09 0.09 0.00 0.00 0.00
Net Operated Land
Dry Land 0.00 0.00 0.00 0.00 0.00 0.00
Pumpset Irrigated 1.72 2.23 1.94 2.63 3.90 3.27
Electric Tubewell Irrigated 0.71 1.60 1.15 3.22 0.83 2.03
Total Irrigated 2.34 3.83 3.09 5.85 4.74 5.30
Total Land 2.34 3.83 3.09 5.85 4.74 5.30
Average size of Land Holding
Own Land 1.63 2.00 1.82 3.60 2.86 3.23
Net operated Land 2.34 3.83 3.09 5.85 4.74 5.30
%NIA to NCA 100 100 100 100 100 100
Source: Ibid

74
The status of irrigation of farms plays an important role in productivity per unit of
land. The entire land operated by the sampled farmers was found irrigated. We had
also sought information about source of irrigation during our survey. It may be observed
from the table that share of pumpset irrigated land was observed higher in owned,
leased in as well as leased out land.
Table 4.6
Source of Irrigation of Owned, Leased-in, Leased-out Land on Sampled Farms (ha)
Source: Ibid
Next Table 4.6 provides information regarding proportion of land irrigated by
pumpsets and electric tubewells in land owned, leased in, leased out and net operated.
Land Details
Tomato Muskmelon
TMC EMC Total TMC EMC Total
Owned Land
Pumpset Irrigated 1.21
(73.57) 0.86
(42.91) 1.03
(56.91) 1.68
(46.67) 2.59
(90.56) 2.13
(66.26)
Electric Tubewell Irrigated 0.43
(25.92) 1.14
(57.09) 0.78
(43.28) 1.92
(53.33) 0.27
(9.44) 1.09
(33.95)
Total Irrigated 1.74
(100.00) 2.00 (100)
1.81 (100.00)
3.60 (100.00)
2.86 (100.00)
3.22 (100.00)
Leased-in land
Pumpset Irrigated 0.52
(64.20) 1.38
(71.88) 0.95
(69.85) 0.96
(42.48) 1.31
(69.68) 1.13
(54.59)
Electric Tubewell Irrigated 0.29
(35.80) 0.54
(28.12) 0.41
(30.15) 1.30
(57.52) 0.57
(30.32) 0.94
(45.41)
Total Irrigated 0.81
(100.00) 1.92
(100.00) 1.36
(100.00) 2.26
(100.00) 1.88
(100.00) 2.07
(100.00)
Leased-out land
Pumpset Irrigated 0.08
(80.00) 0.01
(11.11) 0.04
(44.44) 0.00
(0.00) 0.00
(0.00) 0.00
(0.00)
Electric Tubewell Irrigated 0.02
(20.00) 0.08
(88.89) 0.05
(55.56) 0.00
(0.00) 0.00
(0.00) 0.00
(0.00)
Total Irrigated 0.10
(100.00) 0.09
(100.00) 0.09
(100.00) 0.00
(0.00) 0.00
(0.00) 0.00
(0.00)
Net Operated Land
Pumpset Irrigated 1.72
(70.78) 2.23
(58.22) 1.94
(62.78) 2.63
(44.96) 3.90
(82.51) 3.27
(61.70)
Electric Tubewell Irrigated 0.71
(29.22) 1.60
(41.78) 1.15
(37.22) 3.22
(55.04) 0.83
(17.63) 2.03
(38.30)
Total Irrigated 2.43
(100.00) 3.83
(100.00) 3.09
(100.00) 5.85
(100.00) 4.73
(100.00) 5.30
(100.00)

75
It may be observed that owned land of TMC tomato growers was largely irrigated by
pumpsets. Only 26% of the owned land was irrigated by electric tubewells. The case of
EMC tomato growers was different since around 57% of area was irrigated by electric
tubewells. At the aggregate level of tomato growers, once again irrigated area by
pumpsets was more than 50%. The irrigation status of owned land by the TMC
muskmelon growers showed that irrigated area by pumpsets was lesser than electric
tubewells while vice versa was observed in case of EMC muskmelon growers. The
share of owned land irrigated by pumpsets was as high as 91%. At the aggregate level
of muskmelon growers, share of owned land irrigated by pumpsets was observed
around two third during the reference year. The source of irrigation regarding leased in
and leased out land was found mixed. The irrigated area by pumpsets was found
relatively higher for tomato as well as muskmelon growers. Further, source of irrigation
in case of leased out land was mixed and share of area irrigated by pumpsets and
electric tubewells was 44 and 56% respectively.
Results of table show that more than 60% of net operated land of tomato and
muskmelon growers was irrigated by pumpsets and the remaining share of land was
irrigated by electric tubewells.
Cropping Pattern:
Crop pattern signifies proportion of cultivated area under different crops at a point
of time. Crop pattern of an area depends on soil, water and temperature. There are
two important harvests in Haryana. Crops are grown mainly in two seasons kharif and
rabi. With adequate availability of irrigation facility, river beds are most suitable for the
cultivation of summer season crops grown between April to July. Farmers’ decisions to
grow a particular crop during a season are mostly based on profitability, resource
availability and own requirement for consumption, payment in kind and feeding the
livestock.

76
Since one of our main objectives is to assess the cost of cultivation and revenue
generated from vegetable and fruit crops, it is pertinent to examine cropping pattern
adopted by the sample households. The information about the crop pattern of sampled
TMC and EMC tomato and muskmelon growers for the year 2010-11 was collected
during the survey. These results are presented in Tables 4.7.
According to survey, crop pattern of tomato and muskmelon growers was
dominated by paddy and wheat. These crops occupied 30.86 and 31.12 per cent of
GCA. In case of TMC and EMC tomato growers, these proportions were found 38.25
and 26.3 per cent of GCA devoted to paddy in case of TMC & EMC muskmelon
cultivators.
In case of tomato cultivators, other crops were also grown by the sampled
farmers. Share of other crops such as sugarcane (2.78 %), mustard (2.78 %), pea (2.12
%),bajra (1.45 %) and jowar (1.57%) was found below 3 per cent of GCA. Among
vegetable crops, tomato was found dominant crop in rabi (6.21 %) and summer season
(5.38 %). Muskmelon occupied 1.57 per cent of GCA at the aggregate level. Muskmelon
growers also devoted some area to other crops such as pea (5.90%), sugarcane
(2.05%), mustard ((1.74%) jowar (1.70%), bajra (1.52%), vegetables and other minor
crops. Under vegetable crops, tomato was dominant crop in rabi (3.03 per cent) and
summer season (0.85 per cent). The muskmelon was grown on 12.56 per cent of GCA.
Section-2
Economics of Selected Crops
Horticulture has emerged as a core sector in agriculture passing through the
various phases with coverage of nearly 22.25 million ha in 2011-12, encompassing a
wide variety of crops, vegetables, root and tuber crops, medicinal and aromatic plants,
etc. Within horticulture, vegetables are most important in terms of area and production.
These occupied 8.49 million ha and produced of 149.61 million tones. The yield was

77
17.42 tonnes per ha. The area under vegetables in India has increased from 6 million
ha in 2001-02 to 8.49 million ha during 2011-12. India is the second largest producer of
vegetables after China. Besides, India occupied the third position in tomato production
in the world. Interventions in horticulture such as the National Horticulture Mission
(NHM) in the country, have led to increased per capita availability of vegetables from
279 gms/day /capita in 2005 to 316gms/day/capita in 2011. Vegetables also play an
important role in the regional as well as national economy of the agricultural sector.
These crops are generally of short duration hence, more than one crop can be raised on
the basis of early, medium and late varieties.
Tomato:
Tomato (Lycopersicon esculentum Mill.) is one of the popular vegetables
worldwide. Tomato has its origin in the South American Andes. It contributes to a
healthy and well balanced diet. It is rich in minerals, vitamins, essential amino acids,
sugar and dietary fibers. It is an excellent source of vitamin ‘C’ and also called as a
‘poor man’s orange’. Tomato fruits are consumed fresh in salads or cooked in sauces,
soup and meat or fish preparation. It can be processed into puree, juice and ketchup.
Canned and dried tomatoes are economical in lean season when prices are higher.
Tomato contains the carotene lycopene that is the most powerful natural antioxidants.
Tomato requires a relatively cool, dry climate for higher yield and premium quality.
However, it is adapted to a wide range of climatic conditions from temperate to hot and
humid to tropical. The optimum temperature for most varieties of tomato lies between 21
and 24 0C. The plants can survive a wide range of temperature, but plant tissues are
damaged below 10 0C and above 38 0C. Tomato grows well on fertile soils that have
proper water holding capacity, aeration and are free of salt. The deep, well drained,
sandy loam soils and moderately tolerant to a wide range of pH (level of acidity) are
preferred, but grows well in soils with a pH of 5.5-6.8 with adequate nutrient supply and
availability.

78
In India, tomato has wider coverage in comparison to other vegetables. Among
vegetables, tomato is one of the most popular vegetable grown all over the world. The
production of tomato in India was 16826 MT and percentage of total vegetable
production was 11.5 during the year 2010-11.
Area under tomato cultivation in Haryana was about 22606 ha and produced
379828 tonnes. To meet the higher demand of tomato, it is necessary to increase
production. This can only be achieved by increasing productivity per unit of area as well
as increasing area cultivated under tomato cultivation.
Economics of Tomato Cultivation:
Profitability of various crops is the most important determinant of
production of agricultural commodities governing the behavior of producers. Farmers
grow crops, which offer the highest returns per unit of the scarcest resources such as
land and dearer inputs. Profitability being a catalytic factor in increased production of
agricultural commodities; it is proposed to examine the same for the selected two
horticultural crops (tomato and muskmelon) produced and marketed through TMC and
EMC by the sampled farmers in Haryana. Results presented in Table 4.8 reveal that
operational costs of tomato cultivation for sample farmers under TMC was higher than
that for those in EMC. The cost of human labour was the most important item of
expenditure in both cases. It was observed around 40 and 43 per cent respectively.
The second important item of variable cost was manure and fertilizers in both the cases
(24.19 and 25.73 per cent) followed by insecticides (12.38 and 11.14 per cent), seed
(10.21 and 8.22 per cent) and irrigation expenditure (4.90 and 4.68 per cent). It may be
observed that operational cost for TMC tomato growers was Rs 52335 per hectare while
in case of EMC, it was Rs 48082 per hectare. The cost of labour including the imputed
value of family labour was around 40 per cent of the operational cost and thus,
constituted the largest item of cost under TMC and EMC.

79
Table 4.7
Cropping Pattern of the Sampled Farm Households (Area in ha)
Season/Crop
Tomato Muskmelon
TMC % EMC % Total % TMC % EMC % Total %
Kharif Per
Farm
Per Farm
Per
Farm
Per Farm
Per
Farm
Per Farm
Paddy 2.01 38.25 2.30 26.36 2.15 30.86 3.48 28.62 3.64 33.95 3.56 31.12
Brinjal 0.19 3.62 0.37 4.23 0.28 4.00 0.24 1.97 0.13 1.21 0.18 1.61
Sugarcane 0.17 3.23 0.22 2.51 0.19 2.78 0.47 3.87 0.00 0.00 0.23 2.05
Jowar 0.15 2.85 0.07 0.79 0.11 1.57 0.15 1.20 0.24 2.27 0.19 1.70
Pumpkin 0.02 0.46 0.10 1.16 0.06 0.90 0.17 1.43 0.21 1.97 0.19 1.68
Bajra 0.00 0.00 0.20 2.32 0.10 1.45 0.19 1.60 0.15 1.44 0.17 1.52
Maize 0.00 0.00 0.11 1.30 0.06 0.81 0.08 0.63 0.01 0.08 0.04 0.37
Bittergourd 0.00 0.08 0.04 0.46 0.02 0.32 0.05 0.40 0.08 0.76 0.06 0.57
Radish 0.03 0.62 0.14 1.63 0.09 1.25 0.07 0.60 0.03 0.30 0.05 0.46
Okra 0.01 0.15 0.11 1.21 0.06 0.81 0.04 0.33 0.06 0.53 0.05 0.43
Cucumber 0.01 0.15 0.05 0.60 0.03 0.44 0.00 0.00 0.06 0.60 0.03 0.28
Spongegourd 0.00 0.00 0.07 0.84 0.04 0.52 0.00 0.00 0.04 0.38 0.02 0.18
Turnip 0.01 0.15 0.04 0.46 0.02 0.35 0.02 0.13 0.00 0.00 0.01 0.07
Others 0.02 0.31 0.09 1.02 0.05 0.75 0.02 0.20 0.06 0.53 0.04 0.35
Rabi
Wheat 1.10 20.86 2.11 24.26 1.61 23.00 2.25 18.49 2.53 23.59 2.39 20.88
Pea 0.09 1.69 0.21 2.37 0.15 2.12 0.68 5.56 0.67 6.28 0.67 5.90
Mustard 0.11 2.00 0.28 3.25 0.19 2.78 0.33 2.73 0.06 0.60 0.20 1.74
Potato 0.05 0.92 0.17 1.95 0.11 1.57 0.38 3.17 0.13 1.21 0.26 2.25
Cauliflower 0.21 3.93 0.40 4.56 0.30 4.32 0.36 3.00 0.21 1.97 0.29 2.51
Tomato 0.72 13.70 0.15 1.67 0.43 6.21 0.06 0.50 0.63 5.90 0.35 3.03
Carrot 0.03 0.54 0.05 0.60 0.04 0.58 0.11 0.93 0.00 0.00 0.06 0.50
Radish 0.04 0.77 0.14 1.58 0.09 1.28 0.13 1.07 0.06 0.60 0.10 0.85
Barseem 0.01 0.15 0.10 1.12 0.05 0.75 0.07 0.60 0.11 0.98 0.09 0.78
Bottlegourd 0.00 0.00 0.02 0.19 0.01 0.12 0.08 0.67 0.03 0.30 0.06 0.50
Brinjal 0.00 0.00 0.04 0.46 0.02 0.29 0.03 0.27 0.02 0.23 0.03 0.25
Cucumber 0.00 0.00 0.08 0.93 0.04 0.58 0.06 0.47 0.02 0.15 0.04 0.32
Barley 0.00 0.00 0.06 0.65 0.03 0.41 0.00 0.00 0.04 0.38 0.02 0.18
Capsicum 0.00 0.00 0.02 0.19 0.01 0.12 0.02 0.20 0.00 0.00 0.01 0.11
Coriander 0.00 0.00 0.01 0.09 0.00 0.06 0.06 0.47 0.00 0.00 0.03 0.25
Others 0.00 0.00 0.02 0.19 0.01 0.12 0.27 2.20 0.07 0.68 0.17 1.49
Zaid
Muskmelon 0.08 1.54 0.14 1.58 0.11 1.57 1.85 15.26 1.02 9.49 1.44 12.56
Cucumber 0.20 3.85 0.06 0.74 0.13 1.91 0.02 0.13 0.05 0.45 0.03 0.28
Tomato 0.00 0.00 0.75 8.62 0.38 5.38 0.15 1.20 0.05 0.45 0.10 0.85
Bottlegourd 0.00 0.00 0.00 0.00 0.00 0.00 0.13 1.07 0.12 1.13 0.13 1.10
Others 0.01 0.15 0.01 0.09 0.01 0.12 0.12 1.00 0.17 1.59 0.15 1.28
GCA 5.26 100.00 8.71 100.00 6.98 100.00 12.15 100.00 10.71 100.00 11.43 100.00
Cropping Intensity
215.78 227.19 221.48 207.47 226.07 215.78
Source: Ibid

80
Table 4.8
Operational Cost and Net Returns from Cultivation of Tomato
on Sampled Farms in Haryana
(Rs/ha)
Source: Ibid
Item TMC EMC
I. Operational cost
Family labour
7972
(15.23)
9246
(19.23)
Hired Labour
13196
(25.21)
11273
(23.45)
Total Human Labour
21168
(40.44)
20519
(42.68)
Machine Labour
3301
(6.31)
2917
(6.07)
Seed
5343
(10.21)
3952
(8.22)
Manure
5257
(10.04)
5111
(10.63)
Fertilizers
7405
(14.15)
7262
(15.10)
Insecticides
6481
(12.38)
5358
(11.14)
Irrigation
2563
(4.90)
2248
(4.68)
Interest on Working Capital
816
(1.56)
715
(1.49)
Operational Costs
52335
(100.00)
48082
(100.00)
II. Returns
Gross Returns 154624 171130
Net Return at Operational
Cost 102289 123048
Yield (qtl/ha) 302 314
Price Rs. per qtl 512 545

81
The Gross Returns from tomato cultivation were Rs 154624 per hectare in case
of TMC and Rs 171130 per hectare in case of EMC. After deducting the operational
cost, net returns were found higher in case of EMC. These tomato growers earned Rs.
123048 in comparison to Rs. 102289 per hectare by the TMC. This could be attributed
to the negligible level of market functionaries and higher market price. It may be noted
that marketing costs need not be incurred by farmers who sell tomato through EMC.
The net price received by farmers who sold tomato under TMC was Rs. 512 per quintal
whereas in case of EMC, it was Rs. 545 per quintal. The productivity of tomato was 302
quintal/hectare in case of TMC while it was 314 quintal/ hectare in case of EMC.
These findings show that farmers selling tomatos through the emerging
marketing channel, the Reliance Fresh in our case during the year 2010-11 realised
higher price in comparison the farmers who sold tomato through the traditional
marketing channel. The productivity of tomatos was also found higher on their farms.
Thus, higher prices and better yield together helped EMC tomato producers in realizing
better incomes per unit of land.
Utilization of Human Labour:
Tomato cultivation generated 112 days/ha and 107 days/ha in case of TMC and
EMC farmers. The share of hired labour was observed higher than family labour under
both cases. In the family labour, male labour contributed 22 days/ha against 19 days/ha
by female labour for TMC. The EMC farmers utilized higher number of days with a large
proportion of male family labour. On the other hand, female labour contributed higher
number of days in hired labour in comparison to male labour. We have also assessed
cost of labour. The family labour was imputed on the prevailing wage rate in the
selected villages. The pattern of cost of human labour in cultivation of tomato coincided
with labour utilization.

82
Table 4.9
Labour Utilization by Sampled Farmers for Cultivation of Tomato
SL.
No. Labour
Tomato
TMC EMC
I No. of Labour (days/ha)
A Family Labour
1 Male 22 29
2 Female 19 19
3 Total Family Labour 41 48
% to Total labour 36.61 44.86
B Hired Labour
1 Male 32 27
2 Female 39 32
3 Total Hired Labour 71 59
% to Total labour 63.39 55.14
C Total Labour
1 Male 54 56
2 Female 58 51
3 Total Labour 112 107
II Cost of Labour (Rs/ha)
A Family Labour
1 Male 4497 5718
2 Female 3475 3528
3 Total Family Labour Cost 7972 9246
% to Total labour Cost 37.66 45.06
B Hired Labour
1 Male 6307 5455
2 Female 6889 5818
3 Total Hired Labour Cost 13196 11273
% to Total labour Cost 62.34 54.94
C Total Labour
1 Male 10804 11173
2 Female 10364 9346
3 Total Labour Cost 21168 20519
Source: Ibid

83
Muskmelon:
Muskmelon (Cucumis melo) is a native to hot valleys of southwest Asia. It is
grown in the tropical regions for a very long time. This is a warm season crop and
sensitive to cold temperatures and requires a fairly long growing season from seed to
marketable fruit. Muskmelon is widely known as ‘Cantaloupe’. It is round with firm,
orange moderately sweet flesh and a thin reticulated light brown rind. Muskmelon is
primarily cultivated in India, in the summer season from April to July. During the ripening
period, the best quality melons are produced when hot, dry conditions prevail.
Muskmelon being an annual plant is cultivated from the seeds. The plants have to be
watered lightly. The melons are easily grown in sandy and light soil. The dry river beds
are the most suitable. Manure and fertilizers are essential for a healthy growth and
better production.
There are numerous health benefits of muskmelon. Its juice is effective in
conditions like lack of appetite, weight loss, urinary tract infection, consumption, acidity
and ulcer. It is a good source of vitamin A, B and C. Muskmelon is rich in potassium, a
nutrient that may help control blood pressure, regulate heart beat and possibly prevent
strokes.
Economics of Muskmelon:
The pattern of cost incurred and returns accrued to the sample farmers from
cultivation of muskmelon are presented in Table 4.10. It may be observed that labour
cost constituted higher share of operational cost in both cases of farmers selling through
TMC and EMC. In order of importance, second and third components were manure and
fertilizers (20.53 and 28.23 per cent) and seed (18.45 and 19.64 per cent). In addition,
insecticides constituted 12.76 and 9.95 per cent while irrigation cost formed 9.10 and
10.14 per cent of the total operational cost at the aggregate level.

84
The Gross Returns for farmers selling through EMC were found higher i.e.
(Rs.206080 per hectare) in comparison to TMC growers (Rs.173689). Also, net returns
at operational cost were higher in case of EMC because price received was higher.
Further, TMC cultivators sold muskmelon at Rs. 601 per quintal whereas in case of
EMC, it was Rs 640 per quintal. It may be observed that price realized by the farmers
who sold produce through EMC is higher by 6.5 per cent in comparison to price realized
by farmers who sold through TMC. This is reasonable because the sale price in EMC is
higher mainly due to superior quality produce purchased by the Reliance Fresh.
Utilization of Human Labour:
We have observed that human labour was found an important component in cost
structure of muskmelon cultivation. The TMC and EMC muskmelon growers utilized 94
and 74 days per hectare during the production process. Further, share of female labour
was observed higher in case of TMC farmers and vice-versa was observed for EMC
farmers. The proportion of hired labour was more than double in both the groups. The
results regarding utilization of female labour were noticed mixed across different groups.

85
Table 4.10
Operational Cost and Net Returns from Cultivation of Muskmelon on
Sampled Farms in Haryana (Rs/ha)
Source: Ibid
Item TMC EMC
I. Operational cost
Family labour
3405
(6.10)
3645
(6.49)
Hired Labour
13178
(23.61)
10332
(18.40)
Total Human Labour
16583
(29.72)
13977
(24.90)
Machine Labour
4313
(7.73)
3043
(5.42)
Seed
10296
(18.45)
11028
(19.64)
Manure
3755
(6.73)
7585
(13.51)
Fertilizers
7695
(13.79)
8267
(14.72)
Insecticides
7119
(12.76)
5584
(9.95)
Irrigation
5079
(9.10)
5692
(10.14)
Interest on Working Capital
964
(1.73)
966
(1.72)
Operational Costs
55804
(100.00)
56142
(100.00)
II. Returns
Gross Returns 173689 206080
Net Return at Operational Cost 117885 149938
Yield (qtl/ha) 289 322
Price Rs per qtl 601 640

86
Table 4.11
Labour Utilization by Sampled Farmers for Cultivation of Muskmelon
Source: Ibid
SL. No. Labour
Muskmelon
TMC EMC
I No. of Labour (days/ha)
A Family Labour
1 Male 9 11
2 Female 8 8
3 Total Family Labour 18 19
% to Total labour 19.15 25.68
B Hired Labour
1 Male 24 29
2 Female 52 26
3 Total Hired Labour 76 55
% to Total labour 80.85 74.32
C Total Labour
1 Male 34 40
2 Female 60 34
3 Total Labour 94 74
II Cost of Labour (Rs/ha)
A Family Labour
1 Male 1874 2221
2 Female 1531 1424
3 Total Family Labour Cost 3405 3645
% to Total labour Cost 20.53 26.08
B Hired Labour
1 Male 4971 6017
2 Female 8207 4315
3 Total Hired Labour Cost 13178 10332
% to Total labour Cost 79.47 73.92
C Total Labour
1 Male 6845 8239
2 Female 9738 5739
3 Total Labour Cost 16583 13978

87
Section-3
Price Spread and Marketing Efficiency of Tomato and Muskmelon
This section presents the survey results regarding price spread and marketing
efficiency of selected crops disposed off through TMC and EMC during the reference
year.
The efficiency of marketing for fruit and vegetable crops in India has been of
significant concern in the recent years. Poor efficiency in the marketing and inadequate
marketing infrastructure are believed to be the cause of not only high and fluctuating
consumer prices, but also a reason for reaching lower share of the consumers’ rupee to
the farmer. Indian farmers depend heavily on middleman particularly in fruit and
vegetable marketing. The producers and consumers often get a poor deal and the
middleman controls the market without adding any value. There is also massive
wastage, deterioration in quality as well as frequent mismatch between demand and
supply both spatially and over time.
Marketing channels are routes through which agricultural commodities move
from point of production to the ultimate consumer. The length of the channel for fruit and
vegetable crops varies from commodity to commodity, depending on quantity to be
moved, consumer demand and degree of regional specialization in production. In rural
areas and small towns, many producers perform as retail sellers too. Sometimes,
producers directly sell their produce to the wholesalers or processing firms. In the
marketing of agricultural commodities, price spread which refers to the difference
between price paid by the consumer and price received by the producer per unit of a
commodity has always been a serious concern. It is generally believed that
intermediaries enjoy an undue share of the consumers’ rupee which ultimately affects
the margin of the producer and welfare of the consumer.

88
Tomato:
Marketing of horticultural crops is quite complex and risky due to perishable
nature of the produce, seasonal production and bulkiness. The spectrum of price from
producer to consumer, which is an outcome of demand and supply of transactions
between various intermediaries at different levels in the marketing system, is also
unique for fruits and vegetables. Moreover, marketing arrangements at different stages
also play an important role in price levels at various stages viz. from farm gate to the
ultimate consumer. These features make the marketing system of fruits and vegetables
different from other
TMC EMC
1 2 1
Producer
Commission
Agent/Trader
Wholesaler
Retailer
Consumer
Producer
Commission
Agent/Trader
Retailer
Consumer
Producer
Reliance Fresh
CC/Consumer
agricultural commodities, particularly in terms of time, form and space. The producers
share in consumers’ rupee is comparatively lower for perishable crops due to a variety
of factors such as number of intermediaries, cost of various market functions rendered
by intermediaries and spread of location of the producers and consumers. Further,
degree of perishability, variety, quality, market imperfections, market infrastructure, etc.
also influence marketing cost and price. Normally, producers’ share is observed to be
89
relatively higher in areas where infrastructure facilities for marketing are available. The
costs incurred by producer in the marketing of tomato were observed commission,
market fee, loading/unloading and transport charges. Table 4.12 presents breakup of
various items of cost in total marketing cost of the tomato. These shares are based on
prices recorded in the field survey. The TMC tomato producers sold the produce at
Rs.512/quintal while EMC cultivators sold produce at Rs.545/quintal to the Reliance
Fresh. The Reliance Fresh has established Collection Center (CC) at the village level
and purchased farm produce directly from the farmers after sorting and grading.
Electronic balance is used for weightment and farmers are made payment next day.
The purchased produce is sent to distribution centers through refrigerated vans. The
survey results show that marketing cost borne by TMC farmers was Rs. 77.5/quintal
whereas it was less than half (Rs.34.7/quintal) for EMC farmers. It is due to the fact that
marketing cost in case of EMC was borne by the Reliance Fresh. Often, farmers harvest
crop and sell the produce directly to the Reliance Fresh. The average margin at the
farmer level has been estimated Rs. 217.31/quintal and Rs. 358.5/quintal for TMC and
EMC farmers. The farmer’s ultimate margin is Rs 332.70/ quintal for TMC and Rs
388.05 for EMC. It is worth mentioning that farmer’s margin was higher in case of sale
through EMC compared to TMC due to the absence of market functionaries.

90
Table 4.12 Sampled Farmers Margin in Marketing of Tomato in Haryana
Particulars Tomato
TMC EMC A. Quantum Transacted Production / quintal 302 314 Price paid for purchase (Rs./qtl) from farmer in specified market 512 545 B. Marketing Costs (Rs./qtl) Packing, grading and assembling 32 26 Loading and Unloading 8.25 3.5 Transport 16.25 5.2 Commission Charges 14.5 - Storage - - Mandi Tax - - Development Cess - - Weighing Costs and other expenses 6.5 - Brokerage Expenses - - Other Fees - - Total 77.5 34.7 C. Disposal (qtls) Quantum (Marketable) 302 314 Quantity sold in Specified Market 291.77 306.92 Quantity sold elsewhere 2.27 4.44 Any other Disposal (Wastage in marketing) 7.47 2.18 Total 294.04 311.36 D.Sale Quantity sold in Specified Market (qtls) 291.77 306.92 Price in specified market (Rs./qtl) 512 545 Sales in Specified market (Rs.) 149386.24 167271.4 Quantity sold elsewhere (qtl) 2.27 4.44 Price elsewhere (Rs./qtl) 342 368 Sales elsewhere (Rs./qtl) 776.34 1633.92 Total Farmers Sales (TFS) 150162.58 168905.32 Post Harvest Losses (% of production) 12 10 E.Cost per quintal (Rs) Marketing Costs (Rs./qtl) 77.5 34.7 Production Costs (Rs./qtl) 173.29 153.12
Farmers Costs (Rs./qtl) 250.79 187.82
F. Returns (Rs)
Total Sales 150162.58 168905.32
Total Costs 52335 48082
Average Farmers Price (AFP) 486.0 535.0
Marketing Cost as % of AFP 15.95 7.14

91
Contd…Table-4.12
Marketing Cost as % of TFS 15.95 7.14
Average Farmer Margin (AFM) Rs./qtl 217.31 358.5
Marketing Cost per quintal 77.5 34.7
Marketing Cost as % of AFP 15.95 7.14
Quantity Sold in specified market (qtls) 291.77 306.92
Price at which it was sold (Rs./qtl sold) 512 545
Total Sales 150162.58 168905.32
Total Farmer costs 52335 48082
Margin of the Farmer (Rs.) 97828 120824
Margin per qtl sold (Rs.) 332.70 388.05 Source: Ibid
The results of assessment of the producer’s share and overall margins of
different groups are indicated in Table 4.13. The producer’s share in consumer’s rupee
was observed 48.93 per cent for farmers selling through TMC and 39.63 per cent in
case of EMC. The share of producer in consumer’s price was computed for
intermediaries such as commission agent, wholesaler and retailer). All these items
together received about 42.76 per cent in case of TMC farmers. The RF received 57.08
per cent as a cost transacted for assembling, sorting, grading, transportation and other
marketing costs and its own margin. The share of marketing cost in consumer’s price
was 8.31 per cent for the TMC farmers in comparison to 3.29 per cent for the EMC
farmers.
Table 4.13
Producer’s Share and Price Spread of Tomato (in Rs./qtl)
Sl No. Particulars
TMC EMC
Amount % Amount %
1 Producers' Share 512 48.93 545 39.63
2 Commission Agent 166.60 15.92
785 57.08 3 Wholesalers margin 142.30 13.60
4 Retailer margin 138.50 13.24
5 Total Cost of Marketing 87.00 8.31 45.2 3.29
6 Consumers Rupee 1046.40 100.00 1375.20 100.00 Source: Ibid

92
Marketing Efficiency:
Tomato:
The marketing efficiency was examined in terms of the price difference,
marketing costs and margin for tomato crop. Therefore, marketing costs and margin
have been expressed as percentage to the price difference. In case of present study,
marketing efficiency was calculated by using the formula of Acharya (2011).
Table 4.14 indicates marketing efficiency of tomato for farmers selling through
TMC and EMC. It may be noted that ratio of marketing efficiency was 0.96 for TMC
farmers whereas it was observed 0.66 for EMC farmers. Thus, marketing efficiency was
found better in case of emerging marketing channel that is Reliance Fresh in our case.
Table 4.14
Marketing Efficiency of Tomato
Source: Ibid
Muskmelon:
After analyzing various aspects of marketing of tomato, now we look at the same
for the second selected crop (muskmelon). Table 4.15 provides the details of quantum
transacted, marketing cost, disposal, sale, cost per quintal and returns for TMC and
Sl. No. Particulars TMC EMC
1 Retailers Sale Price or Consumer Purchase Price (RP) in Rs/qtl 1046.40 1375.2
2 Total Marketing Cost (MC) in Rs/qtl 87.00 45.2
3 Total Net Margin of Intermediaries (MM) in Rs/qtl 447.40 785
4 Net Price Received by Farmers (FP) in Rs/qtl 512.5 545
5 Value Added (1-4) in Rs/qtl 534.00 830.2
MME (Modified Measure of Market Efficiency) Ratio 0.96 0.66

93
EMC farmers. Various costs that are incurred in the marketing of muskmelon are
transport, loading/unloading, market fee and commission. Table 4.15 provides the
breakup of various items of the cost in the total marketing cost of the selected fruit crop.
The results show that farmer’s margin for muskmelon sold was Rs.404 per quintal for
TMC and Rs.461 per quintal for EMC during reference year. Further, average farmer’s
margin in case of TMC was estimated around Rs.149 per quintal whereas the same
was Rs.221 per quintal in case of EMC cultivators. The difference in margin of the
producer is due to negligible level of the market functionaries in case of EMC as
compared to TMC.
The details of disposal indicated that TMC muskmelon growers sold more than
90 per cent of their produce in the traditional market and negligible amount was sold
elsewhere. Similarly, EMC growers sold more than 95 per cent of their produce to the
Reliance Fresh (RF). The wastage ranged between 1 and 2 per cent under both the
channels. The price differential was around 7 per cent. The prices received by the
farmers were observed higher under the EMC in comparison to TMC. It is essential to
mention here that the EMC (RF) purchased only quality produce. A minor sum was
deducted from the offered price under the EMC.
In addition, we have analysed returns in the same table that indicates that
marketing cost of total farmer’s sale (TFS) was 12.14 in case of TMC and 10.12 per
cent in case of EMC. It may be noticed that unsold produce was nil under both the
channels.
To sum up, farmers received a higher price (around 6 per cent) by selling
muskmelon to the RF. But, this difference appears to be very low in view of the fact that
RF purchased muskmelon directly from the farmers without involving several
functionaries. Also, only quality produce is purchased and bad quality was rejected
during sorting and grading. Thus, benefits received by the farmers from sale of produce
to the RF were found limited. It implies that a larger share of margins accrued after
shortening the chain was enjoyed by the RF.

94
Table 4.15 Sampled Farmers Margin in Marketing of Muskmelon in Haryana
Particulars
Muskmelon
TMC EMC
A. Quantum Transacted
Production / quintal 289 322
Price paid for purchase (Rs./qtl) from farmer in specified market 601 640
B. Marketing Costs (Rs./qtl)
Packing, grading and assembling 38.5 44
Loading and Unloading Costs 10.5 4.5
Transport 22.75 15.6
Commission Charges -
Storage - -
Mandi Tax - -
Development Cess - -
Weighing Costs and other expenses -
Brokerage Expenses - -
Other Fees paid specify bribes to market comm. Members -
Total 71.75 64.1
C. Disposal (qtls)
Quantum (Marketable) 289 322
Quantity sold in Specified Market 282.64 315.63
Quantity sold elsewhere 2.18 4.76
Any other Disposal (Wastage in marketing, etc may add rows) 2.27 2.31
Total Quantum Sold 284.82 320.39
D. Sale
Quantity sold in Specified Market (qtls) 282.64 315.63
Price in specified market (Rs./qtl) 601 640
Sales in Specified market (Rs.) 169866.64 202003.2
Quantity sold elsewhere (qtl) 2.18 4.76
Price elsewhere (Rs./qtl) 420 410
Sales elsewhere (Rs./qtl) 915.6 1951.6
Total Farmers Sales (TFS) 170782.24 203954.8
Post Harvest Losses (% of production) 8 7
E. Cost per quintals (Rs)
Marketing Costs (Rs./qtl) 71.75 64.1
Production Costs (Rs./qtl) 193.09 174.35
Total per quintal Farmers Costs 264.84 238.45
F. Returns (Rs)
Total Sales 170782.24 203954.8

95
Contd…Table-4.15
Total Farmers Costs 55804 56142
Average Farmers Price (AFP) 590.9 633.4
Marketing Cost as % of AFP 12.14 10.12
Marketing Cost as % of TFS 12.14 10.12
Average Farmer Margin (AFM) Rs./qtl 149.2 221.19
Marketing Cost as % of AFP 12.14 10.12
Quantity Sold in specified market (qtls) 282.64 315.63
Price at which it was sold (Rs./qtl sold) 601 640
Total Sales 170782.24 203954.8
Total Farmer costs 55804 56142
Margin of the Farmer (Rs.) 114978 147813
Margin per qtl sold (Rs.) 404 461 Source: Ibid
Producer’s Share and Price Spread of Muskmelon:
The results of the estimation of the producer’s share and various components of
price spread of muskmelon in selected households shown in Table 4.16 indicate that
producer’s share in consumer’s rupee was greater in case of TMC than EMC. It is
around 44 and 42 per cent for both the channels. It implies that producers are not
benefited significantly by selling produce to the EMC that is Reliance Fresh in our case.
According to Table, share of other intermediaries such as commission agent,
wholesaler, etc. was 15.48 and 12.87 per cent, respectively. The retailer enjoyed the
highest share (19.13 per cent) under TMC. Under the EMC retailer received 52.61 per
cent of the consumer’s rupee. We have already mentioned that price received by the
farmer through the sale to RF was Rs 640 against Rs 601/ quintal under the TMC. The
total cost of marketing was 8.39 and 5.56 per cent of the consumer’s rupee under both
the channels.
Next, we present our results regarding marketing efficiency of muskmelon for the
TMC and EMC producers. It may be noted from Table 4.17 that marketing efficiency

96
was found better under the emerging marketing channel. The ratio was 0.79 and 0.72
under TMC and EMC. This finding suggests that marketing efficiency in the case of
perishable agriculture commodities can be improved if farmers opt for emerging
marketing channels.
Table 4.16
Producer’s Share and Price Spread of Muskmelon (Rs./qtl)
Source: Ibid
Table 4.17
Marketing Efficiency of Muskmelon Sl. No. Particulars TMC EMC
1 Retailers Sale Price or Consumer Purchase Price (RP) in Rs/qtl 1361.68 1530.00
2 Total Marketing Cost (MC) in Rs/qtl 114.20 85.00
3 Total Net Margin of Intermediaries (MM) in Rs/qtl 646.48 805.00
4 Net Price Received by Farmers (FP) in Rs/qtl 601.00 640.00
5 Value Added (1-4) in Rs/qtl 760.68 890.00
MME (Modified Measure of Market Efficiency) Ratio 0.79 0.72 Source: Ibid
Sl. No. Particulars
TMC EMC
Amount % Amount %
1 Producers' Share 601.00 44.14 640.00 41.83
2 Commission Agent 210.80 15.48
3 Wholesalers margin 175.23 12.87 805.00 52.61
4 Retailer margin 260.45 19.13
5 Total Cost of Marketing 114.20 8.39 85.00 5.56
6 Consumers Rupee 1361.68 100.00 1530.00 100.00

97
Post Harvest Losses:
The post harvest losses assume special significance in case of horticultural crops
due to their perishable nature. We had also enquired from farmers during the survey
about the loss of produce. Table 4.12 indicates that post harvest losses were 12 and 10
per cent of the produce for tomato. The proportion of losses was found relatively low in
case of muskmelon and ranged between 8 and 7 per cent for farmers selling through
TMC and EMC.
Section-4
Perceptions of Farmers on Marketing of Tomato and Muskmelon
In the previous section, various issues related to the marketing of tomato and
muskmelon sold through TMC and EMC were discussed. For a deeper understanding of
this phenomenon, perceptions of farmers about marketing of these crops at the grass
root level should be known and understood. In order to capture this aspect, some
questions were included as opinion survey in the questionnaire and related queries
have been answered on this basis. This section focuses on the perceptions of sampled
farmers about marketing of tomato and muskmelon in the selected districts of Haryana.
A variety of price and non-price factors influence farmers’ decision regarding sale
of produce through a particular marketing channel. Table 4.18 presents reasons for
preferring a specific marketing channel. In case of TMC tomato growers, superior
service, infrastructure, higher price and habit played a major role in decision making.
These factors were also noticed equally important in case of TMC tomato cultivators.
The reasons for preferring a particular channel for sale by muskmelon growers were
also found more or less the same.

98
Table 4.18
Reasons for Preferring a Marketing Channel
Sl. No.
Particulars (% to total responses)
Tomato Muskmelon TMC EMC TMC EMC
1 Habit 12.92 13.08 15.74 15.45
2 Influences of friends, relatives, neighbors
4.58 1.27 2.98 0.41
3 Assured sales 8.33 8.44 6.81 7.32
4 Higher/Fair price 15.00 12.66 10.21 12.60
5 Low cost of Marketing 5.42 7.59 7.66 6.10
6 Less physical loss 0.42 0.00 1.28 0.41
7 Proximity 11.67 14.77 10.21 14.23
8 Logistic Support 4.58 5.91 6.38 6.91
9 Access to Inputs 0.00 0.42 0.85 0.00
10 Hidden cost/bribes in alternative channel 0.00 0.00 0.43 0.00
11 Longer waiting time and formalities in alternative channel
0.00 0.42 0.00 0.00
12 Superior services 19.17 20.68 20.43 19.92
13 Infrastructure 17.92 14.77 17.02 16.67 Source: Ibid
The expected price of the produce is the most important determinant in selection
of marketing channel. We have presented percentage of total responses regarding
source, time, difference and time of price agreement. It is amply clear that commission
agents/traders followed by other farmers were the important sources of price
information. Majority of the farmers reported that price information was received at the
time of harvest and sale. We had also enquired during the survey about provision of
price information by AG market. More than 95% of respondents reported in negative.
Majority of them mentioned that price agreement was carried out at the time of sale that
was similar to expected price (Table 4.19).
Table 4.20 indicates that majority of the tomato and muskmelon growers opted
for the merchant/agency with higher confidence and satisfaction in addition to good
record. Farmers were offered agreed price and payment was made without several
visits. However, they pointed out about the quality conflict in case of TMC as well as
EMC irrespective of the crop.

99
Table 4.19
Details about Price Information
Sl. No.
Particulars
% to total responses
Tomato Muskmelon
TMC EMC TMC EMC
A Source of price information
1 Personal information 6.00 0.00 12.00 14.00
2 Discussion with other farmers 34.00 38.00 30.00 44.00
3
Discussion with Commission
Agents/Traders 58.00 62.00 58.00 42.00
4 Discussion with e-choupal agent 2.00 0.00 0.00 0.00
B Time of Price Information
1 At the time of the harvest 84.00 98.00 90.00 96.00
2 After one month of the harvest 16.00 2.00 10.00 4.00
3 > 1 month of he harvest and < 3 months 0.00 0.00 0.00 0.00
4 3 or 4 months after the harvest 0.00 0.00 0.00 0.00
C Price information from AGMARKNET
1 No 100.00 96.00 98.00 100.00
2 Yes 0.00 4.00 2.00 0.00
D Time of Price Information
1 At the time of sale 100.00 98.00 94.00 90.00
2 Number of Days before sale 0.00 2.00 6.00 10.00
E Differences in Price Information
1 Lower than expected 0.00 0.00 8.00 2.00
2 Similar to what excepted 100.00 100.00 90.00 96.00
3 Higher than expected 0.00 0.00 2.00 2.00
F Time of Price Agreement
1 At the time of sale 86.00 100.00 72.00 56.00
2 By previous agreement 14.00 0.00 8.00 6.00
Source: Ibid

100
Table 4.20 Transaction Cost-Enforcement Cost
Sl. No.
Particulars
(% responses to total)
Tomato Muskmelon
TMC EMC TMC EMC
A Difference between Agreed price and Sale price
1 Less 0.00 2.00 0.00 2.00
2 Same 100.00 88.00 100.00 98.00
3 A bit more 0.00 10.00 0.00 0.00
B No. of visits to merchant to receive payment
1 Nil 98.00 88.00 84.00 86.00
2 Several times 2.00 12.00 8.00 8.00
C Merchant Record
1 Bad 2.00 0.00 0.00 0.00
2 Satisfactory 50.00 32.00 50.00 46.00
3 Good 46.00 68.00 50.00 54.00
D Receipt for Sales of the produce
1 No 40.00 8.00 32.00 14.00
2 Yes 60.00 92.00 68.00 86.00
E Conflict on quality
1 Yes 90.00 94.00 82.00 94.00
2 No 10.00 6.00 12.00 4.00
F Any other Conflicts - - - -
G Whether resolved - - - -
H Confidence in the merchant
1 Low 22.00 2.00 18.00 14.00
2 High 78.00 98.00 76.00 86.00 Source: Ibid
We have already mentioned that most of the sampled tomato and muskmelon
growers opted for a marketing channel with higher confidence providing the agreed
price. The perceptions of the farmers about provision of loan facility by the
agency/commission agent also influenced their preference in addition to price factor. It
is reported in Table 4.21 that percentage of selected farmers availing loan facility was
low in case of EMC muskmelon growers while it was noticed 12 and 16% respectively in
the case of tomato cultivators. The primary sources of loan were banks followed by
cooperatives. These loans were availed for saving the crops and for purchasing farm
machinery. Some default cases were also reported in the case of tomato growers. None
of the muskmelon growers was found a defaulter. The reasons attributed for default by
the farmers included poor production and extra interest charged by the lenders.

101
Table 4.21
Perceptions of Farmers on Services provided by Different Agencies
Sl. No. Particulars
Tomato Muskmelon TMC EMC TMC EMC
A Taken any Loan(% to selected households) 12.00 16.00 4.00 2.00
B Source of loan
Money Lender 0.00 0.00 0.00 0.00
Bank 83.33 87.50 100.00 100.00
Cooperatives 16.67 12.50 0.00 0.00
Friends/Relatives 0.00 0.00 0.00 0.00
Self Help Groups 0.00 0.00 0.00 0.00
Buyer of the produce 0.00 0.00 0.00 0.00
Others 0.00 0.00 0.00 0.00
C Purpose of Loan
Crop Loan 83.33 100.00 100.00 100.00
For Purchase of Farm Machinery 16.67 0.00 0.00 0.00
D Reasons for taking loan from buyer 0.00 0.00 0.00 0.00
E No. of times loan taken from the buyer in last 5 years - - - -
F Total amount of loan taken from the buyer in 2009-10 - - - -
G Default of loan taken
Yes 16.67 37.50 0.00 0.00
No 83.33 62.50 100.00 100.00
H Source of loan for default loan
Money Lender 0.00 0.00 0.00 0.00
Bank 100.00 25.00 0.00 0.00
Cooperatives 0.00 12.50 0.00 0.00
Friends/Relatives 0.00 0.00 0.00 0.00
Self Help Groups 0.00 0.00 0.00 0.00
Buyer of the produce 0.00 0.00 0.00 0.00
Others 0.00 0.00 0.00 0.00
I Reasons for default
Poor production 100.00 66.67 0.00 0.00
Extra interest charges 0.00 33.33 0.00 0.00 Source: Ibid
In the next table (4.21), we have pointed out that only 2% of the selected TMC
tomato farmers received advance inputs in terms of seed during the reference year. It
implies that majority of the respondents did not have any access to inputs from the
buyers of the produce.
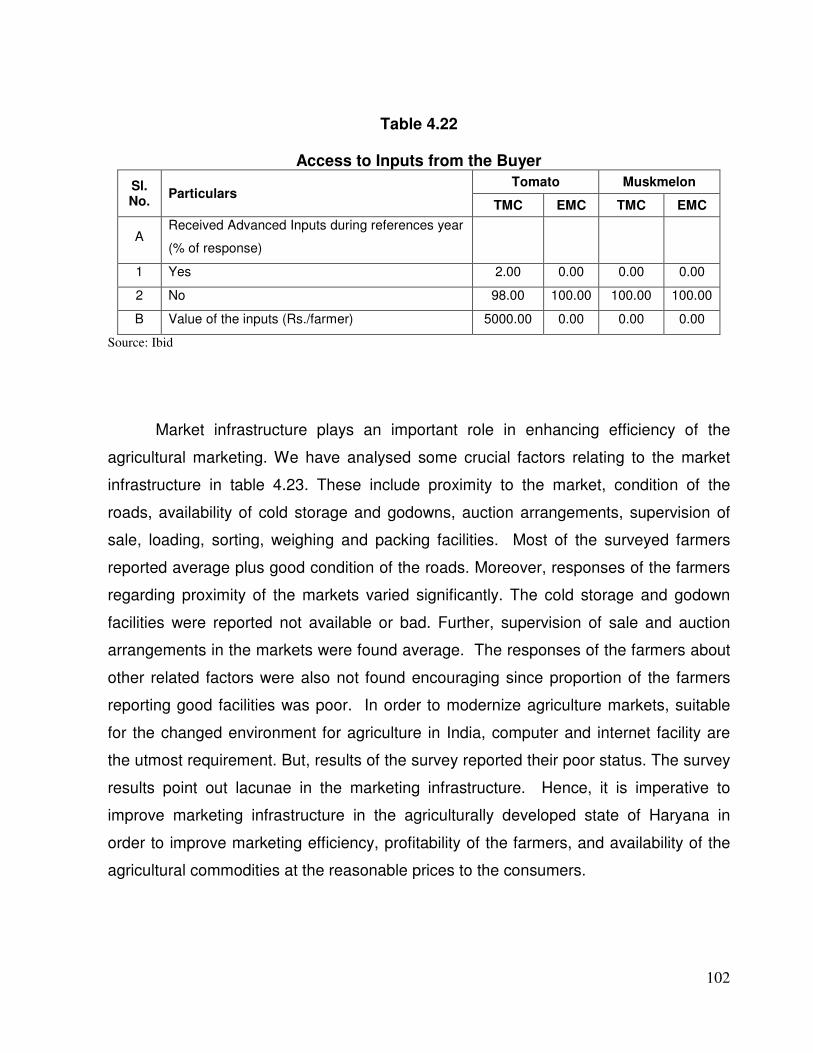
102
Table 4.22
Access to Inputs from the Buyer
Sl. No.
Particulars Tomato Muskmelon
TMC EMC TMC EMC
A Received Advanced Inputs during references year
(% of response)
1 Yes 2.00 0.00 0.00 0.00
2 No 98.00 100.00 100.00 100.00
B Value of the inputs (Rs./farmer) 5000.00 0.00 0.00 0.00
Source: Ibid
Market infrastructure plays an important role in enhancing efficiency of the
agricultural marketing. We have analysed some crucial factors relating to the market
infrastructure in table 4.23. These include proximity to the market, condition of the
roads, availability of cold storage and godowns, auction arrangements, supervision of
sale, loading, sorting, weighing and packing facilities. Most of the surveyed farmers
reported average plus good condition of the roads. Moreover, responses of the farmers
regarding proximity of the markets varied significantly. The cold storage and godown
facilities were reported not available or bad. Further, supervision of sale and auction
arrangements in the markets were found average. The responses of the farmers about
other related factors were also not found encouraging since proportion of the farmers
reporting good facilities was poor. In order to modernize agriculture markets, suitable
for the changed environment for agriculture in India, computer and internet facility are
the utmost requirement. But, results of the survey reported their poor status. The survey
results point out lacunae in the marketing infrastructure. Hence, it is imperative to
improve marketing infrastructure in the agriculturally developed state of Haryana in
order to improve marketing efficiency, profitability of the farmers, and availability of the
agricultural commodities at the reasonable prices to the consumers.

103
Table 4.23 Perceptions about the Market Infrastructure
Sl. No.
Particulars % to total selected household
Tomato Muskmelon TMC EMC TMC EMC
1 Condition of the road to market I Bad 0.00 12.00 14.00 18.00 Ii Average 54.00 28.00 44.00 36.00 Iii Good 46.00 60.00 42.00 46.00 2 Proximity of market i Within the village 6.00 0.00 0.00 8.00 ii Within 10 kms 34.00 90.00 28.00 50.00 iii Between 10 to 25 kms 2.00 4.00 32.00 32.00 iv > 25 kms<50 kms 4.00 2.00 14.00 10.00 v >50 kms 54.00 4.00 26.00 0.00 3 Go-down facilities i Not available 84.00 14.00 60.00 58.00 ii Bad 0.00 28.00 20.00 24.00 iii Average 8.00 4.00 18.00 14.00 iv Good 8.00 54.00 2.00 4.00 4 Cold storage i Not available 0.00 72.00 86.00 88.00 ii Bad 88.00 14.00 10.00 4.00 iii Average 6.00 12.00 4.00 8.00 iv Good 6.00 2.00 0.00 0.00 5 Auction arrangement (Open) i Bad 18.00 42.00 24.00 26.00 ii Average 68.00 58.00 64.00 72.00 iii Good 14.00 0.00 12.00 2.00 6 Supervision of sale i Bad 6.00 10.00 2.00 4.00 ii Average 76.00 54.00 84.00 82.00 iii Good 18.00 36.00 14.00 14.00 7 Loading facilities i Bad 16.00 12.00 18.00 14.00 ii Average 62.00 52.00 66.00 66.00 iii Good 22.00 36.00 16.00 20.00 8 Sorting facilities i Bad 60.00 36.00 28.00 22.00 ii Average 20.00 52.00 50.00 68.00 iii Good 20.00 12.00 22.00 10.00 9 Weighing facilities i Bad 12.00 0.00 8.00 6.00 ii Average 46.00 30.00 34.00 38.00 iii Good 42.00 70.00 58.00 56.00 10 Packing facilities

104
Contd…Table-4.23 i Bad 14.00 50.00 42.00 62.00
ii Average 64.00 32.00 34.00 16.00 iii Good 22.00 18.00 24.00 22.00
11 Internal Telephone 0.00 0.00 i Bad 8.00 18.00 16.00 16.00 ii Average 60.00 50.00 56.00 62.00 iii Good 32.00 32.00 28.00 22.00 12 Banking facilities i Bad 58.00 64.00 68.00 60.00 ii Average 40.00 32.00 28.00 40.00 iii Good 2.00 4.00 0.00 0.00 13 Computer facilities i Bad 38.00 46.00 46.00 50.00 ii Average 16.00 22.00 36.00 28.00 iii Good 2.00 16.00 0.00 8.00 iv Not available 44.00 16.00 18.00 14.00 14 Internet i Bad 30.00 50.00 46.00 56.00 ii Average 0.00 20.00 18.00 20.00 iii Good 2.00 0.00 0.00 2.00 iv Not available 68.00 30.00 36.00 22.00
Source: Ibid

105
Chapter-5
Summary and Conclusions
This chapter aims to present the main findings of the study and to draw policy
implications. This study is a departure from earlier literature in terms of its focus on
issues related to Emerging Marketing Channel (EMC) vis-à-vis Traditional Marketing
Channel (TMC). The main objective of this research is to the examine the comparative
operational cost, returns, price spread and marketing efficiency for selected two crops,
tomato and muskmelon sold through TMC and EMC. Further, it seeks to highlight status
of the APMC Act at the all India and Haryana levels. In addition, we have tried to assess
human labour used in cultivation of tomato and muskmelon by the selected groups.
After the initiation of economic reforms during the early nineties and WTO
agreement in mid nineties, scenario for agricultural marketing has changed significantly
in the country. The entry of corporate in the retail of fresh fruits and vegetables has
opened new channels in the marketing. These channels are competing with the
traditional marketing channels. Under these channels, fruits and vegetables are directly
sourced from the farmers and payments are made for the quality produce. This reduces
supply chain. It is expected that Emerging Marketing Channels (EMCs) will bring
improved quality and better after sales services and will be beneficial to the consumers
as well as producers Although information related to these aspects is useful for the
future policy prescriptions, evidences on these aspects are scant in literature . The
present study was planned to bridge this gap.
5.1 Objectives:
We have selected two horticultural crops for in-depth study. In view of immense
potential of horticulture in India due to varied agro climatic conditions, it is imperative to
point out the benefits of selling horticulture produce through traditional and emerging
marketing channels. The research input on the related issues is an urgent need to draw
in future course for the development of this sector through innovative models. In order

106
to achieve this objective, the study seeks to analyse the related issues. The specific
objectives of the study are as under:
(i) to determine share of the farmer in consumer’s rupee in an emerging marketing
channel vis-a-vis traditional marketing channel;
(ii) to compute the degree of marketing efficiency and incidence of post harvest
losses in emerging marketing channel vis-à-vis traditional marketing channel;
(iii) to analyse the market practices and services of agencies involved in the
emerging marketing channel and observe if they are superior to that of traditional
channel;
(iv) to indicate constraints faced by farmers and different market functionaries in the
emerging marketing channel as compared to the traditional marketing channel.
This study was conducted in the state of Haryana. It is based on macro and
micro level data. The relevant information for the state and district level analysis was
obtained from various issues of the Statistical Abstract of Haryana, Government of
Haryana, Panchkula. The required preliminary information regarding the agricultural
marketing in Haryana was obtained from the officials of the Haryana State Agricultural
Marketing Board, Panchkula.
The scope of the study is confined to two horticultural crops i.e. one vegetable
(tomato) and one fruit (muskmelon). Three districts namely, Gurgaon, Sonepat and
Kurukshetra with the presence of Traditional Marketing Channel (TMC) and Emerging
Marketing Channel (EMC) were selected for in-depth study. The Reliance Fresh was
selected as Emerging Market Channel. A questionnaire was canvassed to the farmers
selling produce through these channels. An effort was made to cover all farm size
categories in the sample. These were divided into marginal (less than one hectare)
small (1-2 hectares), medium (2-4 hectares), and large (more than 4 hectares). The
primary data pertaining to the year 2010-11 were collected from 200 farmers (100 TMC
+ 100 EMC). In addition, 5 intermediaries, 5 retailers and 5 consumers were canvassed
a questionnaire to understand their perspective. In view of the main objective of the

107
study, it was found necessary to compare, cost, economics of the selected crops and
benefits of Emerging Marketing Channel to the farmers.
The study is analytical in nature and therefore, simple measures such as
percentages, shares and compound growth rates have been utilized to derive results.
The methodology followed for each aspect is different. For measuring the growth rates
of area, production and yield of fruit and vegetable crops at the all India and state level
for available period, the semi-log equation of the form log y = a + bt was used. The
marketing efficiency is computed by using the formula given by Acharya, (2011).
Now, we present main findings of the study:
5.2 Main Findings
(i) Macro Scenario of APMC Act:
All India Scenario
India has an Agricultural Produce Marketing Regulation Act (APMRA) in which
every regulated market has a market committee where farmers, traders, commission
agents, local bodies and the state government are represented. Prices are fixed through
an open auction in a transparent manner in front of an official of the auction committee.
The main criticism of regulated markets is that they do not reduce long chain of
intermediaries between farmer and consumer, which adds to the cost of agricultural
commodities to consumers on the one hand, and decreases returns for farmers on the
other.
Agricultural commodities are produced in specific parts of the country depending
upon topography and climatic conditions, while the demand for the same spreads
across India. Hence, there is a need to move agricultural produce from specific supply
centers to various consumption centers in the country in fastest possible way at the
minimum cost in order to ensure supply of quality produce to consumers at affordable

108
price. Under the present system, marketable surplus of one area moves out to
consumption centers through a network of middlemen and traders and institutional
agencies. Thus, there exists national level market though there is no national level
regulation for the same. This has prevented development of an efficient and cost
effective national market. In order to control price inflation at retail and effective control
and regulation of the supply chain of sensitive commodities across the state boundary is
essential. Marketing cost constitutes a major chunk of consumer’s price, which needs to
be reduced.
Over the last sixty years, growth in the agriculture sector in India had been
phenomenal but agricultural marketing sector could not keep pace with the changing
pattern of production, distribution, processing and retail marketing. So far, robust
common national market for agricultural commodities could not take shape and a strong
need is being felt to facilitate such development through a central intervention. This is
presently being tried to be achieved in a limited manner by making the amendments in
State APMC laws on the basis of the Model Rules, 2007 circulated by the Central
Government, but some states are hesitant to amend their Marketing Regulations.
So far, six states (Andhra Pradesh, Rajasthan, Maharashtra, Orissa, Himachal
Pradesh and Karnataka) have framed the APMC Rules for implementing the provisions
of their respective state APMC Act. Three states, viz Madhya Pradesh, Haryana and
Mizoram have partially framed the rules. Haryana has notified the Rules for contract
farming only while Mizoram has notified the rule of single point levy of market fee.
Madhya Pradesh has framed the rules for direct marketing/special license for more than
one market and contract farming only. Unless the corresponding APMC. Rules are
framed and notified, various provisions of the APMC Act cannot be operationalised in
the state and the market reforms may remain unrealized. Some of the states have
imposed restrictions which are not provided in Model APMC Rules such as states of
Andhra Pradesh, Maharashtra and Karnataka prescribing minimum investment
requirement for setting up of private markets and states of Gujarat, Orissa and
Karnataka providing for minimum distance criteria for private markets from existing

109
APMCs. In Gujarat, minimum distance requirement is 5 kms while in Orissa, it is 1 km.
In Karnataka, such restriction is for Bengaluru only for foodgrains, pulses, spices, etc,
and private markets handling these commodities would not be established within the
radius of 25 kms from the existing market. The other restrictions are compulsory
registration of contract farming, short validity of licenses for private mandies (H.P.). The
states of Assam, Gujarat, Madhya Pradesh, Haryana and Uttrakhand have not notified
the APMC rules. Those states have already notified the APMC rules for review and
make the provision in conformity with the Model Rules. Hence, it is urgent to align the
APMC Rules keeping in mind the Model Rules.
State Level Scenario:
The Royal Commission on Agriculture (1928) pointed out that there was no
common yardstick to measure the quality of produce, the weights and measures were
un-standardized and the private market operators exploited the farmers. It
recommended the enactment of market legislation to curb rampant malpractices and
realize better returns. In that context, the Haryana state being a part of undivided,
Punjab enacted the Punjab Agriculture Produce Markets Act, 1939. This act was further
amended in 1961 and is operational in the state. Under this act, all the markets of the
state have been regulated. According to the Model Rules of the Government of India,
2007, Haryana state has so far made provision for the contract farming in the Act. The
transactions in the traditional markets are conducted under set rules on regulations. A
large number of market committees were set up by the state government to supervise
the functioning of agricultural produce markets. The Haryana State Agricultural
Marketing Board was established in 1969 under this market Act to guide and supervise
farmers with the aim of better and efficient marketing of agricultural produce.
Haryana has unevenly spread net work of regulated markets across the districts.
The highest number of regulated markets was observed in Karnal district while Jhajjar,
Faridabad and Rewari districts have shown as low as two markets each. The
110
information on average number of villages served per regulated market has revealed
that in Rewari, each regulated market covered 200 villages that is too high. It implies
that most of the farmers have to carry their agricultural produce for sale far off to the
regulated market which increased cost of transport, wastage of energy and time. The
primary objective of the Board was to set up a modern integrated marketing
infrastructure, improve accessibility to the markets and to provide the farmers with
opportunities to achieve better value for their produce.
In addition, state of Haryana has taken up a number of steps for marketing,
export of fruits, flowers and vegetables. These crops are highly perishable. For
interstate domestic marketing and export, these require quality produce and use of Post
Harvest Management infrastructure for bulk storage. In this direction, state government
has taken several initiatives to improve the scenario:
(ii) Socio-Economic Characteristics of Sampled Districts and Households
For better understanding of the agricultural marketing, one has to look into main
indicators related to population and workers, agricultural development and infrastructural
development at the district level.
Sampled Districts:
(i) The total population of Sonepat, Kurukshetra and Gurgaon districts was 1279,
825 and 871 thousand persons during 2001. Surprisingly, 74 per cent population
in Kurukshetra is rural based. Education, although a catalytic factor in
development has exhibited poor performance in rural areas of all the selected
districts. The share of agricultural workers in total workers in selected districts
was between 40 and 53 per cent. The share of non-agricultural workers in
Gurgaon and Kurukshetra was more than 50 per cent. It seems that growing
work opportunities in these districts benefited rural population. The composition
of workers in farm and non-farm sectors was markedly different. Gurgaon has
shown around 60 per cent workers engaged in the non-farm sector. On the

111
contrary, Sonepat has exhibited 47% of the work force involved in this sector.
Thus, Gurgaon is much ahead of Sonepat and Kurukshetra in rural non-farm
employment.
(ii) A comparison of important indicators of agricultural development reveals wide
disparities across the selected districts. The irrigation status, yield rates of
important crops, input use were analysed to gauge the disparities. Out of the
selected districts, Sonepat appeared to be much ahead in agricultural
development than Gurgaon and Kurukshetra.
(iii) The infrastructural development of selected districts was distinctively different.
Although Gurgaon is the most important industrial and commercial centre near
the capital city of Delhi, is not found rich in infrastructure like roads.
Sampled Farmers
For better understanding of the agricultural marketing through traditional and
emerging marketing channels, we have looked into main indicators related to population
and workers, educational status of the head of households, farm size, nature of land
ownership, cropping pattern and sources of irrigation, farm assets. The efficiency and
success of farming is influenced to a significant degree by the socio-economic
background of the households. In addition, these characteristics influence adoption of
improved technology and marketing behavior. The average size of the family of selected
farm households was 5 and 6 persons for tomato and muskmelon growers. There was
no correlation between farm size and average size of family. The literacy rate of the
selected families was not found to be impressive, however large farm households
indicated higher level of literacy. These farmers owned a variety of farm assets.
Tractors followed by pumpsets were the major assets owned by these families.
The nature of land ownership influences crop pattern, adoption of technology and
innovation. At the aggregate level, average land owned by selected tomato and

112
muskmelon growers was 1.82 and 3.23 hectares. The practice of leasing-in land was
common but rarely land was leased out. Like the state, cropping intensity was found to
be higher in each group. It was found to be the highest in the case of EMC tomato
growers. The main sources of irrigation were pumpsets and electric tubewells. In kharif
season, paddy and vegetables were the main crops while rabi season was dominated
by wheat, vegetables and mustard. The area under tomato and muskmelon cultivation
was 6.21 per cent and 12.56 per cent of GCA on sampled farms. Variations across TMC
and EMC sampled households were found significant. Further, TMC tomato cultivators
devoted the highest share of GCA to this crop.
(iii) Economics of Selected Crops and Labour Absorption
The impact of the Emerging Marketing Channel (EMC) in Haryana on net returns
per hectare was assessed through a comparison with the Traditional Marketing Channel
(TMC) of tomato and muskmelon grown by the surveyed farmers during 2010-11.
Results of sampled survey pointed out that gross returns per hectare for sampled EMC
tomato and muskmelon growers were found to be higher than farmers opting for TMC
during the reference year and this was true for net returns as well. This was on account
of higher yield and better price realized by the EMC farmers.
Variations were common in gross returns and net returns per hectare. In case of
tomato, net returns were Rs. 123048 for EMC farmers against Rs. 102289 for TMC
farmers. The yield variation was around 12 qtl/ha. The difference in price realized was
Rs. 33 per qtl. The scenario for muskmelon growers was also found the same and EMC
farmers realized better yield and prices.
In the cost structure, human labour has emerged as component accounting for
about 40 per cent of the total operational cost in case of TMC and EMC tomato
cultivators. However, it was found relatively lower in case of muskmelon that is around
30 per cent. The inputs related to improved production technology such as fertilizer,
insecticides and irrigation also constituted at least 10 per cent of the cost in each group.

113
Results show that tomato and muskmelon generated significant employment. It
was noticed 112 and 107 days/ha for tomato in case of TMC and EMC farmers. Also,
muskmelon generated 94 and 74 days/ha for both the groups. Findings reveal that
TMC and EMC tomato cultivators utilized 37 and 45 per cent of family labour. On the
other hand, TMC and EMC muskmelon growers utilized around 19 and 26 per cent of
family labour. The remaining human labour was hired. The contribution of female labour
was found higher across all the groups except in the case of EMC muskmelon growers.
(iv) Price Spread and Marketing Efficiency:
Surveyed farmers disposed off their tomato and muskmelon produce through a
commission agent under the traditional marketing channel and to the Reliance Fresh,
under the emerging marketing channel etc. The choice of marketing channel depends
on variety of factors such as financial obligation to commission agent, remunerative
price and proximity to the market.
We have calculated gap between prices received by the producers and prices
paid by the consumers. Results show that producers received around 49% share of
consumer’s rupee in case of tomato and around 44% in case of muskmelon under TMC.
These shares were around 40 and 42% respectively for farmers selling produce through
EMC. The remaining share was incurred as the marketing cost and margins of the
intermediaries in case of TMC. It is essential to mention that the Reliance Fresh
received around 60 and 58% as marketing cost and margins. The calculation of
marketing efficiency ratio showed that it was found better under the EMC for both the
selected crops.
To sum up, farmers received a higher price (around 6 per cent) by selling tomato
and muskmelon to the RF. But, this difference appears to be very low in view of the fact
that RF purchased these crops directly from the farmers without involving several
functionaries. Also, only quality produce is purchased and bad quality was rejected
during sorting and grading. Thus, benefits received by the farmers from sale of produce

114
to the RF were not found significant. It implies that a larger share of margins accrued
after shortening the chain was enjoyed by the RF.
5.3 Policy Implications:
During the course of study, we have observed some shortcomings in the
marketing of tomato and muskmelon through the traditional and emerging marketing
channels. The following suggestions have been offered to improve the marketing
scenario of horticultural crops in general and selected crops in particular in Haryana.
(i) Ensuring barrier free movement of the produce across the country by lifting
restrictions.
(ii) Reducing levies and mandi taxes to the minimum level in order to make
traditional marketing channel competitive to emerging marketing channels.
(iii) Increasing the number of alternate marketing channels for marketing of
perishable crops to increase competition among buyers. The present spread of
emerging channels is inadequate to have wider impact on marketing of the
produce.
(iv) Given the perishable nature of horticultural crops, farmers may be provided
marketing assistance.
(v) Establishing processing centers accessible to producers. This is urgent since
growers sell their produce immediately after the harvest. As a result, farmers
received low prices in the absence of any other option.
(vi) The differential in the price received by tomato and muskmelon producers selling
through TMC and EMC was narrow (6 %). This variation appears to be low in
case of EMC which purchased produce directly from farmers without involving
functionaries. Results of the study show that marketing margin was found more
than 50% in case of EMC. Hence, there is an urgent need to regulate prices and
profits of EMC.

115
Bibliography
Acharya, S.S and N.L. Aggrawal. 2011. Agricultural marketing in India. New Delhi: Oxford and
IBH Publishing Co. PVT. LTD.
Acharya, S.S. .1998. Agricultural marketing: Issue and challenges. Indian Journal of
Agricultural Economics. 53(3).
Alam, G. and D Verma. 2007. Connecting small-scale farmers with dynamic markets: A case
study of a successful supply chain in Uttarakhand. Dehradun: Centre for sustainable
development.
Arora, V.P.S. .2010. Promoting agribusiness in India. Indian Journal of Agricultural Marketing.
24 (3):1-30.
Asian Development Bank (ADB) and International Food Policy Research Institute (IFPRI).
2009. High value crops and marketing-strategic option for development in Uttarakhand. New
Delhi: Academic Foundation.
Bathla Seema and Singh Ishmeeta, 2011 Traditional and Organised Fresh Food Retailing:
Implications for Food Security, Indian Journal of Agricultural Marketing, Volume 25, No.3,
Sept-Dec.
Barbara, Harriss. 1982. The marketed surplus of paddy in north arcot district, Tamil Nadu: A
micro level causal model. Indian Journal of Agricultural Economics. 37 (2):145.
Birthal, P.S., P.K. Joshi and A Gulati. 2005. Vertical co-ordination in high-value food
commodities: Implication for smallholders. In MTID discussion paper 85. Washington: IFPRI.
Deshpande, R.S. and D V Gopalappa. 2003. Administrative reforms in the field of agricultural
marketing in the context of WTO. Indian Journal of Agricultural Marketing. 17 (2): 1-7.
Dev, S. Mahendra. 2007. Market reforms in Indian agricultural. Indian Journal of Agricultural
Marketing. 21 (2):1-29.
Dhananjaya, B.N. and A.U. Rao. 2009. Namdhari fresh limited. In Inclusive value chains in
India: Linking the smallest producers to modern markets. Singapore: World scientific.
Dileep, B.K., R K Grover and K N Rai. 2002. Contract farming in tomato: An economic
analysis. Indian Journal of Agricultural Economics. 57 (2): 198-210.
Gajanana, T.M., DF.S. Murthy, M Sudha and V Dakshinamoorthy. 2006. Marketing and
estimation of post harvest losses of tomato crop in Karnataka. Indian Journal of Agricultural
Marketing. 20(1):1-10.
Gandhi, Vasant P. and N B Namboodiri. 2002. Marketing of fruits and vegetable in India: A
study of the wholesaled markets in the Ahmadabad area. In AERC research report Centre for
Management in Agriculture IIM, Ahmadabad.
Gandhi, Vasant. P. 1991. Marketing management of horticultural produce. New Delhi: Deep and
Deep Publication.

116
GOI.2011. Agricultural Statistics at a glance. Directorate of Economics and Statistics. Ministry
of Agriculture, Government of India, New Delhi.
GOI.(2011). Report on State of Indian Agriculture, Ministry of Agriculture, Government of
India, New Delhi.
Hashim, S.R. 2009. A Perspective on agricultural marketing in India. Indian Journal of
Agricultural Marketing. 23 (3):1-9.
Joseph, M. and N. Soundrarajan. 2009. Retail in India: A critical Assessment. New Delhi:
Academic Foundation.
Joseph, M., N Soundrarajan, M. Gupta and S Sahu. 2008. Impact of organized retailing on the
unorganized sector. New Delhi: Indian Council for Research on International Economics
relation (ICRIER).
Kaul, G.L. 1997. Horticulture in India: Products marketing and processing. Indian Journal of
Agricultural Economics. 52(3).
Khemnar, S.H., D S Nawadkar and S B Dangat. 1994. Profitability of tomato cultivation in
Ahmednagar district of Maharashtra state. Indian Journal of Agricultural Marketing. 8 (1):96-
100.
Kshirsagar, K.G. 2006. Availing marketing infrastructure for horticultural crops: Emerging
perspectives and future policies. Indian Journal of Agricultural Marketing. 20 (2):69-80.
Minton, Bart, Thomas Reardon and Rajib Sutradar. 2010. Food prices and modern retail: The
case of Delhi, World Develpopment.xx.x.pp.xxx-xxx.
NHB. 2011. Indian Horticulture Database. National Horticulture Board, Ministry of Agriculture,
Government of India, Gurgaon (Haryana).
Pingali, P. and Y Khwaja. 2004. Globalization of Indian diets and the transformation of food
supply systems. Indian Journal of Agricultural Marketing. 18(1):26-49.
Prasad, Sivarama A. 1985. Agricultural marketing in India. New Delhi: Mittal Publication.
Pritchard, B., C.P. Gracy and M. Godwin. 2010. The impact of supermarket procurement on
farming communities in India: Evidence from rural Karnataka. Development Policy Review.
28(4):435-456.
Chand Ramesh. 1999. Agricultural Marketing: Issues and Challenges. Indian Journal of
Agricultural Economics. 54(1):46-47.
Sah, D.C and C Hanumantha Rao. 1979. Price spread in groundnut marketing at macro level.
Indian Journal of Agricultural Economics. 34(4):149.
Saran, Sukhjeet K. and Mini Goyal. 2009. Food retail marketing in India. Indian Journal of
Agricultural Marketing. 23 (1):1-9.
Sharma, Vijay Paul. 2003. WTO and agricultural marketing. Indian Journal of Agricultural
Marketing. 17 (2): 57-63.
Sidhu, D.S. 1986. Policies pertaining to agricultural marketing and input supply. Indian Journal
of Agricultural Economics. 41 (3):327.

117
Singh, R.P. and Anupam Toppo. 2010. Economics of production and marketing of tomato in
Kanke block of Ranchi district. Indian Journal of Agricultural Marketing. 24 (2):1-16.
Singh, Ram and K S Suhag. 2010. Role of state agricultural marketing board in marketing
development in Haryana. Indian Journal of Agricultural Marketing. 24 (1):38-48.
Singh, Sukhpal and Naresh Singla. 2010. Inclusive fresh food retail chains in India: Case studies
of Hopcoms and Safal. Indian Journal of Agricultural Marketing. 24(3):191-204.
Singh, Sukhpal and Naresh Singla. 2011. Fresh food retail chains in India: Organisation and
impacts. New Delhi: Allied publishers private limited.
Sinha, S.P, Ajoy Kumar, Jagdish Prasad and P C Pandey. 1979. A study of price spread of
important food grains in two agricultural markets of Bihar. Indian Journal of Agricultural
Economics. 34 (4):136.
Soni, Satyanarayan and M S Ahmed. 1992. Production and marketing of tomato in tribal area of
district Sidhi (M.P.). Indian Journal of Agricultural Marketing. 6(1):49-53.
Subbanarasiah, N. 1991. Marketing of horticultural crops in India. New Delhi: Anmol
Publication PVT LTD.
Swarup, R., B K Sikka, C S Nadda and C S Vaidya. 1985. Price Spread and marketing margins
for Himachal Pradesh apples: Temporal and spatial analysis. Indian Journal of Agricultural
Economics. 40(3):376-378.
V.S, Satyapriya. 1984. Institutional factors and marketing behaviour: A study of three major
arecanut markets in Karnataka. Indian Journal of Agricultural Economics. 39(3):347.

118
Action Taken on coordinators comments
The authors gratefully acknowledge the comments on the draft report given by the
coordinator of the study, Dr. Nilabja Ghosh, Associate Professor, Institute of Economic
Growth, Delhi. These comments have been incorporated in the final report.