Embed Size (px)
Citation preview
Impact of Dust on Printed Circuit Assembly Reliability
Bo Song, Michael H. Azarian and Michael G. Pecht Center for Advanced Life Cycle Engineering (CALCE)
University of Maryland, College Park, MD
Abstract Atmospheric dust consists of solids suspended in air. Dust is well known for its complex nature. It normally includes inorganic mineral materials, water soluble salts, organic materials, and a small amount of water. The impact of dust on the reliability of printed circuit board assemblies (PCBAs) is ever-growing, driven by the miniaturization of technology and the increasing un-controlled operating conditions with more dust exposure in telecom and information industries. A fundamental and systematic study on the impact of dust is needed, since not much research has been done in this area. We started by asking some basic questions on dust. Since dust is always present in the atmosphere, under what conditions is dust a reliability concern for electronics? What are the key characteristics of dust? Are some dust types worse than others: e.g., dust that is more hydrophilic? Should there be classifications of dust? How will different combinations of dust, voltage, relative humidity (RH), temperature, and other factors affect electronic materials and circuits? This paper presents some results towards answering these questions. We designed a group of experiments using real life dust collected from both indoor and outdoor areas. AC impedance spectroscopy (IS) was employed as the measurement technique for this research. We designed test coupons with adjustable spacing between electrodes and measured their electric properties under different relative humidities. We analyzed aqueous solutions produced from dust samples were using their pH and conductivity. And we further analyzed the compositions of the dust samples. We found that dust had a significant impact on the reliability of PCBA. Relating the test results to the analysis results, indoor dust is more sensitive to the change of relative humidity compared to outdoor dust due to the water soluble salts and particle size. At the same dust deposition density, indoor dust is more susceptible to induce moisture related failure, such as loss of surface insulation resistance, electrochemical migration, and corrosion. Introduction Dust is always present in the air. It is considered as a new factor in describing the operating condition of electronics, besides temperature and relative humidity. The impact of dust on the reliability of electronics is increasing due to a number of factors: Driven by the new technology of miniaturization, the trace-to-trace spacing on the printed circuit boards and lead-to-lead spacing on the component have been reduced greatly over the years. The PCBAs have become more sensitive to the dust particles dimension-wise. At the same time, electronics are no longer only residing in benign environments [1]. For example, a lot of functionalities of telecom equipment have been moved to outdoor; and the free air cooling method, which uses the ambient outdoor air to chill the equipment, has been adopted by data centers in order to reduce costs and greenhouse gas emissions [2]. These factors have contributed to the growth of research interests in dust. The existing work on dust has been focused on the impact on PCBs and connectors/contacts [3][4]. Dust may cause electrical leakage, shorting and opening of PCBs under different conditions. A conductive electrolyte film can be formed, which can degrade the surface insulation resistance between conductors. Dust particles can increase friction on contacting surfaces, thus promoting third body wear and fretting corrosion, which in turn can change the contact resistance. Dust particles act as dielectric materials to induce signal interference in the contaminated signal connectors and lines. Dust accumulation on the heat sink, power connectors, or active devices can cause overheating. Research organizations published results on dust, such as Bell Labs [4][5], Telcordia Technologies [6][7], Technical University of Denmark [8][9], Royal Institute of Technology [10][14] in Sweden and IBM [14]. Some developed test methods using salt to simulate the effect of dust. These tests unfortunately are too simple to simulate the dust effect in real life. Some other tests involve randomly depositing dust on a board or exposing a test coupon in a kitchen for months [8]. However, these tests are not well controlled and not reproducible, and there is little conclusion from those tests. After reviewing the previous research on dust, we think that the failure mechanisms are not well understood and the existing test methods are not well developed. Most importantly, some basic questions on dust have not been answered. We started the research work with a number of basic questions on dust. Since dust is always present in the atmosphere, under what conditions is dust a reliability concern for electronics? What are the key characteristics of dust? Are some
As originally published in the IPC APEX EXPO Proceedings.
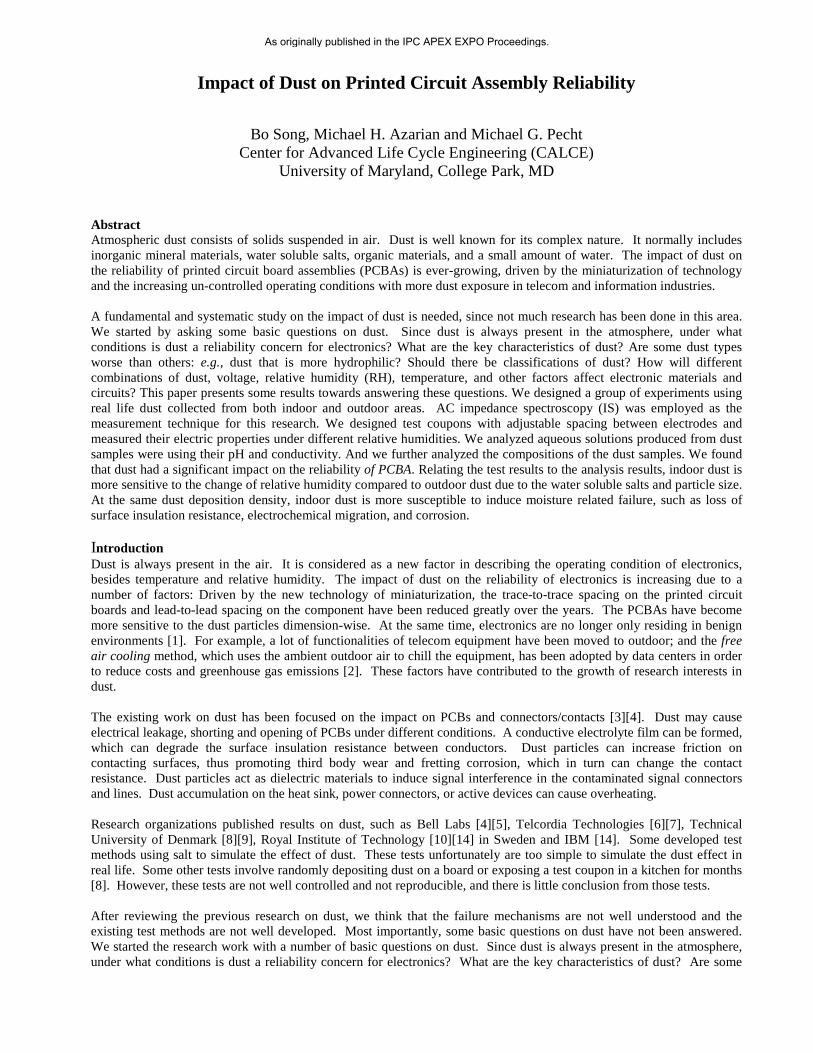
dust types worse than others: e.g. dust that is more hydrophilic? Should there be classifications of dust? How will different combinations of dust and other stress conditions affect electronic materials and circuits? This paper presents some results towards answering these questions. We designed a group of temperature-humidity experiments using real life dust collected from both indoor and outdoor areas. Thus, we describe the design of test coupon, test method and test conditions first. We also show the compositional analysis and pH/conductivity measurement results of dust samples. Then we show the test results at different relative humidities. We present impedance spectroscopy measurement of the electrical properties of test coupons in presence of dust. The findings of impact of dust on the printed circuit assembly were summarized at the end of paper. Design of Experiment Dust samples were collected from both indoor and outdoor areas. Outdoor dust was collected from an outdoor multi-level garage in an urban area. The samples were collected on the second and third floors. Indoor dust was collected from the office building of a computer software company. The office space is equipped with an air conditioning system. Dust was brushed off the surfaces of smooth plastic plates located at a height of 2.5 m. We designed test coupons with different lengths and spacings. The test coupons were designed with adjustable spacing to allow manual calibration. The pairs of copper electrode strips were placed on a FR-4 board. They could be moved toward or apart from each other. After the spacing setting, the electrodes were fastened with plastic fixtures and mounting hardware. Two parallel copper electrodes with a length of 200 mm were selected in this group of study. There are 6 pairs of parallel electrodes on each board, as shown in Figure 1. The spacing was set as 0. 25 mm. A thickness gauge was used to set the spacing and control parallelism of the two electrodes. We used an optical microscope to verify the spacing setting. The board was FR-4 board with a thickness of 0.062” (1.57 mm), which is a widely used thickness in electronic products. The copper electrodes were made by copper foil with a thickness of 0.007” (0.18 mm). Guard traces were added on the test coupons to reduce the noise of high impedance line.
Figure 1: Test coupon with 6 pairs of parallel electrodes
We used volatile alcohol to transfer the dust particles. Small quantities of dust particles were suspended in a 99. 9% isopropyl alcohol (IPA) solution, and then distributed onto the test coupon using a transfer pipette. The IPA volatilized quickly, thereby leaving the dust particles on the coupon surface. To verify uniformity and repeatability of the dust distribution, we used optical microscope inspection and SEM microscopy at different magnifications, which showed that the dust distribution was even in general, even though there were some dust-clustered areas. An optical image of dust particles between electrodes is shown in Figure 2. We further used impedance measurements to verify the result, which showed very similar spectra for the samples with the same deposition density. The sample size was three under each test condition.
As originally published in the IPC APEX EXPO Proceedings.

Copper Electrode
Dust Particles
Copper Electrode
Copper Electrode
Dust Particles
Copper Electrode
Figure 2: Optical image of dust particles between electrodes
We used AC impedance spectroscopy (IS) to characterize the impact of dust on PCBs. The AC impedance technique uses small AC voltage to investigate the electrical response of a system by scanning across a wide frequency range. It measures the relevant interfacial and bulk properties of the system. A number of reasons led us to employ the IS as the measurement technique instead of the commonly used surface insulation resistance (SIR) measurement by DC voltage. Firstly, IS can distinguish between the ionic solution impedance of electrolyte between electrodes and the impedance from interfacial electrochemical reactions. Thus we can understand which the dominant impedance is in the overall system. Secondly, it does not lose the SIR information measured by DC voltage since he DC measurement value is just the end point of the spectrum (frequency = 0). We can provide an estimate of SIR through a construction of an equivalent circuit of the test system and an extrapolation to the SIR data. Thirdly, IS applies a small amount of voltage, which has minimal impact on the operating environment. DC bias is known to promote dendrite growth as a critical acceleration factor, whereas AC does not promote dendrite formation since there is insufficient time on each cycle to form dendrites [11]. The anodes and cathodes were changed continuously during the AC voltage measurement. We performed IS measurements on test coupons deposited with indoor or outdoor dust. Impedance spectra were measured at 40ºC and different relative humidities, 40%, 60%, 80% and 90%. During the ramp up of RH test, the test coupon was exposed under each combination of temperature and humidity for 30 minutes before taking an impedance measurement. The test profile is plotted in Figure 3. The ramp rate between the plateaus (soaking periods) is less than 2 ºC/ minute. AC impedance spectroscopy was measured by scanning a frequency range from 20 Hz to 2 MHz. An AC bias at the level of 25 mV was applied for about 2 minutes to take the measurement. There was no bias applied between measurements. Data were represented by Bode and Nyquist plots. The Bode plot illustrates the relationship between absolute impedance (|Z|) and measurement frequency (f), while the Nyquist plot demonstrates the relationship between real component of impedance (Z’) and imaginary component of impedance (Z”).
0
20
40
60
80
100
0 40 80 120 160 200 240Time (minutes)
RH (%
)
Test point
0
20
40
60
80
100
0 40 80 120 160 200 240Time (minutes)
RH (%
)
Test pointTest point
Figure 3: Test profile of relative humidity
Characterization of Dust Solutions We characterized dust sample by measuring the pH and conductivity of aqueous solutions produced from them. We dissolved 250 mg of dust particles in 10 mL of deionized water (DI water), and measured the aqueous solution with a pH/conductivity meter. The measurement results at ambient temperature are summarized in Table 4. Group one is the
As originally published in the IPC APEX EXPO Proceedings.

control group with DI water only, which has a pH of 5.75. DI water theoretically should have a pH of 7 with equilibrium of hydrogen (H+) ions and hydroxide (OH-) ions. However, as it sits in open air, carbon dioxide (CO2) begins dissolving into the water, forming carbonic acid. A small amount of absorption of CO2 would drop the pH from 7 to between 5 and 6. During the pH measurement of the DI water, we observed the decrease of pH as it came in contact with air. The pH was stabilized at 5.75. Therefore, pH electrodes do not provide accurate pH for DI water. The conductivity of the control group is 0. That means that the tested DI water is cleaned properly, which has very little conductivity in it.
Table 1: Summary table of pH and conductivity measurements Group Sample pH Conductivity (μS/cm)
1 No dust (control) 5.75 0 2 Indoor dust 5.13 2526 3 Outdoor dust 5.53 1640
The conductivity (κ) can be defined by the following equation:
lA
RG κ==
1
Conductance (G) is defined as the reciprocal of the resistance (R). Conductance of a given aqueous solution decreases when the distance (l) between the electrodes increases and increases when the effective area (A) of the electrodes increases. The conductivity of the aqueous solution produced from indoor dust and outdoor dust was 2526 μS/cm and 1640 μS/cm, respectively. During the conductivity measurement of the solutions, the distance and effective area between the electrodes were the constants since we used the same meter. As a result, the conductivity of the aqueous solution is the reciprocal of the resistant value. The resistance value corresponds to the real component in the impedance measurement. The higher conductivity of the indoor dust solution can lead to a lower real component of the impedance at relatively high RH levels. It was verified by the Nyquist plots shown in the next section. The aqueous solution produced from indoor dust had a lower pH compared to the one from outdoor dust. Both of them showed a slightly acidic property. The different pHs of the aqueous solutions produced from the indoor and outdoor dust samples can be explained by the ionization and hydrolysis of the dominant substances in the dust samples. We list the ionization of NH4HSO4, (NH4)2SO4 and NaCl in the reaction (1), (2), and (4), which are the dominant water soluble salts in the indoor or outdoor dust [13]. The ammonium ion (NH4
+) can further hydrolyze to form H3O+, which has acidic property. If the reactions (1) to (3) take place in an aqueous solution produced from dust, the pH is reduced.
NH4HSO4 → NH4+ + H+ + SO4
2- (1)
(NH4)2SO4 → 2NH4+ + SO4
2- (2)
NH4+ + H2O ↔ NH3↑ + H3O+ (3)
NaCl → Na+ + Cl- (4)
Indoor and outdoor dust samples were analyzed for their composition using SEM/EDS. Similar to the process of the dust deposition on the test coupon, the dust samples were deposited onto a 3” x 3” FR4 board before the compositional analysis as shown in Figure 4 Error! Reference source not found.. The major elements detected in both dust samples are: C, O, Na, Mg, Al, Si, S, Cl, K, Ca, etc. The results indicated that the analyzed dust samples consisted of naturally abundant inorganic minerals and water soluble salts. Similar analysis findings were published in [11] and Error! Reference source not found.. The dominant minerals indentified in dust samples include quartz (SiO2), feldspar (KAlSi3O8-NaAlSi3O8-CaAl2Si2O8), calcite (CaCO3), gypsum (CaSO4·2H2O) and mica (SiO2·Al2O3·K2O·Na2O·H2O), most of which are the abundant minerals in the crust of the earth. They are generated by wind-blowing of soil dust [14]. Elements of chlorine and sulfur were also detected, which may exist in the forms of chloride (Cl-) and sulfate (SO4
2-) as the constituents of water soluble salts, and co-existed with the mineral particles. It is likely that they are formed from the sea salts in breaking ocean waves or sprinkled salts on the road.
As originally published in the IPC APEX EXPO Proceedings.

Figure 4: SEM image of the outdoor dust sample deposited on a FR-4 laminate board
Due to the limited sensitivity of EDS for low atomic order elements, elements such as nitrogen and hydrogen can not detected, even if they are present in the dust sample. For the indoor dust sample, the real component in the Nyquist plot showed a big drop when the RH reached 60% as shown in the next section. It indicated that the dust sample consisted of the substance with the CRH lower than 60%. Sulfate (SO4
2-) and ammonium (NH4+) are the main ionic components in
the fine mode dust particles, which are formed by the condensation of low volatility gases [17]. It is speculated that both (NH4)2SO4 and NH4HSO4 existed in the analyzed indoor dust samples due to presence of elements S and O, which have the CRH of 79% and 40% at the room temperature, respectively. Compositional analysis was conducted on dust particles deposited on the test board to analyze the difference between indoor and outdoor dusts. Firstly, elements such as Na, K, Cl and S were more prevalent in the indoor dust sample compared to outdoor dust in terms of distribution since they were detected on the most indoor dust particles. As the major compositions of water soluble salts, they co-existed with other mineral particles. It is a multi-layer structure formed between salts and mineral particles [14] . Secondly, these elements also occupied higher weight percentage in the indoor dust sample compared to the outdoor one. Outdoor dust had higher weight percentages of Al, Si, and Ca, as a result of wind blowing of inorganic mineral particles. Thirdly, they differed a lot in term of size distribution. We measured the dimensions of the dust particles on an area of 0.3 X 0.3 mm2 for both samples. The outdoor dust sample had a larger averaged particle size with a bigger variation compared to indoor dust. It is because of the air conditioning system for the indoor dust sample, which can filter out the particulates greater than a certain size. Error! Reference source not found.Figure 5 and Figure 6 showed higher magnification images of the indoor and outdoor dust samples. Different morphology of dust particles reflected the dissimilar compositions. Dust particles with sharp boundaries are normally mineral dust particles as shown in Figure 5 Error! Reference source not found.of the outdoor dust sample. Some dust particles are agglomerations of many particulates together as shown in Error! Reference source not found.the indoor dust sample. It seems to be small amount of chloride salt mixed quartz and other mineral particles (shown as point 1 of Figure 6). The showing of element S, Cl and Na indicated the presence of water soluble salts, such as NaCl, KCl or NH4HSO4. They normally attached to the mineral particles to form a multi-layer structure. There are normally more than tens of substances in the dust sample. More advanced techniques can be employed in order to have further understanding.
100.00100.00Totals
0.461.18Ca
3.588.93K
8.4015.06Si
2.133.67Al
22.2122.68O
63.2248.47C
Atomic%Weight%Element
100.00100.00Totals
0.461.18Ca
3.588.93K
8.4015.06Si
2.133.67Al
22.2122.68O
63.2248.47C
Atomic%Weight%Element
As originally published in the IPC APEX EXPO Proceedings.

Figure 5: SEM image of the outdoor dust sample with EDS compositional analysis results
Point 1
Point 2
100100100100Totals
3.57.040.821.61Ca
1.292.533.46.55K
9.0516.120.91.58Cl
2.093.37--S
1.512.1217.7424.52Si
--4.86.37Al
--3.143.76Mg
6.927.99--Na
75.6560.8269.1955.61O
Atomic%Weight %Atomic %Weight %
Point 2Point 1Element
Point 1
Point 2
100100100100Totals
3.57.040.821.61Ca
1.292.533.46.55K
9.0516.120.91.58Cl
2.093.37--S
1.512.1217.7424.52Si
--4.86.37Al
--3.143.76Mg
6.927.99--Na
75.6560.8269.1955.61O
Atomic%Weight %Atomic %Weight %
Point 2Point 1Element
Figure 6: SEM image of the indoor dust sample with EDS compositional analysis results
Test Results Error! Reference source not found.Figure 7 shows the Bode plot of the control group of the test coupon, which does not have dust deposition. Figure 8 and Figure 9 show the Bode plots of test coupons deposited with outdoor and indoor dust, respectively. The data showed that the presence of dust had a significant impact on the reliability of PCBA. There was negligible change of the impedance spectra of control samples at different relative humidifies, while there were orders of magnitude changes observed in the samples with both indoor and outdoor dust. Dust particles on the surface can increase the total water sorption compared to a clean board, since water can both adsorb on the increased surface of the dust deposit and further absorb into the dust. The formation of water film and the increase of moisture uptake on the substrate can enhance the conductivity between two separated conductors. In addition, water soluble salts in the dust sample can dissolve in the water film and form the ions, which can further increase conductivity. Comparison tests were performed on indoor and outdoor samples under the same test conditions and dust deposition density. Figure 8 and Figure 9 show the results. Bode plots showed that indoor dust was more sensitive to the change of relative humidity compared to outdoor dust. For the test coupons with outdoor dust, the impedance spectra of the test condition of 80% RH started showing a significant separation in low frequency from the spectra obtained at the lower RH levels. A similar separation occurred at a lower RH of 60% for the coupons with indoor dust. Therefore, under the similar dust deposition density, the indoor dust test coupons are more susceptible to induce moisture related failures to electronic products, such as loss of surface insulation resistance between electrodes, electrochemical migration, and corrosion. We believe the difference is partially caused by the different compositions and weight percentages of each constituent in the indoor and outdoor dust samples. As shown in the compositional analysis, indoor dust contains more water soluble salts, while outdoor dust contains more mineral particles in terms of weight percentage. Water soluble salts are the critical constituent in dust sample due to their deliquescence. One of the dictating properties is the critical relative humidity (CRH), the temperature and humidity level at which a material will begin to absorb water vapor from the air [15]. At or above CRH, water soluble salts can absorb relatively large amounts of water from the atmosphere if exposed to it, forming a liquid solution. For example, the CRH of NH4HSO4 is 40% at 25 ºC, and it is 75% at 20 ºC for NaCl. Due to the higher weight percentage of element Na, K, Cl and S, we believe there existed more water soluble salts in the indoor dust sample including NH4HSO4, NaCl and KCl. As a result, the test coupon with indoor dust started absorbing large amounts of water from the air at a lower RH. The difference between indoor and outdoor dust can also be attributed to the different size distribution of dust particles. Indoor dust contains more fine-mode dust particles due to the usage of particulate filtration systems inside a building. It was observed in the particle size measurement shown in the previous section. Fine-mode particles have more surface areas, which make them act as condensation sites for moisture adsorption due to capillary wetting, the ability of a liquid to penetrate porous solids, such as a mass of fine dust particles. The fine mode dust particles may act as porous solids. Therefore, the fine mode particles are believed to absorb more moisture compared to coarse mode particles given the same composition and deposition density (μg/cm3).
As originally published in the IPC APEX EXPO Proceedings.
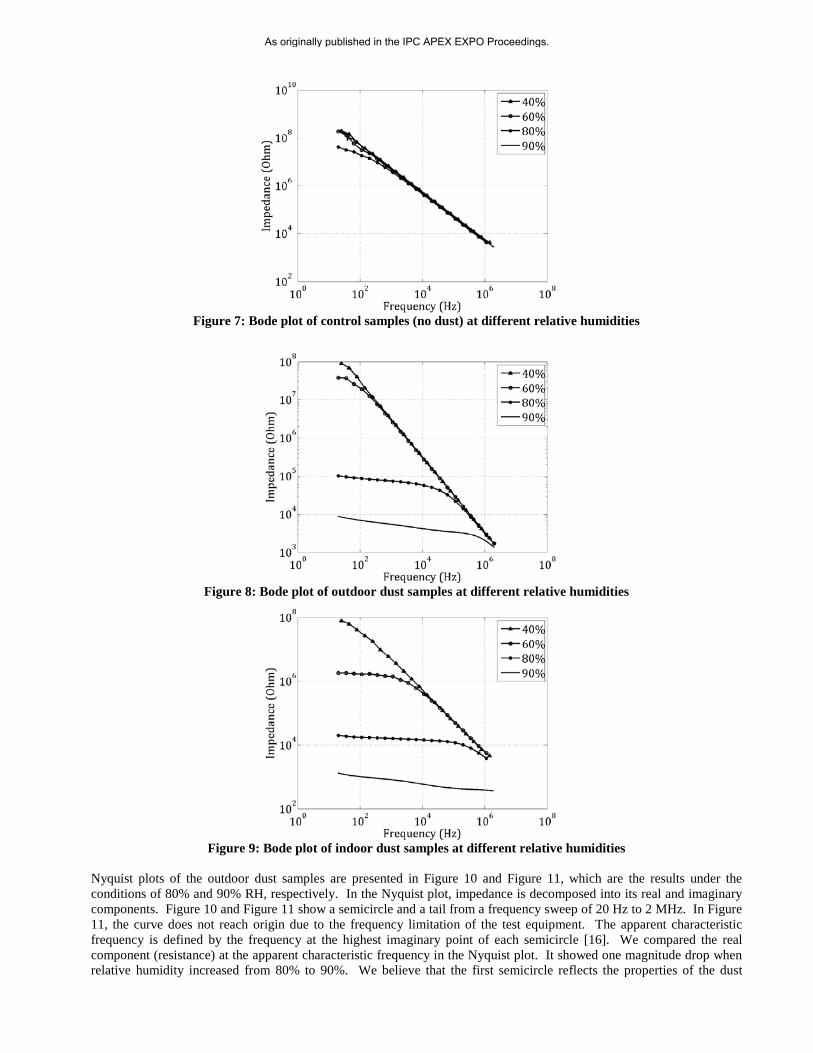
Figure 7: Bode plot of control samples (no dust) at different relative humidities
Figure 8: Bode plot of outdoor dust samples at different relative humidities
Figure 9: Bode plot of indoor dust samples at different relative humidities
Nyquist plots of the outdoor dust samples are presented in Figure 10 and Figure 11, which are the results under the conditions of 80% and 90% RH, respectively. In the Nyquist plot, impedance is decomposed into its real and imaginary components. Figure 10 and Figure 11 show a semicircle and a tail from a frequency sweep of 20 Hz to 2 MHz. In Figure 11, the curve does not reach origin due to the frequency limitation of the test equipment. The apparent characteristic frequency is defined by the frequency at the highest imaginary point of each semicircle [16]. We compared the real component (resistance) at the apparent characteristic frequency in the Nyquist plot. It showed one magnitude drop when relative humidity increased from 80% to 90%. We believe that the first semicircle reflects the properties of the dust
As originally published in the IPC APEX EXPO Proceedings.
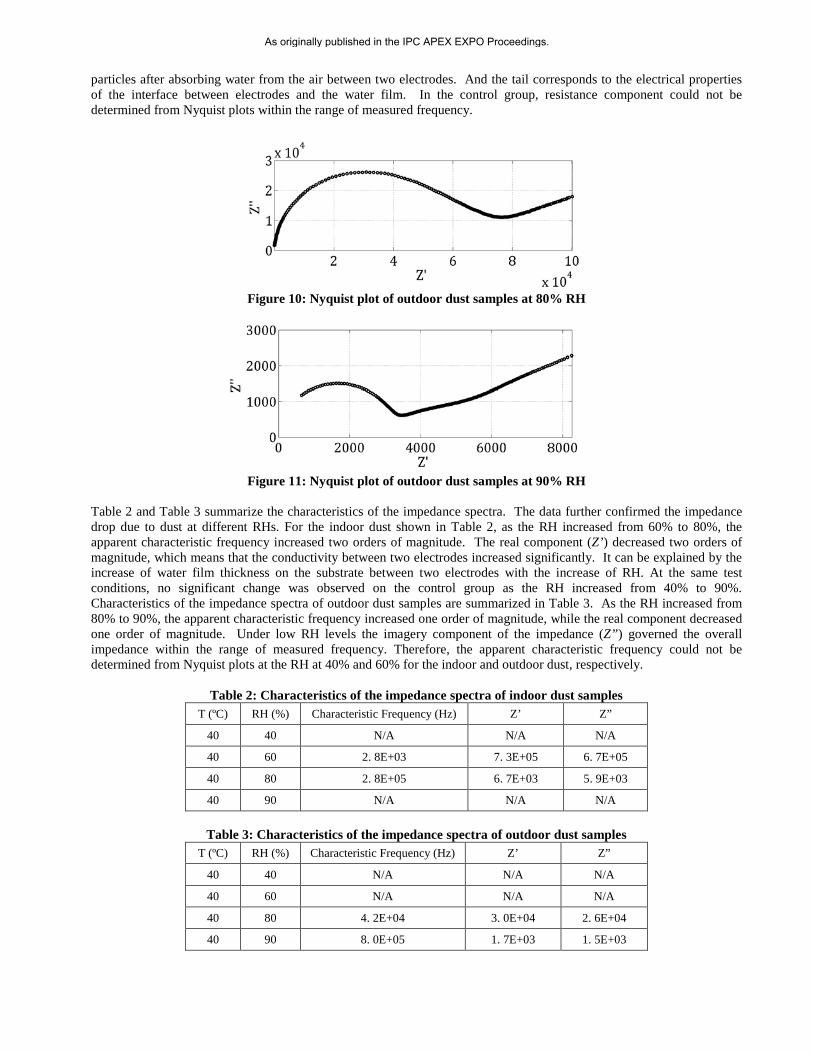
particles after absorbing water from the air between two electrodes. And the tail corresponds to the electrical properties of the interface between electrodes and the water film. In the control group, resistance component could not be determined from Nyquist plots within the range of measured frequency.
Figure 10: Nyquist plot of outdoor dust samples at 80% RH
Figure 11: Nyquist plot of outdoor dust samples at 90% RH
Table 2 and Table 3 summarize the characteristics of the impedance spectra. The data further confirmed the impedance drop due to dust at different RHs. For the indoor dust shown in Table 2, as the RH increased from 60% to 80%, the apparent characteristic frequency increased two orders of magnitude. The real component (Z’) decreased two orders of magnitude, which means that the conductivity between two electrodes increased significantly. It can be explained by the increase of water film thickness on the substrate between two electrodes with the increase of RH. At the same test conditions, no significant change was observed on the control group as the RH increased from 40% to 90%. Characteristics of the impedance spectra of outdoor dust samples are summarized in Table 3. As the RH increased from 80% to 90%, the apparent characteristic frequency increased one order of magnitude, while the real component decreased one order of magnitude. Under low RH levels the imagery component of the impedance (Z”) governed the overall impedance within the range of measured frequency. Therefore, the apparent characteristic frequency could not be determined from Nyquist plots at the RH at 40% and 60% for the indoor and outdoor dust, respectively.
Table 2: Characteristics of the impedance spectra of indoor dust samples T (ºC) RH (%) Characteristic Frequency (Hz) Z’ Z”
40 40 N/A N/A N/A
40 60 2. 8E+03 7. 3E+05 6. 7E+05
40 80 2. 8E+05 6. 7E+03 5. 9E+03
40 90 N/A N/A N/A
Table 3: Characteristics of the impedance spectra of outdoor dust samples T (ºC) RH (%) Characteristic Frequency (Hz) Z’ Z”
40 40 N/A N/A N/A
40 60 N/A N/A N/A
40 80 4. 2E+04 3. 0E+04 2. 6E+04
40 90 8. 0E+05 1. 7E+03 1. 5E+03
As originally published in the IPC APEX EXPO Proceedings.

Conclusions We designed a group of experiments to gain some fundamental understanding of the physics of failure of dust contamination. We used the dust collected from the field instead of a mixture of chemical compounds to simulate the real dust. The test results were more realistic representation of the dust impact on the printed circuit assembly. AC impedance spectroscopy (IS) was employed as the measurement technique for the dust research, as it can provide interfacial and bulk properties of the overall electrochemical system without losing the SIR information measured by DC voltage. To our knowledge we are the first ones to use IS to analyze the effects of dust. The key findings of this paper are listed below. • The data showed that the presence of dust had a significant impact on the reliability of PCBA. There was negligible
change of the impedance spectra of control samples at different relative humidifies, while there were orders of magnitude changes observed in the samples in presence of indoor or outdoor dust.
• Comparison tests were performed on indoor and outdoor samples under the same test conditions and dust deposition
density. Bode plots showed that indoor dust was more sensitive to the change of relative humidity compared to outdoor dust. We believed the difference is due to weight percentage and species of the dominant water soluble salts and dust particle sizes in the dust sample.
• At the same dust deposition density, we observed that test coupons with indoor dust are more susceptible to induce
moisture related failures. These failure mechanisms include loss of surface insulation resistance between electrodes, electrochemical migration, corrosion, etc. In the real life usage conditions, indoor dust often has much lower deposition density compared to outdoor dust on the printed circuit assemblies due to the usage of air-filtering system in buildings. We should put real use-case scenarios into consideration when evaluating the impact of dust.
Reference [1] M. Tencer, and J. S. Moss, “Humidity management of outdoor electronic equipment: methods, pitfalls, and recommendations”,
IEEE Trans. Comp. Packag. Technol., vol 25, pp 66-71, Mar. 2002. [2] Michael Pecht and Jon Fitch, The Fresh Air Cooling Solution for Energy Savings, to be submitted. [3] Xue-Yan Lin, Ji-Gao Zhang, “Dust Corrosion”, 50th IEEE Holm Conference on Electrical Contacts, 2004 [4] D. G. DeNure and E. S. Sproles, Jr. , “Dust test results on multicontact circuit board connectors”, IEEE Transactions on
Components, Hybrids, and Manufacturing Technology, Volume 14, No. 4, 1991 [5] R. P. Frankenthal, D. J. Siconolfi and J. D. Sinclair, “Accelerated Life Testing of Electronic Devices by Atmospheric Particles:
Why and How”, J. Electrochemical Soc., Vol. 140, pp. 3129-3134, 1993. [6] F. S. Sandroff, W. H. Burnett, “Reliability qualification test for circuit boards exposed to airborne hygroscopic dust”, Electronic
Components and Technology Conference Proceedings, pp384 – 389, 1992 [7] GR-63-CORE: NEBSTM Requirements: Physical Protection, Telcordia Technologies Generic Requirements, Issue 3, March 2006. [8] R. Ambat, M.S. Jellesen, D. Minzari, U. Rathinavelu, M.A. K. Johnsen, P. Westermann, and P. Møller, “Solder flux residues and
electrochemical migration failures of electronic devices”, Proc. of Eurocorr 2009, Nice, France, 6-10 September 2009. [9] Rajan Ambat and Per Møller, A review of Corrosion and environmental effects on electronics, Celcorr Publications,
www.celcorr.com/paper-DMS.pdf [10] M. Forslund, C. Leygraf, “Humidity Sorption Due to Deposited Aerosol Particles Studied In Situ outdoors on Gold Surfaces, J.
Electrochem. Soc., Volume 144, Issue 1, pp. 105-113, 1997 [11] Ling Chunxian Zou and Christopher Hunt, Characterization of the Conduction Mechanisms in Adsorbed Electrolyte Layers on
Electronic Boards Using AC Impedance, J. Electrochem. Soc., Volume 156, Issue 1, pp. C8-C15, 2009. [12] Liang, Y. N. ; Zhang, J . G. ; Liu, J. J. ; Identification of inorganic compounds of dust and their effects on electrical contact
failure, Proceedings of the Forty-Third IEEE Holm Conference on Electrical Contacts, 1997, Philadelphia, PA, pp 315 – 327. [13] C. Leygraf, T. E. Graedel, “Atmospheric corrosion”, John Wiley & Sons, Inc. , ISBN 0-471-37219-6, p 200. [14] Prabjit Singh, Joseph F. Prisco, Roger R. Schmidt Particulate and gaseous contamination: effect on computer reliability and
monitoring, ASHRAE Transactions, Jan, 2009 [15] IPC-HDBK, Guidelines for Design, Selection and Application of Conformal Coatings. [16] Chunsheng Wang, John Appleby, Frank E. Little, Electrochemical impedance study of initial lithium ion intercalation into
graphite powders, Electrochimica Acta, Vol 46, 2001, pp 1793–1813. [17] P-E Tegehall, “Impact of Humidity and Contamination on Surface Insulation Resistance and Electrochemical Migration”, IVF
Industrial Research and Development Corporation, http://www.europeanleadfree.net/
As originally published in the IPC APEX EXPO Proceedings.
Impact of Dust on Printed Circuit Assembly Reliability
Bo Song, Michael H. Azarian and Michael G. Pecht Center for Advanced Life Cycle Engineering (CALCE)
University of Maryland, College Park, MD
As originally published in the IPC APEX EXPO Proceedings.

Motivation • Dust
– Suspended solid particles in the atmosphere – Always present – Complex nature (e.g., compositions vary from location to location)
• Impact of dust on reliability – Due to miniaturization – Uncontrolled environmental conditions (e.g., free air cooling, outdoor
applications) • Research is needed
– The failure mechanisms of electronics in presence of dust are not well understood.
– Test methods are not well developed. – Some basic problems are not solved (e.g., classifications of dust
particles).
As originally published in the IPC APEX EXPO Proceedings.
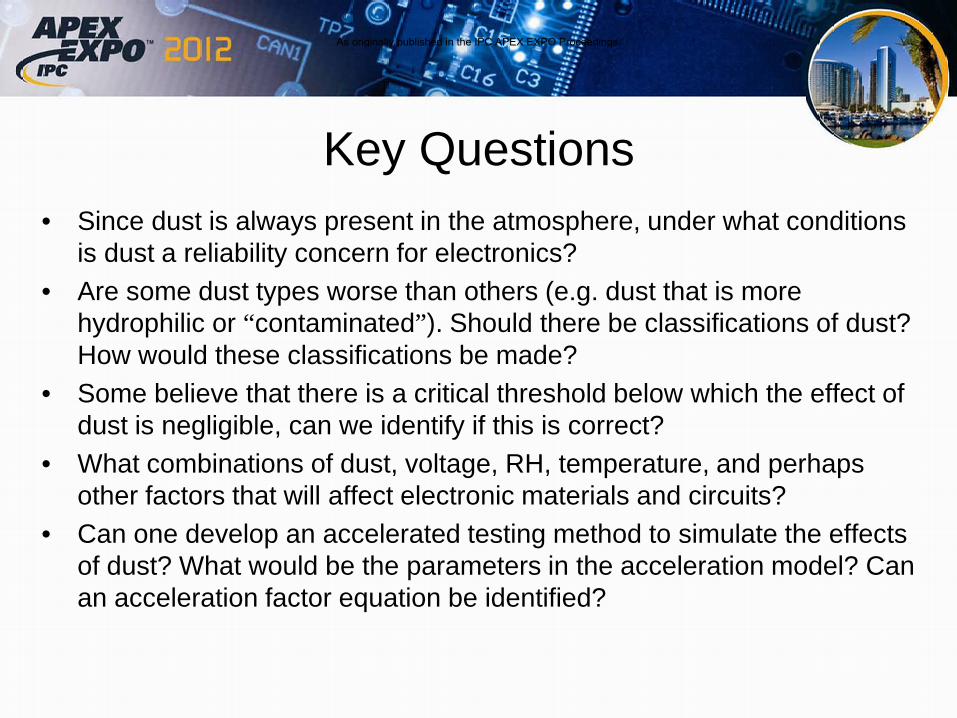
Key Questions • Since dust is always present in the atmosphere, under what conditions
is dust a reliability concern for electronics? • Are some dust types worse than others (e.g. dust that is more
hydrophilic or “contaminated”). Should there be classifications of dust? How would these classifications be made?
• Some believe that there is a critical threshold below which the effect of dust is negligible, can we identify if this is correct?
• What combinations of dust, voltage, RH, temperature, and perhaps other factors that will affect electronic materials and circuits?
• Can one develop an accelerated testing method to simulate the effects of dust? What would be the parameters in the acceleration model? Can an acceleration factor equation be identified?
As originally published in the IPC APEX EXPO Proceedings.

Literature Review Failure Mode Failure Mechanism Research Organizations
Component leads and copper traces
• Electrical leakage • Electrical short • Electrical open
• Conductive water film induced SIR degradation
• Electrochemical migration • Corrosion (Atmospheric)
• Bell Labs • Royal Institute of Technology, Sweden • Bellcore (Telcordia Technologies) CELCORR
(Technical University of Denmark) • IBM • IVF (Industrial Research and Development
Corporation), Sweden • Tekes
Contacts and connectors • Intermittent failure • Noisy (signal line) • Overheating (power
line)
Contact resistance increase • Pore corrosion • Fretting corrosion
• Beijing University of Posts & Telecom (BUPT), China
• Bell Labs • Tekes (Technology Development Center of
Finland), Finland
• Heat sink • Overheating
• PCB in high voltage design
• Electrical overstress
• Physical coverage of the surface
• Spread of charge away from component pins and into the layer of dust to cause arcing.
• IBM • Bellcore (Telcordia Technologies)
As originally published in the IPC APEX EXPO Proceedings.

Test Preparation • Dust samples were collected from both indoor
and outdoor areas. – Outdoor dust: an outdoor multi-level garage in an
urban area. – Indoor dust: a office building of a computer
software company. Brushed off the surfaces of smooth plastic plates located at a height of 2.5 m.
• Test coupons – Length of copper electrodes: 200 mm – Spacing: 0. 25 mm. (A thickness gauge was used
to set the spacing and control parallelism of the two electrodes.)
– Board: FR-4 board with a thickness of 1.57 mm • Dust deposition
– Small quantities of dust particles were suspended in a 99. 9% isopropyl alcohol (IPA) solution, and then distributed onto the test coupon using a transfer pipette.
– The IPA volatilized quickly, thereby leaving the dust particles on the coupon surface
Copper Electrode
Dust Particles
Copper Electrode
Copper Electrode
Dust Particles
Copper Electrode
Test coupon with 6 pairs of parallel electrodes
Optical image of dust particles between electrodes
As originally published in the IPC APEX EXPO Proceedings.

Impedance Spectroscopy • AC impedance spectroscopy (IS) to characterize the impact of dust.
– The AC impedance technique uses small AC voltage to investigate the electrical response of a system by scanning across a wide frequency range. It measures the relevant interfacial and bulk properties of the system.
• Reasons of employing the IS as the measurement technique instead of surface insulation resistance (SIR) measurement by DC voltage.
– Firstly, IS can distinguish between the ionic solution impedance of electrolyte between electrodes and the impedance from interfacial electrochemical reactions. Thus we can understand which the dominant impedance is in the overall system.
– Secondly, it does not lose the SIR information measured by DC voltage since he DC measurement value is just the end point of the spectrum (frequency = 0). We can provide an estimate of SIR through a construction of an equivalent circuit of the test system and an extrapolation to the SIR data.
– Thirdly, IS applies a small amount of voltage, which has minimal impact on the operating environment. DC bias is known to promote dendrite growth as a critical acceleration factor, whereas AC does not promote dendrite formation since there is insufficient time on each cycle to form dendrites. The anodes and cathodes were changed continuously during the AC voltage measurement.
As originally published in the IPC APEX EXPO Proceedings.
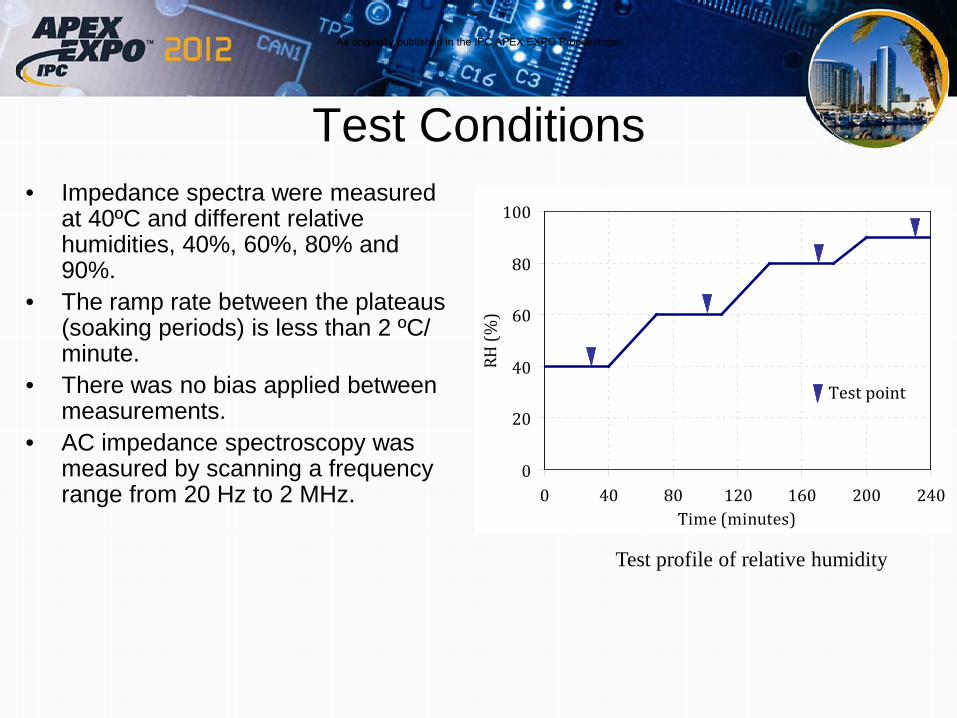
Test Conditions • Impedance spectra were measured
at 40ºC and different relative humidities, 40%, 60%, 80% and 90%.
• The ramp rate between the plateaus (soaking periods) is less than 2 ºC/ minute.
• There was no bias applied between measurements.
• AC impedance spectroscopy was measured by scanning a frequency range from 20 Hz to 2 MHz.
0
20
40
60
80
100
0 40 80 120 160 200 240Time (minutes)
RH (%
)
Test point
0
20
40
60
80
100
0 40 80 120 160 200 240Time (minutes)
RH (%
)
Test pointTest point
Test profile of relative humidity
As originally published in the IPC APEX EXPO Proceedings.
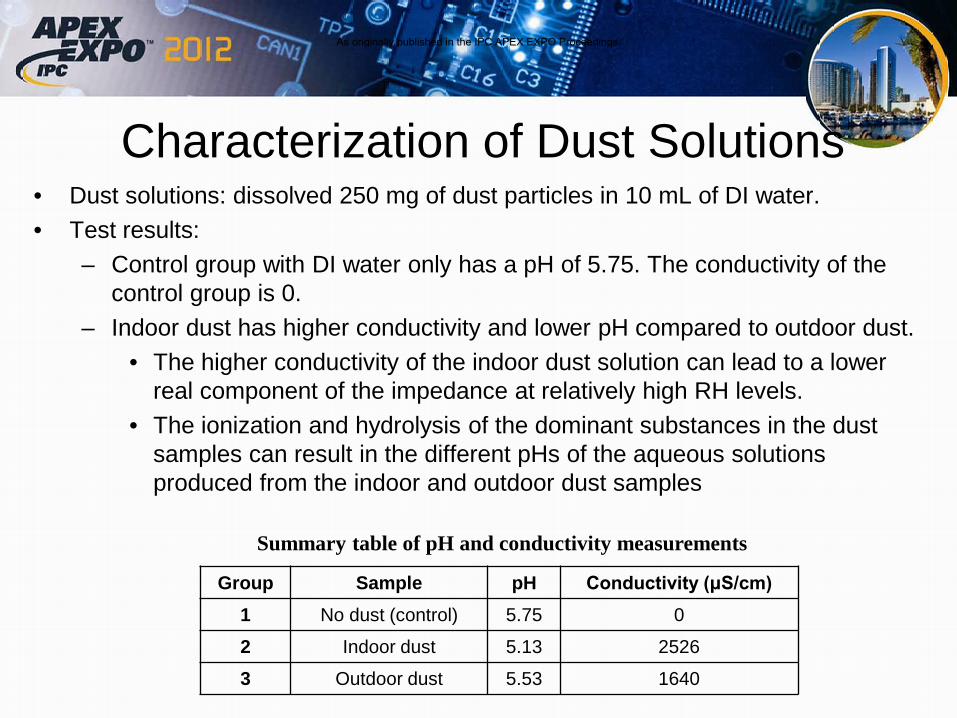
Characterization of Dust Solutions • Dust solutions: dissolved 250 mg of dust particles in 10 mL of DI water. • Test results:
– Control group with DI water only has a pH of 5.75. The conductivity of the control group is 0.
– Indoor dust has higher conductivity and lower pH compared to outdoor dust. • The higher conductivity of the indoor dust solution can lead to a lower
real component of the impedance at relatively high RH levels. • The ionization and hydrolysis of the dominant substances in the dust
samples can result in the different pHs of the aqueous solutions produced from the indoor and outdoor dust samples
Summary table of pH and conductivity measurements
Group Sample pH Conductivity (μS/cm) 1 No dust (control) 5.75 0
2 Indoor dust 5.13 2526
3 Outdoor dust 5.53 1640
As originally published in the IPC APEX EXPO Proceedings.

Compositional Analysis - 1/2 • The major elements detected in both dust samples are: C, O, Na, Mg, Al, Si, S, Cl,
K and Ca. – Indicated that the analyzed dust samples consisted of naturally abundant inorganic
minerals and water soluble salts. • There were some differences between the outdoor and indoor dust samples.
– Na, K, Cl and S were more prevalent in the indoor dust sample compared to outdoor dust in terms of distribution. As the major compositions of water soluble salts, they co-existed with other mineral particles.
– Outdoor dust had higher weight percentages of Al, Si, and Ca as a result of wind blowing of inorganic mineral particles.
– They differed in term of size distribution. The outdoor dust sample had a larger averaged particle size with a bigger variation compared to indoor dust.
• Due to the limited sensitivity of EDS for low atomic order elements, elements such as nitrogen and hydrogen can not detected, even if they are present in the dust sample.
– It is speculated that both (NH4)2SO4 and NH4HSO4 existed in the analyzed indoor dust samples due to the presence of element O and S, which have the CRH of 79% and 40% at the room temperature, respectively.
As originally published in the IPC APEX EXPO Proceedings.

• Different morphology of dust particles reflected the dissimilar compositions.
– Dust particles with sharp boundaries are normally mineral dust particles as shown in the outdoor dust sample.
– Some dust particle is an agglomeration of many particulates together in indoor dust sample. It seems to be small amount of chloride salt mixed quartz and other mineral particles in point 1 in the indoor dust.
– The showing of element S, Cl and Na in the point 2 indicated the presence of water soluble salts, such as NaCl, KCl or NH4HSO4. They normally attached to the mineral particles to form a multi-layer structure.
100.00100.00Totals
0.461.18Ca
3.588.93K
8.4015.06Si
2.133.67Al
22.2122.68O
63.2248.47C
Atomic%Weight%Element
100.00100.00Totals
0.461.18Ca
3.588.93K
8.4015.06Si
2.133.67Al
22.2122.68O
63.2248.47C
Atomic%Weight%Element
Point 1
Point 2
100100100100Totals
3.57.040.821.61Ca
1.292.533.46.55K
9.0516.120.91.58Cl
2.093.37--S
1.512.1217.7424.52Si
--4.86.37Al
--3.143.76Mg
6.927.99--Na
75.6560.8269.1955.61O
Atomic%Weight %Atomic %Weight %
Point 2Point 1Element
Point 1
Point 2
100100100100Totals
3.57.040.821.61Ca
1.292.533.46.55K
9.0516.120.91.58Cl
2.093.37--S
1.512.1217.7424.52Si
--4.86.37Al
--3.143.76Mg
6.927.99--Na
75.6560.8269.1955.61O
Atomic%Weight %Atomic %Weight %
Point 2Point 1Element
the outdoor dust sample with EDS compositional analysis results
the indoor dust sample with EDS compositional analysis results
Compositional Analysis - 2/2
As originally published in the IPC APEX EXPO Proceedings.
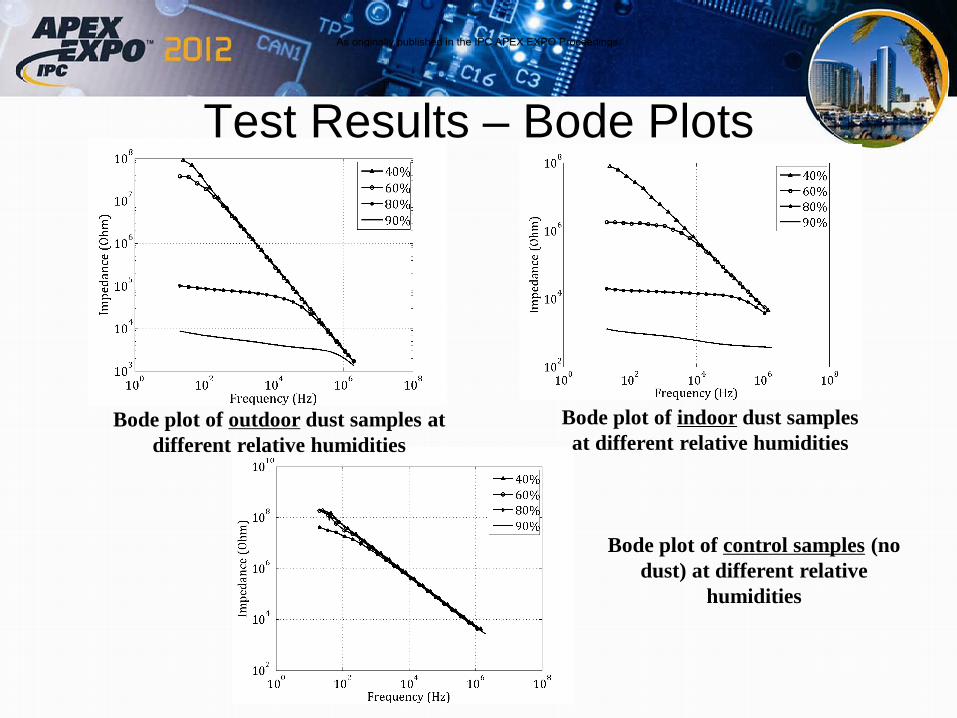
Test Results – Bode Plots
Bode plot of control samples (no dust) at different relative
humidities
Bode plot of outdoor dust samples at different relative humidities
Bode plot of indoor dust samples at different relative humidities
As originally published in the IPC APEX EXPO Proceedings.
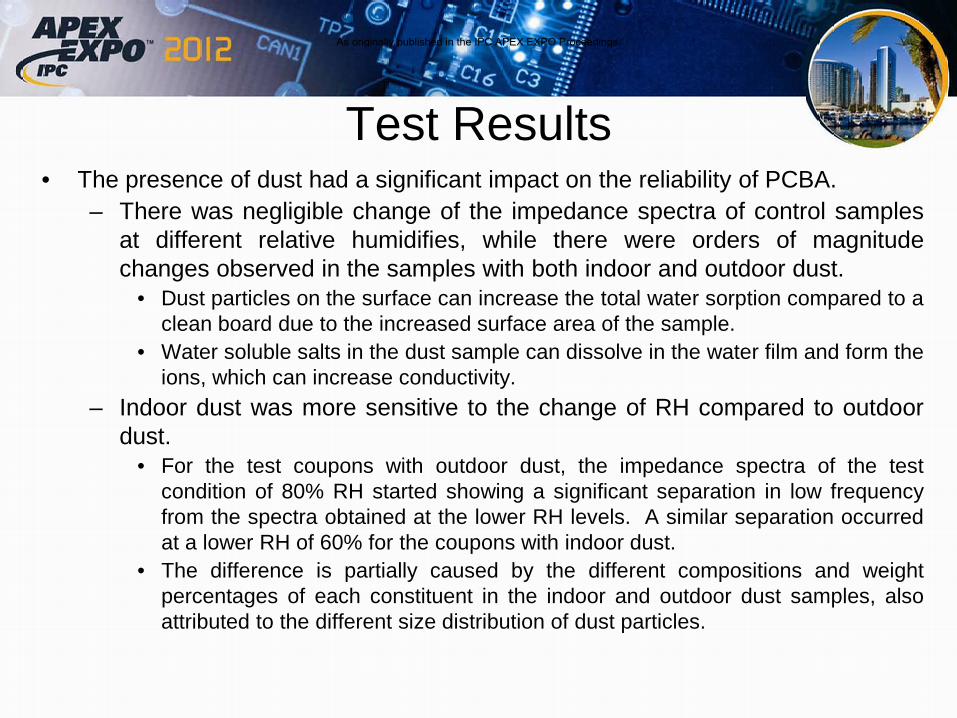
Test Results • The presence of dust had a significant impact on the reliability of PCBA.
– There was negligible change of the impedance spectra of control samples at different relative humidifies, while there were orders of magnitude changes observed in the samples with both indoor and outdoor dust.
• Dust particles on the surface can increase the total water sorption compared to a clean board due to the increased surface area of the sample.
• Water soluble salts in the dust sample can dissolve in the water film and form the ions, which can increase conductivity.
– Indoor dust was more sensitive to the change of RH compared to outdoor dust.
• For the test coupons with outdoor dust, the impedance spectra of the test condition of 80% RH started showing a significant separation in low frequency from the spectra obtained at the lower RH levels. A similar separation occurred at a lower RH of 60% for the coupons with indoor dust.
• The difference is partially caused by the different compositions and weight percentages of each constituent in the indoor and outdoor dust samples, also attributed to the different size distribution of dust particles.
As originally published in the IPC APEX EXPO Proceedings.

Test Results – Nyquist Plots • Nyquist plots show a semicircle and a
tail from a frequency sweep of 20 Hz to 2 MHz.
– We believe that the first semicircle reflects the properties of the dust particles after absorbing water from the air between two electrodes. And the tail corresponds to the electrical properties of the interface between electrodes and the water film.
• Comparing the real component (Z’) at the apparent characteristic frequency in the Nyquist plots, they showed one magnitude drop when relative humidity increased from 80% to 90%.
Nyquist plot of outdoor dust samples at 80% RH
Nyquist plot of outdoor dust samples at 90% RH
As originally published in the IPC APEX EXPO Proceedings.
Conclusions To our knowledge we are the first ones to use IS to analyze the effects of dust. The key findings of this paper are listed below.
– Aqueous solution produced by indoor dust has higher conductivity and low pH compared the one produced by outdoor dust. This result can be correlated to impedance spectrum of both dust samples at the same RH.
– The presence of dust had a significant impact on the reliability of PCBA. – Indoor dust was more sensitive to the change of relative humidity compared
to outdoor dust. – The difference between indoor and outdoor dust is due to weight percentage
and species of the dominant water soluble salts and dust particle sizes in the dust sample. Indoor dust contains more water soluble salts.
– At the same dust deposition density, we observed that test coupons with indoor dust are more susceptible to induce moisture related failures. In the real life usage conditions, indoor dust often has much lower deposition density compared to outdoor dust on the printed circuit assemblies due to the usage of air-filtering system in buildings. We should put real use-case scenarios into consideration when evaluating the impact of dust.
As originally published in the IPC APEX EXPO Proceedings.

Q&A
Thank you!
As originally published in the IPC APEX EXPO Proceedings.


![Reliability estimate of unconfined compressive strength of black …lejpt.academicdirect.org/A30/191_208.pdf · The quarry dust as the name implies, is a dust from quarry stones [8]](https://img.pdfslide.us/doc/110x75/5e500ad976e08a1f931bdbb8/reliability-estimate-of-unconfined-compressive-strength-of-black-lejpt-the-quarry.jpg)