Embed Size (px)
Citation preview

Impact of Dodd-Frank on Small Community Lenders
Brady Brewer
Assistant Professor Department of Agricultural and Applied Economics
University of Georgia [email protected]
Levi Russell Assistant Professor
Department of Agricultural Economics Texas A&M
Selected Paper prepared for presentation at the Agricultural & Applied Economics Association’s 2016
AAEA Annual Meeting, Boston, MA, July 31- August 2, 2016.
Copyright 2016 by Brady Brewer and Levi Russell. All rights reserved. Readers may make verbatim copies
of this document for non-commercial purposes by any means, provided this copyright notice appears on
all such copies.
This is ongoing going, please contact authors before citing to ensure you have the latest version.

1
Impact of Dodd-Frank on Small Community Lenders
Abstract
With the passing of the Dodd-Frank Act in 2010, 10,000 new regulatory restrictions under Title
12 have been imposed on banks. This increase in regulation represents a great burden on financial
institutions as it restricts avenues of revenue and causes an increase in compliance costs. While much
attention has been paid to the Dodd-Frank Act, no empirical evidence exists to show the impact it has
had on financial institutions and their profitability. Even though the Dodd-Frank Act targeted larger
financial institutions, small banks, being defined as a bank with less than $250 million in total assets, are
still regulated. With small community banks being a large provider of agricultural credit for farmers, the
agricultural credit market relies heavily on small community banks being able to provide lending services
to keep farmers in operation. This study examines the impact on profitability of small community banks
and how that affects the availability of credit for the agricultural industry.
Keywords: Banking, Dodd-Frank, Regulation

2
Introduction After the sub-prime mortgage crisis and Great Recession, calls for new regulation of
Wall Street and commercial banks resulted in the Dodd-Frank Wall Street Reform and
Consumer Protection Act of 2010 (Dodd-Frank Act). This act replaced the existing regulatory
framework that had been in place since the 1930s when President Roosevelt enacted the
securities acts of 1933 and 1934 (Skeel, 2010). It was thought, at the time, that this new
legislation would modernize the regulatory framework bringing it into the 21st century so that
American investors and consumers wouldn't have to worry about losing their life savings if their
bank failed.
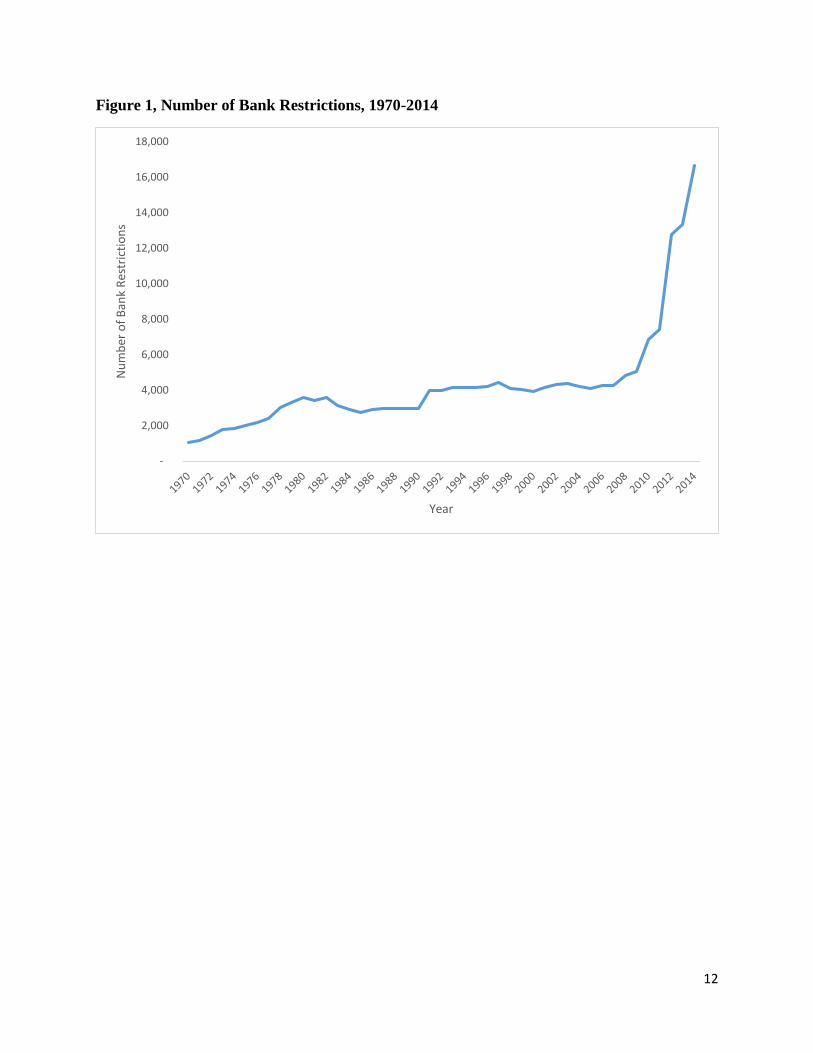
Since the passing of the Dodd-Frank Act in 2010, 10,000 new regulatory restrictions
under Title 12 have been imposed on banks (Figure 1). These restrictions cover a multitude of
topics but two themes defined by the Dodd-Frank Act emerge: limit the risk of contemporary
finance and to limit the impact if a “systemically important institution” were to fail (Skeel,
2010). In accomplishing these two overall themes, Dodd-Frank attempts to single out the
financial institutions that are more likely to cause market failures and attempts to subject them
to more intense scrutiny. These financial institutions are those that have over $50 billion dollars
in assets. (Skeel, 2010)
Despite this emphasis on those financial institutions that have would have the greatest
impact if failure occurred, banks of all sizes have no doubt experienced increased regulatory
oversight. A 2010 survey of small banks reported 80% of respondents stating they saw an
increase in compliance costs at their respective lending institution (Peirce, Robinson and
Stratmann 2014).This increase in compliance burden may decrease the profitability of small

3
banks and make it hard for these banks to grow. With small community banks providing 48.1%
of small business loans, 42.8% of farm lending, and 34.7% of commercial real estate lending,
knowing the impact of Dodd-Frank on the profitability and stability is vital to this contentious
policy debate (Marsh and Norman 2013).
Despite the regulators best efforts to target Dodd-Frank toward those “systemically
important institutions,” the burden on small commercial banks still increased substantially.
Seven of the 16 titles impact small commercial banks (Marsh and Norman, 2013). Anecdotally,
it is easy to see that a bank with over $50 billion dollars of assets can more easily absorb the
compliance costs than a bank with only $175 million of assets.
Surprisingly, with the potential impact this regulation could be having on the
commercial lending industry, very little empirical work has been done to assess how this
increase in regulation is affecting profitability of small commercial banks. The impact on
profitability serves as an important indicator to other equally important questions. If
profitability has decreased, has this led to an increase in bank mergers? There is also the
question about how this affects the availability of credit and how that has affected the recovery
from the Great Recession if credit lines were tightened due to the regulation.
Figure 2 shows the past history of mergers and acquisitions of commercial banks from
1990 to 2015. Since the passing of the Dodd-Frank Act, mergers and acquisitions have
increased. Though there are still fewer mergers and acquisitions than what was seen in the
1990s. While anecdotal evidence from bank managers indicates the increased regulation
increasing the number of mergers and acquisitions (Marsh and Norman, 2013), the overall
numbers are not at historic highs.

4
This paper estimates how Dodd-Frank has affected the profitability of small lenders and
draws conclusions for how this could affect the financial lending sector, specifically how it
pertains to rural communities where a majority of small banks are located and the agricultural
sector is a major part of the economy. The rest of this paper will be organized as follows. An
analytical framework where the main factors that may affect bank profitability is discussed,
then the data and empirical methods are explained, and finally the results of the models are
examined.
Conceptual Model
Regulatory policies affect the profitability of banks by imposing added costs to comply
with the policies and by decreasing revenue making certain investments unattainable or non-
compliant. Several considerations will be analyzed for the multiple channels regulatory policies
travel through to affect the profitability of the commercial lending institution. This section will
discuss the conceptual framework and pertinent past literature to examine the link between
the policy and profitability.
Previous work concerning the impact of the Dodd-Frank Act is limited in the literature.
Much of the previous work has focused on anecdotal evidence. While this can accomplish
much, there is a clear lacking of empirical work currently done in the literature. Identifying the
causal effect of the Dodd-Frank Act on bank profitability and size would prove invaluable in
knowing the impact of this regulation on small community banks.

5
Pierce et al. (2014) present a comprehensive overview of the Dodd-Frank Act and results
of a survey completed by banks addressing the impact of the regulation. Respondents indicated
the Dodd-Frank Act significantly impacted small banks with significantly increased compliance
costs. The survey also revealed that many banks are contemplating mergers which would
reduce the number of banks available to customers. One point of contention in the survey
results was the impact of the Dodd-Frank act on fees and revenues. In the survey, respondents
were split on if fees charged to the customers rose or declined and the same being true for
revenues as well. It is also noted, that due to the location of most small banks, that Dodd-Frank
may negatively impact customers of the small banks if that bank is forced to close due to the
policy since customers have few convenient alternatives. These differences may be due to
competition or macroeconomic effects for each of these banks and highlights the need for a
formal analysis that identifies the effect of the policy.
Impact on Non-Interest Expenses
Marsh and Norman (2013) agree with Pierce et al. (2014) that Dodd-Frank will increase
financial regulatory costs for small banks. The likelihood of merger is increased with the
passage of Dodd-Frank as well. Marsh and Norman (2013) criticize Dodd-Frank as failing to
differentiate between small banks who engage in traditional banking relationships an and the
modern, complex financial services firms, arguing that different policy is needed for each tier of
the financial sector.

6
Impact on Bank Efficiencies
Recent empirical work on bank regulation generally finds that administrative regulation
harms banks while capital requirements are either beneficial or neutral. Specifically,
examinations of bank efficiency (Barth et al., 2013); risk (Gonzalez, 2005); and development,
efficiency, and fragility (Barth et al., 2004) find that administrative regulations increase risk and
decrease efficiency while market-based regulations that improve transparency are beneficial.
Capital requirements can offset some of the perverse incentives of government-provided
deposit insurance. The three studies mentioned above are discussed in detail below.
Barth et al. (2013) uses an input-oriented data envelopment analysis to calculate
efficiency scores for 4,050 banks in 72 countries from 1999-2007. Regression analysis is used to
determine the effects of bank activity and capital regulation stringency on efficiency. Bank
activity regulation is negatively associated with efficiency while capital regulation marginally
improves efficiency. Increases in supervisory power only improve efficiency in countries where
supervisory authority is independent of governments. The authors conclude that market-based
regulations aimed at increasing transparency and disclosure also improve efficiency.
Gonzalez (2005) examines regulatory effects on bank risk using a panel of 251 banks in
36 countries from 1995-1999. Two measures of risk are used: credit risk, the ratio of
nonperforming to total loans, and overall bank risk, the standard deviation of daily bank stock
returns for each year. Measures of risk incentives are bank charter value (measured by Tobin’s
Q) and the presence of government-funded deposit insurance. The author finds that high
charter values and lower regulation combine to incentivize banks to reduce risk. When
7
institutional quality (i.e. high-quality legal system and enforcement of private contracts), these
effects are weaker.
Barth et al. (2004) examines the effects of a host of regulatory, institutional, and market
structure variables on bank development, net interest margin, overhead costs, nonperforming
loans, and national crises for banks in 107 countries. Restrictions on bank activities and
diversification are negatively associated with bank development and stability. Capital
restrictions have little to no effect on most of the variables of interest above except that capital
restrictions
Data
We use bank level data from SNL, a data company that compiles all the Federal Reserve
call report data into one database. Data are from 1990 through 2015. Summary statistics are
found in Table 1. With the Dodd-Frank Act being implemented nationwide and call report data
representing all banks with the US, all 50 states are represented in the data.
The regulatory data is from RegData, a regulatory data base (Borio, 2015). The main
variable of interest is a probability weighted index of the regulatory restriction by Title 12 on
credit intermediaries (NAICS code 522). In addition to the probability weighted index, a word
count index is also used to test for robustness of results. This is an index of all words in Title 12
of the Code of Federal Regulations. The index is normalized so that 2001 is equal to 1. The data
is from 1970 to 2014. Figure 3 shows the increase in the probability weighted index after the
Dodd-Frank Act was passed.
8
Due to the amount of policies that can be in legislation, researchers have used many
proxies for regulatory policies. Two previous measures include page count and word count (Al-
Ubaydli et al., 2015). While simple in nature, these two methods can fail to produce accurate
results as page count nor word count reflect the number of restrictive policies a piece of
legislation may contain. To account for this, Al-Ubaydli et al (2015) create a probability
weighted index of the impact legislation has. A benefit of this index is that it allows for the
analysis of one specific industry according to its respective NAICS code.
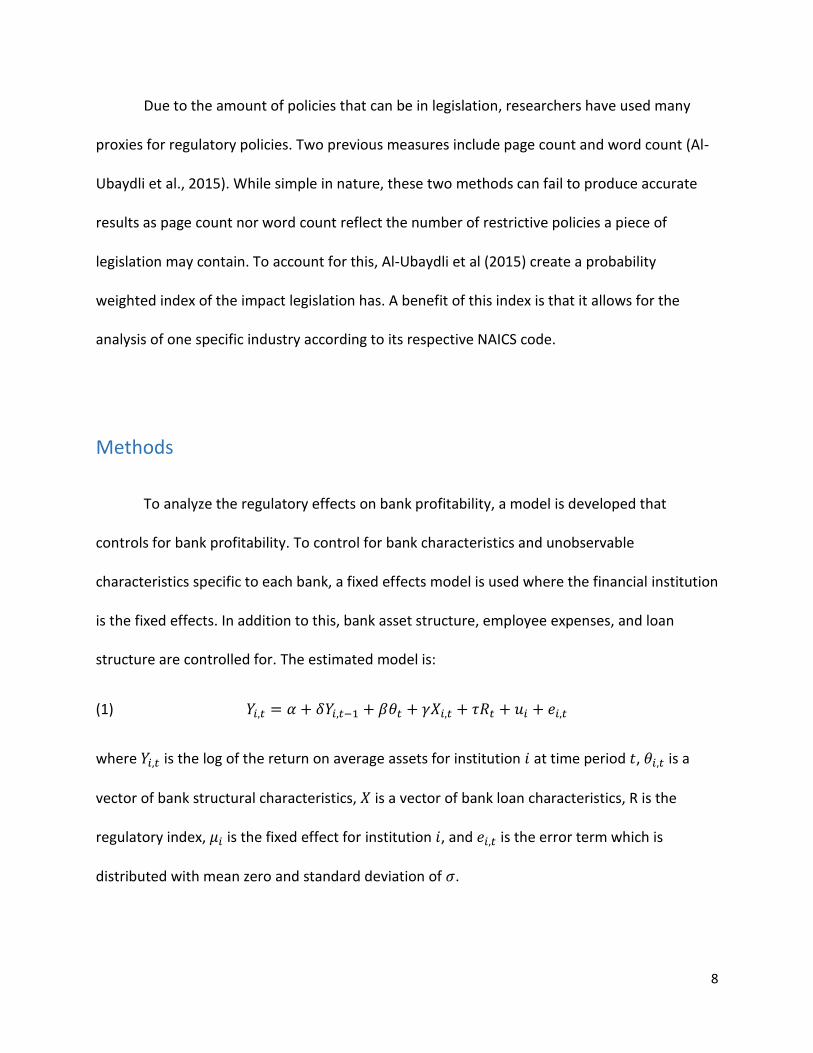
Methods
To analyze the regulatory effects on bank profitability, a model is developed that
controls for bank profitability. To control for bank characteristics and unobservable
characteristics specific to each bank, a fixed effects model is used where the financial institution
is the fixed effects. In addition to this, bank asset structure, employee expenses, and loan
structure are controlled for. The estimated model is:
(1) 𝑌𝑖,𝑡 = 𝛼 + 𝛿𝑌𝑖,𝑡−1 + 𝛽𝜃𝑡 + 𝛾𝑋𝑖,𝑡 + 𝜏𝑅𝑡 + 𝑢𝑖 + 𝑒𝑖,𝑡
where 𝑌𝑖,𝑡 is the log of the return on average assets for institution 𝑖 at time period 𝑡, 𝜃𝑖,𝑡 is a
vector of bank structural characteristics, 𝑋 is a vector of bank loan characteristics, R is the
regulatory index, 𝜇𝑖 is the fixed effect for institution 𝑖, and 𝑒𝑖,𝑡 is the error term which is
distributed with mean zero and standard deviation of 𝜎.

9
To examine how the regulatory index affects small banks, the FDIC definition of a small
bank is used of a bank with less than $250 million in total assets. The model in equation (1) is
analyzed for all banks, banks with less than $250 million in total assets, and for banks with
greater than $250 million in total assets. This allows for the analysis of how the regulation may
affect financial institutions of different size.
To check for robustness, two indexes will be used and the second model will be
estimated. This model is:
(2) 𝑌𝑖,𝑡 = 𝛼 + 𝛿𝑌𝑖,𝑡−1 + 𝛽𝜃𝑡 + 𝛾𝑋𝑖,𝑡 + 𝜏𝑊𝑡 + 𝑢𝑖 + 𝑒𝑖,𝑡
where the regulatory index is replaced by the word count index (𝑊𝑡). Since the word count
index is used in previous literature, this provides a check on how the updated regulatory index
performs and to also ensure the results are similar.
Results and Conclusions
Results for the model are found in Table 2. From the results, the increase in the regulatory index
is statistically significant and negative. Thus, an increase in regulation decreases the profitability of
financial institutions. It is also shown that an increase in regulation decreases the profitability of small
banks more than it does for banks with more than $250 million dollars in assets. This result shows that
the even though the Dodd-Frank Act targets larger banks, small banks are just as affected by the
increase in regulatory oversight.
The robustness check for this model is located in Table 3. For this model, the word count index
of regulatory policies is used instead of the probability weighted regulatory index. Results are similar for

10
this model as those found in Table 2. The word count index is statistically significant and negative. An
increase in the number of words within regulatory policies negatively affects profitability. However, the
magnitude of the word count index is larger than that of the probability weighted index.
Overall, the results of the model shows that the impacts of the Dodd-Frank Act decrease
profitability of financial institutions. Results shows that the impact of regulations was increased for
those banks with less than $250 million in total assets and that the results were robust to using the word
count index instead of the probability weighted index.

11
Works Cited Al-Ubaydili, O., & McLaughlin, P. A. (2015). RegData: A Numerical Database on Industry-Specific
Regulation for all United States Industries and Federal Regulations, 1997-2012. Retrieved from
regdata.org/data/
Barth, J. R., Lin, C., Ma, Y., Seade, J., & Song, F. M. (2013). Do Bank Regulation, Supervision and
Monitoring Enhance or Impede Bank Efficiency. Journal of Banking and Finance, 2879-2892.
Benston, G. J., & Kaufman, G. (1996). The Appropriate Role of Bank Regulation. The Economic Journal,
688-697.
Borio, C., Gambacorta, L., & Hofmann, B. (2015, October). The Influence of Monetary Policy on Bank
Profitability. BIS Working Papers.
Brewer, B. E., Briggeman, B., Featherstone, A., & Wilson, C. (2015). Kansas State University Agricultural
Lender Survey. Kansas State University, Department of Agricultural Economics, Manhattan, KS.
Retrieved from http://www.ageconomics.ksu.edu/p.aspx?tabid=705
Briggeman, B. C., Gunderson, M. A., & Gloy, B. A. (2009, July 31). The Financial Health of Agricultural
Lenders.
Campbell, T. S., Chan, Y.-S., & Marina, A. M. (1992). An Incentive-Based Theory of Bank Regulation.
Journal of Finacial Intermediation, 255-276.
Diamond, D., & Dybvig, P. (1986). Banking Theory, Deposit Insurance, and Bank Regulation. The Journal
of Business, 55-68.
Kaufman, G. G. (1996). Bank Failures, Systemic Risk, and Bank Regulation. Cato Journal.
Marsh, T. D., & Norman, J. W. (2013). The Impact of Dodd-Frank on Community Banks. American
Enterprise Institute.
Peirce, H., Robinson, I., & Stratmann, T. (2014). How are Small banks Faring Under Dodd-Frank.
Arlington, VA: Mercatus Center, George Mason University.
Skeel Jr, D. A. (2010). The New Financial Deal: Understanding the Dodd-Frank Act and its (Unintended)
Consequences. Faculty Scholarship.
12
Figure 1, Number of Bank Restrictions, 1970-2014
-
2,000
4,000
6,000
8,000
10,000
12,000
14,000
16,000
18,000
Nu
mb
er o
f B
ank
Res
tric
tio
ns
Year

13
Figure 2, Number of Mergers and Acquisitions, 1990-2015
0
100
200
300
400
500
600
700
Mer
gers
an
d A
cqu
isit
ion
s
Year
Number of Mergers and Buyouts

14
Figure 3, Probability-Weighted Index of Title 12 Regulatory Restrictions, 1970-2014
0.0
0.5
1.0
1.5
2.0
2.5
3.0
3.5
4.0
4.5
Pro
bab
ility
We
igh
ted
Ind
ex
Year

Table 1, Summary Statistics
Variable Observations Mean
Standard Deviation Min Max
Return on Average Assets 127,246 1.00 3.07 -670.37 129.94
Yield over Cost of Funds 126,932 3.85 1.68 0.00 71.27
Equity to Assets 128,314 11.36 7.73 0.07 99.97
Loan to Deposits 127,608 71.60 21.88 0.00 299.78
Salary to Average Assets 127,254 1.87 3.61 0.00 457.09
Net Charge Offs to Loans 126,537 0.37 0.87 -30.26 45.20
% Farm Loans 124,948 7.17 8.88 0.00 100.00
% Construction Loans 124,947 5.04 6.91 0.00 98.67
% Single Family Loans 124,939 29.55 19.23 0.00 100.03
% Multi Family Loans 127,610 1.76 3.89 0.00 100.00
% Commercial Loans 124,947 18.36 14.44 0.00 100.00
% Other Loans 142,875 45.84 28.54 -13.71 100.00
Regulatory Index 142,875 1.36 0.81 0.72 4.03
Word Count Index 142,875 1.17 0.37 0.74 2.31

1
Table 2, Fixed Effects Model Results for All Banks, Small Banks, and Large Banks
All Banks Banks <$250 Mil Banks >$250 Mil
Variable Coefficient Standard Error
Coefficient
Standard Error
Coefficient
Standard Error
Return on Average Assets 0.06828* 0.00312 0.0601* 0.003615 0.0905* 0.0064
Yield over Cost of Funds 0.04125* 0.00127 0.0310* 0.001334 0.1198* 0.0044
Equity to Assets 0.02265* 0.00079 0.0215* 0.000894 0.0260* 0.0019
Loan to Deposits 0.00296* 0.00014 0.0036* 0.000161 0.0001 0.0003
Salary to Average Assets 0.00347 0.00274 0.0022 0.002938 0.0293* 0.0093
Net Charge Offs to Loans -0.23486* 0.00291 -0.2484* 0.003451 -0.2523* 0.0058
% Farm Loans -0.00087** 0.00044 -0.0010** 0.000453 -0.0052** 0.0024
% Construction Loans -0.00288* 0.00041 -0.0031* 0.000506 -0.0014 0.0009
% Single Family Loans -0.00149* 0.00025 -0.0026* 0.0003 -0.0007 0.0006
% Multi Family Loans -0.00435* 0.00091 -0.0017 0.001169 -0.0067* 0.0016
% Commercial Loans -0.00567* 0.00025 -0.0056* 0.000293 -0.0081* 0.0006
Regulatory Index -0.04978* 0.00210 -0.0649* 0.002571 -0.0352* 0.0041
Constant -0.33503* 0.01719 -0.2925* 0.019169 -0.3497* 0.0496
*,**,*** indicate significance at the 99%, 95% and 90% level respectively
N=99,241
𝑅2 = 0.11
N=77,920
𝑅2 = 0.11
N=21,321
𝑅2 = 0.16

2
Table 3, Robustness Check, Fixed Effects Model using Word Count Index
Banks <$250 Mil
Variable
Coefficient Standard Error
Return on Average Assets 0.0579* 0.0036
Yield over Cost of Funds 0.0285* 0.0013
Equity to Assets 0.0219* 0.0009
Loan to Deposits 0.0037* 0.0002
Salary to Average Assets 0.0024 0.0029
Net Charge Offs to Loans -0.2478* 0.0034
% Farm Loans -0.0003 0.0005
% Construction Loans -0.0022* 0.0005
% Single Family Loans -0.0023* 0.0003
% Multi Family Loans -0.0011 0.0012
% Commercial Loans -0.0049* 0.0003
Regulatory Index -0.1676* 0.0060
Constant -0.2203* 0.0194
*,**,*** indicate significance at the 99%, 95% and 90% level respectively
N=77,920
𝑅2 = 0.11