Embed Size (px)
Citation preview
IMPACT OF DIFFERENT BUFFERS ON MEASURES OF POST-RUMINAL
FERMENTATION
by
Kayla Neiderfer
A thesis submitted to the Faculty of the University of Delaware in partial fulfillment of the requirements for the degree of a Bachelor’s of Science Honors Degree in Pre-Veterinary Medicine and Animal Biosciences with Distinction
Spring 2017
© 2017 Kayla Neiderfer All Rights Reserved
IMPACT OF DIFFERENT BUFFERS ON MEASURES OF POST-RUMINAL
ACIDOSIS
by
Kayla Neiderfer
Approved: __________________________________________________________ Dr. Tanya Gressley, Ph.D. Professor in charge of thesis on behalf of the Advisory Committee Approved: __________________________________________________________ Dr. Robert Dyer, DVM Committee member from the Department of Animal and Food Science Approved: __________________________________________________________ Dr. Rolf Joerger, Ph.D. Committee member from the Board of Senior Thesis Readers Approved: __________________________________________________________ Dr. Michael Arnold, Ph.D. Directory, University Honors Program
iii
ACKNOWLEDGMENTS
I would like to thank my thesis director, Dr. Tanya Gressley, for all of the
opportunities she has given me as well as her guidance and encouragement over the
past four years. I would not have been able to do this project without the help of
Kassandra Moyer, Alexis Trench, Katherine Pacer, and Michael Palilo who helped
with my trial throughout the summer and waking up at all hours of the night to help
with sampling. I would also like to thank Elizabeth Hellings, Shane Cronin, Sofia
Bialkowski and Ashley Taylor for helping me prepare my many samples for analysis.
Also, the guidance and assistance I received from the graduate students Amanda
Barnard, Stephanie Polukis, and Becca Savage was invaluable in completing this
project. A special thank you to Amanda Barnard for helping me through the entire
process and being a mentor to me throughout my experiences with undergraduate
research. A big thank you to Mr. Ron Gouge, Mr. Richard Morris, and Mr. Mark
Baker for their help with the care of dairy cows throughout my trial. Also, thanks to
the Undergraduate Research Program who have provided guidance and support in
writing my thesis. Lastly, I would like to thank all of my friends and family for their
encouragement and support throughout this process.
iv
TABLE OF CONTENTS
LIST OF TABLES .................................................................................................... vi LIST OF FIGURES ................................................................................................. vii ABSTRACT ............................................................................................................ viii CHAPTERS
1 LITERATURE REVIEW .............................................................................. 1
1.1 Bovine Digestions ................................................................................. 1 1.2 The Rumen ............................................................................................ 2 1.3 Small and Large Intestines .................................................................... 3 1.4 Rumen Acidosis .................................................................................... 4 1.5 Post-Ruminal Acidosis ......................................................................... 5 1.6 Release of Endotoxins in the Gastrointestinal Tract ............................. 8 1.7 Buffers ................................................................................................... 9 1.8 Post-Ruminal Starch Infusions ........................................................... 11 1.9 Objectives and Hypothesis .................................................................. 11
2 MATERIALS AND METHODS ................................................................. 13
2.1 Animals and Treatment ....................................................................... 13 2.2 Feed Samplings and Analyses ............................................................ 15 2.3 Sample Collection ............................................................................... 15 2.4 Sample Analysis .................................................................................. 16 2.5 Statistical Analysis .............................................................................. 17
3 RESULTS .................................................................................................... 19
3.1 Feed intake and Milk Component Analysis ........................................ 19 3.2 Rumen Sample Results ....................................................................... 19
3.2.1 Rumen Volatile Fatty Acids .................................................... 19 3.2.2 Rumen pH ............................................................................... 19
3.3 Fecal Sample Results .......................................................................... 20
3.3.1 Fecal Dry Matter ..................................................................... 20 3.3.2 Fecal Volatile Fatty Acids ...................................................... 20 3.3.3 Fecal pH .................................................................................. 21
3.4 LPS and Digestibility .......................................................................... 21
4 DISCUSSION .............................................................................................. 22

v
REFERENCES ........................................................................................................ 26 APPENDICIES
A TABLES ...................................................................................................... 29 B FIGURES ..................................................................................................... 36
vi
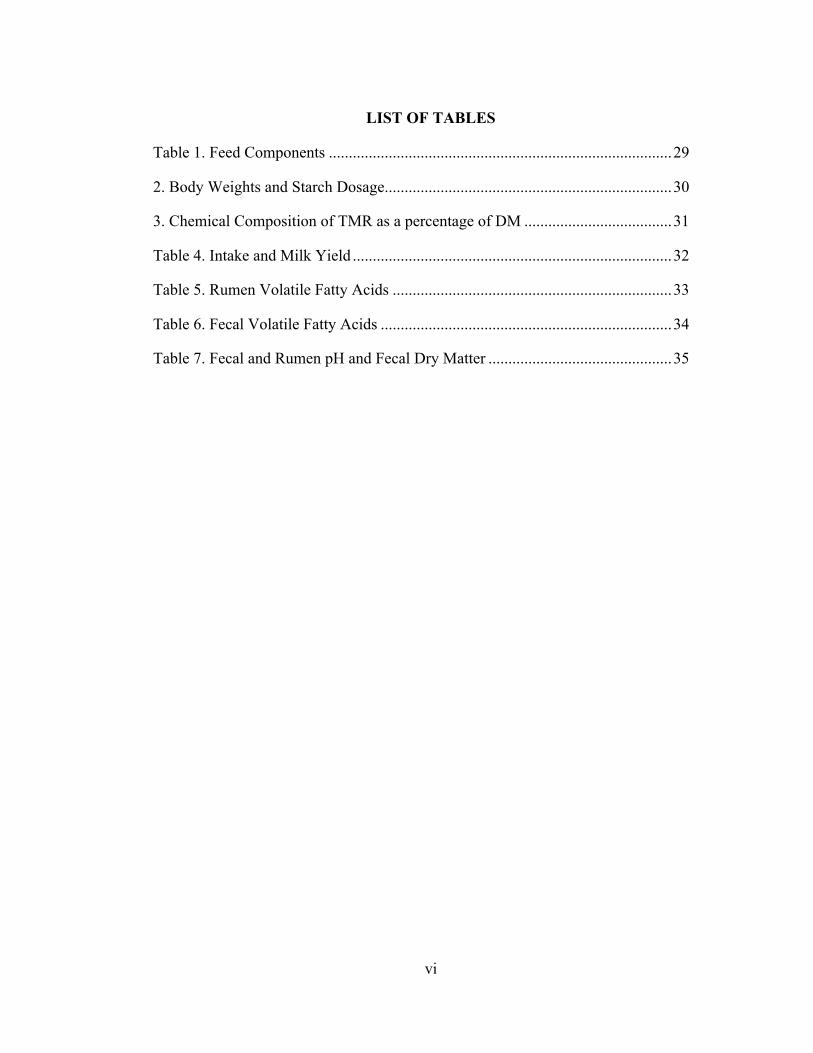
LIST OF TABLES
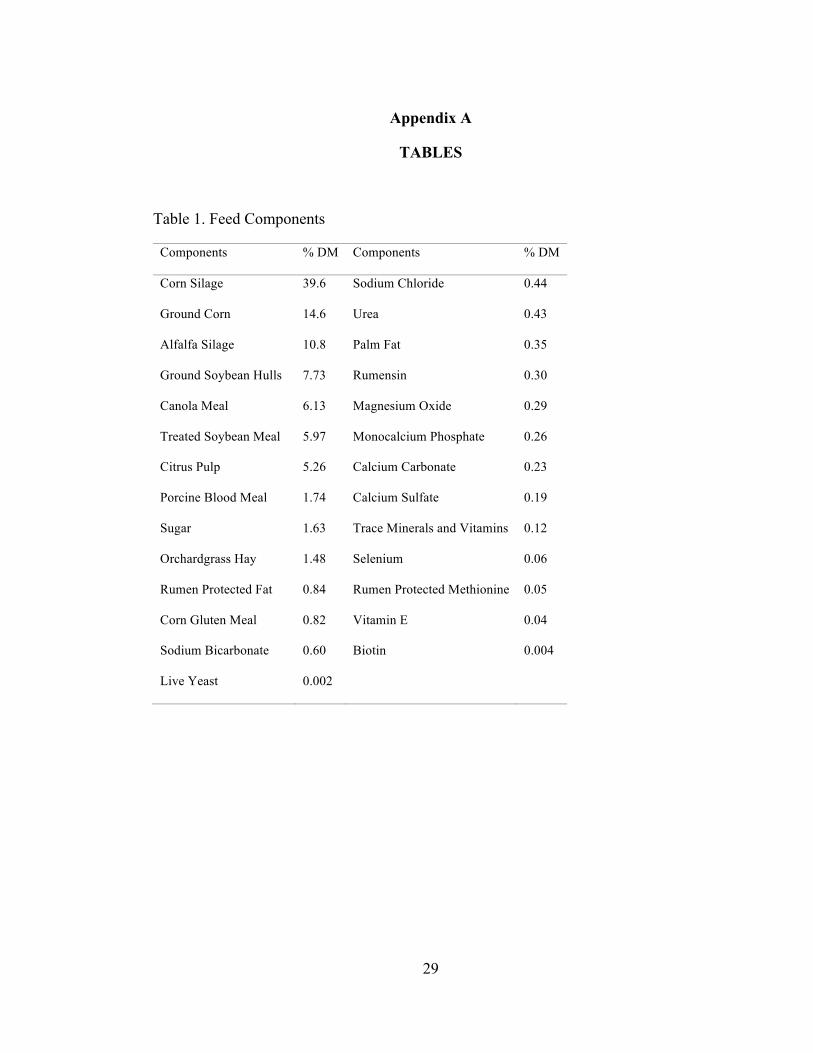
Table 1. Feed Components ...................................................................................... 29
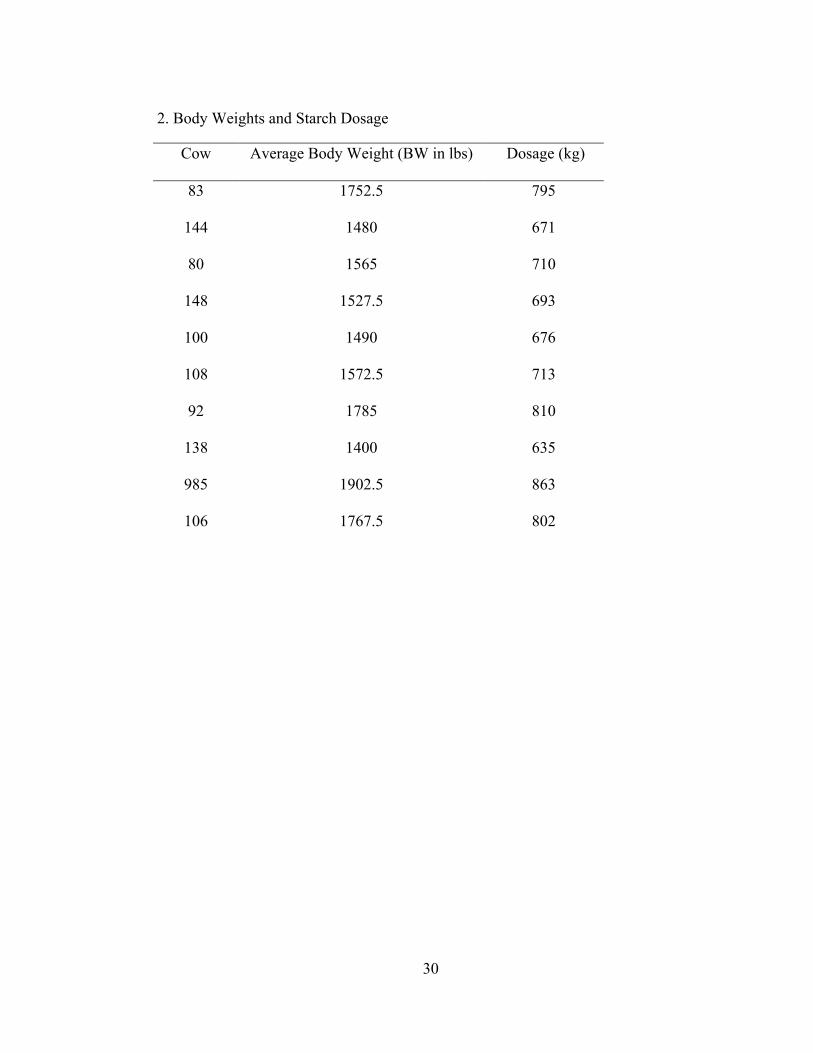
2. Body Weights and Starch Dosage ........................................................................ 30
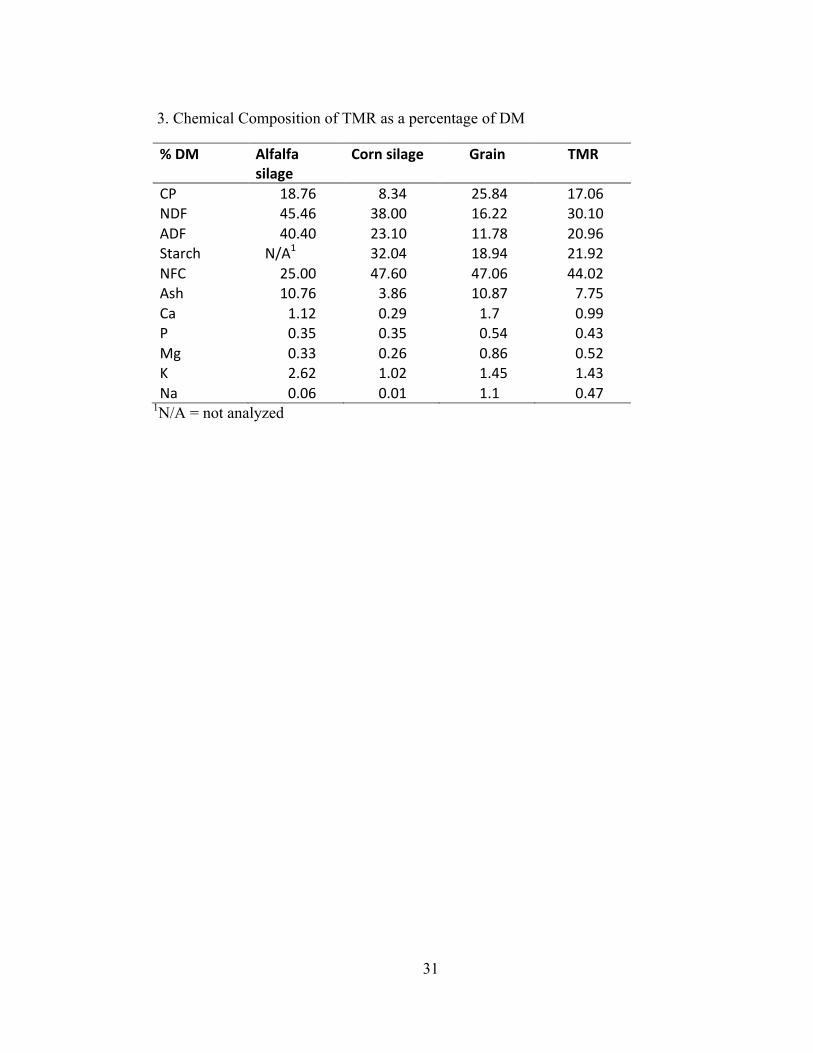
3. Chemical Composition of TMR as a percentage of DM ..................................... 31
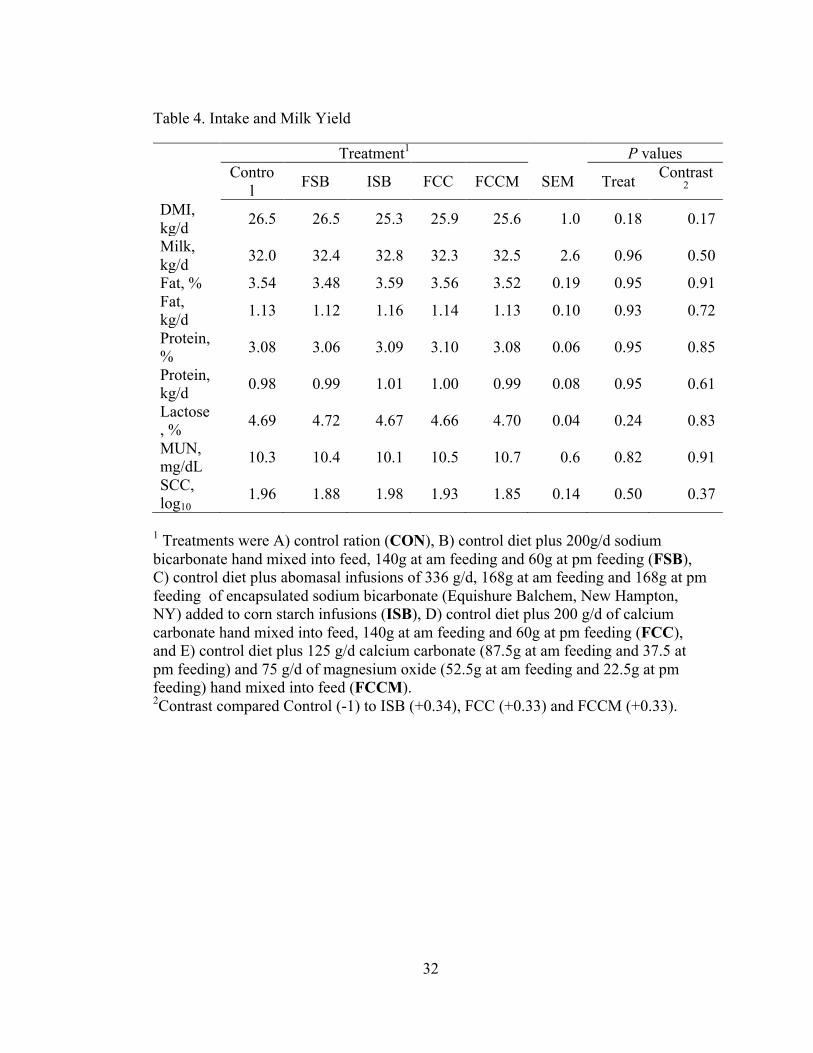
Table 4. Intake and Milk Yield ................................................................................ 32
Table 5. Rumen Volatile Fatty Acids ...................................................................... 33
Table 6. Fecal Volatile Fatty Acids ......................................................................... 34
Table 7. Fecal and Rumen pH and Fecal Dry Matter .............................................. 35
vii
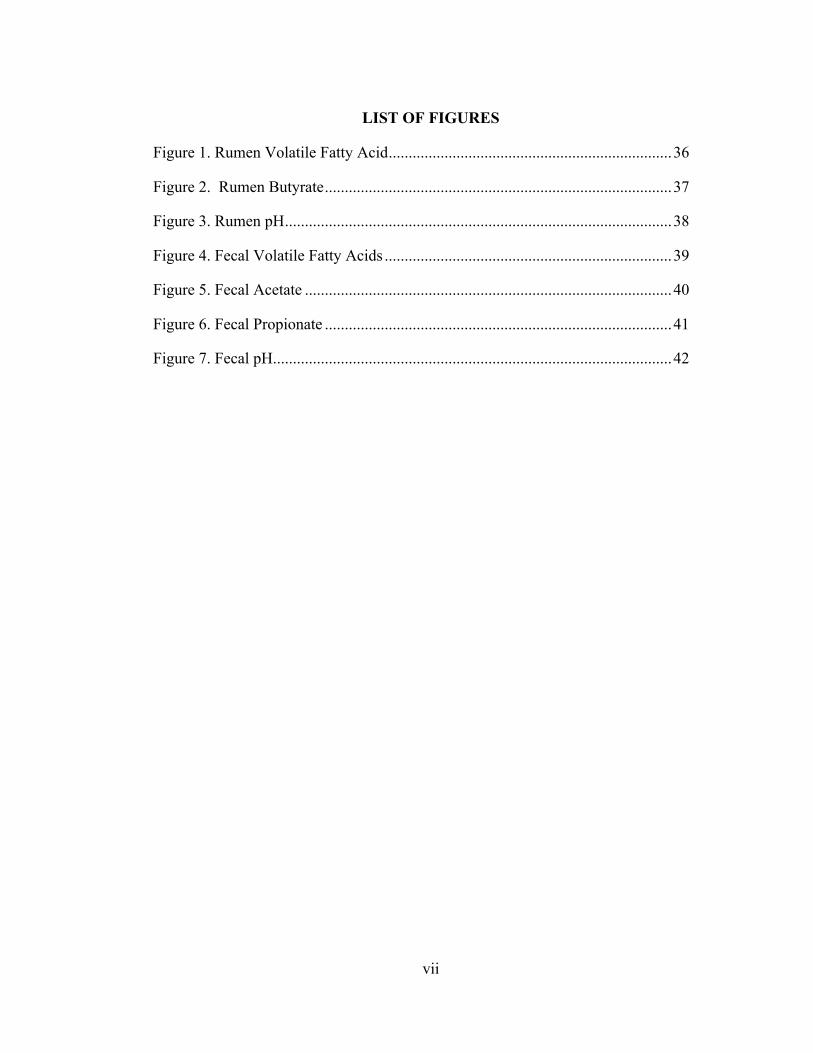
LIST OF FIGURES
Figure 1. Rumen Volatile Fatty Acid ....................................................................... 36
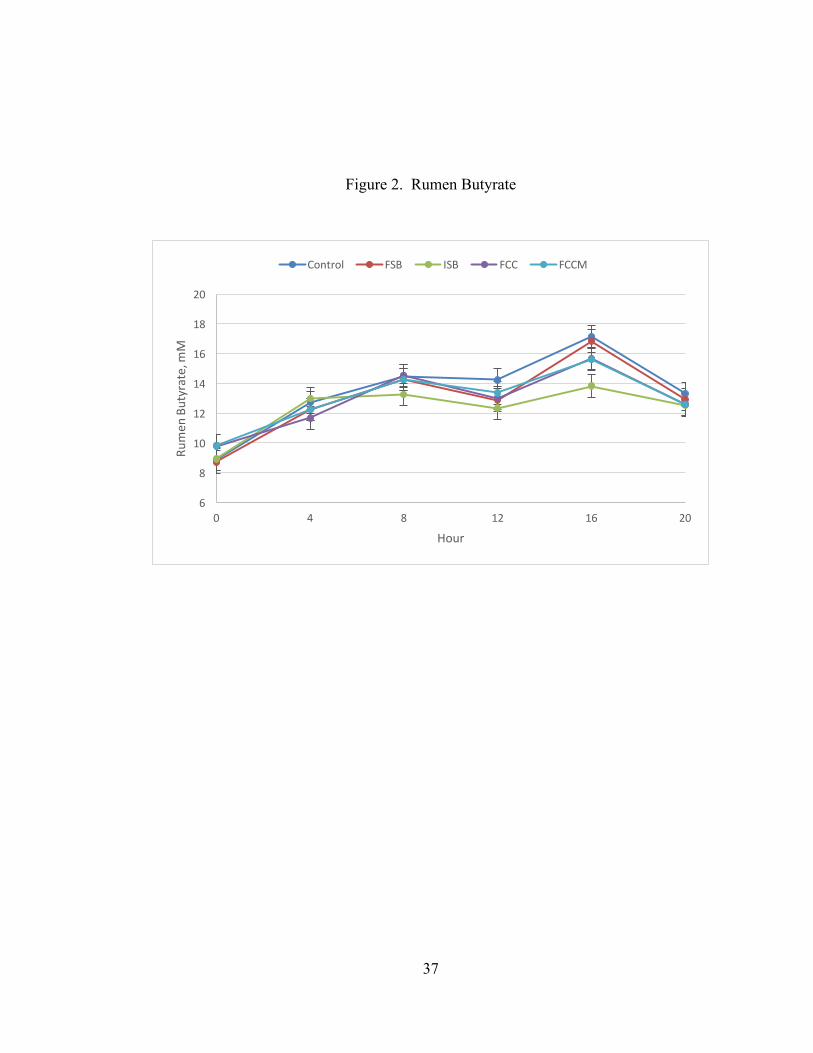
Figure 2. Rumen Butyrate ....................................................................................... 37
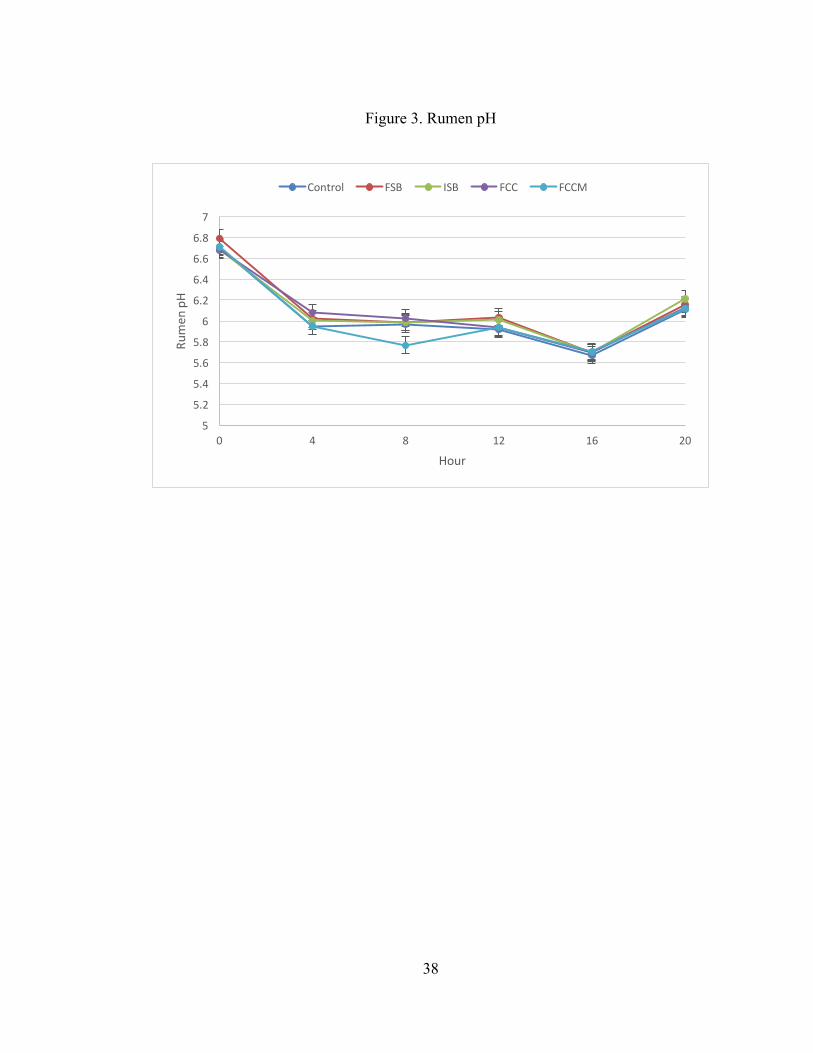
Figure 3. Rumen pH ................................................................................................. 38
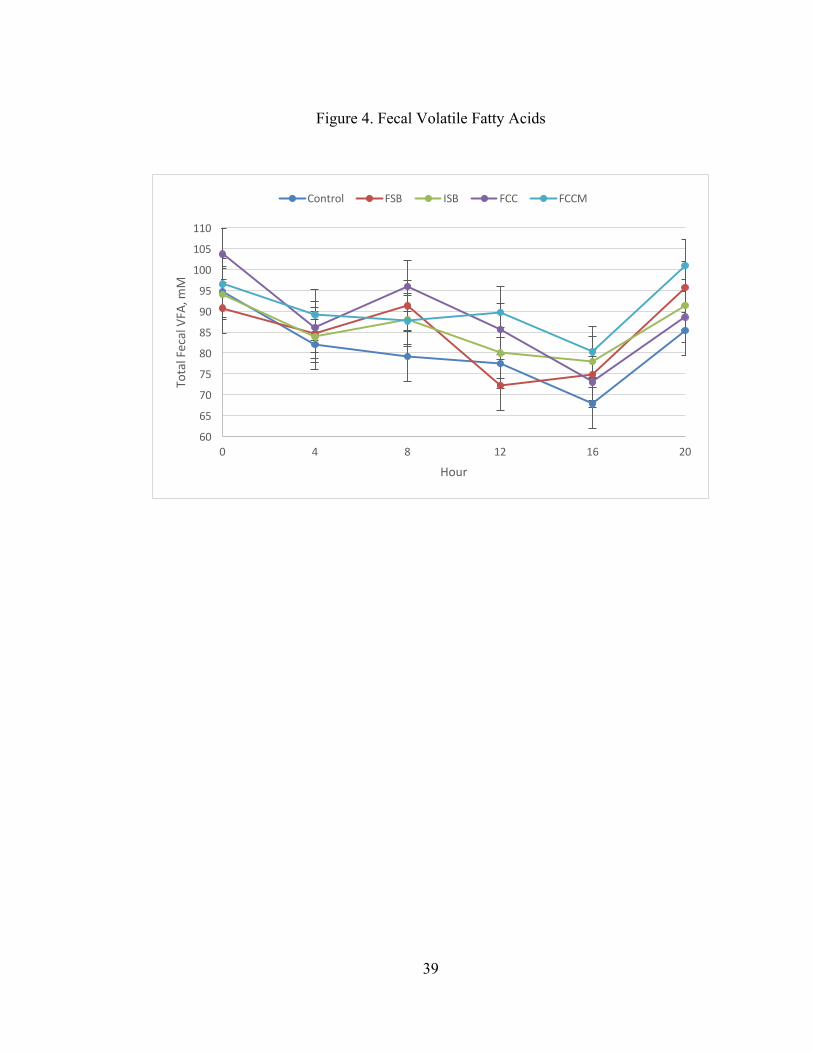
Figure 4. Fecal Volatile Fatty Acids ........................................................................ 39
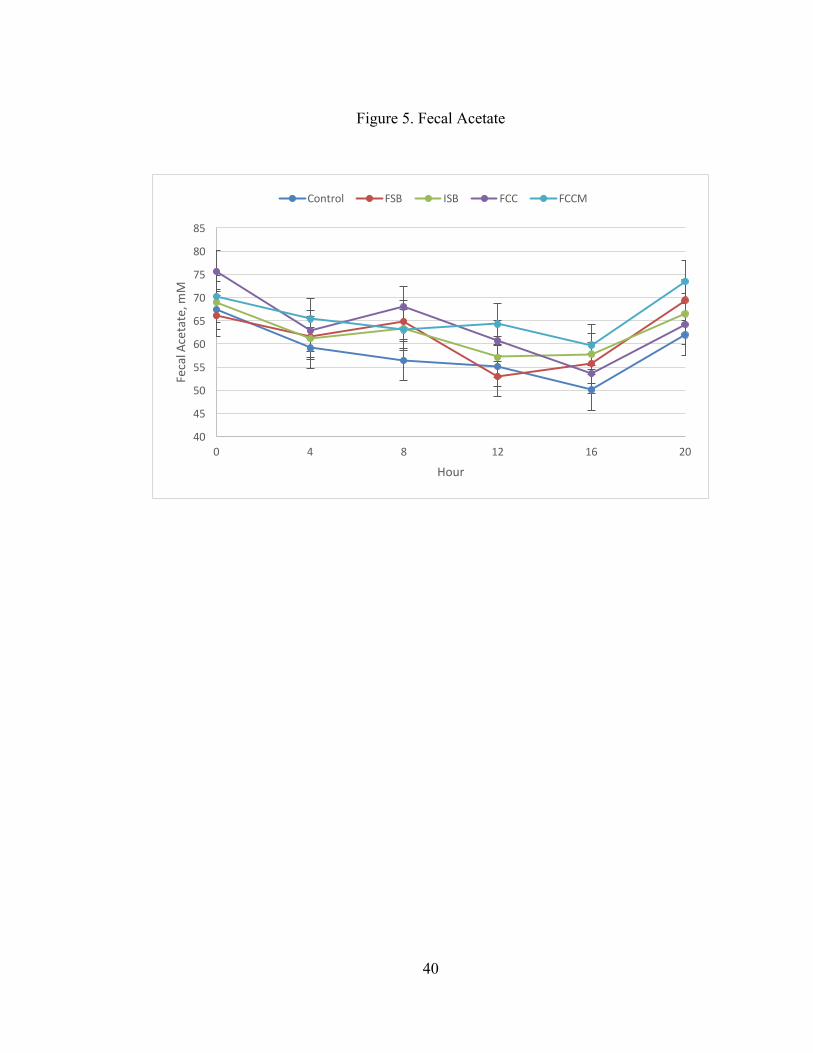
Figure 5. Fecal Acetate ............................................................................................ 40
Figure 6. Fecal Propionate ....................................................................................... 41
Figure 7. Fecal pH .................................................................................................... 42
viii
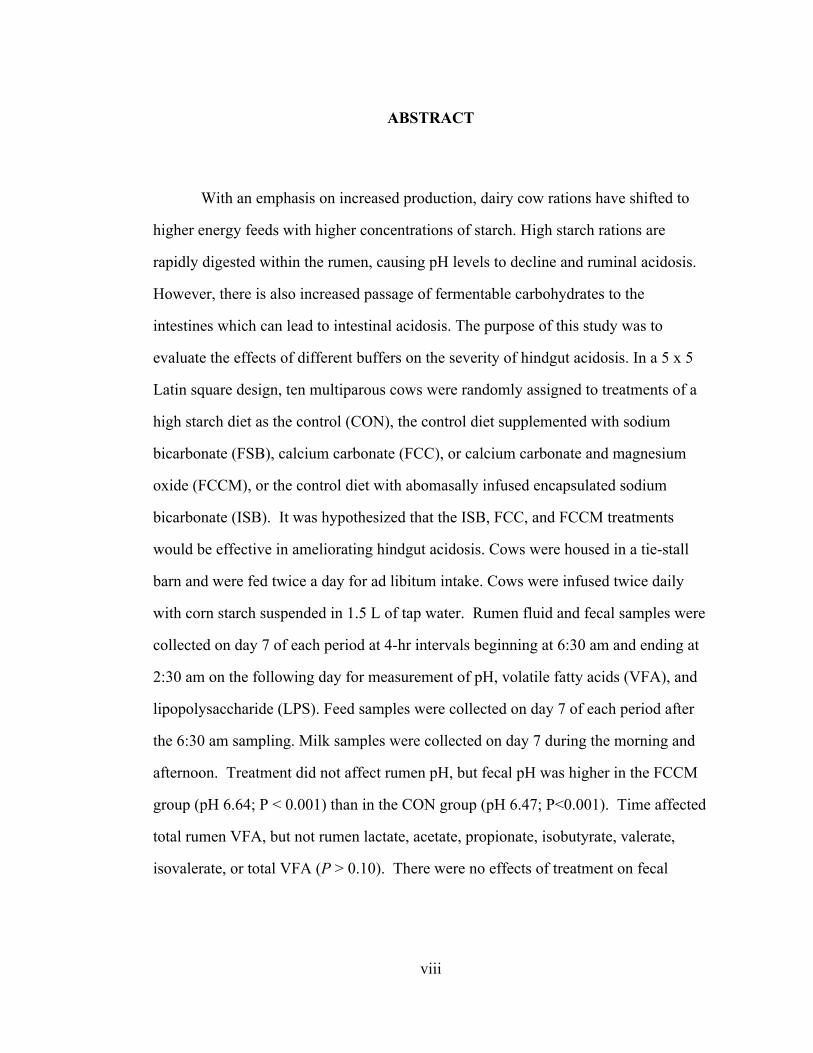
ABSTRACT
With an emphasis on increased production, dairy cow rations have shifted to
higher energy feeds with higher concentrations of starch. High starch rations are
rapidly digested within the rumen, causing pH levels to decline and ruminal acidosis.
However, there is also increased passage of fermentable carbohydrates to the
intestines which can lead to intestinal acidosis. The purpose of this study was to
evaluate the effects of different buffers on the severity of hindgut acidosis. In a 5 x 5
Latin square design, ten multiparous cows were randomly assigned to treatments of a
high starch diet as the control (CON), the control diet supplemented with sodium
bicarbonate (FSB), calcium carbonate (FCC), or calcium carbonate and magnesium
oxide (FCCM), or the control diet with abomasally infused encapsulated sodium
bicarbonate (ISB). It was hypothesized that the ISB, FCC, and FCCM treatments
would be effective in ameliorating hindgut acidosis. Cows were housed in a tie-stall
barn and were fed twice a day for ad libitum intake. Cows were infused twice daily
with corn starch suspended in 1.5 L of tap water. Rumen fluid and fecal samples were
collected on day 7 of each period at 4-hr intervals beginning at 6:30 am and ending at
2:30 am on the following day for measurement of pH, volatile fatty acids (VFA), and
lipopolysaccharide (LPS). Feed samples were collected on day 7 of each period after
the 6:30 am sampling. Milk samples were collected on day 7 during the morning and
afternoon. Treatment did not affect rumen pH, but fecal pH was higher in the FCCM
group (pH 6.64; P < 0.001) than in the CON group (pH 6.47; P<0.001). Time affected
total rumen VFA, but not rumen lactate, acetate, propionate, isobutyrate, valerate,
isovalerate, or total VFA (P > 0.10). There were no effects of treatment on fecal
ix
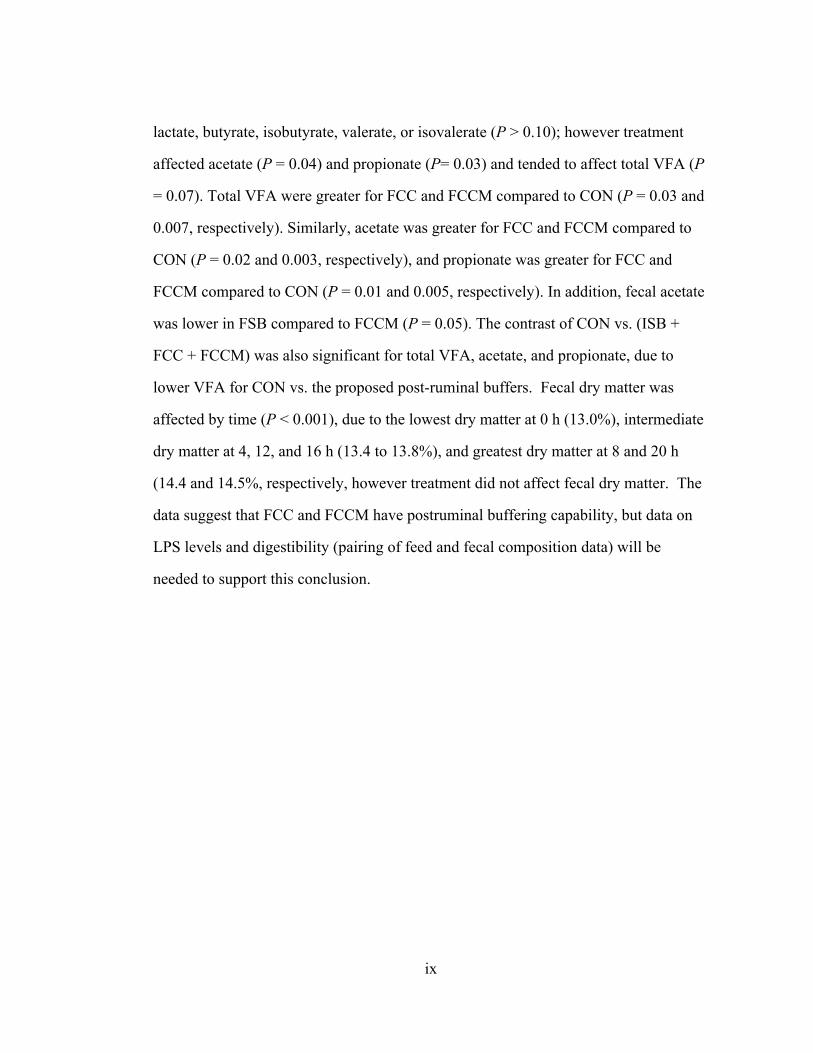
lactate, butyrate, isobutyrate, valerate, or isovalerate (P > 0.10); however treatment
affected acetate (P = 0.04) and propionate (P= 0.03) and tended to affect total VFA (P
= 0.07). Total VFA were greater for FCC and FCCM compared to CON (P = 0.03 and
0.007, respectively). Similarly, acetate was greater for FCC and FCCM compared to
CON (P = 0.02 and 0.003, respectively), and propionate was greater for FCC and
FCCM compared to CON (P = 0.01 and 0.005, respectively). In addition, fecal acetate
was lower in FSB compared to FCCM (P = 0.05). The contrast of CON vs. (ISB +
FCC + FCCM) was also significant for total VFA, acetate, and propionate, due to
lower VFA for CON vs. the proposed post-ruminal buffers. Fecal dry matter was
affected by time (P < 0.001), due to the lowest dry matter at 0 h (13.0%), intermediate
dry matter at 4, 12, and 16 h (13.4 to 13.8%), and greatest dry matter at 8 and 20 h
(14.4 and 14.5%, respectively, however treatment did not affect fecal dry matter. The
data suggest that FCC and FCCM have postruminal buffering capability, but data on
LPS levels and digestibility (pairing of feed and fecal composition data) will be
needed to support this conclusion.
1
Chapter 1
LITERATURE REVIEW
1.1 Bovine Digestions
The ruminant digestive system varies anatomically from that of monogastric
animals as it evolved to enable the utilization of a forage-based diet. Feed in
ruminants is channeled through three distinct diverticula (located towards the end of
the esophagus) before entering the glandular stomach. The three diverticula are
referred to as the forestomach and are lined with non-glandular stratified squamous
epithelium. Within these three compartments, digestion is primarily done by
microorganisms which ferment feed materials. The largest of the diverticula are the
first and second compartments which are the rumen and reticulum, respectively. The
two compartments are collectively referred to as the ruminoreticulum because of their
functional and anatomical similarities. In the beginning stages, digesta is able to move
between the shared space located cranially between the two compartments. The lower
part of these compartments are separated by the muscular ruminoreticular fold
(Frandson et al., 2009). The last of the three diverticula is the omasum, a spherical
organ containing muscular laminae. From the omasum, digesta travels into the
glandular stomach known as the abomasum. The abomasum contains two glandular
regions, anatomically similar to the fundic gland region and the pyloric gland region
2
of the monogastric stomach. These two glandular regions secrete water, hydrochloric
acid, mucus, and pepsin, collectively known as gastric juices, to begin the chemical
portion of digestion. Some of the protein in the digesta is hydrolyzed by pepsin, but
further proteolysis as well as hydrolysis of carbohydrates and lipids takes place in the
small intestines. The intestinal epithelial cells absorb the nutrients released by this
breakdown and the remainder of the digesta continues to the large intestine. The large
intestine is mainly responsible for water reabsorption and further fermentation of
carbohydrates (Frandson et al. 2009).
1.2 The Rumen
The rumen acts as a fermentation chamber to begin the digestion of the forage
based diet consumed by foregut fermenters such as cattle. Carbohydrates that are
commonly seen in the plant based diet of ruminants are soluble fibers, hemicellulose,
starches, and cellulose. The latter cannot be digested by mammals as they do not
possess enzymes that can cleave the presences of b-linkages between the glucose
molecules within cellulose (Pond et al., 2005). Therefore, due to the presence of
cellulose in the cell walls of plants, cattle have adapted numerous techniques to get the
most out of the feed they ingest, two of which are rumination and a mutualistic
relationship with the bacteria that make up their gut microbiome. The process of
rumination, in which the animal regurgitates larger pieces of food to be further broken
down mechanically before re-swallowing, results in increased surface area available
3
for bacteria to aid in digestion. The delay in digestion allows for further solubilizing
of the fibrous materials of the cell wall in forages (Mackie, 2002). A wide array of
microorganisms that reside in the rumen are responsible for the fermentation of
carbohydrates found within forages, some of which the animal would not be able to
digest on its own. The microbiome of the rumen is dominated by bacteria that ferment
starch and perform cellulolytic digestions, releasing volatile fatty acids (VFA) that can
be absorbed directly through the rumen wall, but ciliate and flagellate protozoa,
bacteriophages, anaerobic fungi are also present (Jewel et al., 2015).
1.3 Small and Large Intestines
After passing through the abomasum, partially digested feed and rumen
microbes enter the small intestines as digesta. Enzymes break down proteins, lipids,
and some carbohydrates, and the monomers (amino acids, fatty acids and
monosaccharides) are absorbed through the intestinal epithelium. Any feed or
microbes that are not digested and absorbed by the small intestines are then passed
through to the large intestine where microbiota are present that further breakdown
previously undigested carbohydrates, a process referred to as hindgut fermentation.
This fermentation produces VFAs, which are absorbed through the epithelial wall of
the large intestines. Anything that is not degraded and absorbed by the end of the large
intestines is excreted as feces. On average 41% of organic matter is fermented within
the rumen, 26% is absorbed within the small intestine, and 4% is fermented within the
4
large intestine. The remaining 29% of organic matter is passed as feces (Gressley et
al., 2012).
1.4 Rumen Acidosis
In an effort to keep up with the energy needs of high producing dairy cattle,
total mixed rations (TMR) for dairy cattle are high in rapidly fermentable
carbohydrates, primarily starch. Rumen acidosis is characterized by the decrease of
ruminal pH leading to an increase in VFA and propionate production, increases in
microbial endotoxins, decreased milk production, and reduced dry matter intake.
Rumen acidosis also reduces rumen motility, thereby reducing rumen efficiency, and
salivary production, which provides buffers and acts as a lubricant to protect the walls
of digestive organs (Slyter, 1976). Buffers like sodium bicarbonate and magnesium
carbonate can also be used to increase rumen pH immediately after feeding and
maintain a less acidic pH (Schaefer et al., 1982). The proportion of cellulolytic
bacteria is decreased by a drop in pH, making digestion of a forage-based diet more
challenging. In addition to decreased efficiency and tissue damage, acidosis also
increases endotoxin levels within the rumen. After only 24 hours of feeding high
concentrate diets, lactobacilli become the most numerous microbe in the rumen.
Microbial endotoxin-producing coliforms and C. perfringens increase as well. Under
acidosis conditions in the large intestines, microbial endotoxins levels increase in the
cecum (Slyter, 1976) Endotoxin is a term used to describe toxins released by gram-
5
negative bacteria, such as lipopolysaccharides (LPS), during periods of growth or
during lysis of these bacteria. As populations of lactobacilli grow and produce lactic
acid, many bacteria are lysed because of their inability to survive in the low pH
environment; while other forms of bacteria that can be considered acidophilic thrive in
the low pH environment (Mao et al., 2013).
In a study completed by Steele et al. (2011), four mature non-lactating dairy
cows were fed high forage (HF) diets, then transitioned to a high grain (HG) diet for a
three-week period. After completion of the three-week period, cows were transitioned
back to the HF diet and fed this diet for another three weeks. Rumen pH was measured
weekly throughout the study and biopsies of rumen papillae were taken during the first
and last week of each feeding period. Rumen pH dropped during the first week of the
HG diet, indicating subacute ruminal acidosis (SARA). During this time, microscopic
examination of the papillae showed a decrease in stratum basal, spinosum, and
granulosum layers as well as a reduction in the total depth of the rumen epithelium.
The most dramatic differences in the papillae were seen during the decrease in rumen
pH when SARA was diagnosed (Steele et al. 2011). These results demonstrated that
when damage occurs in the rumen from SARA, the junctions between cells loosen.
Potentially allowing endotoxins into the peripheral blood stream, leading to localized
and systemic inflammation.
1.5 Post-Ruminal Acidosis
6
The drop in pH caused by increased fermentation of carbohydrates within the
rumen during ruminal acidosis continues to have a negative effect on ruminant
digestion as fermented carbohydrates and VFAs travel past the rumen and into the
small and large intestines. Lowered pH in the intestines not only damages the
intestinal epithelium, it also decreases intestinal absorption of nutrients. A pH below
6.9 inhibits pancreatic alpha amylase which breaks down starch to release glucose for
absorption by the small intestine (Wheeler et al. 1980). In a study done by Wheeler et
al. (1980), fecal pH and fecal starch levels proved to be a good indicator of intestinal
pH. Cattle fed high energy diets had low fecal pH and large amounts of starch in
feces, corresponding to low pH and high starch concentrations within the intestines.
Ruminants evolved in environments with forage that contained only very small
amounts of starch. Therefore they produce less pancreatic alpha amylase than
monogastric animals. The activity of the already low amounts of pancreatic alpha
amylase is reduced by the lowered pH and therefore, the small intestines are unable to
utilize a large amount of the starch in high energy feeds. The starch is then passed
directly into the large intestine and partially fermented into VFA before moving into
the feces. In addition to decreased utilization of starch, lowered pH also increases the
populations of endotoxin releasing bacteria. Lactic acid producing bacteria such as
lactobacilli have been found in the intestines of cattle when ruminal pH becomes less
than 5.5 to 5.0 (Slyter, 1976). When Bissell (2002), infused 5 grams of starch/kg of
body weight per day over a three-day period in order to analyze post-ruminal acidosis,
cows receiving the infusion showed a decrease in fecal pH and the appearance of
7
mucus, tissue segments, and mucin casts in the feces, providing evidence of epithelial
damage and hindgut acidosis.
In a study by Tao et al. (2014a), eight goats with rumen cannulas were divided
into two groups. One was fed a high concentrate diet (65% concentrate of DM) and
the other a low concentrate diet (35% concentrate of DM) for six consecutive weeks.
Throughout the six weeks, rumen fluid, plasma, and hindgut mucosa tissue was
collected. The feeding of the high concentrate (HC) diets led to a significant decrease
in ruminal pH and obvious damage to the mucosal epithelium of the hindgut. Tight
junctions between the cells of the hindgut epithelium were compromised in HC goats
but not low concentrate (LC) goats. This caused the hindgut to become “leaky” since
there is only a single layer of epithelial cells in the large intestine (Tao et al. 2014a).
In a similar study by Tao et al. (2014b), twelve mid-lactation goats were randomly
assigned to either a HC or LC diet for a 10-week period. Goats fed the HC diet
showed a significant increase in VFA and of starch contents within their colonic
digesta as compared to those of the LC goats. HC goats also showed severe changes in
the structure of their colonic epithelium and a loosening of the tight junctions between
colonic cells, leading to an inflammatory response and apoptosis of the colonic
epithelial layers (Tao et al. 2014b). Together, these studies demonstrate that high
grain diets not only compromise the rumen but can also lead to inflammation and
epithelial damage in the hindgut.
8
1.6 Release of Endotoxins in the Gastrointestinal Tract
As explained by Nagaraja et al. (1978), the increased presence of
carbohydrates from high concentrate diets causes a change in the microbial population
of both the rumen and cecum. These observed changes are characterized by the
destruction of protozoa and cellulolytic bacteria and an increase in gram positive
cocci. The destruction of gram negative bacteria leads to the release of
lipopolysaccharides (LPS), a type of endotoxin. The release of LPS causes damage to
rumen epithelium barrier function and inflammation in the rumen wall (Naragaja et al.
1978). In a study by Gohzo (2005), the relationship between SARA inflammatory
response increase in LPS endotoxins was analyzed. Free endotoxins were able to
travel into the peripheral bloodstream and trigger an inflammatory response
throughout circulation in cows fed a high concentrate diet, likely due to damage of
epithelial cells (Gozho et al. 2005). Due to the lowered pH during SARA, the
concentration of free LPS endotoxins increases by about five-fold (Emmanuel et al.
2007). This significant increase in endotoxins in combination with the ability for these
endotoxins to enter the peripheral blood stream allows for infiltration of pathogens to
surrounding organs, causing localized and systemic inflammation (Khafipour et al.
2009).
In a study by Li et al. (2012), six non-lactating Holstein cows with cannulas in
the rumen and cecum were randomly assigned to treatments in a 3x3 Latin square
design and fed either a 70% forage diet (control), a 34% grain diet (high grain), or a
9
high forage diet (37% of DM was replaced with ground alfalfa). Samples of rumen
fluid, blood, cecal digesta, and fecal samples were taken before and after feeding at the
end of each period. An increase in LPS concentration in cecal digesta and an increase
in LPS binding proteins in blood serum of treated cows was observed. The authors
concluded that the increase in LPS binding protein in cows given the high grain diet
was due to the increased growth of LPS-producing bacteria within the hindgut and not
solely due to increased LPS-producing bacteria within the rumen. Bile within the
small intestine leads to degradation of rumen-generated LPS, but the continued
presence of LPS later on in the digestive tract, as well as in fecal matter, suggested
that LPS-producing bacteria grew in the cecum (Li et al. 2012). These studies
demonstrate that due to the damage of intestinal epithelial barriers caused by ruminal
and hindgut acidosis, endotoxins are capable to entering the blood stream and inducing
systemic inflammation.
1.7 Buffers
In an effort the decrease the effects of ruminal acidosis, many dairy farms
supplement their high energy diets with buffers to mitigate the fluctuation in ruminal
pH. Sodium bicarbonate is commonly used to buffer acidic conditions within the
rumen in early lactation cattle when their diets are rapidly switched from a
maintenance feed to a high energy feed for production (Kilmer et al., 1980). Sodium
bicarbonate in high energy rations increased the pH in the rumen and nutrient
10
digestibility is increased which results in an increase in milk yield (Kilmer et al.,
1981). Varner et al. (1972), showed that the addition of calcium carbonate and starch
to the rations of steers fed a high energy diet significantly increased organic matter
and cellulose digestion, as well as energy digestibility overall.
Although a significant amount of work with buffers has been done, most
focused on protecting the rumen, however little has been done to see how to buffer the
hindgut. Potential buffers that could be used to protect the hindgut include
magnesium oxide and calcium carbonate. In studies by Christiansen et al. (1990) and
Teh et al. (1985), feeding of magnesium oxide consistently increased fecal pH to
levels higher than that of control groups. This outcome showed the efficacy of
magnesium oxide in buffering the intestines and neutralizing acids in the intestinal
environment. In a study by Wheeler and Noller (1977) on 9 Holstein steers fed high
grain diets calcium carbonate and magnesium limestone led to higher fecal and
intestinal pH values, as well as reduced fecal starch contents as compared to those of
control cows. These studies suggest that it may be possible to effectively buffer the
intestines in cows fed high starch diets using additives such as magnesium oxide and
calcium carbonate. Additionally, encapsulated sodium bicarbonate products are
marketed for horses to reduce the risk for hindgut acidosis. It is possible that
encapsulated buffers may be of benefit for dairy cattle as well, though to date these
types of buffers have not been evaluated in ruminants.
11
1.8 Post-Ruminal Starch Infusions
To experimentally induce post-ruminal acidosis without concurrent ruminal
acidosis, carbohydrates can be infused directly into the abomasum by passing an
infusion line through the rumen of cannulated cows. Mainardi et al. (2011) used
abomasal infusions of 1 g of oligofructose/ 1 kg of body weight to induce hindgut
acidosis in six ruminally cannulated Holstein steers. Oligofructose was used because it
is indigestible by mammalian enzymes and thereby provides as a substrate specifically
for gastrointestinal microbes. Animals given the oligofructose infusion had lower fecal
pH than those given the control, as well as increased fecal excretion of microbial
fermentation products, signs of increased hindgut fermentation. The relevance of this
model to actual intestinal acidosis in cows can be questioned as oligofructose was
provided as a substrate to intestinal microbes, whereas intestinal acidosis that
accompanies ruminal acidosis is typically due to hindgut fermentation of starch. A
follow-up study by Gressley et al. (2016) directly compared abomasal oligofructose
infusion to abomasal starch infusion on fecal measures of hindgut fermentation. The
authors found that abomasal starch and abomasal oligofructose caused similar
decreases in fecal pH and increases in fecal LPS.
1.9 Objectives and Hypothesis
The objective of the current experiments was to compare the effectiveness of
fed sodium bicarbonate (FSB), calcium carbonate (FCC), calcium carbonate with
12
added magnesium oxide (FCCM), and abomasally infused encapsulated sodium
bicarbonate (ISB) as buffers when hindgut acidosis was induced by the infusion of 1 g
of starch/1 kg of BW. It was hypothesized that the ISB, FCC, and FCCM treatments
would be effective in ameliorating hindgut acidosis. The effectiveness of these
treatments would be determined by rumen and fecal pH, VFA, and endotoxin
concentrations.
13
Chapter 2
MATERIALS AND METHODS
2.1 Animals and Treatment
Ten ruminally cannulated, multiparous mid-lactation Holstein cows were
individually housed in the University of Delaware’s tiestall facility. At the start of the
trial, average body weight was 736.8 +74.8 kg and days in milk was 188.4 + 50.2
days. Cows were ad libitum fed a total mixed ration typical for high producing, early
lactation cows (Table 1). Cows were fed twice daily (0800h and 2000h), with 70% of
daily feed in the morning and 30% fed at night. Daily offered and refused amounts
were recorded and aimed for ~5% refusal. All animal procedures were approved by
the University of Delaware Institutional Animal Care and Use Committee.
Prior to the experiment, all cows were fitted with abomasal infusion lines that
were inserted through the ruminal cannula, as described by Gressley et al. (2006).
Briefly, the infusion lines consisted of about five meters of flexible tubing with a
flexible plastic disc attached to the end. The insertion device was constructed of PVC
pipe, which can be placed in the rumen, passed through the omasum orifice, and into
the abomasal orifice. A flexible disc was folded and placed into the PVC pipe, and
was put into the proper location within the cow through the rumen cannula. Once the
device entered the abomasum, the disc unfolded to hold the infusion line in place. The
other end of the infusion line was threaded through a hole in the center of the cannula
plug and held in place with clamps. The placement of the infusion line was checked
14
twice per week and remained in the abomasum for the duration of the trial. At the end
of the trial, the infusion lines were removed by hand.
Cows were weighed for two consecutive days at the start of the trial to
calculate the amount of starch that would be infused daily. Cows were infused with
0.5g/1kg bodyweight of corn starch twice daily at the time of feeding (1g/1kg of
bodyweight per day) (Table 2). Cows were given twice daily infusions of corn starch
(Ingredion, Westchester, IL) suspended in 1.5L of tap water at the time of feeding.
The starch mixture was placed in plastic bottles and mixed rigorously both before and
during the infusions. Infusions were administered using hand pumps at 0800h and
2000h. On average, cows were give about 736 g/d of starch, which was about 10% of
their total daily starch intake.
Cows were assigned to a 5X5 Latin square design with 7-d periods for five
consecutive periods. Treatments were A) control ration (CON), B) control diet plus
200g/d sodium bicarbonate hand mixed into feed, 140g at am feeding and 60g at pm
feeding (FSB), C) control diet plus abomasal infusions of 336 g/d, 168g at am feeding
and 168g at pm feeding, of encapsulated sodium bicarbonate (Equishure Balchem,
New Hampton, NY) added to corn starch infusions (ISB), D) control diet plus 200 g/d
of calcium carbonate hand mixed into feed, 140g at am feeding and 60g at pm feeding
(FCC), and E) control diet plus 125 g/d calcium carbonate (87.5g at am feeding and
37.5 at pm feeding) and 75 g/d of magnesium oxide (52.5g at am feeding and 22.5g at
pm feeding) hand mixed into feed (FCCM). Cows received treatments twice daily
during feeding.
15
2.2 Feed Samplings and Analyses
Samples of the individual feeds and two independent samples of TMR were
collected on day 7 of each period. A portion of each individual feed sample was dried
at 60°C for 48h and the dry matter (DM) results were used to adjust TMR mix
amounts to account for fluctuations in DM. The remainder of the individual feeds
were sent to Cumberland Valley Analytical Services (CVAS) for nutrient analysis.
The TMR was also sent to CVAS for analysis of nutrient composition and 240-h
indigestible NDF (iNDF).
2.3 Sample Collection
Samples collected throughout the trial included milk, fecal, and rumen
samples, all of which were collected on day 7 of each period. Milk yield was recorded
at each milking throughout the study and samples were collected at both milkings on
day 7 (0430h and 1530h). All samples were sent to Dairy One Cooperative Inc.
(Ithaca, NY) for NIR analysis of lactose, protein, fat, somatic cell count (SCC), and
milk urea nitrogen (MUN) using a Milkoscan System 4000 (Foss North American,
Eden Prairie, Minnesota, USA). Fecal and rumen samples were collected every 4
hours on day 7 of each period, starting at 0630h and continuing to 0230h the following
day.
Fecal samples of about 200g/cow were collected via rectal palpation at each
time point. For fecal pH, 20 + 2g of feces were added to a 50ml conical vial
16
containing 20ml of distilled water. The sample was vigorously shaken then passed
through two layers of cheesecloth into a beaker where a pH meter was inserted into the
liquid, given time to equilibrate, and the value was recorded. For VFA analysis, 25 +
5g of feces was weighed and the exact amount recorded. The feces was added to a
50ml conical vial containing 10ml of 2% H2SO4 solution and vigorously mixed. The
resulting solution was strained through two layers of cheesecloth and frozen at -20°C.
For LPS measurement, about 1g of feces was placed in a 2ml LPS-free
microcentrifuge tube and frozen at -20°C. About 100g of the remaining feces was
frozen at -20°C for later DM analysis.
Rumen fluid was collected from four different locations within the ventral
rumen sac and strained through two layers of cheesecloth into a beaker, where a pH
meter was inserted into the liquid, given time to equilibrate, and the value was
recorded. Ten ml of rumen fluid was placed into a 15ml conical vial containing 0.2ml
of 50% H2SO4 solution and stored at -20°C until later VFA analysis. For later LPS
measurements, about 1ml of rumen fluid was placed in a 2ml LPS-free
microcentrifuge tube and frozen at -20°C.
2.4 Sample Analysis
The analysis for fecal and rumen VFA was performed using high performance
liquid chromatography (HPLC) as described by Mainardi et al. (2011). The endotoxin
concentration of both fecal and rumen samples were determined using a commercial
17
chromogenic end point Limulus amebocyte lysate (LAL) assay (QCL-1000TM
Endpoint Chromogenic LAL Assay, Lonza Ltd., Basel, Switzerland). Samples were
centrifuged at 10,000 x g for 30 minutes at room temperature, the supernatant was
diluted 1:10 using endotoxin-free LAL reagent water, and passed through 0.22-µm
microcentrifuge filter tubes (Costar Spin-X, Corning Inc. Corning, NY) via
centrifugation at 13,300 x g for 2 minutes. Samples were diluted further to 1:100 using
endotoxin-free LAL reagent water. The samples were treated with a 1:1 ratio of b-1, 3
glucan blocker (b-G Blocker, Lonza Ltd., Basel, Switzerland). A standard curve was
created which ranged from 0 to 1 endotoxin units (EU)/mL. Samples were prepared
according to kit instructions and the results were read using a plate reader (Molecular
Devices, Sunnyvale, CA) set to 405nm wavelength. When samples failed to fit the
standard curve they were further diluted to final dilutions of 1:5000, 1: 10,000, 1:
25,000, and 1: 50,000.
Fecal samples collected for measurement of DM and nutrient composition
were thawed and dried at 55°C for 72h in a forced air oven. Samples were composited
by cow and period and sent to CVAS for analysis of NDF, ADF, starch, ash, and
indigestible NDF.
2.5 Statistical Analysis
Mean milk yield and dry matter intake were calculated from the last three days
of each period. Milk composition for each cow within each period was calculated as
18
the mean of the am and pm values. Dry matter intake, milk yield and composition,
and nutrient digestibility were evaluated using the Glimmix procedure of SAS. The
model included the main effects of treatment, period, and square, and the random
effect of cow within square. Differences among fixed effects were estimated using the
pdiff option of the lsmeans statement. The overall effect of postruminal buffer was
evaluated using a contrast statement with values of -1, 0, 0.34, 0.33, and 0.33 for
CON, FSB, ISB, FCC, and FCCM, respectively.
Repeated measures (pH, VFA, LPS) were analyzed using the Glimmix
procedure of SAS. The model included the fixed effects of treatment, period, square
and hour and the interaction of treatment by hour and the random effects of cow
within square and cow by period by treatment. Repeated measures were indicated
using the “random _residual_” statement with a subject of period by treatment by cow
within square and an autoregressive covariance structure. Differences among fixed
effects were estimated using the pdiff option of the lsmeans statement. The overall
effect of postruminal buffer was evaluated using a contrast statement with values of -
1, 0, 0.34, 0.33, and 0.33 for CON, FSB, ISB, FCC, and FCCM, respectively. When
the treatment by hour interaction was significant, the Tukey’s adjustment was used to
evaluate differences among treatment at each individual time
19
Chapter 3
RESULTS
3.1 Feed intake and Milk Component Analysis
Treatment did not affect intake, milk yield, or milk composition (Table 4). On
average, cows consumed 26.0 kg DM and produced 32.4 kg/d milk with 3.54% fat and
3.08% protein.
3.2 Rumen Sample Results
3.2.1 Rumen Volatile Fatty Acids
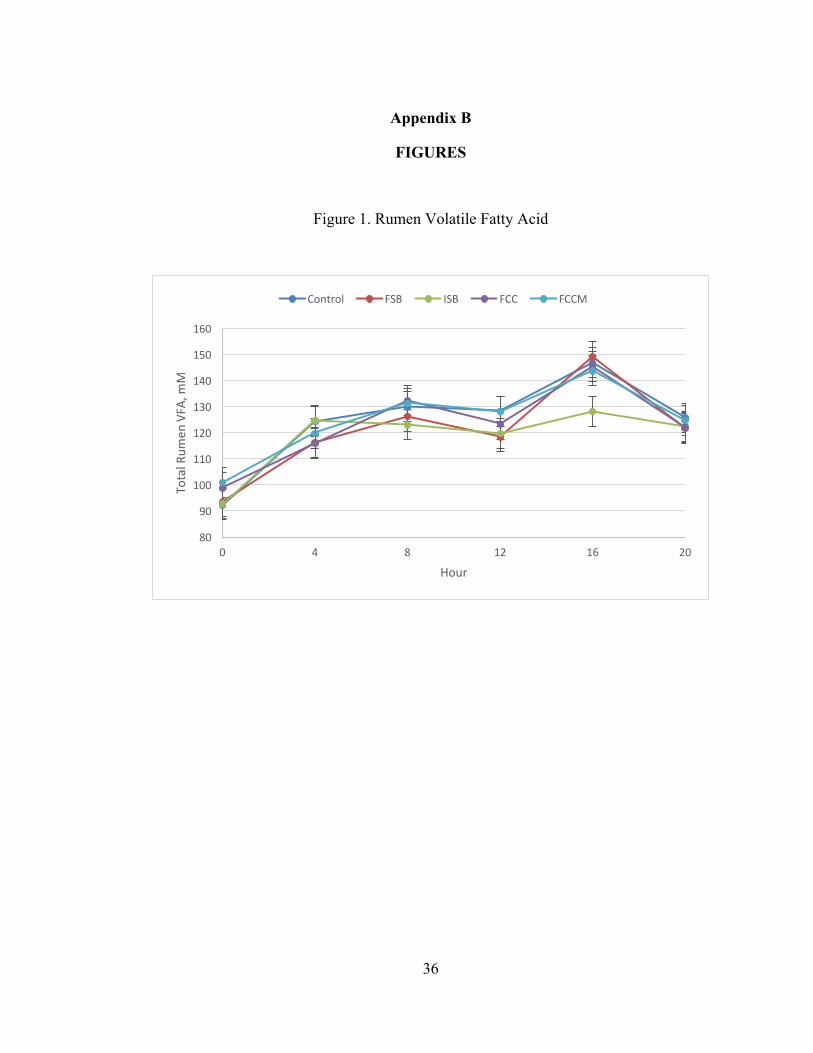
Effects of treatment on rumen VFA and lactate are presented in Table 5. Time
affected all VFA and lactate (P < 0.05), and the effect of time on total VFA is
presented in Figure 1. Total rumen VFA were lowest at 0 h, highest at 16 h, and
intermediate at the other times. There were no effects of treatment on rumen lactate,
acetate, propionate, isobutyrate, valerate, isovalerate, or total VFA (P > 0.10).
Treatment tended to affect butyrate (P = 0.08). As illustrated in Figure 2, this was due
to lower butyrate for ISB compared to CON at 12 h (12.3 vs. 14.2 mM, P = 0.05) and
16 h (13.8 vs 17.1, P < 0.001). The contrast of CON vs. the three treatments expected
to have post-ruminal effects (ISB, FCC, and FCCM) was also significant (P = 0.02),
due to lower butyrate in those treatments compared to the CON.
3.2.2 Rumen pH
Treatment did not affect rumen pH, but an effect of time was observed (P <
0.001; Table 7). There were no differences in rumen pH between 4, 8, and 12 (P >
20
0.10), but all other times differed from one another (P < 0.01; Figure 3). Rumen pH
was highest at 0 h, and lowest at 16 h.
3.3 Fecal Sample Results
3.3.1 Fecal Dry Matter
Treatment did not affect fecal dry matter (P = 0.39), which averaged 13.8%
across treatments (Table 7). Fecal dry matter was affected by time (P < 0.001), due to
the lowest dry matter being recorded at 0 h (13.0%), intermediate dry matter at 4, 12,
and 16 h (13.4 to 13.8%), and greatest dry matter at 8 and 20 h (14.4 and 14.5%,
respectively; data not shown).
3.3.2 Fecal Volatile Fatty Acids
Effects of treatment on fecal VFA and lactate are presented in Table 6. Time
affected all VFAs and lactate (P < 0.05), and the effect of time on total VFA is
presented in Figure 4. Total fecal VFAs were highest at 0 and 20 h, lowest at 12 and
16 h, and intermediate at the other times. There were no effects of treatment on fecal
lactate, butyrate, isobutyrate, valerate, or isovalerate (P > 0.10). Treatment affected
acetate (P = 0.04) and propionate (P= 0.03) and tended to affect total VFA (P = 0.07).
Total VFAs were greater for FCC and FCCM compared to CON (P = 0.03 and 0.007,
respectively; Figure 4). Similarly, acetate was greater for FCC and FCCM compared
to CON (P = 0.02 and 0.003, respectively; Figure 5), and propionate was greater for
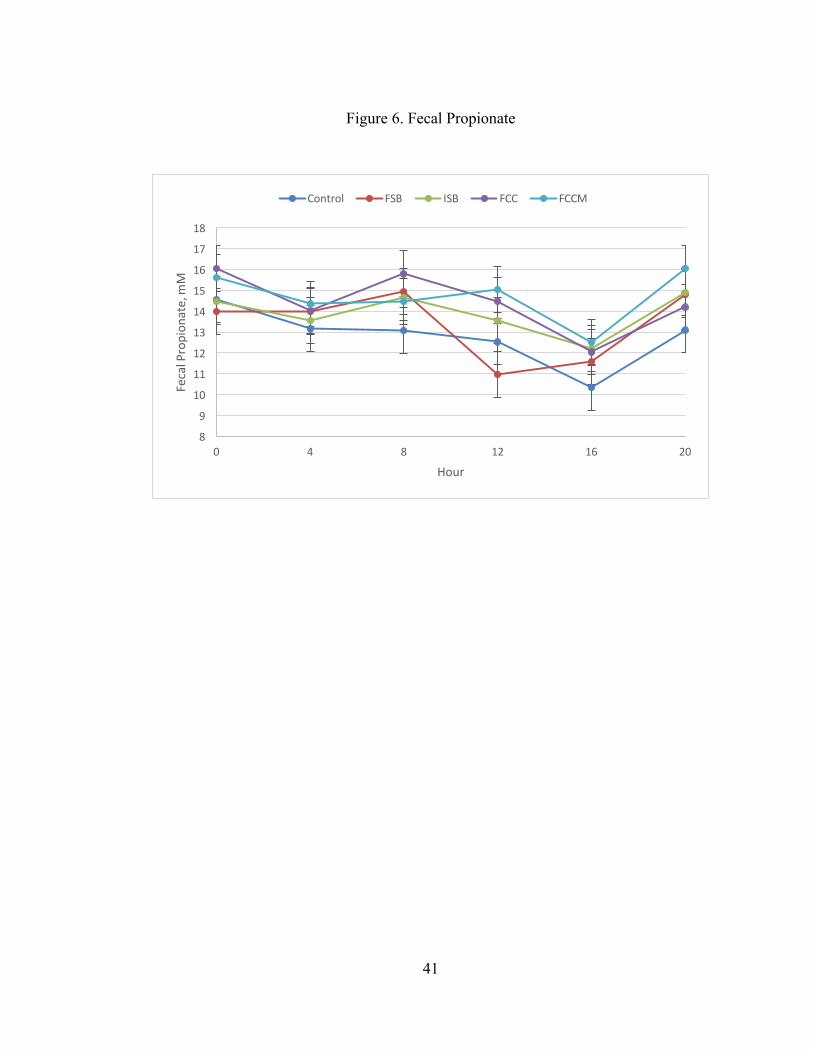
FCC and FCCM compared to CON (P = 0.01 and 0.005, respectively; Figure 6). In
addition, fecal acetate was lower in FSB compared to FCCM (P = 0.05). The contrast
of CON vs. (ISB + FCC + FCCM) was also significant for total VFA, acetate, and
21
propionate, due to lower VFA for CON vs. the proposed post-ruminal buffers (Table
6).
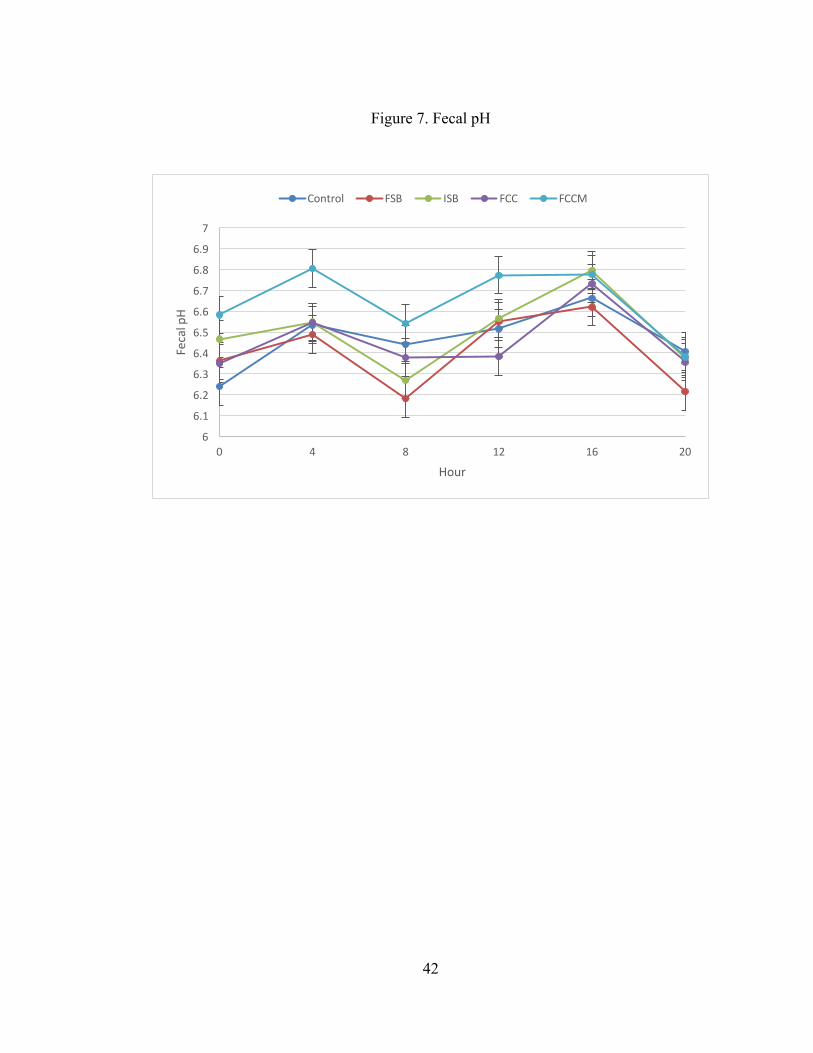
3.3.3 Fecal pH
Fecal pH was affected by both treatment and time (P < 0.001; Table 7). Fecal
pH was greater for FCCM compared to all other treatments (P < 0.01). As shown in
Figure 7, the effect of time was due to lowest pH at 0, 8, and 20 h, intermediate pH at
4 and 12 h, and greatest pH at 16 h.
3.4 LPS and Digestibility
Results of LPS concentrations for both fecal and rumen samples are still
pending, as well as results for starch digestibility.
22
Chapter 4
DISCUSSION
Starch is one of the most efficient carbohydrates that can be fermented in
the rumen and promote microbial growth, however, when high starch diets are quickly
digested within the rumen, pH levels can decrease, causing acidosis. There is also
increased passage of fermentable carbohydrates to the intestines. Some of these
carbohydrates are degraded by enzymes, but typically their levels are too high to be
completely degraded, causing the excess to flow to the large intestine where microbial
fermentation occurs. Therefore, acidosis typically leads to both low rumen pH and low
pH in the large intestine. The epithelium of the rumen consists of stratified cell layers
and is more capable of withstanding this lowered pH than the epithelium of the large
intestine, which is comprised of only one layer of cells. It is possible that damage to
the large intestine contributes to laminitis and other health problems resulting from
acidosis. In the present study, we aimed to evaluate the impact of calcium carbonate,
magnesium oxide, and encapsulated sodium bicarbonate on measures of intestinal
fermentation in cows fed a typical high starch lactating cow ration and abomasally
infused with 1 g/1 kg of bodyweight per day of starch to challenge the large intestines
(Mainardi et al., 2011). With this challenge to the large intestines, we were expecting
to see signs of hindgut acidosis. The effectiveness of the ISB, FCC, and FCCM
treatments administered could then be determined. The starch in the FSB treatment
was expected to be completely degraded within the rumen and this treatment was
therefore used as a second control with rumen buffering activities only.
Rumen acidosis typically leads to decreased milk production and decrease feed
intake, so in combating the effects of acidosis, buffers should have the ability to
23
mitigate these symptoms (Slyter, 1976). The effects of excessive hindgut fermentation
on performance are less clear, but typically the only production measure affected is a
decrease in milk fat percentage (Gressley et al., 2012). There was no effect of
treatment on feed intake, milk production and milk composition, meaning that
increased ruminal buffering (FSB) or increased intestinal buffering (ISB, FCC,
FCCM) did not impact performance. We fed a typical high starch lactating cow diet,
but this diet was balanced to contain adequate forage and buffers to prevent sub-acute
ruminal acidosis. We were successful in achieving this goal, as rumen pH was never
below 5.6, and was only below 5.8 at one-time point (Figure 3). The FSB treatment
was expected to increase rumen pH, but this did not occur, perhaps because sodium
bicarbonate inclusion in the base ration was already sufficient.
As suspected, total rumen VFA was lowest during the first sampling time (0h)
when the cows had not yet been fed, and highest at 16h, 4 h after their second feeding.
The only VFA that was affected by treatment was butyrate, which was lower for ISB
cows as compared to the CON. In addition, the contrast of ISB, FCC and FCCM vs.
CON was also significant, with lower rumen butyrate for the proposed postruminal
buffer treatments compared to the CON. The impact of postruminal buffers on ruminal
butyrate was unexpected, particularly for ISB, as this treatment was administered
postruminally and should not have affected any VFAs within the rumen.
In order to see the effect of buffer treatments on hindgut fermentation, our
study looked at fecal dry matter, fecal VFA, and fecal pH. Time affected all fecal
measures. In a study done by Bissell (2002), low fecal pH was associated with
increased hindgut fermentation, So, when we observed that at 0 h, fecal pH and dry
matter were lowest and fecal VFA were highest, we were able to conclude that this
24
was the time of greatest hindgut fermentation. This time represented 12 h after
postruminal starch infusion and 8 h after the greatest and lowest observed rumen VFA
and pH, respectively. As seen in a study completed by Tao et al (2014b), goats fed a
high concentrate diet showed a significant increase in VFA content within the colonic
digesta, as well as a higher content of starch within the colonic digesta as compared to
goats receiving a low concentrate diet. (Tao et al. 2014b). The results from the current
study parallel the findings by these authors as increased VFA concentrations in fecal
matter correlated to times of increased hindgut fermentation.
There was no change in fecal dry matter as a result of treatment, however there
was an effect of treatment on both fecal VFA and pH values. Fecal pH was greater for
FCCM compared to all other treatments. These findings are in agreement with those
reported by Christiansen et al. (1990) and Teh et al. (1985), who found that feeding of
magnesium oxide consistently increased fecal pH to levels higher than that of CON
groups. To our knowledge, this was the first time that Equishure (the ISB treatment)
has been administered postruminally to cows, and we expected this product to release
sodium bicarbonate in the intestines and increase fecal pH. Similarly, we expected the
FCC treatment to increase fecal pH as has been observed previously in cattle (Wheeler
and Noller, 1977). Counter to these expectations, ISB and FCC did not increase fecal
pH in the present trials. Possibly, the doses were too low to provide sufficient
postruminal buffering. In the case of FCC, it is also conceivable that neutralization of
acids in the rumen exhausted the carbonate supply before it could reach the intestines.
DISCUSS DOSAGES? Alternatively, it is possible that some buffering action
occurred in the intestinal content, but was no longer discernable in the fecal samples
that were analyzed.
25
Total fecal VFA tended to be affected by treatment and was higher for FCC
and FCCM compared to CON. In addition, fecal acetate and propionate were greater
for FCC and FCCM compared to CON, and the contrast of CON vs. the proposed
postruminal buffers (ISB, FCC, and FCCM) was significant for acetate, propionate,
and total VFA. These results were unexpected, as it was hypothesized that increased
buffering in the intestines would reduce excessive fermentation and therefore decrease
fecal VFA. On the contrary, the intestinal buffer treatments actually increased fecal
pH. It is possible that the buffers resulted in a more stable intestinal environment that
promoted microbial fermentation. This hypothesis is supported by the observation
that sodium bicarbonate can increase ruminal VFA in s concentration-dependent
manner (DePeters et al. 1984). VFA levels in feces could also have increased because
absorption of the acids by the intestines slows with increasing digesta pH (Myers et
al., 1967).
The findings of this study suggest that when a challenge of post ruminal
fermentation is imposed on the gastrointestinal tract of mid-lactation cows being fed a
high grain diet, supplementing the diet with magnesium oxide and calcium carbonate
treatments has the potential to alter intestinal fermentation and to possibly mitigate
some of the negative effects of hindgut acidosis. The case for such positive effects
will be strengthened if the data from the analyses of total tract digestibility and fecal
LPS levels show increased digestibility and decreased LPS concentrations for the FCC
and FCCM treatments.
26
REFERENCES
Abaker, J. A., et al. (2017). Lipopolysaccharide derived from the digestive tract provokes oxidative stress in the liver of dairy cows fed a high-grain diet. Journal of Dairy Science, 100(1): 666-678.
Apper-Bossard, E., Faverdin, P., Meschy, F., & Peyraud, J. L. (2010). Effects of dietary cation-anion difference on ruminal metabolism and blood acid-base regulation in dairy cows receiving 2 contrasting levels of concentrate in diets. Journal of Dairy Science, 93(9): 4196-210.
Christiansen, M. L., and K. E. Webb. 1990. Intestinal acid flow, dry matter, starch and protein digestibility and amino acid absorption in beef cattle fed a high-concentrate diet with defluorinated rock phosphate, limestone or magnesium oxide. Journal of Animal Science 68:2105-2118. doi:10.2527/1990.6872105x
DePeters, E. J., Fredeen, A. H., Bath, D. L., & Smith, N. E. (January 01, 1984). Effect of sodium bicarbonate addition to alfalfa hay-based diets on digestibility of dietary fractions and rumen characteristics. Journal of Dairy Science, 67(10): 2344-55.
El, T. A. E., Galyean, M. L., & Kiesling, H. E. (1984). Influence of Limestone Level in High Concentrate and High Roughage Diets on Site and Extent of Digestion in Lambs. Journal of Animal Science,59 (1): 217.
Emmanuel, D. G., et al. (2007). Acidosis and lipopolysaccharide from Escherichia coli B:055 cause hyperpermeability of rumen and colon tissues. Journal of Dairy Science 90(12): 5552-5557.
Erdman, R. A. (1988). Dietary buffering requirements of the lactating dairy cow: a review. Journal of Dairy Science 71: 3246-3266.
Gozho, G. N., et al. (2007). Ruminal lipopolysaccharide concentration and inflammatory response during grain-induced subacute ruminal acidosis in dairy cows. Journal of Dairy Science 90(2): 856-866.
Gozho, G. N., et al. (2005). Subacute ruminal acidosis induces ruminal lipopolysaccharide endotoxin release and triggers an inflammatory response. Journal of Dairy Science 88(4): 1399-1403.
Gressley, T. F., et al. (2016). Effect of abomasal carbohydrates and live yeast on measures of postruminal fermentation. Journal of Animal Science, 94, 1, 284.
27
Gressley. T.F., M.B. Hall, and L.E. Armentano. (2012). Ruminant nutrition symposium: Productivity, digestion, and health responses to hindgut acidosis in ruminants. Journal of Animal Science 89:1120-1130.
Gressley, T. F., Reynal, S. M., Colmenero, J. J. O., Broderick, G. A., & Armentano, L. E. (2006). Technical Note: Development of a Tool to Insert Abomasal Infusion Lines into Dairy Cows. Journal of Dairy Science, 89, (10): 3965-3967.
Jami, E., Israel, A., Kotser, A., & Mizrahi, I. (2013). Exploring the bovine rumen bacterial community from birth to adulthood. The Isme Journal, 7, (6): 1069-79
Jewell, K. A., McCormick, C. A., Weimer, P. J., Suen, G., Odt, C. L., & Weimer, P. J. (2015). Ruminal bacterial community composition in dairy cows is dynamic over the course of two lactations and correlates with feed efficiency. Applied and Environmental Microbiology, 81, (14): 4697-4710.
Johnson, M. A., Sweeney, T. F., & Muller, L. D. (1988). Effects of feeding synthetic zeolite A and sodium bicarbonate on milk production, nutrient digestion, and rate of digesta passage in dairy cows. Journal of Dairy Science, 71, (4):, 946-53.
Khafipour, E., et al. (2009). A grain-based subacute ruminal acidosis challenge causes translocation of lipopolysaccharide and triggers inflammation. Journal of Dairy Science 92(3): 1060-1070.
Kilmer, L. H., Muller, L. D., & Snyder, T. J. (1981). Addition of sodium bicarbonate to rations of postpartum dairy cows: physiological and metabolic effects. Journal of Dairy Science, 64, (12):, 2357-69.
Kilmer, L. H., Muller, L. D., & Wangsness, P. J. (1980). Addition of sodium bicarbonate to rations of pre- and postpartum dairy cows. Journal of Dairy Science, 63, (12):, 2026-36.
Li, S., et al. (2012). Effects of subacute ruminal acidosis challenges on fermentation and endotoxins in the rumen and hindgut of dairy cows. Journal of Dairy Science 95(1): 294-303.
Mackie, R. I. (2002). SYMBIOSIS: THE DYNAMICS OF LIVING TOGETHER - Mutualistic fermentative digestion in the gastrointestinal tract: Diversity and evolution. American Zoologist, 42, (2): 319.
Mainardi, S. R., Hengst, B. A., Nebzydoski, S. J., Nemec, L. M., & Gressley, T. F. (2011). Effects of abomasal oligofructose on blood and feces of Holstein steers. Journal of Animal Science, 89, (8): 2510-7.
28
Myers, L. L. Jackson, H. D.Packett, L. V.1967 Absorption of volatile fatty acids from the cecum of sheep Journal of Animal Science 26:1450-1458
Nagaraja, T. G., et al. (1978). Relationship of rumen gram-negative bacteria and free endotoxin to lactic-acidosis in cattle. Journal of Animal Science 47(6): 1329-1337.
Plaizier, J. C., et al. (2014). Effects of duration of moderate increases in grain feeding on endotoxins in the digestive tract and acute phase proteins in peripheral blood of yearling calves. Journal of Dairy Science 97(11): 7076-7084.
Schaefer, D. M., Wheeler, L. J., Noller, C. H., Keyser, R. B., & White, J. L. (1982). Neutralization of acid in the rumen by magnesium oxide and magnesium carbonate. Journal of Dairy Science, 65 (5): 732-9.
Slyter, L. L. (1976). Influence of Acidosis on Rumen function. Journal of Animal Science, 43, (4): 910.
Steele, M. A., et al. (2011). Bovine rumen epithelium undergoes rapid structural adaptations during grain-induced subacute ruminal acidosis. Am. J. Physiol.-Reg. I. 300, (6): R1515-R1523.
S.Y. Mao, R.Y. Zhang, D.S. Wang, W.Y. Zhu, (2013) Impact of subacute ruminal acidosis (SARA) adaptation on rumen microbiota in dairy cattle using pyrosequencing, 24, 12-19,.
Tao, S. Y., et al. (2014). High Concentrate Diet Induced Mucosal Injuries by Enhancing Epithelial Apoptosis and Inflammatory Response in the Hindgut of Goats. Plos One 9, (10).
Tao, S. Y., et al. (2014). A high-concentrate diet induced colonic epithelial barrier disruption is associated with the activating of cell apoptosis in lactating goats. Bmc Veterinary Research 10.
Teh, T. H., Hemken, R. W., & Harmon, R. J. (1985). Dietary magnesium oxide interactions with sodium bicarbonate on cows in early lactation. Journal of Dairy Science, 68, (4): 881-90.
Varner, L. W., & Woods, W. (1972). Effect of Calcium and Starch Additions upon Ration Digestibility by Steers. Journal of Animal Science, 35, (2): 410.
Wheeler, W. E., & Noller, C. H. (1977). Gastrointestinal Tract pH and Starch in Feces of Ruminants. Journal of Animal Science, 44, (1): 131.
29
Appendix A
TABLES
Table 1. Feed Components
Components % DM Components % DM
Corn Silage 39.6 Sodium Chloride 0.44
Ground Corn 14.6 Urea 0.43
Alfalfa Silage 10.8 Palm Fat 0.35
Ground Soybean Hulls 7.73 Rumensin 0.30
Canola Meal 6.13 Magnesium Oxide 0.29
Treated Soybean Meal 5.97 Monocalcium Phosphate 0.26
Citrus Pulp 5.26 Calcium Carbonate 0.23
Porcine Blood Meal 1.74 Calcium Sulfate 0.19
Sugar 1.63 Trace Minerals and Vitamins 0.12
Orchardgrass Hay 1.48 Selenium 0.06
Rumen Protected Fat 0.84 Rumen Protected Methionine 0.05
Corn Gluten Meal 0.82 Vitamin E 0.04
Sodium Bicarbonate 0.60 Biotin 0.004
Live Yeast 0.002
30
2. Body Weights and Starch Dosage
Cow Average Body Weight (BW in lbs) Dosage (kg)
83 1752.5 795
144 1480 671
80 1565 710
148 1527.5 693
100 1490 676
108 1572.5 713
92 1785 810
138 1400 635
985 1902.5 863
106 1767.5 802
31
3. Chemical Composition of TMR as a percentage of DM
% DM Alfalfa silage
Corn silage Grain TMR
CP 18.76 8.34 25.84 17.06 NDF 45.46 38.00 16.22 30.10 ADF 40.40 23.10 11.78 20.96 Starch N/A1 32.04 18.94 21.92 NFC 25.00 47.60 47.06 44.02 Ash 10.76 3.86 10.87 7.75 Ca 1.12 0.29 1.7 0.99 P 0.35 0.35 0.54 0.43 Mg 0.33 0.26 0.86 0.52 K 2.62 1.02 1.45 1.43 Na 0.06 0.01 1.1 0.47
1N/A = not analyzed
32
Table 4. Intake and Milk Yield
Treatment1 P values Contro
l FSB ISB FCC FCCM SEM Treat Contrast2
DMI, kg/d 26.5 26.5 25.3 25.9 25.6 1.0 0.18 0.17
Milk, kg/d 32.0 32.4 32.8 32.3 32.5 2.6 0.96 0.50
Fat, % 3.54 3.48 3.59 3.56 3.52 0.19 0.95 0.91 Fat, kg/d 1.13 1.12 1.16 1.14 1.13 0.10 0.93 0.72
Protein, % 3.08 3.06 3.09 3.10 3.08 0.06 0.95 0.85
Protein, kg/d 0.98 0.99 1.01 1.00 0.99 0.08 0.95 0.61
Lactose, % 4.69 4.72 4.67 4.66 4.70 0.04 0.24 0.83
MUN, mg/dL 10.3 10.4 10.1 10.5 10.7 0.6 0.82 0.91
SCC, log10
1.96 1.88 1.98 1.93 1.85 0.14 0.50 0.37
1 Treatments were A) control ration (CON), B) control diet plus 200g/d sodium bicarbonate hand mixed into feed, 140g at am feeding and 60g at pm feeding (FSB), C) control diet plus abomasal infusions of 336 g/d, 168g at am feeding and 168g at pm feeding of encapsulated sodium bicarbonate (Equishure Balchem, New Hampton, NY) added to corn starch infusions (ISB), D) control diet plus 200 g/d of calcium carbonate hand mixed into feed, 140g at am feeding and 60g at pm feeding (FCC), and E) control diet plus 125 g/d calcium carbonate (87.5g at am feeding and 37.5 at pm feeding) and 75 g/d of magnesium oxide (52.5g at am feeding and 22.5g at pm feeding) hand mixed into feed (FCCM). 2Contrast compared Control (-1) to ISB (+0.34), FCC (+0.33) and FCCM (+0.33).
33
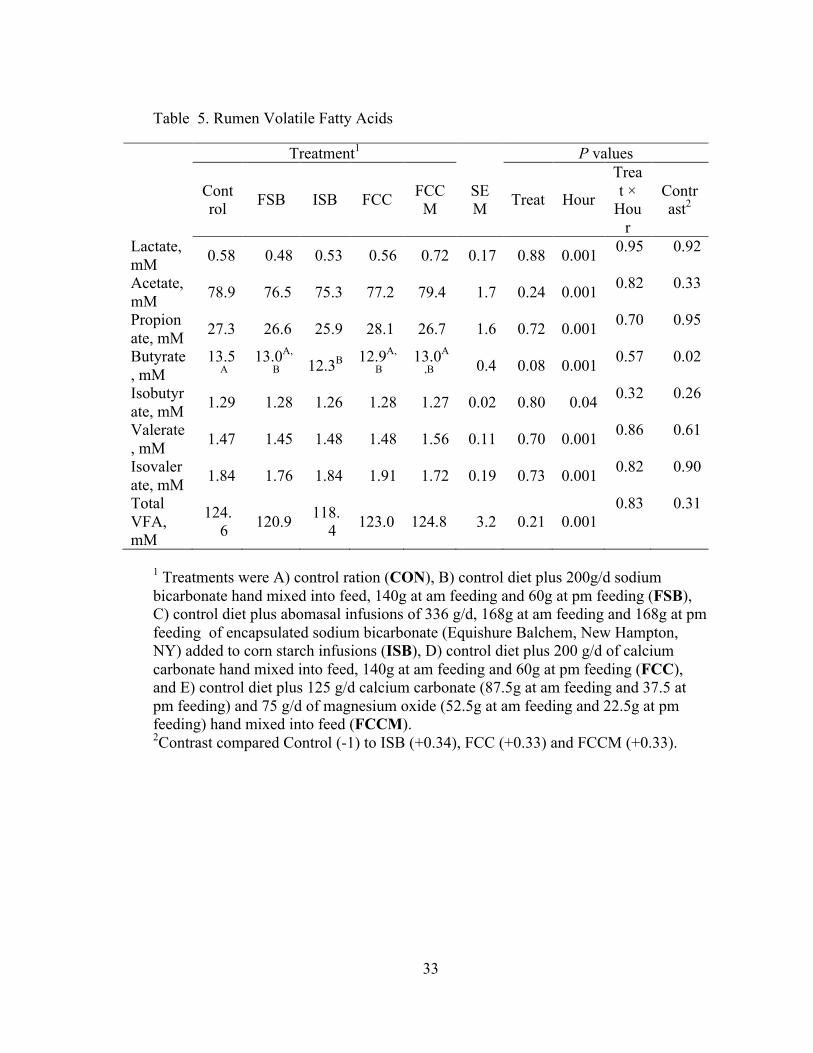
Table 5. Rumen Volatile Fatty Acids
Treatment1 P values
Control FSB ISB FCC FCC
M SEM Treat Hour
Treat ×
Hour
Contrast2
Lactate, mM 0.58 0.48 0.53 0.56 0.72 0.17 0.88 0.001 0.95 0.92
Acetate, mM 78.9 76.5 75.3 77.2 79.4 1.7 0.24 0.001 0.82 0.33
Propionate, mM 27.3 26.6 25.9 28.1 26.7 1.6 0.72 0.001 0.70 0.95
Butyrate, mM
13.5A
13.0A,
B 12.3B 12.9A,
B 13.0A
,B 0.4 0.08 0.001 0.57 0.02
Isobutyrate, mM 1.29 1.28 1.26 1.28 1.27 0.02 0.80 0.04 0.32 0.26
Valerate, mM 1.47 1.45 1.48 1.48 1.56 0.11 0.70 0.001 0.86 0.61
Isovalerate, mM 1.84 1.76 1.84 1.91 1.72 0.19 0.73 0.001 0.82 0.90
Total VFA, mM
124.6 120.9 118.
4 123.0 124.8 3.2 0.21 0.001 0.83 0.31
1 Treatments were A) control ration (CON), B) control diet plus 200g/d sodium bicarbonate hand mixed into feed, 140g at am feeding and 60g at pm feeding (FSB), C) control diet plus abomasal infusions of 336 g/d, 168g at am feeding and 168g at pm feeding of encapsulated sodium bicarbonate (Equishure Balchem, New Hampton, NY) added to corn starch infusions (ISB), D) control diet plus 200 g/d of calcium carbonate hand mixed into feed, 140g at am feeding and 60g at pm feeding (FCC), and E) control diet plus 125 g/d calcium carbonate (87.5g at am feeding and 37.5 at pm feeding) and 75 g/d of magnesium oxide (52.5g at am feeding and 22.5g at pm feeding) hand mixed into feed (FCCM). 2Contrast compared Control (-1) to ISB (+0.34), FCC (+0.33) and FCCM (+0.33).
34
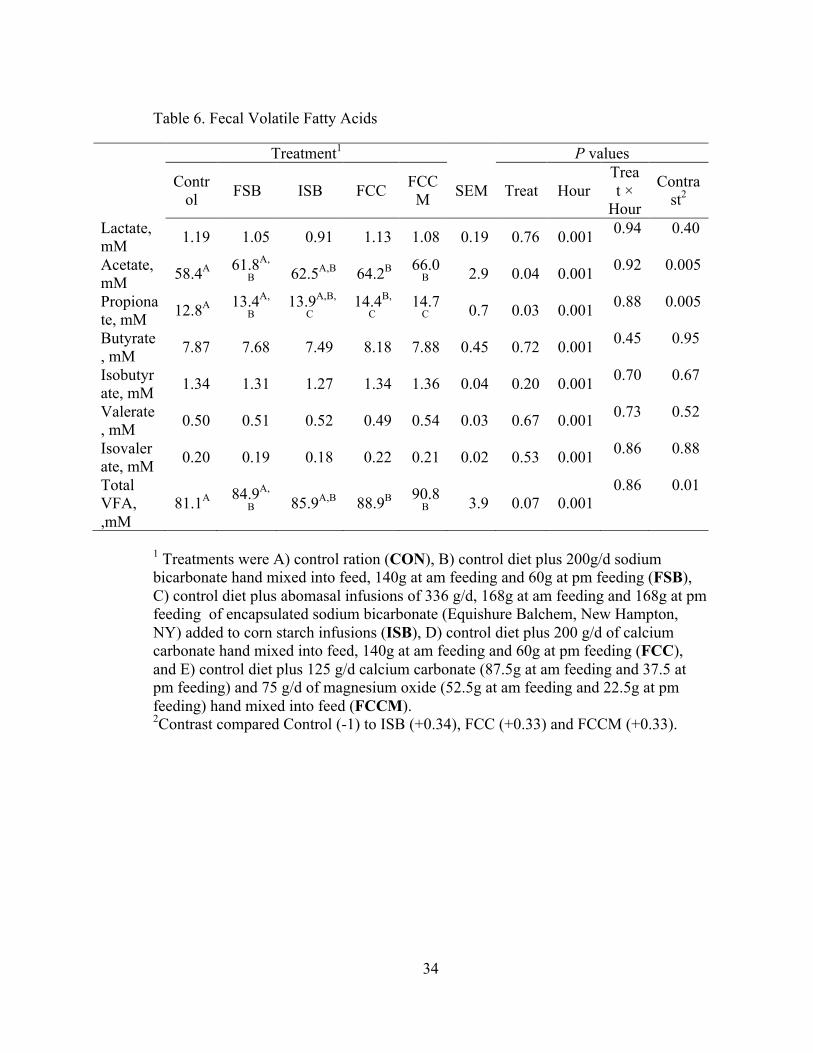
Table 6. Fecal Volatile Fatty Acids
Treatment1 P values Contr
ol FSB ISB FCC FCCM SEM Treat Hour
Treat ×
Hour
Contrast2
Lactate, mM 1.19 1.05 0.91 1.13 1.08 0.19 0.76 0.001 0.94 0.40
Acetate, mM 58.4A 61.8A,
B 62.5A,B 64.2B 66.0B 2.9 0.04 0.001 0.92 0.005
Propionate, mM 12.8A 13.4A,
B 13.9A,B,
C 14.4B,
C 14.7
C 0.7 0.03 0.001 0.88 0.005
Butyrate, mM 7.87 7.68 7.49 8.18 7.88 0.45 0.72 0.001 0.45 0.95
Isobutyrate, mM 1.34 1.31 1.27 1.34 1.36 0.04 0.20 0.001 0.70 0.67
Valerate, mM 0.50 0.51 0.52 0.49 0.54 0.03 0.67 0.001 0.73 0.52
Isovalerate, mM 0.20 0.19 0.18 0.22 0.21 0.02 0.53 0.001 0.86 0.88
Total VFA, ,mM
81.1A 84.9A,
B 85.9A,B 88.9B 90.8B 3.9 0.07 0.001
0.86 0.01
1 Treatments were A) control ration (CON), B) control diet plus 200g/d sodium bicarbonate hand mixed into feed, 140g at am feeding and 60g at pm feeding (FSB), C) control diet plus abomasal infusions of 336 g/d, 168g at am feeding and 168g at pm feeding of encapsulated sodium bicarbonate (Equishure Balchem, New Hampton, NY) added to corn starch infusions (ISB), D) control diet plus 200 g/d of calcium carbonate hand mixed into feed, 140g at am feeding and 60g at pm feeding (FCC), and E) control diet plus 125 g/d calcium carbonate (87.5g at am feeding and 37.5 at pm feeding) and 75 g/d of magnesium oxide (52.5g at am feeding and 22.5g at pm feeding) hand mixed into feed (FCCM). 2Contrast compared Control (-1) to ISB (+0.34), FCC (+0.33) and FCCM (+0.33).
35
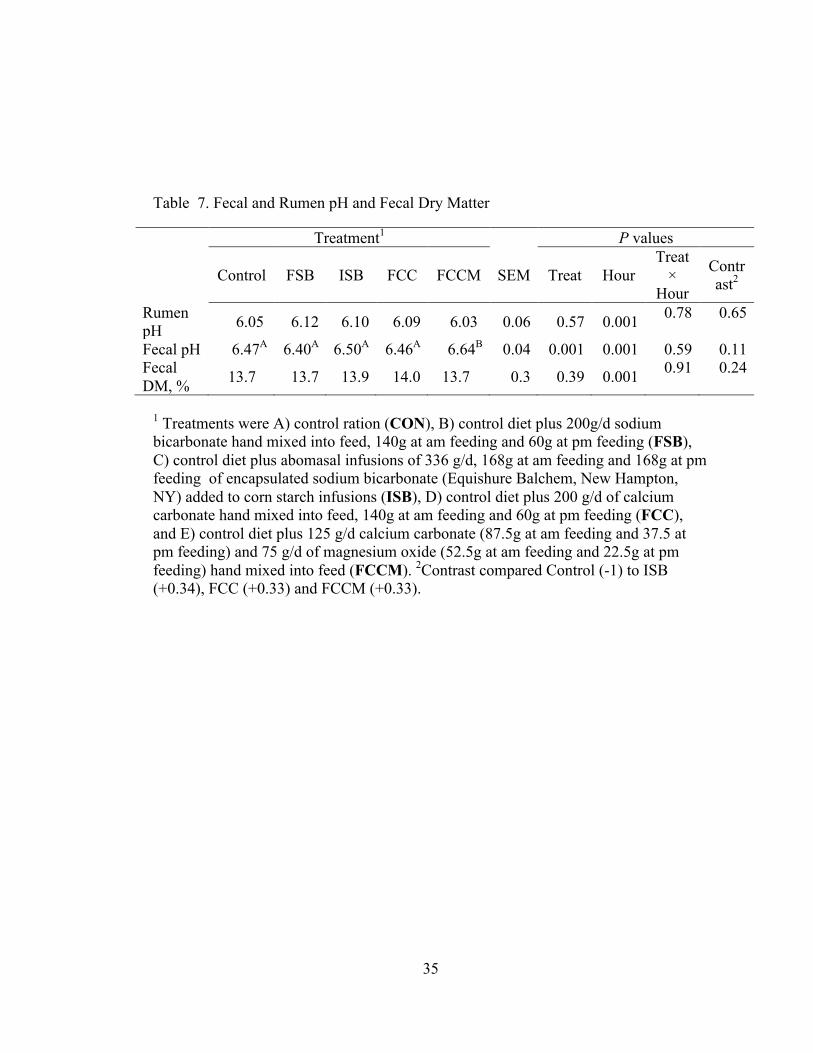
Table 7. Fecal and Rumen pH and Fecal Dry Matter
Treatment1 P values
Control FSB ISB FCC FCCM SEM Treat Hour Treat ×
Hour
Contrast2
Rumen pH 6.05 6.12 6.10 6.09 6.03 0.06 0.57 0.001 0.78 0.65
Fecal pH 6.47A 6.40A 6.50A 6.46A 6.64B 0.04 0.001 0.001 0.59 0.11 Fecal DM, % 13.7 13.7 13.9 14.0 13.7 0.3 0.39 0.001 0.91 0.24
1 Treatments were A) control ration (CON), B) control diet plus 200g/d sodium bicarbonate hand mixed into feed, 140g at am feeding and 60g at pm feeding (FSB), C) control diet plus abomasal infusions of 336 g/d, 168g at am feeding and 168g at pm feeding of encapsulated sodium bicarbonate (Equishure Balchem, New Hampton, NY) added to corn starch infusions (ISB), D) control diet plus 200 g/d of calcium carbonate hand mixed into feed, 140g at am feeding and 60g at pm feeding (FCC), and E) control diet plus 125 g/d calcium carbonate (87.5g at am feeding and 37.5 at pm feeding) and 75 g/d of magnesium oxide (52.5g at am feeding and 22.5g at pm feeding) hand mixed into feed (FCCM). 2Contrast compared Control (-1) to ISB (+0.34), FCC (+0.33) and FCCM (+0.33).
36
Appendix B
FIGURES
Figure 1. Rumen Volatile Fatty Acid
80
90
100
110
120
130
140
150
160
0 4 8 12 16 20
Total Rum
en VFA
, mM
Hour
Control FSB ISB FCC FCCM
37
Figure 2. Rumen Butyrate
6
8
10
12
14
16
18
20
0 4 8 12 16 20
Rumen
Butyrate, mM
Hour
Control FSB ISB FCC FCCM
38
Figure 3. Rumen pH
5
5.2
5.4
5.6
5.8
6
6.2
6.4
6.6
6.8
7
0 4 8 12 16 20
Rumen
pH
Hour
Control FSB ISB FCC FCCM
39
Figure 4. Fecal Volatile Fatty Acids
60
65
70
75
80
85
90
95
100
105
110
0 4 8 12 16 20
Total Fecal VFA
, mM
Hour
Control FSB ISB FCC FCCM
40
Figure 5. Fecal Acetate
40
45
50
55
60
65
70
75
80
85
0 4 8 12 16 20
Fecal Acetate, m
M
Hour
Control FSB ISB FCC FCCM
41
Figure 6. Fecal Propionate
8
9
10
11
12
13
14
15
16
17
18
0 4 8 12 16 20
Fecal Propion
ate, mM
Hour
Control FSB ISB FCC FCCM
42
Figure 7. Fecal pH
6
6.1
6.2
6.3
6.4
6.5
6.6
6.7
6.8
6.9
7
0 4 8 12 16 20
Fecal pH
Hour
Control FSB ISB FCC FCCM