Embed Size (px)
Citation preview
Al-Azhar University – Gaza Faculty of Pharmacy
Master Program of Clinical Nutrition
Impact of Dietary Adherence on Blood L-phenylalanine Levels among Phenylketonuria children aged 6-18 years
in the Gaza Strip: Cross-sectional Study
By Akram Mahmoud Asfour
Supervised by
Dr. SulaimanEljabour
Associate Professor of Pharmaceutical and Medicinal Chemistry
Faculty of Pharmacy Al-Azhar University - Gaza
Dr. Abed El-RaziqSalama Associate Professor of Food Science
and Technology Faculty of Agriculture and Environment
Al-Azhar University - Gaza
A thesis Submitted in Partial Fulfillment of the Requirements for the Master Degree in Clinical Nutrition
Gaza – Palestine 1435 / 2013

1
Chapter I
1. Introduction
1.1 Overview
Phenylketonuria (PKU) is an inherited disorder of protein metabolism, which
inhibits the body’s ability to metabolize the essential amino acid phenylalanine (Phe)
(Burgard et al., 2009). It is caused by a defect in the enzyme phenylalanine hydroxylase or
by defective synthesis/recycling of its co-factor tetra-hydrobiopterin. Up to 90 percent of
phe intake is normally metabolized into tyrosine, the amino acid precursor to dopamine
and norepinephrine (Van Spronsen & Enns 2010). PKU is classified into three categories
based on severity at diagnosis: blood phe levels of 2 – 10 mg/dl may be classified as
having mild (non-PKU) hyperphenylalaninemia, blood phe levels of 10 – 20 mg/dl may be
classified as moderate PKU, and blood phe levels of 20mg/dl and higher may be classified
as classical PKU (Marsden and Levy, 2006). However, cutoffs for blood phe levels for
these classifications vary between countries, and an alternative definition of mild or severe
PKU can be adopted according to whether the patient requires therapeutic intervention or
according to actual daily phenylalanine intake tolerance (Blau, et al. 2002). PKU is the
most common inborn error of metabolism worldwide, with estimating rates of
approximately 1:10,000 in US, 1:9000 in Hungary, 1:8700 in Latvia, 1:6000 in Estonia and
1:4500 in Ireland (Waisbren et al., 2007), prevalence among Turks 1:2,600, among African
1:100,000, among Japanese 1:143,000, among Finnish and Ashkenazi Jewish 1:200,000
(Schulze et al., 2003). In the Middle East, it was estimated to be 1:14000 in UAE (Ali et
al., 2011), 11.6: 100,000 in Iran (Teebi & Farag, 1996).
In Gaza Strip (GS), the cumulative cases of PKU from (1994 – 2003) were 131
cases (MOH, 2004), increased to a total of 186 cases on December 2011 (MOH, 2012).
The incidence rate is 1:4000 and the overall prevalence is 6.35:100,000. Coverage of PKU
2
testing in the GS was limited to about 35.3% of the total newborns (Abu Shahla et al.,
2004), but currently, all the newborns in GS are tested for PKU on their first attendance to
primary health care centers to get the first vaccination dose (MOH, 2012).
Failure to diagnose and properly treat infants with PKU during early days of life leads to
abnormal neurological and psycho-social complications including; seizures and mental
retardation due to progressive brain damage, additionally, hyperphenylalaninemia in
children and adults is often associated with attention problems, mood instability and poor
job performance. Chronically elevated Phe may cause a progressive neurodegenerative
disorders that leads to seizures and gait disturbance (Levy et al., 2003).
The primary treatment for PKU is strict control of dietary Phe intake. If one only
consumed natural protein foods, the degree of protein restriction necessary to reduce
plasma Phe concentrations to treatment levels would lead to marked protein malnutrition,
failure-to-thrive, and death, therefore, individuals with PKU must also supplement their
diet with a phenylalanine-free medical formula that provides tyrosine and other amino
acids (Acosta & Yannicelli, 2001). Medical foods meet approximately 85 to 90% of the
individual’s protein needs (Przyrembel & Bremer, 2000). Adherence to dietary treatment is
a key factor for the wellbeing of PKU patients; adherence to the prescribed diet for PKU is
difficult due to the restrictive and often unpalatable diet, expense of medical food and low
protein food, difficulty taking prescribed medical foods at school or at work, frequency of
testing and record keeping, psychosocial issues, complicated diet planning,
misunderstanding of the diet, and restrictions imposed on social life (Bilginsoy et al.,
2005). Patients' family plays a major role in adherence to dietary treatment. Crone et al.,
(2005) focused on family factors such as parent’s attitudes, beliefs, subjective norms,
emotional reactions, and self-efficacy that may affect the patient’s behavior. They
suggested that family should be firm with the child’s adherence to the diet but not be harsh.
3
Having intact family structure also is important as patients tended to have higher phe levels
when their parents were separated or divorced (Olsson et al., 2007).
Bekhof et al., (2003) found that high level of knowledge among parents of PKU children
was significantly associated with lower phe levels of their children, while Evans et al.,
(2009) reported that fostering positive feelings and attitudes in PKU patients will improve
their adherence to diet. Macdonald et al., (2008) indicated that poor parental educational
level and unsatisfactory maternal dietary knowledge may all influence longer-term blood
Phe control in children.
1.2 Research problem
Phenylketonuria formulas and diet therapy are based on the restrictions of foods
rich in proteins. It is necessary to utilize special formulas that consist of Phe-free amino
acid mixtures supplemented with Tyrosine, vitamins and other micronutrients. Early
detection and treatment of PKU prevent the severe consequences of this disorder, including
subtle deficits in executive functioning, mild reductions in mental processing speed, social
difficulties, and emotional problems, poor executive function may impact treatment
adherence (Gentile, et al., 2010). Dietary therapy is a long-life process, and without
understanding and adherence to prescribed diet, the treatment of PKU will not be effective
and the end results will be traumatic physically and mentally for the affected children.
1.3 Justification of the study
This study will be of great importance as it focuses on a special group of children
suffering from a serious health problem that could be managed effectively by diet.
According to updated records of MOH (2012), one hundred eighty sex cases are registered
as having PKU in GS, of them 65 cases have mental retardation due to late discovery of the
disease and poor management. Early discovery could be achieved through strict screening
program for all newborn and following designated formulas for those who have positive
4
diagnosis. This study will raise the attention of decision-makers in MOH and NGOs
toward affording special dietary regimes and formulas to PKU children, in order to
maintain healthy life.
1.4 Significance of the study
Although PKU is an ongoing health problem in GS, it did not have adequate
attention from researchers in GS. If not discovered in the first days of life and managed
properly, PKU will have serious impacts on the affected children that will end with mental
retardation. Adherence to specified formulas and dietary regimes throughout life, beside
regular check of Phe levels and maintaining normal levels of blood Phe will avoid the
occurrence of health complications and enable the affected children to live almost normal
life as other children. Furthermore, assessment of parents' knowledge and attitudes is an
integral component in compliance to the long-life treatment of PKU, as parents who have
adequate knowledge and positive attitudes toward their children will monitor their children
and support them to follow prescribed dietary therapy.
According to the researcher's knowledge, only one study was conducted in GS
aimed to evaluate screening program for PKU (Abu Shahla, 2004), but this study will
focus on identifying the level of adherence of PKU patients to medical formulas and
dietary regime, beside examining the attitudes of parents toward having a child with PKU.
1.5 General objective of the study
The goal of this study is to identify how the adherence of PKU children to dietary
treatment affect their blood phe levels.
1.6 Specific objectives
- To compare Phe blood levels between male and female patients.
- To compare Phe blood levels in relation to patients' age.
5
- To identify patients' opinion about PKU related issues
- To examine parents knowledge and attitudes toward phenylketonuria.
- To compare Phe blood levels between those who received special diet and those
who did not.
- To compare adherence to dietary treatment in relation to (gender, parents level of
education, economic status, number of children).
1.7 Questions of the study
- What is the level of adherence to prescribed formulas and diet among
phenylketonuria patients in Gaza Strip?
- Are there differences in Phe levels between those who follow special dietary
regime and those who do not?
- Are there differences in Phe levels between male and female patients?
- Are there differences in Phe levels related to patients' age?
- What are the opinions of patients about PKU?
- What is the level of knowledge and attitudes of parents toward phenylketonuria?
- Are there differences in adherence to dietary treatment related to (gender, parents
level of education, economic status, number of children)?
1.8 Context of the study
1.8.1 Demographic context
Historical Palestine is a small country, its area about 26,323 sq. km . Now Palestine
comprises two areas separated geographically, the West Bank (WB) and Gaza Strip (GS),
with total area of 6,020 sq. km (Palestinian Centre Bureau of Statistics (PCBS), 2007). GS
is a narrow band of land located on the south of Palestine, constituting the coastal zone of
the Palestinian territory along the Mediterranean Sea between Egypt and Israel. It is 45
6
Kilometres long and 6-12 Kilometres wide with an area of 365 sq. km (PASSIA, 2008).
The number of population is estimated to be 1.5 million in the GS (PCBS, 2009).
1.8.2 Economical context
Gaza Strip is a poor area; its economy is mainly dependent upon agriculture, fishing, small
industry and governmental employments. The hard conditions in the GS had exacerbated
the humanitarian situation for Palestinians, unemployment and poverty rates have
increased dramatically in recent years due to the Israeli strict siege. The Gaza economy has
been greatly affected during the last six years due to a combination of unemployment,
closures, and restrictions placed on workers and industries. Unemployment in GS reached
alarmingly high levels (Palestinian Centre for Human Rights – PCHR, 2006). It was
reported that unemployment rates in GS reached 65 %, and that poverty rates get up to
80%, due to the ongoing Israeli-led siege and repeated assaults. Furthermore, 80% of the
residents in the strip depend on humanitarian aid provided by different relief groups such
as the World Food Program (WFP) and the United Nations Relief and Welfare Agency for
the Palestinian Refugees (UNRWA) (Human Rights Council, 2010). The ongoing siege
forced 96% of the factories and industrial areas in GS to shut down as the closure of border
terminals blocked exports and also blocked imports of tools and equipment needed by the
factories to continue the production process (Bannoura, 2009).
1.8.3 Health care system
Palestine experience in health care system is unique and complicated. The long
years of occupation and the following unilateral withdrawal of the Israelis from GS did
strongly influence the health care system in Palestine. The consequences of closures and
political separation formed a great challenge for the Ministry of Health (MOH) as it
created obstacles regarding the accessibility to health care services and affects the unity of
the health care system in all Palestinian governorates (MOH, 2004).
7
Health care services in Palestine are provided by five sectors, which is MOH, UNRWA,
Medical Military Services, Non-Governmental Organizations (NGOs) and private sector.
MOH is the main health care provider; it provides primary, secondary and tertiary services
and purchases some services from private providers locally and abroad (MOH, 2006).
MOH plays the main role in providing and controlling immunizations scheme, public
health activities, licensing and registration of health facilities. MOH bears the heaviest
burden, as it takes over the responsibility in GS for 59 primary health care centers and 13
hospitals (MOH, 2011).
Health care financing is mainly provided through the government, apart from the out-of-
pocket health financing which is the first source of health financing in Palestine (MOH,
2006). Additionally, external donations constitute a considerable source for health funding.
UNRWA mainly provides primary health care services to the refugee population. UNRWA
operates 20 PHC centers (WHO, 2009). The NGOs sector is extensive: from missionary
hospitals (As Ahli Arab Hospital, Al-Awda Hospital), to facilities supported by
international organizations, to community health centers. The NGOs sector operates 57
centers (WHO, 2009).
NGOs are considered as second providers of health services in Palestine. In 2004, the
health sector in NGOs owns and operates 265 mini PHC centers in Palestine. Some centers
include medical laboratories to perform simple diagnosis, and pharmacies that provide the
attendants with low cost medication. Services of child health departments are mainly
directed to children who complain from metabolic and nutritional problems (MOH, 2004).
One of the important NGOs is Ard El Insan Palestinian Benevolent Association (AEPBA).
It is a Gaza based Palestinian non-governmental organization primarily dealing in the field
of nutrition. AEPBA provides nutritional and health services to the most needy and
marginalized children under five, their mothers and families. Two community health and
8
nutrition rehabilitation centers in Gaza and Khan Younis city provide curative, preventive
and educational health services to beneficiaries in these areas. In addition, each center
conducts a community-based program targeting vulnerable areas in different locations such
as refugee camps, villages, deprived and rural areas (Ard El Insan Palestinian Benevolent
Association, 2006). Over the years, AEPBA has become the leading health community and
nutrition services provider in the GS. This has been achieved through adopting consistent
technical intervention strategies in the following fields: medical intervention, nutrition
therapy, counseling, health and nutrition awareness, psychological support, promote
household food security, promotion of breast-feeding, emergency intervention, training,
advocacy and exchange of information, as well conducting researches related to nutrition,
community, and environmental health. AEPBA vision "Vulnerable and poor families reach
a high level of nutrition and health through providing a high quality of services consistent
with the international criteria", and the AEPBA mission is "To provide health, nutrition,
and psychosocial services for children and mothers of poor and marginalized families so as
to improve their health and livelihoods" (Ard El Insan Palestinian Benevolent Association,
2006).
1.9 Definition of terms
Phenylketonuria
Phenylketonuria is an inborn error of metabolism, caused by recessively inherited
deficiency of the enzyme phenylalanine hydroxylase. Chronic untreated severe
hyperphenylalaninemia in infants and children leads to mental retardation (Blau et al.,
2010).
Essential amino acids
It is an amino acid that cannot be synthesized by the body, and therefore must be supplied
in the diet. The amino acids regarded as essential for humans are phenylalanine, valine,
9
threonine, tryptophan, isoleucine, methionine, leucine, lysine, and histidine (Young, 1994).
Additionally, cysteine (or sulphur-containing amino acids), tyrosine (or aromatic amino
acids), and arginine are required by infants and growing children. Essential amino acids are
"essential" because the body does not synthesize them. If they are not taken through diet,
they will not be available for protein synthesis (FAO/WHO/UNU, 2007).
The patient
The researcher defines the patient as any individual (male or female) who have confirmed
diagnosis of PKU and live in Gaza Strip.
Adherence
The researcher defines adherence as the degree of compliance to dietary restrictions and
consuming the prescribed diet according to the patient's age.
10
Chapter II
Literature review
2.1 Background
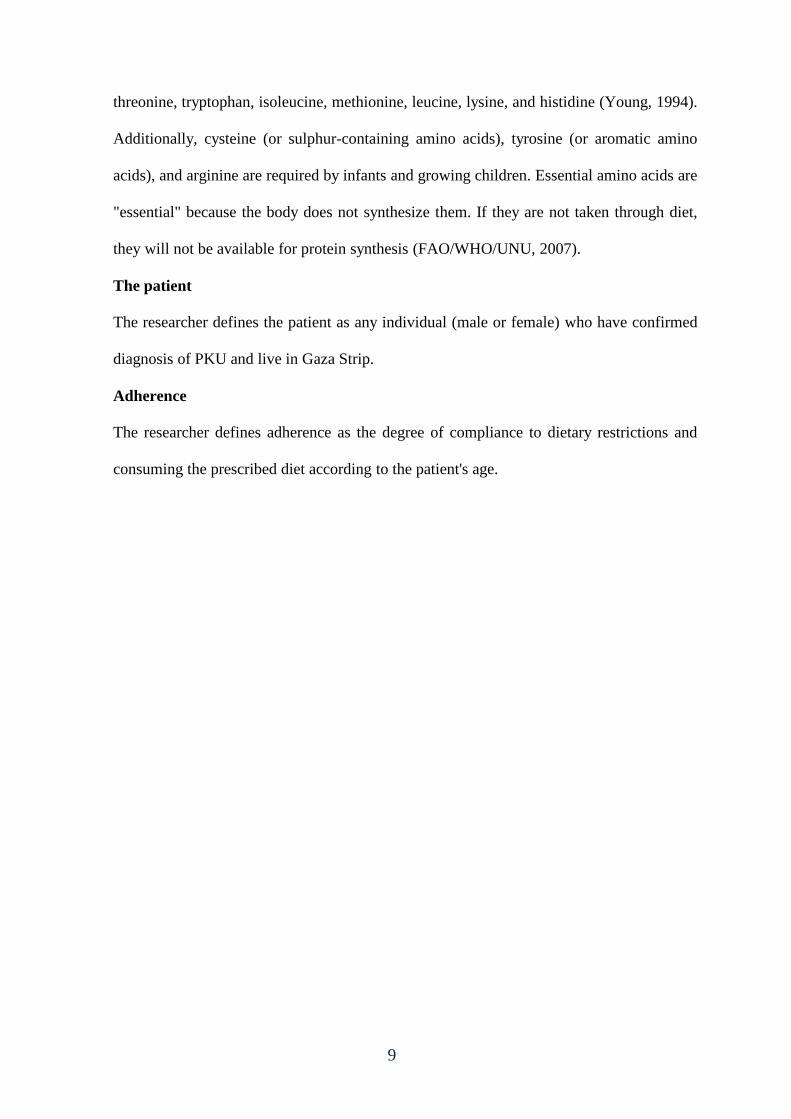
Phenylketonuria is an inherited genetic disorder that affects approximately one in
15,000 babies born in the US (National Institutes of Health, 2000). It is an autosomal,
recessive disorder involving mutations in the Phe hydroxylase gene, which inhibits the
normal metabolism of Phe, an amino acid found in all proteins (Scriver et al., 2000). As a
result, Phe cannot be converted to tyrosine and accumulates in the blood and other tissues
(Pietz, 1998). A person with PKU does not produce enough of an enzyme in their liver
called phenylalanine hydroxylase (EC1.14.16.1), this enzyme is needed to process the
amino acid phenylalanine, which is found in food items that contain protein. Usually, when
people eat protein, it is broken down into different amino acids which are then processed
and used for growth and repair of body tissue. Individuals with PKU can't process
phenylalanine and instead it accumulates in the blood and tissues to high concentrations,
resulting in severe mental retardation, epilepsy, and behavioral problems (National
Institutes of Health, 2000).
Figure (2.1): Phenylalanine metabolism (Adapted from Williams, et al., 2008)
11
2.2 Causes of phenylketonuria
Phenylketonuria is caused by genetic mutation. The defective gene contains the
instructions for making an enzyme needed to process the amino acid called phenylalanine.
In a person with PKU, this gene is defective, causing a complete or near-complete
deficiency of the enzyme. Without the enzyme necessary to process phenylalanine, a
dangerous buildup of this amino acid can develop when a person with PKU eats foods that
are high in protein, such as milk, cheese, nuts or meats. This can eventually lead to serious
health problems. For a child to inherit PKU, both the mother and father must have and pass
on the defective gene. This pattern of inheritance is called autosomal recessive. It's
possible for a parent to have the defective gene, but not have the disease. This is called
being a carrier. Most often, PKU is passed to children by parents who are carriers of the
disorder, but don't know it (www.Mayoclinic).
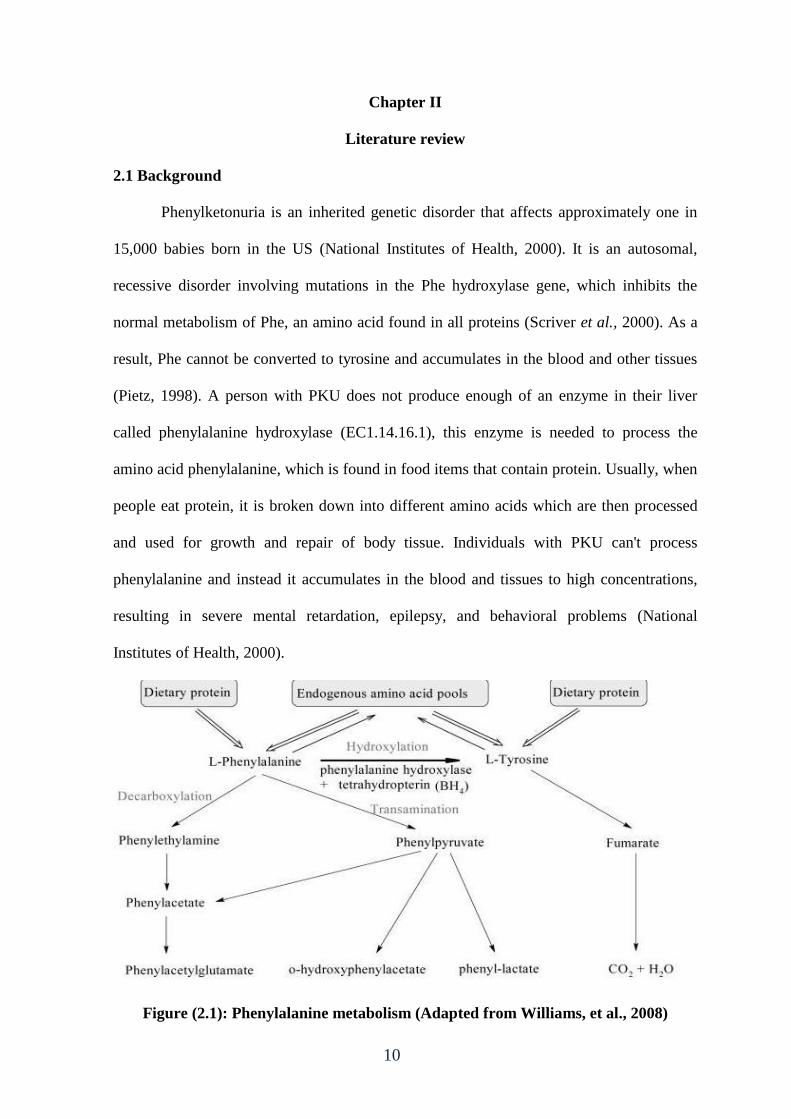
Figure (2.2): Diagram of inherited PKU (Genetic Counseling Aids, 2007)
12
The diagram denotes that to have an autosomal recessive disorder, you inherit two mutated
genes, one from each parent. These disorders are usually passed on by two carriers. Two
carriers have a 25% chance of having an unaffected child with two normal genes (left), a
50% chance of having an unaffected child who also is a carrier (middle), and a 25% chance
of having an affected child with two recessive genes (right) .
2.3 Screening and diagnosis of phenylketonuria
The advent of newborn screening came about with the work of Asbjorn Folling in
Norway nearly 80 years ago (Brin, et al., 2006). It was developed to identify disorders of
amino acid metabolism, which were not typically diagnosed until developmental delay or
other neurological symptoms became apparent (Schulze, et al., 2003). Newborn screening
programs in the United States began approximately 40 years ago for PKU with the filter
paper-based testing technology developed by Robert Guthrie (Longo, 2009; Brin, et al.,
2006). This method involves placing capillary blood from a heel prick on an agar plate
containing Bacillus subtilis, which requires Phenylalanine to grow. A Phenylalanine analog
that inhibits bacterial growth is also applied. High levels of phenylalanine counteract the
inhibitor and permit bacterial growth (Schulze, et al., 2003).
2.3.1 Symptoms of PKU
With newborn screening being widely used for PKU, infants are diagnosed early and
symptoms are prevented with early, life-long treatment. When PKU is untreated, however,
blood phe levels can become elevated; a high level of blood phe is toxic to the brain, the
following symptoms can occur when untreated or treated too late: mental retardation,
seizures, and eczema / skin rash, behavioral or social problems, tremors or jerking
movements in the arms and legs, hyperactivity, stunted growth, small head size
(microcephaly), musty odor in the child's breath, skin or urine, caused by too much
phenylalanine in the body, fair skin and blue eyes, because phenylalanine cannot transform
13
into melanin - the pigment responsible for hair and skin color (Mitchell and Scriver, 2000;
Mayoclinic, 2013).
2.3.2 Guthrie test
A Guthrie blood test, which is also known as the Guthrie bacterial inhibition assay,
is one of the most important screening tests performed on newborn babies. This test is
carried out to detect the presence of phenylketonuria in infants. To conduct the test, a
sample of blood is taken from the baby’s heel on the sixth or the seventh day after birth. If
the blood sample is taken too early, the reading may not be accurate. After collecting the
blood, the sample is incubated with a genus of bacteria known as Bacillus subtilis, along
with a chemical, known as B-2-phenylalanine. This chemical tries to inhibit the growth of
the bacteria, by preventing them from feeding on the phenylalanine present in the sample.
If the bacteria cannot grow, the result is negative. If the bacteria can grow in the sample,
the result is positive, which indicates the presence of phenylketonuria in the infant
(McMillan, et al., 2006).
2.3.3 Method of testing phenylketonuria in MOH Al-Remal PHC
Because of some disadvantages of Guthrie test method, it has been replaced by
assays in which the Phenylalanine in the blood of the patients takes part in a chemical
reaction developing a fluorescinating or a coloured substance which can be measured
quantitavely. The procedures can be used more conveniently in comparison to the more
sophisticated and more expensive method of the HPLC. This assays are used to measure
blood phenylalanine levels using a small blood sample taken from the heel (heel prick) or
big toe of babies and toddlers, and from the fingertip of children and adults. The procedure
is easy to manage once you have had a little practice. The MOH usually supply special
filter papers needed for the sample (MOH, 2013).
14
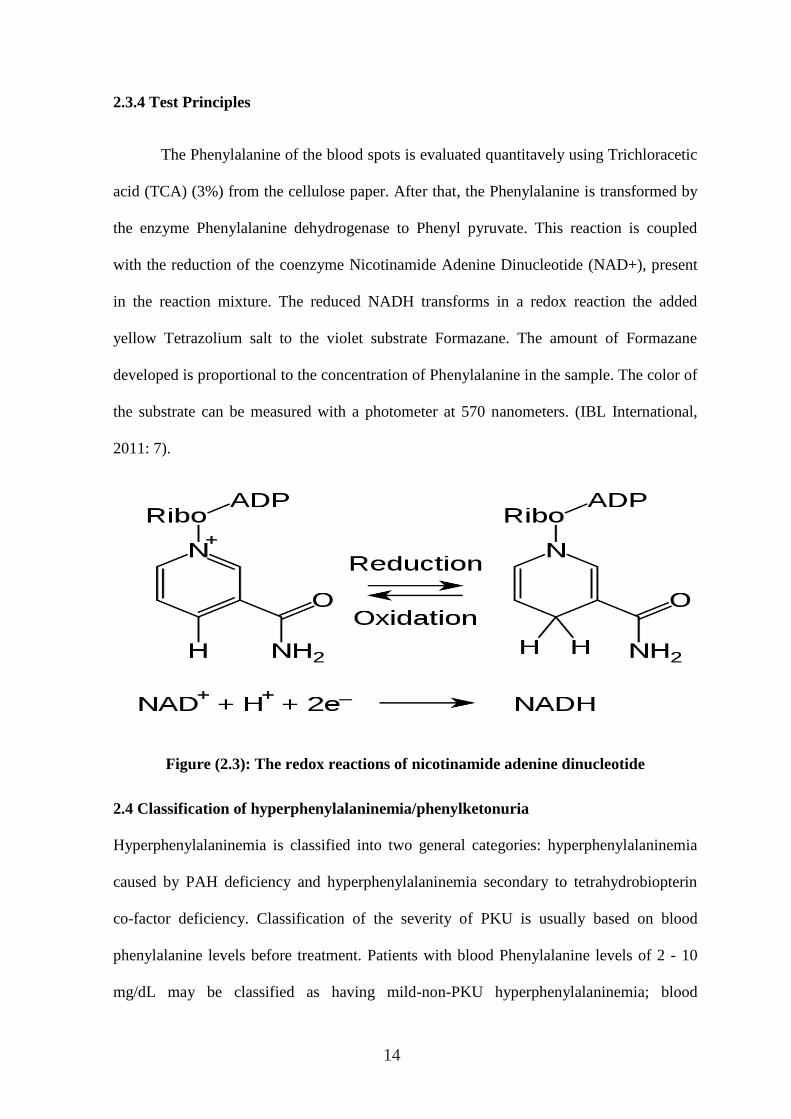
2.3.4 Test Principles
The Phenylalanine of the blood spots is evaluated quantitavely using Trichloracetic
acid (TCA) (3%) from the cellulose paper. After that, the Phenylalanine is transformed by
the enzyme Phenylalanine dehydrogenase to Phenyl pyruvate. This reaction is coupled
with the reduction of the coenzyme Nicotinamide Adenine Dinucleotide (NAD+), present
in the reaction mixture. The reduced NADH transforms in a redox reaction the added
yellow Tetrazolium salt to the violet substrate Formazane. The amount of Formazane
developed is proportional to the concentration of Phenylalanine in the sample. The color of
the substrate can be measured with a photometer at 570 nanometers. (IBL International,
2011: 7).
Figure (2.3): The redox reactions of nicotinamide adenine dinucleotide
2.4 Classification of hyperphenylalaninemia/phenylketonuria
Hyperphenylalaninemia is classified into two general categories: hyperphenylalaninemia
caused by PAH deficiency and hyperphenylalaninemia secondary to tetrahydrobiopterin
co-factor deficiency. Classification of the severity of PKU is usually based on blood
phenylalanine levels before treatment. Patients with blood Phenylalanine levels of 2 - 10
mg/dL may be classified as having mild-non-PKU hyperphenylalaninemia; blood
15
phenylalanine levels of 10 - 20 mg/dL may be classified as mild PKU; and levels of 20
mg/dL and above may be classified as classical PKU (Marsden & Levy, 2006). However,
cutoffs for blood phenylalanine levels for these classifications vary between countries, and
an alternative definition of "mild" or "severe" PKU can be adopted according to whether
the patient requires therapeutic intervention or according to actual daily phenylalanine
intake tolerance. This uncertainty is compounded by marked differences between countries
in the blood phenylalanine level considered to require intervention (National Institutes of
Health Consensus Development Panel, 2000).
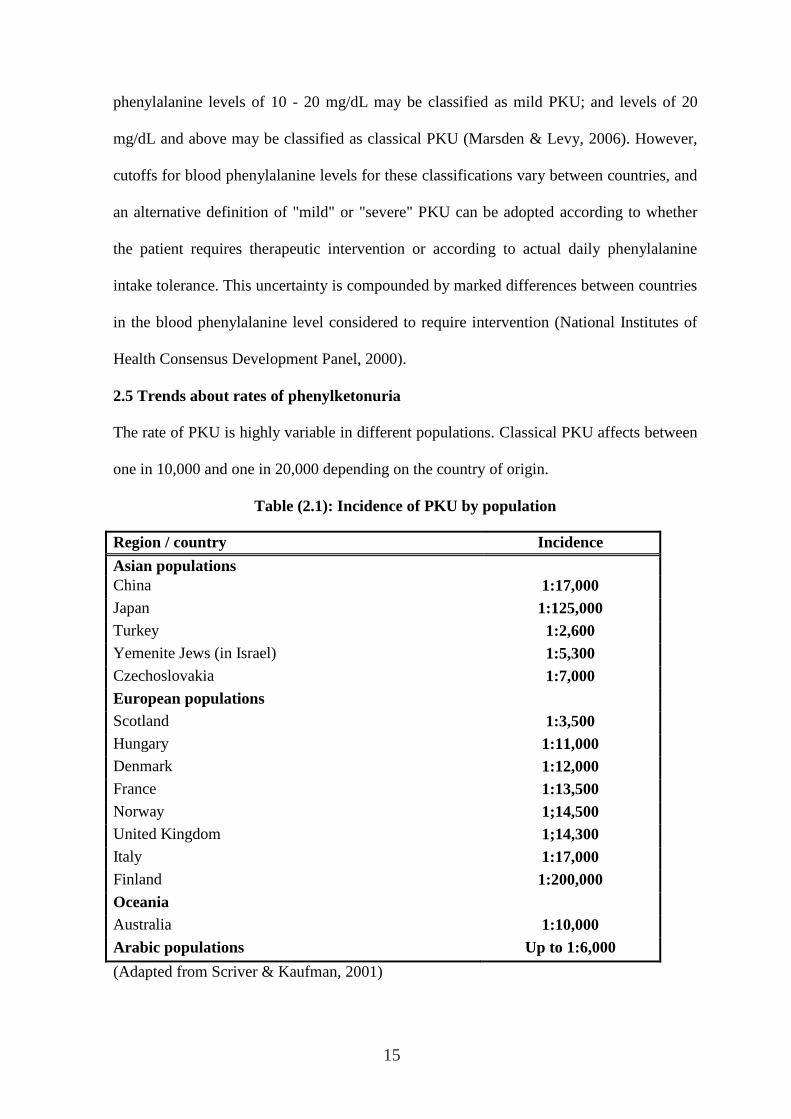
2.5 Trends about rates of phenylketonuria
The rate of PKU is highly variable in different populations. Classical PKU affects between
one in 10,000 and one in 20,000 depending on the country of origin.
Table (2.1): Incidence of PKU by population
Region / country Incidence
Asian populations
China 1:17,000
Japan 1:125,000
Turkey 1:2,600
Yemenite Jews (in Israel) 1:5,300
Czechoslovakia 1:7,000
European populations
Scotland 1:3,500
Hungary 1:11,000
Denmark 1:12,000
France 1:13,500
Norway 1;14,500
United Kingdom 1;14,300
Italy 1:17,000
Finland 1:200,000
Oceania
Australia 1:10,000
Arabic populations Up to 1:6,000
(Adapted from Scriver & Kaufman, 2001)
16
The estimating rates of PKU approximately 1:10,000 in US, 1:8700 in Latvia, 1:6,000 in
Estonia and 1:4,500 in Ireland (Waisbren, et al., 2007), among African 1:100,000, among
Japanese 1:143,000 (Schulze, et al., 2003). The average prevalence of classical PKU in
Iran was 2.1% (Ghiasvand, et al., 2009), in Tunisia 1:7,631(Khemir, et al., 2011), in
United Arab Emarates 1:14,000 (Ali, et al., 2011)
In GS, the rate of PKU is 1:4,000 and the overall prevalence is estimated at 6.35/100,000
(Abu Shahla, et al., 2004).
2.6 Consequences of phenylketonuria
Chronic, untreated, severe hyperphenylalaninemia in infants and children leads to several
physical and mental disabilities that may affect the patient, including:
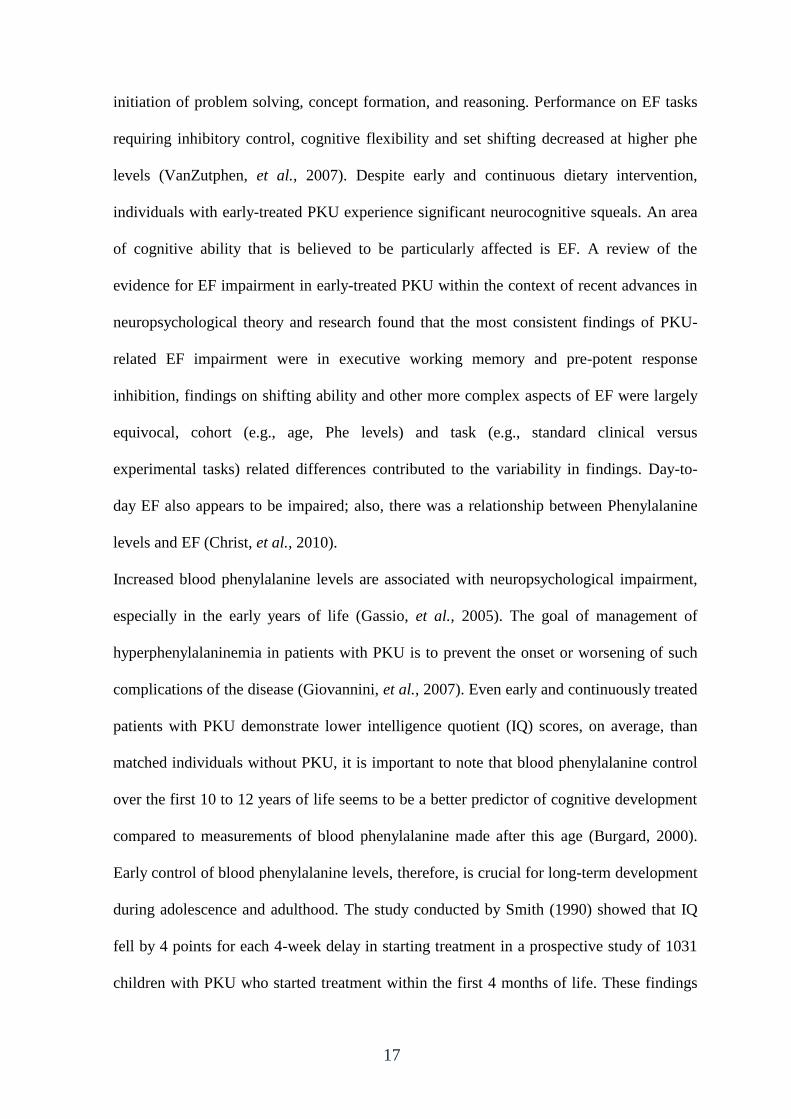
2.6.1 Cognitive and executive function
Specific deficits in executive functions (EF), which encompass planning,
information-processing, and sustained attention, are common among patients with PKU
and are related to increased phe levels (VanZutphen, 2007). Among children with PKU,
those with the highest persistent blood phe levels experience greater problems with
attention deficit, reduced reaction time, and impaired arithmetic skill, language
development, visual perception, visual motor skills, inhibitory control, and cognitive
flexibility compared with children with lower blood phenylalanine levels. However, mild
deficits in EF were observed even among some patients with good dietary control (phe 400
mol/L) compared with control patients (Albrecht, 2009; Huijbregts, 2002). In a study
aimed to examine the effects of dietary adherence, Phenylalanine levels, and age on
performance of EF tasks in children and adolescents with PKU. Fifteen subjects (age 8-20
years) with PKU were compared with the normative sample on the Delis-Kaplan EF
Battery and on the Wechsler Abbreviated Scales of Intelligence, the results showed that
children and adolescents with PKU showed lower performance in several EF skills:
17
initiation of problem solving, concept formation, and reasoning. Performance on EF tasks
requiring inhibitory control, cognitive flexibility and set shifting decreased at higher phe
levels (VanZutphen, et al., 2007). Despite early and continuous dietary intervention,
individuals with early-treated PKU experience significant neurocognitive squeals. An area
of cognitive ability that is believed to be particularly affected is EF. A review of the
evidence for EF impairment in early-treated PKU within the context of recent advances in
neuropsychological theory and research found that the most consistent findings of PKU-
related EF impairment were in executive working memory and pre-potent response
inhibition, findings on shifting ability and other more complex aspects of EF were largely
equivocal, cohort (e.g., age, Phe levels) and task (e.g., standard clinical versus
experimental tasks) related differences contributed to the variability in findings. Day-to-
day EF also appears to be impaired; also, there was a relationship between Phenylalanine
levels and EF (Christ, et al., 2010).
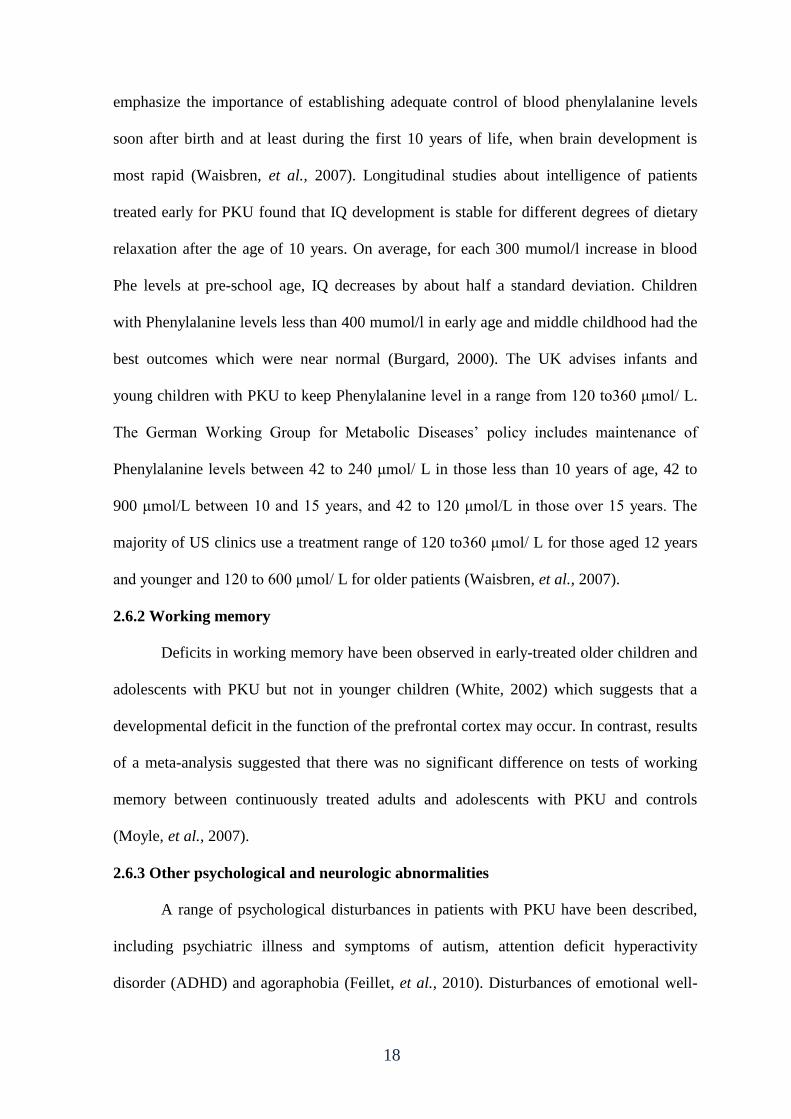
Increased blood phenylalanine levels are associated with neuropsychological impairment,
especially in the early years of life (Gassio, et al., 2005). The goal of management of
hyperphenylalaninemia in patients with PKU is to prevent the onset or worsening of such
complications of the disease (Giovannini, et al., 2007). Even early and continuously treated
patients with PKU demonstrate lower intelligence quotient (IQ) scores, on average, than
matched individuals without PKU, it is important to note that blood phenylalanine control
over the first 10 to 12 years of life seems to be a better predictor of cognitive development
compared to measurements of blood phenylalanine made after this age (Burgard, 2000).
Early control of blood phenylalanine levels, therefore, is crucial for long-term development
during adolescence and adulthood. The study conducted by Smith (1990) showed that IQ
fell by 4 points for each 4-week delay in starting treatment in a prospective study of 1031
children with PKU who started treatment within the first 4 months of life. These findings
18
emphasize the importance of establishing adequate control of blood phenylalanine levels
soon after birth and at least during the first 10 years of life, when brain development is
most rapid (Waisbren, et al., 2007). Longitudinal studies about intelligence of patients
treated early for PKU found that IQ development is stable for different degrees of dietary
relaxation after the age of 10 years. On average, for each 300 mumol/l increase in blood
Phe levels at pre-school age, IQ decreases by about half a standard deviation. Children
with Phenylalanine levels less than 400 mumol/l in early age and middle childhood had the
best outcomes which were near normal (Burgard, 2000). The UK advises infants and
young children with PKU to keep Phenylalanine level in a range from 120 to360 μmol/ L.
The German Working Group for Metabolic Diseases’ policy includes maintenance of
Phenylalanine levels between 42 to 240 μmol/ L in those less than 10 years of age, 42 to
900 μmol/L between 10 and 15 years, and 42 to 120 μmol/L in those over 15 years. The
majority of US clinics use a treatment range of 120 to360 μmol/ L for those aged 12 years
and younger and 120 to 600 μmol/ L for older patients (Waisbren, et al., 2007).
2.6.2 Working memory
Deficits in working memory have been observed in early-treated older children and
adolescents with PKU but not in younger children (White, 2002) which suggests that a
developmental deficit in the function of the prefrontal cortex may occur. In contrast, results
of a meta-analysis suggested that there was no significant difference on tests of working
memory between continuously treated adults and adolescents with PKU and controls
(Moyle, et al., 2007).
2.6.3 Other psychological and neurologic abnormalities
A range of psychological disturbances in patients with PKU have been described,
including psychiatric illness and symptoms of autism, attention deficit hyperactivity
disorder (ADHD) and agoraphobia (Feillet, et al., 2010). Disturbances of emotional well-
19
being in patients with PKU, including feelings of alienation, depression, social isolation,
impaired communication, low self-esteem, and poor functioning in social situations
(Waisbren & Zaff, 1994). Untreated PKU has been associated with severe behavioral
disorders, including hyperactivity, aggression, and self-harm, tremors and hyper-reflexia
have been observed in adult patients with PKU (Williams, 1998).
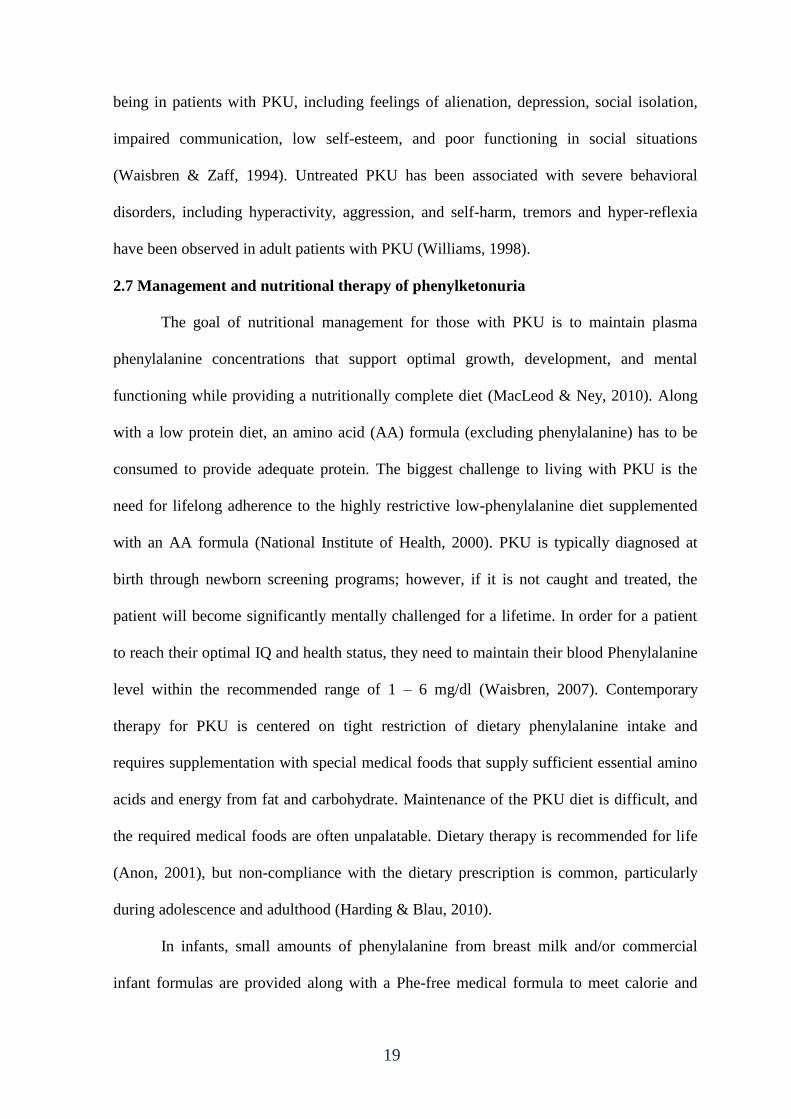
2.7 Management and nutritional therapy of phenylketonuria
The goal of nutritional management for those with PKU is to maintain plasma
phenylalanine concentrations that support optimal growth, development, and mental
functioning while providing a nutritionally complete diet (MacLeod & Ney, 2010). Along
with a low protein diet, an amino acid (AA) formula (excluding phenylalanine) has to be
consumed to provide adequate protein. The biggest challenge to living with PKU is the
need for lifelong adherence to the highly restrictive low-phenylalanine diet supplemented
with an AA formula (National Institute of Health, 2000). PKU is typically diagnosed at
birth through newborn screening programs; however, if it is not caught and treated, the
patient will become significantly mentally challenged for a lifetime. In order for a patient
to reach their optimal IQ and health status, they need to maintain their blood Phenylalanine
level within the recommended range of 1 – 6 mg/dl (Waisbren, 2007). Contemporary
therapy for PKU is centered on tight restriction of dietary phenylalanine intake and
requires supplementation with special medical foods that supply sufficient essential amino
acids and energy from fat and carbohydrate. Maintenance of the PKU diet is difficult, and
the required medical foods are often unpalatable. Dietary therapy is recommended for life
(Anon, 2001), but non-compliance with the dietary prescription is common, particularly
during adolescence and adulthood (Harding & Blau, 2010).
In infants, small amounts of phenylalanine from breast milk and/or commercial
infant formulas are provided along with a Phe-free medical formula to meet calorie and
20
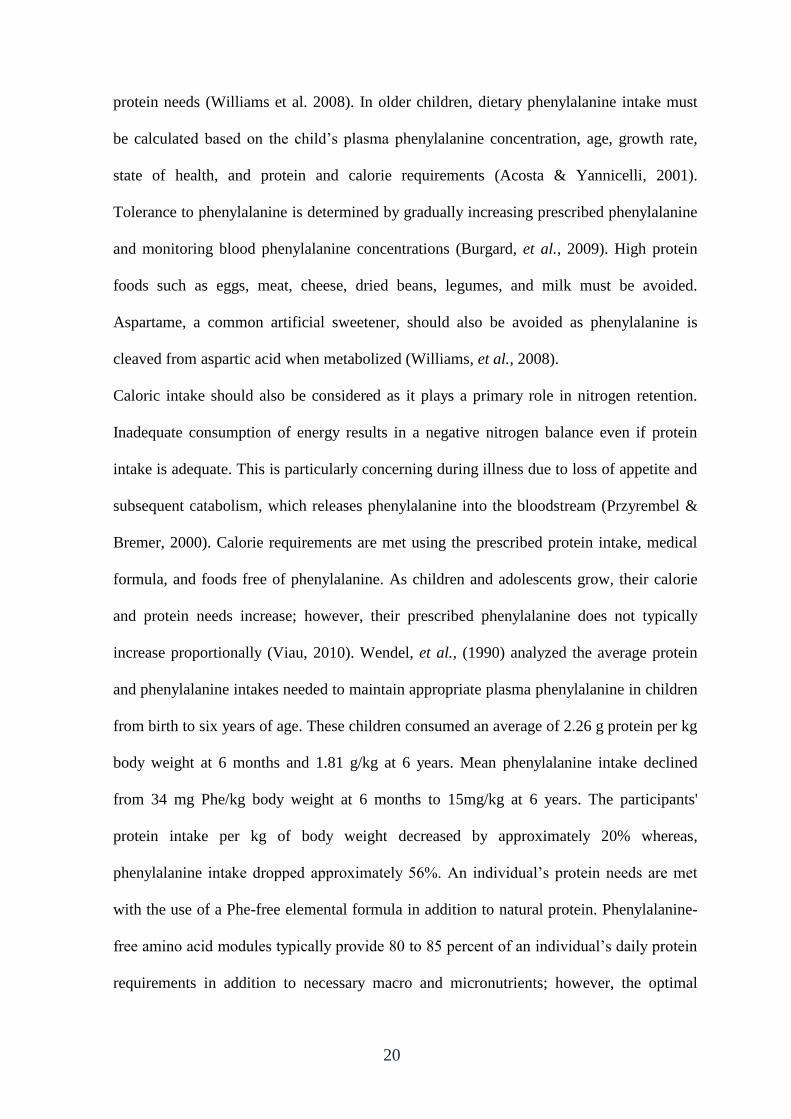
protein needs (Williams et al. 2008). In older children, dietary phenylalanine intake must
be calculated based on the child’s plasma phenylalanine concentration, age, growth rate,
state of health, and protein and calorie requirements (Acosta & Yannicelli, 2001).
Tolerance to phenylalanine is determined by gradually increasing prescribed phenylalanine
and monitoring blood phenylalanine concentrations (Burgard, et al., 2009). High protein
foods such as eggs, meat, cheese, dried beans, legumes, and milk must be avoided.
Aspartame, a common artificial sweetener, should also be avoided as phenylalanine is
cleaved from aspartic acid when metabolized (Williams, et al., 2008).
Caloric intake should also be considered as it plays a primary role in nitrogen retention.
Inadequate consumption of energy results in a negative nitrogen balance even if protein
intake is adequate. This is particularly concerning during illness due to loss of appetite and
subsequent catabolism, which releases phenylalanine into the bloodstream (Przyrembel &
Bremer, 2000). Calorie requirements are met using the prescribed protein intake, medical
formula, and foods free of phenylalanine. As children and adolescents grow, their calorie
and protein needs increase; however, their prescribed phenylalanine does not typically
increase proportionally (Viau, 2010). Wendel, et al., (1990) analyzed the average protein
and phenylalanine intakes needed to maintain appropriate plasma phenylalanine in children
from birth to six years of age. These children consumed an average of 2.26 g protein per kg
body weight at 6 months and 1.81 g/kg at 6 years. Mean phenylalanine intake declined
from 34 mg Phe/kg body weight at 6 months to 15mg/kg at 6 years. The participants'
protein intake per kg of body weight decreased by approximately 20% whereas,
phenylalanine intake dropped approximately 56%. An individual’s protein needs are met
with the use of a Phe-free elemental formula in addition to natural protein. Phenylalanine-
free amino acid modules typically provide 80 to 85 percent of an individual’s daily protein
requirements in addition to necessary macro and micronutrients; however, the optimal
21
dosage has yet to be determined (MacDonald, et al., 2006). Higher amount of protein
substitute (2 g/kg/day) may lead to increased protein retention and compensate for the
potential for poor utilization of free amino acids. Free amino acids are absorbed and
oxidized faster than natural protein; therefore medical formula should be divided into three
doses per day to enhance utilization of amino acids (Olsson, et al., 2007; MacDonald, et
al., 2006). In addition, the study conducted by MacDonald, et al., (2006) showed improved
phenylalanine control for those taking 2 g/kg/day of protein substitute compared to those
taking 1.2 g/kg/day.
While a Phe-restricted diet with amino acid supplementation is indicated for those
with PKU, it presents potential risks; patients with PKU undergoing dietary therapy have
an abnormal fatty acid profile and low levels of cholesterol and trace elements such as iron,
zinc, and retinol. Patients with PKU exclude the majority of animal products, which supply
exogenous cholesterol, fatty acids, and micronutrients; however, it is unclear whether these
disturbances are due to inadequate intake or disordered biosynthesis of these nutrients
(Williams, et al., 2008; Przyrembel & Bremer 2000).
Developments of new treatments have been introduced. A review by Van Spronsen
& Enns (2010) discussed new medical treatments that show promise to increase
compliance with the diet; generally, low protein diet needs to be followed throughout life,
but management methods are inconsistent throughout the world. One development in
treatment was the discovery of glycomacropeptide (GMP) (Van Calcar, et al., 2009). GMP
is a natural protein, derived from goat’s milk, GMP is a 64-amino acid
glycophosphopeptide found in whey protein during cheese making. Pure GMP is free of
phenylalanine but the commercial form of GMP contains 2.5 to 5.0 mg phenylalanine per
gram of protein (Ney, et al., 2009). This can potentially be used instead of the traditional
formula as it has a more palatable taste and may be more effective in lowering
22
phenylalanine levels. Limitations to this include the need to supplement tyrosine,
tryptophan, vitamins and minerals. Another promising treatment is an injectable form of
the enzyme, phenylalanine-ammonia lyase; this enzyme is responsible for breaking down
phenylalanine into non-toxic compounds, preventing high levels of phenylalanine in the
body (Van Spronsen & Enns, 2010).
2.8 Factors influencing adherence to dietary therapy
In PKU, it is common for blood phenylalanine concentrations to be outside optimal
target ranges, particularly in teenagers and adults, indicating inadequate compliance; in
PKU, compliance is complex, being subject to diverse definitions, and factors influencing
compliance include the nature and nurture of the patient, as well as the inconvenience, cost
and availability of dietary treatment (MacDonald, et al., 2010). Adherence to the
prescribed diet for PKU is difficult and time-consuming. Barriers to adherence include; the
restrictive and often unpalatable diet, expense of medical food and low protein food,
difficulty taking prescribed medical foods at school or at work, frequency of testing and
record keeping, psychosocial issues, lack of health insurance, complicated diet planning,
misunderstanding of the diet, and restrictions imposed on social life (Bilginsoy, et al.,
2005).
One component of dietary management was family influence. Parents play a major
role in adherence / compliance to dietary regimes. Crone, et al., (2005) explored parental
dynamics that may relate to PKU patients and their adherence to the diet, and reported that
family should be firm with the child’s adherence to the diet but not be harsh. Another study
revealed that there was significant relationship between parents’ marital status and
phenylalanine levels, where patients tended to have higher phenylalanine levels when their
parents were separated or divorced (Olsson, et al., 2007). Another study conducted in Iran,
found that there was a significant association between divorced and unemployed parents,
23
and higher levels of blood phenylalanine concentration (P = 0.02 and 0.03 respectively),
also there was a significant positive correlation between number of affected children in the
family (r = 0.43, P < 0.001), age at diagnosis (r = 0.2, P = 0.03), treatment duration (r =
0.7, P = < 0.001) and blood phenylalanine concentrations, on the other hand, there was no
significant relationship between parental education, family size and dietary adherence
(Alaei, et al., 2011).
Knowledge of one’s disease may increase successful management of that disease.
Bekhof, et al., (2003) investigated caregivers and patient’s knowledge of PKU and the
possible relation to average blood phenylalanine levels, and found that higher knowledge
of the parents was significantly associated with lower phenylalanine levels of their
children. Another study indicated that a patient-focused written educational package may
be useful as a supportive tool (Durham-Shearer, et al., 2008). The study carried out by
Evans, et al., (2009) showed that fostering positive feelings and attitudes in PKU patients
will improve their adherence to diet. Concerning barriers to diet therapy, the study
conducted by Bilginsory, et al., (2005) showed that compliance habits were frequently
changed before a blood test was taken in 47% of families and 45% of subjects agreed that
PKU was not a substantial financial burden on their household, insurance for 83% of
families did not cover the expensive low protein foods. Another study revealed that the
major barriers to diet therapy included insurance coverage, temptation to go off the diet,
and potential lack of social support from family and friends. This suggests that
interventions to help with dietary control need to be customized for each person due to the
variability of symptoms when the diet is not followed (Kemper, et al., 2010).
2.9 Knowledge and attitudes about phenylketonuria
Metabolic control in PKU may be influenced by parental KAP because dietary
treatment involves complex food choices. A study carried out by Macdonald, et al., (2008)
24
showed that the overall maternal knowledge on most aspects of diet was good and there
was a correlation between annual median blood phenylalanine concentrations and higher
maternal scores on PKU knowledge (r = -0.646; P < 0.0001), the study concluded that
blood phenylalanine control within the first 3 years of age, poor parental educational
achievement at school level and unsatisfactory maternal dietary knowledge may all
influence longer-term blood phenylalanine control in children. A study aimed to compare
the level of maternal knowledge and the blood phenylalanine control in PKU was
conducted on 144 children treated with a low-phe diet using a Phe-exchange system
showed that there was a negative correlation between maternal knowledge about phe-
exchange and median blood phenylalanine concentration (P < 0.05), also, maternal
knowledge about a standard 15 mg Phe-exchange system is correlated with dietary
compliance as measured by blood phenylalanine concentrations (Ozel, et al., 2008). To
evaluate the effectiveness of an education intervention on knowledge, attitudes, and health
beliefs regarding metabolic control of PKU and dietary compliance, Singh, et al., (2000)
found that short-term effects of the educational interventions were significant reductions in
dietary phenylalanine intake and plasma phenylalanine levels. Another study conducted in
Italy, found that 56.1% of patients were considered adherent to the dietary prescriptions,
and that phenylalanine intake was significantly in excess of prescribed amounts if mothers
had a lower level of education, and adherence was not correlated with age (Cotugno, et al.,
2011).
25
Chapter III
Material and methods
In this chapter, the researcher presented the activities performed in conducting
the study; it included choosing study design, population and sample, setting and period of
the study, preparation of study tools and data collection.
3.1 Study design
The researcher used descriptive, retrospective, cross-sectional design which is
useful for the descriptive purposes and it is proper to measure the study variables. Cross-
sectional studies are generally carried out at a point of time or over a short period and are
usually quick and economic compared to other study designs (Polit, 2004).
3.2 Population of the study
The population of the study consisted of all PKU children in GS. Their total number is 186
children (94 females and 92 males).
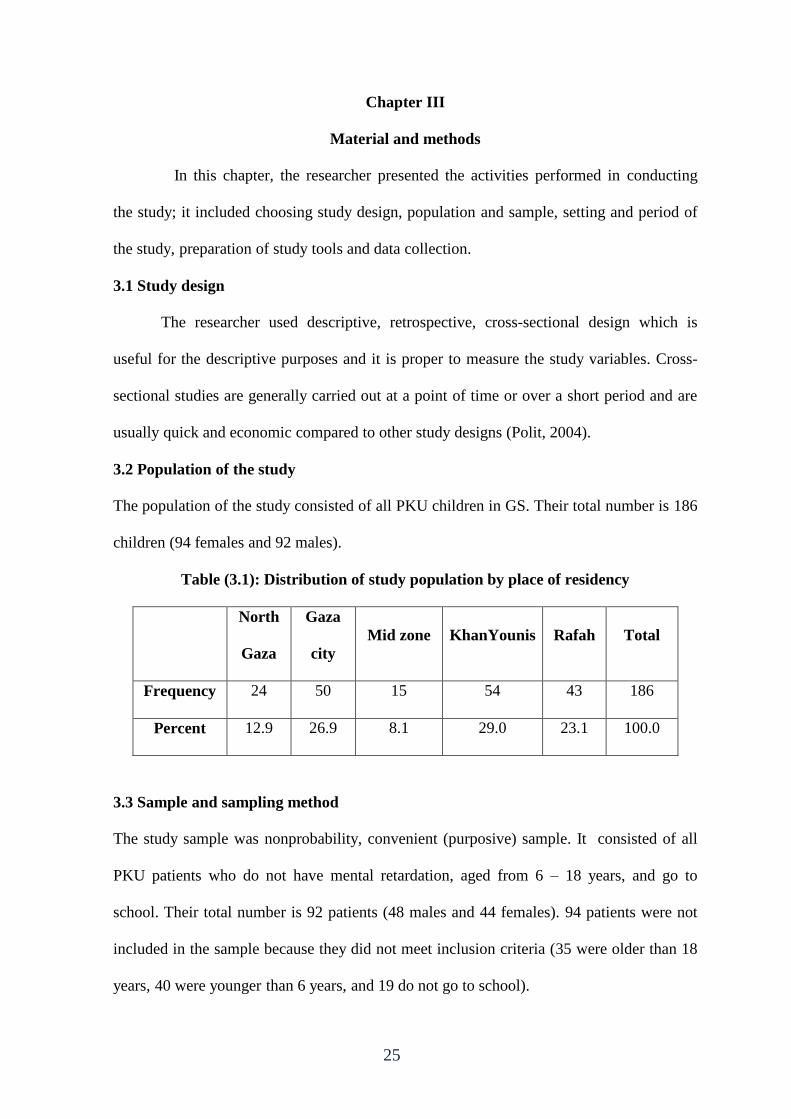
Table (3.1): Distribution of study population by place of residency
North
Gaza
Gaza
city
Mid zone KhanYounis Rafah Total
Frequency 24 50 15 54 43 186
Percent 12.9 26.9 8.1 29.0 23.1 100.0
3.3 Sample and sampling method
The study sample was nonprobability, convenient (purposive) sample. It consisted of all
PKU patients who do not have mental retardation, aged from 6 – 18 years, and go to
school. Their total number is 92 patients (48 males and 44 females). 94 patients were not
included in the sample because they did not meet inclusion criteria (35 were older than 18
years, 40 were younger than 6 years, and 19 do not go to school).
26
3.4 Setting of the study
The study was conducted in Gaza Strip, at Al-Remal PHC in Gaza city.
3.5 Period of the study
The study was conducted during the period from October 2012 to April 2013.
3.6 Eligibility criteria
3.6.1 Inclusion criteria
- Patients without mental deficits and registered in the PKU clinic at Al-Remal primary
health care center.
- Patients aged from 6 – 18 years.
3.6.2 Exclusion criteria
- Children with physical or mental retardation.
- Children who suffer from other diseases that may interfere with PKU such as inborn
error of protein metabolism.
3.7 Tools of the study
3.7.1 Questionnaire
After reviewing literature and previous studies, the researcher developed a constructive
questionnaire for data collection (annex 1 and 2). The questionnaire was divided mainly
into two parts;
First part for PKU patients, included:
- Socio-demographic data; included child's age, gender, weight, height, phenylalanine
level, education, academic achievement.
- Dietary regime; consisted of 8 questions.
- Phe testing; consisted of 8 questions.
Each question has different answer choices, and each participant will chose a response
for each question from the listed choices.
27
Second part for parents, included:
- Socio-demographic data; included parent's age, level of education, occupation,
monthly income, and number of children having PKU.
- Parent's knowledge about PKU; consisted of 5 questions (each question has 3 – 5
answers), and the parent has to choose one.
- Parent's attitudes toward PKU; consisted of 8 questions (each question has 2 – 3
answers), and the parent has to choose one.
3.7.2 Anthro-bio-metric measurements
- Weight and height measurement
- Blood sample to check phe level
3.8 Validity of the questionnaire
Validity of an instrument is essential step before the actual data collection. Validity
is defined as "the extent to which an instrument measures what it is supposed to measure
(Polit, 2004). The researcher distributed the questionnaire to a panel of experts in the field
(annex 3) for their comments regarding the contents of the questionnaire, then their
comments were reviewed and modifications were applied accordingly.
3.9 Data collection
Data was collected by the researcher. The researcher obtained data from patients'
records at Al-Remal primary health care center – PKU clinic. Patients and their attending
parent were interviewed during their visit to the clinic for routine check-up. All the
questionnaires were completed by parents and patients with help from the researcher.
Patients' records were also used to obtain Phe index profile of patients.
Also, the height and weight of each patient was measured by the researcher, and a female
nurse helped in taking measurements for female patients, then blood samples were
obtained to measure phe level for each patient according to the following steps:
28
3.9.1 Weight and height measurement
The researcher used (SECA, Germany) body meter for measuring weight and height of
patients according to the following process:
- Each patient was asked to remove any bulky clothing or any other items that could
affect the measurements.
- Patients were then asked to step on to the scale with their back and heels against the
stand (children were asked not to lean back on the stand), with arms straight down by
their body sides.
- They were then asked to stand up straight (stretching upwards without heels leaving the
ground and to look straight ahead.
- Make sure that the lower body is in proper position (feet about 25 – 30 cm apart), and that
line of vision is at right angles to the body before taking measurement.
- Record the weight, then roll the tape measure down to the top of the child's head, and
record the height (WHO, 2008).
Because many patients do not come to PKU clinic on regular basis and the difficulty
accessing some patients at home, the researcher took anthrometric measurements one time
during their visit to the clinic.
3.9.2 Blood sample collection
The needed equipment for drawing blood sample was prepared included;
- A lancing device for sample blood supply such as 21 gauge pen. Note that high gauge
(ultrafine) lancets do not provide enough blood for testing blood Phe.
- Filter paper from Schleicher & Schuell No. 903 (annex 9).
- Alcohol swab
- Bandage
29
3.9.2.1 Steps for taking blood sample
- Fill in the required details on the filter paper using a ballpoint pen. This usually includes full
name and date of collection.
- Select (or have your child select, if appropriate for age) the finger to use for the blood sample.
- Use an alcohol swab to disinfect the finger or heel.
- Press the lancet or lancet pen firmly against the heel or finger and push down (or push the
button) until the lancet is released, piercing the skin.
- Allow a large drop of blood to form on the heel or finger. If blood is not flowing freely, use
pressure on the foot or the finger, pushing toward the site of the needle stick to cause blood to
flow.
- Let the blood drop onto the circle on the card. Continue to fill the circle from the center,
making sure that the blood soaks through to the back of the card. Fill in required circle(s) based
on clinic’s instructions.
- Cover the puncture site with a bandage.
- Lay the card flat so that both sides of the blood spot can air-dry for at least 2 hours.
Because the standards are established with filter cards from Schleicher & Schuell No. 903
and there is a significant influence of the results by the filter card material, it is
recommended to use these cards also for the patient samples. Don’t squeeze the puncture
site during the collection because this will cause hemolysis or dilution of the blood with
tissue fluid. Don’t apply successive drops of blood to the same pre-printed circles. Don’t
touch or smear the blood spots. Take care that the blood spot samples are visually okay
(e.g. no blood smears, no coagulates, no finger-prints on the spots).
Blood phe level up to 10 mg/dl was considered normal according to MOH protocols.
30
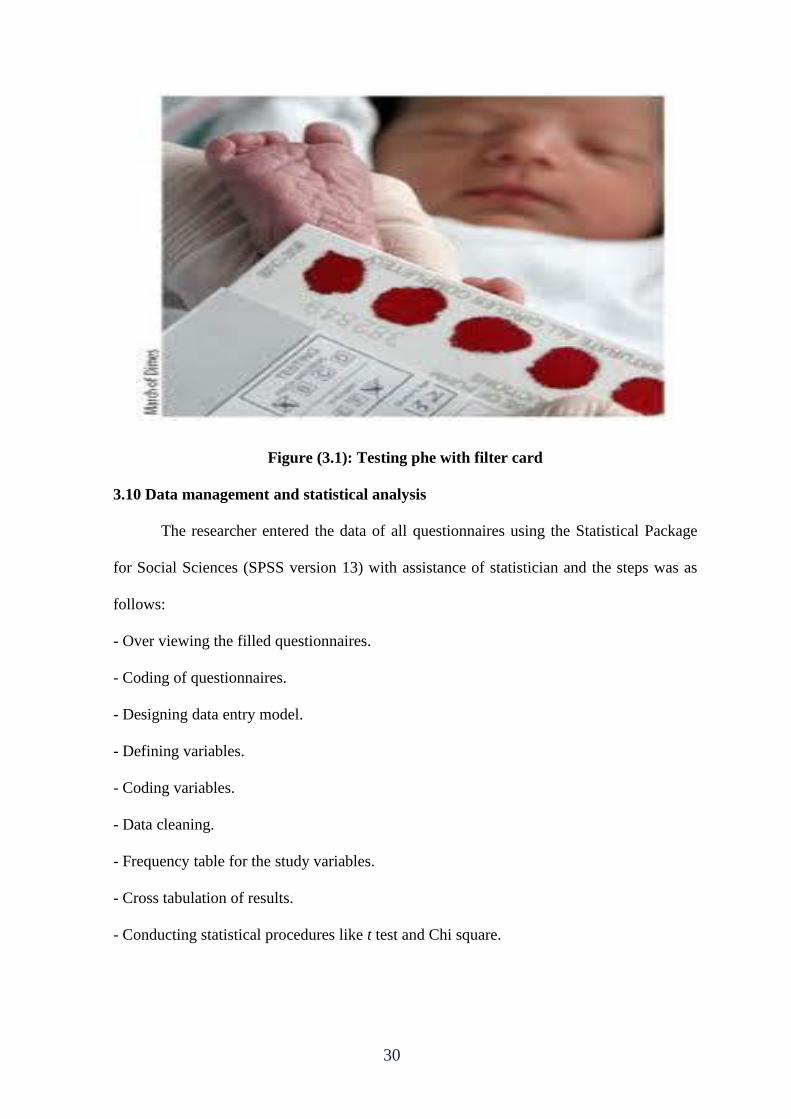
Figure (3.1): Testing phe with filter card
3.10 Data management and statistical analysis
The researcher entered the data of all questionnaires using the Statistical Package
for Social Sciences (SPSS version 13) with assistance of statistician and the steps was as
follows:
- Over viewing the filled questionnaires.
- Coding of questionnaires.
- Designing data entry model.
- Defining variables.
- Coding variables.
- Data cleaning.
- Frequency table for the study variables.
- Cross tabulation of results.
- Conducting statistical procedures like t test and Chi square.
31
3.11 Ethical considerations
An official letter from Al-Azhar University, college of Pharmacy was sent to the
General Directorate for Human Resource Development at MOH (annex 5). Approval letter
was obtained from the General Directorate of Primary Health Care at MOH (annex 6).
Also, approval letter was obtained from the Helsinki Committee in GS (annex 7).
Every participant had been provided with a full explanatory form attached to questionnaire
both verbally and written. This form was included the purpose of the study, assurance
about the confidentiality of the information and the instructions regarding dealing with
questionnaire. Also, it included a statement indicated that the participant have the right to
refuse to participate in this study "consent form".
3.12 Limitation of study
- Lack of local studies and resources.
- Difficulty in reaching the patients at their homes.
- Financial constraints.
- Frequent electricity cuts affected the ability to accomplish the work in a timely
manner.
32
Chapter IV
Results and discussion
4.1 Characteristics of study participants
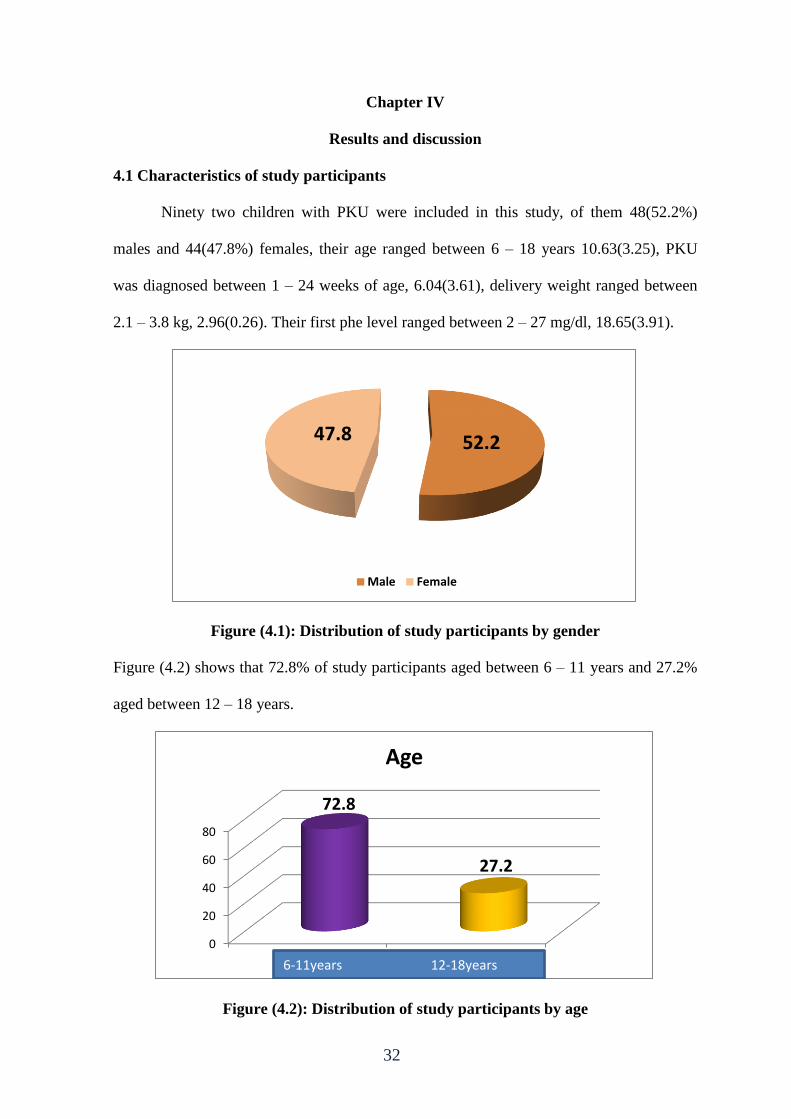
Ninety two children with PKU were included in this study, of them 48(52.2%)
males and 44(47.8%) females, their age ranged between 6 – 18 years 10.63(3.25), PKU
was diagnosed between 1 – 24 weeks of age, 6.04(3.61), delivery weight ranged between
2.1 – 3.8 kg, 2.96(0.26). Their first phe level ranged between 2 – 27 mg/dl, 18.65(3.91).
Figure (4.1): Distribution of study participants by gender
Figure (4.2) shows that 72.8% of study participants aged between 6 – 11 years and 27.2%
aged between 12 – 18 years.
Figure (4.2): Distribution of study participants by age
52.2 47.8
Male Female
0
20
40
60
80
6-11 years 16-18 years
72.8
27.2
Age
6-11years 12-18years
33
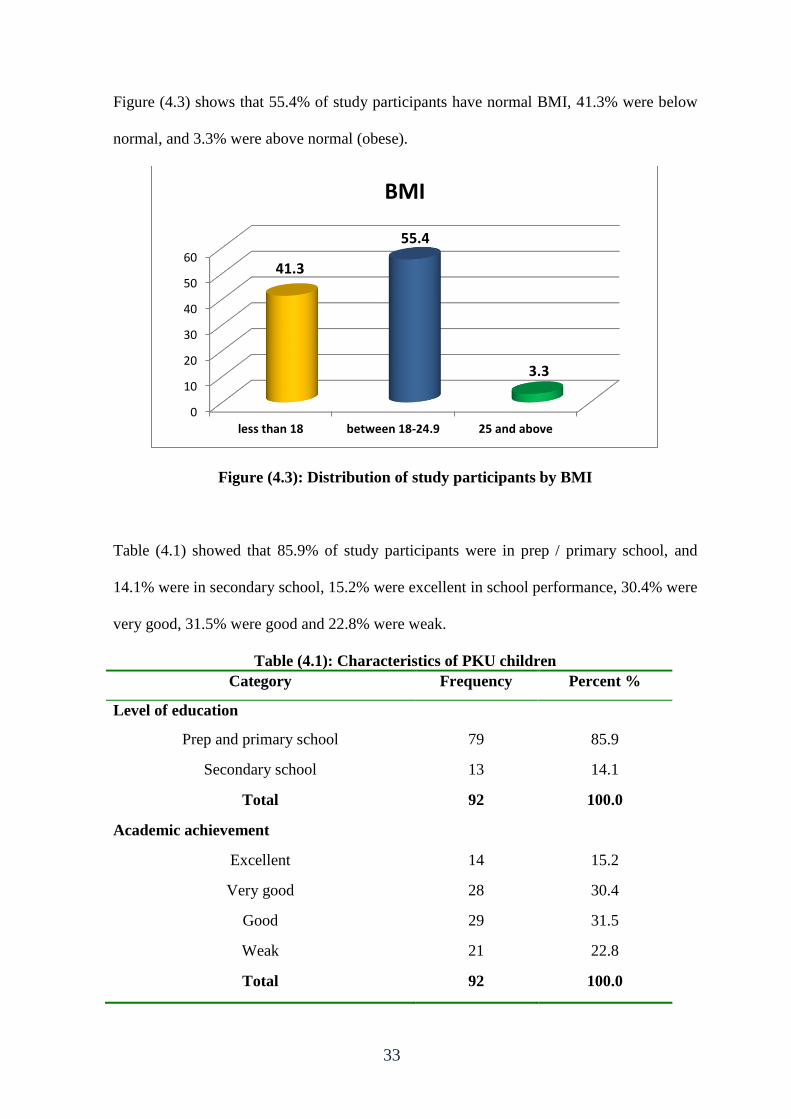
Figure (4.3) shows that 55.4% of study participants have normal BMI, 41.3% were below
normal, and 3.3% were above normal (obese).
Figure (4.3): Distribution of study participants by BMI
Table (4.1) showed that 85.9% of study participants were in prep / primary school, and
14.1% were in secondary school, 15.2% were excellent in school performance, 30.4% were
very good, 31.5% were good and 22.8% were weak.
Table (4.1): Characteristics of PKU children
Category Frequency Percent %
Level of education
Prep and primary school 79 85.9
Secondary school 13 14.1
Total 92 100.0
Academic achievement
Excellent 14 15.2
Very good 28 30.4
Good 29 31.5
Weak 21 22.8
Total 92 100.0
0
10
20
30
40
50
60
less than 18 between 18-24.9 25 and above
41.3
55.4
3.3
BMI
34
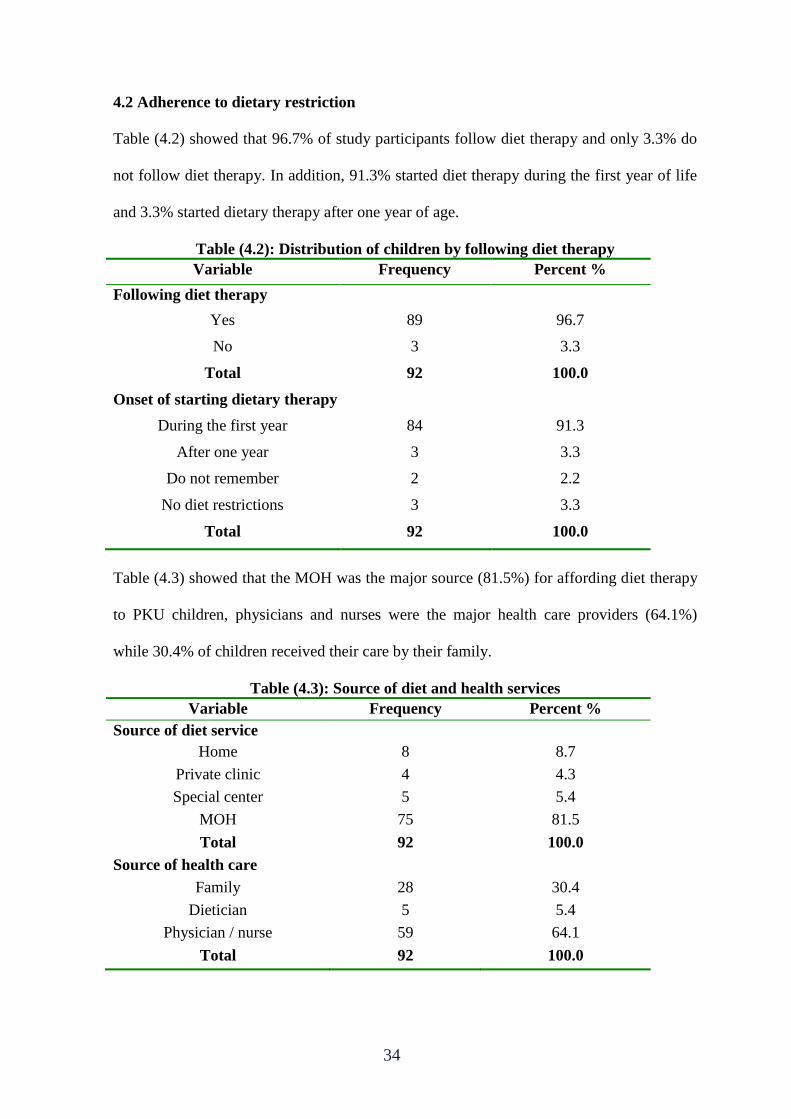
4.2 Adherence to dietary restriction
Table (4.2) showed that 96.7% of study participants follow diet therapy and only 3.3% do
not follow diet therapy. In addition, 91.3% started diet therapy during the first year of life
and 3.3% started dietary therapy after one year of age.
Table (4.2): Distribution of children by following diet therapy
Variable Frequency Percent %
Following diet therapy
Yes 89 96.7
No 3 3.3
Total 92 100.0
Onset of starting dietary therapy
During the first year 84 91.3
After one year 3 3.3
Do not remember 2 2.2
No diet restrictions 3 3.3
Total 92 100.0
Table (4.3) showed that the MOH was the major source (81.5%) for affording diet therapy
to PKU children, physicians and nurses were the major health care providers (64.1%)
while 30.4% of children received their care by their family.
Table (4.3): Source of diet and health services
Variable Frequency Percent %
Source of diet service
Home 8 8.7
Private clinic 4 4.3
Special center 5 5.4
MOH 75 81.5
Total 92 100.0
Source of health care
Family 28 30.4
Dietician 5 5.4
Physician / nurse 59 64.1
Total 92 100.0
35
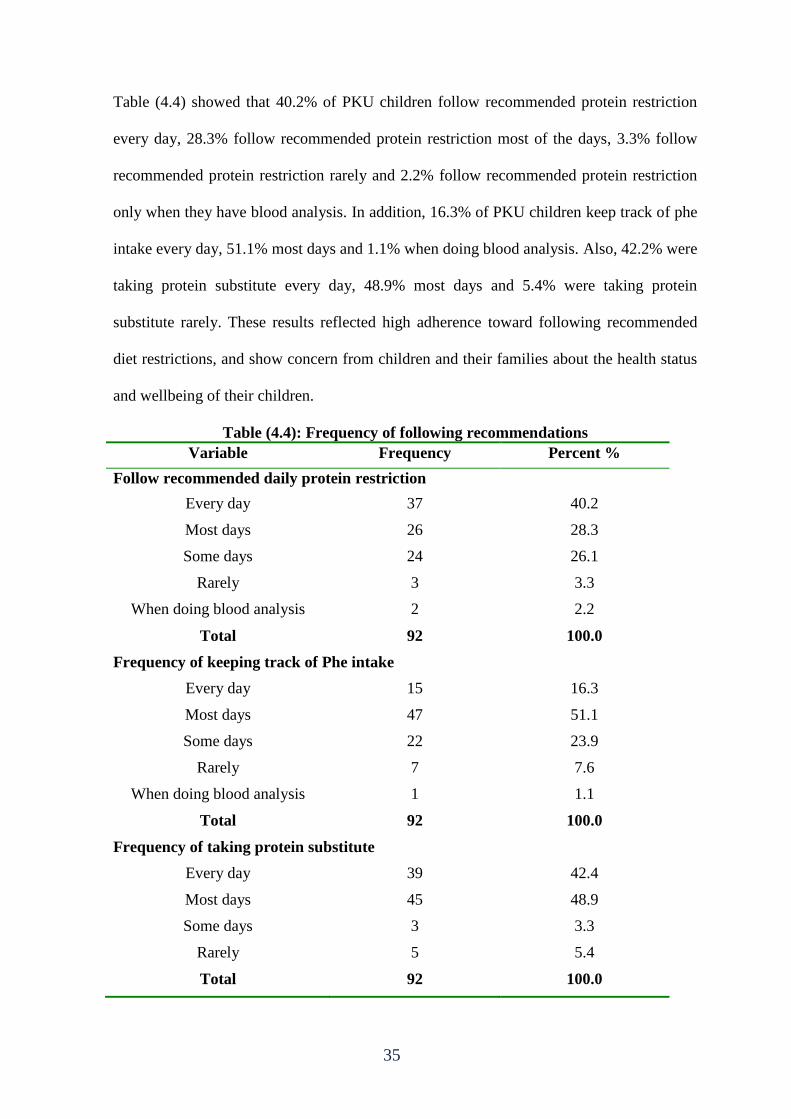
Table (4.4) showed that 40.2% of PKU children follow recommended protein restriction
every day, 28.3% follow recommended protein restriction most of the days, 3.3% follow
recommended protein restriction rarely and 2.2% follow recommended protein restriction
only when they have blood analysis. In addition, 16.3% of PKU children keep track of phe
intake every day, 51.1% most days and 1.1% when doing blood analysis. Also, 42.2% were
taking protein substitute every day, 48.9% most days and 5.4% were taking protein
substitute rarely. These results reflected high adherence toward following recommended
diet restrictions, and show concern from children and their families about the health status
and wellbeing of their children.
Table (4.4): Frequency of following recommendations
Variable Frequency Percent %
Follow recommended daily protein restriction
Every day 37 40.2
Most days 26 28.3
Some days 24 26.1
Rarely 3 3.3
When doing blood analysis 2 2.2
Total 92 100.0
Frequency of keeping track of Phe intake
Every day 15 16.3
Most days 47 51.1
Some days 22 23.9
Rarely 7 7.6
When doing blood analysis 1 1.1
Total 92 100.0
Frequency of taking protein substitute
Every day 39 42.4
Most days 45 48.9
Some days 3 3.3
Rarely 5 5.4
Total 92 100.0
36
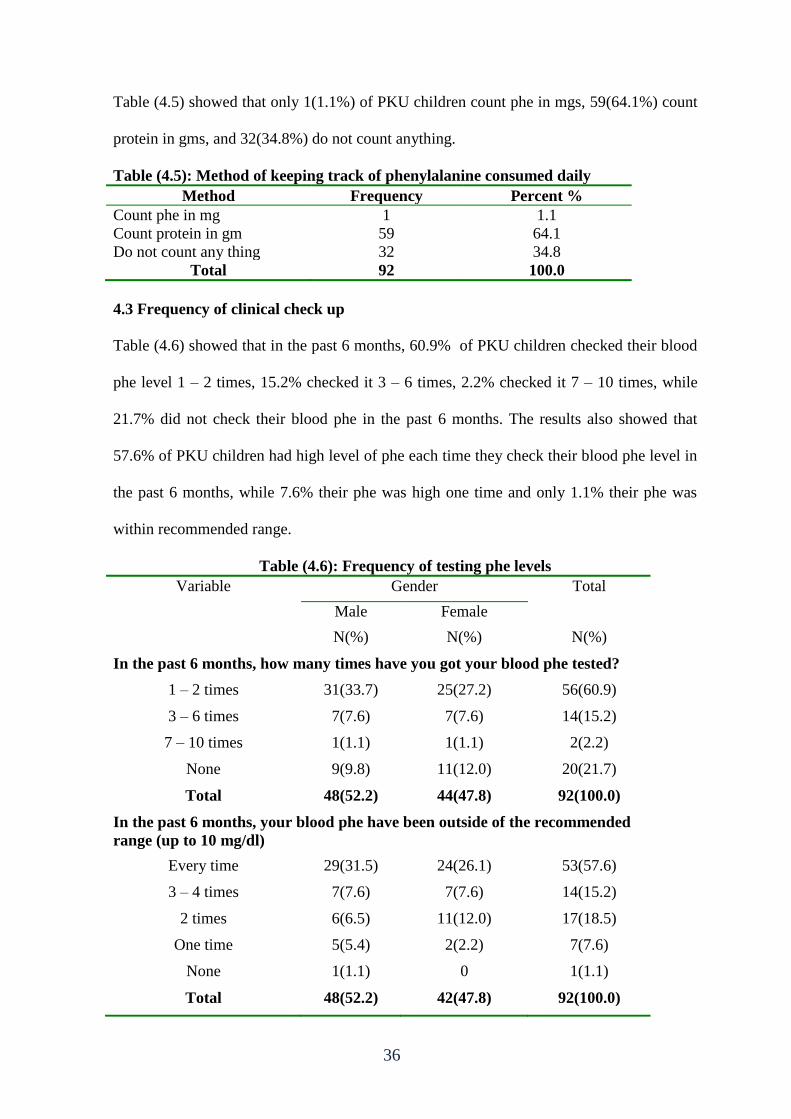
Table (4.5) showed that only 1(1.1%) of PKU children count phe in mgs, 59(64.1%) count
protein in gms, and 32(34.8%) do not count anything.
Table (4.5): Method of keeping track of phenylalanine consumed daily
Method Frequency Percent %
Count phe in mg 1 1.1
Count protein in gm 59 64.1
Do not count any thing 32 34.8
Total 92 100.0
4.3 Frequency of clinical check up
Table (4.6) showed that in the past 6 months, 60.9% of PKU children checked their blood
phe level 1 – 2 times, 15.2% checked it 3 – 6 times, 2.2% checked it 7 – 10 times, while
21.7% did not check their blood phe in the past 6 months. The results also showed that
57.6% of PKU children had high level of phe each time they check their blood phe level in
the past 6 months, while 7.6% their phe was high one time and only 1.1% their phe was
within recommended range.
Table (4.6): Frequency of testing phe levels
Variable Gender Total
Male Female
N(%) N(%) N(%)
In the past 6 months, how many times have you got your blood phe tested?
1 – 2 times 31(33.7) 25(27.2) 56(60.9)
3 – 6 times 7(7.6) 7(7.6) 14(15.2)
7 – 10 times 1(1.1) 1(1.1) 2(2.2)
None 9(9.8) 11(12.0) 20(21.7)
Total 48(52.2) 44(47.8) 92(100.0)
In the past 6 months, your blood phe have been outside of the recommended
range (up to 10 mg/dl)
Every time 29(31.5) 24(26.1) 53(57.6)
3 – 4 times 7(7.6) 7(7.6) 14(15.2)
2 times 6(6.5) 11(12.0) 17(18.5)
One time 5(5.4) 2(2.2) 7(7.6)
None 1(1.1) 0 1(1.1)
Total 48(52.2) 42(47.8) 92(100.0)
37
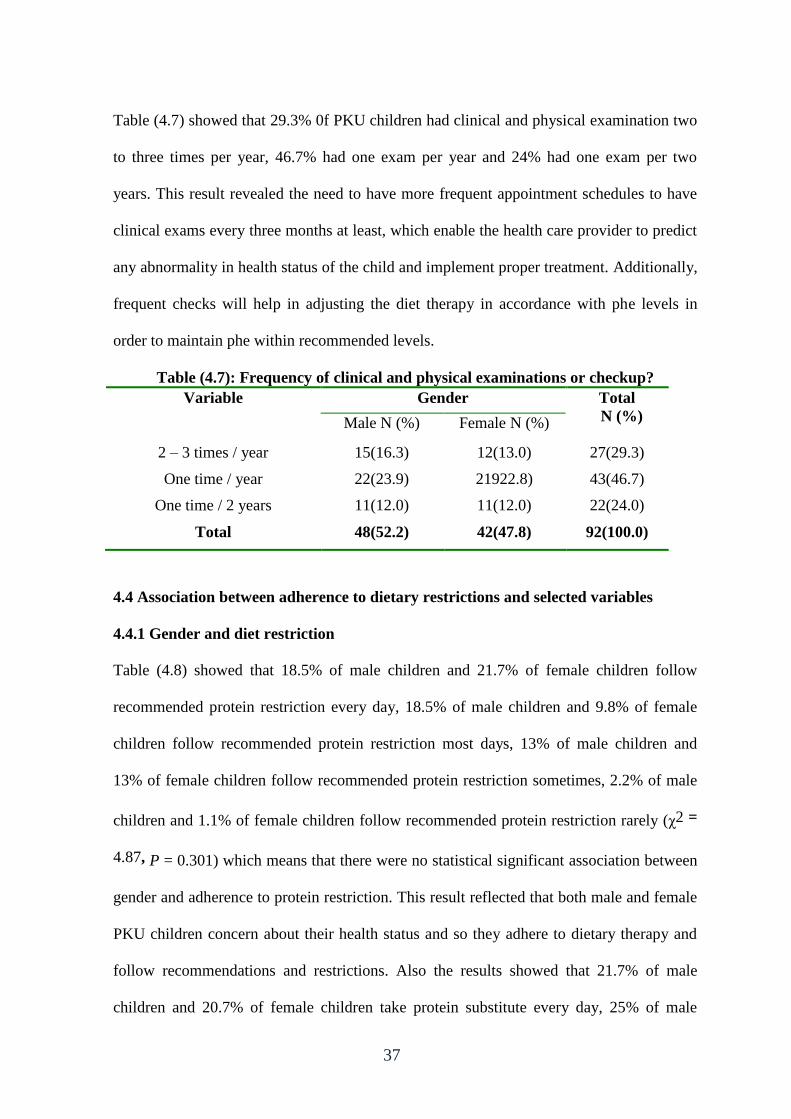
Table (4.7) showed that 29.3% 0f PKU children had clinical and physical examination two
to three times per year, 46.7% had one exam per year and 24% had one exam per two
years. This result revealed the need to have more frequent appointment schedules to have
clinical exams every three months at least, which enable the health care provider to predict
any abnormality in health status of the child and implement proper treatment. Additionally,
frequent checks will help in adjusting the diet therapy in accordance with phe levels in
order to maintain phe within recommended levels.
Table (4.7): Frequency of clinical and physical examinations or checkup?
Variable Gender Total
N (%) Male N (%) Female N (%)
2 – 3 times / year 15(16.3) 12(13.0) 27(29.3)
One time / year 22(23.9) 21922.8) 43(46.7)
One time / 2 years 11(12.0) 11(12.0) 22(24.0)
Total 48(52.2) 42(47.8) 92(100.0)
4.4 Association between adherence to dietary restrictions and selected variables
4.4.1 Gender and diet restriction
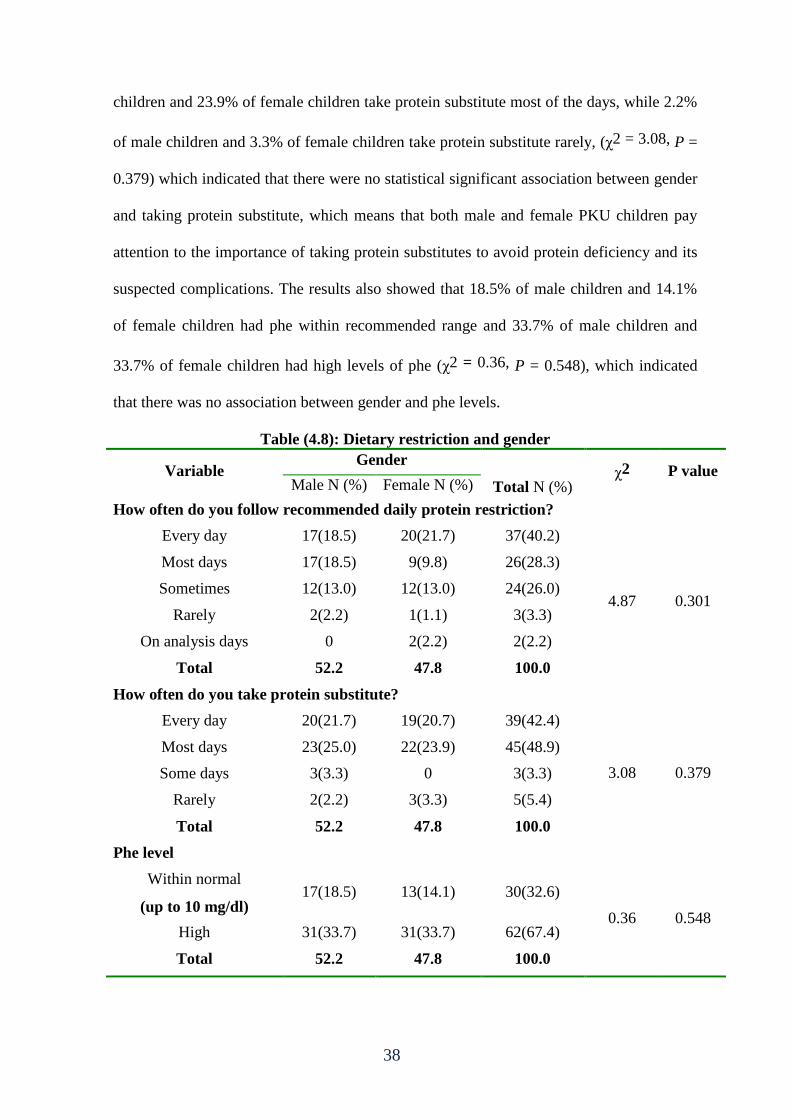
Table (4.8) showed that 18.5% of male children and 21.7% of female children follow
recommended protein restriction every day, 18.5% of male children and 9.8% of female
children follow recommended protein restriction most days, 13% of male children and
13% of female children follow recommended protein restriction sometimes, 2.2% of male
children and 1.1% of female children follow recommended protein restriction rarely (χ2 =
4.87, P = 0.301) which means that there were no statistical significant association between
gender and adherence to protein restriction. This result reflected that both male and female
PKU children concern about their health status and so they adhere to dietary therapy and
follow recommendations and restrictions. Also the results showed that 21.7% of male
children and 20.7% of female children take protein substitute every day, 25% of male
38
children and 23.9% of female children take protein substitute most of the days, while 2.2%
of male children and 3.3% of female children take protein substitute rarely, (χ2 = 3.08, P =
0.379) which indicated that there were no statistical significant association between gender
and taking protein substitute, which means that both male and female PKU children pay
attention to the importance of taking protein substitutes to avoid protein deficiency and its
suspected complications. The results also showed that 18.5% of male children and 14.1%
of female children had phe within recommended range and 33.7% of male children and
33.7% of female children had high levels of phe (χ2 = 0.36, P = 0.548), which indicated
that there was no association between gender and phe levels.
Table (4.8): Dietary restriction and gender
Variable Gender
Total N (%) χ2 P value
Male N (%) Female N (%)
How often do you follow recommended daily protein restriction?
Every day 17(18.5) 20(21.7) 37(40.2)
4.87 0.301
Most days 17(18.5) 9(9.8) 26(28.3)
Sometimes 12(13.0) 12(13.0) 24(26.0)
Rarely 2(2.2) 1(1.1) 3(3.3)
On analysis days 0 2(2.2) 2(2.2)
Total 52.2 47.8 100.0
How often do you take protein substitute?
Every day 20(21.7) 19(20.7) 39(42.4)
3.08 0.379
Most days 23(25.0) 22(23.9) 45(48.9)
Some days 3(3.3) 0 3(3.3)
Rarely 2(2.2) 3(3.3) 5(5.4)
Total 52.2 47.8 100.0
Phe level
Within normal
(up to 10 mg/dl)
recommended range (up
to 10 mg/dl)
17(18.5) 13(14.1) 30(32.6)
0.36 0.548 High
(above 10 mg/dl)
31(33.7) 31(33.7) 62(67.4)
Total 52.2 47.8 100.0
39
4.4.2 Level of education and diet restriction
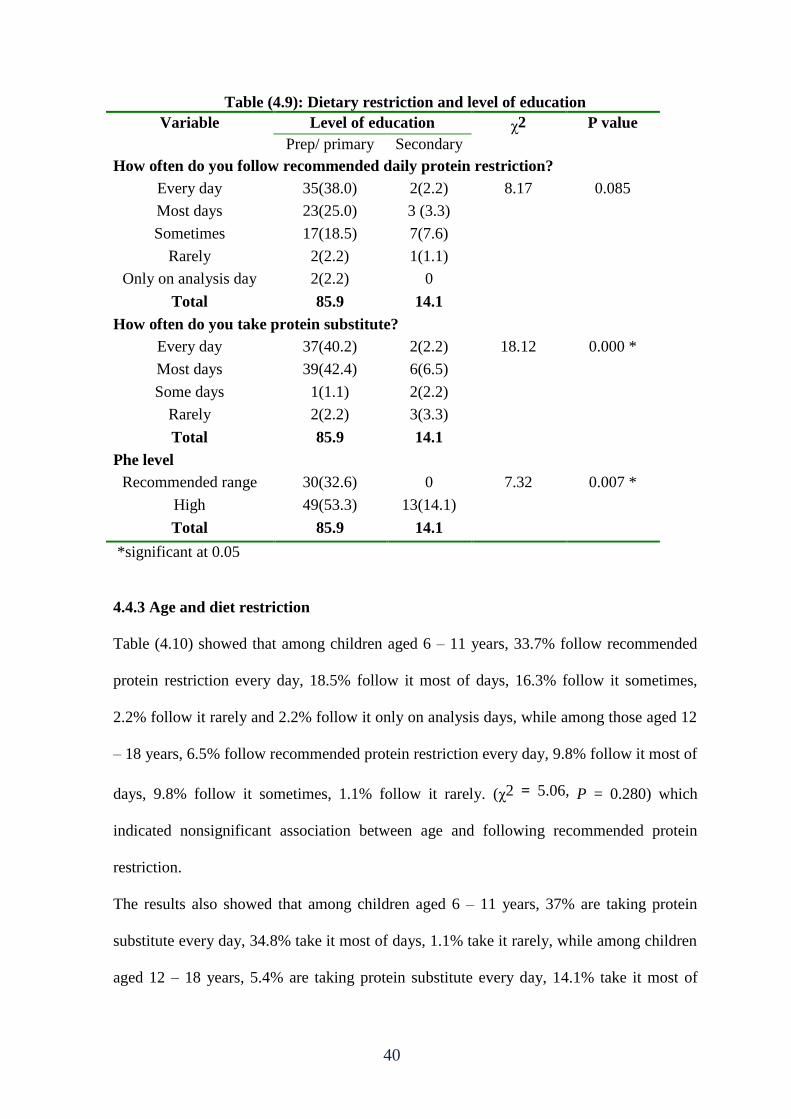
Table (4.9) showed that among children who are in prep school and primary school, 38%
follow recommended protein restriction every day, 25% follow it most days, 18.5% follow
it sometimes, while children who are in secondary school, 2.2% follow recommended
protein restriction every day, 3.3% follow it most days, 7.6% follow it sometimes, (χ2 =
8.17, P = 0.085) which indicated nonsignificant association between level of education and
following recommended daily protein restriction. Also the results showed that among
children who are in primary and prep school 40.2% take protein substitute every day,
42.2% take it most of days and 2.2% take it rarely, while among those who are in
secondary school 2.2% take protein substitute every day, 6.5% take it most of days and
3.3% take it rarely, (χ2 = 18.12, P = 0.000) which indicated statistically significant
association between level of education and taking protein substitute. In addition, the results
showed that 32.6% of children who are in primary and prep school have phe levels within
recommended range while no one from those in secondary school have normal phe level
(χ2 = 7.32, P = 0.007) which indicated statistically significant association between level of
education and phe level.
40
Table (4.9): Dietary restriction and level of education
Variable Level of education χ2 P value
Prep/ primary
N (%)
Secondary
N (%) How often do you follow recommended daily protein restriction?
Every day 35(38.0) 2(2.2) 8.17 0.085
Most days 23(25.0) 3 (3.3)
Sometimes 17(18.5) 7(7.6)
Rarely 2(2.2) 1(1.1)
Only on analysis day 2(2.2) 0
Total 85.9 14.1
How often do you take protein substitute?
Every day 37(40.2) 2(2.2) 18.12 0.000 *
Most days 39(42.4) 6(6.5)
Some days 1(1.1) 2(2.2)
Rarely 2(2.2) 3(3.3)
Total 85.9 14.1
Phe level
Recommended range
(up to 10 mg/dl)
30(32.6) 0 7.32 0.007 *
High
(above 10 mg/dl)
49(53.3) 13(14.1)
Total 85.9 14.1
*significant at 0.05
4.4.3 Age and diet restriction
Table (4.10) showed that among children aged 6 – 11 years, 33.7% follow recommended
protein restriction every day, 18.5% follow it most of days, 16.3% follow it sometimes,
2.2% follow it rarely and 2.2% follow it only on analysis days, while among those aged 12
– 18 years, 6.5% follow recommended protein restriction every day, 9.8% follow it most of
days, 9.8% follow it sometimes, 1.1% follow it rarely. (χ2 = 5.06, P = 0.280) which
indicated nonsignificant association between age and following recommended protein
restriction.
The results also showed that among children aged 6 – 11 years, 37% are taking protein
substitute every day, 34.8% take it most of days, 1.1% take it rarely, while among children
aged 12 – 18 years, 5.4% are taking protein substitute every day, 14.1% take it most of
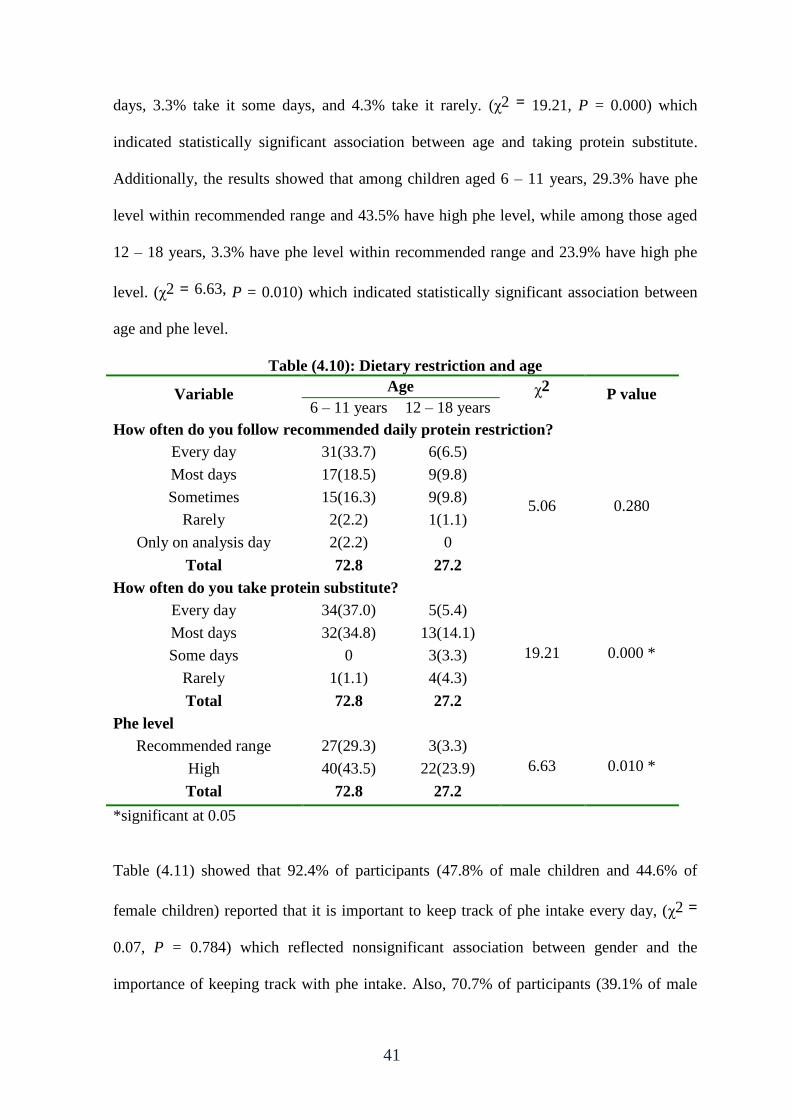
41
days, 3.3% take it some days, and 4.3% take it rarely. (χ2 = 19.21, P = 0.000) which
indicated statistically significant association between age and taking protein substitute.
Additionally, the results showed that among children aged 6 – 11 years, 29.3% have phe
level within recommended range and 43.5% have high phe level, while among those aged
12 – 18 years, 3.3% have phe level within recommended range and 23.9% have high phe
level. (χ2 = 6.63, P = 0.010) which indicated statistically significant association between
age and phe level.
Table (4.10): Dietary restriction and age
Variable Age χ2
N (%)
P value 6 – 11 years
N (%)
12 – 18 years
N (%) How often do you follow recommended daily protein restriction?
Every day 31(33.7) 6(6.5)
5.06 0.280
Most days 17(18.5) 9(9.8)
Sometimes 15(16.3) 9(9.8)
Rarely 2(2.2) 1(1.1)
Only on analysis day 2(2.2) 0
Total 72.8 27.2
How often do you take protein substitute?
Every day 34(37.0) 5(5.4)
19.21 0.000 *
Most days 32(34.8) 13(14.1)
Some days 0 3(3.3)
Rarely 1(1.1) 4(4.3)
Total 72.8 27.2
Phe level
Recommended range
(up to 10 mg/dl)
27(29.3) 3(3.3)
6.63 0.010 * High
(above 10 mg/dl)
40(43.5) 22(23.9)
Total 72.8 27.2
*significant at 0.05
Table (4.11) showed that 92.4% of participants (47.8% of male children and 44.6% of
female children) reported that it is important to keep track of phe intake every day, (χ2 =
0.07, P = 0.784) which reflected nonsignificant association between gender and the
importance of keeping track with phe intake. Also, 70.7% of participants (39.1% of male
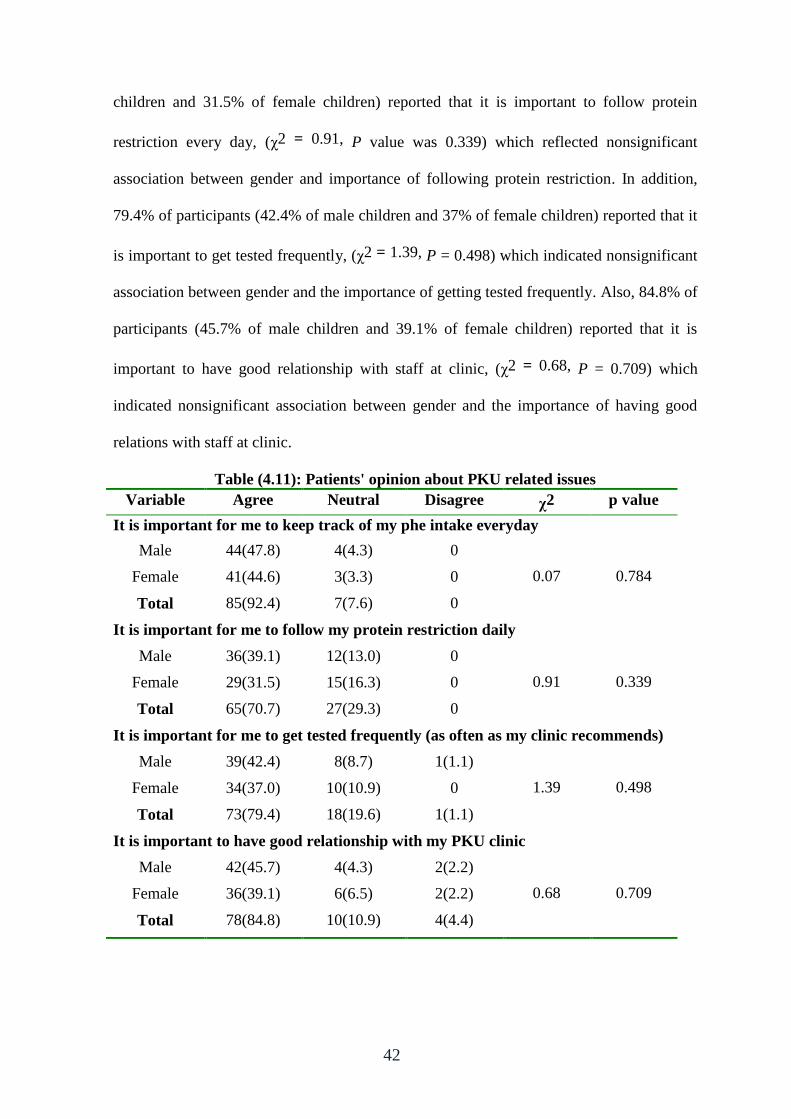
42
children and 31.5% of female children) reported that it is important to follow protein
restriction every day, (χ2 = 0.91, P value was 0.339) which reflected nonsignificant
association between gender and importance of following protein restriction. In addition,
79.4% of participants (42.4% of male children and 37% of female children) reported that it
is important to get tested frequently, (χ2 = 1.39, P = 0.498) which indicated nonsignificant
association between gender and the importance of getting tested frequently. Also, 84.8% of
participants (45.7% of male children and 39.1% of female children) reported that it is
important to have good relationship with staff at clinic, (χ2 = 0.68, P = 0.709) which
indicated nonsignificant association between gender and the importance of having good
relations with staff at clinic.
Table (4.11): Patients' opinion about PKU related issues
Variable Agree Neutral Disagree χ2 p value
It is important for me to keep track of my phe intake everyday
Male 44(47.8) 4(4.3) 0
0.07 0.784 Female 41(44.6) 3(3.3) 0
Total 85(92.4) 7(7.6) 0
It is important for me to follow my protein restriction daily
Male 36(39.1) 12(13.0) 0
0.91 0.339 Female 29(31.5) 15(16.3) 0
Total 65(70.7) 27(29.3) 0
It is important for me to get tested frequently (as often as my clinic recommends)
Male 39(42.4) 8(8.7) 1(1.1)
1.39 0.498 Female 34(37.0) 10(10.9) 0
Total 73(79.4) 18(19.6) 1(1.1)
It is important to have good relationship with my PKU clinic
Male 42(45.7) 4(4.3) 2(2.2)
0.68 0.709 Female 36(39.1) 6(6.5) 2(2.2)
Total 78(84.8) 10(10.9) 4(4.4)
43
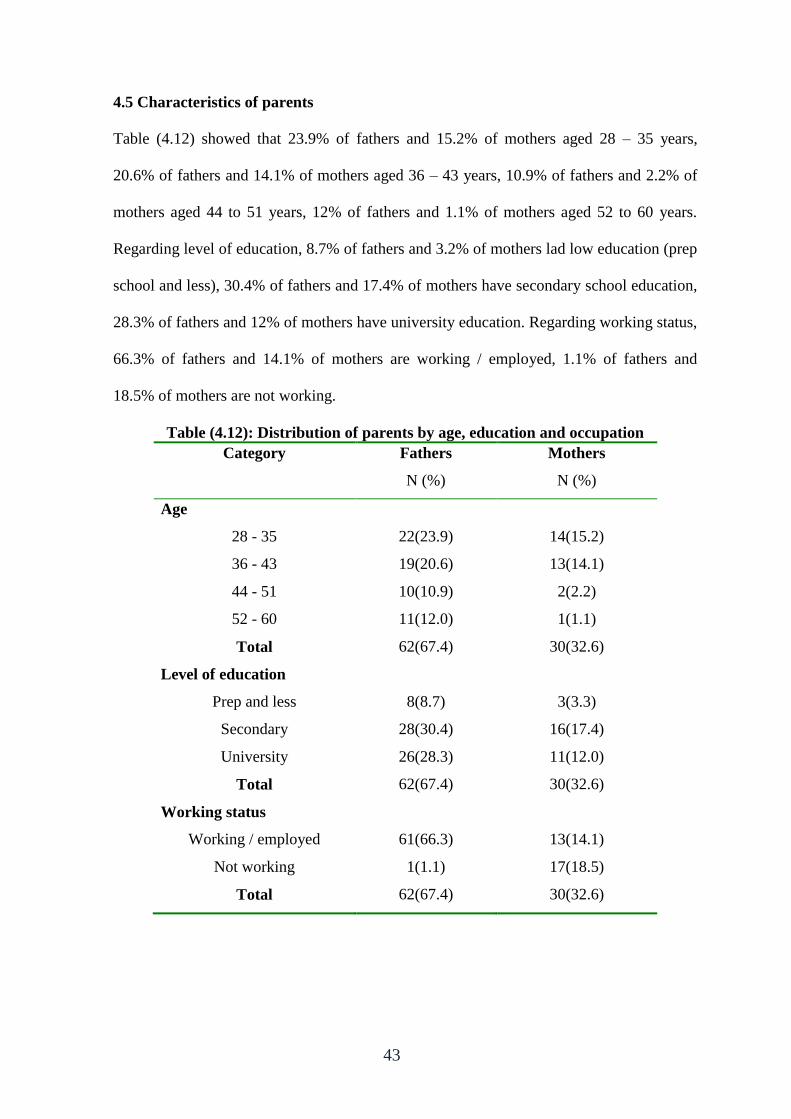
4.5 Characteristics of parents
Table (4.12) showed that 23.9% of fathers and 15.2% of mothers aged 28 – 35 years,
20.6% of fathers and 14.1% of mothers aged 36 – 43 years, 10.9% of fathers and 2.2% of
mothers aged 44 to 51 years, 12% of fathers and 1.1% of mothers aged 52 to 60 years.
Regarding level of education, 8.7% of fathers and 3.2% of mothers lad low education (prep
school and less), 30.4% of fathers and 17.4% of mothers have secondary school education,
28.3% of fathers and 12% of mothers have university education. Regarding working status,
66.3% of fathers and 14.1% of mothers are working / employed, 1.1% of fathers and
18.5% of mothers are not working.
Table (4.12): Distribution of parents by age, education and occupation
Category Fathers
N (%)
Mothers
N (%)
Age
28 - 35 22(23.9) 14(15.2)
36 - 43 19(20.6) 13(14.1)
44 - 51 10(10.9) 2(2.2)
52 - 60 11(12.0) 1(1.1)
Total 62(67.4) 30(32.6)
Level of education
Prep and less 8(8.7) 3(3.3)
Secondary 28(30.4) 16(17.4)
University 26(28.3) 11(12.0)
Total 62(67.4) 30(32.6)
Working status
Working / employed 61(66.3) 13(14.1)
Not working 1(1.1) 17(18.5)
Total 62(67.4) 30(32.6)
44
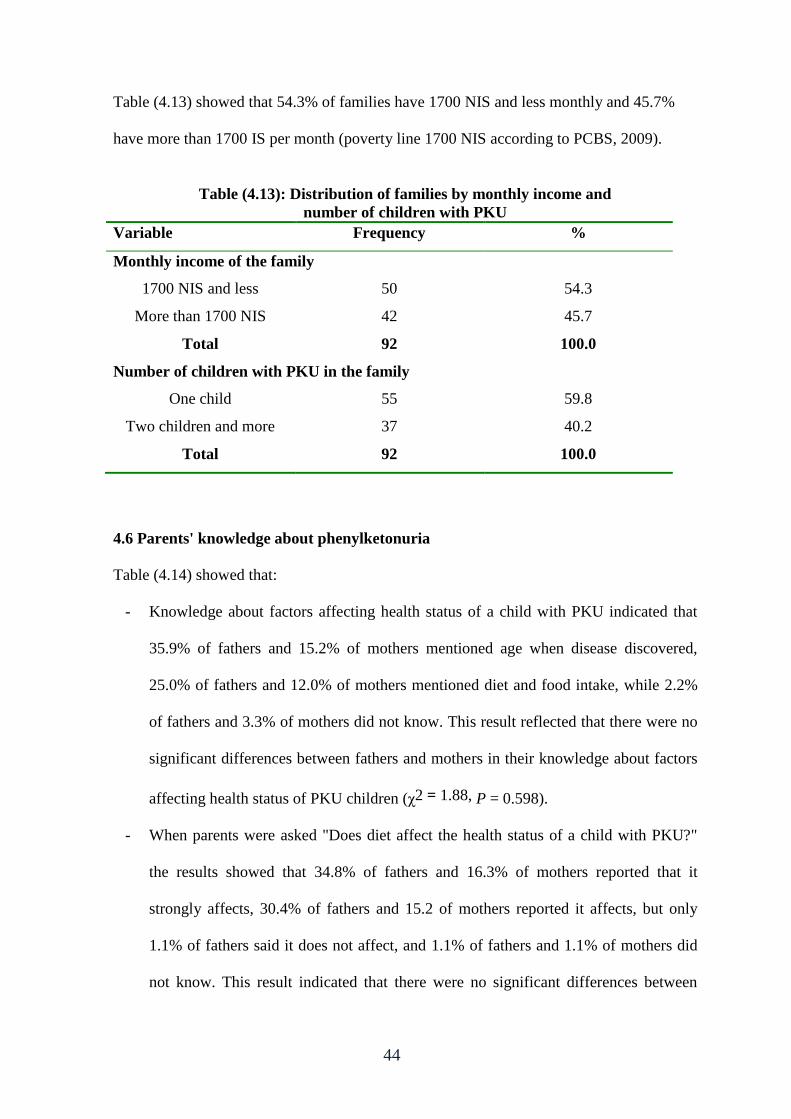
Table (4.13) showed that 54.3% of families have 1700 NIS and less monthly and 45.7%
have more than 1700 IS per month (poverty line 1700 NIS according to PCBS, 2009).
Table (4.13): Distribution of families by monthly income and
number of children with PKU
Variable Frequency %
Monthly income of the family
1700 NIS and less 50 54.3
More than 1700 NIS 42 45.7
Total 92 100.0
Number of children with PKU in the family
One child 55 59.8
Two children and more 37 40.2
Total 92 100.0
4.6 Parents' knowledge about phenylketonuria
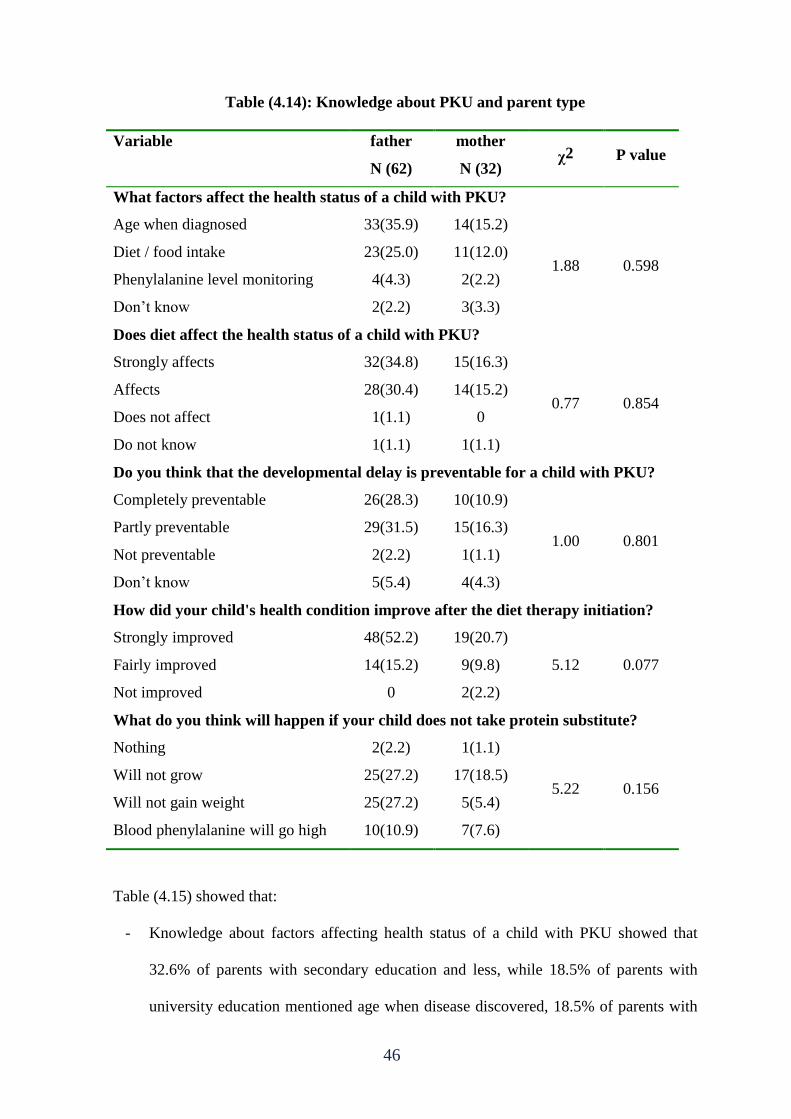
Table (4.14) showed that:
- Knowledge about factors affecting health status of a child with PKU indicated that
35.9% of fathers and 15.2% of mothers mentioned age when disease discovered,
25.0% of fathers and 12.0% of mothers mentioned diet and food intake, while 2.2%
of fathers and 3.3% of mothers did not know. This result reflected that there were no
significant differences between fathers and mothers in their knowledge about factors
affecting health status of PKU children (χ2 = 1.88, P = 0.598).
- When parents were asked "Does diet affect the health status of a child with PKU?"
the results showed that 34.8% of fathers and 16.3% of mothers reported that it
strongly affects, 30.4% of fathers and 15.2 of mothers reported it affects, but only
1.1% of fathers said it does not affect, and 1.1% of fathers and 1.1% of mothers did
not know. This result indicated that there were no significant differences between
45
fathers and mothers about the importance of diet for the health status of PKU
children (χ2 = 0.77, P = 0.854).
- The question "Do you think that developmental delay is preventable for PKU
children?" revealed that 28.3% of fathers and 10.9% of mothers said that
developmental delay is completely preventable, 31.5% of fathers and 16.3% of
mothers said it is partly preventable, but 2.2% of fathers and 1.1% of mothers said it
is not preventable and 5.4% of fathers and 4.3% of mothers do not know. This result
indicated that there were no significant differences between fathers and mothers
concerning their knowledge about prevention of developmental delays that may
occur among PKU children (χ2 = 1.0, P = 0.801).
- About improvement in health condition after initiation of diet therapy, 52.2% of
fathers and 20.7% of mothers reported that it improved strongly, 15.2% of fathers
and 9.8% of mothers said it improved fairly, while only 2.2% of mothers said it did
not improve. This result indicated that there were no significant differences between
fathers and mothers in their knowledge about the importance of diet therapy in
improving health status of PKU children (χ2 = 5.12, P = 0.077).
- Parents' responses about the question "What do you think will happen if your child
does not take protein substitute?", showed that only 2.2% of fathers and 1.1% of
mothers said that nothing will happen, 27.2% of fathers and 18.5% of mothers said
that the child will not grow, 27.2% of fathers and 5.4% of mothers said that the child
will not gain weight, and 10.9% of fathers and 7.6% of mothers said that blood phe
will be high. This result indicated that there were no significant differences between
fathers and mothers in their knowledge about the importance of protein substitute (χ2
= 5.22, P = 0.156).
46
Table (4.14): Knowledge about PKU and parent type
Variable father
N (62)
mother
N (32) χ2 P value
What factors affect the health status of a child with PKU?
Age when diagnosed 33(35.9) 14(15.2)
1.88 0.598 Diet / food intake 23(25.0) 11(12.0)
Phenylalanine level monitoring 4(4.3) 2(2.2)
Don’t know 2(2.2) 3(3.3)
Does diet affect the health status of a child with PKU?
Strongly affects 32(34.8) 15(16.3)
0.77 0.854 Affects 28(30.4) 14(15.2)
Does not affect 1(1.1) 0
Do not know 1(1.1) 1(1.1)
Do you think that the developmental delay is preventable for a child with PKU?
Completely preventable 26(28.3) 10(10.9)
1.00 0.801 Partly preventable 29(31.5) 15(16.3)
Not preventable 2(2.2) 1(1.1)
Don’t know 5(5.4) 4(4.3)
How did your child's health condition improve after the diet therapy initiation?
Strongly improved 48(52.2) 19(20.7)
5.12 0.077 Fairly improved 14(15.2) 9(9.8)
Not improved 0 2(2.2)
What do you think will happen if your child does not take protein substitute?
Nothing 2(2.2) 1(1.1)
5.22 0.156 Will not grow 25(27.2) 17(18.5)
Will not gain weight 25(27.2) 5(5.4)
Blood phenylalanine will go high 10(10.9) 7(7.6)
Table (4.15) showed that:
- Knowledge about factors affecting health status of a child with PKU showed that
32.6% of parents with secondary education and less, while 18.5% of parents with
university education mentioned age when disease discovered, 18.5% of parents with
47
secondary education and less, 18.5%% of parents with university education
mentioned diet and food intake, 3.3% of parents with secondary education and 3.3%
of parents with university education mentioned phenylalanine level monitoring, while
5.4% of parents with secondary education and less did not know. This result reflected
that there were no significant differences between parents with low education
(secondary and less) and parents with university education in their knowledge about
factors affecting health status of PKU children (χ2 = 5.27, P = 0.153).
- When parents were asked about the effect of diet on the health status of a child with
PKU, 21.7% of parents with secondary education and less, and 29.3% of parents with
university education said it is strongly affect, 34.8% of parents with secondary
education and less, 10.9%% of parents with university education said it affects, 1.1%
of parents with secondary education said it does not affect, while 2.2% of parents
with secondary education and less did not know. This result revealed that there were
statistically significant association between parents' level of education and
knowledge about the effect of diet on health status of PKU children (χ2 = 12.52, P =
0.006).
- The question "Do you think that developmental delay is preventable for PKU
children?" indicated that 12.0% of parents with secondary education or less and
27.2% of parents with university education said that developmental delay is
completely preventable, 35.9% of parents with secondary education or less and
12.0% of parents with university education said it is partly preventable, but 2.2% of
parents with secondary education or less and 1.1% of parents with university
education said it is not preventable and 9.8% of parents with secondary education or
less do not know. This result indicated that there were statistically significant
association between parents' level of education and their knowledge about prevention
48
of developmental delays that may occur among PKU children (χ2 = 23.14, P =
0.000).
- About improvement in health condition after initiation of diet therapy, 38.0% of
parents with secondary education or less and 34.8% of parents with university
education said that it improved strongly, 19.6% of parents with secondary education
or less and 5.4% of parents with university education said it improved fairly, while
only 2.2% of parents with secondary education or less said it did not improve. This
result indicated that there were statistically significant association between parents'
level of education and knowledge about the importance of diet therapy in improving
health status of PKU children (χ2 = 6.19, P = 0.045).
- Parents' responses about the question "What do you think will happen if your child
does not take protein substitute?", showed that only 2.2% of parents with secondary
education or less and 1.1% of parents with university education said that nothing will
happen, 25.0% of parents with secondary education or less and 20.7% of parents with
university education said that the child will not grow, 19.6% of parents with
secondary education or less and 13.0% of parents with university education said that
the child will not gain weight, and 13.0% of parents with secondary education and
5.4% of parents with university education said that blood phe will be high. This result
indicated that there were no significant association between parents' level of
education and knowledge about the importance of protein substitute (χ2 = 1.32, P =
0.723).
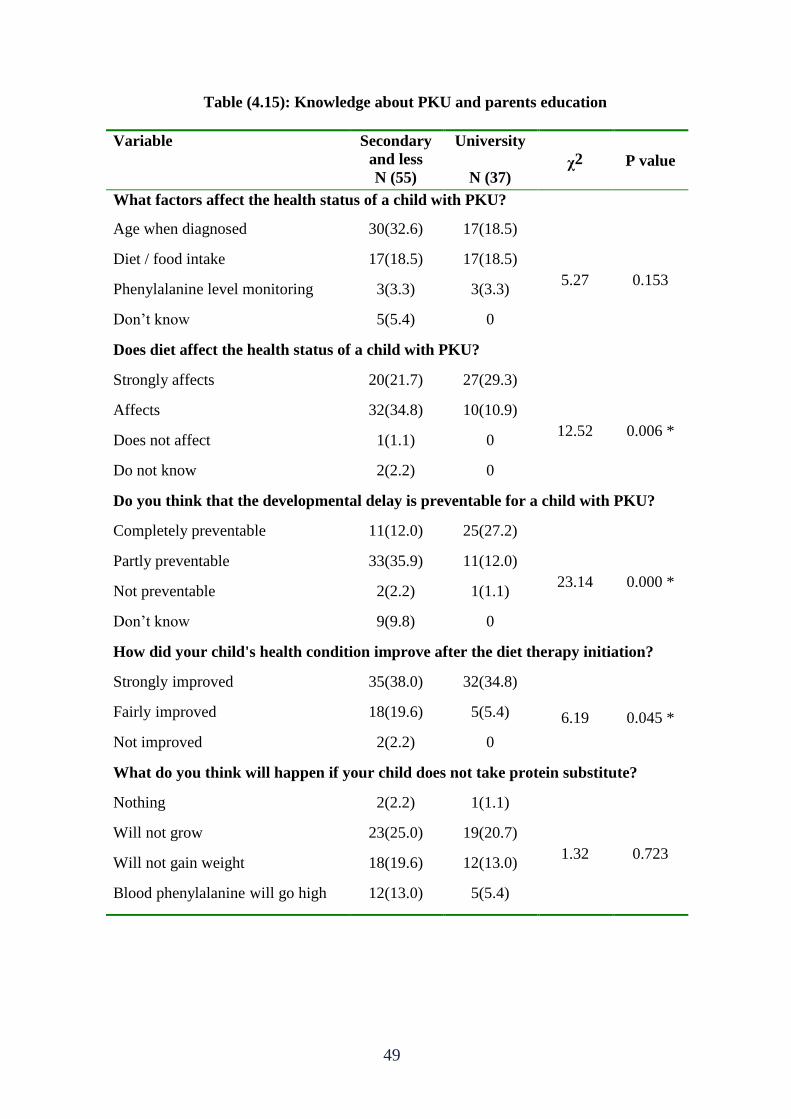
49
Table (4.15): Knowledge about PKU and parents education
Variable Secondary
and less
N (55)
University
N (37) χ2 P value
What factors affect the health status of a child with PKU?
Age when diagnosed 30(32.6) 17(18.5)
5.27 0.153
Diet / food intake 17(18.5) 17(18.5)
Phenylalanine level monitoring 3(3.3) 3(3.3)
Don’t know 5(5.4) 0
Does diet affect the health status of a child with PKU?
Strongly affects 20(21.7) 27(29.3)
12.52 0.006 *
Affects 32(34.8) 10(10.9)
Does not affect 1(1.1) 0
Do not know 2(2.2) 0
Do you think that the developmental delay is preventable for a child with PKU?
Completely preventable 11(12.0) 25(27.2)
23.14 0.000 *
Partly preventable 33(35.9) 11(12.0)
Not preventable 2(2.2) 1(1.1)
Don’t know 9(9.8) 0
How did your child's health condition improve after the diet therapy initiation?
Strongly improved 35(38.0) 32(34.8)
6.19 0.045 * Fairly improved 18(19.6) 5(5.4)
Not improved 2(2.2) 0
What do you think will happen if your child does not take protein substitute?
Nothing 2(2.2) 1(1.1)
1.32 0.723
Will not grow 23(25.0) 19(20.7)
Will not gain weight 18(19.6) 12(13.0)
Blood phenylalanine will go high 12(13.0) 5(5.4)
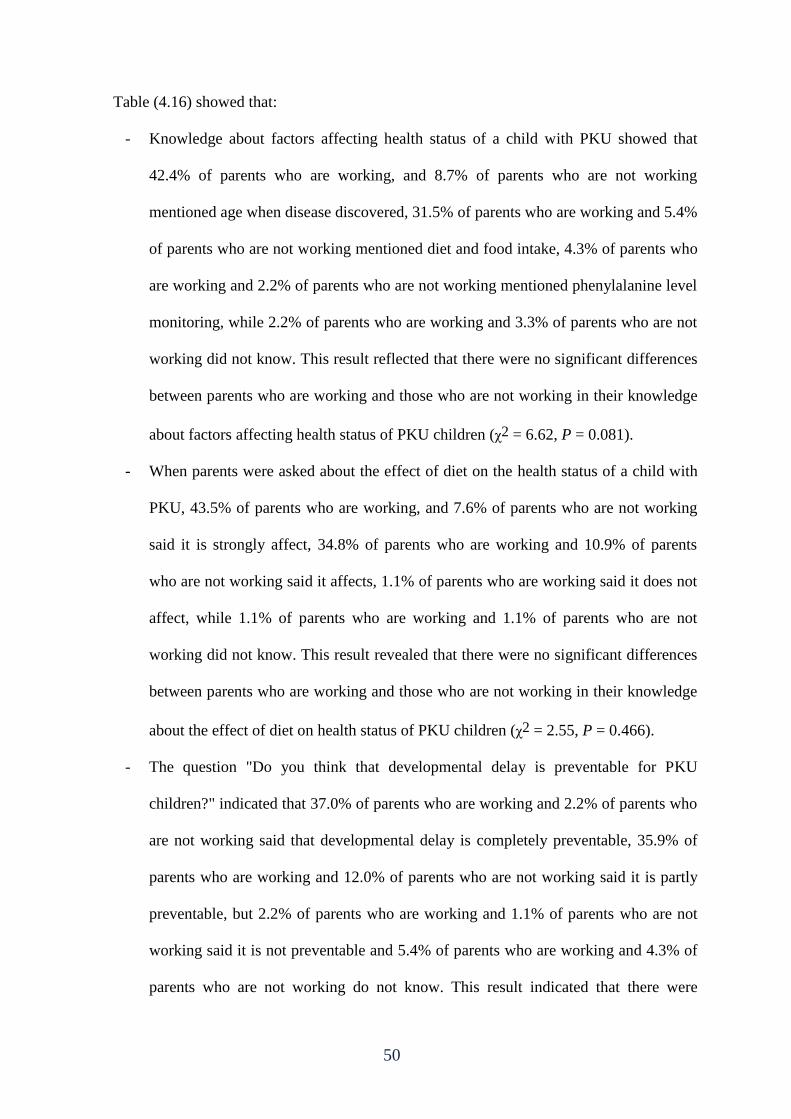
50
Table (4.16) showed that:
- Knowledge about factors affecting health status of a child with PKU showed that
42.4% of parents who are working, and 8.7% of parents who are not working
mentioned age when disease discovered, 31.5% of parents who are working and 5.4%
of parents who are not working mentioned diet and food intake, 4.3% of parents who
are working and 2.2% of parents who are not working mentioned phenylalanine level
monitoring, while 2.2% of parents who are working and 3.3% of parents who are not
working did not know. This result reflected that there were no significant differences
between parents who are working and those who are not working in their knowledge
about factors affecting health status of PKU children (χ2 = 6.62, P = 0.081).
- When parents were asked about the effect of diet on the health status of a child with
PKU, 43.5% of parents who are working, and 7.6% of parents who are not working
said it is strongly affect, 34.8% of parents who are working and 10.9% of parents
who are not working said it affects, 1.1% of parents who are working said it does not
affect, while 1.1% of parents who are working and 1.1% of parents who are not
working did not know. This result revealed that there were no significant differences
between parents who are working and those who are not working in their knowledge
about the effect of diet on health status of PKU children (χ2 = 2.55, P = 0.466).
- The question "Do you think that developmental delay is preventable for PKU
children?" indicated that 37.0% of parents who are working and 2.2% of parents who
are not working said that developmental delay is completely preventable, 35.9% of
parents who are working and 12.0% of parents who are not working said it is partly
preventable, but 2.2% of parents who are working and 1.1% of parents who are not
working said it is not preventable and 5.4% of parents who are working and 4.3% of
parents who are not working do not know. This result indicated that there were
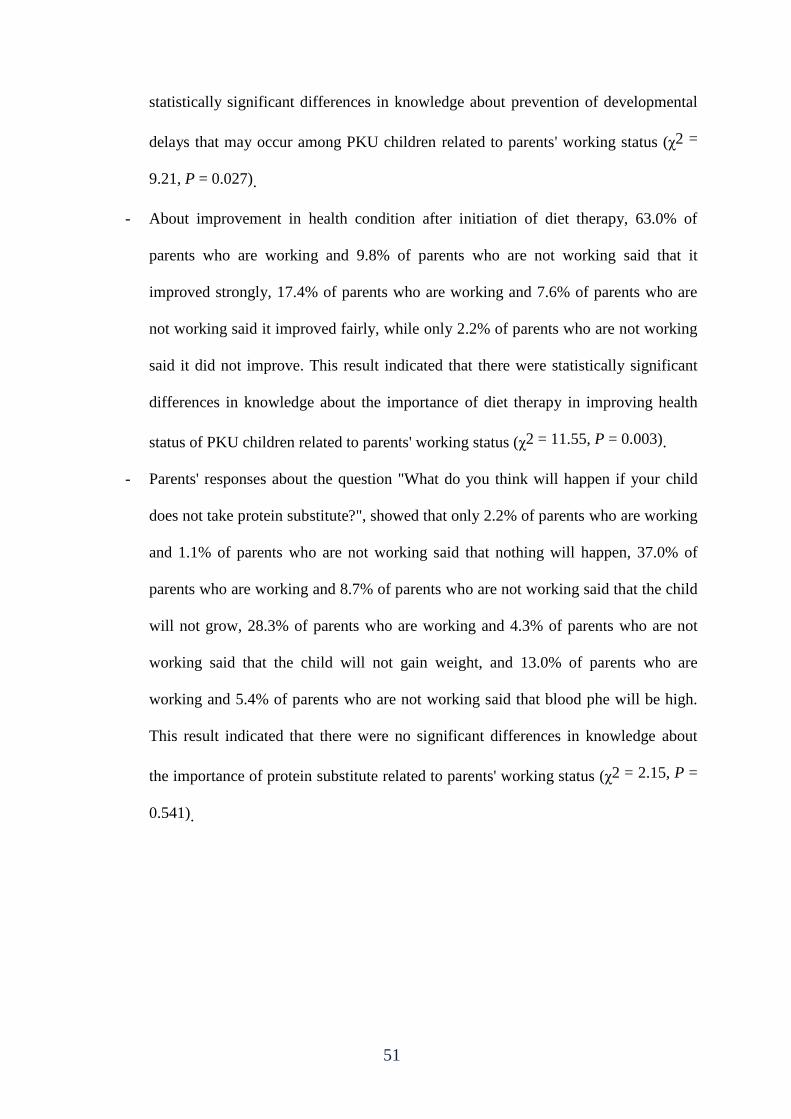
51
statistically significant differences in knowledge about prevention of developmental
delays that may occur among PKU children related to parents' working status (χ2 =
9.21, P = 0.027).
- About improvement in health condition after initiation of diet therapy, 63.0% of
parents who are working and 9.8% of parents who are not working said that it
improved strongly, 17.4% of parents who are working and 7.6% of parents who are
not working said it improved fairly, while only 2.2% of parents who are not working
said it did not improve. This result indicated that there were statistically significant
differences in knowledge about the importance of diet therapy in improving health
status of PKU children related to parents' working status (χ2 = 11.55, P = 0.003).
- Parents' responses about the question "What do you think will happen if your child
does not take protein substitute?", showed that only 2.2% of parents who are working
and 1.1% of parents who are not working said that nothing will happen, 37.0% of
parents who are working and 8.7% of parents who are not working said that the child
will not grow, 28.3% of parents who are working and 4.3% of parents who are not
working said that the child will not gain weight, and 13.0% of parents who are
working and 5.4% of parents who are not working said that blood phe will be high.
This result indicated that there were no significant differences in knowledge about
the importance of protein substitute related to parents' working status (χ2 = 2.15, P =
0.541).
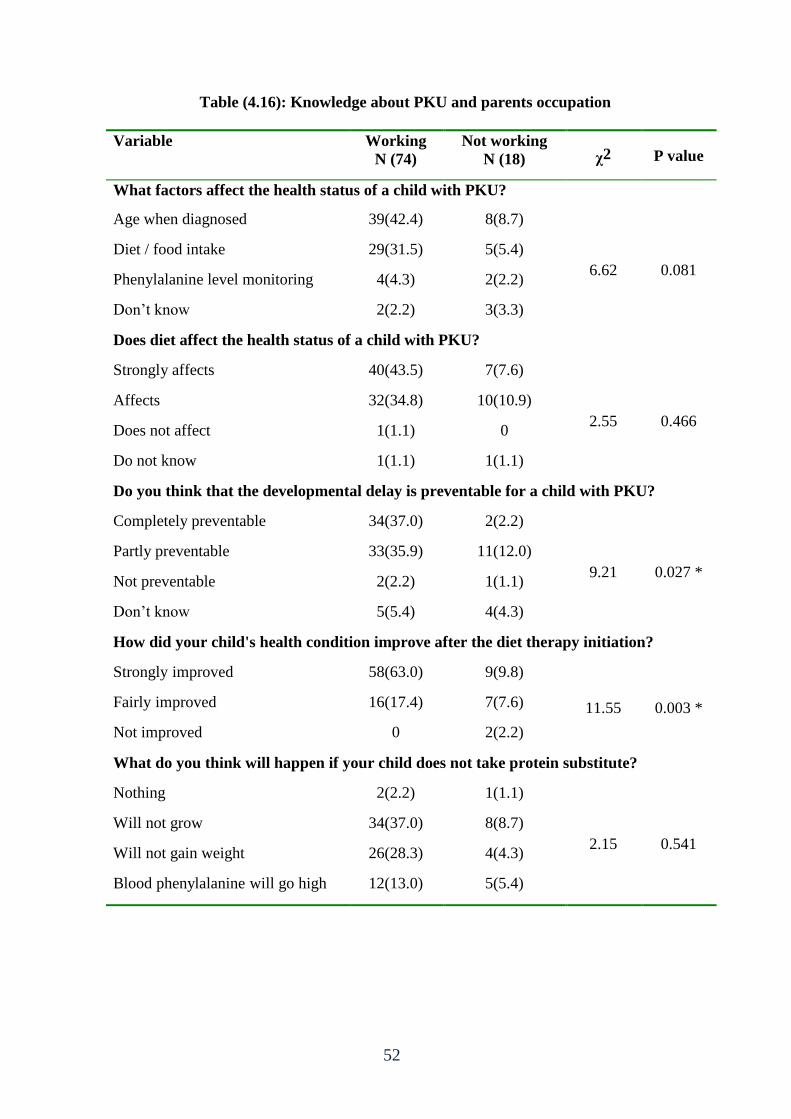
52
Table (4.16): Knowledge about PKU and parents occupation
Variable Working
N (74)
Not working
N (18) χ2 P value
What factors affect the health status of a child with PKU?
Age when diagnosed 39(42.4) 8(8.7)
6.62 0.081
Diet / food intake 29(31.5) 5(5.4)
Phenylalanine level monitoring 4(4.3) 2(2.2)
Don’t know 2(2.2) 3(3.3)
Does diet affect the health status of a child with PKU?
Strongly affects 40(43.5) 7(7.6)
2.55 0.466
Affects 32(34.8) 10(10.9)
Does not affect 1(1.1) 0
Do not know 1(1.1) 1(1.1)
Do you think that the developmental delay is preventable for a child with PKU?
Completely preventable 34(37.0) 2(2.2)
9.21 0.027 *
Partly preventable 33(35.9) 11(12.0)
Not preventable 2(2.2) 1(1.1)
Don’t know 5(5.4) 4(4.3)
How did your child's health condition improve after the diet therapy initiation?
Strongly improved 58(63.0) 9(9.8)
11.55 0.003 * Fairly improved 16(17.4) 7(7.6)
Not improved 0 2(2.2)
What do you think will happen if your child does not take protein substitute?
Nothing 2(2.2) 1(1.1)
2.15 0.541
Will not grow 34(37.0) 8(8.7)
Will not gain weight 26(28.3) 4(4.3)
Blood phenylalanine will go high 12(13.0) 5(5.4)
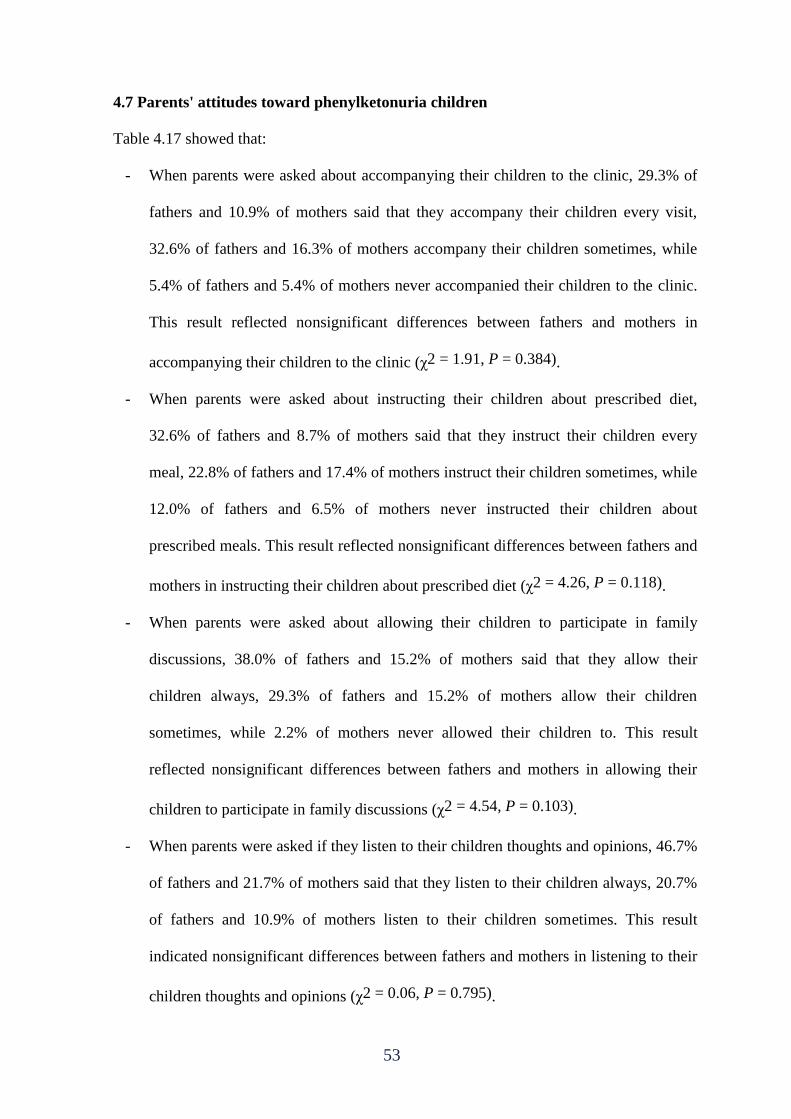
53
4.7 Parents' attitudes toward phenylketonuria children
Table 4.17 showed that:
- When parents were asked about accompanying their children to the clinic, 29.3% of
fathers and 10.9% of mothers said that they accompany their children every visit,
32.6% of fathers and 16.3% of mothers accompany their children sometimes, while
5.4% of fathers and 5.4% of mothers never accompanied their children to the clinic.
This result reflected nonsignificant differences between fathers and mothers in
accompanying their children to the clinic (χ2 = 1.91, P = 0.384).
- When parents were asked about instructing their children about prescribed diet,
32.6% of fathers and 8.7% of mothers said that they instruct their children every
meal, 22.8% of fathers and 17.4% of mothers instruct their children sometimes, while
12.0% of fathers and 6.5% of mothers never instructed their children about
prescribed meals. This result reflected nonsignificant differences between fathers and
mothers in instructing their children about prescribed diet (χ2 = 4.26, P = 0.118).
- When parents were asked about allowing their children to participate in family
discussions, 38.0% of fathers and 15.2% of mothers said that they allow their
children always, 29.3% of fathers and 15.2% of mothers allow their children
sometimes, while 2.2% of mothers never allowed their children to. This result
reflected nonsignificant differences between fathers and mothers in allowing their
children to participate in family discussions (χ2 = 4.54, P = 0.103).
- When parents were asked if they listen to their children thoughts and opinions, 46.7%
of fathers and 21.7% of mothers said that they listen to their children always, 20.7%
of fathers and 10.9% of mothers listen to their children sometimes. This result
indicated nonsignificant differences between fathers and mothers in listening to their
children thoughts and opinions (χ2 = 0.06, P = 0.795).
54
- When parents were asked about allowing their children to accompany their parents
during visits to friends or relatives, 23.9% of fathers and 13.0% of mothers said that
they allow their children always, 40.2% of fathers and 15.2% of mothers allow their
children sometimes, while 3.3% of fathers and 4.3% of mothers never allowed their
children to visit friends or relatives. This result indicated nonsignificant differences
between fathers and mothers in allowing their children to accompany them during
visits to friends or relatives (χ2 = 2.64, P = 0.266).
- When parents were asked about helping their children in doing school homework,
20.7% of fathers and 14.1% of mothers said that they help their children always,
35.9% of fathers and 14.1% of mothers help their children sometimes, and 10.9% of
fathers and 4.3 of mothers never helped their children. This result revealed
nonsignificant differences between fathers and mothers in helping their children
doing school homework (χ2 = 1.43, P = 0.488).
- When parents were asked if they think that their children live normal life like other
children, 27.2% of fathers and 17.4% of mothers said yes, 39.1% of fathers and
14.1% of mothers said somehow, while 1.1% of fathers and 1.1% of mothers said no.
This result indicated nonsignificant differences between fathers and mothers in
thinking about the quality of their children life (χ2 = 1.86, P = 0.393).
- When parents were asked if they think that their children will be effective and
productive in the future, 65.2% of fathers and 28.3% of mothers said yes, 2.2% of
fathers and 4.3% of mothers said no. This result reflected nonsignificant differences
between fathers and mothers in their thoughts about the future of their children life
(χ2 = 3.38, P = 0.066).
55
Table (4.17): Attitudes about PKU and parents' gender
Variable father
N (62)
mother
N (30) χ2 P value
Do you accompany your child to the clinic?
Yes, every visit 27(29.3) 10(10.9)
1.91 0.384 Sometimes 30(32.6) 15(16.3)
Never 5(5.4) 5(5.4)
Do you instruct your child to have the prescribed diet?
Yes, every meal 30(32.6) 8(8.7)
4.26 0.118 Sometimes 21(22.8) 16(17.4)
Never 11(12.0) 6(6.5)
Do you allow your child to participate in the discussions inside the family?
Always 35(38.0) 14(15.2)
4.54 0.103 Sometimes 27(29.3) 14(15.2)
Never 0 2(2.2)
Do you listen to your child's thoughts and opinions?
Always 43(46.7) 20(21.7)
0.06 0.795 Sometimes 19(20.7) 10(10.9)
Never 0 0
Do you let your child accompany you during your visits to relatives and friends?
Always 22(23.9) 12(13.0)
2.64 0.266 Sometimes 37(40.2) 14(15.2)
Never 3(3.3) 4(4.3)
Do you help your child in doing school homework?
Always 19(20.7) 13(14.1)
1.43 0.488 Sometimes 33(35.9) 13(14.1)
Never 10(10.9) 4(4.3)
Do you think that your child lives normal life like other children?
Yes 25(27.2) 16(17.4)
1.86 0.393 Somehow 36(39.1) 13(14.1)
No 1(1.1) 1(1.1)
Do you think that your child will be effective and productive in the future?
Yes 60(65.2) 26(28.3)
3.38 0.066 Somehow 0 0
No 2(2.2) 4(4.3)
56
Table 4.18 showed that:
- When parents were asked about accompanying their children to the clinic, 20.7% of
parents with secondary school education or less and 19.6% of parents with university
education said that they accompany their children every visit, 29.3% of parents with
secondary school education or less and 19.6% of parents with university education
accompany their children sometimes, while 9.8% of parents with secondary school
education or less and 1.1% of parents with university education never accompanied
their children to the clinic. This result indicated insignificant differences between
parents with low education (secondary or less) and those with university education in
accompanying their children to the clinic (χ2 = 4.89, P = 0.087).
- When parents were asked if they instruct their children to have the prescribed diet,
16.3% of parents with secondary school education or less and 25.0% of parents with
university education said that they instruct their children every meal, 27.2% of
parents with secondary school education or less and 13.0% of parents with university
education said sometimes, and 16.3% of parents with secondary school education or
less and 2.2% of parents with university education said never. This result revealed
statistically significant differences between parents with low education (secondary or
less) and those with university education in instructing their children to have the
prescribed diet (χ2 = 13.17, P = 0.001).
- When parents were asked if they allow their children to participate in family
discussions, 26.1% of parents with secondary school education or less and 27.2% of
parents with university education said that they allow their children to participate
always, 31.5% of parents with secondary school education or less and 13.0% of
parents with university education said sometimes, and 2.2% of parents with
secondary school education or less said never. This result revealed statistically
57
insignificant differences between parents with low education (secondary or less) and
those with university education in allowing their children to participate in family
discussions (χ2 = 5.76, P = 0.056).
- When parents were asked if they listen to their children thoughts and opinions, 34.8%
of parents with secondary school education or less and 33.7% of parents with
university education said that they listen to their children always, 25.0% of parents
with secondary school education or less and 6.5% of parents with university
education said sometimes. This result revealed statistically significant differences
between parents with low education (secondary or less) and those with university
education in listening to their children thoughts and opinions (χ2 = 6.71, P = 0.010).
- When parents were asked if they let their children to accompany them during visits to
friends or relatives, 18.5% of parents with secondary school education or less and
18.5% of parents with university education said that they let their children
accompany them always, 34.8% of parents with secondary school education or less
and 20.7% of parents with university education said sometimes, and 6.5% of parents
with secondary school education or less and 1.1% of parents with university
education said never. This result revealed statistically insignificant differences
between parents with low education (secondary or less) and those with university
education in allowing their children to accompany them during visits to friends and
relatives (χ2 = 3.49, P = 0.174).
- When parents were asked if they help their children in doing school homework,
13.0% of parents with secondary school education or less and 21.7% of parents with
university education said that they help their children always, 32.6% of parents with
secondary school education or less and 17.4% of parents with university education
said sometimes, and 14.1% of parents with secondary school education or less and
58
1.1% of parents with university education said never. This result revealed statistically
significant differences between parents with low education (secondary or less) and
those with university education in helping their children in school homework (χ2 =
13.54, P = 0.001).
- When parents were asked if they think that their children live normal life like others,
26.1% of parents with secondary school education or less and 18.5% of parents with
university education said yes, 31.5% of parents with secondary school education or
less and 21.7% of parents with university education said sometimes, and 2.2% of
parents with secondary school education or less said never. This result revealed
statistically insignificant differences between parents with low education (secondary
or less) and those with university education about the normality of their children life
(χ2 = 1.37, P = 0.502).
- When parents were asked if they think that their children will be effective and
productive in the future, 53.3% of parents with secondary school education or less
and 40.2% of parents with university education said yes, 6.5% of parents with
secondary school education or less said no. This result indicated statistically
significant differences between parents with low education (secondary or less) and
those with university education in their thoughts about the future of their children (χ2
= 4.31, P = 0.038).
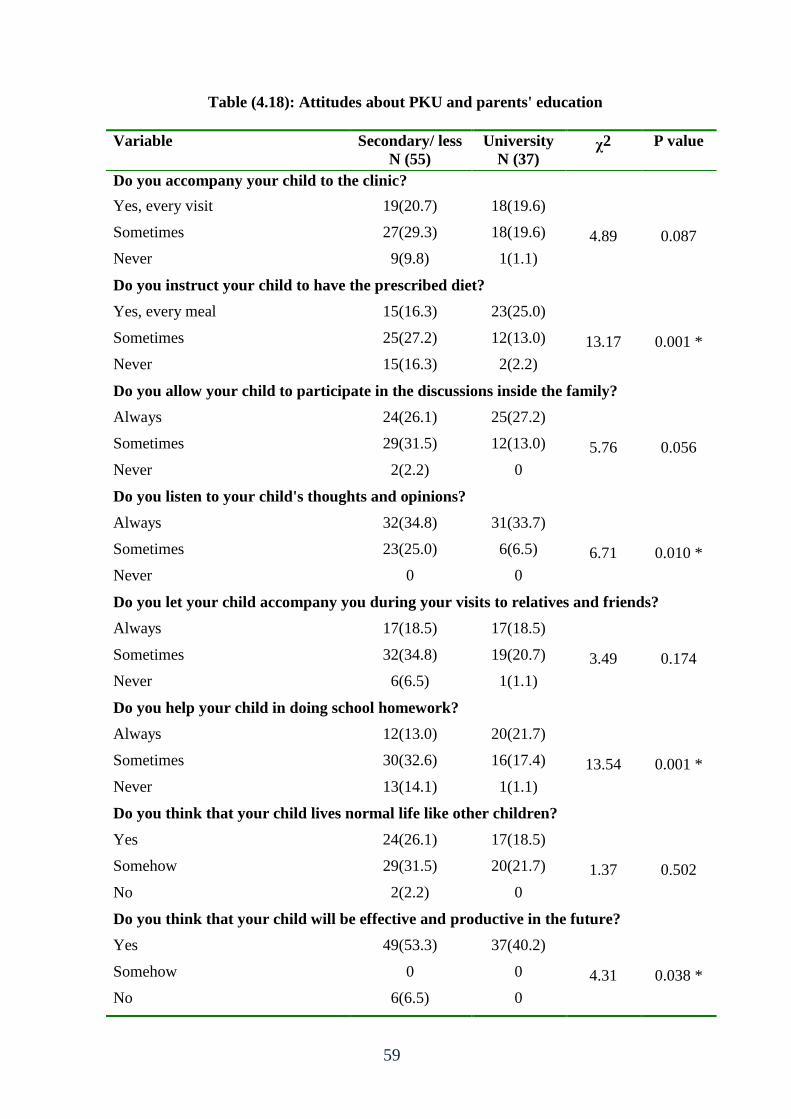
59
Table (4.18): Attitudes about PKU and parents' education
Variable Secondary/ less
N (55)
University
N (37) χ2 P value
Do you accompany your child to the clinic?
Yes, every visit 19(20.7) 18(19.6)
4.89 0.087 Sometimes 27(29.3) 18(19.6)
Never 9(9.8) 1(1.1)
Do you instruct your child to have the prescribed diet?
Yes, every meal 15(16.3) 23(25.0)
13.17 0.001 * Sometimes 25(27.2) 12(13.0)
Never 15(16.3) 2(2.2)
Do you allow your child to participate in the discussions inside the family?
Always 24(26.1) 25(27.2)
5.76 0.056 Sometimes 29(31.5) 12(13.0)
Never 2(2.2) 0
Do you listen to your child's thoughts and opinions?
Always 32(34.8) 31(33.7)
6.71 0.010 * Sometimes 23(25.0) 6(6.5)
Never 0 0
Do you let your child accompany you during your visits to relatives and friends?
Always 17(18.5) 17(18.5)
3.49 0.174 Sometimes 32(34.8) 19(20.7)
Never 6(6.5) 1(1.1)
Do you help your child in doing school homework?
Always 12(13.0) 20(21.7)
13.54 0.001 * Sometimes 30(32.6) 16(17.4)
Never 13(14.1) 1(1.1)
Do you think that your child lives normal life like other children?
Yes 24(26.1) 17(18.5)
1.37 0.502 Somehow 29(31.5) 20(21.7)
No 2(2.2) 0
Do you think that your child will be effective and productive in the future?
Yes 49(53.3) 37(40.2)
4.31 0.038 * Somehow 0 0
No 6(6.5) 0
60
Table 4.19 showed that:
- When parents were asked about accompanying their children to the clinic, 35.9% of
parents who are working and 4.3% of parents who are not working said that they
accompany their children every visit, 39.1% of parents who are working and 9.8% of
parents who are not working accompany their children sometimes, and 5.4% of
parents who are working and 5.4% of parents who are not working never
accompanied their children to the clinic. This result indicated that there are
statistically significant differences in accompanying the children to the clinic related
to parents' work status (χ2 = 7.69, P = 0.021).
- When parents were asked about instructing their children to have prescribed diet,
37.0% of parents who are working and 4.3% of parents who are not working said that
they instruct their children every meal, 30.4% of parents who are working and 9.8%
of parents who are not working instruct their children sometimes, and 13.0% of
parents who are working and 5.4% of parents who are not working never instructed
their children. This result indicated that there are statistically insignificant differences
in instructing the children to have the prescribed diet related to parents' work status
(χ2 = 3.55, P = 0.169).
- When parents were asked if they allow their children to participate in family
discussions, 47.8% of parents who are working and 5.4% of parents who are not
working said that they allow their children always, 32.6% of parents who are working
and 12.0% of parents who are not working allow them sometimes, and 2.2% of
parents who are not working said never. This result indicated that there are
statistically significant differences between parents who are working and those who
are not working in allowing the PKU children to participate in family discussions (χ2
= 12.32, P = 0.002).
61
- When parents were asked if they listen to their children thoughts and opinions, 58.7%
of parents who are working and 9.8% of parents who are not working said they
always listen, 21.7% of parents who are working and 9.8% of parents who are not
working said sometimes. This result indicated that there are statistically insignificant
differences between parents who are working and those who are not working in
listening to their children thoughts and opinions (χ2 = 3.54, P = 0.060).
- When parents were asked if they let their children to accompany them during visits to
friends or relatives, 30.4% of parents who are working and 6.5% of parents who are
not working said that they let them always, 45.7% of parents who are working and
9.8% of parents who are not working said sometimes, and 4.3% of parents who are
working and 3.3% of parents who are not working said never. This result indicated
that there are statistically insignificant differences parents who are working and those
who are not working in letting their children to accompany them during visits to
friends and relatives (χ2 = 2.61, P = 0.271).
- When parents were asked if they help their children in doing school homework,
29.3% of parents who are working and 5.4% of parents who are not working said that
they help their children always, 41.3% of parents who are working and 8.7% of
parents who are not working said sometimes, and 9.8% of parents who are working
and 5.4% of parents who are not working said never. This result indicated that there
are statistically insignificant differences between parents who are working and those
who are not working in helping their children doing school homework (χ2 = 2.77, P
= 0.250).
- When parents were asked if they think that their PKU children live normal life like
others, 33.7% of parents who are working and 10.9% of parents who are not working
said yes, 45.7% of parents who are working and 7.6% of parents who are not working
62
said somehow, and 1.1% of parents who are working and 1.1% of parents who are
not working said no. This result indicated that there are statistically insignificant
differences between parents who are working and those who are not working in their
thoughts about the normality of their children life (χ2 = 2.65, P = 0.266).
- When parents were asked if they think that their PKU children will be effective and
productive in the future, 79.3% of parents who are working and 14.1% of parents
who are not working said that they will be effective and productive, 1.1% of parents
who are working and 5.4% of parents who are not working said no. This result
indicated that there are statistically significant differences between parents who are
working and those who are not working in their thoughts about effectiveness and
productivity of their children in the future (χ2 = 16.58, P = 0.000).
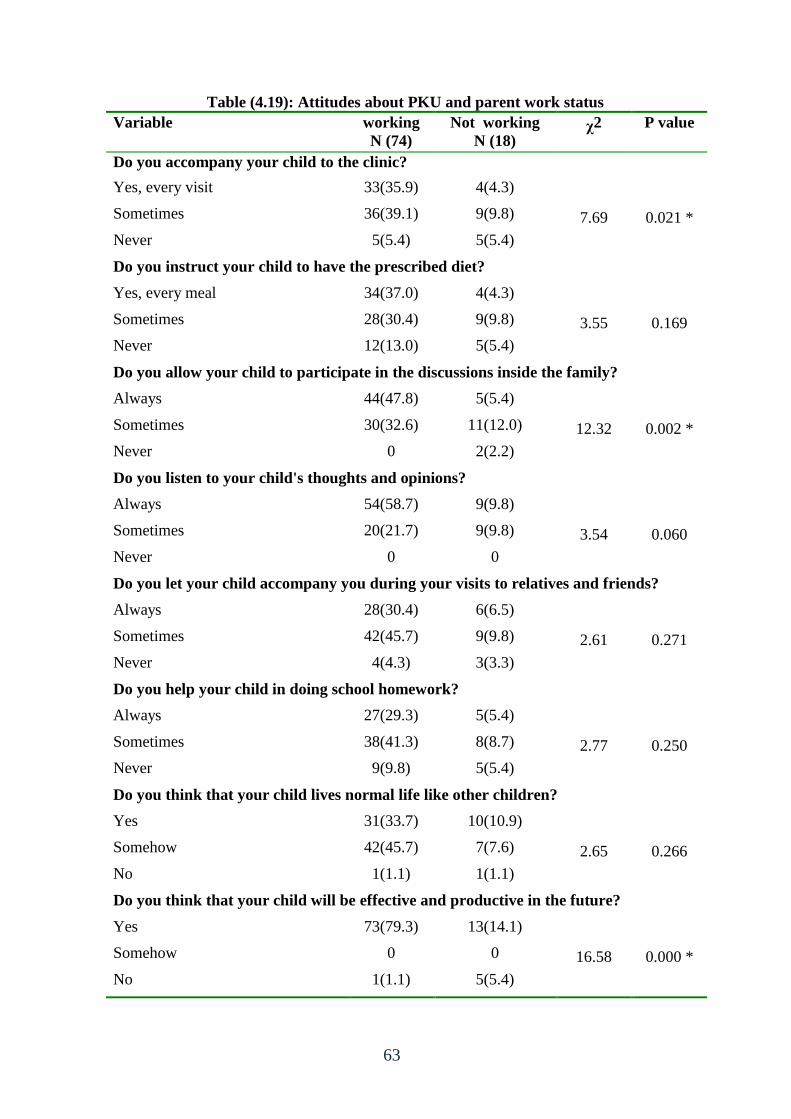
63
Table (4.19): Attitudes about PKU and parent work status
Variable working
N (74)
Not working
N (18) χ2 P value
Do you accompany your child to the clinic?
Yes, every visit 33(35.9) 4(4.3)
7.69 0.021 * Sometimes 36(39.1) 9(9.8)
Never 5(5.4) 5(5.4)
Do you instruct your child to have the prescribed diet?
Yes, every meal 34(37.0) 4(4.3)
3.55 0.169 Sometimes 28(30.4) 9(9.8)
Never 12(13.0) 5(5.4)
Do you allow your child to participate in the discussions inside the family?
Always 44(47.8) 5(5.4)
12.32 0.002 * Sometimes 30(32.6) 11(12.0)
Never 0 2(2.2)
Do you listen to your child's thoughts and opinions?
Always 54(58.7) 9(9.8)
3.54 0.060 Sometimes 20(21.7) 9(9.8)
Never 0 0
Do you let your child accompany you during your visits to relatives and friends?
Always 28(30.4) 6(6.5)
2.61 0.271 Sometimes 42(45.7) 9(9.8)
Never 4(4.3) 3(3.3)
Do you help your child in doing school homework?
Always 27(29.3) 5(5.4)
2.77 0.250 Sometimes 38(41.3) 8(8.7)
Never 9(9.8) 5(5.4)
Do you think that your child lives normal life like other children?
Yes 31(33.7) 10(10.9)
2.65 0.266 Somehow 42(45.7) 7(7.6)
No 1(1.1) 1(1.1)
Do you think that your child will be effective and productive in the future?
Yes 73(79.3) 13(14.1)
16.58 0.000 * Somehow 0 0
No 1(1.1) 5(5.4)
64
Chapter V
Discussion
In this chapter the researcher presented indepth discussion of the study results. The
results were tackled in comparison with relevant previous studies and literature.
PKU patients did not have adequate attention from researchers in GS. If the disease is
discovered early and proper dietary therapy was commenced, many of the negative effects
including mental retardation could be prevented. This study focused on PKU patients who
do not have mental retardation and enrolled in schools.
5.1 Characteristics of the study participants
In this study, 92 children with PKU and 92 parents were included, 52.2% of PKU
children were males and 47.8% were females, their age ranged between 6 – 18 years,
85.9% were in primary and prep school and 14.1 were in secondary school. About their
performance in school, 15.2% were excellent, 30.4% were very good, 31.5% were good,
and 22.8% were weak.
5.2 Adherence to dietary therapy
The results showed that the vast majority (96.7%) of study participants follows diet
therapy and 91.3% started diet therapy during the first year of their life. This result
indicated high level of adherence to diet therapy among PKU children, which reveals that
PKU children and their families understand the importance of diet therapy and have good
concern about the health status of their children. It was reported by Hoedt (2012) that there
is universal consensus that all newborns with PKU need to start a phenylalanine restricted
diet as soon as possible, inorder to prevent severe cognitive impairment caused by high phe
levels. However, there is much debate on the need for a strict dietary control during
adulthood and on the safe upper limit of phe levels.
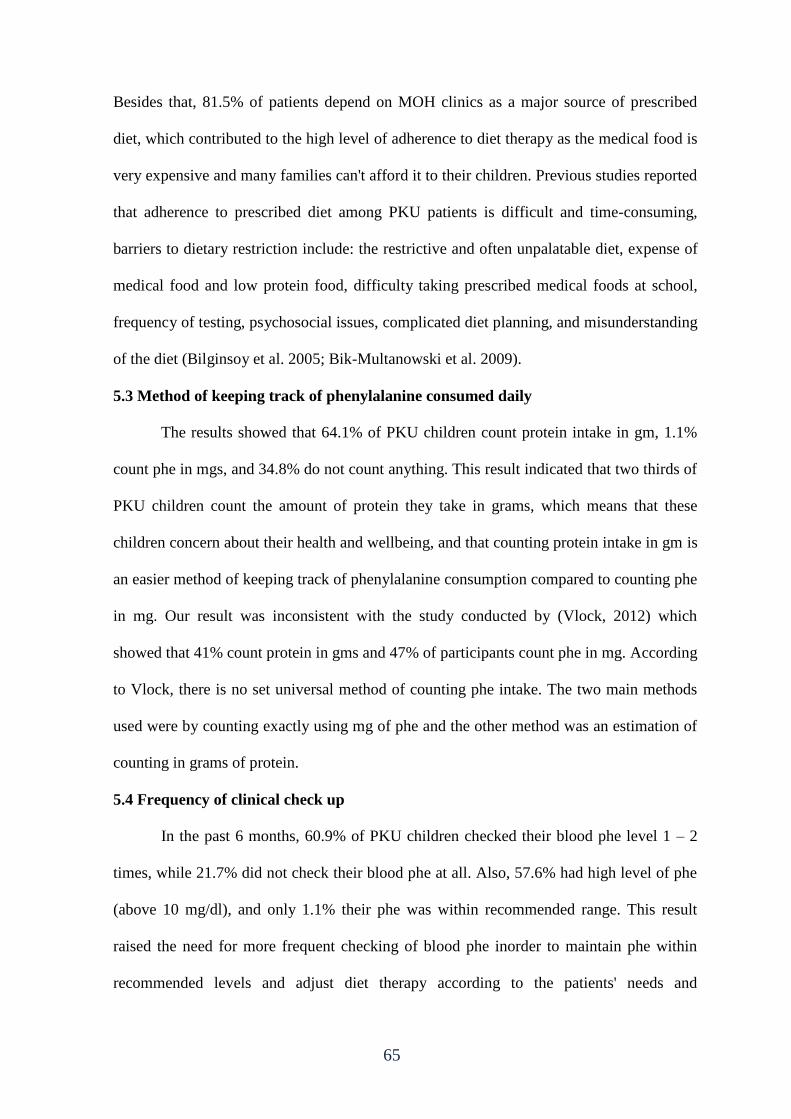
65
Besides that, 81.5% of patients depend on MOH clinics as a major source of prescribed
diet, which contributed to the high level of adherence to diet therapy as the medical food is
very expensive and many families can't afford it to their children. Previous studies reported
that adherence to prescribed diet among PKU patients is difficult and time-consuming,
barriers to dietary restriction include: the restrictive and often unpalatable diet, expense of
medical food and low protein food, difficulty taking prescribed medical foods at school,
frequency of testing, psychosocial issues, complicated diet planning, and misunderstanding
of the diet (Bilginsoy et al. 2005; Bik-Multanowski et al. 2009).
5.3 Method of keeping track of phenylalanine consumed daily
The results showed that 64.1% of PKU children count protein intake in gm, 1.1%
count phe in mgs, and 34.8% do not count anything. This result indicated that two thirds of
PKU children count the amount of protein they take in grams, which means that these
children concern about their health and wellbeing, and that counting protein intake in gm is
an easier method of keeping track of phenylalanine consumption compared to counting phe
in mg. Our result was inconsistent with the study conducted by (Vlock, 2012) which
showed that 41% count protein in gms and 47% of participants count phe in mg. According
to Vlock, there is no set universal method of counting phe intake. The two main methods
used were by counting exactly using mg of phe and the other method was an estimation of
counting in grams of protein.
5.4 Frequency of clinical check up
In the past 6 months, 60.9% of PKU children checked their blood phe level 1 – 2
times, while 21.7% did not check their blood phe at all. Also, 57.6% had high level of phe
(above 10 mg/dl), and only 1.1% their phe was within recommended range. This result
raised the need for more frequent checking of blood phe inorder to maintain phe within
recommended levels and adjust diet therapy according to the patients' needs and
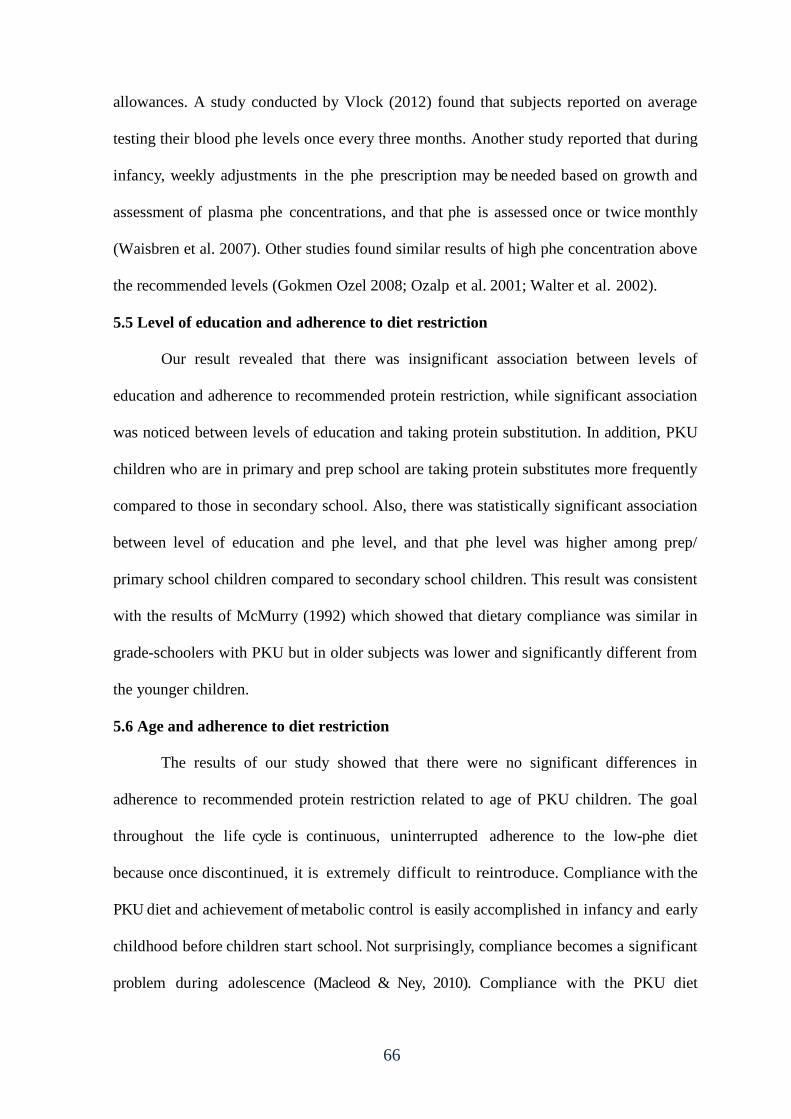
66
allowances. A study conducted by Vlock (2012) found that subjects reported on average
testing their blood phe levels once every three months. Another study reported that during
infancy, weekly adjustments in the phe prescription may be needed based on growth and
assessment of plasma phe concentrations, and that phe is assessed once or twice monthly
(Waisbren et al. 2007). Other studies found similar results of high phe concentration above
the recommended levels (Gokmen Ozel 2008; Ozalp et al. 2001; Walter et al. 2002).
5.5 Level of education and adherence to diet restriction
Our result revealed that there was insignificant association between levels of
education and adherence to recommended protein restriction, while significant association
was noticed between levels of education and taking protein substitution. In addition, PKU
children who are in primary and prep school are taking protein substitutes more frequently
compared to those in secondary school. Also, there was statistically significant association
between level of education and phe level, and that phe level was higher among prep/
primary school children compared to secondary school children. This result was consistent
with the results of McMurry (1992) which showed that dietary compliance was similar in
grade-schoolers with PKU but in older subjects was lower and significantly different from
the younger children.
5.6 Age and adherence to diet restriction
The results of our study showed that there were no significant differences in
adherence to recommended protein restriction related to age of PKU children. The goal
throughout the life cycle is continuous, uninterrupted adherence to the low-phe diet
because once discontinued, it is extremely difficult to reintroduce. Compliance with the
PKU diet and achievement of metabolic control is easily accomplished in infancy and early
childhood before children start school. Not surprisingly, compliance becomes a significant
problem during adolescence (Macleod & Ney, 2010). Compliance with the PKU diet
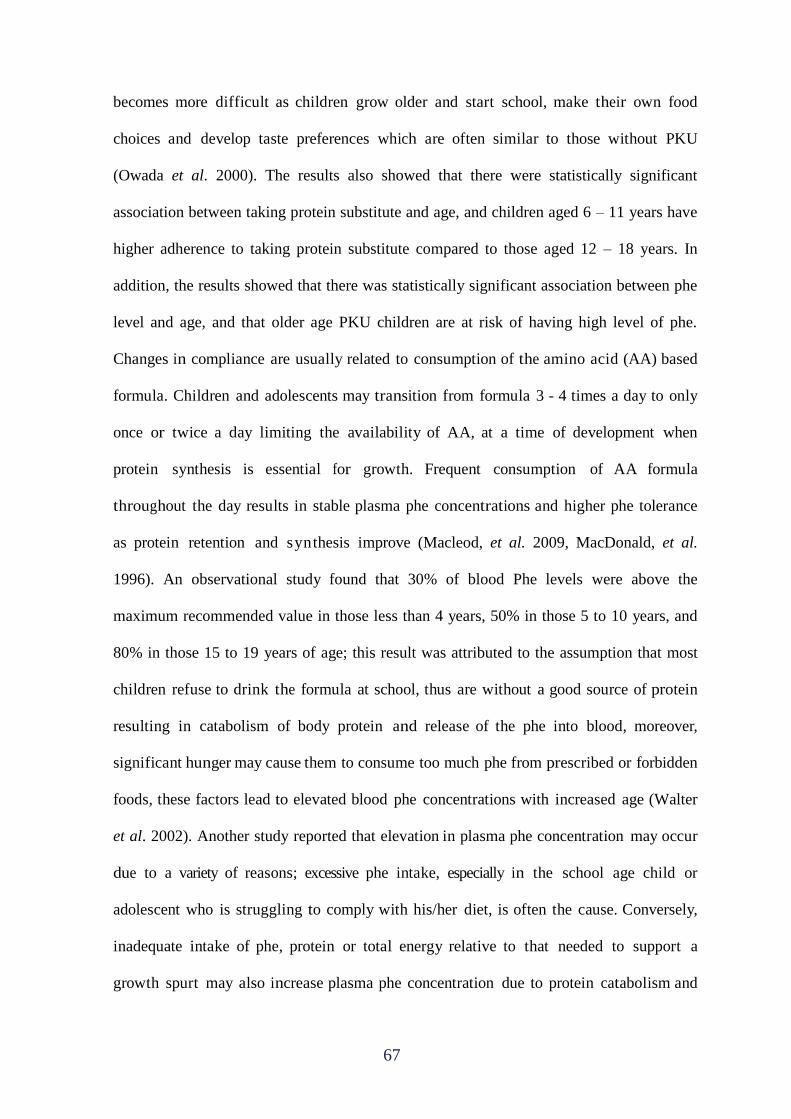
67
becomes more difficult as children grow older and start school, make their own food
choices and develop taste preferences which are often similar to those without PKU
(Owada et al. 2000). The results also showed that there were statistically significant
association between taking protein substitute and age, and children aged 6 – 11 years have
higher adherence to taking protein substitute compared to those aged 12 – 18 years. In
addition, the results showed that there was statistically significant association between phe
level and age, and that older age PKU children are at risk of having high level of phe.
Changes in compliance are usually related to consumption of the amino acid (AA) based
formula. Children and adolescents may transition from formula 3 - 4 times a day to only
once or twice a day limiting the availability of AA, at a time of development when
protein synthesis is essential for growth. Frequent consumption of AA formula
throughout the day results in stable plasma phe concentrations and higher phe tolerance
as protein retention and synthesis improve (Macleod, et al. 2009, MacDonald, et al.
1996). An observational study found that 30% of blood Phe levels were above the
maximum recommended value in those less than 4 years, 50% in those 5 to 10 years, and
80% in those 15 to 19 years of age; this result was attributed to the assumption that most
children refuse to drink the formula at school, thus are without a good source of protein
resulting in catabolism of body protein and release of the phe into blood, moreover,
significant hunger may cause them to consume too much phe from prescribed or forbidden
foods, these factors lead to elevated blood phe concentrations with increased age (Walter
et al. 2002). Another study reported that elevation in plasma phe concentration may occur
due to a variety of reasons; excessive phe intake, especially in the school age child or
adolescent who is struggling to comply with his/her diet, is often the cause. Conversely,
inadequate intake of phe, protein or total energy relative to that needed to support a
growth spurt may also increase plasma phe concentration due to protein catabolism and
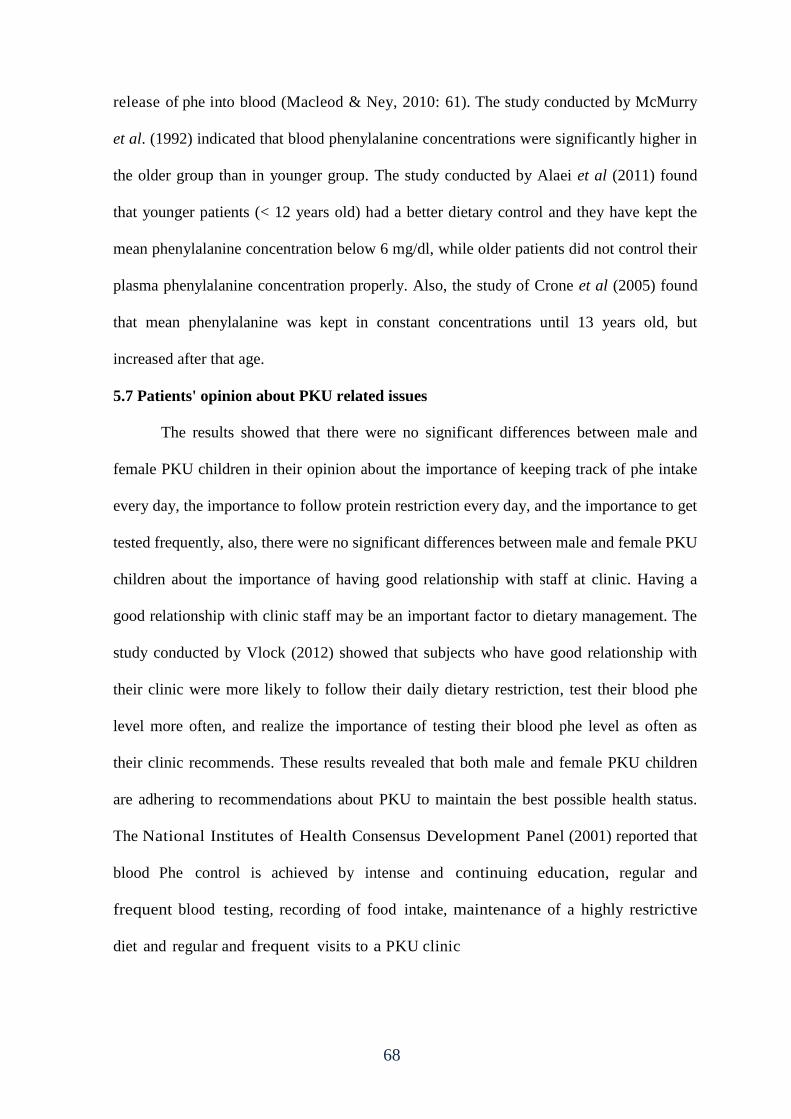
68
release of phe into blood (Macleod & Ney, 2010: 61). The study conducted by McMurry
et al. (1992) indicated that blood phenylalanine concentrations were significantly higher in
the older group than in younger group. The study conducted by Alaei et al (2011) found
that younger patients (< 12 years old) had a better dietary control and they have kept the
mean phenylalanine concentration below 6 mg/dl, while older patients did not control their
plasma phenylalanine concentration properly. Also, the study of Crone et al (2005) found
that mean phenylalanine was kept in constant concentrations until 13 years old, but
increased after that age.
5.7 Patients' opinion about PKU related issues
The results showed that there were no significant differences between male and
female PKU children in their opinion about the importance of keeping track of phe intake
every day, the importance to follow protein restriction every day, and the importance to get
tested frequently, also, there were no significant differences between male and female PKU
children about the importance of having good relationship with staff at clinic. Having a
good relationship with clinic staff may be an important factor to dietary management. The
study conducted by Vlock (2012) showed that subjects who have good relationship with
their clinic were more likely to follow their daily dietary restriction, test their blood phe
level more often, and realize the importance of testing their blood phe level as often as
their clinic recommends. These results revealed that both male and female PKU children
are adhering to recommendations about PKU to maintain the best possible health status.
The National Institutes of Health Consensus Development Panel (2001) reported that
blood Phe control is achieved by intense and continuing education, regular and
frequent blood testing, recording of food intake, maintenance of a highly restrictive
diet and regular and frequent visits to a PKU clinic
69
5.8 Parents' knowledge about PKU
The results reflected that parents of PKU children were knowledgeable about PKU.
There were no significant differences between fathers and mothers in their knowledge
about PKU. Adequate knowledge is an important factor in monitoring their children to
maintain good health and wellbeing. Parents of the PKU children have a key role in
helping their children understand and take responsibility for their own diet. A study
conducted at Hacettepe University Ihsan Demograci Children's hospital in Turkey showed
that the general mean of parental knowledge about PKU was 61.5%, the mean score on
the 6 disease knowledge questions was 81.1%, but the dietary score was much lower
(53.1%) and the Phe exchange knowledge was particularly low (22.9%). The blood Phe
concentrations were higher in children whose mothers had weak knowledge about
exchange score compared to those who did not, but there was nonsignificant negative
correlation between maternal total knowledge score and median blood phenylalanine
concentration (Gokmen Ozel et al. 2008). Another study showed that higher knowledge of
the parents was significantly associated with lower phe levels of their children which
reflects adherence to low protein diet (Bekhof et al. 2003). The study carried out by
Macdonald et al., (2008) showed that overall maternal knowledge on most aspects of diet
was good and there was a correlation between annual median blood phenylalanine
concentrations and higher maternal scores on PKU knowledge (r = -0.646; P < 0.0001), the
study concluded that blood Phe control within the first 3 years of age, poor parental
education, and unsatisfactory maternal dietary knowledge may all influence long-term
blood Phe control in children.
Additionally, parents' knowledge about PKU is influenced by parents' level of education.
The results showed that there were significant association between level of education and
knowledge about; the effect of diet on children health status (χ2 = 12.52, P = 0.006),
70
developmental delay could be prevented (χ2 = 23.14, P = 0.000), and improvement of
health status after diet initiation (χ2 = 6.19, P = 0.045). Parents' education level could be
one of the factors affecting dietary adherence. The study of Bekhof et al (2003) found an
association between higher knowledge in parents and lower level of phenylalanine
concentration, also parental education level was effectively related to blood phenylalanine
concentration. In contrast, Olsson et al (2007) found that there was nonsignificant
correlation between parents' educational level and phenylalanine concentration, and the
study of Alaei et al (2011) found no significant relation between parental educational level
and patients' blood phenylalanine concentration, this may be due to nutrition specialists
who train families, adding to that increase parents' knowledge independently from their
level of education.
5.9 Parents' attitudes about PKU children
The results showed that there were no significant differences between fathers and
mothers in their attitudes toward their PKU children, but there were statistically significant
association between parents' level of education and some aspects of attitude questionnaire,
including; instructing their children to have the prescribed diet (χ2 = 13.17, P = 0.001),
listening to child's thoughts and opinions (χ2 = 6.71, P = 0.010), helping their children in
doing school homework (χ2 = 13.54, P = 0.001), and the believe that their children will be
effective and productive in the future (χ2 = 4.31, P = 0.038). In addition, there were
statistically significant association between some aspects of attitudes toward PKU children
and parents' working status, including; accompanying their children to the clinic (χ2 =
7.69, P = 0.021), allowing the PKU child to participate in family discussions (χ2 = 12.32,
P = 0.002), and the believe that their children will be effective and productive in the future
(χ2 = 16.58, P = 0.000).
71
Parents' attitude toward PKU is very important because attitudes usually reflected in
motivation and behavior. It is believed that positive attitudes will improve patients'
adherence to dietary restrictions and maintain blood phe concentration within the
recommended range. Since a low-Phe diet is one of the most restrictive of all dietary
treatments, adherence to the diet is very diffıcult and influenced by many factors: parental
application and supervision, the level of knowledge of the parents and caregivers,
motivation. Intense and continuing education can help to ensure that patients and their
families understand the diet, improve the motivation of the patients and their families, and
generate a positive attitude towards the diet, eventually resulting in the achievement of
blood Phe control (National Institutes of Health Consensus Panel 2001; MacDonald 2000;
Levy & Waisbren 1994).
Having a child with PKU could be emotionally crisis for the parents and may
reflect feelings of guilt, which will be turned out in their attitudes and behaviors. In one
study, reported that parents did not always apply the diet strictly and deviated from it, the
underlying reason was a compromise between an ideal attitudes towards the diet with the
accompanying experience of guilt (Awiszus & Unger, 1990). Also, the results obtained by
old study conducted by (Keleske et al., 1967) suggested that the efforts to impose dietary
restriction of phenylalanine intake affect the emotional climate of the total family; that the
parents need constant support, orientation, and counseling to enable them to maintain a
realistic attitude toward their child with PKU.
72
5.10 Conclusion
This study aimed to examine the adherence of PKU children to their diet therapy, and to
determine parents' knowledge about PKU and attitudes toward their children. The results
reflected that the vast majority of children were following diet therapy during their first
year of life. In Gaza Strip, there are no documentation of what parents know and what
parents want to know about PKU diet. Barriers to dietary adherence in PKU include
factors associated with the treatment regimen itself as well as economic resources,
psychosocial issues, social and emotional factors, and health care system issues.
Continuing education can help to ensure that patients and their families understand
the diet. It will also improve the motivation of the patients and their families and help
to generate a positive attitude towards the diet (MacDonald, 2000).
It is an important to make health services for PKU accessible, and to do so, the MOH need
to establish another PKU clinic in the southern governorates (Khanyounis for example) to
enable those patients who live in Khanyounis and Rafah to access the clinic more easily
(52.1% of PKU patients live in Rafah and Khanyounis).
5.11 Recommendations
In the light of the study results, the researcher suggests the following recommendations:
- Obligatory screening of all newborns for PKU before the mother having history of
the disease being discharged from the hospital, and initiate therapy for positive cases
immediately to avoid occurrence of mental retardation.
- Establishing national association to take care of PKU children psychologically and
socially to help them being active and productive in the community.
- Teach parents and children how to measure phe in mg and protein in gm in their
meals inorder to maintain normal range of phe plasma concentration.
73
- Instruct parents and children about the importance of dietary restrictions in
preventing unhealthy consequences of PKU, especially mental retardation.
- The school health team at MOH needs to maintain follow up of PKU children to
ensure that they follow recommended diet restriction at school.
- The patients should have more frequent appointment schedules to have clinical
exams every three months at least, to enable the health care provider to predict any
abnormality in health status of the child and implement proper treatment.
5.12 Suggestions for further studies
- To conduct a study exploring the causes of increasing number of PKU children in Gaza
Strip.
- To conduct a study examining the risk parameters for developing mental retardation
among PKU patients.
- To conduct a study examining quality of life of PKU children.
- To conduct a study to identify risk factors of developing PKU in Gaza Strip.
74
References
- Abu Shahla AN, Abed Y, Abu Shahla NK. (2004). Screening programme for
phenylketonuria in the Gaza Strip: Evaluation and recommendations. Journal of
Tropical Pediatrics; 50(2):101-5.
- Acosta PB, and Yannicelli S. (2001). Nutrition Support Protocols, 4th
ed.
Columbus, Ohio: Ross Products Division, Abbott Laboratories.
- (AEPBA) Ard El Insan Palestinian Benevolent Association (2006). We are
Palestine. www.ardelinsan (retrieved August15, 2012).
- Alaei M, Asadzadeh-Totonchi G, Gachkar L, and Farivar S. (2011). Family social
status and dietary adherence of patients with phenylketonuria. Iran Journal of
Pediatrics; 21(3): 379-384.
- Albrecht J, Garbade SF, Burgard P. (2009). Neuropsychological speed tests and
blood phenylalanine levels in patients with phenylketonuria: a meta-analysis.
Neuroscience and Biobehavioral Review; 33(3): 414 – 421.
- Ali, B., Hertecant, J., Al-Jasmi, F., Hamdan, M., Khuri, S., Akawi, N., & Al-Gazali,
L. (2011). New and known mutations associated with inborn errors of metabolism
in a heterogeneous Middle Eastern population. Saudi Medical Journal, 32(4), 353-
359.
- Anon (2001). National institutes of health consensus development conference
statement: phenylketonuria: screening and management, October 16–18, 2000.
Pediatrics 108(4): 972-982.
- Autti-Ramo, I. (2012). HTA on neonatal screening for rare metabolic disorders
faced misconceptions and blurred objectivity. The 6th
European Conference on
Rare Diseases and Orphan Products, Brussels, Belgium, 23-25 May 2012.
75
- Awiszus, D. & Unger, I. (1990). Coping with PKU: results of narrative interviews
with parents. European Journal of Pediatrics; 149(1): 45-51.
- Azen C, Koch R, Friedman E, Wenz E, and Fishier K. (1996). Summary of findings
from the United States collaborative study of children treated for phenylketonuria.
European Journal of Pediatrics; 155. Suppl 1:S29–S32.
- Bannoura S. (2009). Unemployment rate in Gaza. International Middle East Media
Center (IMEMC).
- Beauchamp MH, and Anderson V. (2010). An integrative framework for the
development of social skills. Psychological Bulletin; 136: 39-64.
- Bekhof, J., van Spronsen, F., Crone, M., van Rijn, M., Oudshoorn, C., and Verkerk,
P. (2003). Influence of knowledge of the disease on metabolic control in
phenylketonuria. European Journal of Pediatrics; 162(6): 440 - 442.
- Bik-Multanowski M, Didycz B, Mozrzymas R, Nowacka M, Kaluzny L, et al.,
(2008). Quality of life in noncompliant adults with phenylketonuria after
resumption of the diet. Journal of Inherited Metabolic Disorders; 31(2): 415-418.
- Bilginsoy C, Waitzman N, Leonard C, and Ernst S. (2005). Living with
phenylketonuria: Perspectives of patients and their families. Journal of Inherited
Metabolic Diseases; 28(5): 639-649.
- Blau N. (2010). Sapropterin dihydrochloride for phenylketonuria and
tetrahydrobiopterin deficiency. Expert Review of Endocrinology and Metabolism; 5
(4): 483–494.
- Brin A, Johnson K, McPherson M, Lloyd-Puryear MA, Tonniges T, van Dyck PC,
Mann MY. (2006). American Academy of Pediatrics Newborn Screening Task
Force recommendations: how far have we come?. Pediatrics; 117(5pt2): S194-211.
76
- Burgard P, Xiaoping L and Hoffmann GF. (2009). Phenylketonuria. In Sarafoglou
K, Hoffman GF, Roth KS, eds. Pediatric Endocrinology and Inborn Errors of
Metabolism. New York: McGraw Hill Companies, 163-168.
- Burgard P. (2000). Development of intelligence in early treated phenylketonuria.
European Journal of Pediatrics; 159(suppl 2):S74–S79.
- Christ SE, Huijbregts SC, de Sonneville LM, and White DA. (2010). Executive
function in early-treated phenylketonuria: profile and underlying mechanisms.
Molecular Genetics and Metabolism; 99(Suppl 1): S22-32.
- Cotugno G, Nicolo R, Cappelletti S, Goffredo BM, Dionisi Vici C, and Di Ciommo
V. (2011). Adherence to diet and quality of life in patients with phenylketonuria.
Acta Pediatrica; 100(8): 1144-1149.
- Crone, M., van Spronsen, F., Oudshoorn, K., Bekhof, J., van Rijn, G., and Verkerk,
P. (2005). Behavioral factors related to metabolic control in patients with
phenylketonuria. Journal of Inherited Metabolic Diseases; 28(2), 627-637.
- DiLella A. G, Kwok S. C. M, Ledley F. D, Marvit J, and Woo S. L. C. (1986).
Molecular structure and polymorphic map of the human phenylalanine hydroxylase
gene. Biochemistry; 25: 743-749.
- Durham-Shearer S, Judd P, Whelan K, and Thomas J. (2008). Knowledge,
compliance and serum phenylalanine concentrations in adolescents and adults with
phenylketonuria and the effect of a patient-focused educational resource. Journal of
Human Nutrition and Dietetics; 21: 474-485.
- Evans, S., Daly, A., Hopkins, V., Davies, P., and MacDonald, A. (2009). The
impact of visual media to encourage low protein cooking in inherited metabolic
disorders. Journal of Human Nutrition and Dietetics; 22: 409 - 413.
77
- FAO/WHO/UNU (2007). Protein and amino acid requirements in human nutrition.
Who press. P. 150.
- Gassio R, Artuch R, Vilaseca MA, et al. (2005). Cognitive functions in classic
phenylketonuria and mild hyperphenylalaninemia: Experience in a pediatric
population. Developmental Medicine and Child Neurology; 47(7): 443 – 448.
- Gassio R, Fusté E, López-Sala A, et al., (2005). School performance in early and
continuously treated phenylketonuria. Pediatric Neurology; 33(4): 267-271.
- Gassio R, Campistol J, Vilaseca MA, Lambruschini N, Cambra FJ, and Fusté E.
(2003). Do adult patients with phenylketonuria improve their quality of life after
introduction/resumption of a phenylalanine-restricted diet? Acta Pediatrica; 92(12):
1474-1478.
- Genetic Counseling Aids (2007). 5th
. ed. Cited in PKU Handbook: A guide for
PKU from diagnosis to adulthood. National PKU alliance, p. 12.
- Gentile, J.K., Ten Hoedt, A.E., & Bosch, A.M. (2010). Psychosocial aspects of
PKU: Hidden disabilities – a review. Molecular Genetics and Metabolism, 99, s64-
s67.
- Ghiasvand N.M, Aledavood A, Ghiasvand R, Borojeny F, et al., (2009). Prevalence
of classical phenylketonuria in mentally retarded individuals in Iran. Journal of
Inherited Metabolic Disease; 32(1): 283-287.
- Giovannini M, Verduci E, Salvatici E, Fiori L, Riva E. (2007). Phenylketonuria:
dietary and therapeutic challenges. Journal of Inherited Metabolic Disorders;
30(2):145 – 152.
- Gokmen Ozel H, Kucukkasap T, Koksal G, Kalkanoglu Sivri H.S, Dursun A,
Tokatli A, Coskun T. (2008). Does maternal knowledge impact blood
78
phenylalanine concentration in Turkish children with phenylketonuria?. JIMD short
report No. 111.
- Guldberg P, Henriksen K. F, Sipila I, Guttler F, and de la Chapelle A. (1995).
Phenylketonuria in a low incidence population: molecular characterization of
mutations in Finland. Journal of Medical Genetics; 32: 976-978.
- Hardelid P, Cortina-Borja M, Munro A, Jones H, et al., (2008). The birth
prevalence of PKU in populations of European, South Asian and sub-Saharan
African ancestry living in South East England. Annals of Human Genetics; 72: 65-
71.
- Harding, C., & Blau, N. (2010). Advances and challenges in phenylketonuria.
Journal of Inherited Metabolic Diseases, 33, 645-648.
- Hoedt, A.E. (2012). Phenylketonuria: impact and implications. PhD. Dissertation,
Faculty of Medicine, University of Amsterdam, Netherlands.
- Huijbregts SC, de Sonneville LM, Licht R, van Spronsen FJ, Verkerk PH, Sergeant
JA. (2002). Sustained attention and inhibition of cognitive interference in treated
phenylketonuria: associations with concurrent and life-time phenylalanine
concentrations. Neuropsychological; 40(1): 7 – 15.
- Human Rights Council (2010). Annual report.
- Feillet F, Van Spronsen F, MacDonald A, Trefz F, Demirkol M, et al., (2010).
Challenges and pitfalls in the management of phenylketonuria. Pediatrics; 126(2):
333-341.
- IBL International GmbH, (2011). Phenylalanine neonatal Screening Assay
RE80015/RE80019, Germany.
- McMillan J.A, Feigin R.D, DeAngelis C, and Douglas J.M. (2006). Oski's
pediatrics: principles and practice. Lippincott Williams & Wilkins, p. 162.
79
- Keleske L., Solomons G. & Opitz E. (1967). Parental reaction to phenylketonuria in
the family. The Journal of Pediatrics; 70(5): 793-798.
- Kemper A, Brewer C, and Singh R. (2010). Perspectives on dietary adherence
among women with inborn errors of metabolism. Journal of the American Dietetic
Association; 110(8): 247-252.
- Khemir, S., El-Asmi, M., Sanhaji, H., Feki, M., Jemma, R., Tebib, N., et al.,
(2011). Phenylketonuria is still a major cause of mental retardation in Tunisia
despite the possibility of treatment. Clinical Neurology and Neurosurgery, 113(9),
727-730.
- Landolt M.A, Nuoffer J, Steinmann B, and Superti-Furga A. (2002). Quality of life
and psychological adjustment in children and adolescents with early treated
phenylketonuria can be normal. The Journal of Pediatrics; 140(5): 516-521.
- Levy HL. et al., (2003). Pregnancy experiences in the woman with mild
hyperphenylalaninemia. Pediatrics; 112(6 Pt 2):1548–1552.
- Levy HL. & Waisbren SE. (1994). PKU in adolescents: rational and psychosocial
factors in diet continuation. Acta Pediatrica Supplement; 407: 92-97.
- Longo N. (2009). Disorders of biopterin metabolism. Journal of Inherited
Metabolic Disease; 32(3): 333-342.
- Lundstedt G, Johansson A, Melin L, and Alm J. (2001). Adjustment and
intelligence among children with phenylketonuria in Sweden. Acta Paediatrica;
90(10):1147-1152.
- MacDonald A, Gokmen-Ozel H, van Rijn M, and Burgard P. (2010). The reality of
dietary compliance in the management of phenylketonuria. Journal of Inherited
Metabolic Disease; 33(6): 665-670.
- MacDonald A, Davies P, Daly A, Hopkins V, et al., (2008). Does maternal
knowledge and parent education affect blood phenylalanine control in
phenylketonuria?. Journal of Human Nutrition and Diet; 21(4): 351-358.
80
- MacDonald A, Chakrapani A, Hendriksz C, Daly A, Davies P, et al., (2006).
Protein substitute dosage in PKU: how much do young patients need? Archive of
Disease in Childhood; 91: 588-593.
- MacDonald A. (2000). Diet and compliance in phenylketonuria. European
Journal of Pediatrics; 159(Supple 2): S136-S141.
- MacDonald A, Rylance G, Hall SK, et al. (1996). Factors affecting the variation in
plasma phenylalanine in patients with phenylketonuria on diet. Archive of
Disease in Childhood; 74: 412-417.
- Macleod E, and Ney D. (2010). Nutritional management of phenylketonuria.
Annales Nestle, 68(2), 58-69.
- MacLeod EL, Gleason ST, van Calcar SC, and Ney DM. (2009). Reassessment
of phenylalanine tolerance in adults with phenylketonuria is needed as body
mass changes. Molecular Genetics and Metabolism; 98: 331-337.
- Marsden D, and Levy H. (2006). Classification of PKU. In: Blau N, ed. Advances
in Phenylketonuria and Tetrahydrobiopterin. Heilbronn, Germany: SPS
Verlagsgesell schaft GmbH: 92–103.
- McMurry M, Chan G, Leonard C, and Ernst S. (1992). Bone mineral status in
children with phenylketonuria – relationship to nutritional intake and phenylalanine
control. American Journal of Clinical Nutrition; 55: 997-1004.
- Mitchell J.J., and Scriver C.R. (2000). Phenylalanine Hydroxylase deficiency In:
Gene Reviews. University of Washington, Seattle; 1993-2000.
- MOH, (2013). Testing for PKU. Al-Remal PHC.
- MOH, (2011). Annual report. Department of health information, Gaza.
- MOH, (2006). Health Status in Palestine, annual report.
- MOH, (2004). Palestinian health care system. Health status in Palestine 2003.
81
- Moyle JJ, Fox AM, Arthur M, Bynevelt M, Burnett JR. (2007). Meta-analysis of
neuropsychological symptoms of adolescents and adults with PKU.
Neuropsychological Review; 17(2): 91-101.
- National Institutes of Health Consensus Development Panel. (2001). National
Institutes of Health Consensus Development Conference Statement:
Phenylketonuria: Screening and Management. Pediatrics; 4: 972-982.
- National Institutes of Health (NIH) Consensus statement, (2000).
Phenylketonuria (PKU): screening and management. October 16 – 18; 17(3), 1-33.
- Ney, D., Gleason, ST., Van Calcar, SC., MacLeod, EL., Nelson, KL., Etzel,
MR., Rice, GM., & Wolff, JA. (2009). Nutritional management of PKU
with glycomacropeptide from cheese whey. Journal of Inherited Metabolic
Disease, 32, 32-39.
- Olsson, G. M., Montgomery, S. M., and Alm, J. (2007). Family conditions and
dietary control in phenylketonuria. Journal of Inherited Metabolic Diseases; 30(5):
708-715.
- Owada M, Aoki K, and Kitagawa T. (2000). Taste preferences and feeding
behavior in children with phenylketonuria on a semisynthetic diet. European
Journal of Pediatrics; 159: 846-850.
- Ozel HG, Kucukkasap T, Koksal G, Sivri HS, et al., (2008). Does maternal
knowledge impact blood phenylalanine concentration in Turkish children with
phenylketonuria?. Journal of Inherited Metabolic Disease; Suppl 2:S213-217.
- PASSIA, (2008). Palestinian Academic Society for the Study of International
Affairs, http://www.passia.org. (accesses 18.8.2012).
- (PCBS) Palestinian Central Bureau of Statistics. 2007, 2009. Annual report.
82
- (PCHR) Palestinian Center for Human Rights (2006). Poverty in the Gaza Strip
Report.
- Pietz J. (1998). Neurological aspects of adult phenylketonuria, Current Opinion in
Neurology; 11: 679–688.
- Polit, D. (2004). Nursing research: principles and methods, 7th
Ed., Lippincott,
New York, USA.
- Przyrembel H, and Bremer HJ. (2000). Nutrition, physical growth, and bone density
in treated phenylketonuria. European Journal of Pediatrics; 159: S129-S135.
- Schulze A, Lindner M, Kohlmuller D, Olgemoller K, Mayatepek E, Hoffmann GF.
(2003). Expanded newborn screening for inborn errors of metabolism by
electrospray ionization-tandem mass spectrometry: results, outcome, and
implications. Pediatrics; 111(6 Pt 1): 1399-1406.
- Scriver CR, Kaufman S. (2001).Hyperphenylalaninemia: phenylalanine
hydroxylase deficiency. In: Williams, R., Mamotte, C., & Burnett, J. (2008).
Phenylketonuria: An inborn error of phenylalanine metabolism. Clinical
Biochemistry Review, 29(1), 31.41.
- Scriver C.R., Waters P.J., Sarkissian C, Ryan S, Prevost L, Cote D, Novak J, Teebi
S, Nowacki P.M., (2000). PAHdb: a locus-specific knowledgebase, Human
Mutation; 15: 99–104.
- Scriver C.R., Kaufman S., Eisensmith R.C., Woo S.L., (1995). The
hyperphenylalaninemias, in: C.R. Scriver, A.L. Beaudet, W.S. Sly, D. Valle (Eds.),
The Metabolic and Molecular Bases of Inherited Disease, McGraw-Hill, New
York, 1995, pp. 1015–1075.
- Simon E, Schwarz M, Roos J, et al., (2008). Evaluation of quality of life and
description of the sociodemographic state in adolescent and young adult patients
83
with phenylketonuria (PKU). Health and Quality of Life Outcomes; 6:25.
(Available at: http://www.hqlo.com/content/6/1/25.)
- Singh RH, Kable JA, Guerrero NV, Sullivan KM, and Elsas LJ. (2000). Impact of a
camp experience on phenylalanine levels, knowledge, attitudes, and health beliefs
relevant to nutrition management of phenylketonuria in adolescent girls. Journal of
American Dietetic Association; 100(7): 797-803.
- Teebi, A. & Farag T. (1996). Genetic disorders among Arab populations. Oxford
monographs on medical genetics No. 30, Oxford, Oxford University Press.
- Waisbren S, Noel K, Fahrbach K. et al., (2007). Phenylalanine blood levels and
clinical outcomes in phenylketonuria: A systematic literature review and meta-
analysis. Molecular Genetics and Metabolism; 92: 63-70.
- Waisbren S, and Zaff J. (1994). Personality disorder in young women with treated
phenylketonuria. Journal of Inherited Metabolic Disease; 17(5): 584-592.
- Walter JH, White FJ, Hall SK, et al. (2002). How practical are recommendations
for dietary control i n phenylketonuria? Lancet; 360: 55-57.
- Wendel U, Ullrich K, Schimdt H, and Batzler U. (1990) Six-year follow up of
phenylalanine intakes and plasma phenylalanine concentrations. European Journal
of Pediatrics; 149 (Suppl 1): S13-S16.
- White DA, Nortz MJ, Mandernach T, Huntington K, Steiner RD. (2002). Age-
related working memory impairments in children with prefrontal dysfunction
associated with phenylketonuria. Journal of the International Neuropsychological
Society; 8(1):1 – 11.
- WHO, (2009). Gaza Strip Initial Health Needs Assessment.
- WHO Collaboration Center on Obesity Prevention and Related Research and
Training, (2008). Protocols for measuring height and weight of adolescents. WHO,
Geneva.
84
- Williams RA, Mamotte CD, and Burnett JR. (2008). Phenylketonuria: an inborn
error of metabolism. Clinical Biochemistry Review; 29: 31-40.
- Williams K. (1998). Benefits of normalizing plasma phenylalanine: impact on
behavior and health – a case report. Journal of Inherited Metabolic Disease; 21(8):
785-790.
- www.ncbi.nlm.nih.gov. (accessed 4.1.2013)
- www.mayoclinic. Retrieved May 30, 2013.
- www. PubMedHealth.com. (accessed 3.1.2013)
- www.shs-nutrition.com/conditions/phenylketonuria-PKU. (accessed 2.1.2013)
- Van Calcar, SC., MacLeod, EL., Gleason, ST., Etzel, MR., Clayton, MK., Wolff,
JA., & Ney, D. (2009). Improved nutritional management of phenylketonuria by
using a diet containing glycomacropeptide compared with amino acids. American
Journal of Clinical Nutrition, 89, 1068-1077.
- Van Spronsen FJ, and Enns GM. (2010). Future treatment strategies in
phenylketonuria. Molecular Genetics and Metabolism; 99: 590-595.
- VanZutphen KH, Packman W, Sporri L, Needham M, Morgan C, et al., (2007).
Executive functioning in children and adolescents with phenylketonuria. Clinical
Genetics; 72(1):13-18.
- Viau, K. (2010). Correlation of age-specific phenylalanine levels on intellectual
outcomes in patients with phenylketonuria. Master Degree Thesis, Utah State
University, Logan, Utah, USA.
- Vlock, E.L. (2012). A pilot study on the attitudes of management practices in adults
with PKU. Master Degree Thesis. College of Education and Human Sciences,
University of Nebraska.
85
- Young, VR. (1994). Adult amino acid requirements: the case for a major revision in
current recommendations. Journal of Nutrition; 124(8 Suppl): 1517S-1523S.
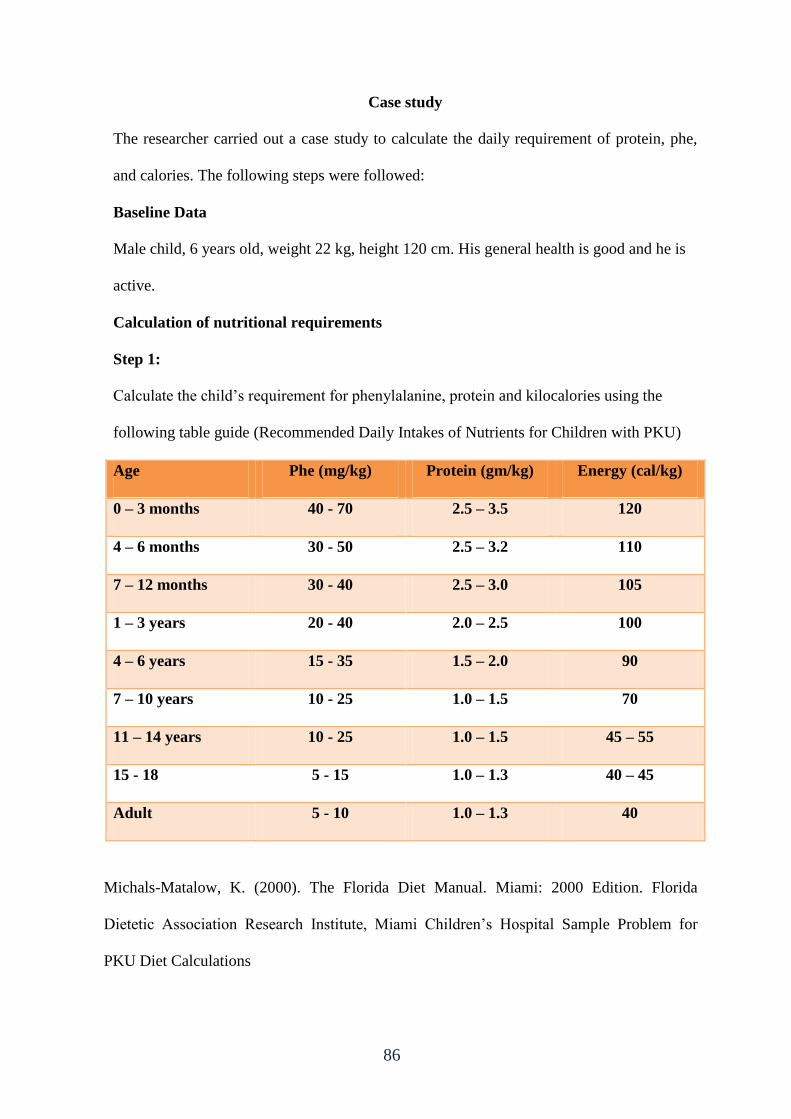
86
Case study
The researcher carried out a case study to calculate the daily requirement of protein, phe,
and calories. The following steps were followed:
Baseline Data
Male child, 6 years old, weight 22 kg, height 120 cm. His general health is good and he is
active.
Calculation of nutritional requirements
Step 1:
Calculate the child’s requirement for phenylalanine, protein and kilocalories using the
following table guide (Recommended Daily Intakes of Nutrients for Children with PKU)
Age Phe (mg/kg) Protein (gm/kg) Energy (cal/kg)
0 – 3 months 40 - 70 2.5 – 3.5 120
4 – 6 months 30 - 50 2.5 – 3.2 110
7 – 12 months 30 - 40 2.5 – 3.0 105
1 – 3 years 20 - 40 2.0 – 2.5 100
4 – 6 years 15 - 35 1.5 – 2.0 90
7 – 10 years 10 - 25 1.0 – 1.5 70
11 – 14 years 10 - 25 1.0 – 1.5 45 – 55
15 - 18 5 - 15 1.0 – 1.3 40 – 45
Adult 5 - 10 1.0 – 1.3 40
Michals-Matalow, K. (2000). The Florida Diet Manual. Miami: 2000 Edition. Florida
Dietetic Association Research Institute, Miami Children’s Hospital Sample Problem for
PKU Diet Calculations
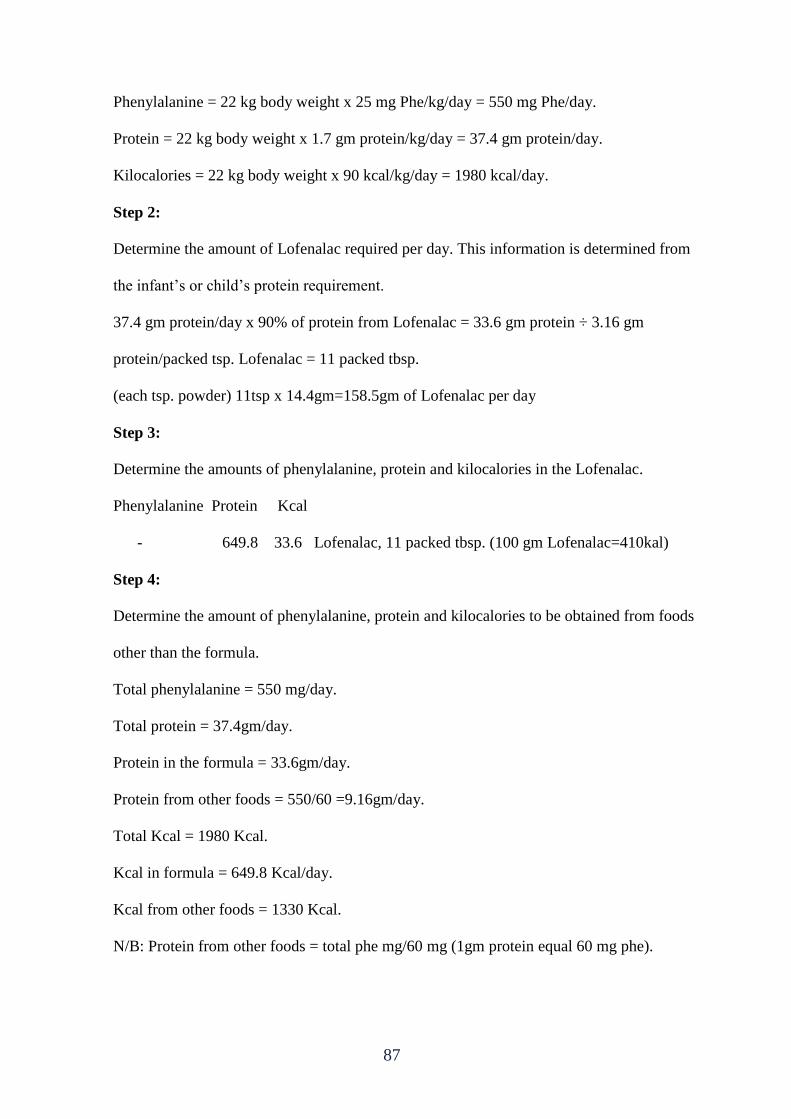
87
Phenylalanine = 22 kg body weight x 25 mg Phe/kg/day = 550 mg Phe/day.
Protein = 22 kg body weight x 1.7 gm protein/kg/day = 37.4 gm protein/day.
Kilocalories = 22 kg body weight x 90 kcal/kg/day = 1980 kcal/day.
Step 2:
Determine the amount of Lofenalac required per day. This information is determined from
the infant’s or child’s protein requirement.
37.4 gm protein/day x 90% of protein from Lofenalac = 33.6 gm protein ÷ 3.16 gm
protein/packed tsp. Lofenalac = 11 packed tbsp.
(each tsp. powder) 11tsp x 14.4gm=158.5gm of Lofenalac per day
Step 3:
Determine the amounts of phenylalanine, protein and kilocalories in the Lofenalac.
Phenylalanine Protein Kcal
- 649.8 33.6 Lofenalac, 11 packed tbsp. (100 gm Lofenalac=410kal)
Step 4:
Determine the amount of phenylalanine, protein and kilocalories to be obtained from foods
other than the formula.
Total phenylalanine = 550 mg/day.
Total protein = 37.4gm/day.
Protein in the formula = 33.6gm/day.
Protein from other foods = 550/60 =9.16gm/day.
Total Kcal = 1980 Kcal.
Kcal in formula = 649.8 Kcal/day.
Kcal from other foods = 1330 Kcal.
N/B: Protein from other foods = total phe mg/60 mg (1gm protein equal 60 mg phe).
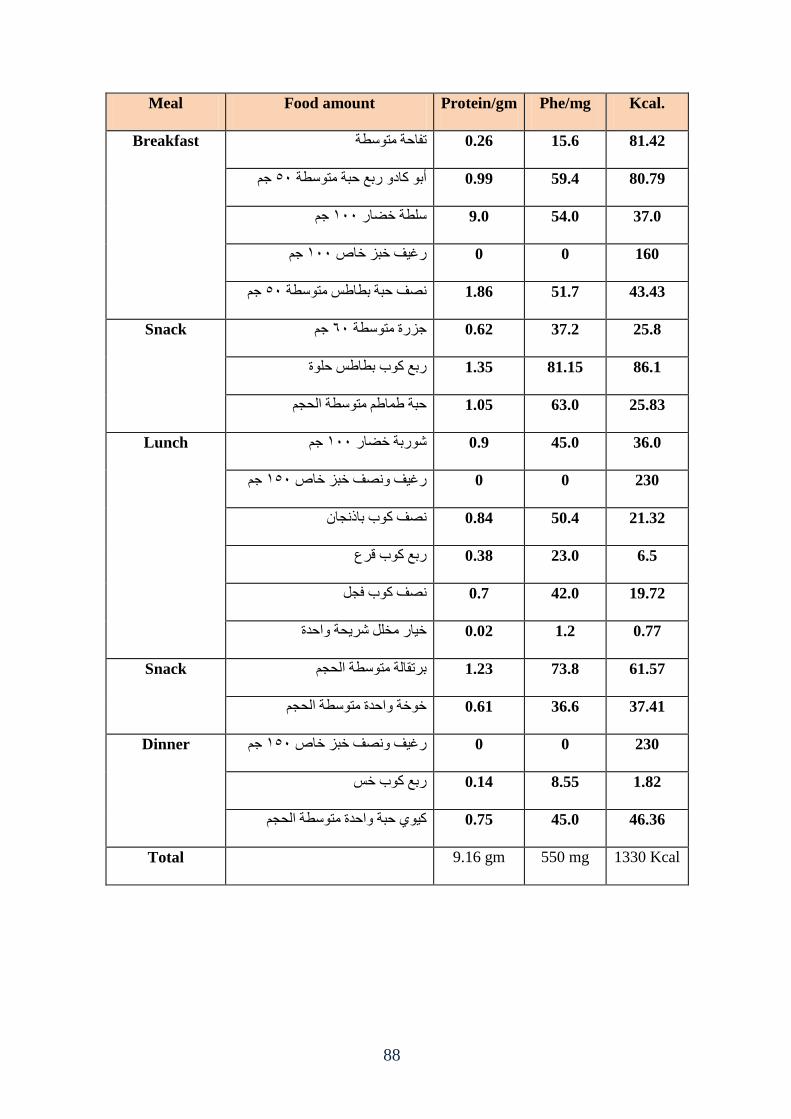
88
Meal Food amount Protein/gm Phe/mg Kcal.
Breakfast 81.42 15.6 0.26 ذفازح يرىقطح
خى 45أتى كاظو ؼتع زثح يرىقطح 0.99 59.4 80.79
خى 055قهطح ضضاؼ 9.0 54.0 37.0
خى 055ؼغف ضثؿ ضاص 0 0 160
خى 45ظف زثح تطاطف يرىقطح 1.86 51.7 43.43
Snack خى 55خؿؼج يرىقطح 0.62 37.2 25.8
86.1 81.15 1.35 ؼتع كىب تطاطف زهىج
25.83 63.0 1.05 زثح طاطى يرىقطح انسدى
Lunch خى 055شىؼتح ضضاؼ 0.9 45.0 36.0
خى 045ضثؿ ضاص وظف ؼغف 0 0 230
21.32 50.4 0.84 ظف كىب تاغدا
6.5 23.0 0.38 ؼتع كىب قؽع
19.72 42.0 0.7 ظف كىب فدم
يطهم شؽسح وازعجضاؼ 0.02 1.2 0.77
Snack 61.57 73.8 1.23 تؽذقانح يرىقطح انسدى
37.41 36.6 0.61 ضىضح وازعج يرىقطح انسدى
Dinner خى 045ؼغف وظف ضثؿ ضاص 0 0 230
1.82 8.55 0.14 ؼتع كىب ضف
46.36 45.0 0.75 كى زثح وازعج يرىقطح انسدى
Total 9.16 gm 550 mg 1330 Kcal

89
Annex (1)
Adherence to dietary regime questionnaire "English version"
(This part is designed for PKU patients)
A. Socio-demographic data
- Serial No. ………….. Date of birth …../ ……./ ……..
- Gender: _____________
- Age when PKU was discovered: __________
- Current age: ________.
- Birth weight: _________ kg.
- Current height: _________ cm.
- Phenylalanine level in the first screening: ________
- Current Phenylalanine level: ____________
- level of education: ___ primary ___ preparatory ___ secondary ___
- Academic achievement: ___ excellent ___ very good ___ good ___ poor
B. Dietary regime
1. Do you follow any diet therapy regime? yes ……… no ………
2. If yes, where do you receive the services?
MOH ( ) UNRWA ( ) Special center ( ) private clinic ( ) home made ( ).
3. Who provides the health care to the child?
Dietitian ( ) physician ( ) nurse ( ) nutritionist ( ) parents ( )
4. When you firstly start your diet restriction
a) When I was a baby
b) _______ years old
c) I have never restricted my diet
d) I do not know
5. How often do you follow your recommended daily protein restriction?
a) Everyday
b) Often – most days of the week
c) Sometimes
d) Rarely
e) Never
f) Only around the days that I test my phe level
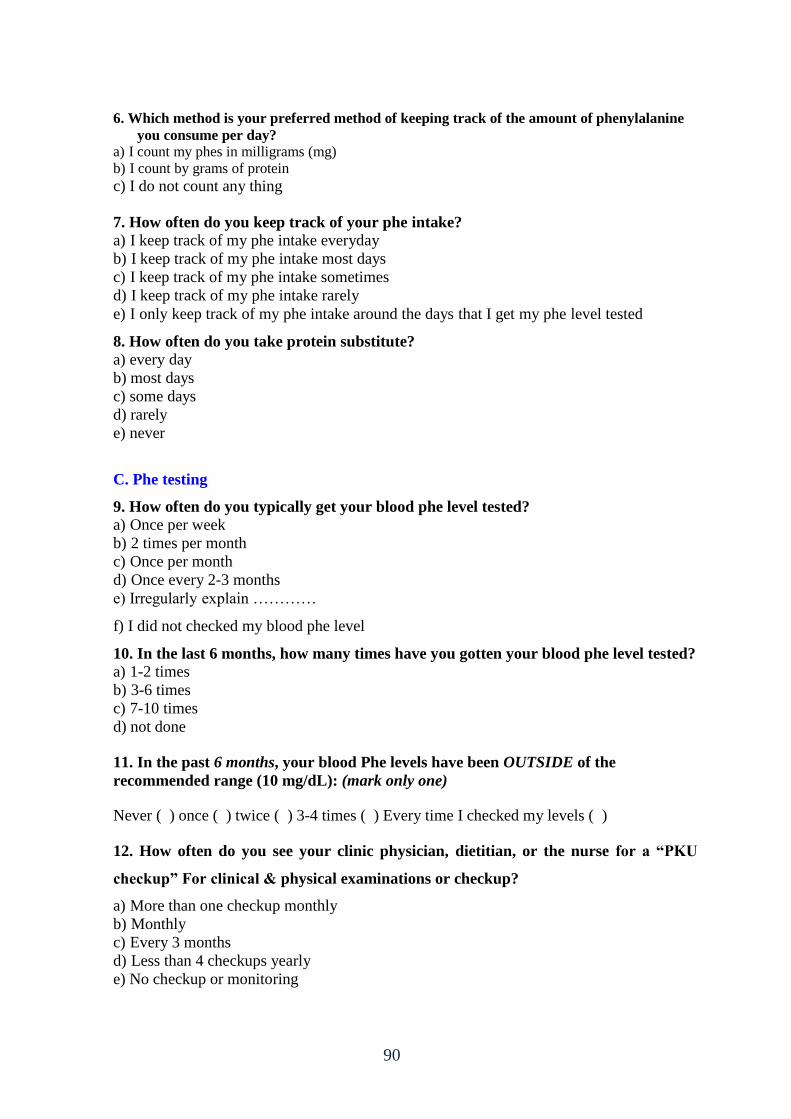
90
6. Which method is your preferred method of keeping track of the amount of phenylalanine
you consume per day?
a) I count my phes in milligrams (mg)
b) I count by grams of protein
c) I do not count any thing
7. How often do you keep track of your phe intake?
a) I keep track of my phe intake everyday
b) I keep track of my phe intake most days
c) I keep track of my phe intake sometimes
d) I keep track of my phe intake rarely
e) I only keep track of my phe intake around the days that I get my phe level tested
8. How often do you take protein substitute?
a) every day
b) most days
c) some days
d) rarely
e) never
C. Phe testing
9. How often do you typically get your blood phe level tested?
a) Once per week
b) 2 times per month
c) Once per month
d) Once every 2-3 months
e) Irregularly explain …………
f) I did not checked my blood phe level
10. In the last 6 months, how many times have you gotten your blood phe level tested?
a) 1-2 times
b) 3-6 times
c) 7-10 times
d) not done
11. In the past 6 months, your blood Phe levels have been OUTSIDE of the
recommended range (10 mg/dL): (mark only one)
Never ( ) once ( ) twice ( ) 3-4 times ( ) Every time I checked my levels ( )
12. How often do you see your clinic physician, dietitian, or the nurse for a “PKU
checkup” For clinical & physical examinations or checkup?
a) More than one checkup monthly
b) Monthly
c) Every 3 months
d) Less than 4 checkups yearly
e) No checkup or monitoring
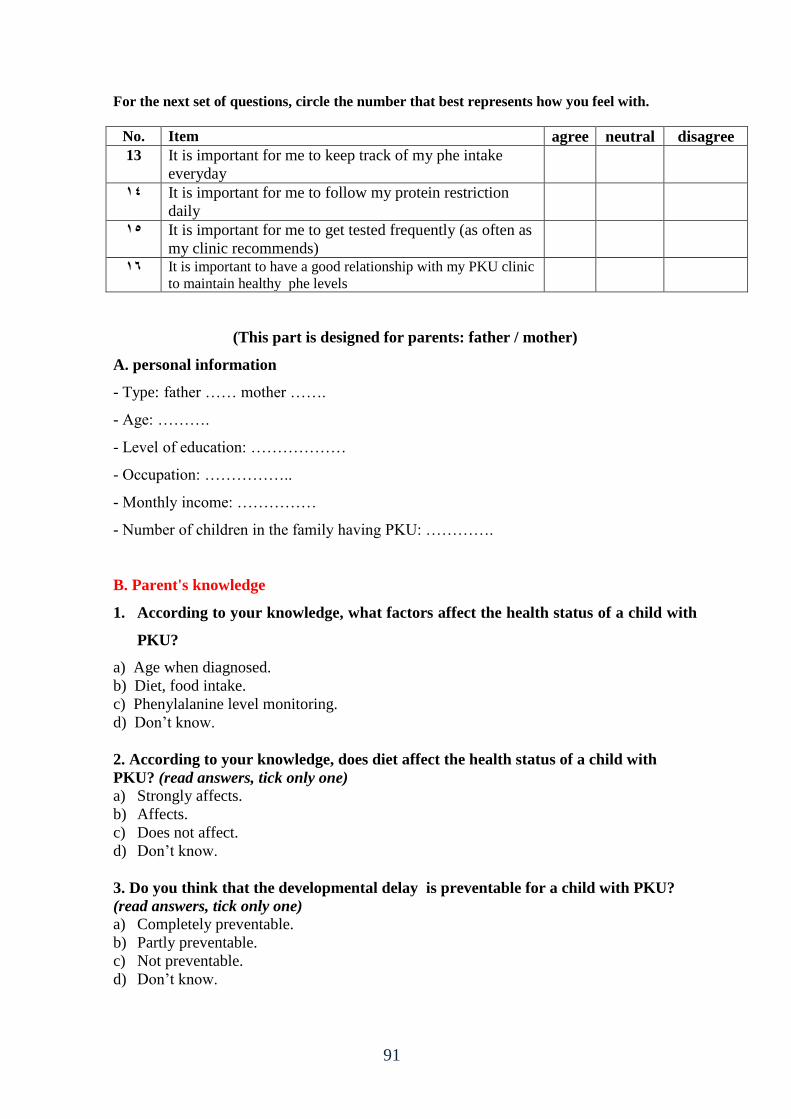
91
For the next set of questions, circle the number that best represents how you feel with.
No. Item agree neutral disagree
13 It is important for me to keep track of my phe intake
everyday
44 It is important for me to follow my protein restriction
daily
45 It is important for me to get tested frequently (as often as
my clinic recommends)
46 It is important to have a good relationship with my PKU clinic
to maintain healthy phe levels
(This part is designed for parents: father / mother)
A. personal information
- Type: father …… mother …….
- Age: ……….
- Level of education: ………………
- Occupation: ……………..
- Monthly income: ……………
- Number of children in the family having PKU: ………….
B. Parent's knowledge
1. According to your knowledge, what factors affect the health status of a child with
PKU?
a) Age when diagnosed.
b) Diet, food intake.
c) Phenylalanine level monitoring.
d) Don’t know.
2. According to your knowledge, does diet affect the health status of a child with
PKU? (read answers, tick only one)
a) Strongly affects.
b) Affects.
c) Does not affect.
d) Don’t know.
3. Do you think that the developmental delay is preventable for a child with PKU?
(read answers, tick only one)
a) Completely preventable.
b) Partly preventable.
c) Not preventable.
d) Don’t know.
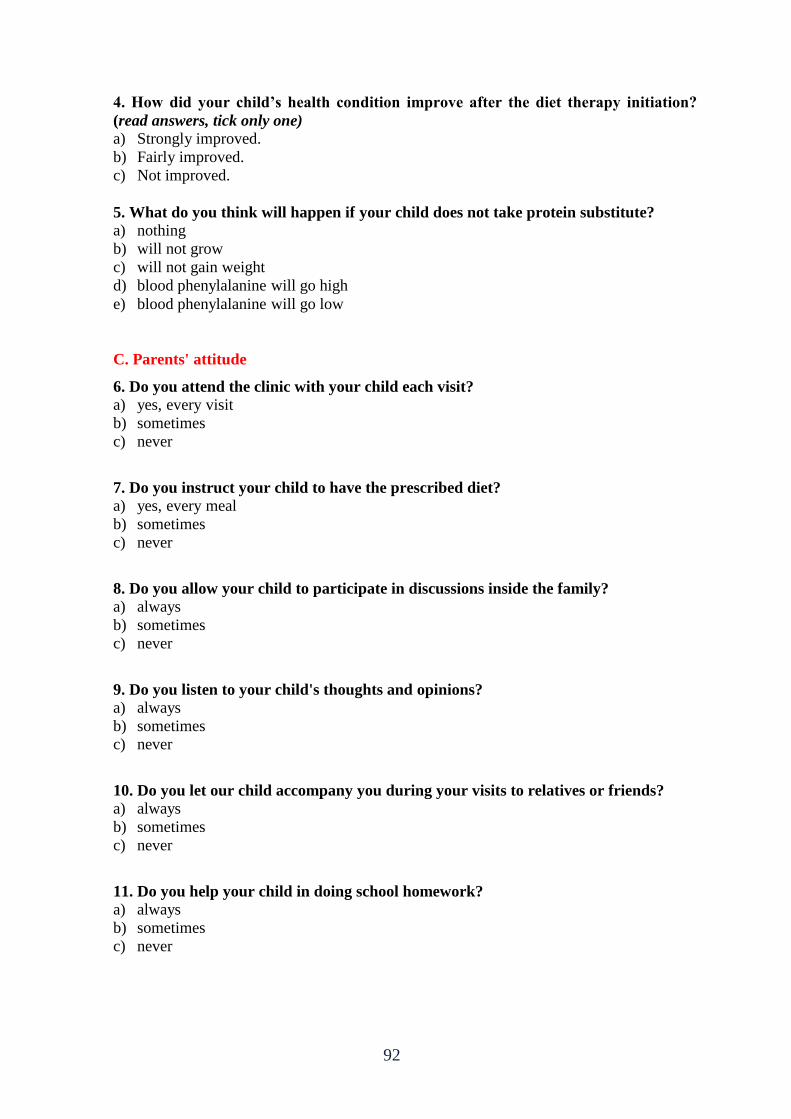
92
4. How did your child’s health condition improve after the diet therapy initiation?
(read answers, tick only one)
a) Strongly improved.
b) Fairly improved.
c) Not improved.
5. What do you think will happen if your child does not take protein substitute?
a) nothing
b) will not grow
c) will not gain weight
d) blood phenylalanine will go high
e) blood phenylalanine will go low
C. Parents' attitude
6. Do you attend the clinic with your child each visit?
a) yes, every visit
b) sometimes
c) never
7. Do you instruct your child to have the prescribed diet?
a) yes, every meal
b) sometimes
c) never
8. Do you allow your child to participate in discussions inside the family?
a) always
b) sometimes
c) never
9. Do you listen to your child's thoughts and opinions?
a) always
b) sometimes
c) never
10. Do you let our child accompany you during your visits to relatives or friends?
a) always
b) sometimes
c) never
11. Do you help your child in doing school homework?
a) always
b) sometimes
c) never
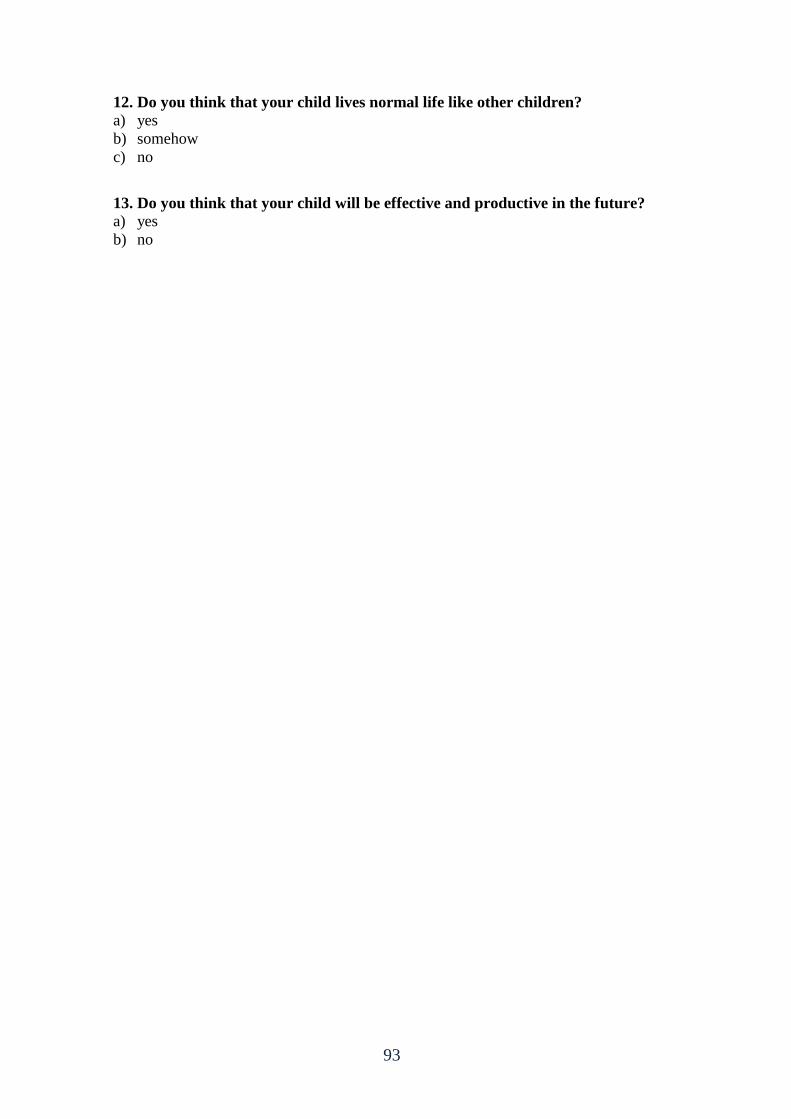
93
12. Do you think that your child lives normal life like other children?
a) yes
b) somehow
c) no
13. Do you think that your child will be effective and productive in the future?
a) yes
b) no

94
Annex (2)
استبانة لقياس مدى التزام مرضى الفينيمكيتونيوريا بنظام الحمية الغذائية " نسخة خاصة بمرضى الفينيمكيتونيوريا" )نسخة عربية(
بسم الله الرحمن الرحيم
الأخ الكريم.....الأخت الكريمة....حفظك الله ,,, عميكم ورحمة الله وبركاتوالسلام الاكمينيكية في كمية التغذية في برنامج ماجستير طالب عصفور حمودمأكرم ثأنا الباح
:أقوم بدراسة بحثية حول الصيدلة بجامعة الأزىر,الذين يعانون من طفالعند الأ نين في الدممستويات الفنيلالا عمي الغذائي الالتزامأثر
.سنة في قطاع غزة 88-6في عمر االفينيمكيتونيوريمرض
وأن أي ونعممكم بأن المشاركة طوعية نشكركم عمي موافقتكم المشاركة في ىذه الدراسة, بيانات أو معمومات, ستكون سرية.
بعض المشاكل الصحية عند في ىذه الدراسة ستساىم في التعرف عمي كمشاركت .الأطفال
/ أكرم محمود عصفورباحثال

95
الاجخواعت والذوغشافت البااثأولا:
…… /.…… /..… ذاؼص انلاظ ..………… .انؽقى انركهكه -
الجنس: ........ ذكر ....... أنثى -
العمر عند اكتشاف المرض: ........ سنة -
العمر الحالي: .......... سنة -
الوزن: .......... كيموجرام -
.......... كيموجرام :الوزن عند الولادة -
الطول: .......... سم. -
مستوى الفينلانين في الدم عند أول فحص: -
مستوى الفينلانين حاليا: -
المستوى التعميمي: .... ابتدائي .... إعدادي .... ثانوي .... -
مستوى التحصيل الدراسي: .... ممتاز .... جيد جدا .... جيد .... ضعيف -
الغزائ لظاماثاا:
..........غزائ ؟ عن ........... لاعلاج ظام أي حخبع ل -4
ز الخزهت؟ فأي حخلقى را ماج الاجابت بعنإ -2
) ( تر ( ) عاظج ضاطح ( ) يؽكؿ ضاص ( ) انىكانح ) ( وؾاؼج انظسح
هي الزي ضودك بالخذهاث الصحت لطفلل؟ -3
الاهم ( ) ف انرغػحانرطظض ( ) انؽع ( ) انطثة ( )
هخ بذأث ظام الحوت الخاص بل؟ -4
طفلا أ.ععيا كد
._______ قح -ب
زح اذثع نى كثق ن أج.
ظ. لا اظؼ
كيف تتبع التوصيات بالحد من البروتينات في الطعام؟ -5
لا أتبع التوصيات أبدا ىـ. د. نادرا ج. أحيانا معظم أيام الأسبوعب. كل يوم . أ
و. فقط في الأيام التي أعمل بيا تحاليل دم لقياس مستوى الفينلانين
ما هي الطريقة المفضمة لديك لمحفاظ عمى كمية الفينلانين التي تتناولها يوميا؟ -6 أقوم بحساب كمية الفينلانين بالمميجرام . أ
بالجرامأقوم بحساب كمية البروتينات ب.

96
ج. لا أقوم بحساب أي شيء
كيف تحافظ عمى كمية الفينلانين التي تتناولها؟ -7 كل يوم / دائما . أ
معظم الأيامب.
ج. أحيانا د. نادرا
ىـ. فقط عندما أرغب بعمل تحاليل دم لقياس مستوى الفينلانين
كم مرة تتناول بدائل البروتينات؟ -8 كل يوم . أ
الأياممعظم ب.
ج. بعض الأيام / أحيانا د. نادرا
ىـ. لا أتناول بدائل البروتينات نيائيا
ححلل الحوض الاه ف الذمثالثا:
في العادة، كم مرة تقوم بعمل تحاليل دم لقياس مستوى الفينلانين؟-9 .2
مرة كل أسبوع . أ مرتان في الشير . ب
ج. مرة واحدة في الشير شيور 3 – 2د. مرة كل
غير ذلك )حدد( ............. ىـ.
؟في الستة شهور الأخيرة، كم مرة قمت بقياس مستوى الفينلانين في الدم-81 .3 مرة أو مرتان . أ
مرات 6 – 3 . ب
مرات 01 – 7ج. د. ولا مرة
mg/dL 81به ىلحمض الاميني في الدم الحد الموصفي الستة اشهر الاخيرة هل تجاوز مستوي ا -88
(اجابة واحدة فقطاختر )
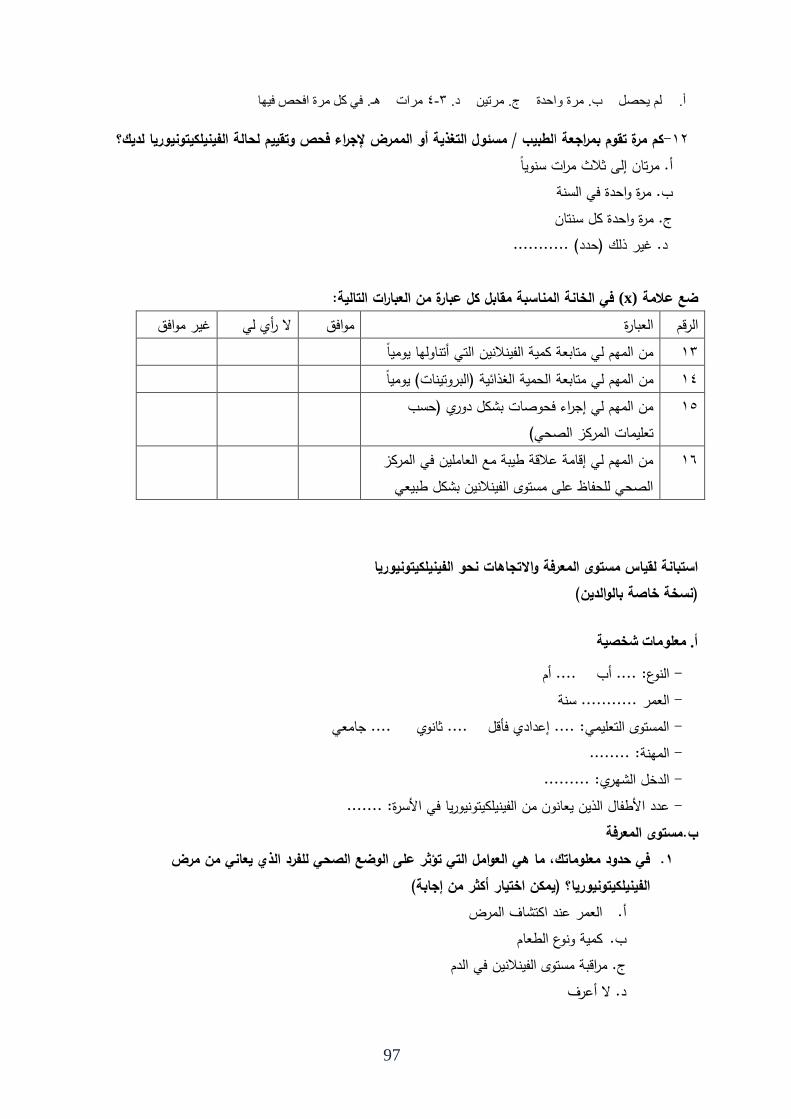
97
ف كم يؽج افسض فها. هـ مرات 4-3د. مرتين ج. واحدة مرةب. لم يحصل . أ
؟الفينيمكيتونيوريا لديك لطبيب / مسئول التغذية أو الممرض لإجراء فحص وتقييم لحالةا كم مرة تقوم بمراجعة-02
أ. مرتان إلى ثلاث مرات سنويا مرة واحدة في السنة ب.
ج. مرة واحدة كل سنتان د. غير ذلك )حدد( ...........
في الخانة المناسبة مقابل كل عبارة من العبارات التالية: (x)ضع علامة
غير موافق لا رأي لي موافق العبارة الرقم التي أتناوليا يوميا من الميم لي متابعة كمية الفينلانين 03 من الميم لي متابعة الحمية الغذائية )البروتينات( يوميا 04من الميم لي إجراء فحوصات بشكل دوري )حسب 05
تعميمات المركز الصحي(
من الميم لي إقامة علاقة طيبة مع العاممين في المركز 06 الصحي لمحفاظ عمى مستوى الفينلانين بشكل طبيعي
استبانة لقياس مستوى المعرفة والاتجاهات نحو الفينيمكيتونيوريا (الوالدين)نسخة خاصة ب
أ. هعلوهاث شخصت
النوع: .... أب .... أم - العمر ........... سنة - المستوى التعميمي: .... إعدادي فأقل .... ثانوي .... جامعي - المينة: ........ - الدخل الشيري: ......... - عدد الأطفال الذين يعانون من الفينيمكيتونيوريا في الأسرة: ....... - مستوى المعرفة.ب
في حدود معموماتك، ما هي العوامل التي تؤثر عمى الوضع الصحي لمفرد الذي يعاني من مرض .8 الفينيمكيتونيوريا؟ )يمكن اختيار أكثر من إجابة(
اكتشاف المرضالعمر عند . أ كمية ونوع الطعام . ب
ج. مراقبة مستوى الفينلانين في الدم د. لا أعرف

98
في حدود معموماتك، هل يؤثر نظام الغذاء عمى صحة مريض الفينيمكيتونيوريا؟ )اختر إجابة واحدة فقط( .2
يؤثر بشدة . أ يؤثر . ب
ج. لا يؤثر د. لا أعرف
الفينيمكيتونيوريا؟ )اختر إجابة واحدة فقط( هل تعتقد أنه يمكن تفادي التأخر في النمو لدى مريض .3
يمكن تفادي ذلك بشكل كمي . أ يمكن تفادي ذلك بشكل جزئي . ب
ج. لا يمكن تفادي ذلك د. لا أعرف
كيف تحسنت الحالة الصحية لابنك / ابنتك بعد إتباع نظام الحمية الغذائية؟ )اختر إجابة واحدة فقط( .4
تحسنت بشكل ممتاز . أ تحسنت بشكل بسيط . ب
يطرأ أي تحسن ج. لم
ما الذي يمكن أن يحدث لو لم يتناول ابنك / ابنتك بدائل البروتينات؟ .5 لا شيء . أ
تأخر في النمو . ب
ج. نقص في الوزن د. سيرتفع مستوى الفينلانين في الدم
ىـ. سينخفض مستوى الفينلانين في الدم
الاتجاهاتج. ؟هل تقوم بمرافقة ابنك / ابنتك عند ذهابه لممركز الصحي .6
نعم, في كل زيارة . أ أحيانا, في بعض الزيارات . ب
ج. لا اذىب معو أبدا
هل تقوم بإعطاء ابنك / ابنتك توجيهات لإتباع نظام الحمية الغذائية المحدد؟ .7 نعم, كل وجبة . أ

99
أحيانا, في بعض الوجبات . ب
ج. لا أعطي أي توجييات أبدا
ث داخل الأسرة؟هل تسمح لابنك / ابنتك بالمشاركة في النقاشات التي تحد .8 دائما . أ
أحيانا . ب
ج. أبدا
هل تستمع لأفكار وآراء ابنك / ابنتك؟ .9 دائما . أ
أحيانا . ب
ج. أبدا
؟هل تسمح لابنك / ابنتك بمرافقتك عند زيارة الأقارب أو الأصدقاء .01 دائما . أ
أحيانا . ب
ج. أبدا
هل تساعد ابنك / ابنتك في أداء الواجبات المدرسية / الدراسة؟ .88 دائما . أ
أحيانا . ب
ج. أبدا
؟هل تعتقد أن ابنك / ابنتك يعيش حياة عادية مثل الآخرين .02 نعم . أ
نوعا ما . ب
ج. لا ؟هل تعتقد أن ابنك / ابنتك سيكون فردا فعال ومنتج في المستقبل .03
نعم . أ لا . ب
شكرا علي المشاركة
100
Annex (3)
Panel of expertise
Dr. Jehad Al-Hesy
Dr. Sameer Radi
Dr. Ihab Al Masrey
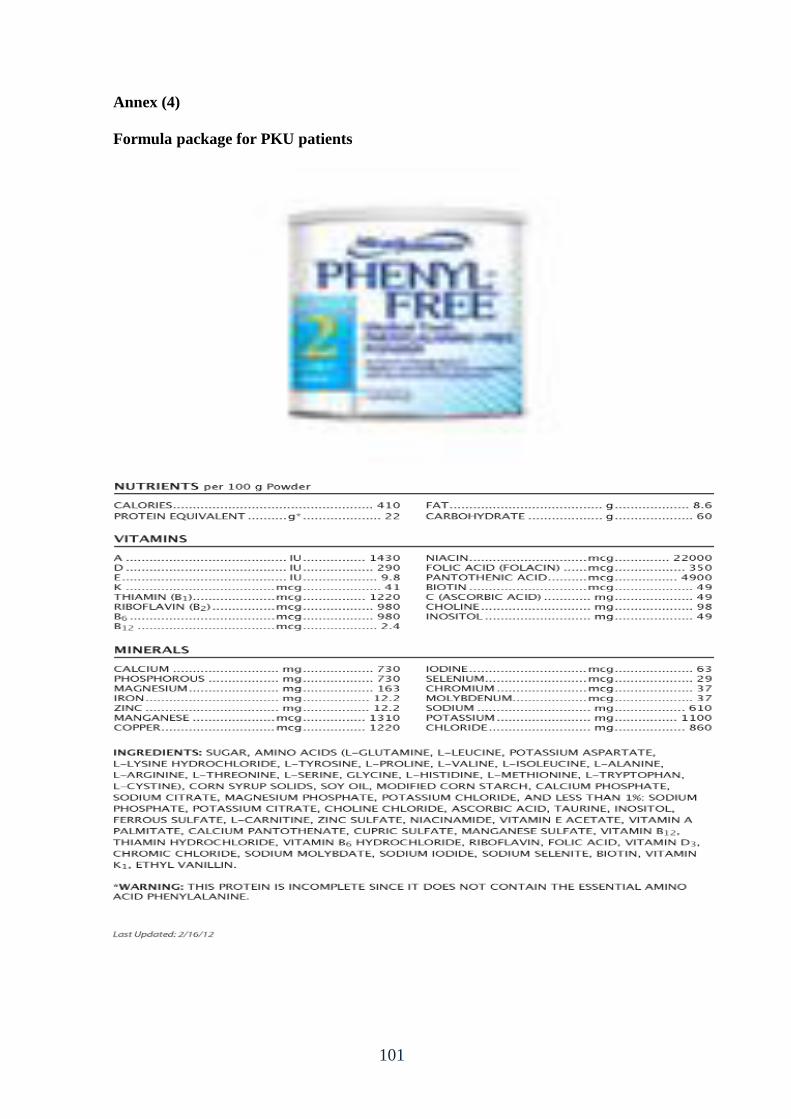
101
Annex (4)
Formula package for PKU patients
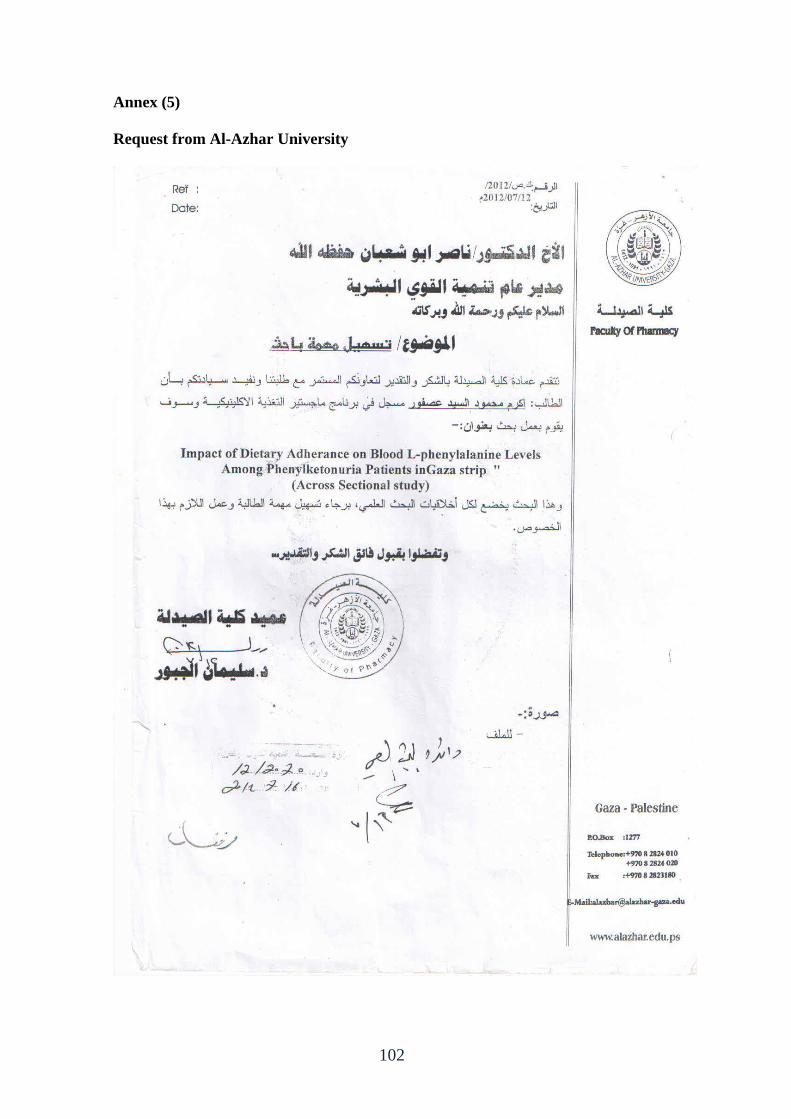
102
Annex (5)
Request from Al-Azhar University
103
Annex (6)
Approval letter from Directorate General of Human Resources Development - MOH
104
Annex (7)
Approval letter from Helsinki Committee
105
Annex (8)
MOH format for meals
106
Annex (9)
Filter paper for PKU testing
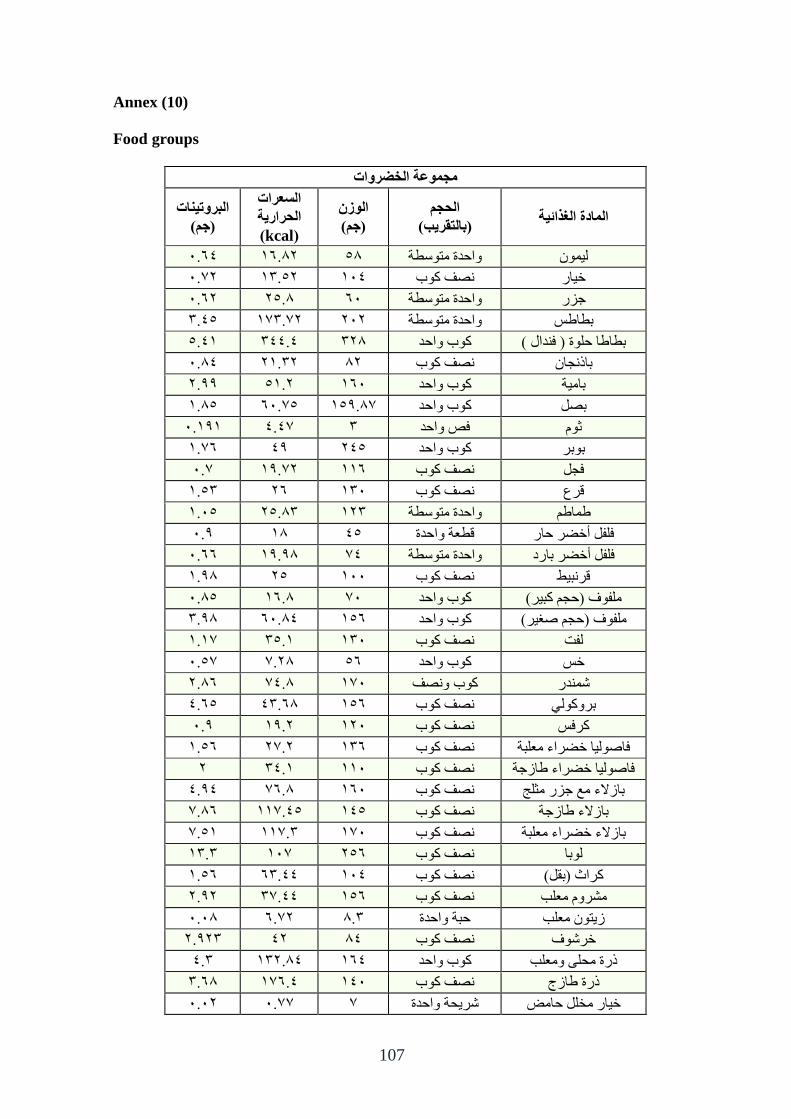
107
Annex (10)
Food groups
هجووعت الخضشواث
الوادة الغزائت الحجن
)بالخقشب(
الوصى
)جن(
السعشاث
الحشاست
(kcal)
البشوحاث
)جن(
5.53 05.51 45 وازعج يرىقطح نى
1..5 02.41 053 ظف كىب ضاؼ
5.51 14.5 55 وازعج يرىقطح خؿؼ
2.34 1..0.2 151 وازعج يرىقطح تطاطف
4.30 233.3 215 كىب وازع تطاطا زهىج ) فعال (
5.53 10.21 51 ظف كىب تاغدا
1.22 40.1 055 كىب وازع تايح
0.54 4..55 .042.5 كىب وازع تظم
5.020 .3.3 2 فض وازع ثىو
5..0 32 134 كىب وازع تىتؽ
..5 1..02 005 ظف كىب فدم
0.42 15 025 ظف كىب قؽع
0.54 14.52 012 وازعج يرىقطح طاطى
5.2 05 34 قطعح وازعج فهفم أضضؽ زاؼ
5.55 02.25 3. وازعج يرىقطح فهفم أضضؽ تاؼظ
0.25 14 055 ظف كىب قؽثظ
5.54 05.5 5. كىب وازع يهفىف )زدى كثؽ(
2.25 55.53 045 كىب وازع يهفىف )زدى طغؽ(
.0.0 24.0 025 ظف كىب نفد
.5.4 15.. 45 كىب وازع ضف
1.55 3.5. 0.5 وظفكىب شعؼ
3.54 32.55 045 ظف كىب تؽوكىن
5.2 02.1 015 ظف كىب كؽفف
0.45 1..1 025 ظف كىب فاطىنا ضضؽاء يعهثح
1 23.0 005 ظف كىب فاطىنا ضضؽاء طاؾخح
3.23 5.5. 055 ظف كىب تاؾلاء يع خؿؼ يثهح
55.. 34..00 034 ظف كىب تاؾلاء طاؾخح
40.. 2..00 0.5 ظف كىب يعهثحتاؾلاء ضضؽاء
02.2 .05 145 ظف كىب نىتا
0.45 52.33 053 ظف كىب كؽاز )تقم(
1.21 33..2 045 ظف كىب يشؽوو يعهة
5.55 1..5 5.2 زثح وازعج ؾرى يعهة
1.212 31 53 ظف كىب ضؽشىف
3.2 021.53 053 كىب وازع غؼج يسه ويعهة
2.55 0.5.3 035 ظف كىب غؼج طاؾج
5.51 ...5 . شؽسح وازعج ضاؼ يطهم زايغ
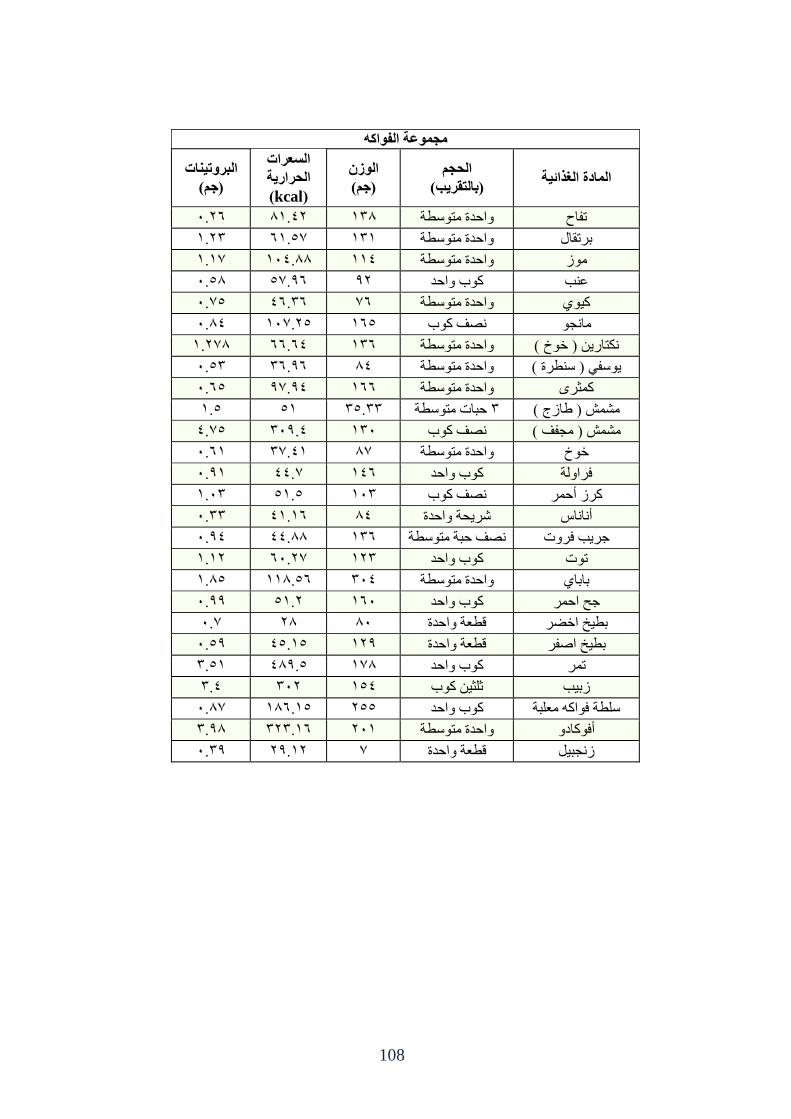
108
هجووعت الفوام
الوادة الغزائت الحجن
)بالخقشب(
الوصى
)جن(
السعشاث
الحشاست
(kcal)
البشوحاث
)جن(
5.15 50.31 025 وازعج يرىقطح ذفاذ
0.12 .50.4 020 وازعج يرىقطح تؽذقال
.0.0 053.55 003 وازعج يرىقطح يىؾ
5.45 25..4 21 كىب وازع عة
4..5 35.25 5. وازعج يرىقطح كى
5.53 14..05 054 ظف كىب يادى
0.1.5 55.53 025 وازعج يرىقطح كراؼ ) ضىش (
5.42 25.25 53 وازعج يرىقطح ىقف ) قطؽج (
5.54 23..2 055 وازعج يرىقطح كثؽي
0.4 40 24.22 زثاخ يرىقطح 2 يشش ) طاؾج (
4..3 252.3 025 ظف كىب يشش ) يدفف (
5.50 30..2 .5 وازعج يرىقطح ضىش
5.20 ..33 035 كىب وازع فؽاونح
0.52 40.4 052 ظف كىب كؽؾ أزؽ
5.22 30.05 53 شؽسح وازعج أااـ
5.23 33.55 025 ظف زثح يرىقطح خؽة فؽوخ
0.01 .55.1 012 كىب وازع ذىخ
0.54 005.45 253 وازعج يرىقطح تاتا
5.22 40.1 055 كىب وازع خر ازؽ
..5 15 55 قطعح وازعج تطص اضضؽ
5.42 34.04 012 قطعح وازعج تطص اطفؽ
2.40 352.4 0.5 كىب وازع ذؽ
2.3 251 043 ثهث كىب ؾتة
.5.5 055.04 144 كىب وازع قهطح فىاكه يعهثح
2.25 212.05 150 وازعج يرىقطح أفىكاظو
5.22 12.01 . قطعح وازعج ؾدثم
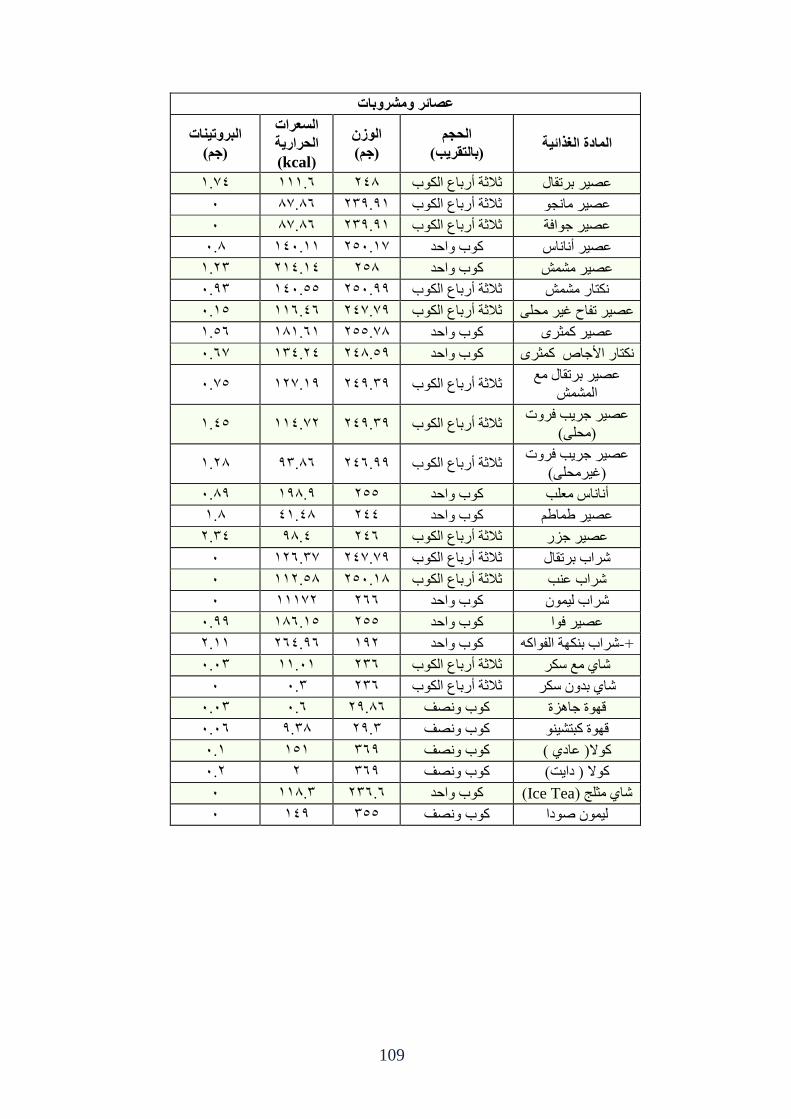
109
عصائش وهششوباث
الوادة الغزائت الحجن
)بالخقشب(
الوصى
)جن(
السعشاث
الحشاست
(kcal)
البشوحاث
)جن(
3..0 000.5 135 ثلاثح أؼتاع انكىب عظؽ تؽذقال
5 55..5 122.20 ثلاثح أؼتاع انكىب عظؽ يادى
5 55..5 122.20 ثلاثح أؼتاع انكىب عظؽ خىافح
5.5 035.00 .145.0 كىب وازع عظؽ أااـ
0.12 103.03 145 كىب وازع عظؽ يشش
5.22 035.44 145.22 ثلاثح أؼتاع انكىب كراؼ يشش
5.04 005.35 2...13 ثلاثح أؼتاع انكىب عظؽ ذفاذ غؽ يسه
0.45 050.50 5..144 كىب وازع عظؽ كثؽي
.5.5 023.13 135.42 كىب وازع كراؼ الأخاص كثؽي
عظؽ تؽذقال يع
انشش 4..5 02..01 132.22 ثلاثح أؼتاع انكىب
عظؽ خؽة فؽوخ
)يسه( 0.34 1..003 132.22 ثلاثح أؼتاع انكىب
عظؽ خؽة فؽوخ
)غؽيسه( 0.15 22.55 135.22 ثلاثح أؼتاع انكىب
5.52 025.2 144 وازعكىب أااـ يعهة
0.5 30.35 133 كىب وازع عظؽ طاطى
1.23 25.3 135 ثلاثح أؼتاع انكىب عظؽ خؿؼ
5 .015.2 2...13 ثلاثح أؼتاع انكىب شؽاب تؽذقال
5 001.45 145.05 ثلاثح أؼتاع انكىب شؽاب عة
5 000.1 155 كىب وازع شؽاب نى
5.22 055.04 144 كىب وازع عظؽ فىا
1.00 153.25 021 كىب وازع شؽاب تكهح انفىاكه-+
5.52 00.50 125 ثلاثح أؼتاع انكىب شا يع قكؽ
5 5.2 125 ثلاثح أؼتاع انكىب شا تعو قكؽ
5.52 5.5 12.55 كىب وظف قهىج خاهؿج
5.55 2.25 12.2 كىب وظف قهىج كثرشى
5.0 040 252 كىب وظف كىلا) عاظ (
5.1 1 252 كىب وظف كىلا ) ظاد(
5 005.2 125.5 كىب وازع (Ice Teaشا يثهح )
5 032 244 كىب وظف نى طىظا
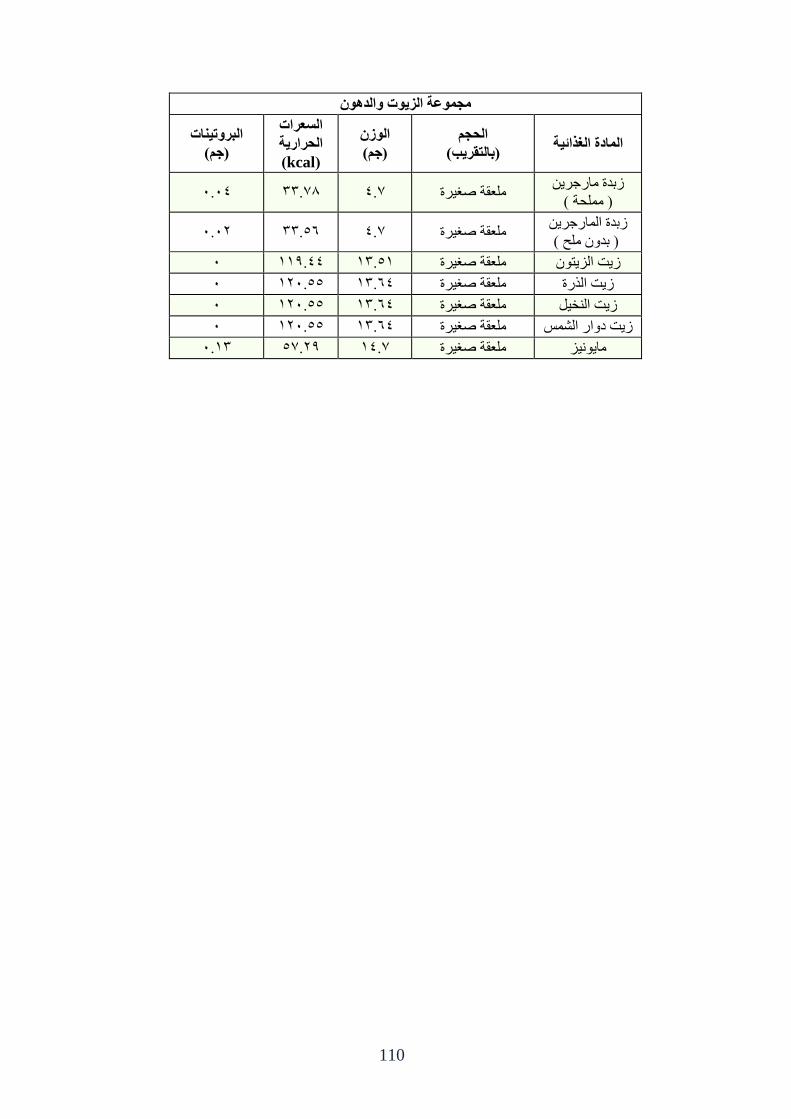
110
هجووعت الضوث والذوى
الوادة الغزائت الحجن
)بالخقشب(
الوصى
)جن(
السعشاث
الحشاست
(kcal)
البشوحاث
)جن(
ؾتعج ياؼخؽ
) يهسح ( 5.53 5..22 ..3 يهعقح طغؽج
ؾتعج اناؼخؽ
) تعو يهر ( 5.51 22.45 ..3 يهعقح طغؽج
5 002.33 02.40 يهعقح طغؽج ؾد انؿرى
5 015.44 02.53 يهعقح طغؽج ؾد انػؼج
5 015.44 02.53 يهعقح طغؽج ؾد انطم
5 015.44 02.53 يهعقح طغؽج ؾد ظواؼ انشف
5.02 12..4 ..03 يهعقح طغؽج ياىؿ