Embed Size (px)
Citation preview

UNLV Theses, Dissertations, Professional Papers, and Capstones
5-2011
Impact of design cost on project performance of design bid build Impact of design cost on project performance of design bid build
projects projects
Nirajan Mani University of Nevada, Las Vegas
Follow this and additional works at: https://digitalscholarship.unlv.edu/thesesdissertations
Part of the Civil Engineering Commons, and the Construction Engineering and Management
Commons
Repository Citation Repository Citation Mani, Nirajan, "Impact of design cost on project performance of design bid build projects" (2011). UNLV Theses, Dissertations, Professional Papers, and Capstones. 998. http://dx.doi.org/10.34917/2339665
This Thesis is protected by copyright and/or related rights. It has been brought to you by Digital Scholarship@UNLV with permission from the rights-holder(s). You are free to use this Thesis in any way that is permitted by the copyright and related rights legislation that applies to your use. For other uses you need to obtain permission from the rights-holder(s) directly, unless additional rights are indicated by a Creative Commons license in the record and/or on the work itself. This Thesis has been accepted for inclusion in UNLV Theses, Dissertations, Professional Papers, and Capstones by an authorized administrator of Digital Scholarship@UNLV. For more information, please contact [email protected].

IMPACT OF DESIGN COST ON PROJECT PERFORMANCE OF DESIGN BID
BUILD PROJECTS
by
Nirajan Mani
Bachelor’s Degree in Civil Engineering
Tribhuvan University, Nepal
2006
A thesis submitted in partial fulfillment
of the requirements for the
Master of Science in Construction Management
Construction Management Program
Howard R. Hughes College of Engineering
Graduate College
University of Nevada, Las Vegas
May 2011

.
Copyright by Nirajan Mani 2011
All Rights Reserved

THE GRADUATE COLLEGE
We recommend the thesis prepared under our supervision by
Nirajan Mani
entitled
Impact of Design Cost on Project Performance of Design Bid Build
Projects
be accepted in partial fulfillment of the requirements for the degree of
Master of Science in Construction Management
Pramen P. Shrestha, Committee Chair
David R. Shields, Committee Member
Neil D. Opfer, Committee Member
Nancy N. Menzel, Graduate Faculty Representative
Ronald Smith, Ph. D., Vice President for Research and Graduate Studies
and Dean of the Graduate College
May 2011

iii
ABSTRACT
Impact of Design Cost on Project Performance of Design Bid Build Projects
by
Nirajan Mani
Dr. Pramen P. Shrestha, Examination Committee Chair
Assistant Professor, Construction Management Program
University of Nevada, Las Vegas
The majority of public projects in the United States are procured and constructed by
state or local governments using the design-bid-build (DBB) project delivery method. In
the DBB method, the detailed design is completed by a design firm, then, a contractor
builds the project according to the plans and specifications prepared by the design firm.
Some studies show that a project’s performance depends upon the quality of the design.
If the errors in a design are minimized, the construction cost and schedule growth of the
project also will be minimized.
This study analyzed data from Clark County, Nevada public works projects to
determine the impact of design cost on construction cost and schedule growth. The
sample included projects completed between 1992 and 2007 and over $ 803 million in
construction value, converted to 2010 base cost. The correlation among design cost with
other parameters, such as construction cost growth, construction schedule growth, total
cost growth, and contract award cost growth, were determined. The correlation between
basic design cost and total cost growth for Clark County road projects was found to be
0.29, which was statistically significant at alpha level 0.05. The correlation was negative.
This investigation revealed that the higher the cost expended in the design, the lower the
total cost growth. A regression model was developed to predict the final construction cost

iv
of the projects using the design cost as an input variable. The R-square value of Clark
County road projects’ model was found to be 62.30%.

v
ACKNOWLEDGEMENTS
First of all, I especially want to thank my supervisor, Dr. Pramen P. Shrestha, for his
guidance and support throughout my thesis research and study at University of Nevada,
Las Vegas. He was always accessible and willing to help his students with their research.
His inspiration, proper advice, good teaching and company, made it easier for me to
complete this thesis.
I owe my deepest gratitude to our Department Chair and a member of my advisory
committee, Dr. David R. Shields, for his kindly support throughout my study. I would
like to thank to Prof. Neil Opfer for his support during my degree program. I would like
to show my gratitude to Dr. Nancy Menzel for being a part of my committee as the
Graduate College Representative.
Additionally, I would like to thank the staffs of the Design and Construction
Divisions of Clark County Public Works Department, Clark County, Nevada for
providing data. I would also like to thank Texas Department of Transportation for
providing data. My deepest gratitude goes to Mrs. Julie Longo, Technical Writer, Howard
R. Hughes, College of Engineering, UNLV, for helping me with my write-ups and
providing valuable suggestions for this thesis.

vi
TABLE OF CONTENTS
ABSTRACT ....................................................................................................................... iii
ACKNOWLEDGEMENT .................................................................................................. v
LIST OF FIGURES ........................................................................................................... ix
LIST OF TABLES ............................................................................................................. xi
CHAPTER 1 INTRODUCTION ........................................................................................ 1
1.1 Background............................................................................................................................... 1
1.2 Scope and Objectives of Research ....................................................................... 5
1.3 Research Hypothesis ............................................................................................ 6
1.4 Null Hypothesis ................................................................................................... 7
1.5 Thesis Structure ................................................................................................... 9
CHAPTER 2 LITERATURE REVIEW ........................................................................... 11
CHAPTER 3 RESEARCH METHODOLOGY ............................................................... 27
3.1 Outline of Research Methodology ..................................................................... 27
3.1.1 Define Scope and Objectives ........................................................................ 28
3.1.2 Review Literature.......................................................................................... 28
3.1.3 Collect Data from Clark County, Nevada and Texas Department of
Transportation .............................................................................................. 28
3.1.4 Analyze Data ................................................................................................. 29
3.1.5 Summarize Results........................................................................................ 29
3.1.6 Compare the Results of Clark County and TXDOT Data ............................ 29
3.1.7 Make Conclusions and Recommendation ..................................................... 29
3.2 History of Data Collection ................................................................................. 31
3.3 Statistical Background ....................................................................................... 32
3.3.1 Types of Variables ........................................................................................ 32
3.3.2 Correlation Analysis ..................................................................................... 33
3.3.3 Regression Analysis ...................................................................................... 33
3.3.4 Types of Modeling Approaches .................................................................... 34
3.3.4.1 Deterministic Approach ........................................................................ 34
3.3.4.2 Probabilistic Approach.......................................................................... 34
3.3.5 Least Squares Line ........................................................................................ 35
3.3.6 Coefficient of Determination ........................................................................ 36
3.4 Limitation of Study ............................................................................................ 36
CHAPTER 4 DATA DESCRIPTION .............................................................................. 38
4.1 Project Identification, Selection, and Execution ................................................ 38
4.2 Data Description of Clark County Projects ....................................................... 39
4.2.1 Clark County Public Road Projects Data ...................................................... 40
4.2.2 Clark County Public Flood Control Projects Data ........................................ 44
4.2.3 Both Road and Flood Control Projects Data of Clark County...................... 48

vii
4.3 Data Description of Texas Department of Transportation Projects ................... 52
4.4 Distribution of Projects by Design and Construction Costs .............................. 55
4.4.1 Design and Construction Costs for Clark County’s Public Flood
Control Projects ............................................................................................. 56
4.4.2 Clark County Public Road Projects’ Design and Construction Costs .......... 59
4.4.3 Design and Construction Costs for Clark County’s Public Road and
Flood Control Projects ................................................................................... 60
4.4.4 TXDOT Road Projects’ Design and Construction Costs .............................. 61
4.5 Database Formation ........................................................................................... 63
4.6 Engineering News Record Construction Cost Indices ....................................... 65
CHAPTER 5 DATA ANALYSIS AND RESULTS ........................................................ 67
5.1 Data Preparation for Analysis ............................................................................ 67
5.2 Descriptive Statistics Overview ......................................................................... 68
5.2.1 Descriptive Statistics for Clark County Road Projects ................................. 68
5.2.2 Descriptive Statistics of Clark County Flood Control Projects .................... 69
5.2.3 Descriptive Statistics of Combined Clark County Road and
Flood Control Projects ................................................................................... 70
5.2.4 Descriptive Statistics of Texas Department of Transportation Road
Projects .......................................................................................................... 71
5.2.5 Descriptive Statistics of Construction Schedule Growth of various projects 72
5.3 Statistical Tests .................................................................................................. 72
5.3.1 Statistical Tests for Verification of Assumptions of the Correlation
Analysis ......................................................................................................... 72
5.3.1.1 Normality Test ...................................................................................... 73
5.3.1.2 Outliers Test .......................................................................................... 75
5.3.1.3 Linearity Test ........................................................................................ 76
5.3.1.4 Heteroscedasticity Test ......................................................................... 77
5.3.2 Statistical Tests for Verification of Assumptions of Regression Analysis ... 78
5.3.2.1 Check for a Mis-specified Model ......................................................... 79
5.3.2.2 Check for Heteroscedasticity / Unequal Variance ................................ 79
5.3.2.3 Check for Non-normal Errors ............................................................... 80
5.3.2.4 Check for Correlated Errors .................................................................. 81
5.3.2.5 Check for outliers .................................................................................. 81
5.4 Correlation of Basic Design Cost with Other Metrics for Clark
County Projects .................................................................................................. 81
5.4.1 Correlation between Basic Design Cost and Contract Award Cost Growth 82
5.4.2 Correlation between Basic Design Cost and Total Cost Growth .................. 84
5.4.3 Correlation between Basic Design Cost and Construction Cost Growth ..... 86
5.4.4 Correlation between Basic Design Cost and Construction Schedule Growth87
5.5 Correlation between Total Design Cost and Other Metrics for Clark
County Projects .................................................................................................. 89
5.5.1 Correlation between Total Design Cost and Contract Award Cost Growth . 90
5.5.2 Correlation between Total Design Cost versus Total Cost Growth .............. 91
5.5.3 Correlation between Total Design Cost versus Construction Cost Growth . 93

viii
5.5.4 Correlation between Total Design Cost versus Construction Schedule
Growth ........................................................................................................... 95
5.6 Regression Model of Basic Design Cost with Final Construction Cost ............ 96
5.7 Regression Model of Total Design Cost with Final Construction Cost........... 100
CHAPTER 6 COMPARISON BETWEEN CLARK COUNTY AND TEXAS
DOT DATA .............................................................................................. 105
6.1 Correlation between Basic Design Cost and Other Metrics for
CCDPW Projects ............................................................................................. 105
6.1.1 Correlation between Basic Design Cost and Contract Award Cost Growth 105
6.1.2 Correlation between Basic Design Cost and Total Cost Growth ................ 107
6.1.3 Correlation between Basic Design Cost and Construction Cost Growth ... 109
6.1.4 Correlation between Basic Design Cost and Construction Schedule
Growth ......................................................................................................... 111
6.2 Regression Model of Basic Design Cost with Final Construction Cost .......... 113
CHAPTER 7 CONCLUSIONS AND RECOMMENDATIONS ................................... 121
APPENDIX A DATA DESCRIPTION AND ANALYSIS ........................................... 126
APPENDIX B HISTOGRAM OF VARIOUS METRICS ............................................. 143
APPENDIX C BOX PLOTS .......................................................................................... 170
APPENDIX D SCATTER PLOT BETWEEN INDEPENDENT AND DEPENDENT
VARIABLES ......................................................................................... 189
APPENDIX E RESIDUAL PLOT WITH INDEPENDENT VARIABLES .................. 207
APPENDIX F RESIDUAL PLOT WITH PREDICTED VALUE ................................. 213
APPENDIX G HISTOGRAM OF RESIDUALS ........................................................... 217
APPENDIX H PLOT FOR PREDICTED VALUES AGAINST ACTUAL VALUES . 221
APPENDIX I RESIDUAL PLOT FOR YEARLY TIME SERIES MODEL ................ 225
BIBLIOGRAPHY ........................................................................................................... 228
VITA ............................................................................................................................... 232

ix
LIST OF FIGURES
Figure 1. Flow chart depicting the effect of design cost on construction projects .......... 3
Figure 2. Proportion of poor performance caused by defective design
(Adopted from Andi and Minato, 2003) ......................................................... 20
Figure 3. Flowchart of research methodology ............................................................... 30
Figure 4. Histogram of the contract signed CCDPW road projects distribution
by year ............................................................................................................. 40
Figure 5. Histogram of the ―Notice to Proceed‖ by year for CCDPW road projects .... 41
Figure 6. Histogram of completed CCDPW road projects by year ............................... 42
Figure 7. Histogram of construction contract duration for CCDPW road projects ....... 43
Figure 8. Histogram of final construction duration for CCDPW road projects ............. 44
Figure 9. Histogram of contracts signed for CCDPW flood control projects by year ... 45
Figure 10. Histogram of the ―Notice to Proceed‖ by year for CCDPW
flood control projects ...................................................................................... 46
Figure 11. Histogram of completed CCDPW flood control projects, by year ................. 47
Figure 12. Histogram of contract signed for CCDPW road and flood control
projects, by year .............................................................................................. 48
Figure 13. Histogram of the ―Notice to Proceed‖ by year for CCDPW road and
flood control projects ...................................................................................... 49
Figure 14. Histogram of the construction completed for CCDPW road and
flood control projects, by year ........................................................................ 50
Figure 15. Histogram of the construction contract duration for CCDPW both
road and flood control projects ....................................................................... 51
Figure 16. Histogram of the final construction duration for CCDPW both road and flood
control projects................................................................................................ 52
Figure 17. Histogram of the contract signed TXDOT road projects distribution by year 53
Figure 18. Histogram of the ―Notice to Proceed‖ by year for TXDOT road projects ..... 54
Figure 19. Histogram of the completed TXDOT road projects, by year ......................... 55
Figure 20. Histogram of the basic design cost (in $ million) of Clark County
flood control projects ...................................................................................... 56
Figure 21. Histogram of the total design cost ($ million) of Clark County
flood control projects ...................................................................................... 57
Figure 22. Histogram of the final construction cost (in $ million) of Clark County
flood control projects ...................................................................................... 58
Figure 23. Histogram of the total project cost (in $ million) of Clark County
flood control projects ...................................................................................... 59
Figure 24. Histogram of the basic design cost (in $ million) of TXDOT road projects .. 61
Figure 25. Histogram of the final construction cost (in $ million) of TXDOT
road projects .................................................................................................... 62
Figure 26. Histogram of total project cost (in $ million) of TXDOT road projects ........ 63
Figure 27. Histogram of contract award cost growth (%) of CCDPW road projects ...... 75
Figure 28. Box plot of basic design cost (%) of CCDPW flood control projects ............ 76
Figure 29. Residual plot with for total design cost for CCDPW road projects ............... 77
Figure 30. Residual plot with predicted value (for total design cost) for
CCDPW road projects..................................................................................... 78

x
Figure 31. Scatter plot of basic design cost and contract award cost growth
for road projects .............................................................................................. 83
Figure 32. Scatter plot of basic design cost and total cost growth for road projects ....... 85
Figure 33. Scatter plot of basic design cost and construction cost growth of
CCDPW flood control projects ....................................................................... 87
Figure 34. Scatter plot of basic design cost and construction schedule growth
of combined CCDPW flood control and road projects ................................... 89
Figure 35. Scatter plot of total design cost and contract award cost growth of
road projects .................................................................................................... 91
Figure 36. Scatter plot of total design cost and total cost growth of CCDPW
road projects .................................................................................................... 93
Figure 37. Scatter plot of total design cost and construction cost growth of
CCDPW road projects..................................................................................... 95
Figure 38. Scatter plot of basic design cost versus final construction cost
for CCDPW road projects (N = 46) ................................................................ 98
Figure 39. Scatter plot of basic design cost versus final construction cost for
combined CCDPW road and flood control projects (N = 58) ...................... 100
Figure 40. Scatter plot of total design cost versus final construction cost
for CCDPW road projects (N = 46) .............................................................. 102
Figure 41. Scatter plot of basic design cost versus final construction cost for
combined CCDPW road and flood control projects (N = 58) ...................... 104
Figure 42. Scatter plot of basic design cost and contract award cost growth
for TXDOT road projects.............................................................................. 107
Figure 43. Scatter plot of basic design cost and total cost growth for
TXDOT road projects ................................................................................... 109
Figure 44. Scatter plot of basic design cost and construction cost growth
for TXDOT road projects.............................................................................. 111
Figure 45. Scatter plot of basic design cost and construction schedule growth
for TXDOT road projects.............................................................................. 113
Figure 46. Scatter plot of basic design cost versus final construction cost for
both CCDPW and TXDOT road projects (N = 62). ..................................... 115

xi
LIST OF TABLES
Table 1. Research hypotheses based on basic design cost .............................................. 7
Table 2. Research hypotheses based on total design cost ............................................... 7
Table 3. Null hypotheses based on basic design cost ..................................................... 8
Table 4. Null hypotheses based on total design cost ...................................................... 8
Table 5. Project success measurement performance metrics
(Konchar & Sanvido, 1998) ............................................................................ 12
Table 6. Summary of research findings ........................................................................ 25
Table 7. ENR cost indices ............................................................................................. 66
Table 8. Descriptive statistics of CCDPW road projects costs ($ K) ........................... 69
Table 9. Descriptive statistics of CCDPW flood control projects costs ($ K) .............. 70
Table 10. Descriptive statistics of CCDPW road and flood control projects costs ($ K) 71
Table 11. Descriptive statistics of TXDOT road projects costs ($ K) ............................ 71
Table 12. Descriptive statistics of construction schedule growth of various
projects (%) ..................................................................................................... 72
Table 13. Anderson-Darling normality test results ......................................................... 74
Table 14. Pearson Correlation – Basic design cost versus contract award cost growth . 82
Table 15. Pearson correlation – basic design cost versus total cost growth ................... 84
Table 16. Pearson correlation – basic design cost versus construction cost growth ....... 86
Table 17. Pearson correlation – basic design cost versus construction schedule growth 88
Table 18. Pearson correlation – total design cost versus contract award cost growth .... 90
Table 19. Pearson correlation – total design cost versus total cost growth .................... 92
Table 20. Pearson correlation – total design cost versus construction cost growth ........ 94
Table 21. Pearson correlation – total design cost versus construction schedule growth 96
Table 22. Pearson correlation – basic design cost versus final construction cost ........... 97
Table 23. Pearson correlation – total design cost versus final construction cost .......... 101
Table 24. Pearson correlation – basic design cost versus contract award cost growth . 106
Table 25. Pearson correlation – basic design cost versus total cost growth ................. 108
Table 26. Pearson correlation – basic design cost versus construction cost growth ..... 110
Table 27. Pearson correlation – basic design cost versus construction
schedule growth ............................................................................................ 112
Table 28. Pearson correlation – basic design cost versus final construction cost ......... 114
Table 29. Summary of pearson correlation – basic design cost (%) with other metrics117
Table 30. Summary of pearson correlation – total design cost (%) with other metrics 118
Table 31. Summary of pearson correlation – basic design cost ($ M) and final
construction cost ........................................................................................... 119
Table 32. Summary of pearson correlation – total design cost ($ M) and final
construction cost ........................................................................................... 120

1
CHAPTER 1
INTRODUCTION
1.1 Background
Public road projects generally are constructed using traditional design-bid-build
(DBB) project delivery method. DBB is used extensively all over the United States in
such government agencies as federal and state Departments of Transportation as well as
related state and county agencies. In the DBB method, the design and construction are
performed by two separate entities. An engineer prepares design drawings and
specifications of the project. Once the detailed design is completed, the project is put to
bid during the contract procurement phase. The owner selects a contractor based on
different selection criteria, for instance, low bid, lump sum, or best value. Then, the
contractor that is awarded the bid constructs the project. By using the DBB method, there
is no contractual relationship between the designer and the contractor. If any problem
arises during the construction phase regarding design, the contractor proceeds with
change orders. Errors in design and a lack of communication between the designer and
the contractor can have a negative impact on the project cost and schedule.
In DBB projects, the role of the designer and the quality of design are important
factors that can have a huge impact on the engineer’s estimate as well as the actual cost
and duration of the construction phase. If the quality of design is good, the engineer’s
estimate will also be accurate and the contractor will bid near to the estimate. There will
be little variation between the engineer’s estimate and the cost and duration of contract
award. If the design is of good quality, then there will be fewer change orders issued
during the construction phase due to design errors. This will control the cost and schedule

2
growth during the construction phase. However, if there are many errors in the design,
the engineer’s estimate will not be accurate. That results in a large variation between the
engineer’s estimate and the contractors’ bid. Failure to find mistakes during the bidding
period of the contract will result in change orders during construction, and these change
orders will contribute to an increase in the duration of the projects as well as an increase
in cost. Figure 1 shows the impact of the design cost in the contract procurement and the
construction phases of the projects.
Like other public owners, Clark County Department of Public Works (CCDPW) of
Nevada generally uses the DBB project delivery method to build roads and flood control
infrastructures. Little research has been conducted to determine the effect of design cost
on the construction phase performance. Gransberg et al. tested the hypothesis that there is
a correlation between design cost and construction cost performance in highway projects.
The study found, that as design cost of a highway increased, the construction cost
performance improved (Gransberg et al., 2007).
Cost growth in construction projects occurs due to various reasons. Some of the
factors influencing the cost growth are project characteristics, project delivery methods,
contract types, unforeseen site conditions, inaccurate bidding, design fees, and weather
conditions (Gransberg et al., 2007; Carr, 2005; Li et al., 2008; Shrestha et al., 2007; Hale
et al., 2009; Konchar et al., 1998; Jahren & Ashe, 1990; Odeck, 2004; Knight & Fayek,
1999; Chua & Li, 2000). A contract award cost growth occurs during the procurement
phase, and a construction cost growth occurs during the construction phase. If both of
these growths are combined, this is called the total cost growth for the project.

3
Figure 1. Flow chart depicting the effect of design cost on construction projects
Design Cost
Accurate
Engineers’
Estimate
Inaccurate
Engineer’s
Estimate
Yes
No
Is the design cost enough?
Low Deviation
between
Estimated Cost
and Bid Cost
High Deviation
between
Estimated
Duration and
Bid Duration
Low Deviation
between Bid
Cost and Final
Construction
Cost
High Deviation
between Bid
Duration and
Final
Construction
Duration
Low Deviation
between
Estimate
Duration and
Bid Duration
Low Deviation
between Bid
Duration and
Final
Construction
Duration
High Deviation
between
Estimated Cost
and Bid Cost
High Deviation
between Bid
Cost and Final
Construction
Cost
Contract Award Cost Growth Construction Cost Growth
Contract Award Schedule Growth Construction Schedule Growth
Project Design Phase Project Procurement Phase Project Construction Phase
Contract Award Cost Growth Construction Cost Growth

4
The hypothesis of this study is that the design cost impacts the construction cost and
schedule performance of the projects. This paper analyzes the correlations of the design
cost and duration with total cost growth, contract award cost growth, construction cost
growth, and construction schedule growth of CCDPW road and flood control projects.
The terminology ―basic design cost‖ used in this paper refers to the pure design cost of
the project. A pure design cost is composed of the engineer’s or architecture fees as well
as expenses for design drawings and specifications. On the other hand, total design cost is
composed of all expenses during designing, such as geotechnical works, surveys, and
right of way and includes basic design cost. In this paper, the basic design cost is the ratio
of the basic design cost to the total project cost, expressed as percentage. The total design
cost is the total design cost to the total project cost, expressed as percentage. In context of
this paper, a deviation of bid price from the engineer’s estimate is defined as ―contract
award cost growth‖ and is the difference between the owner’s estimate and the bid price
calculated as the percentage increase from the owner’s estimate. Construction cost
growth is the difference between the final construction cost and bid cost, calculated as the
percentage increase from the bid cost. The total cost growth is the difference between the
final construction cost and estimated construction cost, expressed as the percentage of the
estimated construction cost. Construction schedule growth is the difference between the
final construction cost and construction contract duration, expressed as the percentage of
the construction contract duration.
The first analysis of this study will determine the effect of the design cost on total
cost growth. The second analysis will determine whether design cost has an impact on the
contract award cost growth. The third analysis will determine the effect of the design cost

5
on the construction cost growth. The fourth analysis will determine whether the design
cost has an impact on the construction schedule growth. The final analysis will determine
the correlation between the design cost and final construction cost of the project. A
regression equation also will be developed to predict the final construction cost of the
public roads and flood control projects, with the design cost as an input variable.
1.2 Scope and Objectives of Research
The objective of this research is to determine the relationship of design cost and
design duration with the project performance parameters. In this research, the project
performance is measured on the basis of changes in its parameters, such as construction
cost growth, construction schedule growth, total cost growth, contract award cost growth,
and final construction cost. To achieve the objective, the research focused on 47 public
road projects, and 11 flood control projects undertaken by Clark County Department of
Public Works (CCDPW), Nevada, from the years 1992 through 2007. The sample
consists of the projects costing from $337,644 to $53 million in total design and
construction costs. The total value of design and construction is equivalent to $803
million when converted into a 2010 base cost. The road projects consisted of the
construction of road elements, including detail design, and a thorough inspection during
construction. Flood control project encompassed design and construction of flood control
elements.
The objective of this research not only is to determine the relationship between design
parameters and construction parameters, but also to develop a tool that will provide an
early reliable estimation of final construction cost based on the design cost of any project.

6
Even though; the database consists of less than one hundred data points to develop the
model, it will conceptualize and add knowledge that will aid future research.
Furthermore, for validation of the model, this study analyzes and compares the Clark
County road and flood control projects data with Texas Department of Transportation
(TXDOT) road projects data. This model will support designers, estimators, and
contractors in visualizing the final construction cost, construction duration, and possibly
the quality of final product or performance of projects, specifically in public works.
To summarize, some major objectives of this research are:
Determine the correlation of design cost with the total cost growth of the
public road and flood control projects.
Determine the correlation of design cost with the contract award cost growth
of the public road and flood control projects.
Determine the correlation of design cost with the construction cost growth of
the public road and flood control projects.
Determine the correlation of design cost with the construction schedule
growth of the public road and flood control projects.
Determine the correlation of design cost with the final construction cost of the
public road and flood control projects.
1.3 Research Hypothesis
To achieve the objectives of this research, five research hypotheses are formulated
based on basic design cost, as shown in Table 1; another five research hypotheses are
formulated based on total design cost, as shown in Table 2.

7
Table 1. Research hypotheses based on basic design cost
No. Research Hypotheses
I Ha1: A lower basic design cost will result in an increased total cost growth of
public road and flood control projects
II Ha2: A lower basic design cost will result in an increased contract award cost
growth of public road and flood control projects
III Ha3: A lower basic design cost will result in an increased construction cost
growth of public road and flood control projects
IV Ha4: A lower basic design cost will result in an increased construction schedule
growth of public road and flood control projects
V Ha5: A basic design cost can be used to predict the final construction cost of the
public road and flood control projects
Table 2. Research hypotheses based on total design cost
No. Research Hypotheses
I Ha6: A lower total design cost will result in an increased total cost growth of
public road and flood control projects
II Ha7: A lower total design cost will result in an increased contract award cost
growth of public road and flood control projects
III Ha8: A lower total design cost will result in an increased construction cost
growth of public road and flood control projects
IV Ha9: A lower total design cost will result in an increased construction schedule
growth of public road and flood control projects
V Ha10: A total design cost can be used to predict the final construction cost of
the public road and flood control projects
1.4 Null Hypothesis
The above research hypothesis will be converted to null hypotheses to conduct the
statistical test. The p- value must be less than or equal to 0.05 for the justification of the
false null hypothesis. Given that the null hypothesis is true, the p-value represents the
probability of observing a test static that is at least as large as the one that is actually

8
observed. The statistical test hypothesizes that the correlation coefficient between these
variables is not significantly different from zero. Mathematically, it can be expressed as
010987654321
Table 3. Null hypotheses based on basic design cost
No. Null Hypotheses
I H01: There is no relationship between the basic design cost and the total cost
growth of public road and flood control projects
II H02: There is no relationship between the basic design cost and the contract
award cost growth of public road and flood control projects
III H03: There is no relationship between the basic design cost and the
construction cost growth of public road and flood control projects
IV H04: There is no relationship between the basic design cost and the
construction schedule growth of public road and flood control projects
V H05: There is no relationship between the design cost and the final construction
cost of the public road and flood control projects
Table 4. Null hypotheses based on total design cost
No. Null Hypotheses
I H06: There is no relationship between the total design cost and the total cost
growth of public road and flood control projects
II H07: There is no relationship between the total design cost and the contract
award cost growth of public road and flood control projects
III H08: There is no relationship between the total design cost and the construction
cost growth of public road and flood control projects
IV H09: There is no relationship between the total design cost and the construction
schedule growth of public road and flood control projects
V H010: There is no relationship between the total design cost and the final
construction cost of the public road and flood control projects
9
1.5 Thesis Structure
This thesis consists of seven chapters. It is a compilation of documents in a single
report describing the background of that research, the research’s significance,
methodology followed to conduct the research, a description about the database and its
sources, analytical results obtained from statistical analysis, formation of models and
their validation, and a discussion about the limitations of the research as well as
recommendations for further research. The structure of thesis with its components is
described briefly below:
Chapter 1 Introduction: This chapter concentrates on the scope and objectives of the
research; the effect of design cost and duration on the project performance; and sources
of data, characteristics of data, and hypotheses of the research.
Chapter 2 Literature Review: This chapter covers the foundation and guidelines of
research. This chapter discusses previous research papers on this subject and their
findings related to this research. The various research papers relevant to this thesis are
collected and described briefly in this chapter.
Chapter 3 Research Methodology: This chapter thoroughly describes the steps of the
research, history of data collection and statistical background.
Chapter 4: Data Description: The sources of data, brief description of project
identification, selection and execution methodology, Clark County road and flood control
projects data collection information and data distribution histograms, discussion of
sources of data of Texas Department of Transportation road projects, description of each
terminology of data set, and stepwise procedure of analysis, are encompassed in this
chapter.

10
Chapter 5 Data Analysis and Results: In this chapter, the detailed discussion on the
data analysis, descriptive statistics of each metrics, regression models developments,
checking of statistical analysis with various histograms and scatter plots are
demonstrated.
Chapter 6 Comparison of Results of Clark County Data with TXDOT Data: For the
validation of the results, a new set of data are collected from Texas Department of
Transportation and are analyzed as before. This data are compared with the results of
Clark County data.
Chapter 7 Conclusions and Recommendations: The conclusions and limitations of
this research are discussed in this chapter. Potential research areas are recommended in
this section.

11
CHAPTER 2
LITERATURE REVIEW
This thesis focuses on the study of the design cost and their impact on the project
performance, especially in design-bid-build projects. To achieve this objective, various
books, published and currently proceeding research papers on various kinds of
construction projects were reviewed. In particular, the literature review focuses on studies
done on the development of regression models for prediction of construction cost, based
on the design cost of projects; and the impact of design cost on construction cost growth
as well as construction schedule growth. Although, not all papers reviewed have a direct
impact on the regression models developed for this study, even so, they helped to form a
baseline for research.
The success of a construction project is a reflection of good performance of the
project. Cost, schedule and quality are the major metrics to measure performance of a
project. Using 341 U.S. building projects, Konchar and Sanvido (1998) conducted
research to compare these metrics for three project delivery systems: construction
management at risk, design-build (DB), and design-bid-build (DBB). The owner
contracts with a single entity to perform both design and construction under a single
design-build contract in DB project delivery method. Table 5 shows the performance
metrics used in this study along with their definitions. If all the other variables were held
constant, this study indicated that design-build projects had lesser unit cost, faster
construction speed, faster delivery speed, lesser cost growth, and lesser schedule growth
than design-bid-build projects.

12
Table 5. Project success measurement performance metrics (Konchar & Sanvido, 1998)
Performance Metrics Definition
Unit Cost ($ /m2) (Final project cost/Area)/Cost Index
Cost growth (%) (Final project cost – Contract project cost)/Contract project
cost] x 100
Intensity ($/m2/month) (Unit cost/Total Time)
Construction Speed
(m2/month)
Area/ (As-built construction end date –As-built construction
start date)/30
Delivery Speed
(m2/month)
(Area / Total time)/30
Schedule Growth (%) [(Total time –Total as-planned time)/Total as-built time] x
100
Turnover Quality Ease of starting up and extent of call backs
(5 = exceed owner’s expectation; 1 = not satisfactory)
System Quality Performance of building elements, interior space and
environment
(5 = exceed owner’s expectation; 1 = not satisfactory)
Equipment quality (5 = exceed owner’s expectation; 1 = not satisfactory)
A study conducted to predict the project performance of design-build and design-bid-
build project generated models, by using project-specific data collected from 87 building
projects in Singapore (Ling et al., 2004). These projects were grass-root public and
private building construction projects exceeding $5 million, and were completed between
1993 and 2001. From the review of past works, 59 potential factors were identified, that
affect project performance. All these factors were categorized into three major headings:
project characteristics, owner- consultant characteristics, and contractor characteristics. A
multivariate regression analysis was used to develop models in order to determine the
statistical relationship between DBB and DB projects variables, such as cost growth and
construction speed: other variables included floor area, type of client, and adequacy of
contractor’s plant and equipment. The major factors determined to analyze the project
success were cost performance, time performance, quality performance, and owner’s
13
satisfaction. This study Ling et al. is an extension of research done by Konchar and
Sanvido (1998). Additional terminologies, such as turnover quality, system quality,
equipment quality, owner’s satisfaction, and administrative burden were discussed in this
study. Additionally, Ling et al. (2004) developed models to determine the delivery speed
and construction speed of DBB and DB projects.
In order to identify factors affecting duration of design-bid procurement and effect of
duration on project success, Migliaccio and Shrestha (2009) conducted a study on the
design-build procurement activities durations for highway projects. These authors
collected 19 highway projects of sizes ranging from $9 million to $1.3 billion dollars,
constructed between 1997 and 2006. The correlation coefficient between the total
procurement duration and the total construction cost was found to be 0.61. The results
showed that the total procurement duration was linearly correlated with total construction
cost, indicating that, by increasing the project construction cost, the total procurement
duration also increased for project costing greater than $250 million. The correlation
between procurement durations and project cost was very weak for projects having less
than $250 million total project cost.
Migliaccio et al. (2009) conducted research to determine the impact of procurement
duration on project performance, using 146 design-build transportation projects. These
projects were collected from 15 states, especially from Florida. The projects used best
value, low bid, and adjusted bid selection methods. The metrics used to measure the
project performance were: schedule growth, cost growth, and total project time growth.
The study found that low-bid projects had the longest average procurement duration (3.06
months), and adjusted-bid projects had the shortest average procurement duration (2.65

14
months). The Pearson correlation value between variables procurement duration and
schedule growth was -0.8, which showed that the schedule growth decreases with
increasing procurement duration. The R-square value 0.64 indicated high reliability and
strong linear correlation between these variables. Additionally, the correlation between
procurement duration and total time based schedule growth was -0.79. However, the R-
square value for the variables procurement duration and cost growth performance, which
was 0.05, showed that there was little influence of procurement duration on cost growth
performance. Furthermore, the Pearson correlation value between cost growth and
schedule growth was found to be 0.29, which indicated that there was weak linear
correlation between these variables. This study found that the projects with longer
procurement duration had lower schedule growth by the awarded bidder. On the other
hand, the degree of linear correlation between procurement duration and schedule growth
was different for different complexity levels.
A study funded by Asian Development Bank was conducted to identify the main
causes of project delay and cost under-run, studying about 100 projects (Ahsan and
Gunawan, 2010). The ultimate objective of this study was to examine international
development project costs and schedule performances as well as the main reasons for
poor project outcome. The authors found that, on average, 86% of projects were late, with
time overruns of about 2 years, and projects took approximately 39% more time than the
planned average. Authors analyzed the time and cost performance for all international
development projects and found an unusual relationship. Most projects, 73%, were late
(schedule overruns) and operated with less budgeted cost, with a cost under-run of 20%.
This showed that most late projects experienced cost under-runs. It was found that about

15
83% projects were found successful. The major causes of project delay were duration of
contract procurement, civil works and land acquisition, and consultant recruitment. The
major reasons for the cost under-runs were devaluation of local currency, competitive
bidding price, lower than estimated bid, and large contingency budgets.
In conventional project procurement methods, change orders are common during
design and construction processes, often causing cost overrun or schedule growth. A
study in Taipei, Taiwan reviewed 90 metropolitan public work projects, those were
completed before the year 2000 (Hsieh et al., 2004). The researchers studied 40 building
constructions, 14 road constructions, 14 bridge and culvert constructions, 12 flood control
constructions, and 10 subway tunnel construction projects. The chain of events was
identified, and the causes for change orders were categorized based on information from
the database. The causes of change orders were: discrepancies in planning and design,
underground conditions, safety considerations, incidents due to natural causes, change of
work rules/regulations, change of decision-making authority, special needs for project
commissioning and ownership transfer, neighborhood pleading, and miscellaneous
causes. The study showed that the problems incurred in the planning and design stage
accounted for the most critical causes of change orders: the proportion of change orders
for planning and design was 23.17%. Based on statistical testing, a 10-17% ratio of
change order cost to total project cost (COR) was typical in metropolitan public works. It
was suggested that more comprehensive planning and design would be required in order
to improve project performance.
External factors such as political and economic factors, natural environmental factors,
and third party factors and internal factors such as owner’s demand changes, quality of

16
design done by the consultant, and performance of the contractors were major causes of
change orders. Moreover, design changes in construction projects often cause cost
overrun or schedule growth. To clarify the causes of construction changes and to analyze
the influence of these changes, the authors conducted multiple-case studies using
statistics analysis to identify change in highway projects in Taiwan (Wu et. al. 2004).
Authors interpreted the impact of change order in two aspects: 1) cost variation, and 2)
schedule variation. The study showed that changes were due to difficulties in the pre-
engineering investigation of the structures; as a result, the designer was unable to control
all the factors in the designing phase. For instance, the study revealed that the cost for
design change caused by insufficient geologic survey was 0.92% (NT $ 407,233,790) to
the total contract amount (NT$44,412,072,900). The ratio on the cost of planning and
design was low in the life cycle of construction engineering, but its influence to the entire
engineering project was the greatest. The study suggested that detailed feasibility analysis
and planning during the design phase was needed to prevent changes in the future.
A quantity analysis on construction delay was conducted by Al-Momani (2000),
studying 130 public projects in nation of Jordan. The five kinds of projects were taken
under consideration during the period of 1990 to 1997: residential, office and
administration buildings, school buildings, medical centers and communication facilities.
The data collection was done to investigate the reasons behind the construction delay and
over-runs. These reasons were: 1) the planned duration of contract, 2) the actual
completion date, 3) design changes, 4) disputes, 5) notification of extra work, 6) the date
of notice to proceed, 7) delays encountered during construction, 8) conflict between the
drawings and the specifications, 9) time extensions, and 10) late delivery of materials and
17
equipments among others. The authors identified the major causes of delays which
included: poor design, change orders, weather, site conditions, late delivery, economic
conditions, and increase in quantity. About 106 out of 130 projects (81.5 %) were
delayed. Poor design was the major cause of delay about 24.6 %, meanwhile, change
orders was second major cause of delay about 15.4 %. The mean actual duration and
planned duration for all public projects were 426.6 days and 343.1 days. Linear
regression models were used to estimate the relationship between the actual and planned
time for all five kinds of projects. The R-square value found for housing projects, office
and administrative buildings projects, school projects, medical centers, and
communication facilities were 72.85%, 58.96%, 51.47%, 79.24%, and 73.97%,
respectively.
Design cost and quality are associated with each other. Design fees and design cost
are synonymous. Design cost is defined as the cost to design the facilities, either roads
(horizontal construction) or buildings (vertical construction). The method for calculating
design cost or fees varies according to the type of owner. There are a number of methods
to compensate the engineers and architects for their design work. Some of the prevalent
methods in the construction industry mentioned in ASCE, Manuals and reports on
engineering practice – No. 45 (2003) are: 1) per diem, 2) cost plus a fixed fee, 3) fixed
lump-sum payment, 4) salary cost times a multiplier plus direct non-salary expense, 5)
retainer, and 6) percentage of construction cost (ASCE. Manuals and reports on
engineering practice – No. 45, 2003).
Surveys conducted by PSMJ have shown that the fixed lump-sum payment type
design cost is widely used by engineers and architects to calculate the design cost of the

18
buildings (CEO Snapshot: A/E fees and pricing survey. 23rd Edition, PSMJ Inc.). They
reported that in 2006, 51% of owners used the fixed lump-sum form of payment to
determine the design fee. Carr and Beyor have found that both professional fees and
design fees have not been uniformly adjusted for inflation in the last three decades. There
has been a decline of professional service fees when the impact of thirty years of inflation
is considered (Carr and Beyor, 2005).
The relationship between design cost and design quality of the project is difficult to
predict. It is a generally held belief that higher design costs result in a higher quality of
design, up to some point of diminishing returns. Bubshait et al. conducted research
investigating the correlation between design fees and design quality (Bubshait et al.,
1998). These researchers collected project cost, design fees, and change order cost data
for 58 large building projects in Saudi Arabia. The authors measured the design
deficiency using the metric Total Cost of Design Deficiency (TCDD) given in Equation
1.
n
i
ii ICCO (DCDCTCDD1
)
(1)
where DCDCi is the direct cost of the ith design deficiency, and is the contractor’s
charges for the change to correct the design deficiency. The ICCOi is the ith
charge for
the indirect costs of the change order resulting from delayed project completion as is
given by the Equation 2.
12Pr
s) (in monthTime Delayear ofit per yected Annual ExpICCO (2)
The authors assumed 15% as the expected annual profit in their analyses. A fifth-
order polynomial statistical model was developed where the dependent variable was

19
TCDD and the independent variable was design cost. Using the data from 58 projects, the
researchers found that the TCDD decreases as the design cost increases. In their data, the
average design cost on building projects was found to be 2.4% of the total project cost,
and the average project cost was $2 million. The authors also developed a statistical
model to predict the design deficiency cost with the design fees. The coefficient of
determination was 0.85 for the statistical model. However, the validity of fitting the data
with a 5th
order polynomial is questionable, and it should be noted that goodness-of-fit is
no guarantee of predictive success.
Currently, Japanese construction industry is paying more attention to the quality of
design documents. Defective design is considered to be the most important risk factor in
determining the success of a project. The research conducted a number of interviews and
questionnaire surveys involving 105 designers and 91 construction personnel (Andi and
Minato, 2003). In investigating the perceptions of the designers and contractors, the
quality of design and its documentation (such as drawings and specifications) was
evaluated based on several attributed indicators, including whole life cycle cost issues,
material efficiency, economy, relevancy, constructability, innovation, expressiveness,
aesthetics, ecological sustainability, site compatibility, material selection, and
functionality. It was determined that there are two influential factors of design documents
quality, which were design duration and design fees. The researchers determined the
impact of deficient design documents on construction process efficiency. The defective
designs impacts negatively on the performances of projects, which results rework, delays,
cost overruns, changes, accidents, disputes, and loss of profit. The respondents of the
surveys believed that almost 40% construction changes originated from defective design,
20
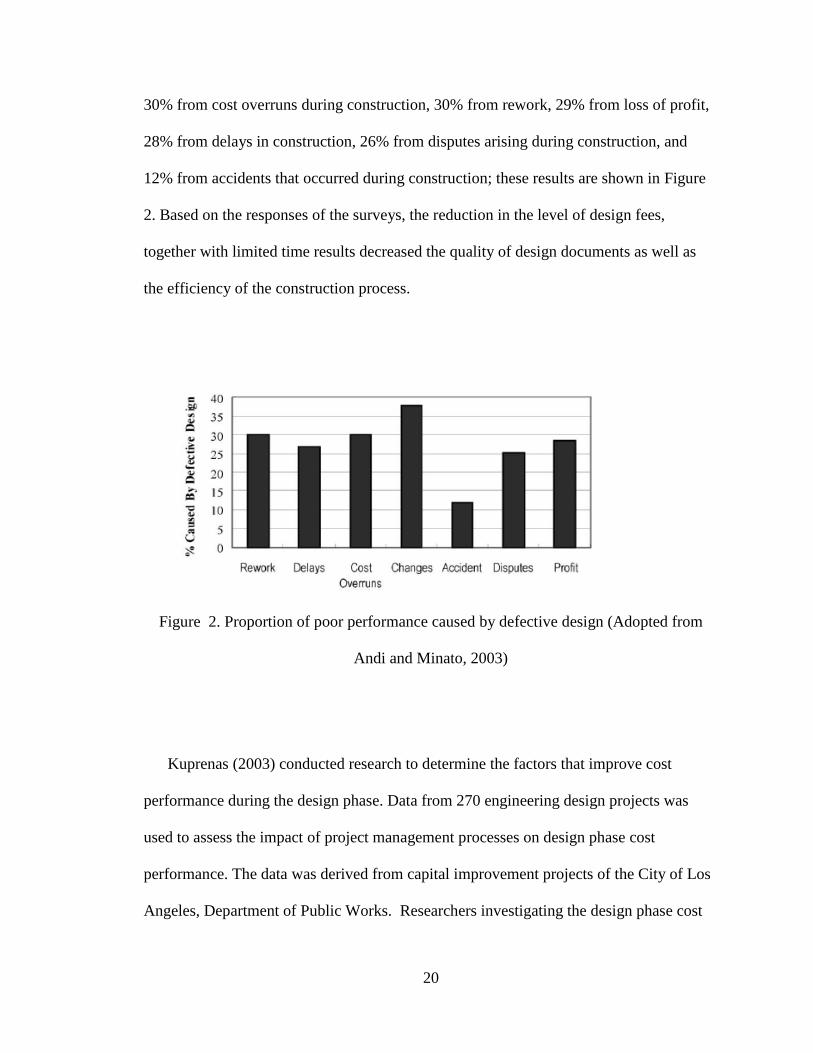
30% from cost overruns during construction, 30% from rework, 29% from loss of profit,
28% from delays in construction, 26% from disputes arising during construction, and
12% from accidents that occurred during construction; these results are shown in Figure
2. Based on the responses of the surveys, the reduction in the level of design fees,
together with limited time results decreased the quality of design documents as well as
the efficiency of the construction process.
Figure 2. Proportion of poor performance caused by defective design (Adopted from
Andi and Minato, 2003)
Kuprenas (2003) conducted research to determine the factors that improve cost
performance during the design phase. Data from 270 engineering design projects was
used to assess the impact of project management processes on design phase cost
performance. The data was derived from capital improvement projects of the City of Los
Angeles, Department of Public Works. Researchers investigating the design phase cost

21
performance used the Design Cost Performance Index (DCPI) metric which is calculated
by using Equation 3.
BCDWP
ACDWPDCPI
(3)
where, ACDWP is the actual cost of design work performed and BCDWP is the
budgeted cost of design work performed. The cost of projects ranged from $25,000 to
$25 million, and the construction completion period of these projects were between 1993
and 2000. Four project management processes were selected to find the correlation with
the design phase cost performance: organizational structure (matrix or functional), project
management training tools, design phase progress reporting frequency, and meeting
frequency. The findings of the research showed that the frequency of design team
meetings and reporting of design phase progress were significantly correlated with design
phase cost performance.
The study of the number of changes that occurred in the construction projects
revealed that 78% of the changes are related to design (Burati et al., 1992). The data of
nine industrial projects of Construction Industry Institute (CII) member firms showed that
about 19.7% of the design changes were related to design error; 13.3% were related to
design revision, modifications, and improvements; 10.9% were related to design changes
initiated by operations or processes; 9.1% were related to design changes initiated by the
owners; and 6.1% were related to design omissions. It was found that, on average, 9.5%
of the total project cost growth was accounted for by the design changes. However, the
construction deviation only accounted for 2.5% of the total project cost growth. The
study showed that design changes, which frequently occurred in the projects, contributed
22
the most to the total project cost growth. Therefore, the researchers recommended that the
owners needed to control the design changes in order to control the total project cost
growth.
Gransberg et al. (2007) investigated the relationship between design fees and
construction quality of transportation projects. The design cost for this analysis is the
percentage of total design and construction cost of the projects. Due to unavailability of
detailed data, the researchers used construction cost growth of the project as an indicator
of construction quality. Data from 31 Oklahoma Turnpike Authority projects were used
to investigate the correlation between these variables. They also created a regression
model so that the project construction cost growth could be predicted with the design
cost. The cost of projects ranged from $490,000 to $27.4 million. The total value of the
projects was $90 million. The project data was analyzed collectively; then, the data was
then subdivided into bridge and road projects, each of which were and analyzed
separately. The cost growth metric used in these analyses was cost growth from the
initial estimate (CGIE), calculated by using Equation 4.
%sttimated CoIntital Es
ted Costtal Estimaost - Intitruction CFinal Cons CGIE 100 (4)
To calculate this metric, the researchers used the estimated cost of the project before
the design started as the value for the variable initial estimated cost. This metric differs
from the cost growth metric in the way that the initial estimated cost of the project is
defined. In the construction industry, using the DBB project delivery method, the initial
estimated cost of the construction is generally fixed after the design of the project is
completed.

23
Gransberg et al. (2007) found the average design fee for the projects to be 5.2% of the
total project cost, and the average CGIE was 36.31%. Also, as the design fees decreased,
the absolute construction cost growth from the engineer’s early estimate increased. The
research also found that this correlation is stronger in bridge projects than in road
projects, because bridge projects have more technical issues during design than road
projects. A second-order polynomial regression analysis was used to determine the
correlation between design fees and cost growth. The analysis showed that the value of
the coefficient of determination was higher in bridge projects than in road projects. The
coefficient of determination, R square, quantifies the percentage of variation created in
the dependent variable (in this case, CGIE) by the independent variable (in this case,
design fees). The value of the coefficient of determination calculated for road and bridge
projects were 0.39 and 0.95 respectively. A conclusion of this study was that design fees
and construction cost growth were inversely correlated. Another conclusion was that, in
their data set, design fees were higher in bridge projects than in road projects.
A study was conducted to determine the association of design costs with construction
cost growth, construction cost per lane mile, construction schedule growth, and
construction delivery speed per lane mile (Shrestha and Shields, 2009). To conduct this
analysis, researchers collected data from 11 highway projects built in Texas. The findings
showed that the design cost is strongly correlated with construction cost growth and
construction cost per lane mile. It showed that the higher the design cost of the highway
project, the lower the construction cost growth and construction cost per lane mile.
Research on the correlation between the design quality and the annual maintenance
and rehabilitation cost of the buildings showed that an improved quality of design

24
resulted in decreased annual maintenance and rehabilitation costs (Newton and Christian,
2006). The analysis was based on 28 new building projects collected from the Canadian
Department of National Defense. To determine the design quality of the projects, the
authors considered seven qualitative factors: performance, reliability, serviceability,
conformance, durability, perceived quality, and aesthetics of the design drawings. The
study showed that the design quality has significant impact on the maintenance and
rehabilitation cost of the buildings. The R-square value for this model was found to be
56%.
25
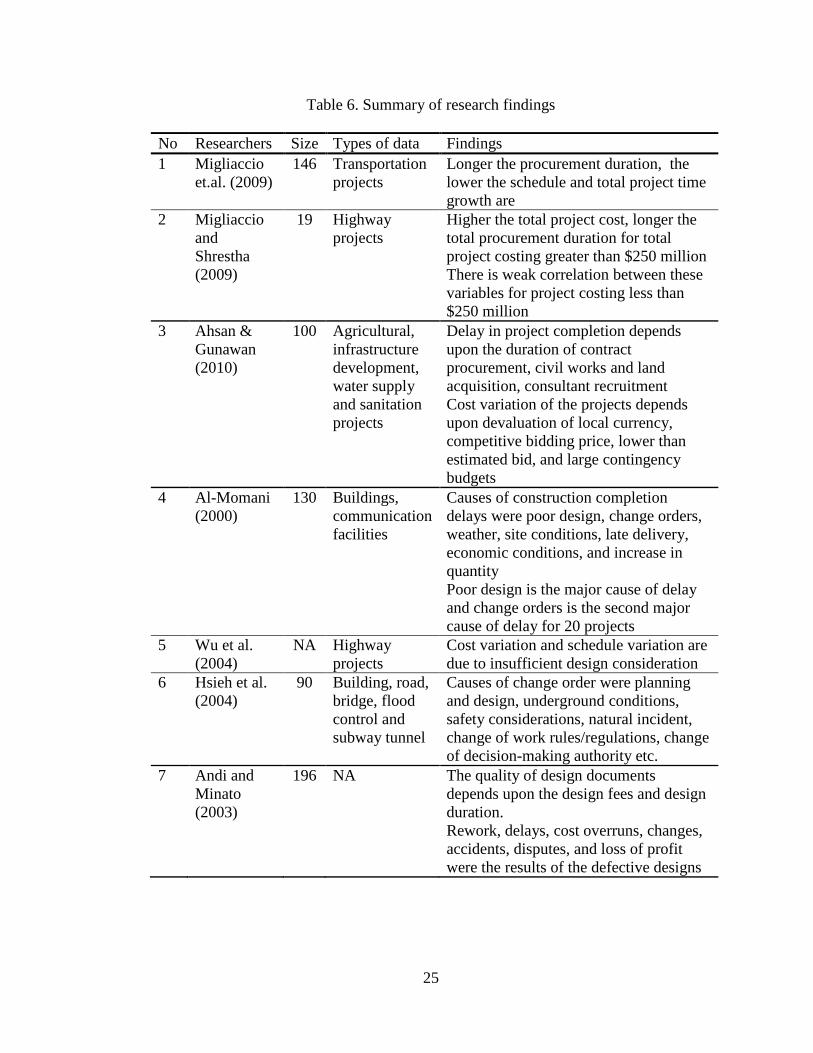
Table 6. Summary of research findings
No Researchers Size Types of data Findings
1 Migliaccio
et.al. (2009)
146 Transportation
projects
Longer the procurement duration, the
lower the schedule and total project time
growth are
2 Migliaccio
and
Shrestha
(2009)
19 Highway
projects
Higher the total project cost, longer the
total procurement duration for total
project costing greater than $250 million
There is weak correlation between these
variables for project costing less than
$250 million
3 Ahsan &
Gunawan
(2010)
100 Agricultural,
infrastructure
development,
water supply
and sanitation
projects
Delay in project completion depends
upon the duration of contract
procurement, civil works and land
acquisition, consultant recruitment
Cost variation of the projects depends
upon devaluation of local currency,
competitive bidding price, lower than
estimated bid, and large contingency
budgets
4 Al-Momani
(2000)
130 Buildings,
communication
facilities
Causes of construction completion
delays were poor design, change orders,
weather, site conditions, late delivery,
economic conditions, and increase in
quantity
Poor design is the major cause of delay
and change orders is the second major
cause of delay for 20 projects
5 Wu et al.
(2004)
NA Highway
projects
Cost variation and schedule variation are
due to insufficient design consideration
6 Hsieh et al.
(2004)
90 Building, road,
bridge, flood
control and
subway tunnel
Causes of change order were planning
and design, underground conditions,
safety considerations, natural incident,
change of work rules/regulations, change
of decision-making authority etc.
7 Andi and
Minato
(2003)
196 NA The quality of design documents
depends upon the design fees and design
duration.
Rework, delays, cost overruns, changes,
accidents, disputes, and loss of profit
were the results of the defective designs

26
No Researchers Size Types of data Findings
8 Burati et
al. (1992)
9 Industrial
projects
Design changes occurs due to design error,
design revision, operation process, design
omission and design change initiated by
the owners
Total project cost growth is the result of
design changes
9 Bubshait
et al.
(1998)
58 Large building
projects
Total cost of design deficiency decreases
with the increase in the design cost
Higher the design cost, higher the quality
of design
10 Kuprenas
(2003)
270 Municipal
facilities, storm-
water, sewer,
street projects
For a constant level of quality and
schedule performance, frequency of design
team meetings and reporting of design
phase progress, project manager training,
and organization structures play
significant role in the design phase cost
performance
11 Newton
&
Christian
(2006)
28 Building projects Seven factors to determine the design
quality of the projects are performance,
reliability, serviceability, conformance,
durability, perceived quality, and aesthetics
of design drawings
Better the quality of design, lower the
annual maintenance and rehabilitation cost
12 Gransber
g et al.
(2007)
31 Road and bridge
projects
Lower the design fees, higher the
construction cost growth
The correlation between these two
variables is stronger in bridge projects
than in road projects
13 Shrestha
& Shields
(2009)
11 Highway
projects
Higher the design cost of the highway
projects, the lower the construction cost
growth and construction cost per lane
mile

27
CHAPTER 3
RESEARCH METHODOLOGY
This research statistically analyzes the design and construction costs and the schedule
data of public projects in Clark County, Nevada, completed between the 1992-2007
timeframe. To validate the findings, the results of this data will be compared to that of the
Texas Department of Transportation. The detailed methodology for this research is
discussed below.
3.1 Outline of Research Methodology
The methodology of this study consists of seven steps which are shown in Figure 3.
The seven steps are as follows:
Define scope and objectives
Review literature
Collect data from Clark County, Nevada and Texas Department of Transportation
Analyze data
Summarize results
Compare the results of Clark County and TXDOT data
Make conclusion and recommendation
Each step of this research methodology is discussed below.

28
3.1.1 Define Scope and Objectives
The scope and objectives of the research are illustrated in this section. The major
objective of this research is to determine the correlation between the design cost with
construction cost growth and schedule growth. The results of the correlation analysis of
this study will be compared to that of TXDOT’s road project data’s results. The detailed
research hypotheses, background, study objectives were described in Chapter 1.
3.1.2 Review Literature
A literature review is the foundation of any research; therefore, various sources, such
as journals, research papers on various kinds of construction projects, theses, books and
articles were reviewed before finalizing the methodology and refining the scope of the
research. The literatures review was discussed in Chapter 2 and is listed in the
bibliography section.
3.1.3 Collect Data from Clark County, Nevada and Texas Department of Transportation
Data are the backbone of any research. Research without adequate and reliable data
has no definable shape. To perform statistical analysis, sufficient data should be
available. Various methodologies, such as surveys, questionnaires, and personal
interviews could be implemented in order to collect data. However, to conduct this
research, the data of road and flood control projects were collected from the Clark
County Department of Public Works (CCDPW). Data of road projects from Texas
Department of Transportation (TXDOT) were collected by questionnaire survey. The
history behind the data collection and the statistical background are discussed in Section
3.2. Clark County road and flood control projects as well as Texas Department of
Transportation road projects’ data are described in Chapter 4. The type and size of data

29
samples, histogram plots of various costs and durations, and description of metrics are
discussed.
3.1.4 Analyze Data
Descriptive statistics as well as correlation and regression analyses of Clark County
road and flood control projects and Texas Department of Transportation road projects are
done by using SPSS software. The statistical assumptions tests for correlation and
regression analysis are discussed in Chapter 5. Regression models are developed for final
construction cost and design cost metrics. Detailed procedures regarding the statistical
analysis of Clark County road and flood control projects and Texas DOT road projects
are described in Chapter 5.
3.1.5 Summarize Results
The results of descriptive statistics as well as correlation and regression analyses
of Clark County road and flood control projects and Texas Department of Transportation
road projects are discussed in Chapter 5. The results obtained after comparison between
Clark County data and Texas DOT data, are described in Chapter 6.
3.1.6 Compare the Results of Clark County and TXDOT Data
The results obtained from Clark County road and flood control data analyses are
compared with the data from Texas Department of Transportation (TXDOT) road
projects. The models formed from the regression analysis were checked for validation.
The detailed procedures are discussed in Chapter 6.
3.1.7 Make Conclusions and Recommendation
The conclusions of this research, the limitations, and the scope of future research are
identified and presented in Chapter 7.

30
Figure 3. Flowchart of research methodology
31
3.2 History of Data Collection
To conduct this research, data were collected from the Clark County Department of
Public Works (CCDPW), Clark County, Nevada. The data consists of data sheets from
the design phase and the construction phase. The data related to design were collected
directly from Design division of CCDPW, whereas the data related to construction was
collected with the help of a graduate student from UNLV’s Construction Management
Program, who is now working as construction manager in CCDPW. This data set consists
of Clark County’s standard construction bid forms, with bid schedule information and
invoices of design works of transportation and flood control projects constructed by
CCDPW from 1992 to 2007.
Clark County uses Global 360 Software, previously known as Kovis, to archive
construction related data of completed projects (Burns, 2008). These data are available to
the public for informational purposes from the County Archives, if requested through the
proper channel. A final affidavit of settlement is signed by the contractor after completion
of a project. The project records are then stamped, delivered to the Construction
Management Division of the CCDPW, scanned, and stored into the Global 360 database.
Hard copies of completed projects are destroyed to reduce the storage space that the
physical retention of records demands. However, the database of design documents
(invoices) can be obtained in spreadsheet format.
Project data were obtained in pdf format and manually entered into a spreadsheet. The
data obtained included project year, lists of items (by number and description), quantities,
units, engineer’s estimates of probable cost, bid price for each item, total estimates of
cost, and bids for each projects. Final completion costs for each project were entered

32
separately in an Excel worksheet format. However, the design phase data were obtained
in spreadsheets format and entered in haphazardly. These spreadsheets included contract
date, authorized funding amount and date, item-wise parameters with amount, and
invoices amount for each project. The required data were extracted from these
spreadsheets in suitable format. The invoice spreadsheets consisted of data from more
than one projects’ design phase, so there was some difficulty in extracting the required
data.
In addition, the data related to the design and construction of Texas Department of
Transportation road projects were collected by means of a questionnaire, which surveyed
information regarding design cost, design start date, construction start and completion
date, final construction cost, estimated cost, contract award cost, construction cost
growth, and total cost growth.
3.3 Statistical Background
The public projects, such as the road and flood control construction projects design
and construction phase data for Clark County, were analyzed by conducting uni-variate
statistical analysis. Pearson correlation and linear regression analysis were used to
analyze the data in this study. The terms and methodologies used in this analysis are
described below.
3.3.1 Types of Variables
Dependent and independent variables are two types of variables, used in any
statistical correlation and regression analysis. The variable to be predicted is called the
dependent, or response, variable. The value of dependent variable cannot be controlled
33
because its value depends on an independent variable. A variable that is used to predict
the dependent variable; is called an independent variable; this variable can be controlled
during the period of research.
3.3.2 Correlation Analysis
Correlation is a measure of the relation between two or more variables. The degree of
correlation can be measured by correlation coefficients. Pearson correlation coefficient is
the most common correlation coefficient which is widely used to determine linear
relationship between two variables. Correlation can be negative correlation or positive
correlation depending upon its correlation coefficient values from -1 to +1. If coefficient
of correlation is -1, it is called a perfect negative correlation. If coefficient of correlation
is +1, it is called a perfect positive correlation. The correlation value ―0‖ indicates a lack
of correlation. The normality test, linearity test, heteroscedasticity test and outliers test
should be conducted to prove the assumptions of correlation analysis. In this study, the
metrics used for correlation analyses are: basic design cost, total design cost, total cost
growth, contract award cost growth, construction cost growth, construction schedule
growth, and final construction cost. Among these metrics, basic design cost and total
design cost are independent variables. Rest metrics are dependent variables.
3.3.3 Regression Analysis
It is a statistical technique, which is used to find the relationship between dependent
and independent variables, for the purpose of predicting future values. The regression
model, also called ―prediction equation,‖ is an expression that reveals the relations
between these variables (Mendenhall and Sincich, 2007). Depending upon the nature of
complexity in the relationship, the regression model can involve simple to extremely

34
complicated mathematical functions. In this research, a simple regression model is used
to understand the relationship between variables. A simple regression model consists of
one independent variable and one dependent variable. The independent variable is
denoted by ―x,‖ whereas, the symbol ―y‖ stands for the dependent variable (Devore,
1999).
Equation 5 represents a simple linear model, in which ―x‖ stands for the independent
variable and ―y‖ stands for the dependent variable. The symbol ―β0‖ and ―β1‖ are the
constant and the coefficient of the independent variable, respectively. In this study, the
dependent variable, ―final construction cost‖ can be predicted using the independent
variables ―basic design cost‖ and ―total design cost‖.
xy 10 (5)
3.3.4 Types of Modeling Approaches
3.3.4.1 Deterministic Approach
The deterministic approach is the ideal case approach, in which all the points exactly
lie on the fitted-line plot (Mendenhall and Sincich, 2007). Although, it has no provision
for errors in prediction, some points always substantially deviate from a fitted line plot. A
linear deterministic model is represented by Equation 6.
xy 10 (6)
3.3.4.2 Probabilistic Approach
In real field data, all the points do not lie exactly on a fitted line plot. Therefore, no
one could expect exactness in the prediction. In the probabilistic approach, there will be

35
an additional error factor ―ε‖ in addition to the equation of the deterministic approach. A
linear probabilistic model is represented by Equation 7.
xy 10 (7)
3.3.5 Least Squares Line
A least-square line is one that has a smaller sum of squares of the deviation (SSE)
than any other straight-line model; that is, the deviation of the predicted values from the
actual value is minimized. This line is also called the least squares prediction equation.
This method is used to make the best fitted line plot.
Let ix and iy be the observed values, iy be the estimator of the mean value of y for
case i among n number of cases, and x and y be the averages for x and y series
respectively. Let 0ˆ and 1
ˆ be the estimators of 0 and 1 respectively. Then, the term
to be minimized isn
i ii yy1
2)ˆ( . But, we know that, ii xy 10ˆˆˆ . Hence, our term to
be minimized is n
i ii xy1
2
10 )ˆˆ( . Taking the partial derivative and solving for it,
we get Equation 8.
n
i i
n
i ii
xx
yyxx
1
2
11
)(
))((ˆ
(8)
Equation 9 results from Equations 7 and 8,
xy 10ˆˆ
(9)

36
3.3.6 Coefficient of Determination
It is the proportion of the total variation in the dependent variable y that is explained,
by the variation in the independent variable x (Mendenhall and Sincich, 2007). The
Coefficient of Determination used in the regression analysis is actually the square of the
Pearson Correlation Coefficient between y and y . The general expression for ―r‖ is
shown in Equation 10.
n
i
n
i ii
n
i ii
yyxx
yyxxr
1 1
22
1
)()(
))((
(10)
The above equation gives the correlation between the two random variables. If x is
replaced by y in the above equation, it will actually give the correlation between y and y
for the regression model, which is R.
In the case of the simple correlation, the value of r lies in the interval -1 r 1. In
multiple correlations, R cannot be negative and lies in the interval 0 R 1. The value is
the same, regardless of the interchange of the axis and their units. The higher value of R2
means a higher correlation and a better fit of the curve, representing the data when
graphically plotted.
3.4 Limitation of Study
Following are some limitations of this study,
There is unavailability of detailed data. The total design costs of TXDOT data
are not available.
This study only does univariate analysis whereas a good reliable relationship
would have consisted of multiple variables.

37
There are only two types of projects: flood control and road projects. The
numbers of flood control projects were not sufficient for analysis.
There were no parameters defining the complexity of the projects for analysis.
There were only DBB roads and flood control projects. If there were other
projects with different project delivery methods, then the impact of the types
of project delivery methods with the project performance could be
determined.

38
CHAPTER 4
DATA DESCRIPTION
This chapter discusses the description of data and some statistical assumptions tests
required before data analysis. Details about identification, selection, and execution of
projects in Clark County, Nevada and Texas Department of Transportation are discussed
below.
4.1 Project Identification, Selection, and Execution
The Clark County Public Works Department follows the typical process to select and
build a project. Initially, Clark County, the Regional Transportation Commission (RTC),
and the Regional Flood Control District (RFCD) identify the necessity of the project. The
project is prioritized by each entity and then assigned to an in-house Public Works
Engineer or a consultant engineering firm, selected through an interview process, and
design work begins (Burns, 2008). Design documents are reviewed three to four times at
various stages of completion such as 35, 60, and 100 percent by Clark County’s Design
Division. The constructability review is done by the Construction Management Division
in order to prevent change orders and delays during construction. After securing the
funds, the documents are forwarded for approval within the Department of Public Works
as well as outside agencies. The project is advertised for bids by the Purchasing Office.
The construction of a project is awarded to the lowest bidder; during the construction
phase, the project is monitored by the Construction Management Division. The data
associated with design and construction are scanned and sent to the Design and
Construction Management Divisions, respectively. The design data are recorded by the
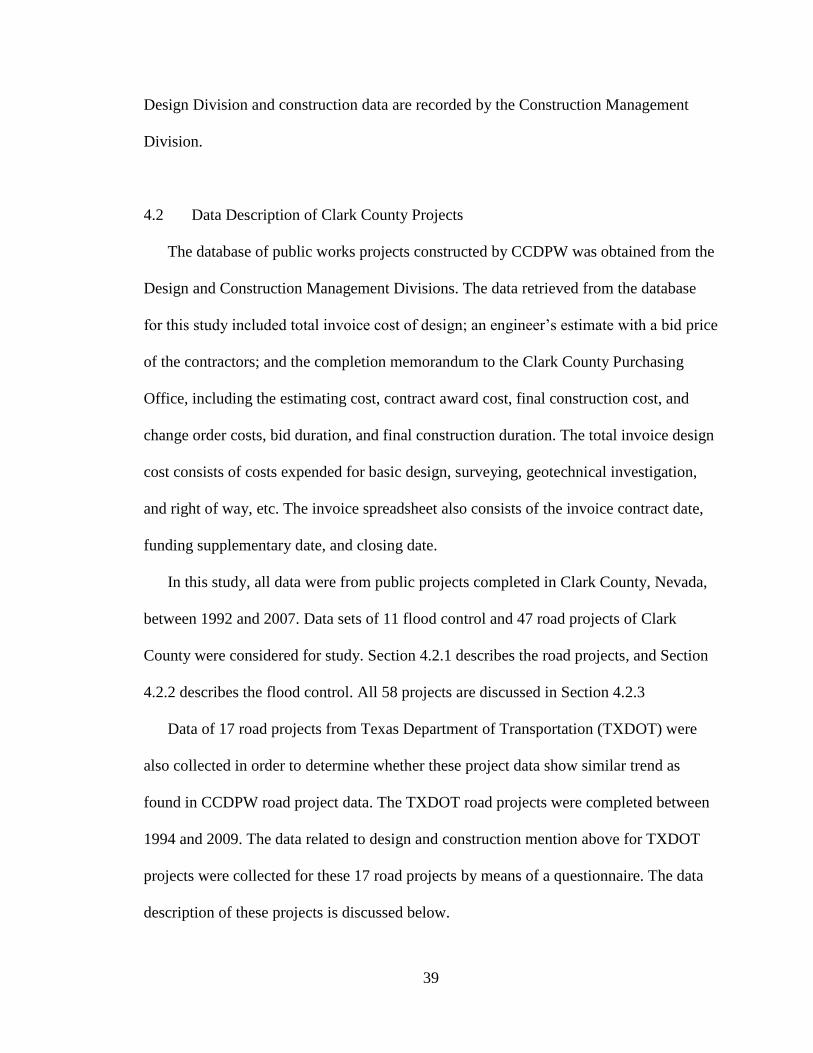
39
Design Division and construction data are recorded by the Construction Management
Division.
4.2 Data Description of Clark County Projects
The database of public works projects constructed by CCDPW was obtained from the
Design and Construction Management Divisions. The data retrieved from the database
for this study included total invoice cost of design; an engineer’s estimate with a bid price
of the contractors; and the completion memorandum to the Clark County Purchasing
Office, including the estimating cost, contract award cost, final construction cost, and
change order costs, bid duration, and final construction duration. The total invoice design
cost consists of costs expended for basic design, surveying, geotechnical investigation,
and right of way, etc. The invoice spreadsheet also consists of the invoice contract date,
funding supplementary date, and closing date.
In this study, all data were from public projects completed in Clark County, Nevada,
between 1992 and 2007. Data sets of 11 flood control and 47 road projects of Clark
County were considered for study. Section 4.2.1 describes the road projects, and Section
4.2.2 describes the flood control. All 58 projects are discussed in Section 4.2.3
Data of 17 road projects from Texas Department of Transportation (TXDOT) were
also collected in order to determine whether these project data show similar trend as
found in CCDPW road project data. The TXDOT road projects were completed between
1994 and 2009. The data related to design and construction mention above for TXDOT
projects were collected for these 17 road projects by means of a questionnaire. The data
description of these projects is discussed below.

40
4.2.1 Clark County Public Road Projects Data
Figure 4 shows the distribution of CCDPW road projects with respect to the year in
which the contract for the design was signed. In 1996, eight design contracts were signed,
which is the maximum. In 1999, 2002 and 2004, one project had a signed design contract
in each year, representing the minimum. The distribution shows that the number of
design contract signed from 1992 to 2004 varies from one to eight.
Figure 4. Histogram of the contract signed CCDPW road projects distribution by year
Figure 5 shows the distribution of CCDPW road projects with respect to construction
start date (―Notice to Proceed‖ date). The maximum number of projects that underwent

41
construction phases was seven in 1999; the minimum number of projects was one in each
2002 and 2006. The distribution shows that the number of construction for projects that
were started from 1992 to 2004 varies from one to seven.
Figure 5. Histogram of the ―Notice to Proceed‖ by year for CCDPW road projects
Figure 6 shows the distribution of CCDPW road projects with respect to construction
completion by year. In 2001, the maximum number of construction completed projects
was eight. The minimum number of construction completed projects was one in 1996,
2002, and 2007. The distribution shows that the number of completed construction
projects from 1996 to 2007 varies from one to eight.
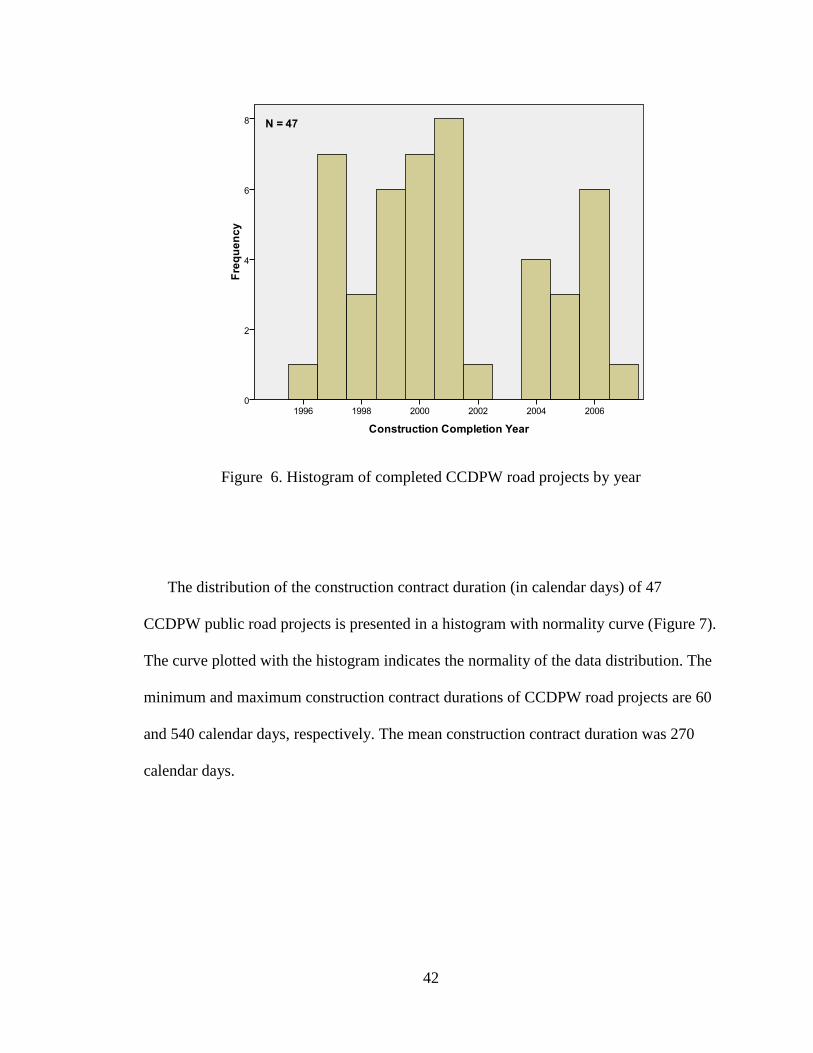
42
Figure 6. Histogram of completed CCDPW road projects by year
The distribution of the construction contract duration (in calendar days) of 47
CCDPW public road projects is presented in a histogram with normality curve (Figure 7).
The curve plotted with the histogram indicates the normality of the data distribution. The
minimum and maximum construction contract durations of CCDPW road projects are 60
and 540 calendar days, respectively. The mean construction contract duration was 270
calendar days.

43
Figure 7. Histogram of construction contract duration for CCDPW road projects
The distribution of the final construction duration (in calendar days) of 47 CCDPW
public road projects is presented in a histogram with normality curve (Figure 8). The
curve plotted with the histogram indicates the normality of the data distribution. The
minimum and maximum final construction durations of CCDPW road projects are 38 and
775 calendar days, respectively. The mean final construction duration was 328 calendar
days.

44
Figure 8. Histogram of final construction duration for CCDPW road projects
4.2.2 Clark County Public Flood Control Projects Data
Figure 9 shows the distribution by year of CCDPW flood control projects with
respect to design contract signed. In 1999, the maximum design projects signed were
three. The minimum design projects signed was one each in 1996, 2000 and 2002. The
distribution shows that the number of contract signed for design of projects from 1996 to
2003 varies from one to three.
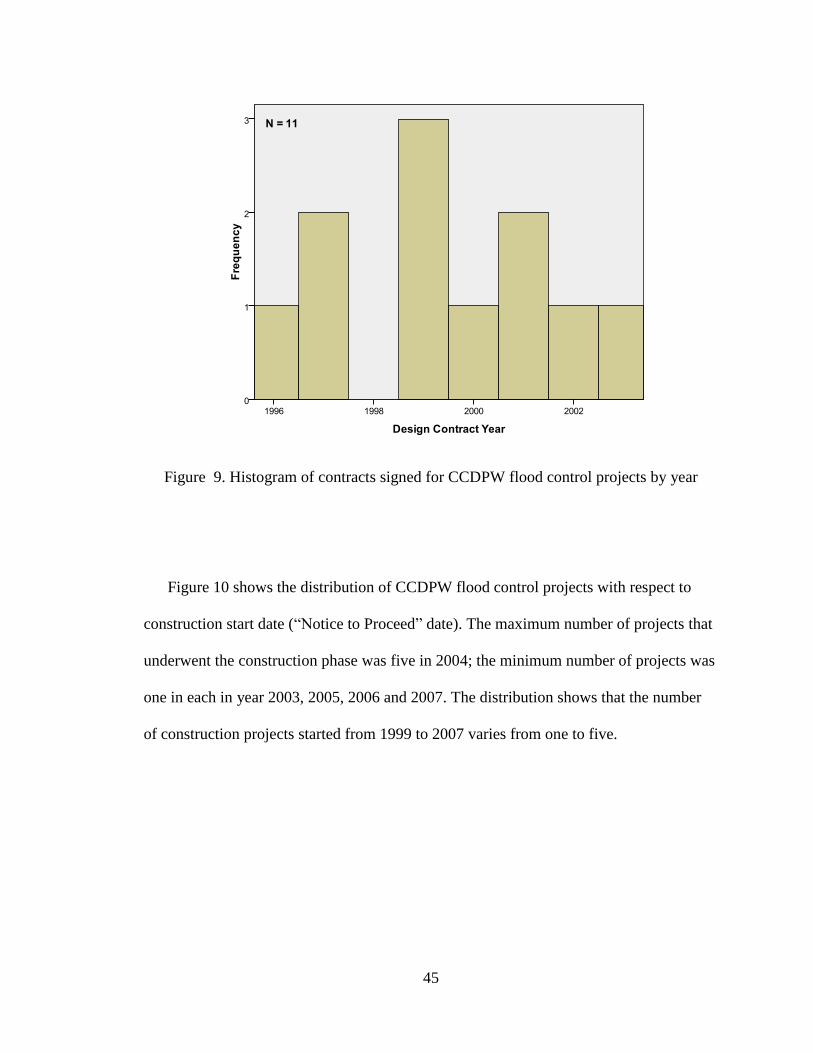
45
Figure 9. Histogram of contracts signed for CCDPW flood control projects by year
Figure 10 shows the distribution of CCDPW flood control projects with respect to
construction start date (―Notice to Proceed‖ date). The maximum number of projects that
underwent the construction phase was five in 2004; the minimum number of projects was
one in each in year 2003, 2005, 2006 and 2007. The distribution shows that the number
of construction projects started from 1999 to 2007 varies from one to five.

46
Figure 10. Histogram of the ―Notice to Proceed‖ by year for CCDPW flood control
projects
Figure 11 shows the distribution by year of CCDPW flood control projects with
respect to construction completion. In 2005, the maximum number of completed
construction projects was four. The minimum number of construction completed projects
was one in year 2004. The distribution shows that the number of construction completed
projects during 2000 to 2007 varies from 1 to 4.
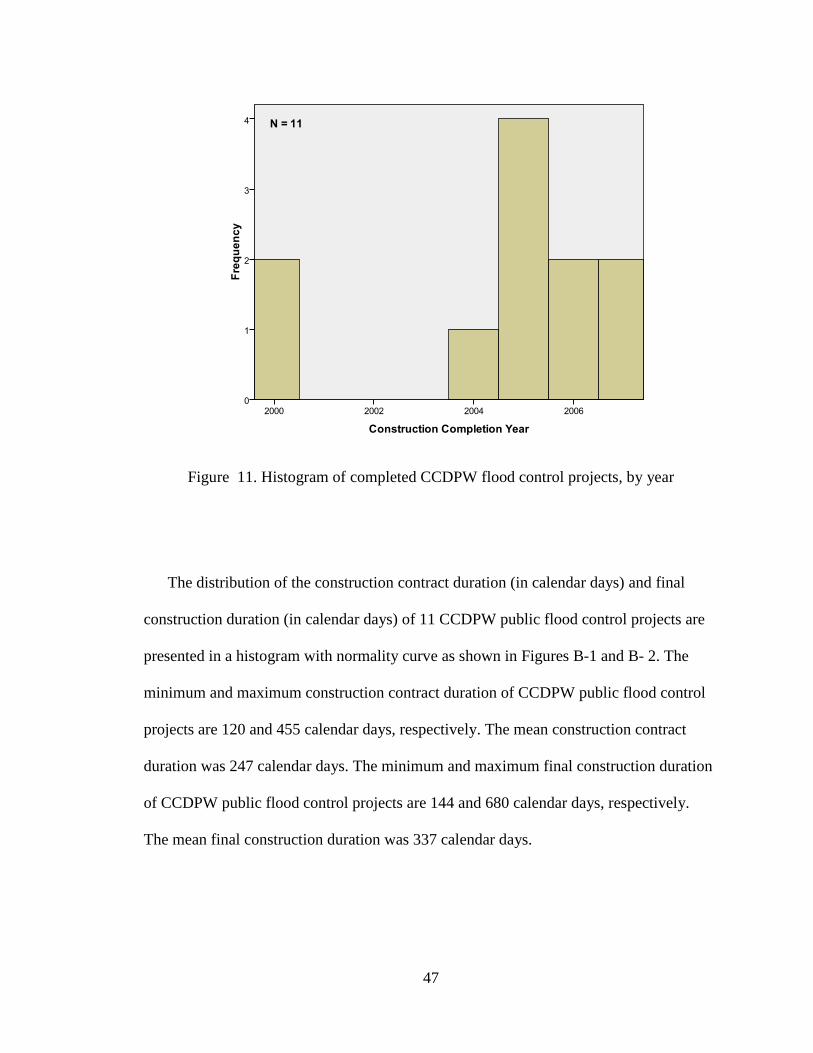
47
Figure 11. Histogram of completed CCDPW flood control projects, by year
The distribution of the construction contract duration (in calendar days) and final
construction duration (in calendar days) of 11 CCDPW public flood control projects are
presented in a histogram with normality curve as shown in Figures B-1 and B- 2. The
minimum and maximum construction contract duration of CCDPW public flood control
projects are 120 and 455 calendar days, respectively. The mean construction contract
duration was 247 calendar days. The minimum and maximum final construction duration
of CCDPW public flood control projects are 144 and 680 calendar days, respectively.
The mean final construction duration was 337 calendar days.

48
4.2.3 Both Road and Flood Control Projects Data of Clark County
Figure 12 shows the distribution by year of CCDPW road and flood control projects
with respect to design contract signed. In each of the years 1996, 1997, and 2001, the
maximum design projects signed were nine. The minimum design projects signed was
one in 2004. The distribution shows that the number of design contracts signed from
1992 to 2004 varies from one to nine.
Figure 12. Histogram of contract signed for CCDPW road and flood control projects, by
year
Figure 13 shows the distribution by year of both road and flood control projects for
the CCDPW with respect to construction start date (―Notice to Proceed‖ date). The
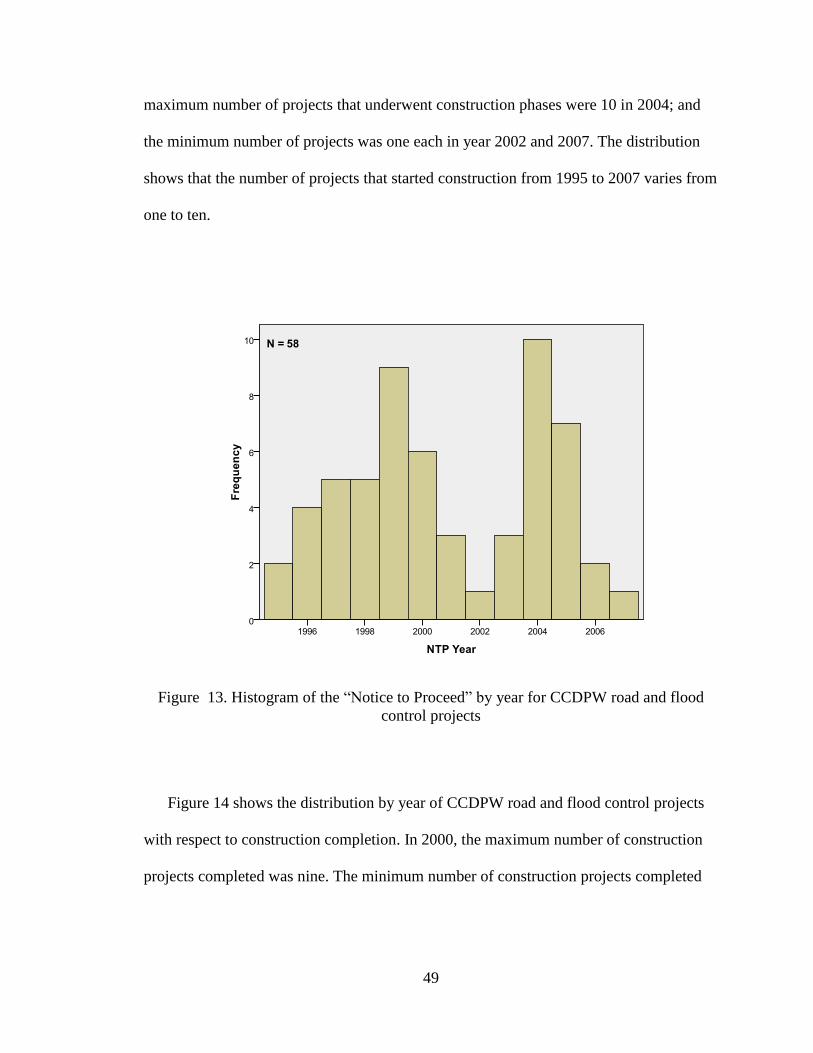
49
maximum number of projects that underwent construction phases were 10 in 2004; and
the minimum number of projects was one each in year 2002 and 2007. The distribution
shows that the number of projects that started construction from 1995 to 2007 varies from
one to ten.
Figure 13. Histogram of the ―Notice to Proceed‖ by year for CCDPW road and flood
control projects
Figure 14 shows the distribution by year of CCDPW road and flood control projects
with respect to construction completion. In 2000, the maximum number of construction
projects completed was nine. The minimum number of construction projects completed
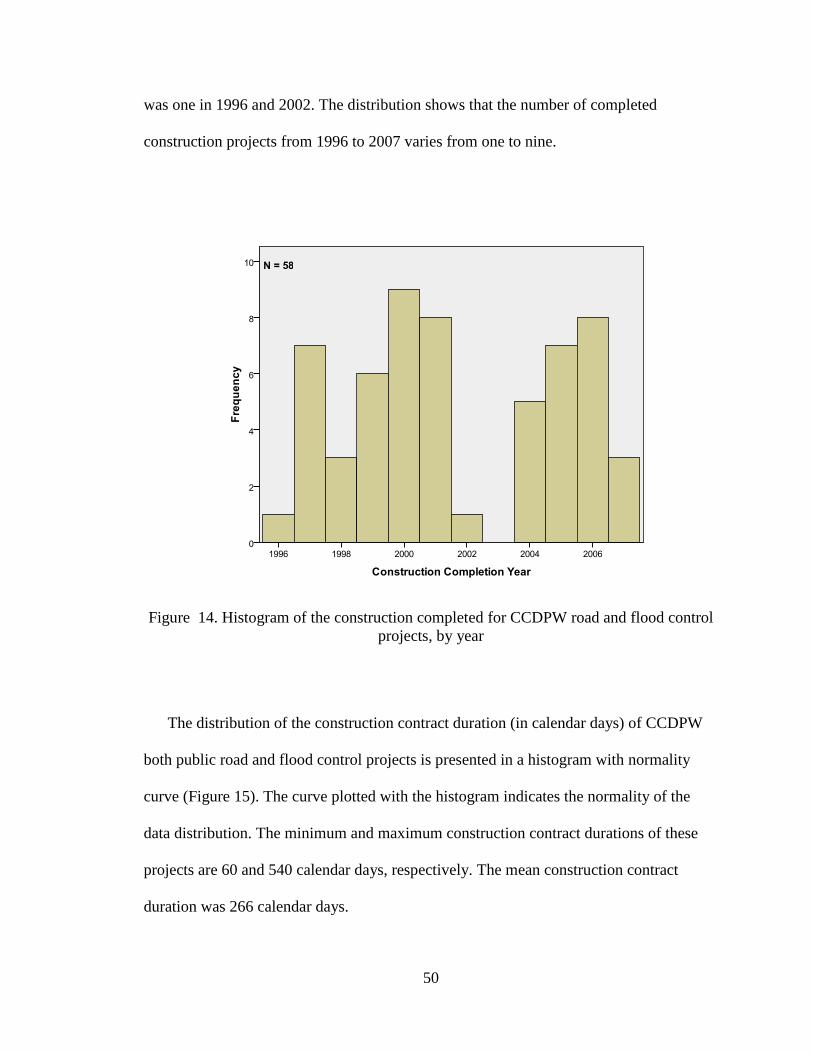
50
was one in 1996 and 2002. The distribution shows that the number of completed
construction projects from 1996 to 2007 varies from one to nine.
Figure 14. Histogram of the construction completed for CCDPW road and flood control
projects, by year
The distribution of the construction contract duration (in calendar days) of CCDPW
both public road and flood control projects is presented in a histogram with normality
curve (Figure 15). The curve plotted with the histogram indicates the normality of the
data distribution. The minimum and maximum construction contract durations of these
projects are 60 and 540 calendar days, respectively. The mean construction contract
duration was 266 calendar days.

51
Figure 15. Histogram of the construction contract duration for CCDPW both road and
flood control projects
The distribution of the final construction duration (in calendar days) of CCDPW both
public road and flood control projects is presented in a histogram with normality curve
(Figure 16). The curve plotted with the histogram indicates the normality of the data
distribution. The minimum and maximum final construction durations of these projects
are 38 and 775 calendar days, respectively. The mean final construction duration was 330
calendar days.
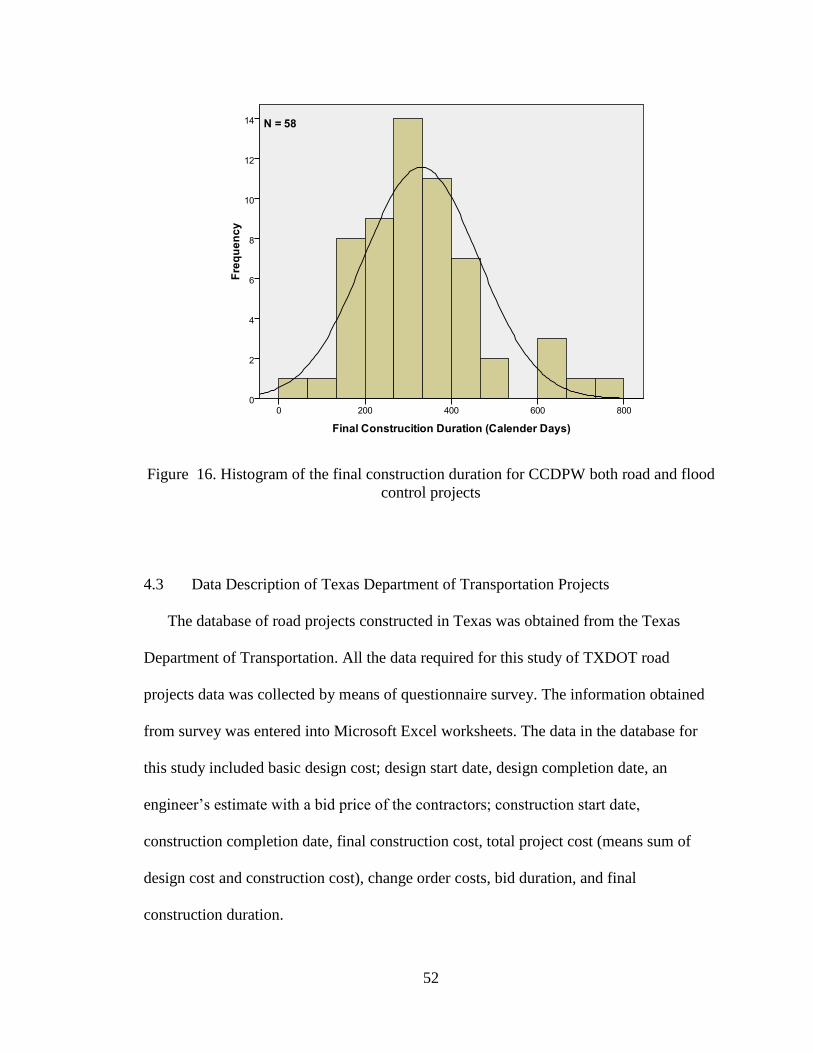
52
Figure 16. Histogram of the final construction duration for CCDPW both road and flood
control projects
4.3 Data Description of Texas Department of Transportation Projects
The database of road projects constructed in Texas was obtained from the Texas
Department of Transportation. All the data required for this study of TXDOT road
projects data was collected by means of questionnaire survey. The information obtained
from survey was entered into Microsoft Excel worksheets. The data in the database for
this study included basic design cost; design start date, design completion date, an
engineer’s estimate with a bid price of the contractors; construction start date,
construction completion date, final construction cost, total project cost (means sum of
design cost and construction cost), change order costs, bid duration, and final
construction duration.
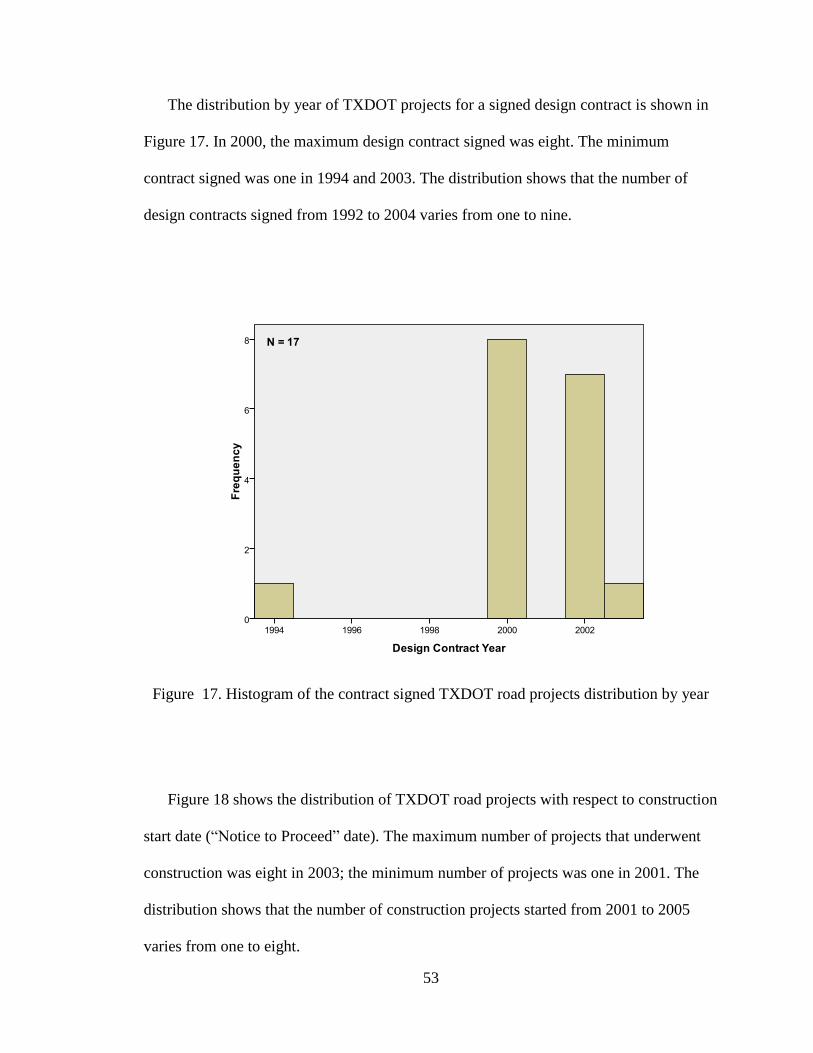
53
The distribution by year of TXDOT projects for a signed design contract is shown in
Figure 17. In 2000, the maximum design contract signed was eight. The minimum
contract signed was one in 1994 and 2003. The distribution shows that the number of
design contracts signed from 1992 to 2004 varies from one to nine.
Figure 17. Histogram of the contract signed TXDOT road projects distribution by year
Figure 18 shows the distribution of TXDOT road projects with respect to construction
start date (―Notice to Proceed‖ date). The maximum number of projects that underwent
construction was eight in 2003; the minimum number of projects was one in 2001. The
distribution shows that the number of construction projects started from 2001 to 2005
varies from one to eight.

54
Figure 18. Histogram of the ―Notice to Proceed‖ by year for TXDOT road projects
Figure 19 shows the distribution by year of TXDOT road projects with respect to
construction completion. In 2006, the maximum number of construction projects
completed was eight. The minimum number of construction projects completed was one
in 2010. The distribution shows that the number of projects completed from 2006 to 2010
varies from one to eight.

55
Figure 19. Histogram of the completed TXDOT road projects, by year
The distribution of the final construction duration (in calendar days) of TXDOT road
projects is presented in a histogram with normality curve (Figure B-3). The curve plotted
with the histogram indicates the normality of the data distribution. The minimum and
maximum final construction durations of these projects are 870 and 1920 calendar days,
respectively. The mean final construction duration was 1348 calendar days.
4.4 Distribution of Projects by Design and Construction Costs
In this section, Clark County road and flood control projects as well as Texas DOT
road projects are described on the basis of basic design cost, total design cost, final
construction cost, and total project cost. All the costs are expressed in million dollars.

56
The maximum, minimum, and sum of each kind of projects are described in the sub-
sections.
4.4.1 Design and Construction Costs for Clark County’s Public Flood Control Projects
The distribution of the basic design cost (in $ million) of 11 Clark County public
flood control projects is presented in a histogram with normality curve (Figure 20). The
curve plotted with the histogram indicates the normality of the data distribution. The
normality test procedure and results are described in Chapter 5.
The minimum and maximum basic design costs are 0.04 and 1.10 million dollars,
respectively. The sum of basic design cost is 6.23 million dollars.
Figure 20. Histogram of the basic design cost (in $ million) of Clark County flood
control projects
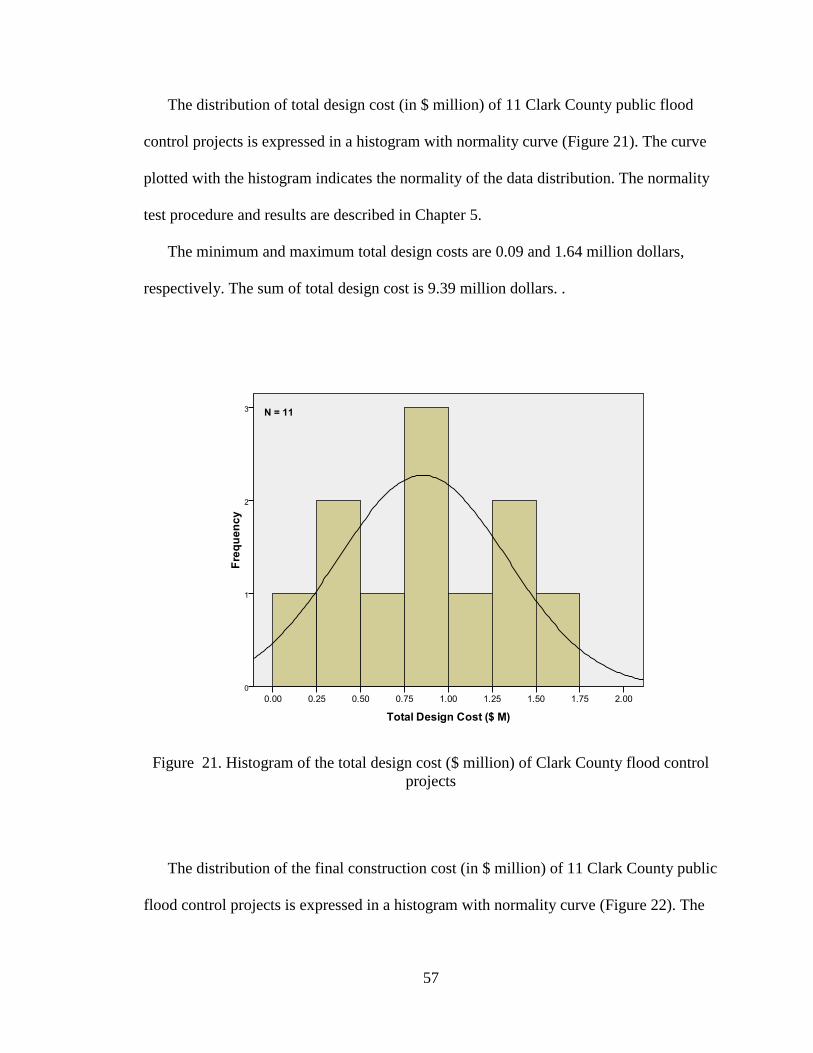
57
The distribution of total design cost (in $ million) of 11 Clark County public flood
control projects is expressed in a histogram with normality curve (Figure 21). The curve
plotted with the histogram indicates the normality of the data distribution. The normality
test procedure and results are described in Chapter 5.
The minimum and maximum total design costs are 0.09 and 1.64 million dollars,
respectively. The sum of total design cost is 9.39 million dollars. .
Figure 21. Histogram of the total design cost ($ million) of Clark County flood control
projects
The distribution of the final construction cost (in $ million) of 11 Clark County public
flood control projects is expressed in a histogram with normality curve (Figure 22). The

58
curve plotted with the histogram indicates a slightly right-skewed data distribution.
Thorough normality test procedures and their results are described in Chapter 5.
The minimum and maximum total design costs are 2.99 and 18.57 million dollars,
respectively. The sum of final construction cost is 85.01 million dollars.
Figure 22. Histogram of the final construction cost (in $ million) of Clark County flood
control projects
The distribution of total project cost which the sum of the total design cost and the
final construction cost in $ million of 11 Clark County public flood control projects is
expressed in a histogram with normality curve (Figure 23). The curve plotted with the
histogram indicates an almost normally distributed data set. Thorough normality test
procedures and their results are described in Chapter 5.

59
The minimum and maximum total design costs are 3.31 and 19.03 million dollars,
respectively. The sum of total project cost is 94.39 million dollars.
Figure 23. Histogram of the total project cost (in $ million) of Clark County flood
control projects
4.4.2 Clark County Public Road Projects’ Design and Construction Costs
The histogram with normality curves of distribution for 47 Clark County public road
projects, with respect to final construction cost, basic design cost, total design cost, and
total project cost in million dollars, are plotted in Figure B- 10, Figure B- 11, Figure B-
12, Figure B- 13, respectively. The curves were slightly right-skewed, indicating a non-
normally distributed data set. Detailed normality test procedures and their results are
described in Chapter 5.
60
The minimum and maximum basic design costs are 0.12 and 4.15 million dollars,
respectively. The sum of basic design cost of all projects cost is 59.16 million dollars.
The minimum and maximum total design cost of 47 road projects are 0.12 and 4.88
million dollars. The sum of total design cost is 75.33 million dollars. The minimum and
maximum final construction costs of these projects are 0.21 to 50.39 million dollars,
respectively. The sum of final construction cost is 634.27 million dollars. The sum of
total project cost of all 47 road projects is 709.60 million dollars. The minimum and
maximum total project cost is 0.34 to 53.35 million dollars, respectively.
4.4.3 Design and Construction Costs for Clark County’s Public Road and Flood Control
Projects
Clark County road and flood control projects were collected in a single data set, and
studied. The histogram with normality curves of distribution of 58 Clark County public
road projects, with respect to final construction cost, basic design cost, total design cost,
and total project cost in million dollars, was plotted as shown in Figure B- 20, Figure B-
21, Figure B- 22, Figure B- 23, respectively. The curves were slightly right-skewed,
indicating a non-normally distributed data set. Detailed normality test procedures and
their results are described in Chapter 5.
The minimum and maximum basic design costs are 0.04 and 4.15 million dollars,
respectively. The sum of basic design cost of all projects cost is 65.40 million dollars.
The minimum and maximum total design costs of 58 projects are 0.09 and 4.88 million
dollars, respectively. The sum of total design cost is 84.72 million dollars. The minimum
and maximum final construction costs of these projects are 0.21 to 50.39 million dollars,
respectively. The sum of final construction cost is 719.28 million dollars. The sum of

61
total project cost of all 58 projects is 804 million dollars. The minimum and maximum
total project costs are 0.34 to 53.35 million dollars, respectively.
4.4.4 TXDOT Road Projects’ Design and Construction Costs
The distribution of basic design cost (in $ million) of 17 Texas Department of
Transportation road projects is presented in a histogram with normality curve (Figure 24).
The curve plotted with histogram indicates a non-normal distribution of data. The
normality test procedure and results are described in Chapter 5.
The minimum and maximum basic design costs are 0.04 and 1.10 million dollars,
respectively. The sum of basic design cost is 214.79 million dollars.
Figure 24. Histogram of the basic design cost (in $ million) of TXDOT road projects

62
The distribution of final construction cost (in $ million) of 17 Texas DOT road
projects is presented in a histogram with a normality curve (Figure 25). The curve plotted
with histogram indicates a normality of data distribution. The normality test procedure
and results are described in Chapter 5. The minimum and maximum final construction
costs are 31.24 and 288 million dollars, respectively. The sum of basic design cost is
2,526.04 million dollars.
Figure 25. Histogram of the final construction cost (in $ million) of TXDOT road
projects
The distribution of total project cost (in $ million) of 17 Texas DOT road projects is
presented in a histogram with a normality curve (Figure 26). The curve plotted with the
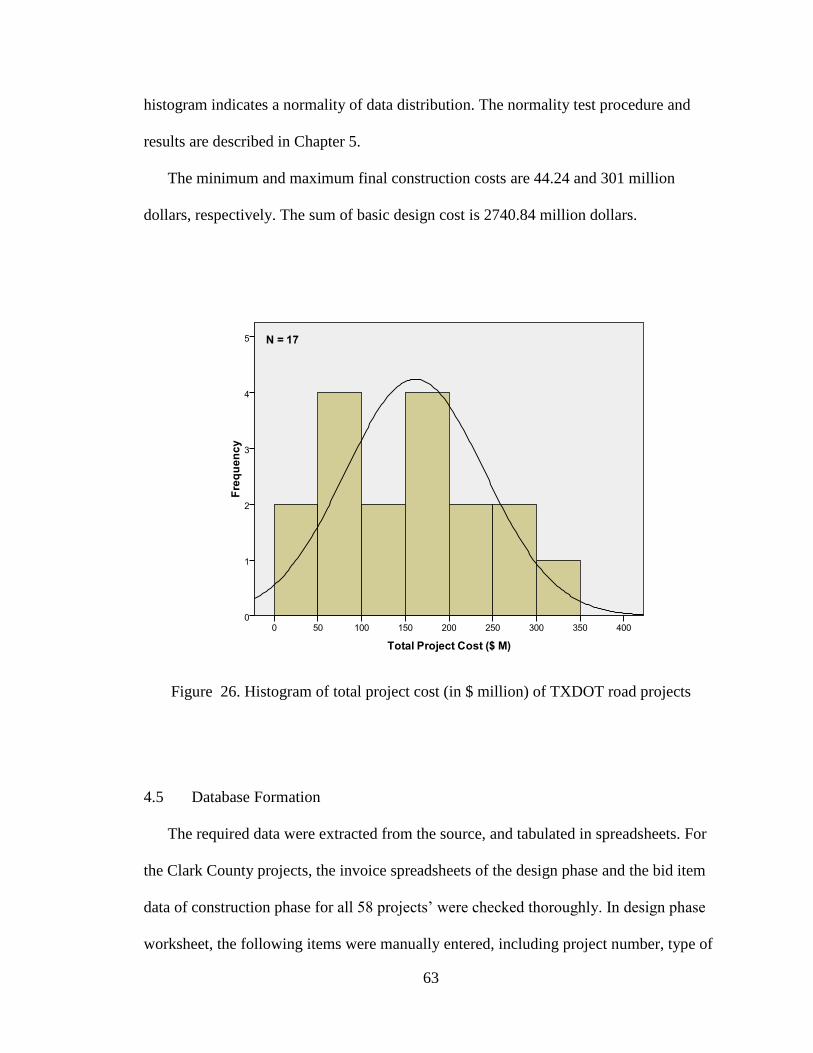
63
histogram indicates a normality of data distribution. The normality test procedure and
results are described in Chapter 5.
The minimum and maximum final construction costs are 44.24 and 301 million
dollars, respectively. The sum of basic design cost is 2740.84 million dollars.
Figure 26. Histogram of total project cost (in $ million) of TXDOT road projects
4.5 Database Formation
The required data were extracted from the source, and tabulated in spreadsheets. For
the Clark County projects, the invoice spreadsheets of the design phase and the bid item
data of construction phase for all 58 projects’ were checked thoroughly. In design phase
worksheet, the following items were manually entered, including project number, type of
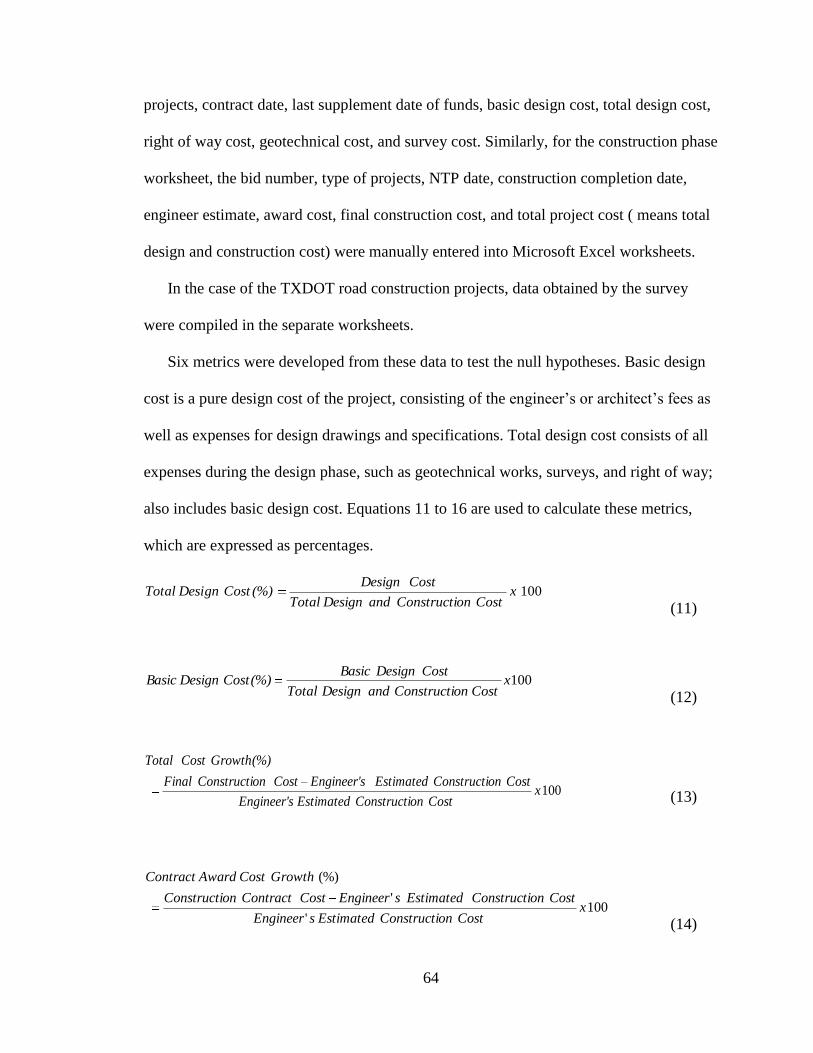
64
projects, contract date, last supplement date of funds, basic design cost, total design cost,
right of way cost, geotechnical cost, and survey cost. Similarly, for the construction phase
worksheet, the bid number, type of projects, NTP date, construction completion date,
engineer estimate, award cost, final construction cost, and total project cost ( means total
design and construction cost) were manually entered into Microsoft Excel worksheets.
In the case of the TXDOT road construction projects, data obtained by the survey
were compiled in the separate worksheets.
Six metrics were developed from these data to test the null hypotheses. Basic design
cost is a pure design cost of the project, consisting of the engineer’s or architect’s fees as
well as expenses for design drawings and specifications. Total design cost consists of all
expenses during the design phase, such as geotechnical works, surveys, and right of way;
also includes basic design cost. Equations 11 to 16 are used to calculate these metrics,
which are expressed as percentages.
100xCostonConstructiandDesignTotal
CostDesign(%)CostgnTotal Desi
(11)
100xCostonConstructiandDesignTotal
CostDesignBasic(%)CostDesignBasic
(12)
100xCostonConstructiEstimatedEngineer's
CostonConstructiEstimatedEngineer'sCostonConstructiFinal
(%)GrowthCostTotal
(13)
100'
'
(%)
xCostonConstructiEstimatedsEngineer
CostonConstructiEstimatedsEngineerCostContractonConstructi
GrowthCostAwardContract
(14)

65
100
(%)
xCostContractonConstructi
CostContractonConstructiCostonConstructiFinal
GrowthCostonConstructi
(15)
100
(%)
xDurationContractonConstructi
DurationContractonConstructiDurationonConstructiFinal
GrowthScheduleonConstructi
(16)
For further analysis, all these metrics were calculated by using Microsoft Excel
spreadsheets. The Engineering News Record Construction Cost Indices were manually
entered into the spreadsheets to get the 2010 equivalent costs. These cost indices were
used to normalize the cost data. All the design cost and final construction data were
converted to 2010 equivalent costs. All the above metrics were relative metrics expressed
in terms of percentages. Therefore, it was not necessary to convert all the cost data into
2010 equivalent cost. However, the design costs and final construction cost were
converted to 2010 equivalent cost, because this study determines the relationship between
these two variables; and the regression model was developed to predict the final
construction cost of the projects by using the design cost as an input variable. If the cost
data was not normalized, then the model developed would not have reflected an accurate
prediction of the final construction cost.
4.6 Engineering News Record Construction Cost Indices
The Engineering News Record Construction Cost Indices were used to convert all
costs, such as basic design cost, total design cost, final construction cost, and total project
cost, to their 2010 equivalent costs. Table 7 shows the average ENR Cost Indices to
adjust the cost. Table A- 12 shows the detailed ENR Cost Indices in monthly basis.

66
Table 7. ENR cost indices
Year Index Year Index
1991 4835 2001 6334
1992 4985 2002 6538
1993 5210 2003 6695
1994 5408 2004 7115
1995 5471 2005 7446
1996 5620 2006 7751
1997 5826 2007 7959
1998 5920 2008 8310
1999 6059 2009 8570
2000 6221 2010 8952
Equations 17 and 18 were used for adjusting the design and construction costs.
actoract Date*F the Contrt based onDesign Cosst in Design CoEquivalent 2010 (17)
Where,
Date Contract Index ofENR Cost
December Index ofENR Cost Factor
2010
Factor NTP Date*sed on theon Cost baConstructin ion Cost i ConstructEquivalent 2010 (18)
Where,
te NTP Da Index ofENR Cost
December Index ofENR Cost Factor
2010

67
CHAPTER 5
DATA ANALYSIS AND RESULTS
This chapter thoroughly describes data analysis and includes statistical assumptions
tests, descriptive statistics, correlation tests, regression analyses, and scatter plots with
detailed interpretations. The purpose of this analysis was to find correlation of design cost
with cost growth and schedule growth, and also to find a reliable mechanism to display
the relationship between the predicted and historical data.
To achieve objective of this research, 47 Clark County road projects and 11 Clark
County flood control projects were analyzed separately, and then the combined 58 Clark
County projects for both road and flood control were analyzed. The separate and
combined project analyses were compared.
5.1 Data Preparation for Analysis
A set of data were prepared for 47 Clark County road projects in a spreadsheet and
uploaded to Statistical Package for the Social Sciences Incorporated (SPSS Inc.) to
conduct statistical analyses. Another set of data were prepared for 11 Clark County flood
control projects in a spreadsheet and those data were copied to SPSS software to conduct
statistical analyses. Similarly, a combined 58 Clark County road and flood control
projects data set were analyzed using SPSS software. Then, the results of these analyses
were compared. Additionally, a set of data were prepared for 17 Texas Department of
Transportation road projects and analyzed with similar procedure as discussed above. To
prove the results from Clark County data, the results of both TXDOT and CCDPW data
were compared.

68
5.2 Descriptive Statistics Overview
A descriptive statistics of Clark County road and flood control projects were
determined in separate and combined set of data for different types of costs: basic design
cost, total design cost, estimated cost, contract award cost, final construction cost, total
project cost, contract award cost growth, total cost growth, and construction cost growth.
A similar procedure was followed for Texas Department of Transportation road projects.
This section summarizes the various types of costs, including their maximum, minimum,
mean and standard deviation.
5.2.1 Descriptive Statistics for Clark County Road Projects
Various types of costs of all metrics for 47 Clark County road projects are
summarized in Table 8. The mean basic design cost is $1,258,800, and the minimum and
maximum values are $124,770 and $4,150,740, respectively. The basic design cost
deviated by $971,600. The mean total design cost is $ 1,602,800, and the minimum and
maximum values are $124,770 and $ 4,880,570, respectively. The total design cost
deviated by $ 1,193,100. The maximum and minimum final construction costs of these
projects are $212,880 and $50,385,080, respectively, and the mean is $13,495,000. The
mean of contract award cost growth, total cost growth, and construction cost growth are -
$ 592,940, $ 69,390 and $ 662,340 respectively. The negative sign for dollar amount of $
524,390 indicates a decrease in contract award cost growth. The minimum costs of
contract award cost growth, total cost growth, and construction cost growth have negative
values, indicating a decrease in cost growth.
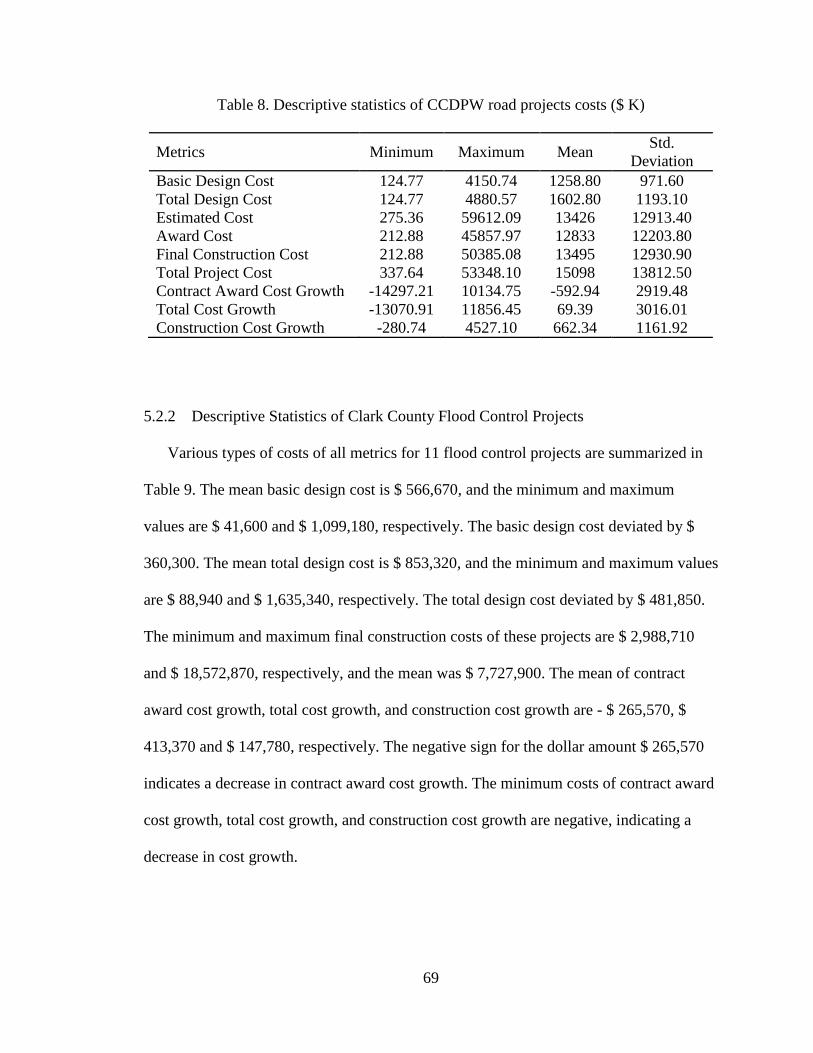
69
Table 8. Descriptive statistics of CCDPW road projects costs ($ K)
Metrics Minimum Maximum Mean Std.
Deviation
Basic Design Cost 124.77 4150.74 1258.80 971.60
Total Design Cost 124.77 4880.57 1602.80 1193.10
Estimated Cost 275.36 59612.09 13426 12913.40
Award Cost 212.88 45857.97 12833 12203.80
Final Construction Cost 212.88 50385.08 13495 12930.90
Total Project Cost 337.64 53348.10 15098 13812.50
Contract Award Cost Growth -14297.21 10134.75 -592.94 2919.48
Total Cost Growth -13070.91 11856.45 69.39 3016.01
Construction Cost Growth -280.74 4527.10 662.34 1161.92
5.2.2 Descriptive Statistics of Clark County Flood Control Projects
Various types of costs of all metrics for 11 flood control projects are summarized in
Table 9. The mean basic design cost is $ 566,670, and the minimum and maximum
values are $ 41,600 and $ 1,099,180, respectively. The basic design cost deviated by $
360,300. The mean total design cost is $ 853,320, and the minimum and maximum values
are $ 88,940 and $ 1,635,340, respectively. The total design cost deviated by $ 481,850.
The minimum and maximum final construction costs of these projects are $ 2,988,710
and $ 18,572,870, respectively, and the mean was $ 7,727,900. The mean of contract
award cost growth, total cost growth, and construction cost growth are - $ 265,570, $
413,370 and $ 147,780, respectively. The negative sign for the dollar amount $ 265,570
indicates a decrease in contract award cost growth. The minimum costs of contract award
cost growth, total cost growth, and construction cost growth are negative, indicating a
decrease in cost growth.

70
Table 9. Descriptive statistics of CCDPW flood control projects costs ($ K)
Metrics Minimum Maximum Mean Std.
Deviation
Basic Design Cost 41.60 1099.18 566.67 360.30
Total Design Cost 88.94 1635.34 853.32 481.85
Estimated Cost 2195.93 17729.01 7314.50 5573.58
Award Cost 2919.21 18701.82 7580.10 5508.93
Final Construction Cost 2988.71 18572.87 7727.90 5466.29
Total Project Cost 3307.16 19026.59 8581.20 5488.14
Contract Award Cost Growth -1446.73 1848.71 -265.57 1037.35
Total Cost Growth -1265.88 1759.10 413.37 1008.29
Construction Cost Growth -209.34 739.03 147.78 270.10
5.2.3 Descriptive Statistics of Combined Clark County Road and Flood Control
Projects
Various types of costs of all metrics for the combined 58 road and flood control
projects are summarized in Table 10. The mean basic design cost is $ 1,127,500, and the
minimum and maximum value was $ 41,600 and $ 4,150,740, respectively. The basic
design cost deviated by $ 927,100. The mean total design cost is $ 1,460,700, and the
minimum and maximum values are $ 88,940 and $ 4,880,570, respectively. The total
design cost deviated by $ 1,130,210. The minimum and maximum final construction
costs of these projects are $ 212,880 and $ 50,385,080, and the mean is $ 12,401,000.
The mean of contract award cost growth, total cost growth, and construction cost growth
are - $ 430 120, $ 134,630 and $ 564,750, respectively. The negative sign for the dollar
amount of $ 430,120 indicates a decrease in contract award cost growth. The minimum
costs for contract award cost growth, total cost growth, and construction cost growth
were negative, indicating a decrease in cost growth.

71
Table 10. Descriptive statistics of CCDPW road and flood control projects costs ($ K)
Metrics Minimum Maximum Mean Std.
Deviation
Basic Design Cost 41.60 4150.74 1127.50 927.10
Total Design Cost 88.94 4880.57 1460.70 1130.21
Estimated Cost 275.36 59612.10 12267 12077.40
Award Cost 212.88 45857.97 11837 11394.30
Final Construction Cost 212.88 50385.08 12401 12057.50
Total Project Cost 337.64 53348.10 13862 12880
Contract Award Cost Growth -14297.21 10134.75 -430.12 2680
Total Cost Growth -13070.91 11856.45 134.63 2745.49
Construction Cost Growth -280.74 4527.10 564.75 1069.45
5.2.4 Descriptive Statistics of Texas Department of Transportation Road Projects
Various types of costs of all metrics for 17 road projects are summarized in Table 11.
The mean basic design cost is $ 12,635,000, and the minimum and maximum values are $
3,633,260 and $ 58,893,000, respectively. The basic design cost deviated by $
12,571,300. The minimum and maximum final construction costs of these projects are $
34,239,320 and $ 288,000,000, respectively, and the mean is $ 148,590,000.
Table 11. Descriptive statistics of TXDOT road projects costs ($ K)
Metrics Minimum Maximum Mean Std.
Deviation
Basic Design Cost 3633.26 58893 12635 12571.30
Final Construction Cost 34239.32 288000 148590 78699.70
Total Project Cost 44239.32 301000 161230 79972.60

72
5.2.5 Descriptive Statistics of Construction Schedule Growth of various projects
Construction schedule growth for various projects is summarized in Table 12. The
mean construction schedule growth of CCDPW road projects is 21.18%, and the
minimum and maximum values are -36.67% and 100%, respectively. The construction
schedule growth deviated by 24.28%. Similarly, the descriptive statistics of construction
schedule growth of CCDPW flood control projects, CCDPW both road, and flood control
projects, TXDOT road projects are listed in Table 12. The mean of construction schedule
growth of TXDOT road projects is lower than that for other projects. The standard
deviation of construction schedule growth of CCDPW flood control projects is greater
than that for other projects.
Table 12. Descriptive statistics of construction schedule growth of various projects (%)
Projects No. of
Projects Minimum Maximum Mean
Std.
Deviation
CCDPW Road Projects 47 -36.67 100 21.18 24.28
CCDPW Flood Control
Projects
11 -46.67 151.85 40.43 56.48
CCDPW Both Road and
Flood Control Projects
58 -46.67 151.85 24.83 33.07
TXDOT Road Projects 17 0 66 10.18 15.71
5.3 Statistical Tests
5.3.1 Statistical Tests for Verification of Assumptions of the Correlation Analysis
Correlation tests were conducted for design cost (basic design cost as well as total
design cost) with contract award cost growth, total cost growth, construction cost growth,
and construction schedule growth; the results are discussed in Sections 5.5.
73
Before conducting correlation analysis, the assumptions of correlation analysis, such
as the normality test, linearity test, heteroscedasticity test, and outliers test should be
conducted.
5.3.1.1 Normality Test
The Anderson-Darling test was conducted to check the normality of the data
distribution curves. This test assumes that the higher the p-value (p > 0.05), the better the
normality of curve. The p-value of various metrics obtained from the Anderson-Darling
test is presented in Table 13. The results show that data of contract award cost growth,
and total cost growth of Clark County road projects are normally distributed. Similarly,
basic design cost (%), total design cost (%), contract award cost growth (%), total cost
growth (%), construction cost growth (%), construction schedule growth (%), basic
design cost ($ million), and total project cost ($ million) of Clark County flood control
projects are normally distributed. Combined Clark County road and flood control projects
were tested, and it was found that total cost growth is normally distributed. The contract
award cost growth (%), total cost growth (%), final construction cost growth ($ million),
and total project cost ($ million) of the 17 TXDOT road projects are normally distributed.
Also, the contract award cost growth (%) and total cost growth (%) of combined TXDOT
and Clark County road projects are normally distributed.

74
Table 13. Anderson-Darling normality test results
P value of Normality Test
Metrics
Clark County
TXDOT
TXDOT and
Clark
County
Road
Projects
(N = 47)
Flood
Control
Projects
(N = 11)
Road and
Flood
Control
Projects
(N = 58)
Road
Projects
(N = 17)
Road
Projects
(N = 64)
Basic Design Cost
(%) 0.0005 0.38 0.0005 0.0005 0.0005
Total Design Cost
(%) 0.0005 0.48 0.0005 NA NA
Contract award cost
growth (%) 0.21 0.51 0.047 0.18 0.08
Total Cost Growth
(%) 0.31 0.89 0.141 0.08 0.08
Construction cost
growth (%) 0.0005 0.84 0.0005 0.0005 0.0005
Construction
Schedule growth
(%)
0.035 0.55 0.0005 0.0005 0.0005
Final Construction
Cost ($ M) 0.0005 0.024 0.0005 0.62 0.0005
Basic Design Cost
($ M) 0.0008 0.64 0.0005 0.0005 0.0005
Total Project Cost
($ M) 0.0005 0.06 0.0005 0.61 0.0005
Figure 27 shows the histogram of contract award cost growth for Clark County road
projects. This histogram shows that the curve is normally distributed. The histograms
with normality curves for other costs are listed in Appendix B.
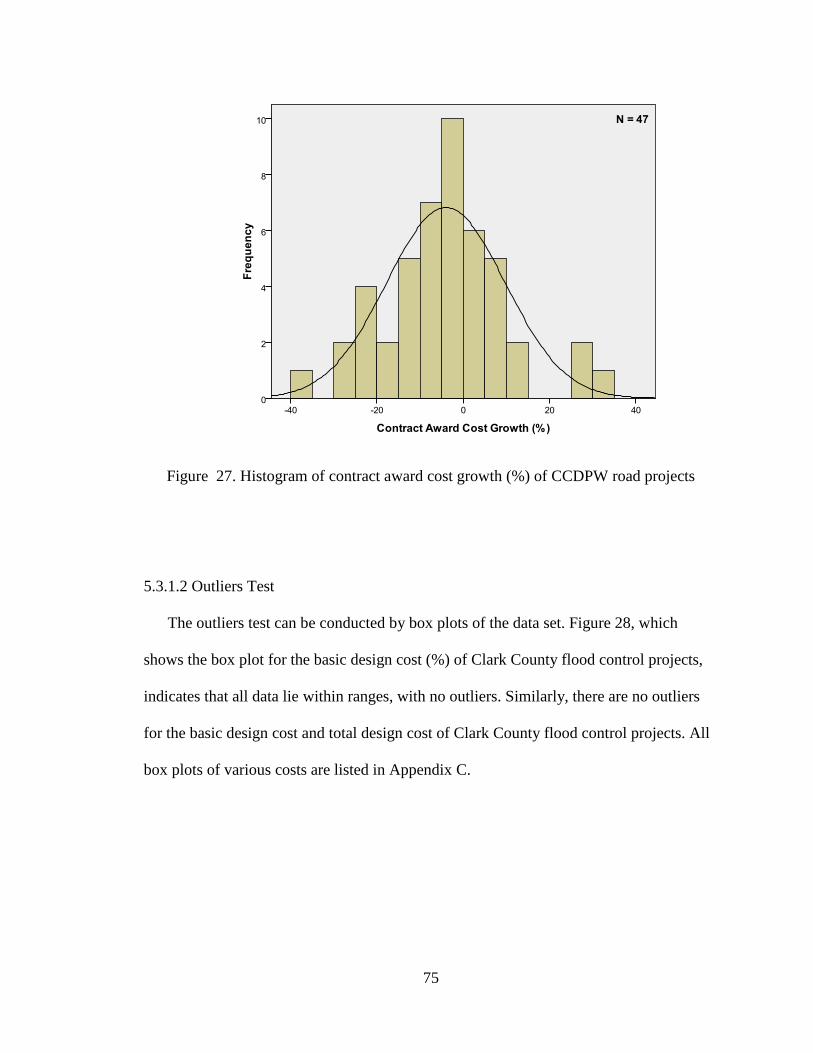
75
Figure 27. Histogram of contract award cost growth (%) of CCDPW road projects
5.3.1.2 Outliers Test
The outliers test can be conducted by box plots of the data set. Figure 28, which
shows the box plot for the basic design cost (%) of Clark County flood control projects,
indicates that all data lie within ranges, with no outliers. Similarly, there are no outliers
for the basic design cost and total design cost of Clark County flood control projects. All
box plots of various costs are listed in Appendix C.

76
Figure 28. Box plot of basic design cost (%) of CCDPW flood control projects
5.3.1.3 Linearity Test
Scatter plots of correlation between independent variable and its studentized residual
was plotted to conduct linearity test. Figure 29 shows the scatter plot between total design
cost and its studentized residual. The horizontal line in this scatter plot indicates the
condition of linearity.

77
Figure 29.Residual plot with for total design cost for CCDPW road projects
5.3.1.4 Heteroscedasticity Test
Heteroscedasticity can be studied by plotting the predicted values against the residual
values. After conducting regression analysis of total design cost and total cost growth,
studentized residual and unstandardized predicted values were determined, and plotted a
scatter diagram between predicted values and residual values, as shown in Figure 30.
There is no constant variance in errors, indicating absence of homoscedasticity. Similarly,
the studentized residual and unstandardized predicted values for other variables were
plotted and analyzed for heteroscedasticity , as shown in Appendix F.

78
Figure 30.Residual plot with predicted value (for total design cost) for CCDPW road
projects
5.3.2 Statistical Tests for Verification of Assumptions of Regression Analysis
Residual data analysis was conducted to determine the more precise prediction of
dependent variables on the basis of the independent variables. The term ―residual‖ is
equal to the difference between the observed value of y and predicted value of y. It is also
called the estimated error value (ε = yy ˆ ). The assumptions of the linear regression
model can be checked by residual analysis (Mendenhall and Sincich, 2007). For the
residual analysis, the variables were transformed into their respective required forms, and
then, a linear regression analysis was conducted with the transformed variables and
residuals that were generated. To conduct this research, un-standardized predicted values
and standardized residuals were studied to determine their sensitivity. The tests for the
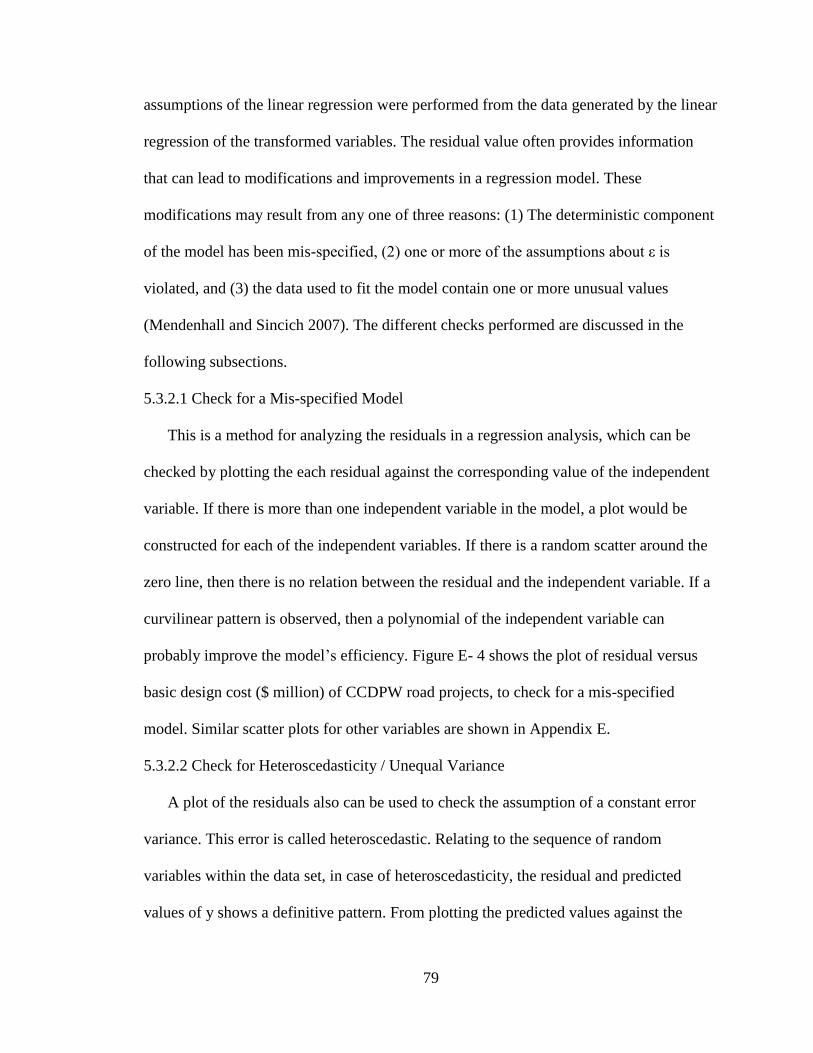
79
assumptions of the linear regression were performed from the data generated by the linear
regression of the transformed variables. The residual value often provides information
that can lead to modifications and improvements in a regression model. These
modifications may result from any one of three reasons: (1) The deterministic component
of the model has been mis-specified, (2) one or more of the assumptions about ε is
violated, and (3) the data used to fit the model contain one or more unusual values
(Mendenhall and Sincich 2007). The different checks performed are discussed in the
following subsections.
5.3.2.1 Check for a Mis-specified Model
This is a method for analyzing the residuals in a regression analysis, which can be
checked by plotting the each residual against the corresponding value of the independent
variable. If there is more than one independent variable in the model, a plot would be
constructed for each of the independent variables. If there is a random scatter around the
zero line, then there is no relation between the residual and the independent variable. If a
curvilinear pattern is observed, then a polynomial of the independent variable can
probably improve the model’s efficiency. Figure E- 4 shows the plot of residual versus
basic design cost ($ million) of CCDPW road projects, to check for a mis-specified
model. Similar scatter plots for other variables are shown in Appendix E.
5.3.2.2 Check for Heteroscedasticity / Unequal Variance
A plot of the residuals also can be used to check the assumption of a constant error
variance. This error is called heteroscedastic. Relating to the sequence of random
variables within the data set, in case of heteroscedasticity, the residual and predicted
values of y shows a definitive pattern. From plotting the predicted values against the
80
residual values, it may be observed that the value of the residuals increases with the
increase of predicted values. In this case, different transformations on the independent
variables should be implemented depending upon the nature of the plot. Poisson,
Binomial, and Multiplicative are some commonly encountered transformations. A scatter
plot is desirable to avoid any further transformations of variables. Figure F-2 shows the
scatter plot between studentized residual and unstandardized predicted value for CCDPW
road projects, to check heteroscedasticity. Similar scatter plots for other variables are
shown in Appendix F.
5.3.2.3 Check for Non-normal Errors
Normality refers that the distribution of both variables is not skewed in either the
positive or the negative direction. The distribution of errors can be tested by plotting a
histogram of errors. Three statistical tests: the Kolmogorov-Smirnov test, the Anderson-
Darling test, and the Shapiro-Wilk test can be used to check the normality of the sample
distribution. In this study, the Anderson-Darling test is used to conduct the normality test.
Moreover, the histogram-normality curve is plotted and compared with the results
obtained from the Anderson-Darling test for validation.
The transformation of variables requires extremely skewed plots. The
transformations, in this case, resemble the transformations in the previous case. Non-
normality may also result, due to outliers. However, moderate departures from the
assumption of normality have very little effect on the validity of the statistical tests,
confidence intervals, and prediction intervals. Table 12 shows the results for Anderson-
Darling test for regression model parameters, such as total design cost, basic design cost,
and final construction cost.

81
5.3.2.4 Check for Correlated Errors
Whenever the data in the research corresponds to different time frames, a correlated
errors check should be performed. If any pattern is observed in the plot of residuals
against time, a time series analysis should be done to address the problem. In such
conditions, the introduction of time variables can be helpful. A random scatter plot is
useful to verify that the linear model is sufficient for the analysis. Figure I-1 shows the
scatter plot between studentized residual and design contract year.
5.3.2.5 Check for outliers
Outliers are checked by locating residuals that lie a distance of 3s or more above or
below 0 on a residual plot versus y . An investigation should be conducted to determine
the cause of any outlier before eliminating it. Those outliers found due to coding or
recording error should be fixed or removed. Figure C-7 shows the box plot of basic
design cost ($ million). The outlier was removed before developing a regression model.
Similarly, box plot for other parameters are shown in Appendix C.
5.4 Correlation of Basic Design Cost with Other Metrics for Clark County Projects
The data was analyzed to determine the Pearson correlation coefficients of the basic
design cost with the contract award cost growth, total cost growth, construction cost
growth, and construction schedule growth for Clark County road and flood control
projects. Two sets of analyses were done to determine the effect of basic design cost on
contract award cost growth, total cost growth, construction cost growth, and construction
schedule growth. The first analysis was conducted with all the sample data, and the
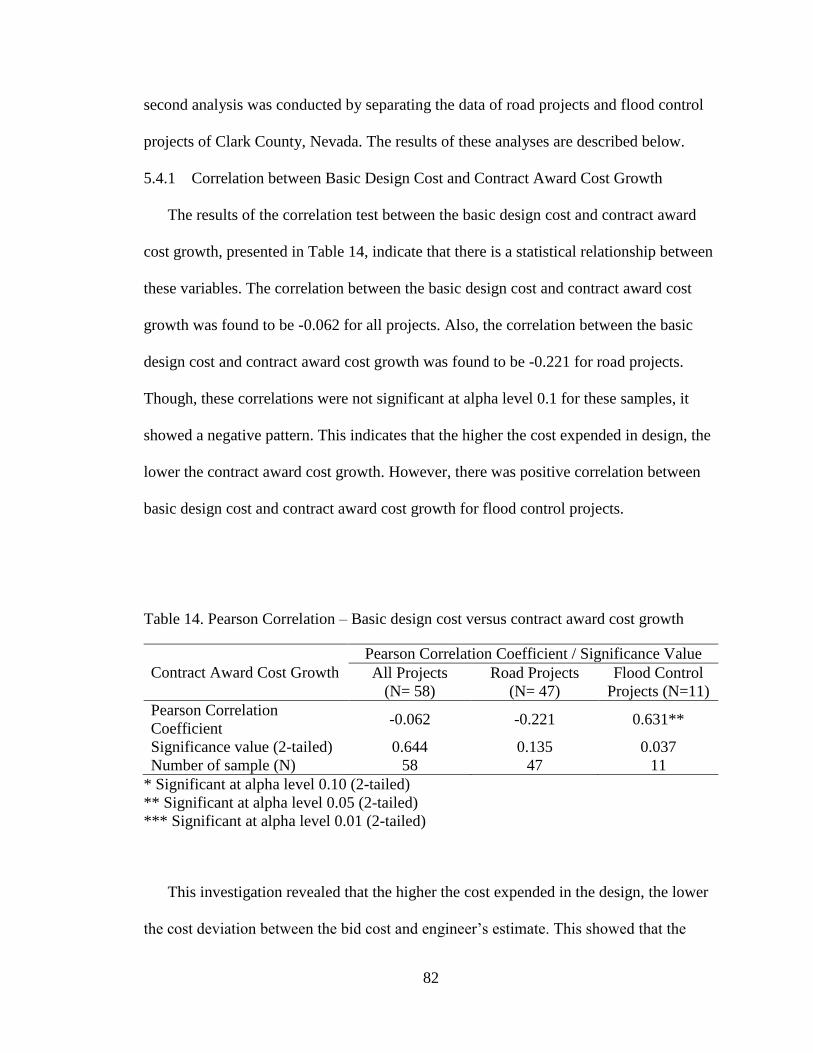
82
second analysis was conducted by separating the data of road projects and flood control
projects of Clark County, Nevada. The results of these analyses are described below.
5.4.1 Correlation between Basic Design Cost and Contract Award Cost Growth
The results of the correlation test between the basic design cost and contract award
cost growth, presented in Table 14, indicate that there is a statistical relationship between
these variables. The correlation between the basic design cost and contract award cost
growth was found to be -0.062 for all projects. Also, the correlation between the basic
design cost and contract award cost growth was found to be -0.221 for road projects.
Though, these correlations were not significant at alpha level 0.1 for these samples, it
showed a negative pattern. This indicates that the higher the cost expended in design, the
lower the contract award cost growth. However, there was positive correlation between
basic design cost and contract award cost growth for flood control projects.
Table 14. Pearson Correlation – Basic design cost versus contract award cost growth
Contract Award Cost Growth
Pearson Correlation Coefficient / Significance Value
All Projects
(N= 58)
Road Projects
(N= 47)
Flood Control
Projects (N=11)
Pearson Correlation
Coefficient -0.062 -0.221 0.631**
Significance value (2-tailed) 0.644 0.135 0.037
Number of sample (N) 58 47 11
* Significant at alpha level 0.10 (2-tailed)
** Significant at alpha level 0.05 (2-tailed)
*** Significant at alpha level 0.01 (2-tailed)
This investigation revealed that the higher the cost expended in the design, the lower
the cost deviation between the bid cost and engineer’s estimate. This showed that the

83
higher design cost will improve the quality of design and will reduce errors in the design,
resulting in the engineer’s estimate to be accurate. Figure 31 shows the scatter plot of
design cost and contract award cost growth of road projects. Figure D- 2 shows the
scatter plot of basic design cost and contract award cost growth of CCDPW flood control
projects. Figure D- 3 shows the scatter plot of basic design cost and contract award cost
growth of combined road and flood control projects of Clark County public projects.
Figure 31. Scatter plot of basic design cost and contract award cost growth for road
projects

84
5.4.2 Correlation between Basic Design Cost and Total Cost Growth
The results of the correlation test between the basic design cost and total cost growth,
presented in Table 15, indicate that there is a statistical relationship between these
variables. The correlation between the basic design cost and total cost growth was found
to be -0.115 for all projects. Although the correlation was not significantly correlated at
alpha level 0.1 for this sample, it showed a negative correlation. Also, the correlation
between the basic design cost and total cost growth was found to be -0.287 for road
projects. This correlation was significant at alpha level 0.05 for this sample. This
indicates that the relationship between the design cost and the total cost growth is a
negative correlation, which indicates that the higher the cost expended in design, the
lower the total cost growth, resulting in better cost performance. However, there was
positive correlation between basic design cost and contract award cost growth for flood
control projects.
Table 15. Pearson correlation – basic design cost versus total cost growth
Total Cost Growth
Pearson Correlation Coefficient / Significance Value
All Projects
(N= 58)
Road Projects
(N= 47)
Flood Control
Projects (N=11)
Pearson Correlation
Coefficient -0.115 -0.287** 0.559*
Significance value (2-tailed) 0.389 0.05 0.074
Number of sample (N) 58 47 11
* Significant at alpha level 0.10 (2-tailed)
** Significant at alpha level 0.05 (2-tailed)
*** Significant at alpha level 0.01 (2-tailed)

85
This investigation revealed that the higher the cost expended in the design, the lower
the cost deviation between the final construction cost and the engineer’s estimate. This
showed that the higher design cost will improve the quality of design and will reduce
errors in design resulting in the engineer’s estimate to be accurate. Figure 32 shows the
scatter plot of basic design cost and total cost growth for road projects. Figure D- 5 shows
the scatter plot of basic design cost and total cost growth for flood control projects.
Figure D- 6 shows the scatter plot of design cost and total cost growth for the combined
road and flood control projects of Clark County public projects.
Figure 32. Scatter plot of basic design cost and total cost growth for road projects

86
5.4.3 Correlation between Basic Design Cost and Construction Cost Growth
The results of the correlation test between basic design cost and construction cost
growth, presented in Table 16, indicate that there is a statistical relationship between
these variables. The correlation between basic design cost and construction cost growth
was found to be -0.110 for combined projects, -0.119 for road projects, and -0.163 for
flood control projects. Although, the correlation values were not significantly correlated
at alpha level 0.1 for this sample, it showed a negative correlation. This indicates that the
higher the cost expended in design, the lower the construction cost growth, resulting in
better cost performance.
Table 16. Pearson correlation – basic design cost versus construction cost growth
Construction Cost Growth
Pearson Correlation Coefficient / Significance Value
All Projects
(N= 58)
Road Projects
(N= 47)
Flood Control
Projects (N=11)
Pearson Correlation
Coefficient -0.110 -0.119 -0.163
Significance value (2-tailed) 0.411 0.425 0.632
Number of sample (N) 58 47 11
* Significant at alpha level 0.10 (2-tailed)
** Significant at alpha level 0.05 (2-tailed)
*** Significant at alpha level 0.01 (2-tailed)
This investigation revealed that the higher the cost expended in the design, the lower
the cost deviation between the final construction cost and construction contract cost.
Figure D- 7 shows the scatter plot of basic design cost and construction cost growth for
road projects. Figure 33 shows the scatter plot of design cost and construction cost
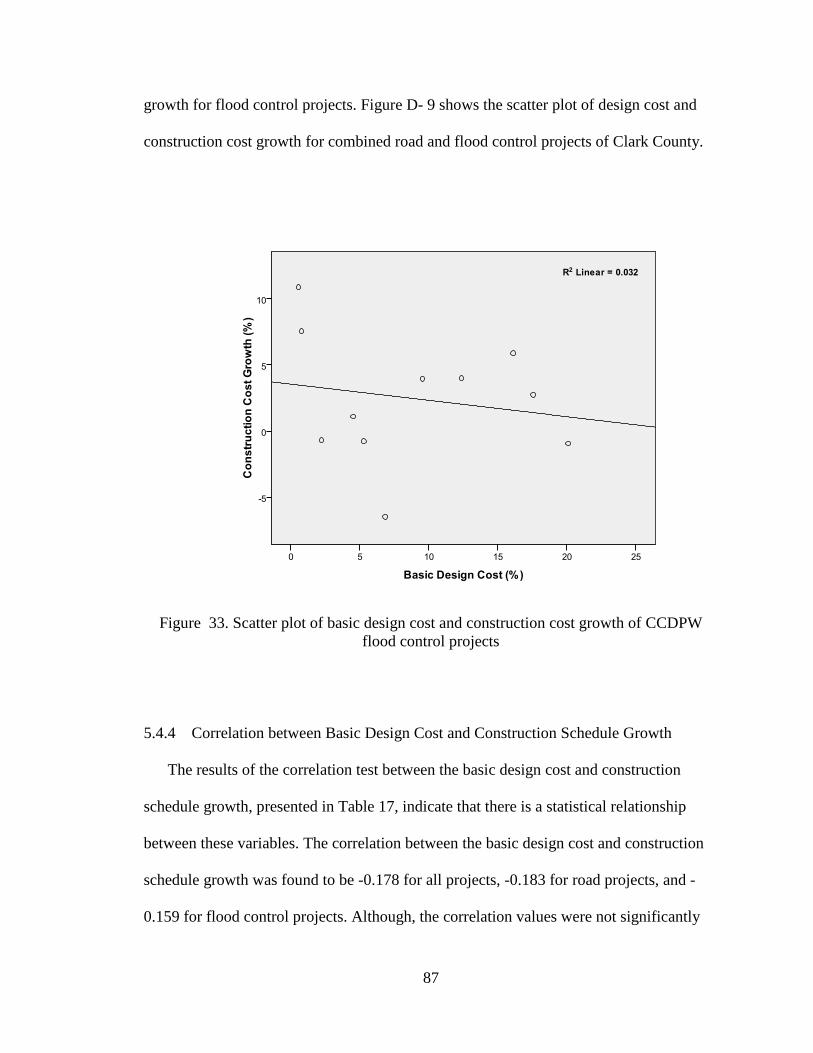
87
growth for flood control projects. Figure D- 9 shows the scatter plot of design cost and
construction cost growth for combined road and flood control projects of Clark County.
Figure 33. Scatter plot of basic design cost and construction cost growth of CCDPW
flood control projects
5.4.4 Correlation between Basic Design Cost and Construction Schedule Growth
The results of the correlation test between the basic design cost and construction
schedule growth, presented in Table 17, indicate that there is a statistical relationship
between these variables. The correlation between the basic design cost and construction
schedule growth was found to be -0.178 for all projects, -0.183 for road projects, and -
0.159 for flood control projects. Although, the correlation values were not significantly

88
correlated at alpha level 0.1 for this sample, it showed a negative correlation. This
indicates that the higher the cost expended in design, the lower the construction schedule
growth, thus the better schedule performance.
Table 17. Pearson correlation – basic design cost versus construction schedule growth
Construction Schedule
Growth
Pearson Correlation Coefficient / Significance Value
All Projects
(N= 58)
Road Projects
(N= 47)
Flood Control
Projects (N=11)
Pearson Correlation
Coefficient -0.178 -0.183 -0.159
Significance value (2-tailed) 0.182 0.219 0.640
Number of sample (N) 58 47 11
* Significant at alpha level 0.10 (2-tailed)
** Significant at alpha level 0.05 (2-tailed)
*** Significant at alpha level 0.01 (2-tailed)
This investigation revealed that the higher the cost expended in the design, the lower
the schedule deviation between the final construction duration and construction contract
duration. Figure D-10 shows the scatter plot of basic design cost and construction
schedule growth of road projects. Figure D- 11 shows the scatter plot of basic design cost
and construction schedule growth of flood control projects. Figure 34 shows the scatter
plot of basic design cost and construction schedule growth of CCDPW combined road
and flood control projects of Clark County public projects.

89
Figure 34. Scatter plot of basic design cost and construction schedule growth of
combined CCDPW flood control and road projects
5.5 Correlation between Total Design Cost and Other Metrics for Clark County
Projects
The data was analyzed to determine the Pearson correlation coefficients of the total
design cost with the contract award cost growth, total cost growth, construction cost
growth, and construction schedule growth for Clark County road and flood control
projects. Two sets of analyses were done to determine the effect of total design cost on
contract award cost growth, total cost growth, construction cost growth, and construction
schedule growth. The first analysis was conducted with all the sample data, and the
second analysis was conducted by separating the data of the road projects and the flood
control projects of Clark County, Nevada. These analysis results are described below.

90
5.5.1 Correlation between Total Design Cost and Contract Award Cost Growth
The results of the correlation test between the total design cost and contract award
cost growth, presented in Table 18, indicate that there is a statistical relationship between
these variables. The correlation between the total design cost and contract award cost
growth was found to be 0.024 for all projects, -0.129 for road projects, and 0.62 for flood
control projects. Although the correlation value for road projects was not significantly
correlated at alpha level 0.1 for this sample, it showed a negative correlation. This
indicates that the higher the cost expended in design, the lower the contract award cost
growth, thus better cost performance.
Table 18. Pearson correlation – total design cost versus contract award cost growth
Contract Award Cost Growth
Pearson Correlation Coefficient / Significance Value
All Projects
(N= 58)
Road Projects
(N= 47)
Flood Control
Projects (N=11)
Pearson Correlation
Coefficient 0.024 -0.129 0.620**
Significance value (2-tailed) 0.859 0.389 0.042
Number of sample (N) 58 47 11
* Significant at alpha level 0.10 (2-tailed)
** Significant at alpha level 0.05 (2-tailed)
*** Significant at alpha level 0.01 (2-tailed)
This investigation revealed that the higher the cost expended in the design, the lower
the cost deviation between the construction contract cost and engineer’s estimated cost.
Figure 35 shows the scatter plot of total design cost and contract award cost growth of
road projects. Figure D- 14 shows the scatter plot of total design cost and contract award
cost growth of flood control projects. Figure D- 15 shows the scatter plot of total design
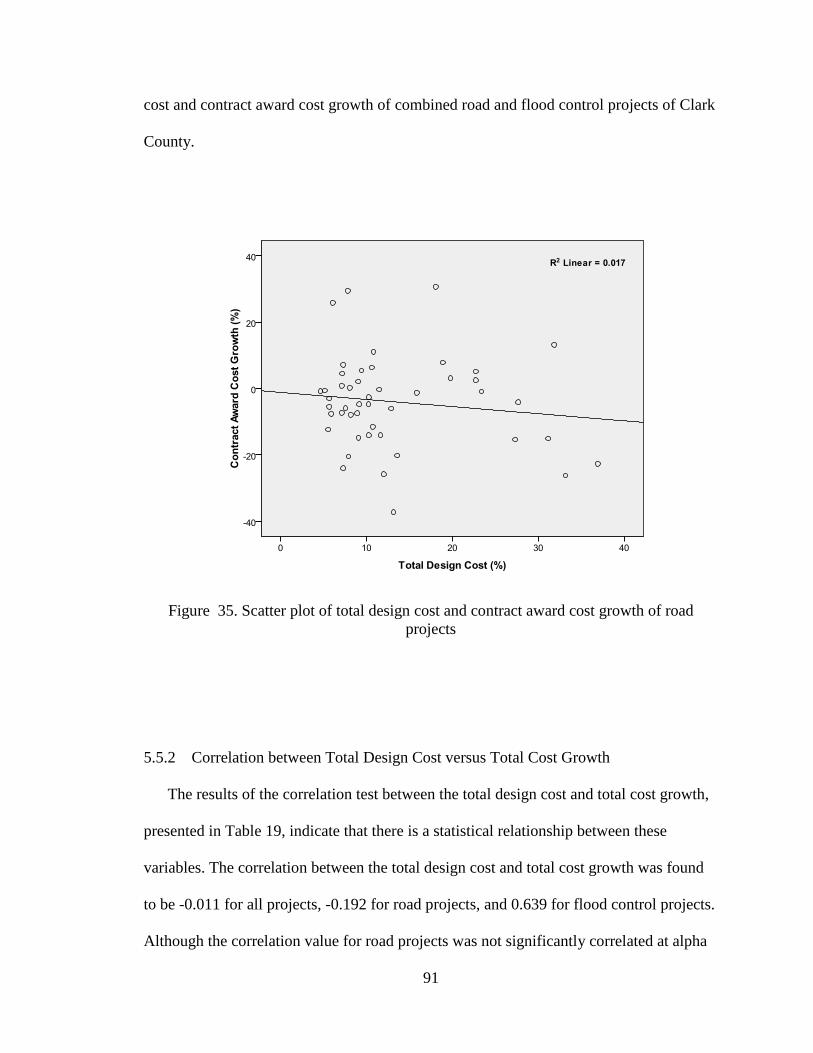
91
cost and contract award cost growth of combined road and flood control projects of Clark
County.
Figure 35. Scatter plot of total design cost and contract award cost growth of road
projects
5.5.2 Correlation between Total Design Cost versus Total Cost Growth
The results of the correlation test between the total design cost and total cost growth,
presented in Table 19, indicate that there is a statistical relationship between these
variables. The correlation between the total design cost and total cost growth was found
to be -0.011 for all projects, -0.192 for road projects, and 0.639 for flood control projects.
Although the correlation value for road projects was not significantly correlated at alpha

92
level 0.1 for this sample, it showed a negative correlation. This indicates that the higher
the cost expended in design, the lower the total cost growth, thus the better cost
performance.
Table 19. Pearson correlation – total design cost versus total cost growth
Total Cost Growth
Pearson Correlation Coefficient / Significance Value
All Projects
(N= 58)
Road Projects
(N= 47)
Flood Control
Projects (N=11)
Pearson Correlation
Coefficient -0.011 -0.192 0.639
Significance value (2-tailed) 0.937 0.195 0.034
Number of sample (N) 58 47 11
* Significant at alpha level 0.10 (2-tailed)
** Significant at alpha level 0.05 (2-tailed)
*** Significant at alpha level 0.01 (2-tailed)
This investigation revealed that the higher the cost expended in the design, the lower
the cost deviation between the final construction cost and engineer’s estimated cost.
Figure 36 shows the scatter plot of total design cost and total cost growth of CCDPW
road projects. Figure D- 17 shows the scatter plot of total design cost and total cost
growth of flood control projects. Figure D- 18 shows the scatter plot of total design cost
and total cost growth of combined road and flood control projects of Clark County.
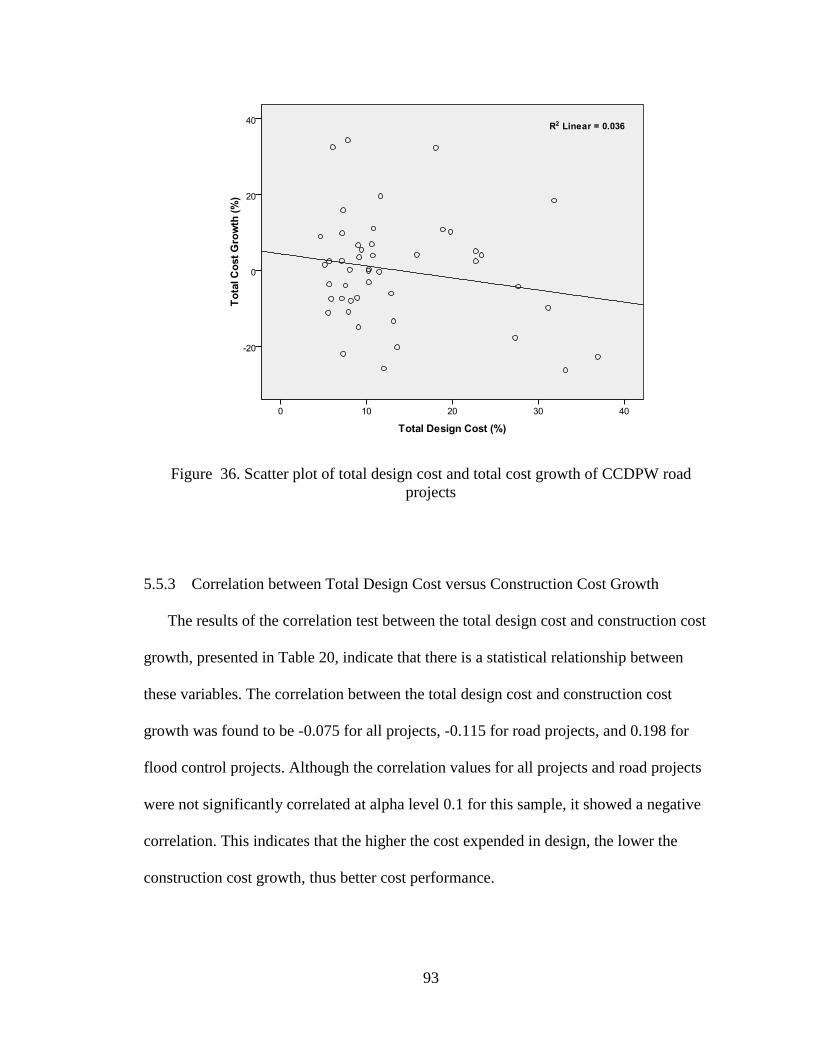
93
Figure 36. Scatter plot of total design cost and total cost growth of CCDPW road
projects
5.5.3 Correlation between Total Design Cost versus Construction Cost Growth
The results of the correlation test between the total design cost and construction cost
growth, presented in Table 20, indicate that there is a statistical relationship between
these variables. The correlation between the total design cost and construction cost
growth was found to be -0.075 for all projects, -0.115 for road projects, and 0.198 for
flood control projects. Although the correlation values for all projects and road projects
were not significantly correlated at alpha level 0.1 for this sample, it showed a negative
correlation. This indicates that the higher the cost expended in design, the lower the
construction cost growth, thus better cost performance.

94
Table 20. Pearson correlation – total design cost versus construction cost growth
Construction Cost Growth
Pearson Correlation Coefficient / Significance Value
All Projects
(N= 58)
Road Projects
(N= 47)
Flood Control
Projects (N=11)
Pearson Correlation
Coefficient -0.075 -0.115 0.198
Significance value (2-tailed) 0.577 0.442 0.559
Number of sample (N) 58 47 11
* Significant at alpha level 0.10 (2-tailed)
** Significant at alpha level 0.05 (2-tailed)
*** Significant at alpha level 0.01 (2-tailed)
This investigation revealed that the higher the cost expended in the design, the lower
the cost deviation between the final construction cost and construction contract cost.
Figure 37 shows the scatter plot of total design cost and construction cost growth of road
projects. Figure D 20 shows the scatter plot of total design cost and construction cost
growth of flood control projects. Figure D 21 shows the scatter plot of total design cost
and construction cost growth of combined road and flood control projects of Clark
County.

95
Figure 37. Scatter plot of total design cost and construction cost growth of CCDPW road
projects
5.5.4 Correlation between Total Design Cost versus Construction Schedule Growth
The results of the correlation test between the total design cost and construction
schedule growth, presented in Table 21, indicate that there is a statistical relationship
between these variables. The correlation between the total design cost and construction
schedule growth was found to be -0.042 for all projects, -0.080 for road projects, and
0.054 for flood control projects. Although the correlation values for all projects and road
projects were not significantly correlated at alpha level 0.1 for this sample, it showed a
negative correlation. This indicates that the higher the cost expended in design, the lower
the construction cost growth, thus the better cost performance.

96
Table 21. Pearson correlation – total design cost versus construction schedule growth
Construction Schedule
Growth
Pearson Correlation Coefficient / Significance Value
All Projects
(N= 58)
Road Projects
(N= 47)
Flood Control
Projects (N=11)
Pearson Correlation
Coefficient -0.042 -0.080 0.054
Significance value (2-tailed) 0.754 0.595 0.874
Number of sample (N) 58 47 11
* Significant at alpha level 0.10 (2-tailed)
** Significant at alpha level 0.05 (2-tailed)
*** Significant at alpha level 0.01 (2-tailed)
This investigation revealed that the higher the cost expended in the design, the lower
the schedule deviation between the final construction duration and construction contract
duration. Figure D- 22 shows the scatter plot of total design cost and construction
schedule growth of road projects. Figure D- 23 shows the scatter plot of total design cost
and construction schedule growth of flood control projects. Figure D- 24 shows the
scatter plot of total design cost and construction schedule growth of combined road and
flood control projects of Clark County.
5.6 Regression Model of Basic Design Cost with Final Construction Cost
The data set of basic design cost and final construction cost were tested for
assumption of correlation. From the box plot, one extreme outlier was removed, and the
correlation analysis conducted. Out of 47 Clark County road projects, only 46 projects
were considered for further analysis. The correlation test was conducted between basic
design cost ($ million) and final construction cost ($ million), result is shown in Table 22,
and indicates that there is a significant statistical relationship between these variables.

97
The correlation between the basic design cost and final construction cost was found to be
0.8 for Clark County road projects. The correlation was significant at alpha level 0.01 for
this sample. This indicates that the relationship between the design cost and the total cost
growth is a positive correlation, which indicates that the higher the cost expended in
design, the higher the final construction cost.
Table 22. Pearson correlation – basic design cost versus final construction cost
Final Construction Cost
Pearson Correlation Coefficient / Significance Value
All Projects
(N= 58)
Road Projects
(N= 46)
Flood Control
Projects (N=11)
Pearson Correlation
Coefficient 0.75** 0.80** 0.015
Significance value (2-tailed) 0.0001 0.0001 0.965
Number of sample (N) 58 46 11
* Significant at alpha level 0.10 (2-tailed)
** Significant at alpha level 0.05 (2-tailed)
*** Significant at alpha level 0.01 (2-tailed)
In considering the Clark County road projects (N = 46), mis-specified model,
heteroscedasticity, and non-normal and correlated errors checks were performed; data
were re-plotted as per regression model assumptions. The scatter plot between the
unstandardized residual and basic design cost ($ million) is shown in Figure E- 3. Also,
the scatter plot between the studentized residual plot and basic design cost ($ million) is
shown in Figure E- 4. The studentized residual versus the unstandardized predicted value
scatter plot is shown in Figure F- 2. The histogram of the residuals shows the normal
distribution of data as shown in Figure G- 2. The plot in Figure H-1 shows that almost all

98
the data point lie between the 95% confidence interval lines. The predicted points and the
historical points for basic design cost ($ million) both lie along the diagonal line.
Therefore, the linear regression model was found acceptable for expressing this relation.
Figure 38 shows the scatter plot between basic design cost and final construction cost for
CCDPW road projects. R-square value of the model found to be 62.30%.
Mathematically, the regression equation for Clark County road project is expressed in
Equation 19. In this equation, final construction cost and basic design cost are expressed
in terms of $ million.
80589 .CostgnBasic Desix .Coststruction Final Con (19)
Figure 38. Scatter plot of basic design cost versus final construction cost for CCDPW
road projects (N = 46)

99
In case of Clark County flood control projects (N = 11), the correlation value between
basic design cost and final construction cost was insignificant, and the number of samples
was very few. Therefore, further analysis was not conducted for this sample.
Additionally, for combined Clark County road and flood control projects (N = 58),
mis-specified model, heteroscedasticity, and non-normal and correlated errors checks
were performed; data were re-plotted as per regression model assumptions. The scatter
plot between unstandardized residual and basic design cost ($ million) is shown in Figure
E- 5. Also, the scatter plot between studentized residual plot and basic design cost ($
million) is shown in Figure E- 6. Studentized residual versus unstandardized predicted
value scatter plot is shown in Figure F- 3. The histogram of the residuals shows the
normal distribution of data as shown in Figure G- 3. The plot in Figure H-3 shows that
almost all the data point lie between the 95% confidence interval lines. The predicted
points and the historical points for basic design cost ($ million) points both lie along the
diagonal line. Therefore, the linear regression model was found acceptable for expressing
this relation. Figure 39 shows the scatter plot between basic design cost and final
construction cost of CCDPW combined road and flood control projects. R-square value
of the model found to be 55.60%.
Mathematically, the regression equation for combined Clark County road and flood
control projects is expressed in Equation 20. In this equation, final construction cost and
basic design cost are expressed in terms of $ million.
46179 .CostgnBasic Desix.osttruction CFinal Cons (20)
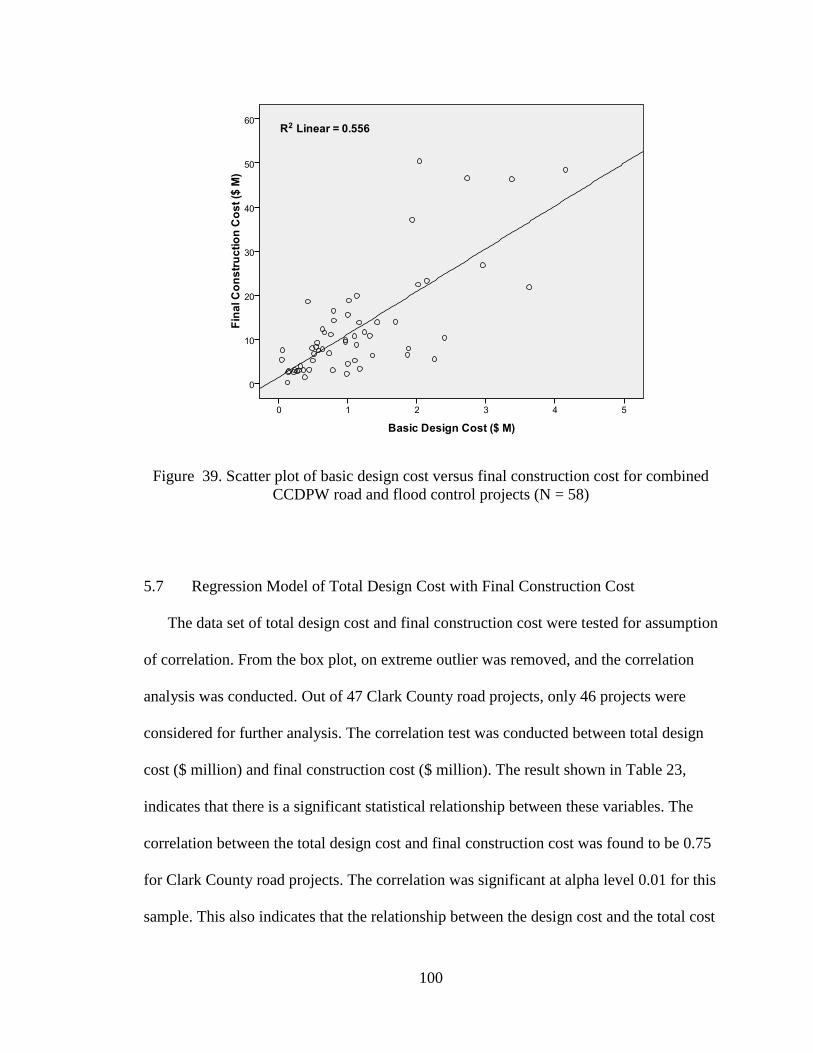
100
Figure 39. Scatter plot of basic design cost versus final construction cost for combined
CCDPW road and flood control projects (N = 58)
5.7 Regression Model of Total Design Cost with Final Construction Cost
The data set of total design cost and final construction cost were tested for assumption
of correlation. From the box plot, on extreme outlier was removed, and the correlation
analysis was conducted. Out of 47 Clark County road projects, only 46 projects were
considered for further analysis. The correlation test was conducted between total design
cost ($ million) and final construction cost ($ million). The result shown in Table 23,
indicates that there is a significant statistical relationship between these variables. The
correlation between the total design cost and final construction cost was found to be 0.75
for Clark County road projects. The correlation was significant at alpha level 0.01 for this
sample. This also indicates that the relationship between the design cost and the total cost

101
growth is a positive correlation, which indicates that the higher the cost expended in
design, the higher the final construction cost.
Table 23. Pearson correlation – total design cost versus final construction cost
Final Construction Cost
Pearson Correlation Coefficient / Significance Value
All Projects
(N= 58)
Road Projects
(N= 46)
Flood Control
Projects (N=11)
Pearson Correlation
Coefficient 0.71*** 0.75*** 0.00
Significance value (2-tailed) 0.0001 0.0001 0.998
Number of sample (N) 58 46 11
* Significant at alpha level 0.10 (2-tailed)
** Significant at alpha level 0.05 (2-tailed)
*** Significant at alpha level 0.01 (2-tailed)
In considering the Clark County road projects (N = 46), the mis-specified model,
heteroscedasticity, and non-normal and correlated errors checks were performed, and the
data were re-plotted as per regression model assumptions. The scatter plot between
unstandardized residual and total design cost ($ million) is shown in Figure E- 1. Also,
the scatter plot between studentized residual plot and total design cost ($ million) is
shown in Figure E- 2. Studentized residual versus unstandardized predicted value scatter
plot is shown in Figure F- 1. The histogram of the residuals shows the normal distribution
of data as shown in Figure G- 1. The plot in Figure H-2 shows that almost all the data
points lie between the 95% confidence interval lines. The predicted points and the
historical points for total design cost ($ million) points both lie along the diagonal line.
Therefore, the linear regression model was found acceptable for expressing this relation.

102
Figure 40 shows the scatter plot between total design cost and final construction cost of
CCDPW road projects. R-square value of the model found to be 55.80%.
Mathematically, the regression equation for Clark County road projects is expressed
in Equation 21. In this equation, final construction cost and total design cost are
expressed in terms of $ million.
011377 .CostgnTotal Desix.osttruction CFinal Cons (21)
Figure 40. Scatter plot of total design cost versus final construction cost for CCDPW
road projects (N = 46)

103
In case of Clark County flood control projects (N = 11), the correlation value between
total design cost and final construction cost was insignificant, and the number of the
samples was very few. Therefore, further analysis was not conducted for this sample.
In considering the combined Clark County road and flood control projects (N = 58),
the mis-specified model, heteroscedasticity, and non-normal and correlated errors checks
were performed and the data were re-plotted as per regression model assumptions. The
scatter plot between unstandardized residual and total design cost ($ million) is shown in
Figure E- 7. Also, the scatter plot between studentized residual plot and total design cost
($ million) is shown in Figure E- 8. Studentized residual versus unstandardized predicted
value scatter plot is shown in Figure F- 4. The histogram of the residuals shows the
normal distribution of data as shown in Figure G- 4. The plot in Figure H- 4 shows that
almost all the data points lie between the 95% confidence interval lines. The predicted
points and the historical points for the total design cost ($ million) both lie along the
diagonal line. Therefore, the linear regression model was found acceptable for expressing
this relation. Figure 41 shows scatter plot between total design cost and final construction
cost for CCDPW road and flood control projects. R-square value of the model found to
be 49.80%.
Mathematically, the regression equation for combined Clark County road and flood
control project is expressed in Equation 22. In this equation, the final construction cost
and the total design cost are expressed in terms of $ million.
41153.7 .Costgn Total Desixosttruction CFinal Cons (22)

104
Figure 41. Scatter plot of basic design cost versus final construction cost for combined
CCDPW road and flood control projects (N = 58)
105
CHAPTER 6
COMPARISON BETWEEN CLARK COUNTY AND TEXAS DOT DATA
The main objective of this chapter is to compare the regression models of Clark
County public road projects and Texas Department of Transportation road projects. If
both of them are statistically significant, then the models can be validated. By using
design cost as an independent variable for similar kind of projects, the validated models
can be used to predict dependent variables, such as contract award cost growth, total cost
growth, construction cost growth, and construction schedule metrics.
Clark County public road projects and Texas Department of Transportation road
projects were analyzed separately. The Pearson correlations of basic design cost with cost
growth and schedule growth are described in detail in this chapter. The same analysis
procedure is followed for combined Clark County public road and Texas DOT road
projects. The correlation and regression analyses between total design cost and other
parameters were not able to be performed due to unavailability of total design cost for
Texas DOT road projects.
6.1 Correlation between Basic Design Cost and Other Metrics for CCDPW Projects
6.1 .1 Correlation between Basic Design Cost and Contract Award Cost Growth
The correlation test was conducted between the basic design cost and contract award
cost growth for road projects, as shown in Table 24. The correlation value between these
variables was -0.322 for all projects, -0.221 for Clark County road projects, and -0.501
for Texas DOT road projects. These relationships were statistically significant at alpha
level 0.05 for all road projects (combined Clark County and Texas DOT road projects)
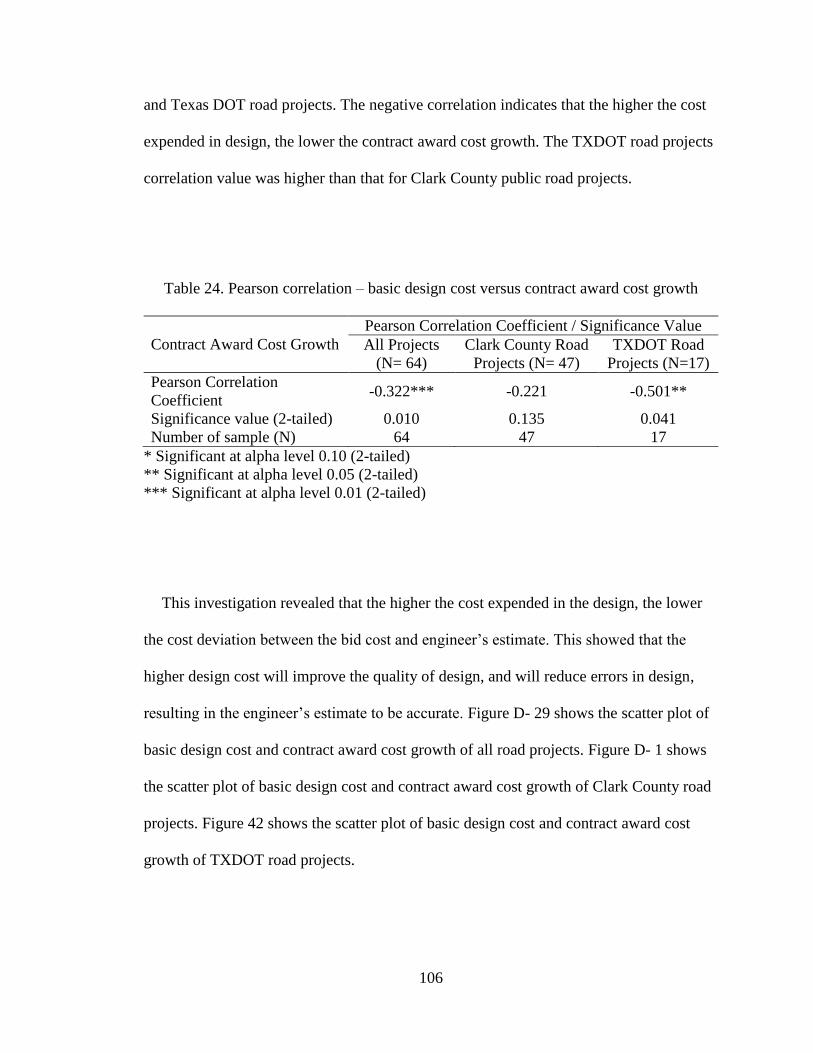
106
and Texas DOT road projects. The negative correlation indicates that the higher the cost
expended in design, the lower the contract award cost growth. The TXDOT road projects
correlation value was higher than that for Clark County public road projects.
Table 24. Pearson correlation – basic design cost versus contract award cost growth
Contract Award Cost Growth
Pearson Correlation Coefficient / Significance Value
All Projects
(N= 64)
Clark County Road
Projects (N= 47)
TXDOT Road
Projects (N=17)
Pearson Correlation
Coefficient -0.322*** -0.221 -0.501**
Significance value (2-tailed) 0.010 0.135 0.041
Number of sample (N) 64 47 17
* Significant at alpha level 0.10 (2-tailed)
** Significant at alpha level 0.05 (2-tailed)
*** Significant at alpha level 0.01 (2-tailed)
This investigation revealed that the higher the cost expended in the design, the lower
the cost deviation between the bid cost and engineer’s estimate. This showed that the
higher design cost will improve the quality of design, and will reduce errors in design,
resulting in the engineer’s estimate to be accurate. Figure D- 29 shows the scatter plot of
basic design cost and contract award cost growth of all road projects. Figure D- 1 shows
the scatter plot of basic design cost and contract award cost growth of Clark County road
projects. Figure 42 shows the scatter plot of basic design cost and contract award cost
growth of TXDOT road projects.
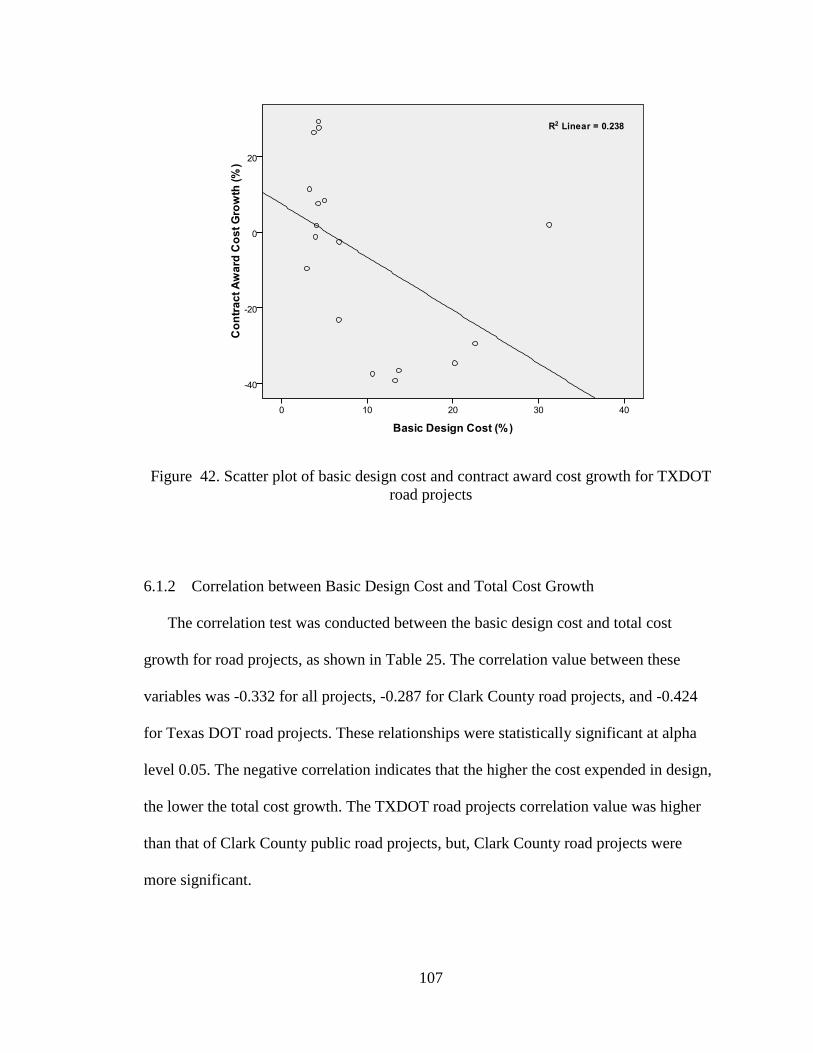
107
Figure 42. Scatter plot of basic design cost and contract award cost growth for TXDOT
road projects
6.1.2 Correlation between Basic Design Cost and Total Cost Growth
The correlation test was conducted between the basic design cost and total cost
growth for road projects, as shown in Table 25. The correlation value between these
variables was -0.332 for all projects, -0.287 for Clark County road projects, and -0.424
for Texas DOT road projects. These relationships were statistically significant at alpha
level 0.05. The negative correlation indicates that the higher the cost expended in design,
the lower the total cost growth. The TXDOT road projects correlation value was higher
than that of Clark County public road projects, but, Clark County road projects were
more significant.

108
Table 25. Pearson correlation – basic design cost versus total cost growth
Total Cost Growth
Pearson Correlation Coefficient / Significance Value
All Projects
(N= 64)
Clark County Road
Projects (N= 47)
TXDOT Road
Projects (N=17)
Pearson Correlation
Coefficient -0.332** -0.287** -0.424*
Significance value (2-tailed) 0.007 0.05 0.090
Number of sample (N) 64 47 17
* Significant at alpha level 0.10 (2-tailed)
** Significant at alpha level 0.05 (2-tailed)
*** Significant at alpha level 0.01 (2-tailed)
This investigation revealed that the higher the cost expended in the design, the lower the
cost deviation between the final construction cost and the engineer’s estimate. Figure D-
30 shows the scatter plot of basic design cost and total cost growth of all road projects.
Figure D- 4 shows the scatter plot of basic design cost and total cost growth of Clark
County road projects. Figure 43 shows the scatter plot of basic design cost and total cost
growth of TXDOT road projects.

109
Figure 43. Scatter plot of basic design cost and total cost growth for TXDOT road
projects
6.1.3 Correlation between Basic Design Cost and Construction Cost Growth
The correlation test was conducted between the basic design cost and construction
cost growth for road projects, as shown in Table 26. The correlation value between these
variables was -0.025 for all projects, -0.119 for Clark County road projects, and 0.224 for
Texas DOT road projects. Although these relationships were not statistically significant
at alpha level 0.1, the negative correlation indicates that the higher the cost expended in
design, the lower the construction cost growth.

110
Table 26. Pearson correlation – basic design cost versus construction cost growth
Construction Cost Growth
Pearson Correlation Coefficient / Significance Value
All Projects
(N= 64)
Clark County Road
Projects (N= 47)
TXDOT Road
Projects (N=17)
Pearson Correlation
Coefficient -0.025 -0.119 0.224
Significance value (2-tailed) 0.846 0.425 0.387
Number of sample (N) 64 47 17
* Significant at alpha level 0.10 (2-tailed)
** Significant at alpha level 0.05 (2-tailed)
*** Significant at alpha level 0.01 (2-tailed)
This investigation revealed that the higher the cost expended in the design, the lower the
cost deviation between the final construction cost and construction contract cost. Figure
D- 31 shows the scatter plot of basic design cost and construction cost growth of all road
projects. Figure D- 7 shows the scatter plot of basic design cost and construction cost
growth of Clark County road projects. Figure 44 shows the scatter plot of basic design
cost and construction cost growth of TXDOT road projects.

111
Figure 44. Scatter plot of basic design cost and construction cost growth for TXDOT
road projects
6.1.4 Correlation between Basic Design Cost and Construction Schedule Growth
The correlation test was conducted between the basic design cost and construction
schedule growth for road projects, as shown in Table 27. The correlation value between
these variables was -0.143 for all projects, -0.183 for Clark County road projects, and -
0.098 for Texas DOT road projects. Although these relationships were not statistically
significant at alpha level 0.1, the negative correlation indicates that the higher the cost
expended in design, the lower the construction schedule growth.

112
Table 27. Pearson correlation – basic design cost versus construction schedule growth
Construction Schedule
Growth
Pearson Correlation Coefficient / Significance Value
All Projects
(N= 64)
Clark County Road
Projects (N= 47)
TXDOT Road
Projects (N=17)
Pearson Correlation
Coefficient -0.143 -0.183 -0.098
Significance value (2-tailed) 0.260 0.219 0.709
Number of sample (N) 64 47 17
* Significant at alpha level 0.10 (2-tailed)
** Significant at alpha level 0.05 (2-tailed)
*** Significant at alpha level 0.01 (2-tailed)
This investigation revealed that the higher the cost expended in the design, the lower the
schedule deviation between the final construction duration and construction contract
duration. Figure D- 32 shows the scatter plot of basic design cost and construction
schedule growth of all road projects. Figure D- 10 shows the scatter plot of basic design
cost and construction schedule growth of Clark County road projects. Figure 45 shows
the scatter plot of basic design cost and construction schedule growth of TXDOT road
projects.

113
Figure 45. Scatter plot of basic design cost and construction schedule growth for
TXDOT road projects
6.2 Regression Model of Basic Design Cost with Final Construction Cost
The data set of basic design cost and final construction cost were tested for
assumption of correlation. From the box plot, two extreme outliers were removed and
correlation analysis conducted. Out of 47 Clark County road projects, only 46 projects
were considered for further analysis, and, out of 17 Texas Department of Transportation
road projects, only 16 projects were considered for further analysis. A correlation test
was conducted between basic design cost ($ million) and final construction cost ($
million); the result, shown in Table 28, indicates that there is a significant statistical
relationship between these variables. The correlation between the basic design cost and
final construction cost was found to be 0.80 for Clark County road projects. The
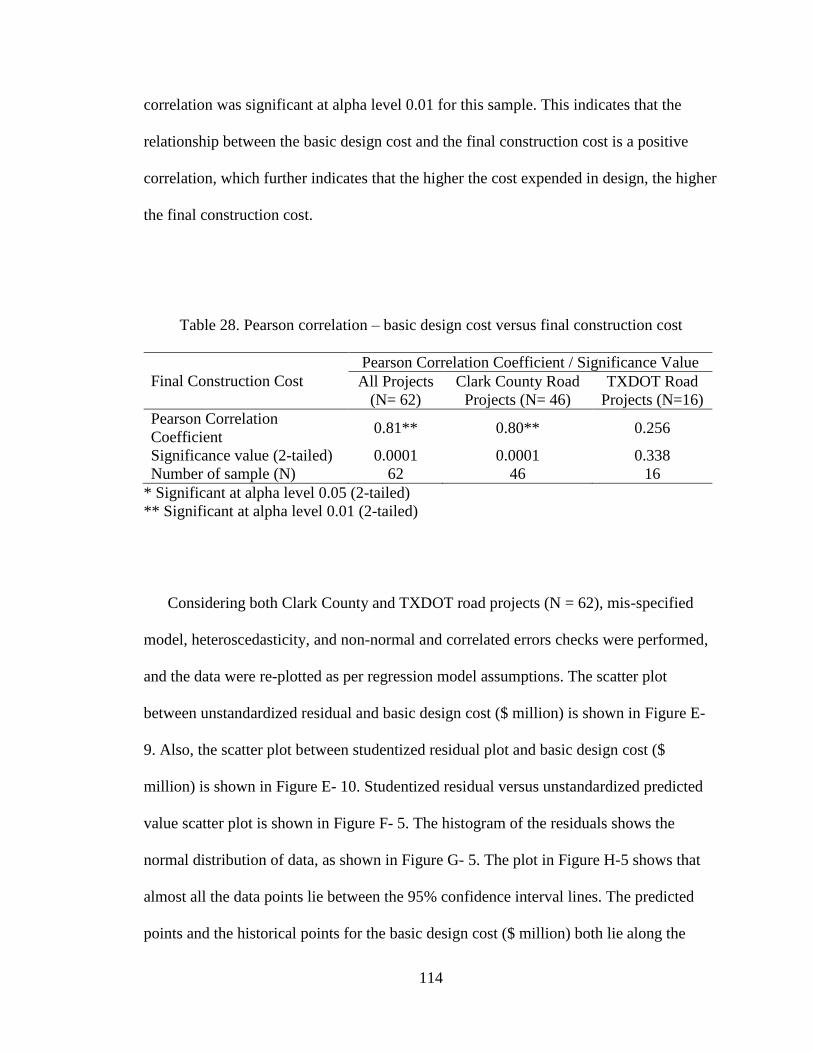
114
correlation was significant at alpha level 0.01 for this sample. This indicates that the
relationship between the basic design cost and the final construction cost is a positive
correlation, which further indicates that the higher the cost expended in design, the higher
the final construction cost.
Table 28. Pearson correlation – basic design cost versus final construction cost
Final Construction Cost
Pearson Correlation Coefficient / Significance Value
All Projects
(N= 62)
Clark County Road
Projects (N= 46)
TXDOT Road
Projects (N=16)
Pearson Correlation
Coefficient 0.81** 0.80** 0.256
Significance value (2-tailed) 0.0001 0.0001 0.338
Number of sample (N) 62 46 16
* Significant at alpha level 0.05 (2-tailed)
** Significant at alpha level 0.01 (2-tailed)
Considering both Clark County and TXDOT road projects (N = 62), mis-specified
model, heteroscedasticity, and non-normal and correlated errors checks were performed,
and the data were re-plotted as per regression model assumptions. The scatter plot
between unstandardized residual and basic design cost ($ million) is shown in Figure E-
9. Also, the scatter plot between studentized residual plot and basic design cost ($
million) is shown in Figure E- 10. Studentized residual versus unstandardized predicted
value scatter plot is shown in Figure F- 5. The histogram of the residuals shows the
normal distribution of data, as shown in Figure G- 5. The plot in Figure H-5 shows that
almost all the data points lie between the 95% confidence interval lines. The predicted
points and the historical points for the basic design cost ($ million) both lie along the

115
diagonal line. Therefore, the linear regression model was found acceptable for expressing
this relation. Figure 46 shows the scatter plot between basic design cost and final
construction cost for both CCDPW and TXDOT road projects. R-square value for this
model was found to be 63.60%.
Mathematically, the regression equation for both Clark County and TXDOT road
projects is expressed in Equation 23. In this equation, final construction cost and basic
design cost is expressed in terms of $ million.
9014413 .Costgn Basic Desix.osttruction CFinal Cons (23)
Figure 46. Scatter plot of basic design cost versus final construction cost for both
CCDPW and TXDOT road projects (N = 62).

116
For TXDOT road projects, the correlation coefficient was not significant. This might
be due to insufficient data. Therefore, further analysis was not conducted for this data.
The regression model for data from Clark County road projects was described in
Section 5.6 (Chapter 5). The correlation coefficient obtained for the combined TXDOT
and Clark County road projects was nearly same as that for Clark County road projects
only. This result validates the finding of this research.
Table 29 describes the summary of Pearson correlation coefficients of the basic
design cost (%) with various metrics. There are negative correlations between the basic
design costs with almost all the metrics.

117
Table 29. Summary of pearson correlation – basic design cost (%) with other metrics
Metrics
Clark County
TXDOT
TXDOT
and Clark
County
Road
Projects
(N = 47)
Flood
Control
Projects
(N = 11)
Road and
Flood Control
Projects
(N = 58)
Road
Projects
(N = 17)
Road
Projects
(N = 64)
Contract award
cost growth
-0.221 0.631 -0.062 -0.501** -0.322***
Significance Value
(2-tailed)
0.135 0.037 0.644 0.041 0.01
Total Cost Growth -0.287** 0.559 -0.115 -0.424* -0.332***
Significance Value
(2-tailed)
0.05 0.074 0.389 0.090 0.007
Construction cost
growth
-0.119 -0.163 -0.110 0.224 -0.025
Significance Value
(2-tailed)
0.425 0.632 0.411 0.387 0.846
Construction
Schedule growth
-0.183 -0.159 -0.178 -0.098 -0.143
Significance Value
(2-tailed)
0.219 0.640 0.182 0.709 0.260
* Significant at alpha level 0.10 (2-tailed)
** Significant at alpha level 0.05 (2-tailed)
*** Significant at alpha level 0.01 (2-tailed)
Table 30 describes the summary of Pearson correlation coefficients of total design
cost (%) with various metrics. There are negative correlations between the total design
cost with almost all the metrics. Due to the unavailability of TXDOT road projects data,
the correlation analysis was not conducted.

118
Table 30. Summary of pearson correlation – total design cost (%) with other metrics
Metrics
Clark County
TXDOT
TXDOT
and Clark
County
Road
Projects
(N = 47)
Flood
Control
Projects
(N = 11)
Road and
Flood
Control
Projects
(N = 58)
Road
Projects
(N = 17)
Road
Projects
(N = 64)
Contract award cost
growth
-0.129 0.620 0.024 NA NA
Significance Value
(2-tailed)
0.389 0.042 0.859 NA NA
Total Cost Growth -0.192 0.639 -0.011 NA NA
Significance Value
(2-tailed)
0.195 0.034 0.937 NA NA
Construction cost
growth
-0.115 0.198 -0.075 NA NA
Significance Value
(2-tailed)
0.442 0.559 0.577 NA NA
Construction Schedule
growth
-0.080 0.054 -0.042 NA NA
Significance Value
(2-tailed)
0.595 0.874 0.754 NA NA
* Significant at alpha level 0.10 (2-tailed)
** Significant at alpha level 0.05 (2-tailed)
*** Significant at alpha level 0.01 (2-tailed)
Table 31 describes the summary of Pearson correlation coefficients of basic design
cost ($ million) with various metrics. There are significant positive correlations between
basic design cost with almost all the metrics.

119
Table 31. Summary of pearson correlation – basic design cost ($ M) and final
construction cost
Metrics
Clark County
TXDOT
TXDOT and
Clark County
Road
Projects
(N = 46)
Flood
Control
Projects
(N = 11)
Road and
Flood
Control
Projects
(N = 58)
Road
Projects
(N = 17)
Road Projects
(N = 62)
Final Construction
Cost
0.80*** 0.015 0.75*** 0.256 0.81***
Significance Value
(2-tailed)
0.0001 0.965 0.0001 0.338 0.0001
* Significant at alpha level 0.10 (2-tailed)
** Significant at alpha level 0.05 (2-tailed)
*** Significant at alpha level 0.01 (2-tailed)
Table 32 describes the summary of Pearson correlation coefficients of total design
cost ($ million) with various metrics. There are significant positive correlations between
the total design costs with almost all the metrics. Due to the unavailability of TXDOT
road projects data, the correlation analysis was not conducted.

120
Table 32. Summary of pearson correlation – total design cost ($ M) and final construction
cost
Metrics
Clark County
TXDOT
TXDOT and
Clark County
Road
Projects
(N = 46)
Flood
Control
Projects
(N = 11)
Road and
Flood
Control
Projects
(N = 58)
Road
Projects
(N = 17)
Road Projects
(N = 62)
Final Construction
Cost
0.75*** 0.001 0.71*** NA NA
Significance Value
(2-tailed)
0.0001 0.998 0.0001 NA NA
* Significant at alpha level 0.10 (2-tailed)
** Significant at alpha level 0.05 (2-tailed)
*** Significant at alpha level 0.01 (2-tailed)

121
CHAPTER 7
CONCLUSIONS AND RECOMMENDATIONS
Basically, this study tested five hypotheses. However, for the sake of simplicity,
design cost was divided into two headings – basic design cost and total design cost.
Therefore, ten research hypotheses were developed, which were stated in Table 1 and
Table 2 in Section 1.3. However, significant results were not found for correlation among
total design cost with cost growth and schedule growth parameters, they showed simply a
trend of negative relationships. Therefore, the findings for only basic design cost are
discussed in this chapter.
The first hypothesis deals with the relationship between basic design cost and total
cost growth, which was proved to be true for Clark County road projects. This hypothesis
was also found to be true in TXDOT road projects on one hand. On the other hand, the
combined TXDOT and Clark County road projects were analyzed. This analysis result
also proved the first hypothesis of the study. Pearson Coefficient for Clark County road
projects and TXDOT projects were -0.287 and -0.424 respectively. In case of combined
TXDOT and Clark County road projects, the coefficient value was -0.332. The
correlation was found to be negative. This result showed that during the design phase, the
owner must make sure that enough resources are expended to prepare a quality design, so
that there will be low total cost growth during the construction. It also indicates that if the
public owners expended enough resources to prepare high quality design drawings and
documents, then the contractor will complete the project near to the engineer’s estimate.
Because public work projects are funded by the taxpayers, it is necessary that the owner
should complete the projects within a reasonable cost.
122
When the data is divided for Clark County road projects and TXDOT road projects,
the analysis showed that the design cost has stronger negative correlation with total cost
growth in TXDOT road projects than that in Clark County road projects. One of the
possible reasons for this is that TXDOT road projects are bigger and have more technical
issues in design than Clark County road projects. This finding is in accordance with the
previous findings by Gransberg et al. (2007). He found that the correlation between
design cost and cost growth is stronger in bridge projects than road projects, because
bridge projects are more design-intensive than road projects. However, the correlation
between basic design cost and total cost growth was found to be positive and significant
in case of flood control projects. This finding is exactly opposite to the finding of the
road projects. One of reasons for this correlation might be the very small sample size. On
the other hand, due to the type of the projects the correlation was found to be exactly
opposite. Therefore, it can be suggested that, while conducting these types of correlation
analysis, the data should be separated depending upon the types of projects. It is
recommended to conduct further study to validate these findings with large sample size.
The second hypothesis regarding the relationship between basic design cost and
contract award cost growth showed a negative correlation, indicating that the higher cost
expended in design will reduce the contract award cost growth. Pearson coefficients for
TXDOT road projects and combined TXDOT and Clark County road projects were found
to be -0.501 and -0.322, respectively. Even though, the TXDOT road projects’ correlation
coefficient was greater than that for combined Clark County and TXDOT road projects,
the significance value of combined TXDOT and Clark County road projects was more
than TXDOT road projects. One of reasons for this case might be the very small sample

123
size for TXDOT road projects. Although the Pearson coefficient of Clark County road
projects was low, the negative correlation value indicates that the higher the design cost,
lower the contract award cost growth. However, the correlation between basic design cost
and contract award cost growth was found to be positive and significant in case of flood
control projects. This finding is exactly opposite to the finding of the road projects. One
of reasons for this correlation might be the very small sample size. On the other hand, due
to the type of the projects the correlation was found to be exactly opposite. Therefore, it
can be suggested that, while conducting these types of correlation analysis, the data
should be separated depending upon the types of projects. It is recommended to conduct
further study to validate these findings with large sample size.
The third hypothesis analyzed the relationship between the construction cost growth
and basic design cost. However, there was no significant correlation between these
variables. There was a negative correlation, indicating that the higher the basic design
cost, the lower the construction cost growth during construction of these projects.
The relationship between construction schedule growth and basic design cost was
fourth hypothesis of this study. There was no significant correlation between these
variables, a negative correlation was found for all cases. This indicates that the higher
cost in design will reduce the construction schedule growth.
The fifth hypothesis deals with the relationship between the basic design cost and
final construction cost, which showed that there is a strong and significant positive
correlation between these two variables. The regression analysis shows that the final
construction cost of road projects can be predicted by using the basic design cost as an
input. Table 31 describes Pearson correlations between the basic design cost and final

124
construction cost for each case. The R-square value of the regression model for Clark
County road projects was 62.30%. In addition, the R-square value of the regression
model for both Clark County and TXDOT road projects was 63.60%.
This study validated the relationships of design cost and cost growth in DBB projects.
To make the validation, the results from Clark County projects were compared with the
Texas Department of Transportation road projects. Recently, in order to improve
construction costs and schedule performance of public works projects, more public
owners have been using different types of project delivery methods, such as, design-build
and construction manager. More research is required to determine the relationships
among design costs, construction costs, and schedule performance in these types of
public projects.
Some recommendations of this study are discussed as follows:
If all detailed data were available, then the impact of design duration or
procurement duration with the project performance could be determined.
If various kinds of projects with sufficient numbers were available for
analysis, then the impact of types of projects with the project performance
could be determined.
If these parameters were available, then the impact of complexity of projects
with project performance could be determined.
If there were other projects with different project delivery methods, then the
impact of the types of project delivery methods with the project performance
could be determined.

125
The multivariate models incorporating more relevant variables, such as project
characteristics, project delivery methods, contract types, weather conditions, unforeseen
site conditions, design fees, construction costs, and cost growth parameters are
recommended for future study. More accurate predictions could be obtained with
improving the R-square value by integrating more variables for analysis. More reliable
data should be analyzed to get reliable predictable output for future use.
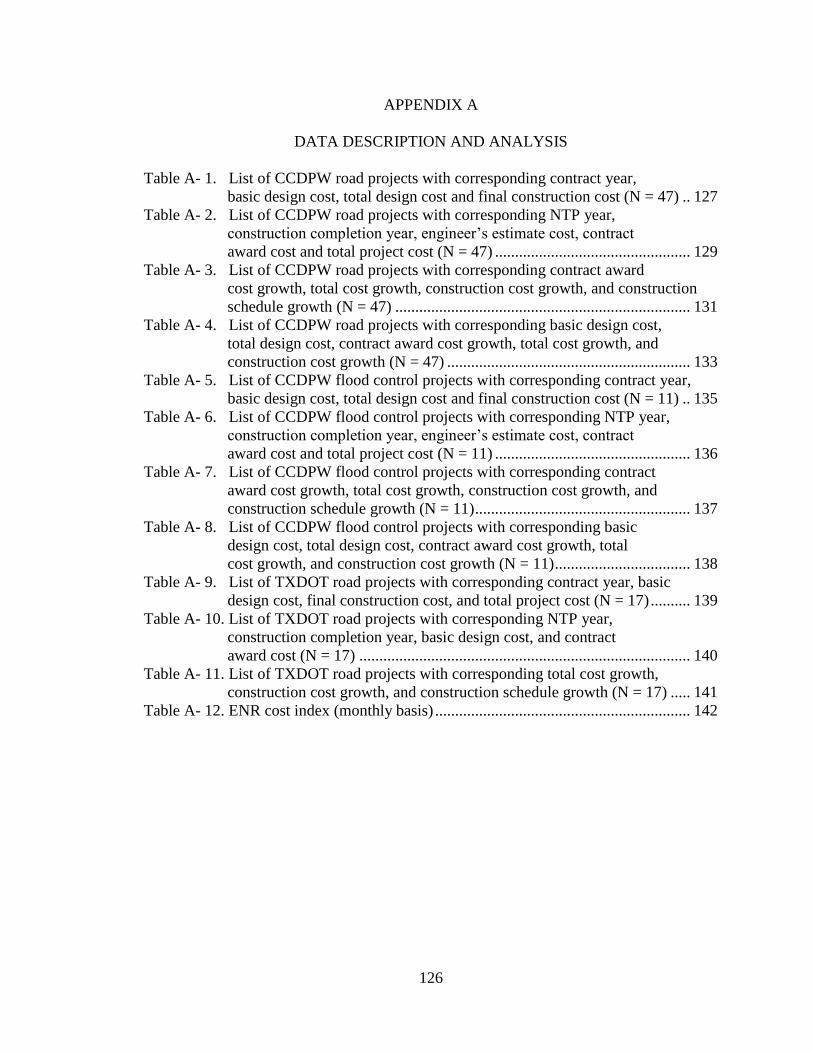
126
APPENDIX A
DATA DESCRIPTION AND ANALYSIS
Table A- 1. List of CCDPW road projects with corresponding contract year,
basic design cost, total design cost and final construction cost (N = 47) .. 127
Table A- 2. List of CCDPW road projects with corresponding NTP year,
construction completion year, engineer’s estimate cost, contract
award cost and total project cost (N = 47) ................................................. 129
Table A- 3. List of CCDPW road projects with corresponding contract award
cost growth, total cost growth, construction cost growth, and construction
schedule growth (N = 47) .......................................................................... 131
Table A- 4. List of CCDPW road projects with corresponding basic design cost,
total design cost, contract award cost growth, total cost growth, and
construction cost growth (N = 47) ............................................................. 133
Table A- 5. List of CCDPW flood control projects with corresponding contract year,
basic design cost, total design cost and final construction cost (N = 11) .. 135
Table A- 6. List of CCDPW flood control projects with corresponding NTP year,
construction completion year, engineer’s estimate cost, contract
award cost and total project cost (N = 11) ................................................. 136
Table A- 7. List of CCDPW flood control projects with corresponding contract
award cost growth, total cost growth, construction cost growth, and
construction schedule growth (N = 11) ...................................................... 137
Table A- 8. List of CCDPW flood control projects with corresponding basic
design cost, total design cost, contract award cost growth, total
cost growth, and construction cost growth (N = 11) .................................. 138
Table A- 9. List of TXDOT road projects with corresponding contract year, basic
design cost, final construction cost, and total project cost (N = 17) .......... 139
Table A- 10. List of TXDOT road projects with corresponding NTP year,
construction completion year, basic design cost, and contract
award cost (N = 17) ................................................................................... 140
Table A- 11. List of TXDOT road projects with corresponding total cost growth,
construction cost growth, and construction schedule growth (N = 17) ..... 141
Table A- 12. ENR cost index (monthly basis) ................................................................ 142
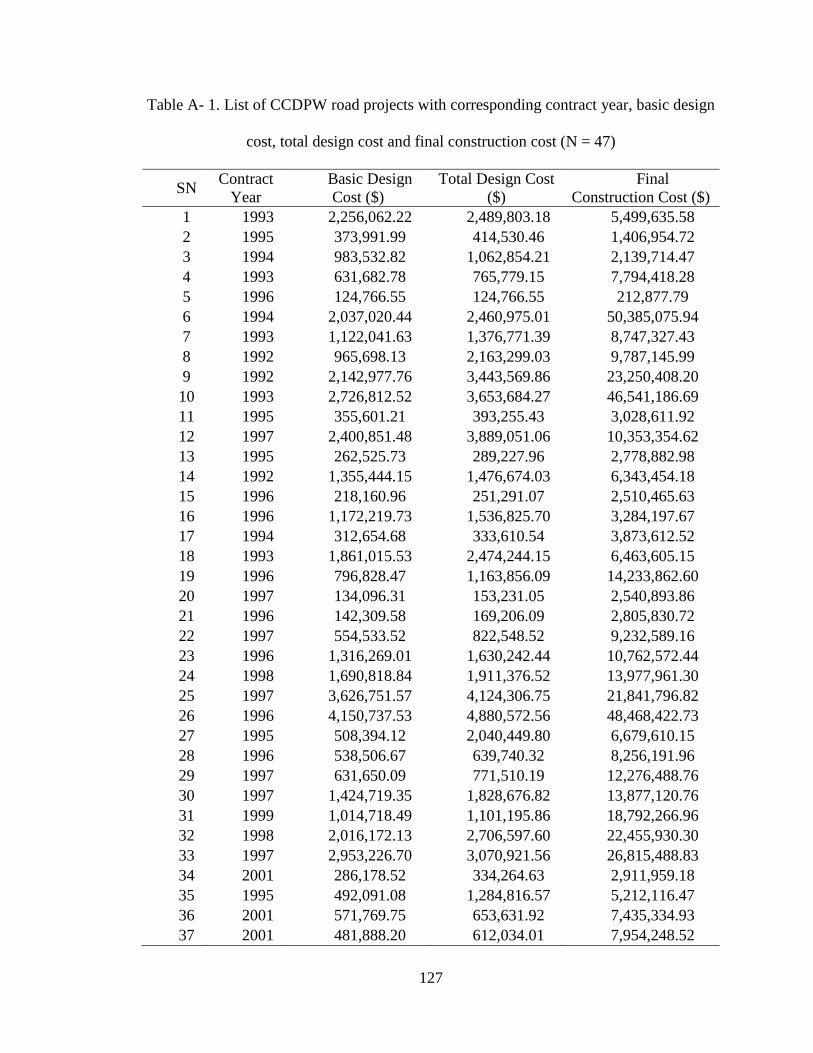
127
Table A- 1. List of CCDPW road projects with corresponding contract year, basic design
cost, total design cost and final construction cost (N = 47)
SN Contract
Year
Basic Design
Cost ($)
Total Design Cost
($)
Final
Construction Cost ($)
1 1993 2,256,062.22 2,489,803.18 5,499,635.58
2 1995 373,991.99 414,530.46 1,406,954.72
3 1994 983,532.82 1,062,854.21 2,139,714.47
4 1993 631,682.78 765,779.15 7,794,418.28
5 1996 124,766.55 124,766.55 212,877.79
6 1994 2,037,020.44 2,460,975.01 50,385,075.94
7 1993 1,122,041.63 1,376,771.39 8,747,327.43
8 1992 965,698.13 2,163,299.03 9,787,145.99
9 1992 2,142,977.76 3,443,569.86 23,250,408.20
10 1993 2,726,812.52 3,653,684.27 46,541,186.69
11 1995 355,601.21 393,255.43 3,028,611.92
12 1997 2,400,851.48 3,889,051.06 10,353,354.62
13 1995 262,525.73 289,227.96 2,778,882.98
14 1992 1,355,444.15 1,476,674.03 6,343,454.18
15 1996 218,160.96 251,291.07 2,510,465.63
16 1996 1,172,219.73 1,536,825.70 3,284,197.67
17 1994 312,654.68 333,610.54 3,873,612.52
18 1993 1,861,015.53 2,474,244.15 6,463,605.15
19 1996 796,828.47 1,163,856.09 14,233,862.60
20 1997 134,096.31 153,231.05 2,540,893.86
21 1996 142,309.58 169,206.09 2,805,830.72
22 1997 554,533.52 822,548.52 9,232,589.16
23 1996 1,316,269.01 1,630,242.44 10,762,572.44
24 1998 1,690,818.84 1,911,376.52 13,977,961.30
25 1997 3,626,751.57 4,124,306.75 21,841,796.82
26 1996 4,150,737.53 4,880,572.56 48,468,422.73
27 1995 508,394.12 2,040,449.80 6,679,610.15
28 1996 538,506.67 639,740.32 8,256,191.96
29 1997 631,650.09 771,510.19 12,276,488.76
30 1997 1,424,719.35 1,828,676.82 13,877,120.76
31 1999 1,014,718.49 1,101,195.86 18,792,266.96
32 1998 2,016,172.13 2,706,597.60 22,455,930.30
33 1997 2,953,226.70 3,070,921.56 26,815,488.83
34 2001 286,178.52 334,264.63 2,911,959.18
35 1995 492,091.08 1,284,816.57 5,212,116.47
36 2001 571,769.75 653,631.92 7,435,334.93
37 2001 481,888.20 612,034.01 7,954,248.52

128
SN Contract
Year
Basic Design
Cost ($)
Total Design Cost
($)
Final
Construction Cost ($)
38 2001 1,877,227.59 2,323,075.93 7,885,222.01
39 2000 751,918.63 851,497.77 11,066,963.02
40 2000 1,130,135.67 1,565,213.48 19,880,440.59
41 2004 964,043.92 1,074,220.29 9,411,118.29
42 2003 1,097,009.41 1,268,701.27 10,676,085.36
43 2001 1,239,914.58 1,415,564.10 11,651,065.08
44 2001 1,164,109.50 1,372,649.59 13,818,377.26
45 2002 999,768.94 1,008,017.10 15,545,685.08
46 2003 1,928,878.06 2,015,583.83 37,088,211.35
47 2001 3,375,898.48 3,938,142.85 46,313,757.98
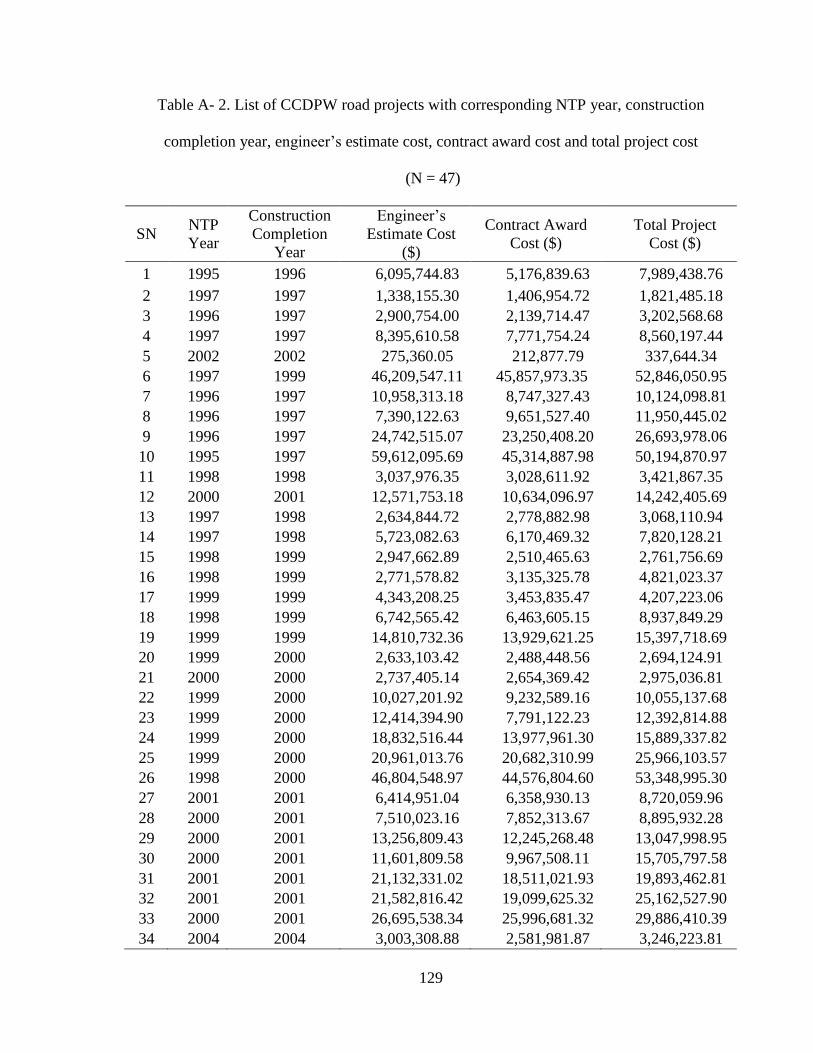
129
Table A- 2. List of CCDPW road projects with corresponding NTP year, construction
completion year, engineer’s estimate cost, contract award cost and total project cost
(N = 47)
SN NTP
Year
Construction
Completion
Year
Engineer’s
Estimate Cost
($)
Contract Award
Cost ($)
Total Project
Cost ($)
1 1995 1996 6,095,744.83 5,176,839.63 7,989,438.76
2 1997 1997 1,338,155.30 1,406,954.72 1,821,485.18
3 1996 1997 2,900,754.00 2,139,714.47 3,202,568.68
4 1997 1997 8,395,610.58 7,771,754.24 8,560,197.44
5 2002 2002 275,360.05 212,877.79 337,644.34
6 1997 1999 46,209,547.11 45,857,973.35 52,846,050.95
7 1996 1997 10,958,313.18 8,747,327.43 10,124,098.81
8 1996 1997 7,390,122.63 9,651,527.40 11,950,445.02
9 1996 1997 24,742,515.07 23,250,408.20 26,693,978.06
10 1995 1997 59,612,095.69 45,314,887.98 50,194,870.97
11 1998 1998 3,037,976.35 3,028,611.92 3,421,867.35
12 2000 2001 12,571,753.18 10,634,096.97 14,242,405.69
13 1997 1998 2,634,844.72 2,778,882.98 3,068,110.94
14 1997 1998 5,723,082.63 6,170,469.32 7,820,128.21
15 1998 1999 2,947,662.89 2,510,465.63 2,761,756.69
16 1998 1999 2,771,578.82 3,135,325.78 4,821,023.37
17 1999 1999 4,343,208.25 3,453,835.47 4,207,223.06
18 1998 1999 6,742,565.42 6,463,605.15 8,937,849.29
19 1999 1999 14,810,732.36 13,929,621.25 15,397,718.69
20 1999 2000 2,633,103.42 2,488,448.56 2,694,124.91
21 2000 2000 2,737,405.14 2,654,369.42 2,975,036.81
22 1999 2000 10,027,201.92 9,232,589.16 10,055,137.68
23 1999 2000 12,414,394.90 7,791,122.23 12,392,814.88
24 1999 2000 18,832,516.44 13,977,961.30 15,889,337.82
25 1999 2000 20,961,013.76 20,682,310.99 25,966,103.57
26 1998 2000 46,804,548.97 44,576,804.60 53,348,995.30
27 2001 2001 6,414,951.04 6,358,930.13 8,720,059.96
28 2000 2001 7,510,023.16 7,852,313.67 8,895,932.28
29 2000 2001 13,256,809.43 12,245,268.48 13,047,998.95
30 2000 2001 11,601,809.58 9,967,508.11 15,705,797.58
31 2001 2001 21,132,331.02 18,511,021.93 19,893,462.81
32 2001 2001 21,582,816.42 19,099,625.32 25,162,527.90
33 2000 2001 26,695,538.34 25,996,681.32 29,886,410.39
34 2004 2004 3,003,308.88 2,581,981.87 3,246,223.81

130
SN NTP
Year
Construction
Completion
Year
Engineer’s
Estimate Cost
($)
Contract Award
Cost ($)
Total Project
Cost ($)
35 2004 2004 4,726,333.02 4,871,672.22 6,496,933.05
36 2003 2004 7,419,679.31 7,435,334.93 8,088,966.85
37 2003 2004 8,584,889.78 7,954,248.52 8,566,282.53
38 2005 2005 7,691,723.99 7,885,222.01 10,208,297.94
39 2004 2005 10,781,157.70 10,872,198.79 11,918,460.78
40 2004 2005 17,149,596.85 18,375,986.29 21,445,654.07
41 2005 2006 9,413,302.20 8,967,646.53 10,485,338.58
42 2005 2006 9,979,305.67 10,612,456.84 11,944,786.63
43 2004 2006 10,486,479.19 11,639,403.38 13,066,629.19
44 2005 2006 12,948,704.37 13,224,050.24 15,191,026.85
45 2005 2006 11,725,559.18 14,754,117.69 16,553,702.18
46 2005 2006 36,533,548.03 36,302,084.02 39,103,795.18
47 2006 2007 34,457,304.30 44,592,052.67 50,251,900.83

131
Table A- 3. List of CCDPW road projects with corresponding contract award cost
growth, total cost growth, construction cost growth, and construction schedule growth
(N = 47)
SN Contract Award
Cost Growth ($)
Total Cost
Growth ($)
Construction
Cost Growth
($)
Construction
Schedule Growth
(%)
1 -918,905.20 -596,109.26 322,795.95 31.90
2 68,799.43 68,799.43 0.00 0.00
3 -761,039.53 -761,039.53 0.00 -2.38
4 -623,856.34 -601,192.30 22,664.04 19.17
5 -62,482.26 -62,482.26 0.00 -36.67
6 -351,573.76 4,175,528.83 4,527,102.59 34.00
7 -2,210,985.75 -2,210,985.75 0.00 18.36
8 2,261,404.77 2,397,023.36 135,618.59 54.58
9 -1,492,106.87 -1,492,106.87 0.00 9.75
10 -14,297,207.70 -13,070,908.99 1,226,298.71 0.00
11 -9,364.44 -9,364.44 0.00 10.00
12 -1,937,656.21 -2,218,398.56 -280,742.34 36.67
13 144,038.26 144,038.26 0.00 -1.33
14 447,386.69 620,371.55 172,984.86 -1.90
15 -437,197.27 -437,197.27 0.00 2.00
16 363,746.96 512,618.86 148,871.90 64.58
17 -889,372.78 -469,595.73 419,777.05 -4.50
18 -278,960.27 -278,960.27 0.00 42.08
19 -881,111.10 -576,869.76 304,241.35 44.44
20 -144,654.85 -92,209.56 52,445.29 0.00
21 -83,035.71 68,425.58 151,461.30 100.00
22 -794,612.76 -794,612.76 0.00 21.25
23 -4,623,272.67 -1,651,822.46 2,971,450.22 9.52
24 -4,854,555.14 -4,854,555.14 0.00 5.75
25 -278,702.78 880,783.06 1,159,485.83 25.15
26 -2,227,744.37 1,663,873.76 3,891,618.13 55.00
27 -56,020.91 264,659.12 320,680.02 2.92
28 342,290.51 746,168.80 403,878.29 3.00
29 -1,011,540.95 -980,320.67 31,220.28 -8.25
30 -1,634,301.47 2,275,311.18 3,909,612.66 47.50
31 -2,621,309.09 -2,340,064.06 281,245.02 17.14
32 -2,483,191.09 873,113.89 3,356,304.98 31.67
33 -698,857.02 119,950.49 818,807.51 17.04
34 -421,327.01 -91,349.70 329,977.31 42.67

132
SN Contract Award
Cost Growth ($)
Total Cost
Growth ($)
Construction
Cost Growth
($)
Construction
Schedule Growth
(%)
35 145,339.20 485,783.45 340,444.25 20.56
36 15,655.62 15,655.62 0.00 17.08
37 -630,641.26 -630,641.26 0.00 38.33
38 193,498.02 193,498.02 0.00 30.00
39 91,041.09 285,805.32 194,764.22 2.00
40 1,226,389.44 2,730,843.74 1,504,454.31 70.67
41 -445,655.67 -2,183.91 443,471.76 15.93
42 633,151.17 696,779.69 63,628.52 42.08
43 1,152,924.19 1,164,585.89 11,661.71 12.96
44 275,345.88 869,672.89 594,327.01 7.67
45 3,028,558.52 3,820,125.91 791,567.39 30.33
46 -231,464.01 554,663.32 786,127.33 16.67
47 10,134,748.38 11,856,453.68 1,721,705.31 0.00
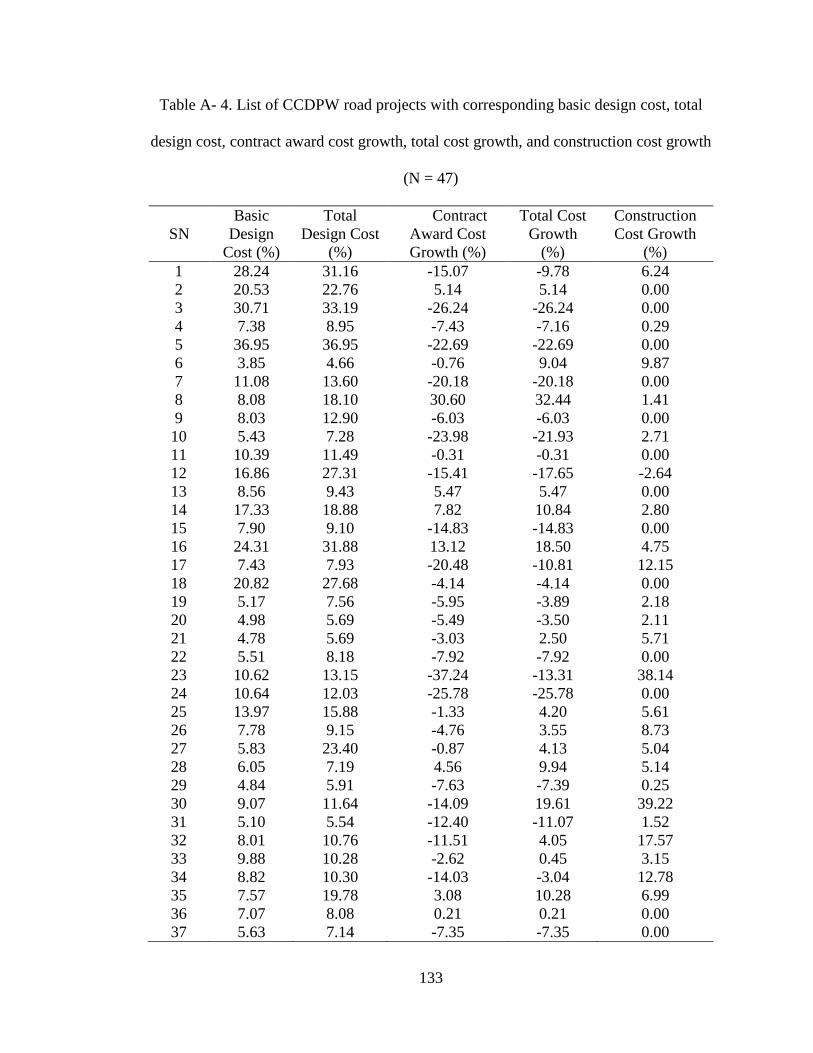
133
Table A- 4. List of CCDPW road projects with corresponding basic design cost, total
design cost, contract award cost growth, total cost growth, and construction cost growth
(N = 47)
SN
Basic
Design
Cost (%)
Total
Design Cost
(%)
Contract
Award Cost
Growth (%)
Total Cost
Growth
(%)
Construction
Cost Growth
(%)
1 28.24 31.16 -15.07 -9.78 6.24
2 20.53 22.76 5.14 5.14 0.00
3 30.71 33.19 -26.24 -26.24 0.00
4 7.38 8.95 -7.43 -7.16 0.29
5 36.95 36.95 -22.69 -22.69 0.00
6 3.85 4.66 -0.76 9.04 9.87
7 11.08 13.60 -20.18 -20.18 0.00
8 8.08 18.10 30.60 32.44 1.41
9 8.03 12.90 -6.03 -6.03 0.00
10 5.43 7.28 -23.98 -21.93 2.71
11 10.39 11.49 -0.31 -0.31 0.00
12 16.86 27.31 -15.41 -17.65 -2.64
13 8.56 9.43 5.47 5.47 0.00
14 17.33 18.88 7.82 10.84 2.80
15 7.90 9.10 -14.83 -14.83 0.00
16 24.31 31.88 13.12 18.50 4.75
17 7.43 7.93 -20.48 -10.81 12.15
18 20.82 27.68 -4.14 -4.14 0.00
19 5.17 7.56 -5.95 -3.89 2.18
20 4.98 5.69 -5.49 -3.50 2.11
21 4.78 5.69 -3.03 2.50 5.71
22 5.51 8.18 -7.92 -7.92 0.00
23 10.62 13.15 -37.24 -13.31 38.14
24 10.64 12.03 -25.78 -25.78 0.00
25 13.97 15.88 -1.33 4.20 5.61
26 7.78 9.15 -4.76 3.55 8.73
27 5.83 23.40 -0.87 4.13 5.04
28 6.05 7.19 4.56 9.94 5.14
29 4.84 5.91 -7.63 -7.39 0.25
30 9.07 11.64 -14.09 19.61 39.22
31 5.10 5.54 -12.40 -11.07 1.52
32 8.01 10.76 -11.51 4.05 17.57
33 9.88 10.28 -2.62 0.45 3.15
34 8.82 10.30 -14.03 -3.04 12.78
35 7.57 19.78 3.08 10.28 6.99
36 7.07 8.08 0.21 0.21 0.00
37 5.63 7.14 -7.35 -7.35 0.00
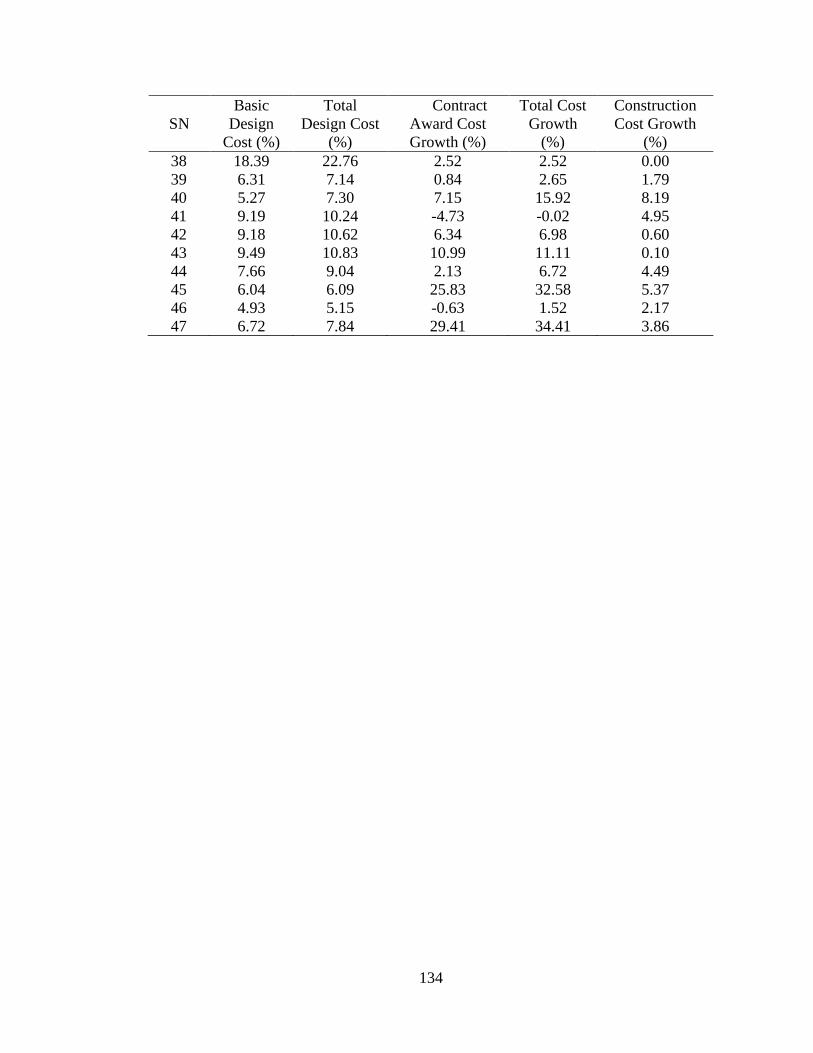
134
SN
Basic
Design
Cost (%)
Total
Design Cost
(%)
Contract
Award Cost
Growth (%)
Total Cost
Growth
(%)
Construction
Cost Growth
(%)
38 18.39 22.76 2.52 2.52 0.00
39 6.31 7.14 0.84 2.65 1.79
40 5.27 7.30 7.15 15.92 8.19
41 9.19 10.24 -4.73 -0.02 4.95
42 9.18 10.62 6.34 6.98 0.60
43 9.49 10.83 10.99 11.11 0.10
44 7.66 9.04 2.13 6.72 4.49
45 6.04 6.09 25.83 32.58 5.37
46 4.93 5.15 -0.63 1.52 2.17
47 6.72 7.84 29.41 34.41 3.86

135
Table A- 5. List of CCDPW flood control projects with corresponding contract year,
basic design cost, total design cost and final construction cost (N = 11)
SN Contract
Year
Basic Design
Cost ($)
Total Design Cost
($)
Final
Construction Cost ($)
1 1996 781,393.63 903,177.23 2,988,708.12
2 2002 440,931.59 528,029.19 3,036,172.39
3 2001 226,038.36 286,890.63 3,020,266.26
4 2001 41,603.23 88,938.52 5,380,830.10
5 1999 731,260.94 826,525.89 6,837,363.99
6 2003 788,509.99 1,047,270.39 16,463,130.77
7 1999 658,444.26 934,191.84 11,550,969.66
8 1997 419,651.77 453,719.02 18,572,866.09
9 1997 48,391.16 1,431,074.87 7,532,795.05
10 1999 997,954.25 1,251,365.39 4,432,127.73
11 2000 1,099,183.44 1,635,341.63 5,191,387.44

136
Table A- 6. List of CCDPW flood control projects with corresponding NTP year,
construction completion year, engineer’s estimate cost, contract award cost and total
project cost (N = 11)
SN NTP
Year
Construction
Completion
Year
Engineer’s
Estimate Cost
($)
Contract
Award Cost ($)
Total Project
Cost ($)
1 2007 2007 2,291,522.28 3,017,064.84 3,891,885.35
2 2006 2007 2,195,934.56 2,919,206.35 3,564,201.58
3 2004 2005 4,126,674.78 3,229,611.62 3,307,156.89
4 2004 2006 5,217,246.70 5,002,783.44 5,469,768.62
5 1999 2000 7,506,271.70 6,576,929.03 7,663,889.88
6 2003 2004 17,729,008.19 16,282,280.59 17,510,401.15
7 2004 2005 9,791,872.70 11,640,585.87 12,485,161.50
8 1999 2000 17,476,958.57 18,701,822.55 19,026,585.11
9 2004 2005 6,760,625.58 6,793,768.33 8,963,869.92
10 2004 2005 3,533,961.16 4,313,823.94 5,683,493.13
11 2005 2006 3,829,425.43 4,902,943.01 6,826,729.07

137
Table A- 7. List of CCDPW flood control projects with corresponding contract award
cost growth, total cost growth, construction cost growth, and construction schedule
growth (N = 11)
SN Contract Award
Cost Growth ($)
Total Cost
Growth ($)
Construction
Cost Growth
($)
Construction
Schedule Growth
(%)
1 725,542.56 697,185.84 -28,356.72 -4.44
2 723,271.78 840,237.83 116,966.05 27.50
3 -897,063.16 -1,106,408.52 -209,345.36 -46.67
4 -214,463.26 163,583.39 378,046.65 151.85
5 -929,342.67 -668,907.71 260,434.96 29.05
6 -1,446,727.61 -1,265,877.43 180,850.18 36.04
7 1,848,713.16 1,759,096.96 -89,616.21 3.00
8 1,224,863.98 1,095,907.52 -128,956.46 -1.00
9 33,142.75 772,169.47 739,026.72 95.56
10 779,862.78 898,166.57 118,303.79 96.32
11 1,073,517.58 1,361,962.01 288,444.43 57.50
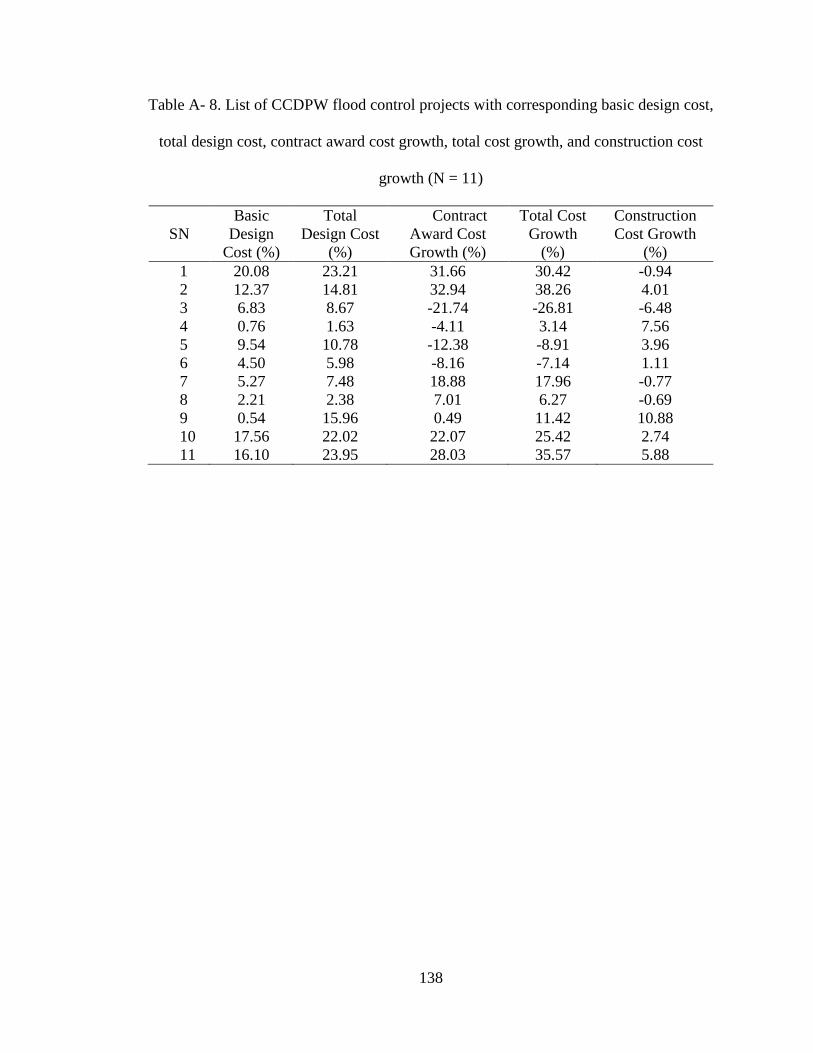
138
Table A- 8. List of CCDPW flood control projects with corresponding basic design cost,
total design cost, contract award cost growth, total cost growth, and construction cost
growth (N = 11)
SN
Basic
Design
Cost (%)
Total
Design Cost
(%)
Contract
Award Cost
Growth (%)
Total Cost
Growth
(%)
Construction
Cost Growth
(%)
1 20.08 23.21 31.66 30.42 -0.94
2 12.37 14.81 32.94 38.26 4.01
3 6.83 8.67 -21.74 -26.81 -6.48
4 0.76 1.63 -4.11 3.14 7.56
5 9.54 10.78 -12.38 -8.91 3.96
6 4.50 5.98 -8.16 -7.14 1.11
7 5.27 7.48 18.88 17.96 -0.77
8 2.21 2.38 7.01 6.27 -0.69
9 0.54 15.96 0.49 11.42 10.88
10 17.56 22.02 22.07 25.42 2.74
11 16.10 23.95 28.03 35.57 5.88
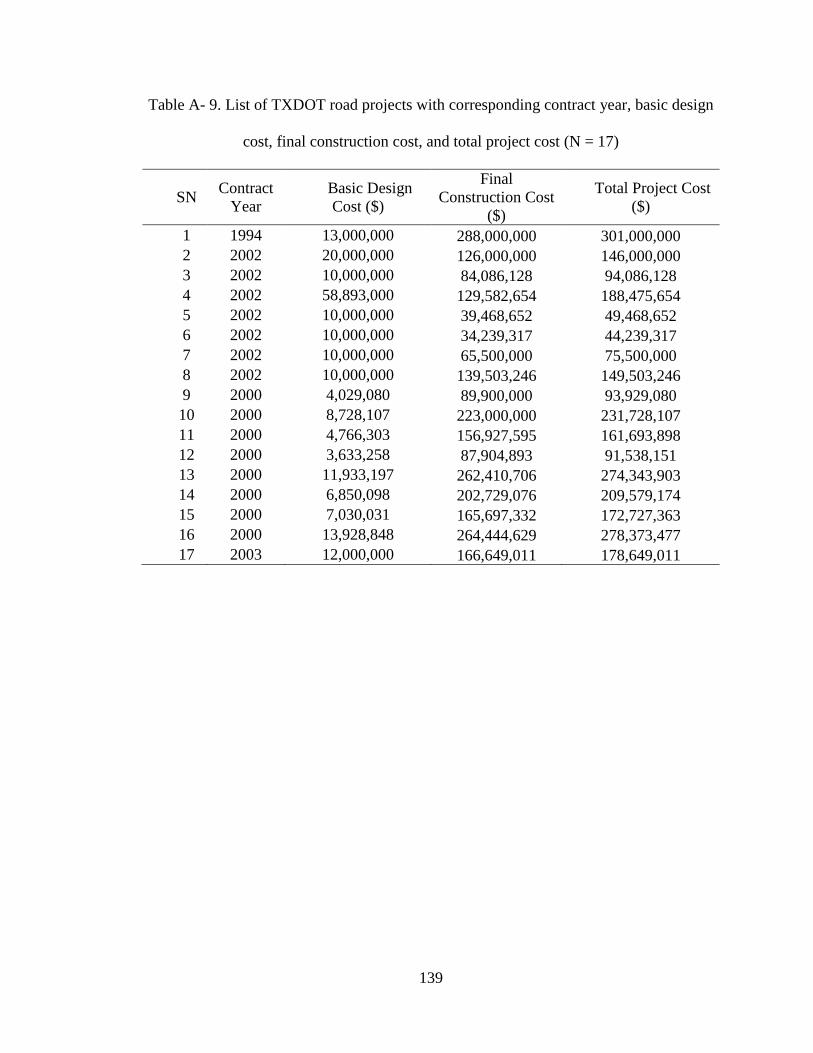
139
Table A- 9. List of TXDOT road projects with corresponding contract year, basic design
cost, final construction cost, and total project cost (N = 17)
SN Contract
Year
Basic Design
Cost ($)
Final
Construction Cost
($)
Total Project Cost
($)
1 1994 13,000,000 288,000,000 301,000,000
2 2002 20,000,000 126,000,000 146,000,000
3 2002 10,000,000 84,086,128 94,086,128
4 2002 58,893,000 129,582,654 188,475,654
5 2002 10,000,000 39,468,652 49,468,652
6 2002 10,000,000 34,239,317 44,239,317
7 2002 10,000,000 65,500,000 75,500,000
8 2002 10,000,000 139,503,246 149,503,246
9 2000 4,029,080 89,900,000 93,929,080
10 2000 8,728,107 223,000,000 231,728,107
11 2000 4,766,303 156,927,595 161,693,898
12 2000 3,633,258 87,904,893 91,538,151
13 2000 11,933,197 262,410,706 274,343,903
14 2000 6,850,098 202,729,076 209,579,174
15 2000 7,030,031 165,697,332 172,727,363
16 2000 13,928,848 264,444,629 278,373,477
17 2003 12,000,000 166,649,011 178,649,011
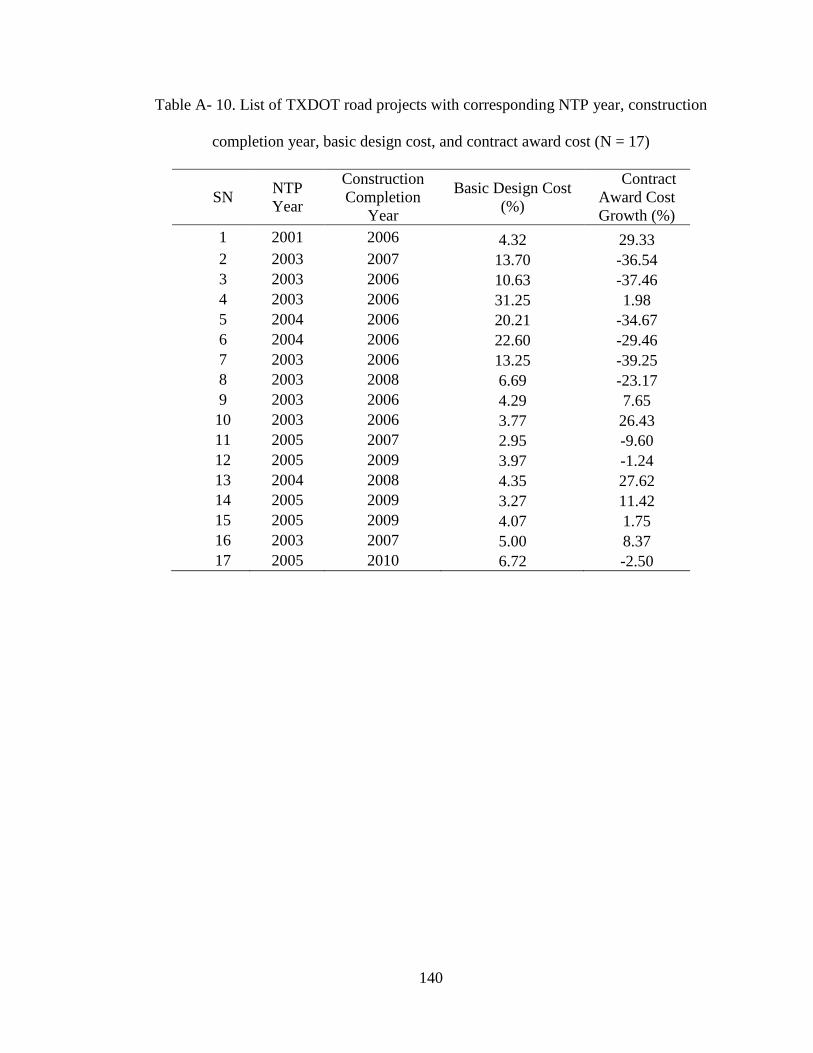
140
Table A- 10. List of TXDOT road projects with corresponding NTP year, construction
completion year, basic design cost, and contract award cost (N = 17)
SN NTP
Year
Construction
Completion
Year
Basic Design Cost
(%)
Contract
Award Cost
Growth (%)
1 2001 2006 4.32 29.33
2 2003 2007 13.70 -36.54
3 2003 2006 10.63 -37.46
4 2003 2006 31.25 1.98
5 2004 2006 20.21 -34.67
6 2004 2006 22.60 -29.46
7 2003 2006 13.25 -39.25
8 2003 2008 6.69 -23.17
9 2003 2006 4.29 7.65
10 2003 2006 3.77 26.43
11 2005 2007 2.95 -9.60
12 2005 2009 3.97 -1.24
13 2004 2008 4.35 27.62
14 2005 2009 3.27 11.42
15 2005 2009 4.07 1.75
16 2003 2007 5.00 8.37
17 2005 2010 6.72 -2.50

141
Table A- 11. List of TXDOT road projects with corresponding total cost growth,
construction cost growth, and construction schedule growth (N = 17)
SN
Total Cost
Growth (%) Construction
Cost Growth (%)
Construction
Schedule Growth
(%)
1 31.872946 1.96 66.0037879
2 -27.59876 14.10 14.1078838
3 -35.34088 3.39 7.53768844
4 18.70837 16.41 0
5 -32.11569 3.90 3.44827586
6 -29.16949 0.41 16.2831858
7 -37.36467 3.10 12.6262626
8 2.9438166 33.99 18.1459566
9 7.8256077 0.16 0
10 27.845873 1.12 0
11 -7.075129 2.79 10.6255356
12 3.2157055 4.51 0.09090909
13 32.870556 4.12 4.07105848
14 10.60971 -0.73 7.75716695
15 6.3429748 4.51 0.41946309
16 9.1342377 0.71 0
17 4.4731058 7.16 11.9257087

142
Table A- 12. ENR cost index (monthly basis)
Year Jan Feb Mar Apr May Jun Jul Aug Sept Oct Nov Dec Average
1990 4680 4685 4691 4693 4707 4732 4734 4752 4774 4771 4787 4777 4732
1991 4777 4773 4772 4766 4801 4818 4854 4892 4891 4892 4896 4889 4835
1992 4888 4884 4927 4946 4965 4973 4992 5032 5042 5052 5058 5059 4985
1993 5071 5070 5106 5167 5262 5260 5252 5230 5255 5264 5278 5310 5210
1994 5336 5371 5381 5405 5405 5408 5409 5424 5437 5437 5439 5439 5408
1995 5443 5444 5435 5432 5433 5432 5484 5506 5491 5511 5519 5524 5471
1996 5523 5532 5537 5550 5572 5597 5617 5652 5683 5719 5740 5744 5620
1997 5765 5769 5759 5799 5837 5860 5863 5854 5851 5848 5838 5858 5826
1998 5852 5874 5875 5883 5881 5895 5921 5929 5963 5986 5995 5991 5920
1999 6000 5992 5986 6008 6006 6039 6076 6091 6128 6134 6127 6127 6059
2000 6130 6160 6202 6201 6233 6238 6225 6233 6224 6259 6266 6283 6221
2001 6281 6272 6279 6286 6288 6318 6404 6389 6391 6397 6410 6390 6334
2002 6462 6462 6502 6480 6512 6532 6605 6592 6589 6579 6578 6563 6538
2003 6581 6640 6627 6635 6642 6694 6696 6733 6741 6771 6794 6782 6695
2004 6825 6861 6957 7017 7064 7109 7126 7188 7298 7314 7312 7308 7115
2005 7297 7298 7309 7355 7398 7415 7422 7479 7540 7563 7630 7647 7446
2006 7660 7689 7692 7695 7691 7700 7721 7723 7763 7883 7911 7888 7751
2007 7880 7880 7856 7865 7942 7939 7959 8007 8050 8045 NA NA 7959
2008 NA NA NA NA NA 8185 8293 8362 8557 8623 8602 8551 8310
2009 8549 8533 8534 8528 8574 8578 8566 8564 8586 8596 8592 8641 8570
2010 8660 8672 8671 8677 8762 8805 8865 8858 8831 8920 NA 8952 NA

143
APPENDIX B
HISTOGRAM OF VARIOUS METRICS
Figure B- 1. Histogram for construction contract duration of CCDPW
flood control projects ................................................................................ 145
Figure B- 2. Histogram for final construction duration of CCDPW flood
control projects.......................................................................................... 145
Figure B- 3. Histogram for final construction duration of TXDOT road projects ....... 146
Figure B- 4. Histogram for total design cost (%) of CCDPW road projects ................ 146
Figure B- 5. Histogram for basic design cost (%) of CCDPW road projects ............... 147
Figure B- 6. Histogram for contract award cost growth (%) of CCDPW road projects 147
Figure B- 7. Histogram for total cost growth (%) of CCDPW road projects ............... 148
Figure B- 8. Histogram for construction cost growth (%) of CCDPW road projects ... 148
Figure B- 9. Histogram for construction schedule growth (%) of CCDPW
road projects .............................................................................................. 149
Figure B- 10. Histogram for final construction cost ($ million) of CCDPW
road projects .............................................................................................. 149
Figure B- 11. Histogram for basic design cost ($ million) of CCDPW road projects .... 150
Figure B- 12. Histogram for total design cost ($ million) of CCDPW road projects ..... 150
Figure B- 13. Histogram for total project cost ($ million) of CCDPW road projects .... 151
Figure B- 14. Histogram for total design cost (%) of CCDPW flood control projects ... 151
Figure B- 15. Histogram for basic design cost (%) of CCDPW flood control projects . 152
Figure B- 16. Histogram for contract award cost growth (%) of CCDPW
flood control projects ................................................................................ 152
Figure B- 17. Histogram for total cost growth (%) of CCDPW flood control projects .. 153
Figure B- 18. Histogram for construction cost growth (%) of CCDPW flood
control projects.......................................................................................... 153
Figure B- 19. Histogram for construction schedule growth (%) of CCDPW
flood control projects ................................................................................ 154
Figure B- 20. Histogram for final construction cost ($ M) of CCDPW flood
control projects.......................................................................................... 154
Figure B- 21. Histogram for basic design cost ($ M) of CCDPW flood
control projects.......................................................................................... 155
Figure B- 22. Histogram for total design cost ($ M) of CCDPW flood control projects 155
Figure B- 23. Histogram for total project cost ($ M) of CCDPW flood control projects156
Figure B- 24. Histogram for total design cost (%) of CCDPW flood control and
road projects .............................................................................................. 156
Figure B- 25. Histogram for basic design cost (%) of CCDPW flood control and
road projects .............................................................................................. 157
Figure B- 26. Histogram for contract award cost growth (%) of CCDPW flood
control and road projects ........................................................................... 157
Figure B- 27. Histogram for total cost growth (%) of CCDPW flood control and road
projects ...................................................................................................... 158
Figure B- 28. Histogram for construction cost growth (%) of CCDPW flood
control and road projects ........................................................................... 158

144
Figure B- 29. Histogram for construction schedule growth (%) of CCDPW
flood control and road projects ................................................................. 159
Figure B- 30. Histogram for final construction cost ($ M) of CCDPW flood
control and road projects ........................................................................... 159
Figure B- 31. Histogram for basic design cost ($ M) of CCDPW flood control
and road projects ....................................................................................... 160
Figure B- 32. Histogram for total design cost ($ M) of CCDPW flood control
and road projects ....................................................................................... 160
Figure B- 33. Histogram for total project cost ($ M) of CCDPW flood control
and road projects ....................................................................................... 161
Figure B- 34. Histogram for basic design cost (%) of TXDOT road projects ................ 161
Figure B- 35. Histogram for contract award cost growth (%) of TXDOT road projects 162
Figure B- 36. Histogram for total cost growth (%) of TXDOT road projects ................ 162
Figure B- 37. Histogram for construction cost growth (%) of TXDOT road projects ... 163
Figure B- 38. Histogram for construction schedule growth (%) of TXDOT
road projects ............................................................................................. 163
Figure B- 39. Histogram for final construction cost ($ M) of TXDOT road projects .... 164
Figure B- 40. Histogram for basic design cost ($ M) of TXDOT road projects ............. 164
Figure B- 41. Histogram for total project cost ($ M) of TXDOT road projects ............. 165
Figure B- 42. Histogram for basic design cost (%) of TXDOT and CCDPW
road projects ............................................................................................. 165
Figure B- 43. Histogram for contract award cost growth (%) of TXDOT and
CCDPW road projects............................................................................... 166
Figure B- 44. Histogram for total cost growth (%) of TXDOT and CCDPW
road projects .............................................................................................. 166
Figure B- 45. Histogram for construction cost growth (%) of TXDOT and
CCDPW road projects............................................................................... 167
Figure B- 46. Histogram for construction schedule growth (%) of TXDOT and
CCDPW road projects............................................................................... 167
Figure B- 47. Histogram for final construction cost ($ M) of TXDOT and
CCDPW road projects............................................................................... 168
Figure B- 48. Histogram for basic design cost ($ M) of TXDOT and
CCDPW road projects............................................................................... 168
Figure B- 49. Histogram for total project cost ($ M) of TXDOT and
CCDPW road projects............................................................................... 169

145
Figure B- 1. Histogram for construction contract duration of CCDPW flood control
projects
Figure B- 2. Histogram for final construction duration of CCDPW flood control projects
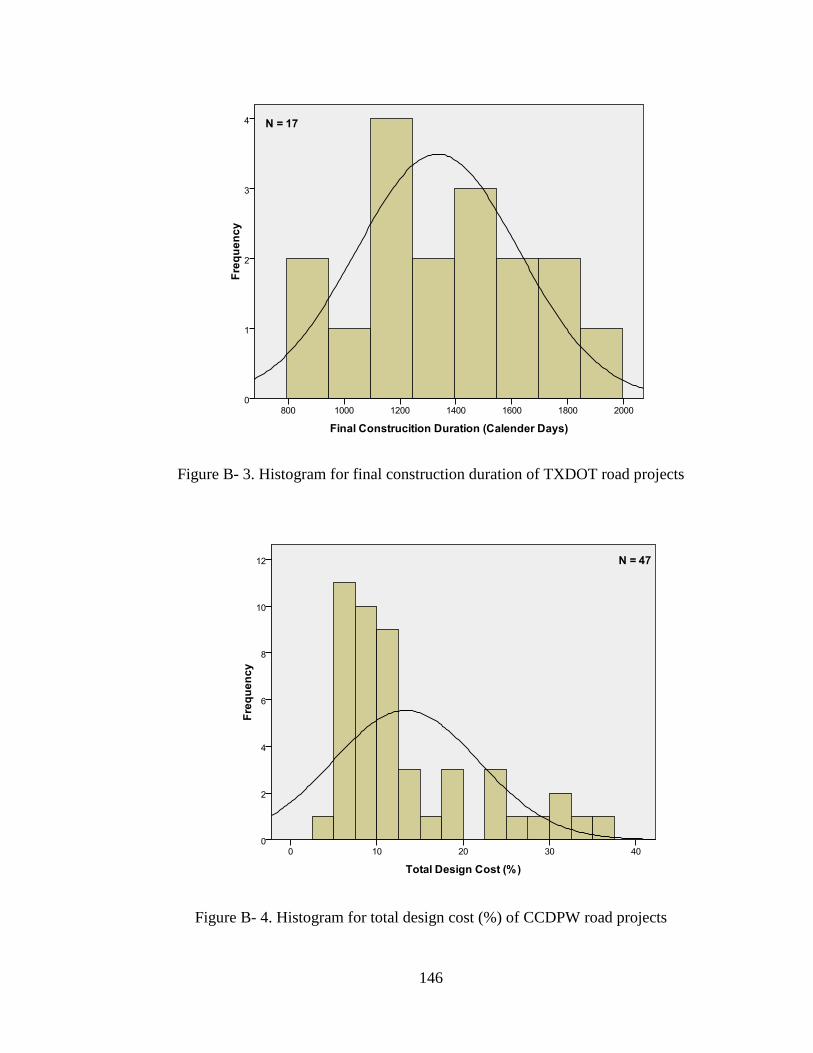
146
Figure B- 3. Histogram for final construction duration of TXDOT road projects
Figure B- 4. Histogram for total design cost (%) of CCDPW road projects

147
Figure B- 5. Histogram for basic design cost (%) of CCDPW road projects
Figure B- 6. Histogram for contract award cost growth (%) of CCDPW road projects

148
Figure B- 7. Histogram for total cost growth (%) of CCDPW road projects
Figure B- 8. Histogram for construction cost growth (%) of CCDPW road projects
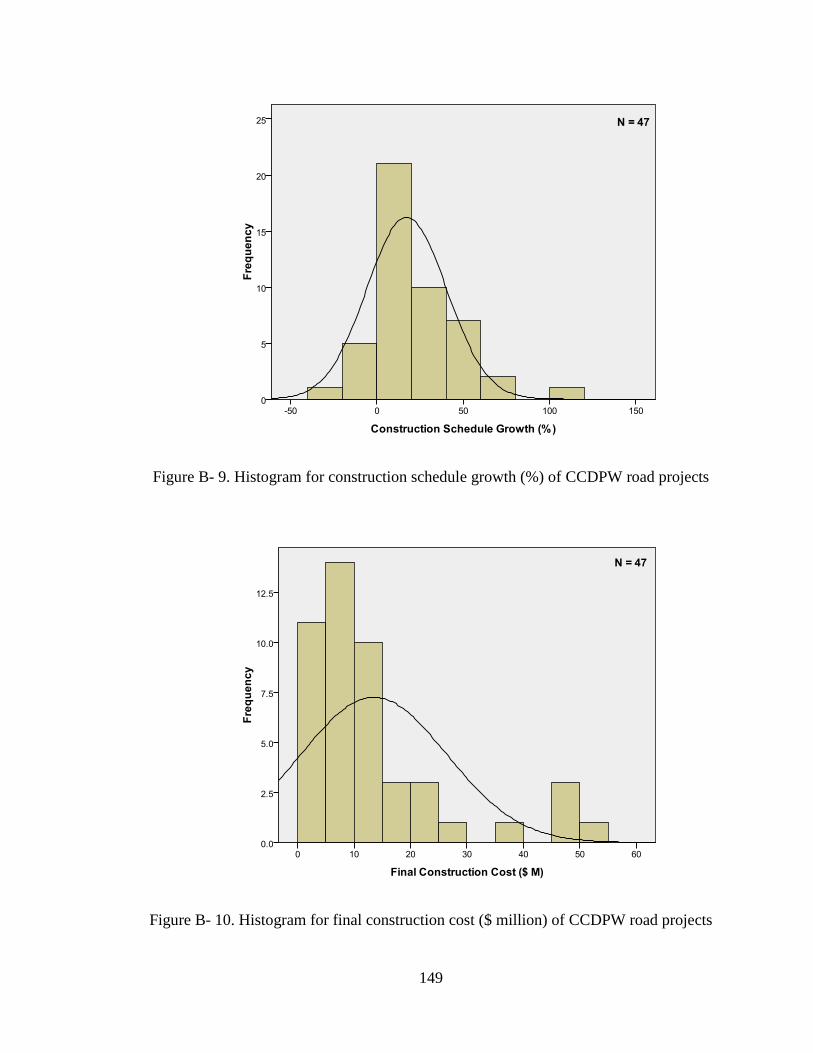
149
Figure B- 9. Histogram for construction schedule growth (%) of CCDPW road projects
Figure B- 10. Histogram for final construction cost ($ million) of CCDPW road projects

150
Figure B- 11. Histogram for basic design cost ($ million) of CCDPW road projects
Figure B- 12. Histogram for total design cost ($ million) of CCDPW road projects

151
Figure B- 13. Histogram for total project cost ($ million) of CCDPW road projects
Figure B- 14. Histogram for total design cost (%) of CCDPW flood control projects

152
Figure B- 15. Histogram for basic design cost (%) of CCDPW flood control projects
Figure B- 16. Histogram for contract award cost growth (%) of CCDPW flood control
projects

153
Figure B- 17. Histogram for total cost growth (%) of CCDPW flood control projects
Figure B- 18. Histogram for construction cost growth (%) of CCDPW flood control
projects
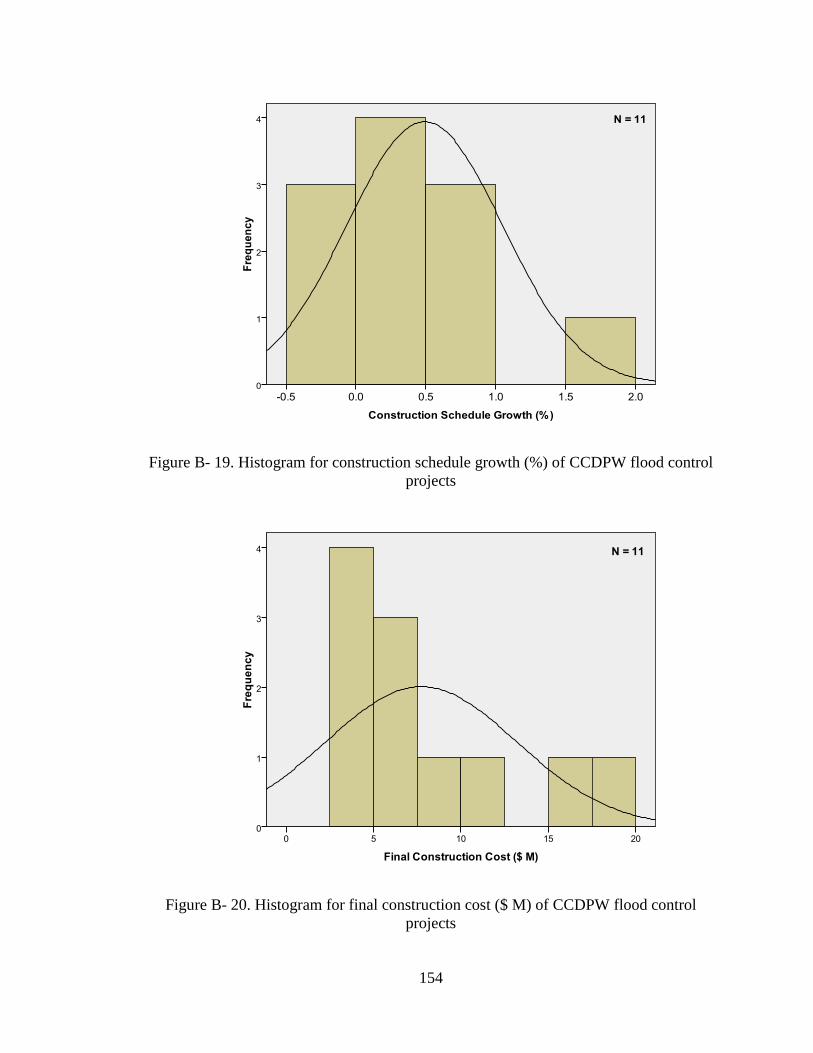
154
Figure B- 19. Histogram for construction schedule growth (%) of CCDPW flood control
projects
Figure B- 20. Histogram for final construction cost ($ M) of CCDPW flood control
projects

155
Figure B- 21. Histogram for basic design cost ($ M) of CCDPW flood control projects
Figure B- 22. Histogram for total design cost ($ M) of CCDPW flood control projects

156
Figure B- 23. Histogram for total project cost ($ M) of CCDPW flood control projects
Figure B- 24. Histogram for total design cost (%) of CCDPW flood control and road
projects
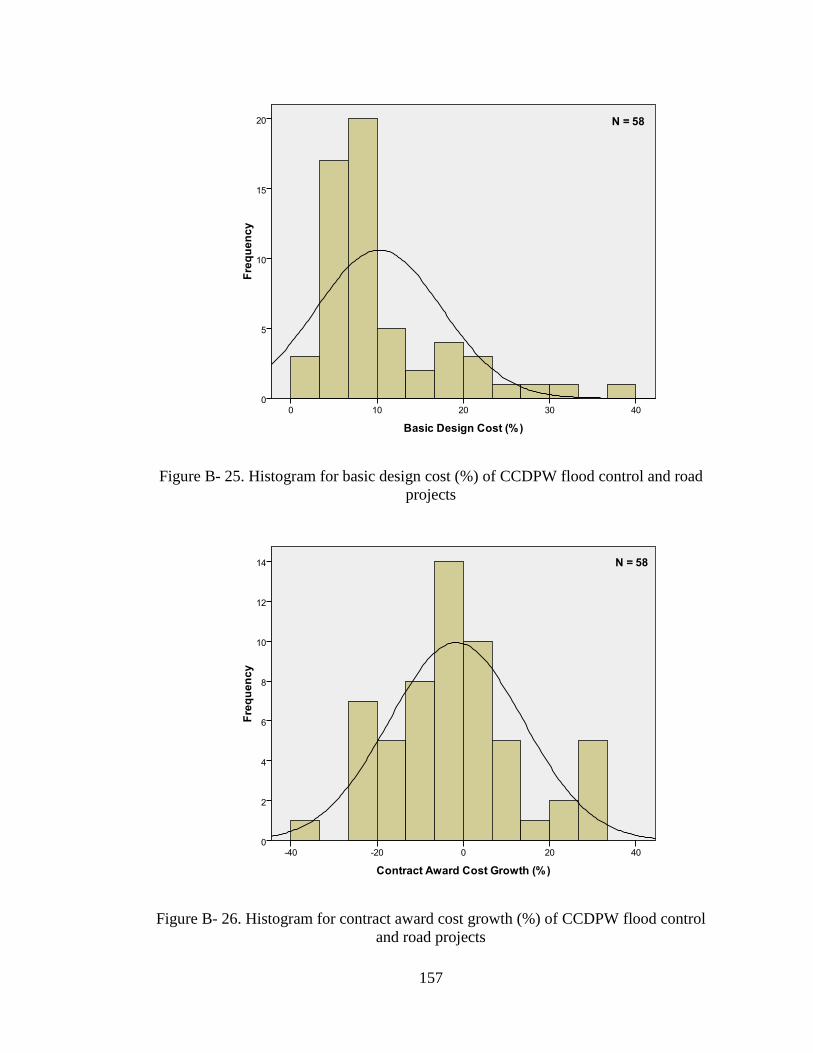
157
Figure B- 25. Histogram for basic design cost (%) of CCDPW flood control and road
projects
Figure B- 26. Histogram for contract award cost growth (%) of CCDPW flood control
and road projects
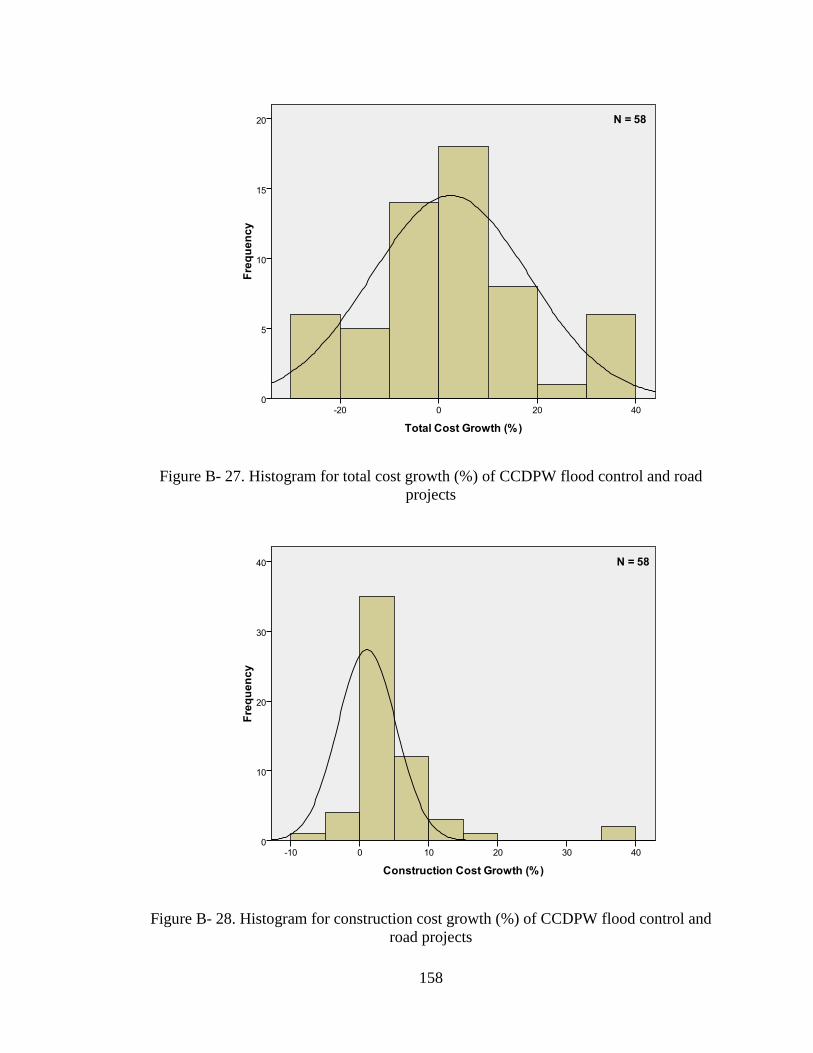
158
Figure B- 27. Histogram for total cost growth (%) of CCDPW flood control and road
projects
Figure B- 28. Histogram for construction cost growth (%) of CCDPW flood control and
road projects
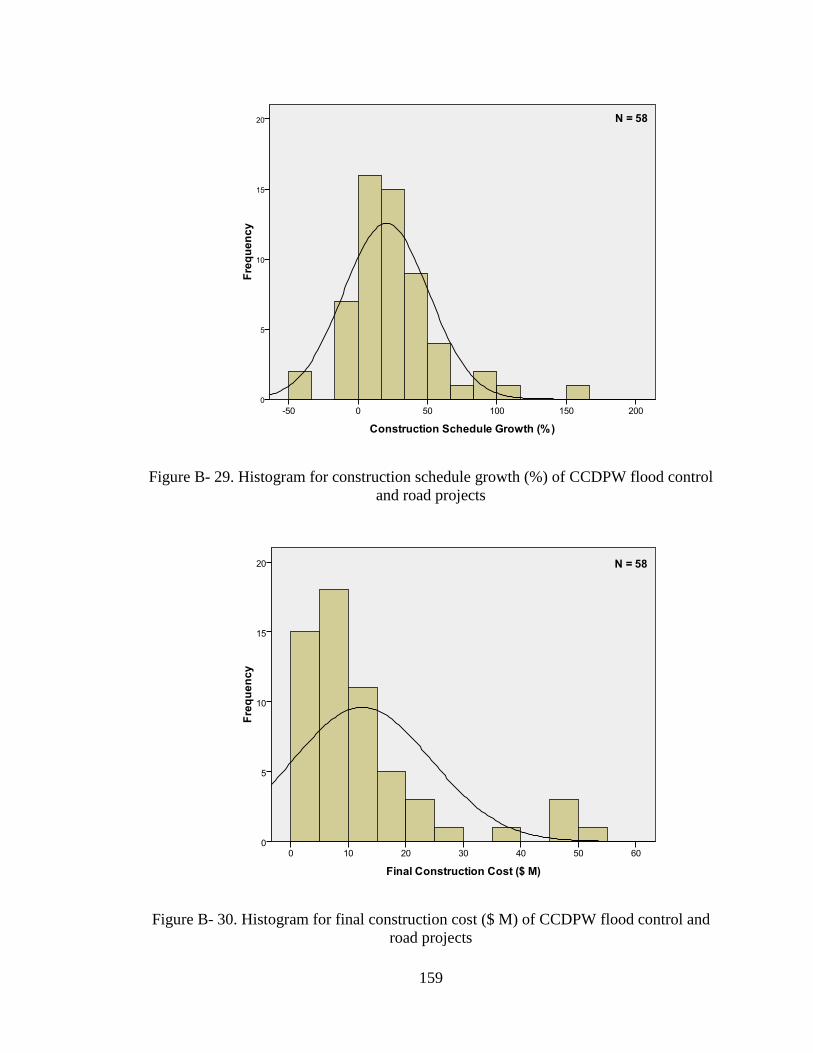
159
Figure B- 29. Histogram for construction schedule growth (%) of CCDPW flood control
and road projects
Figure B- 30. Histogram for final construction cost ($ M) of CCDPW flood control and
road projects

160
Figure B- 31. Histogram for basic design cost ($ M) of CCDPW flood control and road
projects
Figure B- 32. Histogram for total design cost ($ M) of CCDPW flood control and road
projects

161
Figure B- 33. Histogram for total project cost ($ M) of CCDPW flood control and road
projects
Figure B- 34. Histogram for basic design cost (%) of TXDOT road projects

162
Figure B- 35. Histogram for contract award cost growth (%) of TXDOT road projects
Figure B- 36. Histogram for total cost growth (%) of TXDOT road projects

163
Figure B- 37. Histogram for construction cost growth (%) of TXDOT road projects
Figure B- 38. Histogram for construction schedule growth (%) of TXDOT road projects

164
Figure B- 39. Histogram for final construction cost ($ M) of TXDOT road projects
Figure B- 40. Histogram for basic design cost ($ M) of TXDOT road projects

165
Figure B- 41. Histogram for total project cost ($ M) of TXDOT road projects
Figure B- 42. Histogram for basic design cost (%) of TXDOT and CCDPW road projects
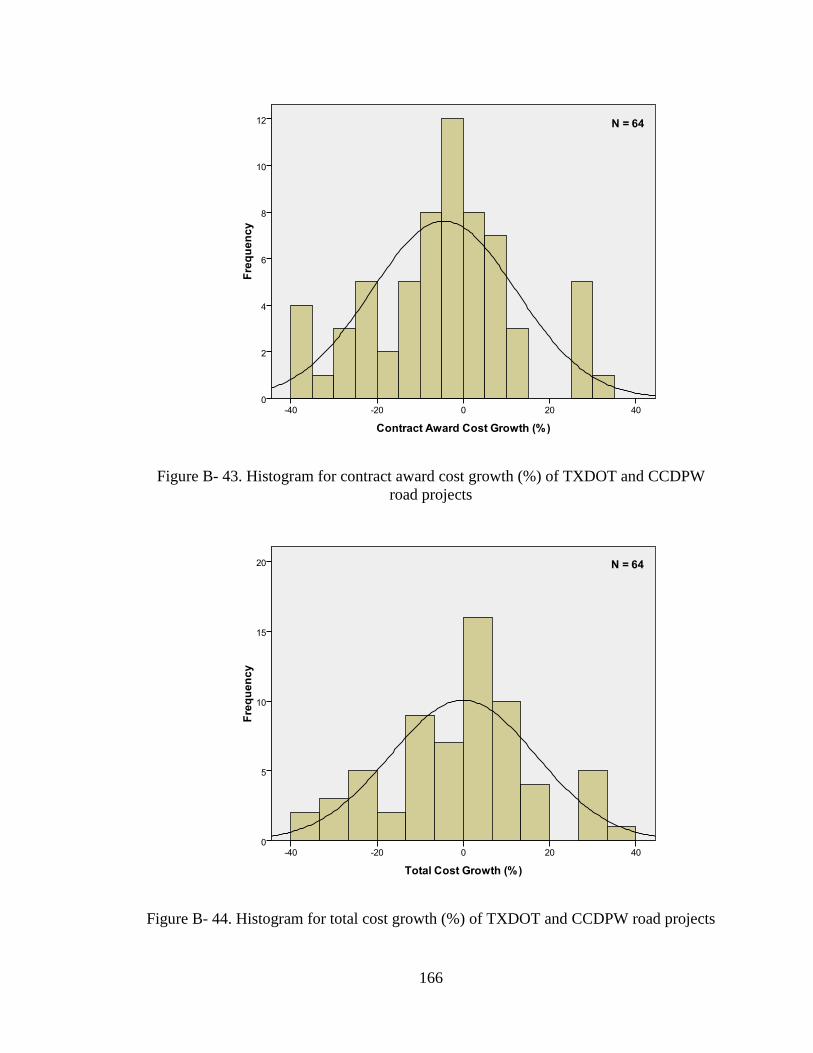
166
Figure B- 43. Histogram for contract award cost growth (%) of TXDOT and CCDPW
road projects
Figure B- 44. Histogram for total cost growth (%) of TXDOT and CCDPW road projects

167
Figure B- 45. Histogram for construction cost growth (%) of TXDOT and CCDPW road
projects
Figure B- 46. Histogram for construction schedule growth (%) of TXDOT and CCDPW
road projects

168
Figure B- 47. Histogram for final construction cost ($ M) of TXDOT and CCDPW road
projects
Figure B- 48. Histogram for basic design cost ($ M) of TXDOT and CCDPW road
projects
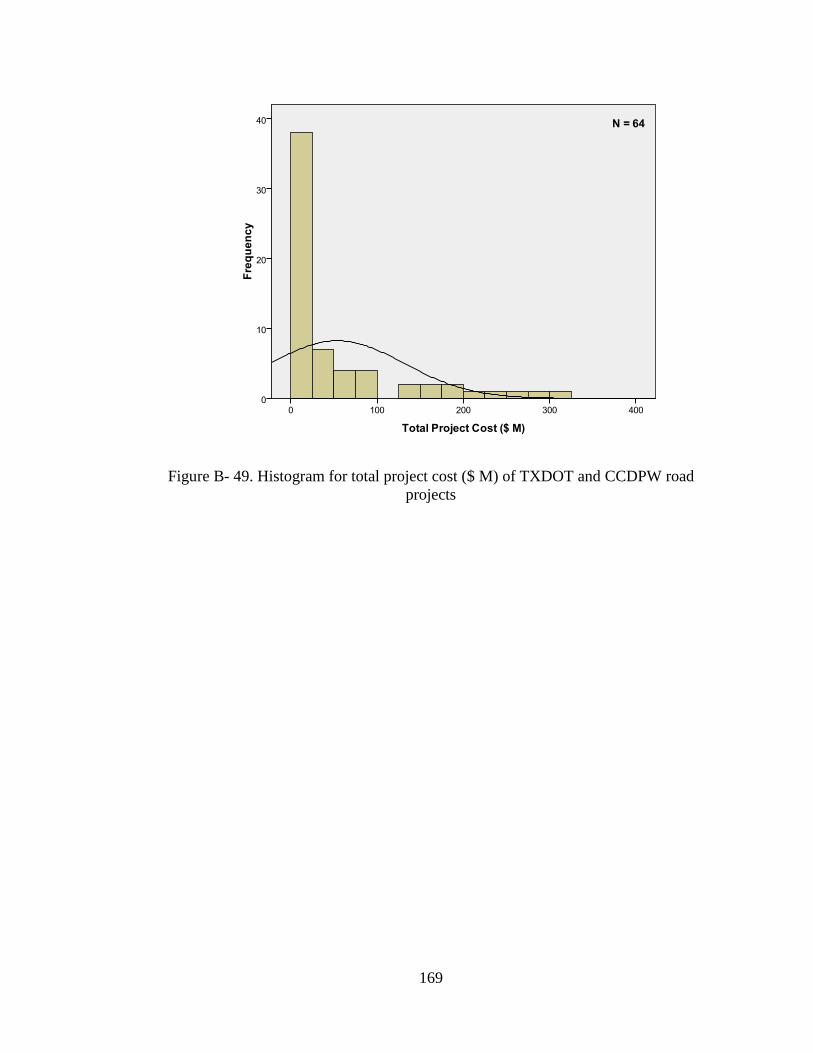
169
Figure B- 49. Histogram for total project cost ($ M) of TXDOT and CCDPW road
projects

170
APPENDIX C
BOX PLOTS
Figure C- 1. Box plot for basic design cost (%) of CCDPW road projects .................. 172
Figure C- 2. Box plot for total design cost (%) of CCDPW road projects ................... 172
Figure C- 3. Box plot for contract award cost growth (%) of CCDPW road projects .. 173
Figure C- 4. Box plot for total cost growth (%) of CCDPW road projects .................. 173
Figure C- 5. Box plot for construction cost growth (%) of CCDPW road projects ...... 174
Figure C- 6. Box plot for construction schedule growth (%) of CCDPW
road projects .............................................................................................. 174
Figure C- 7. Box plot for basic design cost ($ million) of CCDPW road projects ....... 175
Figure C- 8. Box plot for basic design cost ($ million) of CCDPW road projects ....... 175
Figure C- 9. Box plot for total project cost ($ million) of CCDPW road projects ....... 176
Figure C- 10. Box plot for total design cost (%) of CCDPW road and flood control
projects ...................................................................................................... 176
Figure C- 11. Box plot for basic design cost (%) of CCDPW road and flood control
projects ...................................................................................................... 177
Figure C- 12. Box plot for contract award cost growth (%) of CCDPW road and
flood control projects ................................................................................ 177
Figure C- 13. Box plot for total cost growth (%) of CCDPW road and flood control
projects ...................................................................................................... 178
Figure C- 14. Box plot for construction cost growth (%) of CCDPW road and flood
control projects.......................................................................................... 178
Figure C- 15. Box plot for construction schedule growth (%) of CCDPW road and
flood control projects ................................................................................ 179
Figure C- 16. Box plot for final construction cost (%) of CCDPW road and flood
control projects.......................................................................................... 179
Figure C- 17. Box plot for basic design cost ($ million) of CCDPW road and flood
control projects.......................................................................................... 180
Figure C- 18. Box plot for total project cost ($ million) of CCDPW road and flood
control projects.......................................................................................... 180
Figure C- 19. Box plot for basic design cost (%) of TXDOT road projects ................... 181
Figure C- 20. Box plot for contract award cost growth (%) of TXDOT road projects .. 181
Figure C- 21. Box plot for total cost growth (%) of TXDOT road projects ................... 182
Figure C- 22. Box plot for construction cost growth (%) of TXDOT road projects ...... 182
Figure C- 23. Box plot for construction schedule growth (%) of TXDOT road projects 183
Figure C- 24. Box plot for final construction cost ($ million) of TXDOT road projects 183
Figure C- 25. Box plot for basic design cost ($ million) of TXDOT road projects........ 184
Figure C- 26. Box plot for total project cost ($ million) of TXDOT road projects ........ 184
Figure C- 27. Box plot for basic design cost (%) of TXDOT and CCDPW
road projects ............................................................................................. 185
Figure C- 28. Box plot for contract award cost growth (%) of TXDOT and
CCDPW road projects............................................................................... 185
Figure C- 29. Box plot for total cost growth (%) of TXDOT and CCDPW
road projects ............................................................................................. 186

171
Figure C- 30. Box plot for construction cost growth (%) of TXDOT and
CCDPW road projects............................................................................... 186
Figure C- 31. Box plot for construction schedule growth (%) of TXDOT
and CCDPW road projects ........................................................................ 187
Figure C- 32. Box plot for final construction cost ($ million) of TXDOT
and Clark County road projects ................................................................ 187
Figure C- 33. Box plot for basic design cost ($ million) of TXDOT and
CCDPW road projects............................................................................... 188
Figure C- 34. Box plot for total project cost ($ million) of TXDOT and
CCDPW road projects............................................................................... 188
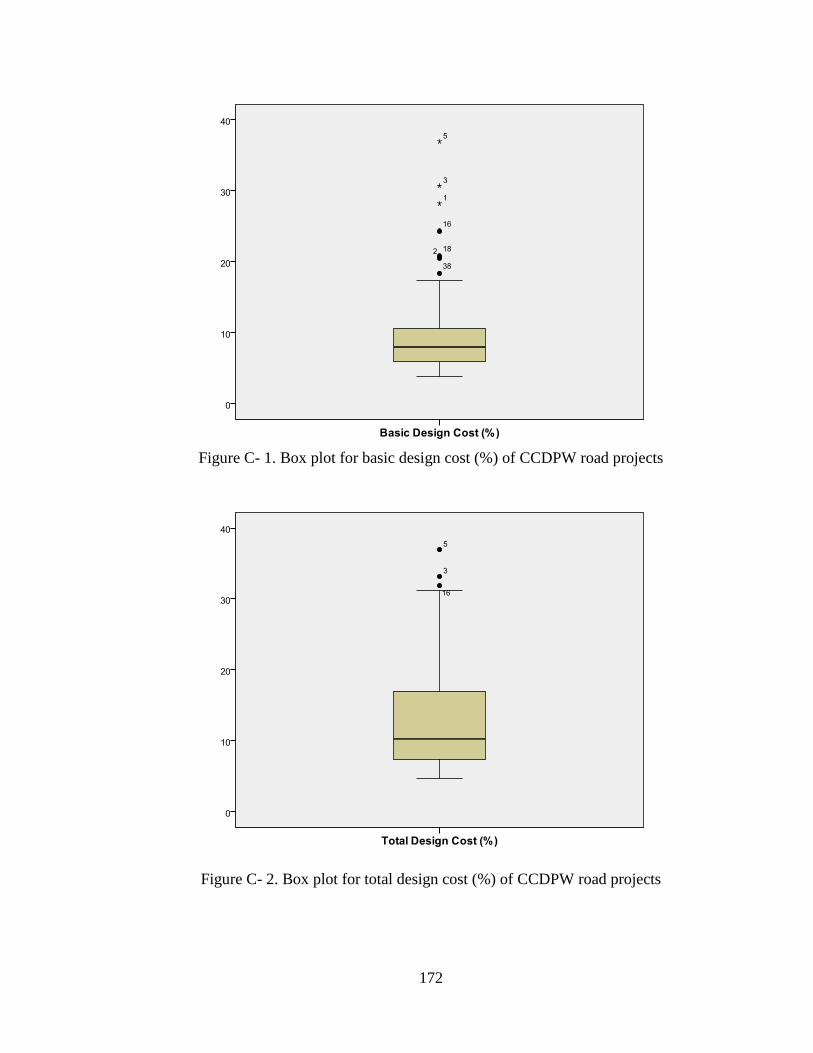
172
Figure C- 1. Box plot for basic design cost (%) of CCDPW road projects
Figure C- 2. Box plot for total design cost (%) of CCDPW road projects
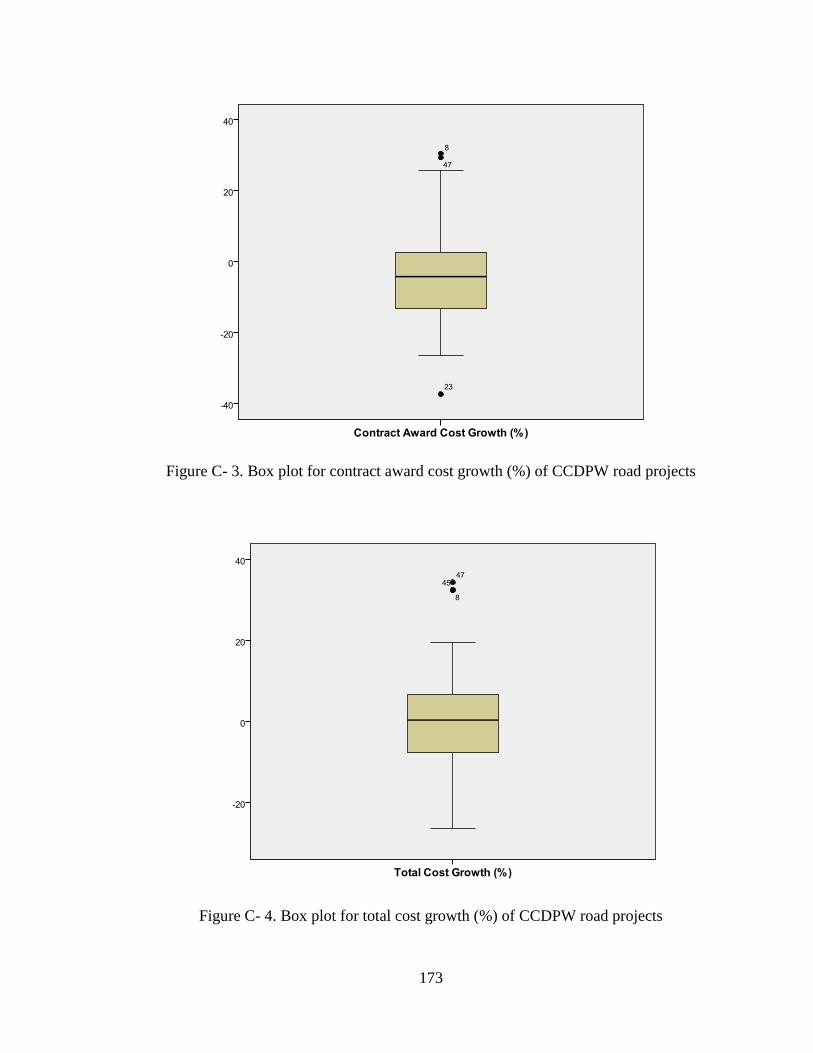
173
Figure C- 3. Box plot for contract award cost growth (%) of CCDPW road projects
Figure C- 4. Box plot for total cost growth (%) of CCDPW road projects

174
Figure C- 5. Box plot for construction cost growth (%) of CCDPW road projects
Figure C- 6. Box plot for construction schedule growth (%) of CCDPW road projects

175
Figure C- 7. Box plot for basic design cost ($ million) of CCDPW road projects
Figure C- 8. Box plot for basic design cost ($ million) of CCDPW road projects

176
Figure C- 9. Box plot for total project cost ($ million) of CCDPW road projects
Figure C- 10. Box plot for total design cost (%) of CCDPW road and flood control
projects

177
Figure C- 11. Box plot for basic design cost (%) of CCDPW road and flood control
projects
Figure C- 12. Box plot for contract award cost growth (%) of CCDPW road and flood
control projects

178
Figure C- 13. Box plot for total cost growth (%) of CCDPW road and flood control
projects
Figure C- 14. Box plot for construction cost growth (%) of CCDPW road and flood
control projects

179
Figure C- 15. Box plot for construction schedule growth (%) of CCDPW road and flood
control projects
Figure C- 16. Box plot for final construction cost (%) of CCDPW road and flood control
projects

180
Figure C- 17. Box plot for basic design cost ($ million) of CCDPW road and flood
control projects
Figure C- 18. Box plot for total project cost ($ million) of CCDPW road and flood
control projects

181
Figure C- 19. Box plot for basic design cost (%) of TXDOT road projects
Figure C- 20. Box plot for contract award cost growth (%) of TXDOT road projects

182
Figure C- 21. Box plot for total cost growth (%) of TXDOT road projects
Figure C- 22. Box plot for construction cost growth (%) of TXDOT road projects

183
Figure C- 23. Box plot for construction schedule growth (%) of TXDOT road projects
Figure C- 24. Box plot for final construction cost ($ million) of TXDOT road projects

184
Figure C- 25. Box plot for basic design cost ($ million) of TXDOT road projects
Figure C- 26. Box plot for total project cost ($ million) of TXDOT road projects

185
Figure C- 27. Box plot for basic design cost (%) of TXDOT and CCDPW road projects
Figure C- 28. Box plot for contract award cost growth (%) of TXDOT and CCDPW road
projects

186
Figure C- 29. Box plot for total cost growth (%) of TXDOT and CCDPW road projects
Figure C- 30. Box plot for construction cost growth (%) of TXDOT and CCDPW road
projects

187
Figure C- 31. Box plot for construction schedule growth (%) of TXDOT and CCDPW
road projects
Figure C- 32. Box plot for final construction cost ($ million) of TXDOT and Clark
County road projects

188
Figure C- 33. Box plot for basic design cost ($ million) of TXDOT and CCDPW road
projects
Figure C- 34. Box plot for total project cost ($ million) of TXDOT and CCDPW road
projects

189
APPENDIX D
SCATTER PLOT BETWEEN INDEPENDENT AND DEPENDENT VARIABLES
Figure D- 1. Scatter plot of basic design cost and contract award cost growth for
CCDPW road projects............................................................................... 191
Figure D- 2. Scatter plot of basic design cost and contract award cost growth for
CCDPW flood control projects ................................................................. 191
Figure D- 3. Scatter plot of basic design cost and contract award cost growth for
CCDPW combined CCDPW road and flood control projects .................. 192
Figure D- 4. Scatter plot of basic design cost and total cost growth for CCDPW
road projects ............................................................................................. 192
Figure D- 5. Scatter plot of basic design cost and total cost growth for CCDPW
flood control projects ................................................................................ 193
Figure D- 6. Scatter plot of basic design cost and total cost growth for CCDPW
combined road and flood control projects ................................................ 193
Figure D- 7. Scatter plot of basic design cost and construction cost growth of
CCDPW road projects............................................................................... 194
Figure D- 8. Scatter plot of basic design cost and construction cost growth of
CCDPW flood control projects ................................................................. 194
Figure D- 9. Scatter plot of basic design cost and construction cost growth of
CCDPW combined road and flood control projects ................................. 195
Figure D- 10. Scatter plot of basic design cost and construction schedule growth
of CCDPW road projects .......................................................................... 195
Figure D- 11. Scatter plot of basic design cost and construction schedule growth of
CCDPW flood control projects ................................................................. 196
Figure D- 12. Scatter plot of basic design cost and construction schedule growth of
CCDPW combined road and flood control projects ................................. 196
Figure D- 13. Scatter plot of total design cost and contract award cost growth of
CCDPW road projects............................................................................... 197
Figure D- 14. Scatter plot of total design cost and contract award cost growth of
CCDPW flood control projects ................................................................. 197
Figure D- 15. Scatter plot of total design cost and contract award cost growth of
CCDPW combined road and flood control projects ................................. 198
Figure D- 16. Scatter plot of total design cost and total cost growth of CCDPW
road projects ............................................................................................. 198
Figure D- 17. Scatter plot of total design cost and total cost growth of CCDPW
flood control projects ................................................................................ 199
Figure D- 18. Scatter plot of total design cost and total cost growth of CCDPW
combined road and flood control projects ................................................ 199
Figure D- 19. Scatter plot of total design cost and construction cost growth of
CCDPW road projects............................................................................... 200
Figure D- 20. Scatter plot of total design cost and construction cost growth of
CCDPW flood control projects ................................................................. 200
Figure D- 21. Scatter plot of total design cost and construction cost growth of
CCDPW combined road and flood control projects ................................. 201
190
Figure D- 22. Scatter plot of total design cost and construction schedule growth of
CCDPW combined road and flood control projects ................................. 201
Figure D- 23. Scatter plot of total design cost and construction schedule growth of
CCDPW flood control projects ................................................................. 202
Figure D- 24. Scatter plot of total design cost and construction schedule growth of
combined CCDPW road and flood control projects ................................. 202
Figure D- 25. Scatter plot of basic design cost and contract award cost growth for
TXDOT road projects ............................................................................... 203
Figure D- 26. Scatter plot of basic design cost and total cost growth for TXDOT
road projects .............................................................................................. 203
Figure D- 27. Scatter plot of basic design cost and construction cost growth for
TXDOT road projects ............................................................................... 204
Figure D- 28. Scatter plot of basic design cost and construction schedule growth for
TXDOT road projects ............................................................................... 204
Figure D- 29. Scatter plot of basic design cost and contract award cost growth for
CCDPW and TXDOT road projects ......................................................... 205
Figure D- 30. Scatter plot of basic design cost and total cost growth for CCDPW and
TXDOT road projects ............................................................................... 205
Figure D- 31. Scatter plot of basic design cost and construction cost growth for
CCDPW and TXDOT road projects ......................................................... 206
Figure D- 32. Scatter plot of basic design cost and construction schedule growth for
CDPW and TXDOT road projects ............................................................ 206

191
Figure D- 1. Scatter plot of basic design cost and contract award cost growth for CCDPW
road projects
Figure D- 2. Scatter plot of basic design cost and contract award cost growth for CCDPW
flood control projects

192
Figure D- 3. Scatter plot of basic design cost and contract award cost growth for CCDPW
combined CCDPW road and flood control projects
Figure D- 4. Scatter plot of basic design cost and total cost growth for CCDPW road
projects
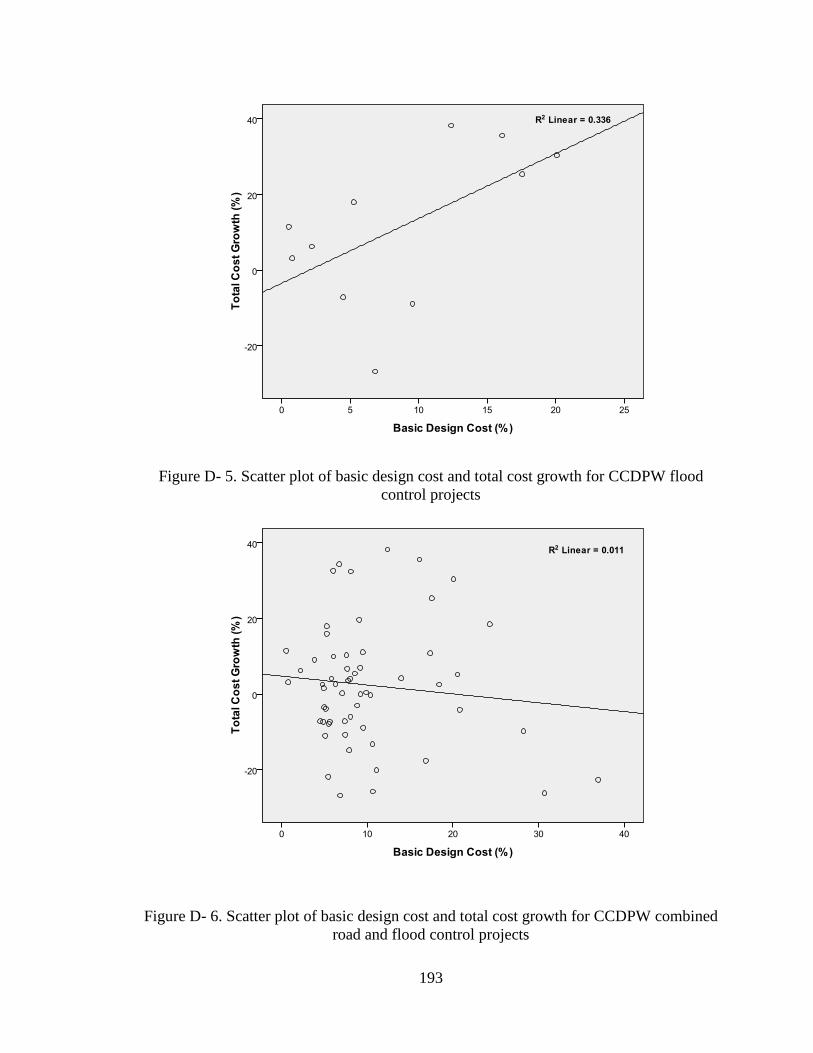
193
Figure D- 5. Scatter plot of basic design cost and total cost growth for CCDPW flood
control projects
Figure D- 6. Scatter plot of basic design cost and total cost growth for CCDPW combined
road and flood control projects
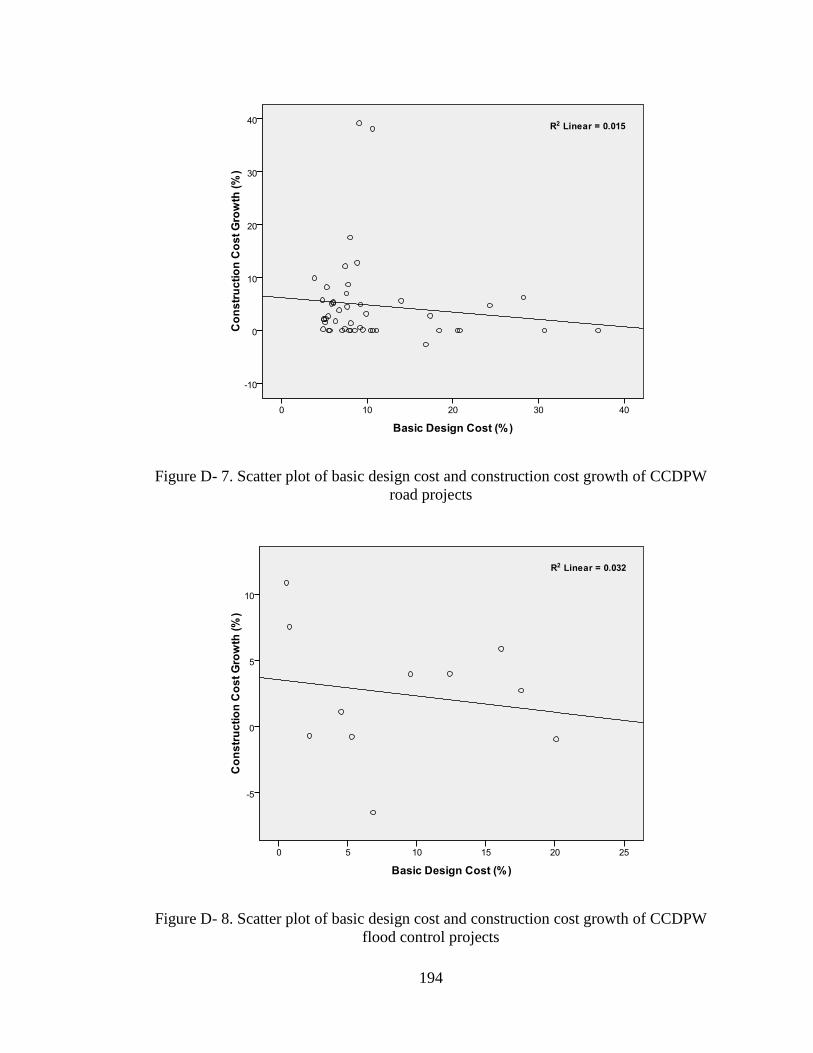
194
Figure D- 7. Scatter plot of basic design cost and construction cost growth of CCDPW
road projects
Figure D- 8. Scatter plot of basic design cost and construction cost growth of CCDPW
flood control projects

195
Figure D- 9. Scatter plot of basic design cost and construction cost growth of CCDPW
combined road and flood control projects
Figure D- 10. Scatter plot of basic design cost and construction schedule growth of
CCDPW road projects

196
Figure D- 11. Scatter plot of basic design cost and construction schedule growth of
CCDPW flood control projects
Figure D- 12. Scatter plot of basic design cost and construction schedule growth of
CCDPW combined road and flood control projects

197
Figure D- 13. Scatter plot of total design cost and contract award cost growth of CCDPW
road projects
Figure D- 14. Scatter plot of total design cost and contract award cost growth of CCDPW
flood control projects

198
Figure D- 15. Scatter plot of total design cost and contract award cost growth of CCDPW
combined road and flood control projects
Figure D- 16. Scatter plot of total design cost and total cost growth of CCDPW road
projects
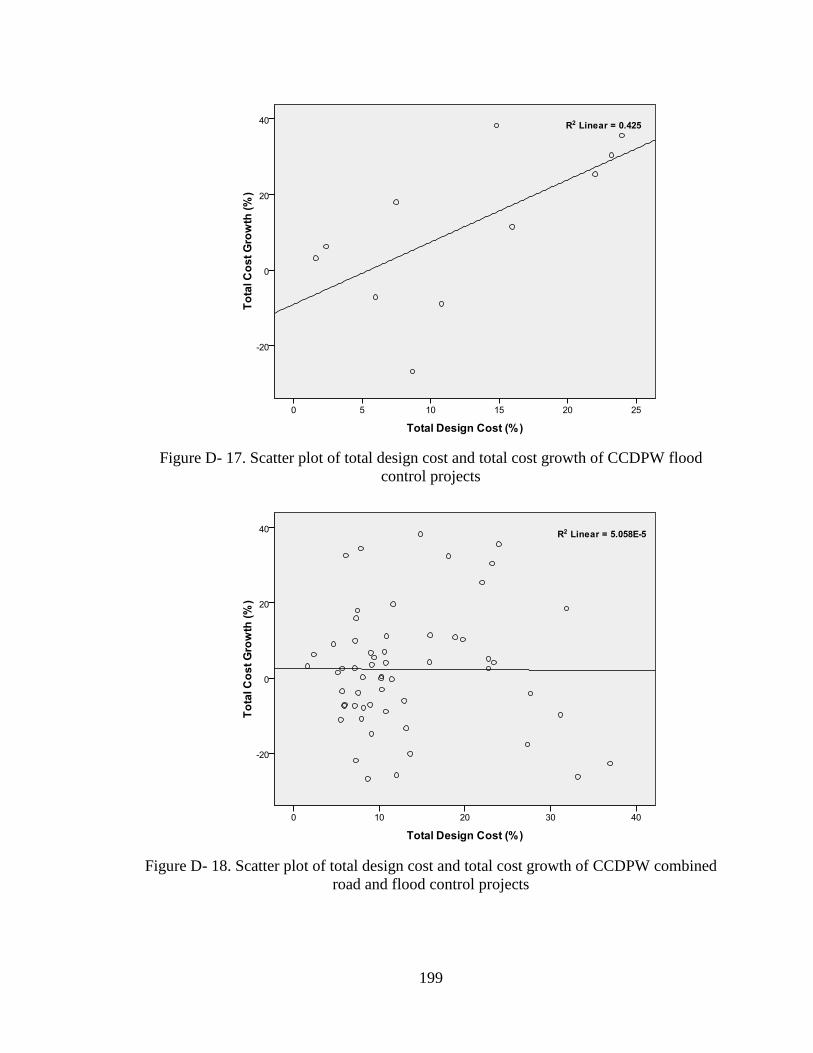
199
Figure D- 17. Scatter plot of total design cost and total cost growth of CCDPW flood
control projects
Figure D- 18. Scatter plot of total design cost and total cost growth of CCDPW combined
road and flood control projects

200
Figure D- 19. Scatter plot of total design cost and construction cost growth of CCDPW
road projects
Figure D- 20. Scatter plot of total design cost and construction cost growth of CCDPW
flood control projects

201
Figure D- 21. Scatter plot of total design cost and construction cost growth of CCDPW
combined road and flood control projects
Figure D- 22. Scatter plot of total design cost and construction schedule growth of
CCDPW combined road and flood control projects

202
Figure D- 23. Scatter plot of total design cost and construction schedule growth of
CCDPW flood control projects
Figure D- 24. Scatter plot of total design cost and construction schedule growth of
combined CCDPW road and flood control projects
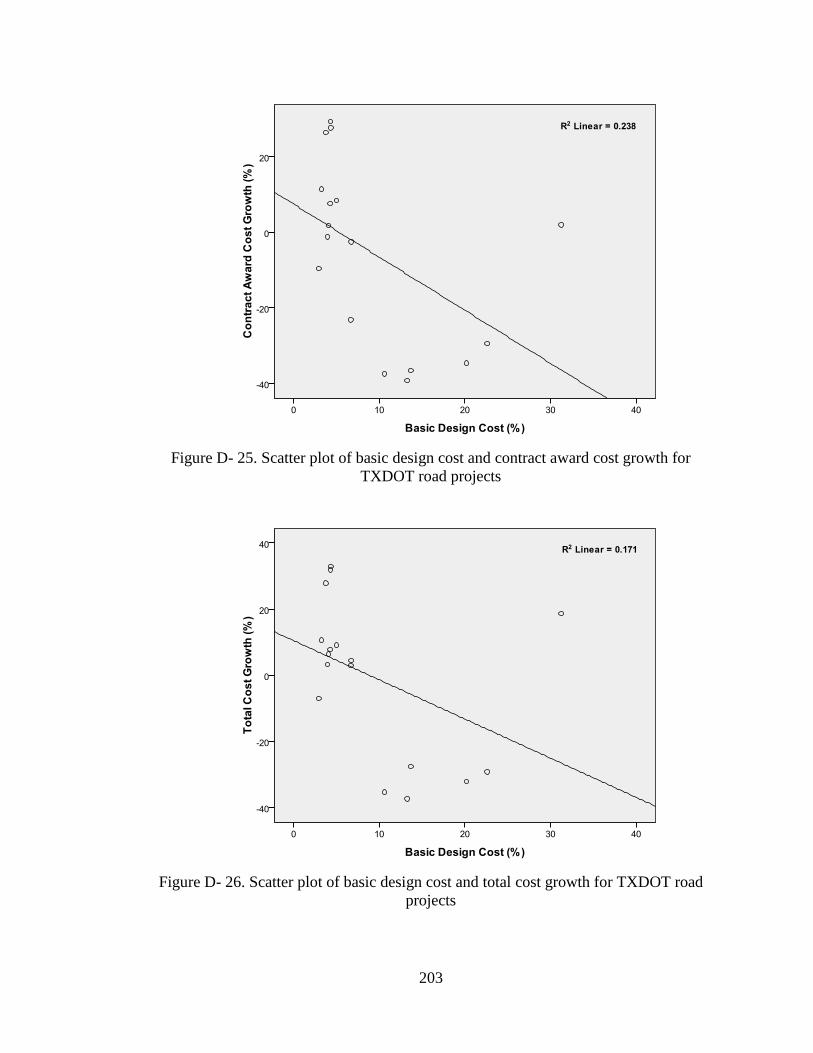
203
Figure D- 25. Scatter plot of basic design cost and contract award cost growth for
TXDOT road projects
Figure D- 26. Scatter plot of basic design cost and total cost growth for TXDOT road
projects

204
Figure D- 27. Scatter plot of basic design cost and construction cost growth for TXDOT
road projects
Figure D- 28. Scatter plot of basic design cost and construction schedule growth for
TXDOT road projects

205
Figure D- 29. Scatter plot of basic design cost and contract award cost growth for
CCDPW and TXDOT road projects
Figure D- 30. Scatter plot of basic design cost and total cost growth for CCDPW and
TXDOT road projects

206
Figure D- 31. Scatter plot of basic design cost and construction cost growth for
CCDPW and TXDOT road projects
Figure D- 32. Scatter plot of basic design cost and construction schedule growth for
CCDPW and TXDOT road projects

207
APPENDIX E
RESIDUAL PLOT WITH INDEPENDENT VARIABLES
Figure E- 1. Unstandardized residual plot with total design cost ($ million) for
CCDPW road projects............................................................................... 208
Figure E- 2. Studentized residual plot with total design cost ($ million) for
CCDPW road projects............................................................................... 208
Figure E- 3. Unstandardized residual plot with basic design cost ($ million)
for CCDPW road projects ......................................................................... 209
Figure E- 4. Studentized residual plot with basic design cost ($ million) for
CCDPW road projects............................................................................... 209
Figure E- 5. Unstandardized residual plot with basic design cost ($ million)
for CCDPW road and flood control projects ............................................ 210
Figure E- 6. Studentized residual plot with basic design cost ($ million) for
CCDPW road and flood control projects .................................................. 210
Figure E- 7. Unstandardized residual plot with total design cost ($ million)
for CCDPW road and flood control projects ............................................ 211
Figure E- 8. Studentized residual plot with total design cost ($ million) for
CCDPW road and flood control projects .................................................. 211
Figure E- 9. Unstandardized residual plot with basic design cost ($ million)
for CCDPW and TXDOT road projects.................................................... 212
Figure E- 10. Studentized residual plot with basic design cost ($ million) for
CCDPW and TXDOT road projects ......................................................... 212

208
Figure E- 1. Unstandardized residual plot with total design cost ($ million) for CCDPW
road projects
Figure E- 2. Studentized residual plot with total design cost ($ million) for CCDPW road
projects

209
Figure E- 3. Unstandardized residual plot with basic design cost ($ million) for CCDPW
road projects
Figure E- 4. Studentized residual plot with basic design cost ($ million) for CCDPW road
projects

210
Figure E- 5. Unstandardized residual plot with basic design cost ($ million) for CCDPW
road and flood control projects
Figure E- 6. Studentized residual plot with basic design cost ($ million) for CCDPW road
and flood control projects
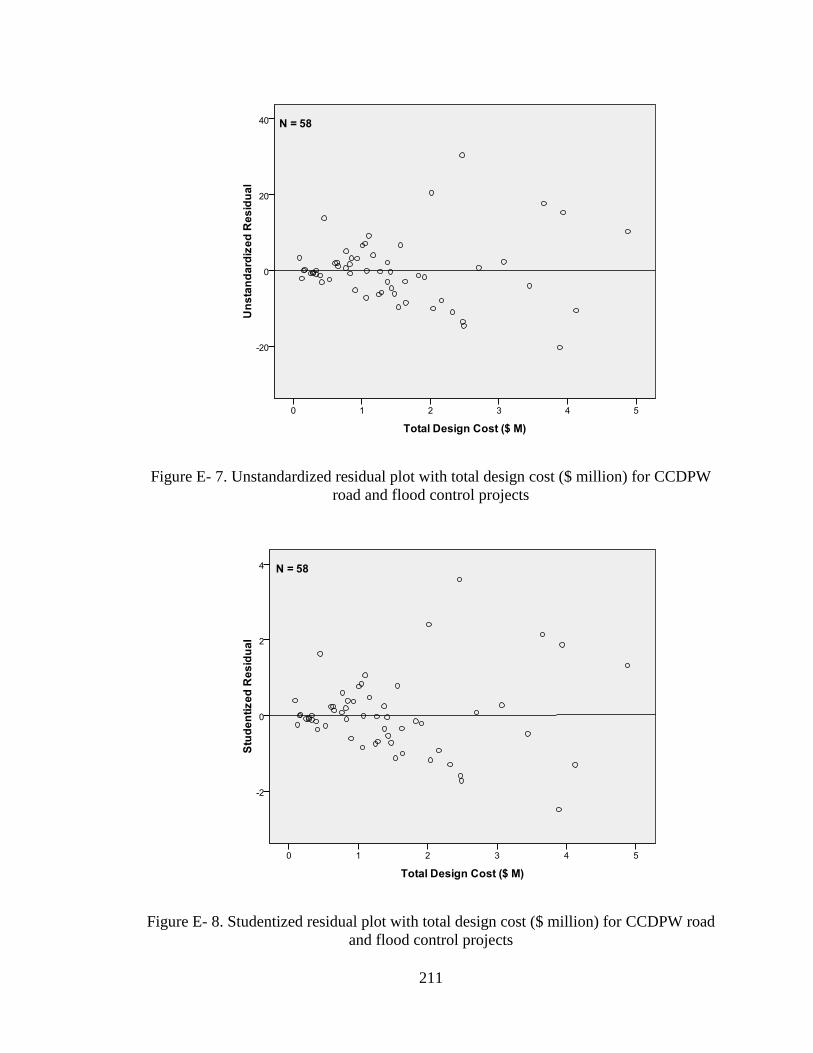
211
Figure E- 7. Unstandardized residual plot with total design cost ($ million) for CCDPW
road and flood control projects
Figure E- 8. Studentized residual plot with total design cost ($ million) for CCDPW road
and flood control projects

212
Figure E- 9. Unstandardized residual plot with basic design cost ($ million) for CCDPW
and TXDOT road projects
Figure E- 10. Studentized residual plot with basic design cost ($ million) for CCDPW
and TXDOT road projects
213
APPENDIX F
RESIDUAL PLOT WITH PREDICTED VALUE
Figure F- 1. Residual plot with predicted value (for total design cost) for
CCDPW road projects............................................................................... 214
Figure F- 2. Residual plot with predicted value (for basic design cost) for
CCDPW road projects............................................................................... 214
Figure F- 3. Residual plot with predicted value (for basic design cost) for
CCDPW road and flood control projects .................................................. 215
Figure F- 4. Residual plot with predicted value (for total design cost) for
CCDPW road and flood control projects .................................................. 215
Figure F- 5. Residual plot with predicted value (for basic design cost) for
CCDPW and TXDOT road projects ......................................................... 216

214
Figure F- 1. Residual plot with predicted value (for total design cost) for CCDPW road
projects
Figure F- 2. Residual plot with predicted value (for basic design cost) for CCDPW road
projects
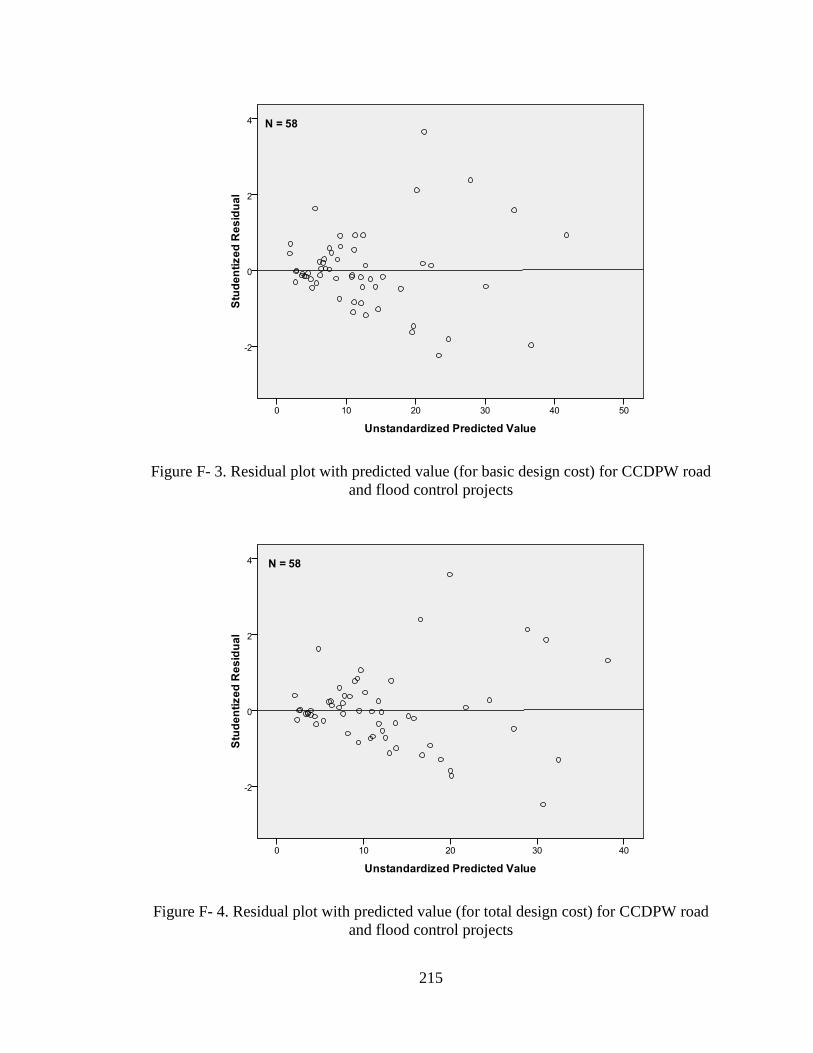
215
Figure F- 3. Residual plot with predicted value (for basic design cost) for CCDPW road
and flood control projects
Figure F- 4. Residual plot with predicted value (for total design cost) for CCDPW road
and flood control projects

216
Figure F- 5. Residual plot with predicted value (for basic design cost) for CCDPW and
TXDOT road projects

217
APPENDIX G
HISTOGRAM OF RESIDUALS
Figure G- 1. Histogram of the residuals (for total design cost) for
CCDPW road projects.............................................................................. 218
Figure G- 2. Histogram of the residuals (for basic design cost) for
CCDPW road projects.............................................................................. 218
Figure G- 3. Histogram of the residuals (for basic design cost) for
CCDPW road and flood control projects ................................................. 219
Figure G- 4. Histogram of the residuals (for total design cost) for
CCDPW road and flood control projects ................................................. 219
Figure G- 5. Histogram of the residuals (for basic design cost) for
CCDPW and TXDOT road projects ........................................................ 220

218
Figure G- 1. Histogram of the residuals (for total design cost) for CCDPW road projects
Figure G- 2. Histogram of the residuals (for basic design cost) for CCDPW road projects

219
Figure G- 3. Histogram of the residuals (for basic design cost) for CCDPW road and
flood control projects
Figure G- 4. Histogram of the residuals (for total design cost) for CCDPW road and flood
control projects

220
Figure G- 5. Histogram of the residuals (for basic design cost) for CCDPW and TXDOT
road projects

221
APPENDIX H
PLOT FOR PREDICTED VALUES AGAINST ACTUAL VALUES
Figure H- 1. Standardized predicted values of final construction cost ($ M) for
CCDPW road projects (considering basic design cost) ............................ 222
Figure H- 2. Standardized predicted values of final construction cost ($ M) for
CCDPW road projects (considering total design cost) ............................. 222
Figure H- 3. Standardized predicted values of final construction cost ($ M) for
CCDPW road and flood control projects (considering basic design cost) 223
Figure H- 4. Standardized predicted values of final construction cost ($ M) for
CCDPW road and flood control projects (considering total design cost) . 223
Figure H- 5. Standardized predicted values of final construction cost ($ M) for
CCDPW and TXDOT road (considering basic design Cost).................... 224

222
Figure H- 1. Standardized predicted values of final construction cost ($ M) for CCDPW
road projects (considering basic design cost)
Figure H- 2. Standardized predicted values of final construction cost ($ M) for CCDPW
road projects (considering total design cost)
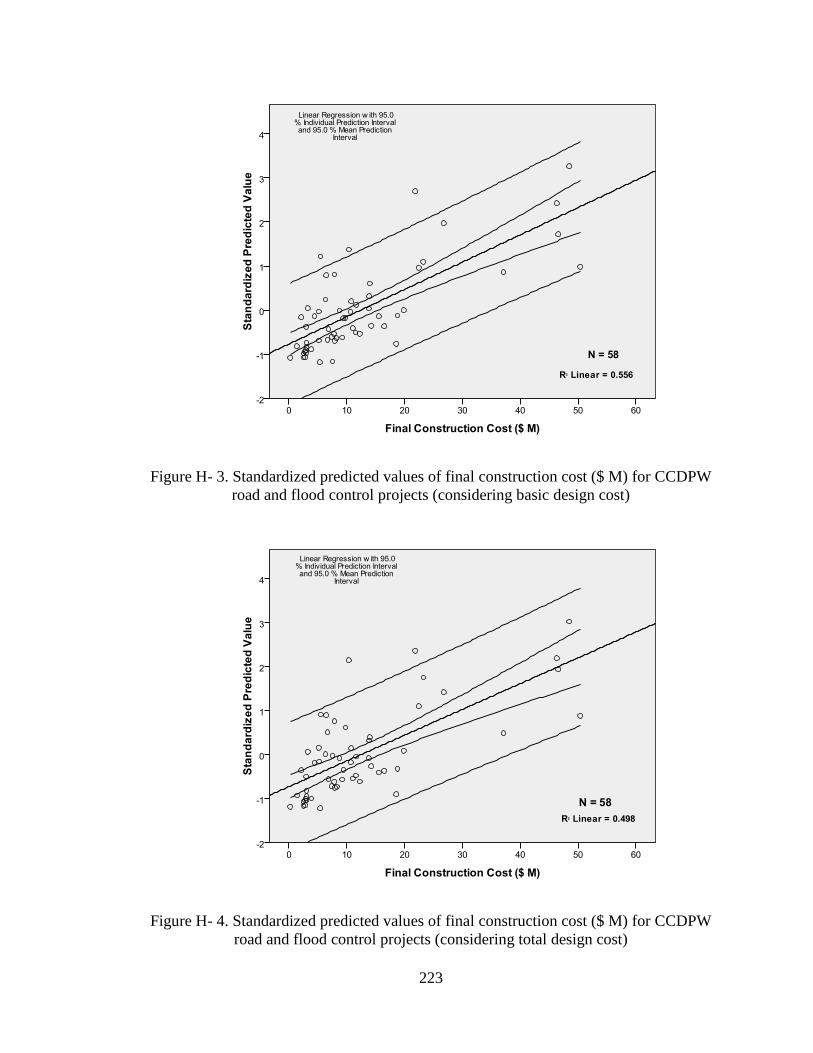
223
Figure H- 3. Standardized predicted values of final construction cost ($ M) for CCDPW
road and flood control projects (considering basic design cost)
Figure H- 4. Standardized predicted values of final construction cost ($ M) for CCDPW
road and flood control projects (considering total design cost)

224
Figure H- 5. Standardized predicted values of final construction cost ($ M) for CCDPW
and TXDOT road (considering basic design Cost)
225
APPENDIX I
RESIDUAL PLOT FOR YEARLY TIME SERIES MODEL
Figure I- 1. Residual plot for yearly design contract for CCDPW road projects ......... 226
Figure I- 2. Residual plot for yearly NTP for CCDPW road projects ......................... 226
Figure I- 3. Residual plot for yearly construction completion for CCDPW
road projects .............................................................................................. 227

226
Figure I- 1. Residual plot for yearly design contract for CCDPW road projects
Figure I- 2. Residual plot for yearly NTP for CCDPW road projects

227
Figure I- 3. Residual plot for yearly construction completion for CCDPW road projects

228
BIBLIOGRAPHY
Ahsan, K. and Gunawan, I. (2010). ―Analysis of cost and schedule performance of
international development projects.‖ International Journal of Project Management, 28,
68-78.
Al-Momani, A. H., (2000). ―Construction delay: a quantitative analysis.‖ International
Journal of Project Management, 18, 51-59.
Andi, Minato, T., (2003). ―Design documents quality in the Japanese construction
industry: Factors Influencing and Impacts on Construction Process.‖, 21, 537-546.
ASCE. Manuals and reports on engineering practice – No. 45, (2003). Consulting
engineering – A guide for the engagement of engineering services, New York.
Bubshait, A. A. (1998). ―Design fees versus design deficiency.‖ J. Arch. Eng., 4 (5), 44-
46.
Burati, J. L., Farrington, J. J., and Ledbetter, W. B. (1992). ―Causes of quality deviations
in design and construction.‖ J. Constr. Eng. Manage.,118 (34), 34-49.
Burns, L.A. (2008). ―Analyzing cost and schedule growth in public works projects.‖ MS
thesis, Univ. of Nevada Las Vegas, Las Vegas, NV.
Carr, P.G. (2005). ―Investigation of bid price competition measured through prebid
project estimates, actual bid prices, and number of bidders.‖ J. Constr. Eng. Manage., 131
(11), 1165-1172.
Carr, P. G. and Beyor, P. S. (2005). ―Design fees, the state of the profession, and the time
for corrective action.‖ J. Manage. Eng., 21 (3), 110-117.

229
CEO Snapshot: A/E fees and pricing survey. 23rd Edition, PSMJ Inc.
<www.psmj.com/documents/surveys/2008/fees/FEE08CEOSnapv1.pdf>. (June, 2010).
Chua, D.K.H. and Li, D. (2000). ―Key factors in bid reasoning model.‖ J. Constr. Eng.
Manage., 126 (5), 349-357.
Devore, J.L. (1999). ―Probability and statistics for engineering and the sciences.‖ 5th
Ed.,
Duxbury, Pacific Grove, CA.
General Contracting Cost Book, Engineering News Record Cost Data, (2010). Design
and Construction Resources, McGraw Hill Construction, USA, 2010.
Gransberg, D. D., Puerto, C. L., and Humphrey, C. (2007). ―Relating cost growth from
the initial estimate to design fee for transportation projects.‖ J. Constr. Eng. Manage., 133
(6), 404-408.
Hale, D.R., Shrestha, P. P., Gibson, G.E., and Migliaccio, G. C. (2009). ―An empirical
comparison of design-build and design-bid-build project delivery methods for building
projects.‖ J. Constr. Eng, Manage., 135 (7), 579-587.
Hsieh, T.Y., Lu, S.T., Wu., C.H., (2004). ―Statistical analysis of causes for change orders
in metropolitan public works.‖ International Journal of Project Management, 22, 679-
686.
Jahren, C. T. and Ashe, A. M. (1990). Predictors of cost-overrun rates. J. Constr. Eng.
Manage., 116 (3), 548-552.
Knight, K. and Fayek, R.. (1999). A preliminary study of the factors affecting the cost
escalation of construction projects. Can. J. Civil Eng., 27, 73-83.

230
Konchar, Mark, and Sanvido, V. (1998). Comparison of U.S. project delivery systems, J.
Constr. Eng. Manage., 124 (6), 435-444.
Kuprenas, J. A. (2003). ―Project management actions to improve design phase cost
performance.‖ J. Manage. Eng., 19 (1), 25-32.
Li, S., Foulger, J.R., and Philips, P. W. (2008). ―Analysis of the impacts of the number of
bidders upon bid values: implications for contractor prequalification and project timing
and bundling.‖ J. Public Works Manage. & Policy, 12, 503-514.
Ling, F.Y.Y., Chan, S.L., Chong, E., and Ee, L.P. (2004). ―Predicting performance of
design-build and design-bid-build projets.‖ J. Constr. Eng. Manage., 130 (1), 75-83.
Menxenhall, W. and Sincich, T. (2007). Statistics for engineering and the sciences, 5th
Ed. Prentice Hall Inc., New Jersey.
Migliaccio, G.C. and Shrestha, P.P. (2009). ―Analysis of design-build procurement
activities durations for highway projects.‖ Proceedings of the 2009 ASCE Construction
Research Congress, ASCE.
Newton, A. L. and Christian, J. (2006). ―Impact of quality on building costs.‖ J. Infrastr.
Systems, 12 (4), 199-206.
Odeck, J., (2004). ―Cost growth in road construction—what are their sizes and
determinants?‖ J. Trans. Policy, 11 (1), 43-53.
Shrestha, P. P., Migliaccio, G. C., Gibson, G. E., and O’Connor, J. T. (2007).
―Benchmarking of large design-build highway projects: one-to-one comparison and
comparison with design-bid-build projects.‖ J. Trans. Res. Board, No.1994,
Transportation Board of the National Academies, Washington D.C., 17-25.

231
Shrestha, P. P. and Shields, D. R.(2009). ―Effect of design cost on highway construction
project performance.‖ Proceedings of 1st International Conference on Transportation
Construction Management, CD-ROM, Orlando, Florida, February 9-12.
Wu, C.H., Hsieh, T.Y., Cheng, W.L., (2004). ―Statistical analysis of causes for design
change in highway construction on Taiwan.‖ International Journal of Project
Management, 23, 554-563.

232
VITA
Graduate College
University of Nevada, Las Vegas
Nirajan Mani
Degrees:
Bachelor’s Degree in Civil Engineering, 2006
Tribhuvan University, Nepal
Special Honors and Awards:
―Jerry P. King Construction Management Scholarship‖ University of Nevada, Las
Vegas (2010 and 2011)
―Graduate Access Scholarship‖ University of Nevada, Las Vegas (2011)
Publications:
Shrestha, P.P. and Mani, N., Impact of Design Cost on Construction Project
Performance of Design Bid Build Projects, paper submitted to 2011 ASCE
Construction Research Congress (CRC), Ottawa, Canada, June, 2011.
Shrestha, P.P. and Mani, N., Impact of Mathematics and Physics Grade Point
Average on Construction Management Undergraduate Students’ Overall Grade, paper
submitted to 4th
International Multi-Conference on Engineering and Technological
Innovation, Orlando, Florida, July, 2011.
Thesis Title: Impact of Design Cost on Project Performance of Design Bid Build Projects
Thesis Examination Committee:
Chairperson, Pramen P. Shrestha, Ph.D., P.E.
Committee Member, David R. Shields, Ph.D., P.E.
Committee Member, Neil D. Opfer, MBA.
Graduate Faculty Representative, Nancy N. Menzel, Ph.D.