Embed Size (px)
Citation preview

Impact of dams on Yangtze River sediment supply to the sea and delta
intertidal wetland response
S. L. Yang and J. ZhangState Key Laboratory of Estuarine and Coastal Research, East China Normal University, Shanghai, China
J. Zhu and J. P. SmithEnvironmental, Earth, and Ocean Sciences Department, University of Massachusetts, Boston, Massachusetts, USA
S. B. Dai,1 A. Gao, and P. LiState Key Laboratory of Estuarine and Coastal Research, East China Normal University, Shanghai, China
Received 7 December 2004; revised 22 April 2005; accepted 4 May 2005; published 16 August 2005.
[1] On the basis of estimates of sediment accumulation in reservoirs, the impact of50,000 dams on sediment supply and intertidal wetland response in the Yangtze Rivercatchment is examined. The total storage capacity of reservoirs is 200 � 109 m3, or 22%of the Yangtze annual runoff. The sediment accumulation rate in reservoirs has increasedfrom �0 in 1950 to >850 � 106 t/yr in 2003. Although sediment yield has increasedwith broader soil erosion in the river basin, the total riverine sediment discharge rateshows a strong decreasing trend from the late 1960s to 2003, likely due to damconstruction. Consequently, the total growth rate of intertidal wetlands at the delta fronthas decreased dramatically. A significant relationship exists between intertidal wetlandgrowth rate and riverine sediment supply that suggests riverine sediment supply is agoverning factor in the interannual to interdecadal evolution of delta wetlands. Regressionanalysis of intertidal wetland growth rate and sediment supply shows that intertidalwetlands at the delta front degrades when the riverine sediment discharge rate reaches athreshold level of <263 � 106 t/yr. Owing to the construction of the Three Gorges Damand other new dams, the sediment discharge rate of the Yangtze River will most likelydecrease to below 150 � 106 t/yr in the coming decades. Therefore unless currentmanagement policies are adjusted, drastic recession of Yangtze River delta intertidalwetlands can be expected to occur.
Citation: Yang, S. L., J. Zhang, J. Zhu, J. P. Smith, S. B. Dai, A. Gao, and P. Li (2005), Impact of dams on Yangtze River sediment
supply to the sea and delta intertidal wetland response, J. Geophys. Res., 110, F03006, doi:10.1029/2004JF000271.
1. Introduction
[2] Many deltas worldwide are retreating due to decreasesin sediment supply from river [Trenhaile, 1997]. TheColorado River in the USA once supplied more than 150 �106 t/yr of sediment to theGulf of California. River diversionsand sediment trapping by dams have prevented a great portionof sediment from reaching the Colorado Delta, which hasresulted in coastal recession [Carriquiry et al., 2001]. Sedi-ment discharge from the Nile River in Egypt was oncebetween 100 and 124 � 106 t/yr. At present, almost no netannual sediment load is delivered to the Nile delta due to theconstruction of dams, especially the Aswan High Dam thatwas put into operation in 1964 [Stanley and Warne, 1998;Frihy et al., 2003]. Accordingly, recession of the promonto-
ries formed at the mouths of two active tributaries of the Nilehas been very rapid [Fanos, 1995; Wiegel, 1996]. After theconstruction of the Ribarroja-Mequinenza dam complex innorthern Spain, about 96% of Ebro River sediment wastrapped in the reservoir and the progradation of the delta asa whole ceased [Sanchez-Arcilla et al., 1998]. The YellowRiver (Huanghe) in China, once the world’s largest insediment discharge [Milliman and Meade, 1983], is nowproviding less than 100 � 106 t/yr of sediment to the seadue to dam construction and water withdrawals. TheYellow River delta as a whole is degrading [Yang etal., 2004].[3] The progradation/recession of intertidal wetlands at
the delta front is usually a representative of delta evolution.Intertidal wetlands are important ecosystems that providenursery habitats for fish, dissipate water energy, filter con-taminants, provide resting areas for migratory birds, supportbiodiversity, offer opportunities for recreation, hunting, andfishing, and provide intrinsic values such as aesthetics andeducation [Goodwin et al., 2001]. The Yangtze delta inter-tidal wetlands have been listed as one of the world’s
JOURNAL OF GEOPHYSICAL RESEARCH, VOL. 110, F03006, doi:10.1029/2004JF000271, 2005
1Also at Geography Department, Chuzhou University, Chuzhou City,China.
Copyright 2005 by the American Geophysical Union.0148-0227/05/2004JF000271$09.00
F03006 1 of 12

important wetland ecosystems [Lu, 1997; Wang and Qian,1988; Maff et al., 2000; State Forestry Administration,2000; Zhao et al., 2003]. Two intertidal wetlands, easternChongming and Jiuduansha (Figure 1), have been desig-nated as natural reserves by the Chinese government.[4] The rapid progradation of the Yangtze delta has made
it possible for Shanghai, currently the largest city in China,to pursue a policy of reclaiming land from intertidal wet-lands. Nearly 2/3 of the Shanghai land area was obtained inthis way during the last 2000 years, with 1/5 of it obtainedin the last half century [Yang, 1999]. Shanghai plans tofurther reclaim 767 km2 of intertidal wetlands in this and thecoming decade [SCWAPDI et al., 2002]. This is more thanthe current total area of intertidal wetlands. This plan isbased upon an assumption that the intertidal wetlands willcontinue to prograde at a high rate. Understanding andpredicting the evolutionary trend of intertidal wetlands istherefore critical in appraising the rationality of currentgovernment policies. Although a preliminary study showsthat the progradation of the subaqueous delta has greatlyreduced in response to the decrease in riverine sedimentsupply [Yang et al., 2003], there has been little research onthe response of the intertidal wetlands.[5] This study examines the influence of catchment dams
on Yangtze River sediment supply and on the delta advance-ment. Intertidal wetlands at the delta front (Figure 1) cover-ing a total area of 411 km2 were selected to study delta
response. Documented sediment accumulation rates,recorded riverine sediment transport data, and measuredchanges in delta intertidal wetland coverage are used to(1) calculate the amount of sediment trapped in reservoirs,(2) examine the influence of dam trapping on riverinesediment load, (3) establish a statistical relationship betweenriverine sediment discharge and growth rate of intertidalwetlands at the delta front, (4) evaluate the thresholds ofriverine sediment discharge with regard to the stability ofintertidal wetlands, and (5) predict the trend in riverinesediment supply and delta wetland evolution in the comingdecades in relation to the Three Gorges Dam (TGD) andother new dams.
2. Physical Setting
[6] The Yangtze River is one of the largest rivers in theworld. It originates on the Qinghai-Tibet Plateau at 5100 melevation and extends 6300 km eastward to the East ChinaSea [Chen and Li, 1979]. The catchment covers a total area of1,808,500 km2 and, at present, is home to a population ofmore than 400 million. The upper reaches of the river end atYichang, 30 km downstream of TGD, in Hubei Province,China. Along the middle and lower reaches of the river, manylakes connect to the main stream. Lake Dongting, one of thelargest freshwater lakes in China, plays an important role inregulating the riverine sediment load [Yang et al., 2003].
Figure 1. Yangtze River mouth. The study area is the region of intertidal wetlands east of the referenceline and is divided into four sectors.
F03006 YANG ET AL.: YANGTZE RIVER SEDIMENT SUPPLY TO THE SEA
2 of 12
F03006

[7] During the dry season, the tidal effects reach 640 kmupriver to Datong, which is located downstream of 94% ofthe catchment area. Datong is the location of a majorgauging station for riverine water and sediment flux mea-surements (Figure 2). Upstream of Datong, the river can beexpected not to be influenced by tides. Downstream ofDatong, however, the river level fluctuates in response totides. The range of fluctuations increases from Datong to thedelta front. In the first 400 km downstream of Datong,although the flow speed tidally varies, the flow direction isalways seaward and the water is always fresh. Furtherdownstream, both the flow speed and the flow directiontidally vary [Chen et al., 1988a, 1988b].[8] The Yangtze River mouth below Xuliujing is bifur-
cated, with a width of 90 km at the outer limit (Figure 1).Since the 1950s, nearly all riverine discharge has flowed viathe South Branch system [Chen et al., 1985]. As a result,outlets of the Southern Branch are the major depocenters forYangtze River sediment. Mean and maximum tidal rangesare 2.7 m and >5.0 m, respectively. Wave activity isgenerally moderate, with a mean wave height of 1.0 m atthe outer mouth [Yang, 1999]. The inner continental shelf onwhich the delta is built is less than a 1% gradient. Long-shore currents off the estuary carry a great quantity ofriverine sediment southward to the Zhejiang Province coastin winter and northward to the Jiangsu Province coast insummer [Yang et al., 2000] (Figure 2). During the past2000–3000 years, the delta coastline has progradated at arate of 10–20 m/yr, and intertidal wetlands as a whole havegrown at a rate of about 5 km2/yr [Yang et al., 2001a].Deltaic progradation rate has accelerated in recent centuries(Figure 3) probably because of intensification of deforesta-tion in the catchment area and the resultant increase inriverine sediment supply to the sea.[9] In this study, ‘‘delta front’’ means the portion of the
delta exposed to the East China Sea. Intertidal wetlands atthe delta front are several kilometers in width under normalnatural conditions, but their actual width depends on inten-
sity of reclamation. The lower portion of local intertidalwetlands is permanently bare whereas the higher portion iscovered by Scirpus and reeds during their growing seasons[Yang, 1998].
3. Materials and Methods
[10] Data on soil erosion rates, sediment yield, sedimentdeposition in reservoirs, lakes, and channels, and riverinewater and sediment discharge were collected from theinstitutions of Yangtze RiverWater Conservancy Committee.This data set was used to examine the impact of dam trappingon sediment supply to the sea. Delta bathymetric maps from1971 to 1998 were collected to examine temporal variationsin the growth rate of intertidal wetlands. These maps weresurveyed by the China Maritime Survey Bureau using depthsounding (inner space 449 thermal depth sounder recorderwith frequency of 23.5 kHz). The accuracy of the surveyswas 0.1 m. The map scale is 1:120,000, with a contourinterval of 1 m. Since 1999, several large-scale engineeringprojects have been carried out in the study area that likelyinterfere with the response of intertidal wetlands to riverinesediment supply [Du et al., 2005]. In order to filter out theinfluences of these structures, only bathymetric maps before1999 were utilized to examine intertidal wetland growthrates. On these maps, the theoretically lowest tidal lines(0 m contours which are about 2 m below the mean sealevel) on eastern Chongming, eastern Hengsha, Jiuduanshaand eastern Nanhui were shown, but elevation datawas absent for most of the intertidal areas due to logisticproblems. Variation in the 0 m contour line reflects netprogradation/recession of the intertidal wetlands.[11] In the study area, the movement of the 0 m contour is
typically variable due to the complexity of local hydrody-namics and geomorphology as well as to sediment supplyand deposition. The 0 m contour advances in some areaswhile it retreats in others (Figure 4). Therefore temporalvariation in the 0 m contour line (m/yr) alone is an
Figure 2. Yangtze River basin showing the distribution of large reservoirs (>108 m3 in storage capacity)and hydrographical gauging stations at Yichang and Datong.
F03006 YANG ET AL.: YANGTZE RIVER SEDIMENT SUPPLY TO THE SEA
3 of 12
F03006

ineffective means of quantifying the rate of shorelinemovement. The growth rate of intertidal wetlands wasthereby estimated by calculating the change in total wetlandarea over time expressed in units of km2/yr. In large deltassuch as the Yellow River delta and the Yangtze River delta,this method is easier and more accurate than the calculationof progradation rate in unit of m/yr [Xu, 2003].[12] Bathymetric maps of four intertidal wetlands (eastern
Chongming, eastern Hengsha, Jiuduansha and easternNanhui) (Figure 1) over different periods (1971, 1975,1979, 1983, 1987, 1991, 1995 and 1998) were scanned intojpeg format. These images were digitized using MapInfosoftware in order to allow for the calculation of intertidalwetland area.
[13] On Jiuduansha and eastern Hengsha, the intertidalwetland is encircled by the 0 m contour, and the temporalchange in intertidal area reflects progradation or recession.On eastern Chongming and eastern Nanhui, however, theintertidal wetland exists between the 0 m contour and theseawall. Because parts of these intertidal wetlands werereclaimed between 1971 and 1998, the temporal change inintertidal area reflects both progradation/recession and rec-lamation. In order to filter the interference of reclamation, areference line (the 121�500E longitude) was introduced. Thereference line was located on the landside of the seawall in1971 and was not influenced by reclamation that occurredbetween 1971 and 1998. Because the reference line wasstatic, the temporal change in area between the 0 m contourand the reference line reflects the shift of the 0 m contour orprogradation or recession.[14] Change in area was estimated between each set of
measurements taken in 1971, 1975, 1979, 1983, 1987, 1991,1995 and 1998. For example, the area of eastern Chongmingintertidal wetland in 1971 was subtracted from that in 1975to give a difference of 44.4 km2. This suggests that theintertidal wetland grew by 44.4 km2 from 1971 to 1975, witha growth rate of 11.1 km2/yr (Table 1). The total growth rateshown in Table 1 is the sum of the rates in the four sectors.[15] Area was calculated using MapInfo software by
fitting a series of polygons to a given area then summingthe areas of the polygons to calculate total area. In order toestimate the error associated with polygon method, a 15 cmdiameter circle with an area of 176.7 cm2 was used. Thecircle was approximated as a polygon whose sides intersectthe arc of the circle and are equally parted by the point ofintersection. In this way, the area of the polygon can becompared to the actual area of the circle to estimate the errorassociated with the software (polygon) method. The area ofthe polygon was measured between 176 and 178 cm2, anerror of <1%. Therefore the software based polygon methodwas taken as a suitable approach for calculating the area ofintertidal wetlands.[16] Regression analysis was performed using Microsoft
Excel and SPSS 12.0 software. The 3 year running averagewas an average of the previous year, the current year and thenext year.
4. Results and Discussion
4.1. Dam Constructions in the River Basin
[17] Since 1950, many dams have been constructed in theYangtze River catchment. The total storage capacity ofreservoirs in the upper reaches of the river in 1950 was
Figure 3. Advancement of coastline (seawall) on theeastern Chongming Island (the data source for the coastlinesfrom the 1700s to the 1960s is Chen [1988], and the datasource for the coastlines from the 1970s to 2001 is personalfield surveys using GPS).
Figure 4. Shift of the 0 m contour (theoretically lowesttidal line) on Jiuduansha intertidal wetland (data sources arebathymetric maps from the China Maritime Survey Bureau).
Table 1. Growth Rates on the Intertidal Wetlands at the Delta
Front of Yangtze Rivera
PeriodEastern
ChongmingEasternHengsha Jiuduansha
EasternNanhui Total
1971–1975 11.1 1.1 1.4 �1.8 11.81975–1979 8.8 0.8 2.2 �1 10.81979–1983 6.6 0.5 2.4 �0.3 9.21983–1987 4.5 0.4 2.7 0.5 8.11987–1991 1.9 0.2 2.9 1.2 6.21991–1995 �0.5 0 3.1 2 4.61995–1998 �2.5 �0.1 3.3 2.6 3.3Totals, km2 122.1 11.7 70.7 10.2 215
aRates are in km2/yr.
F03006 YANG ET AL.: YANGTZE RIVER SEDIMENT SUPPLY TO THE SEA
4 of 12
F03006

only 0.06 � 109 m3. By 1990 it had increased to 23 �109 m3 due to dam construction (Figure 5). By 1995,45,628 dams had been constructed in the river basin witha total storage capacity of 142 � 109 m3. Sixty-four percentof this capacity was attributed to 119 large-scale reservoirs(>0.1 � 109 m3 storage capacity) [CCYRA, 1999]. By theend of 2002, 143 large-scale reservoirs had been constructed(Figure 2) with a total storage capacity of 115 � 109 m3
[CCYRA, 2003]. This represents a 26.5% increase from1995 to 2002. In this period, seven other large reservoirswere also in construction [CCYRA, 2003], including TGD.The number of dams in the watersheds is about 50,000 atpresent. According to the storage capacity ratio of large-scale reservoirs to total number of reservoirs in 1995, thetotal storage capacity of reservoirs in the Yangtze catchmentreached about 180 � 109 m3 by the end of 2002. The TGDreservoir began to impound water in June of 2003. By theend of 2003, the associated TGD reservoir water level roseto 140 m above sea level. When the dam construction isfinished in 2009, the reservoir water level will be at 175 mabove sea level. The storage capacity of TGD Reservoir isexpected to be 17.15 � 109, 22.8 � 109 and 39.3 � 109 m3
when the water level is at 145, 155, and 175 m above sealevel, respectively (Society of Water Conservancy of China,unpublished data, 2001).[18] The relationship between the data on storage capac-
ity and water level of reservoir shown above yields a storagecapacity of 14.63 � 109 m3 at 140 m above sea level.Taking into account other dams constructed after 2002, thecumulative storage capacity of reservoirs in the catchment is200 � 109 m3 at present. This represents about 22% of theannual water discharge from Yangtze River to the sea. Thisstorage to discharge ratio exceeds the world average of 20%(available at http://www.seaweb.org/background/book/dams.html). According to CCYRA [2002], 95% of the totalstorage capacity is derived from reservoirs that are locatedin the drainage area upstream of Datong.
4.2. Deposition in Reservoirs
[19] Dams efficiently trap riverine sediment. Trappingefficiency of reservoirs can be expressed as the impoundedratio of sediment (IRS), or the percent of sediment deposited
in a given reservoir versus the total sediment input to thereservoir. With regard to TGD, 124 � 106 t, or 60%, of thetotal sediment load from upstream, was deposited in the TGDreservoir from June to December 2003 (available at http://www.irtces.org/nishagb_2003.asp).[20] The Danjiangkou Reservoir in Hanjiang River, a
tributary in the middle reaches of Yangtze, was built in1959. It was the largest reservoir in terms of storagecapacity on the river catchment before TGD. From 1960to 1994, 1.41 � 109 m3 of sediment was deposited in theDanjiangkou Reservoir (available at http://www.irtces.org/nishagb_2000.asp). Using a dry bulk density of 1.29 g/cm3
for the riverine sediment [Zhu, 2000], the total dry weight ofsediment deposited was 1.81 � 109 t. Most of the depositionoccurred after 1968 when the reservoir began to impoundwater (available at http://www.irtces.org/nishagb_2001.asp).The budget of sediment entering the reservoir, deposited inthe reservoir and transported out of the reservoir shows thatmore than 90% of the sediment entering the reservoir wastrapped in the reservoir. In spite of the fluctuations ofsediment input and deposition, the impounded ratio ofsediment (IRS) was stable (Figure 6).[21] Significant sediment deposition has also occurred in
many other reservoirs. In the upper reaches of Yangtze, theexamples include the Wujiangdu, Gongzui, Bikou, Gez-houba reservoirs and reservoirs on the Jialingjiang andJinshajiang rivers (Figure 2; Table 2). Wang and Peng[1999] measured sediment deposition in 17 reservoirs alongthe middle and lower reaches of the river to estimate acumulative storage capacity of 2.66 � 109 m3 and acumulative deposition rate of 3.69 � 106 m3/yr (4.76 �106 t/yr assuming a dry bulk density of 1.29 g/cm3).[22] Deposition in reservoirs is more rapid in the upper
reaches of the river than in the middle and lower reaches.For example, the Three Gorges, Wujiangdu, Gongzui,Bikou, Gezhouba reservoirs and the reservoirs on theJialingjiang and Jinshajiang rivers have a cumulative storagecapacity of 26.5 � 109 m3 and a cumulative deposition rateof 309 � 106 t/yr (Table 2). This yields 11.7 kg/yr ofsediment deposited per unit storage capacity. The Danjiang-
Figure 5. Total storage capacity and deposition rate inreservoirs in the upper reaches of the Yangtze River(data source is the Yangtze River Water ConservancyCommittee).
Figure 6. Annual sediment deposition and impoundedratio of sediment (IRS) in the Danjiangkou Reservoir. IRSis the ratio of amount of sediment impounded by thereservoir to the total amount of sediment entering thereservoir (data source is the Yangtze River Water Con-servancy Committee).
F03006 YANG ET AL.: YANGTZE RIVER SEDIMENT SUPPLY TO THE SEA
5 of 12
F03006

kou reservoir (Table 1) and the 17 reservoirs studied byWang and Peng [1999] in the middle and lower reaches, onthe other hand, have a combined storage capacity of 20.1 �109 m3 and a combined deposition rate of 76.5 � 106 t/yr,yielding 3.81 kg/yr of sediment deposited per unit storagecapacity. This difference can probably be attributed tothe spatial variation in suspended sediment concentration(SSC).[23] During the 1950s, when SSC in the Yangtze River
was not significantly influenced by reservoirs, the meanSSC was 1.22 kg/m3 in the upper reaches of Yangtze(Yichang Station) and 0.278 kg/m3 in the tributaries of themiddle and lower reaches of Yangtze. These values arebased on water and sediment discharges at Yichang andDatong stations and the amount of sediment deposited in themiddle and lower reaches of Yangtze. The combined storagecapacity of reservoirs shown in Table 2 and mentioned byWang and Peng [1999] is 46.6 � 109 m3, accounting foronly 23.3% of the present 200 � 109 m3 total storagecapacity of the Yangtze basin. The combined deposition ratein the reservoirs listed in Table 2 and mentioned by Wangand Peng [1999] is 390 � 106 t/yr.[24] If the total deposition rate in reservoirs throughout
the catchment was proportional to the total reservoir storagecapacity shown above, the total deposition rate would be1.67 � 109 t/yr. However, one must account for the fact thatriverine sediment is derived mainly from the upper reachesof the river and reservoir sediment deposition rates shouldnot maintain a consistent ratio to reservoir storage capacityas one moves downstream. More than 45 � 103 additionalreservoirs accounting for more than 153 � 109 m3 in storagecapacity have been constructed in the tributaries of themiddleand lower reaches of Yangtze and remain largely unstudied[Zhu, 2000; CCYRA, 1993, 1994, 1995, 1997, 1998, 1999,2000, 2001, 2002, 2003]. If all the additional unstudiedreservoirs were located in the tributaries of the middle andlower reaches of the river with a combined deposition rateproportional to that of the similar studied reservoirs in thetributaries in the same areas (the Danjiangkou Reservoir andthe 17 reservoirs mentioned byWang and Peng [1999]), then
the total deposition rate would be 390 � 106 t/yr + 584 �106 t/yr = 974 � 106 t/yr. This estimate is significantlylower than the deposition rate estimated by assuming aconstant ratio of sediment deposition to reservoir storagecapacity throughout the catchment.[25] This estimate may still be inaccurate because (1) the
distribution of unstudied reservoirs in the upper reaches,although fewer in number and lower in capacity than in themiddle and lower reaches (Figure 2) [Zhu, 2000; CCYRA,1993, 1994, 1995, 1997, 1998, 1999, 2000, 2001, 2002,2003], is not taken into account and (2) the deposition ratesin reservoir complexes may be lower than the sum of thedeposition rates in the same reservoirs treated as a series ofsingle reservoirs. For example, in recent years, the deposi-tion rate in Danjiangkou Reservoirs was reduced becausenew dams were constructed upstream of the DanjiangkouDam (available at http://www.irtces.org/nishagb_2002.asp).[26] The sediment trapping efficiency of dams in the
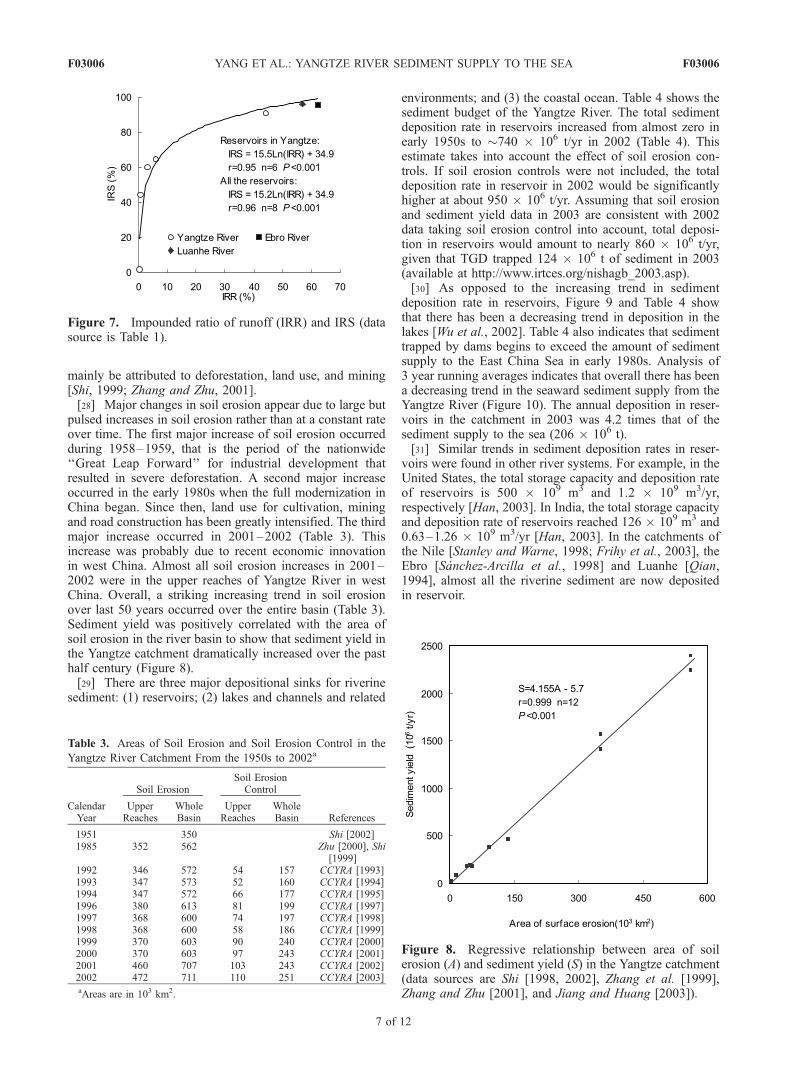
Yangtze catchment depends not only on the storage capacityof reservoirs, but also the ratio of storage capacity to runoff.For reservoirs listed in Table 2, the impounded ratio ofsediment (IRS) is logarithmically related to the impoundedratio of runoff (IRR), the ratio of water storage to annualdischarge (Figure 7). The higher the IRR, the longer theresidence time, and the more the suspended particles settle.The relationship of IRR to IRS in Panjiakou Reservoir inthe Luanhe River, a river in north China (Table 2), isconsistent with the relationship shown in Figure 7. Further-more, IRR to IRS data from the Ebro river system innorthern Spain (Table 2) suggests that this logarithmicrelationship may hold true in other river systems when theratio of drainage area regulated by reservoirs (RDARR) isnear 100%.[27] The total deposition rate in reservoirs in the Yangtze
catchment increased with total storage capacity and sedi-ment yield. The area of soil erosion in the river basinincreased from 350 km2 in the early 1950s to 711 km2 in2002 (Table 3). The population in the river basin alsoincreased from 178 million to more than 400 million[Zhang, 2000]. Soil erosion in the Yangtze catchment can
Table 2. Deposition in Reservoir(s) in the Yangtze River in Comparison to Other Reservoirs
Reservoir(s) River Capacity, 109 m3 IRR,a % DR,b 106 t/yr IRS,c % RDARR,d % Period
Three Gorges Yangtze 13.55e 3.19 134.4f 60.0 100 Jun–Dec 2003Danjiangkou Hanjiangg 17.45 44.3 71.7 90.8 100 1968–1994Gezhouba Yangtze 1.58 0.36 8.3 1.68 100 1981–2000Gongzui Daduheg 0.32 0.72 13.3 44.3 100 1967–1987Wujiangdu Wujiangg 2.15 14.53 72.8 1979–1998Bikou Bailongjiangg 0.52 6.01 16.6 64.6 100 1975–1996Reservoirs Jialinjiangg 5.58 7.95 46 32.9 26 1996Reservoirs Jinshajiangg 2.81 1.85 17.4 7.08 3.1 1996Panjiakou Luanhe 2.93 62.1 21.2 95.4 100 1980–1988h
Reservoirs Ebro 7.7 57 144 96 96 1916–2000i
aImpounded ratio of runoff (the ratio of capacity to annual runoff flowing through the reservoir).bDeposition rate.cImpounded ratio of sediment (the ratio of sediments impounded by reservoir to the sediment entering the reservoir).dRatio of drainage area regulated by reservoir(s). For single reservoirs, it is 100%. For reservoirs in a river system, it is the ratio of the accumulative area
regulated the reservoirs to the total river drainage basin area.eThe average of capacities at 135 and 140 m above sea level.fOf the 134.4 � 106 t/yr deposition, 124 � 106 t/yr deposition was observed from June through December, and the rest was simulated according to the
IRS from June through December.gTributary in Yangtze River system.hFrom Qian [1994].iFrom Batalla et al. [2004].
F03006 YANG ET AL.: YANGTZE RIVER SEDIMENT SUPPLY TO THE SEA
6 of 12
F03006
mainly be attributed to deforestation, land use, and mining[Shi, 1999; Zhang and Zhu, 2001].[28] Major changes in soil erosion appear due to large but
pulsed increases in soil erosion rather than at a constant rateover time. The first major increase of soil erosion occurredduring 1958–1959, that is the period of the nationwide‘‘Great Leap Forward’’ for industrial development thatresulted in severe deforestation. A second major increaseoccurred in the early 1980s when the full modernization inChina began. Since then, land use for cultivation, miningand road construction has been greatly intensified. The thirdmajor increase occurred in 2001–2002 (Table 3). Thisincrease was probably due to recent economic innovationin west China. Almost all soil erosion increases in 2001–2002 were in the upper reaches of Yangtze River in westChina. Overall, a striking increasing trend in soil erosionover last 50 years occurred over the entire basin (Table 3).Sediment yield was positively correlated with the area ofsoil erosion in the river basin to show that sediment yield inthe Yangtze catchment dramatically increased over the pasthalf century (Figure 8).[29] There are three major depositional sinks for riverine
sediment: (1) reservoirs; (2) lakes and channels and related
environments; and (3) the coastal ocean. Table 4 shows thesediment budget of the Yangtze River. The total sedimentdeposition rate in reservoirs increased from almost zero inearly 1950s to �740 � 106 t/yr in 2002 (Table 4). Thisestimate takes into account the effect of soil erosion con-trols. If soil erosion controls were not included, the totaldeposition rate in reservoir in 2002 would be significantlyhigher at about 950 � 106 t/yr. Assuming that soil erosionand sediment yield data in 2003 are consistent with 2002data taking soil erosion control into account, total deposi-tion in reservoirs would amount to nearly 860 � 106 t/yr,given that TGD trapped 124 � 106 t of sediment in 2003(available at http://www.irtces.org/nishagb_2003.asp).[30] As opposed to the increasing trend in sediment
deposition rate in reservoirs, Figure 9 and Table 4 showthat there has been a decreasing trend in deposition in thelakes [Wu et al., 2002]. Table 4 also indicates that sedimenttrapped by dams begins to exceed the amount of sedimentsupply to the East China Sea in early 1980s. Analysis of3 year running averages indicates that overall there has beena decreasing trend in the seaward sediment supply from theYangtze River (Figure 10). The annual deposition in reser-voirs in the catchment in 2003 was 4.2 times that of thesediment supply to the sea (206 � 106 t).[31] Similar trends in sediment deposition rates in reser-
voirs were found in other river systems. For example, in theUnited States, the total storage capacity and deposition rateof reservoirs is 500 � 109 m3 and 1.2 � 109 m3/yr,respectively [Han, 2003]. In India, the total storage capacityand deposition rate of reservoirs reached 126 � 109 m3 and0.63–1.26 � 109 m3/yr [Han, 2003]. In the catchments ofthe Nile [Stanley and Warne, 1998; Frihy et al., 2003], theEbro [Sanchez-Arcilla et al., 1998] and Luanhe [Qian,1994], almost all the riverine sediment are now depositedin reservoir.
Figure 7. Impounded ratio of runoff (IRR) and IRS (datasource is Table 1).
Table 3. Areas of Soil Erosion and Soil Erosion Control in the
Yangtze River Catchment From the 1950s to 2002a
CalendarYear
Soil ErosionSoil ErosionControl
ReferencesUpperReaches
WholeBasin
UpperReaches
WholeBasin
1951 350 Shi [2002]1985 352 562 Zhu [2000], Shi
[1999]1992 346 572 54 157 CCYRA [1993]1993 347 573 52 160 CCYRA [1994]1994 347 572 66 177 CCYRA [1995]1996 380 613 81 199 CCYRA [1997]1997 368 600 74 197 CCYRA [1998]1998 368 600 58 186 CCYRA [1999]1999 370 603 90 240 CCYRA [2000]2000 370 603 97 243 CCYRA [2001]2001 460 707 103 243 CCYRA [2002]2002 472 711 110 251 CCYRA [2003]aAreas are in 103 km2.
Figure 8. Regressive relationship between area of soilerosion (A) and sediment yield (S) in the Yangtze catchment(data sources are Shi [1998, 2002], Zhang et al. [1999],Zhang and Zhu [2001], and Jiang and Huang [2003]).
F03006 YANG ET AL.: YANGTZE RIVER SEDIMENT SUPPLY TO THE SEA
7 of 12
F03006

4.3. Reduction in Sediment Supply to the Sea
[32] Although annual sediment load in the Yangtze Rivervaried over time, there has been a strong decreasing trend inseaward supply since the mid 1960s (Figure 10). Fluctua-tions in annual sediment discharge may be attributed to thechanges in annual precipitation and water discharge [Yang etal., 2003]. Observed annual sediment discharge decreasedfrom a maximum of 679 � 106 t/yr in 1964 to a minimumof 206 � 106 t/yr in 2003 (available at http://www.irtces.org/nishagb_2000.asp, http://www.irtces.org/nishagb_2001.asp, http://www.irtces.org/nishagb_2002.asp, http://www.irtces.org/nishagb_2003.asp), and the 3 year runningaverage sediment discharge decreased from a maximum of563 � 106 t/yr in 1965 to a minimum of 252 � 106 t/yr in2002 (Figure 10). A linear regression fit to the 3 yearrunning average sediment discharge versus time shows adecrease in sediment discharge of about 50% from 1965 to2002 (Figure 10). Major variations in sediment dischargewere in phase with the fluctuations of water discharge
(Figure 11) may be attributed to local climate changes(e.g., weather and precipitation patterns).[33] The decreasing trend in annual sediment discharge to
the sea discussed above can be attributed to increasedsediment storage in the reservoirs because, during the sameperiod: (1) annual precipitation [Wang et al., 2002] andwater discharge (Figure 11) have not shown an overalldecreasing trend; (2) annual sediment yield has increasedin parallel with soil erosion (Table 3) [Higgitt and Lu, 2001;Lu and Higgitt, 2001; Yin and Li, 2001]; and (3) depositionin lakes and channels in the river system has decreased(Figure 9; Table 4). Further evidence to support thisassertion can be found in records of sediment dischargeand water discharge. For example, from 1967 to 1969,sediment discharge decreased sharply even though waterdischarge was dramatically increased (Figure 11). This isrelated to water impoundment at the Danjiangkou reservoir,the largest reservoir before construction of TGD. From 2002
Table 4. Sediment Budget of the Yangtze River Basin
PeriodSoil Erosion,103 km2
Soil ErosionControl, 103 km2
SedimentYield, 106 t/yr
Sediment Enteringthe River, 106 t/yr
Net Depositionin Lakes and
Channels, 106 t/yrSupply to
the Sea,a 106 t/yrDeposition in
Reservoirs, 106 t/yr
1951 350 1449b 599 195c 403 <1d
1985 562 2320e 951f 108c 403 440g
2002 711 251 2427b,h 995e �17i 275 737g
aDatong Station.bBased on the regressive relationship between sediment yield and area of soil erosion in Figure 8.cMost of the net deposition occurred in Lake Dongting based on http://www.irtces.org/nishagb_2000.asp, http://www.irtces.org/nishagb_2001.asp, and
Wu et al. [2002].dBased on Figure 5 and the ratio of deposition in reservoirs of the upper reaches to the whole river basin.eBased on Shi [1998] and Zhang and Zhu [2001].fAccording to the sediment budget in 1951, the transport ratio was (195 + 403 + 1)/1449 = 0.41, where 195, 403, 1, and 1449 (106t/yr) were net
deposition in lakes and channels, sediment supply to the sea, deposition in reservoirs, and sediment yield, respectively. This ratio is near the estimate of0.3–0.5 by Shi [1999]. The amount of sediment entering into the river system was calculated by multiplying the sediment transport ratio with the sedimentyield.
gSediment entering into the river system subtracted by deposition in lakes and channels and sediment supply to the sea.hThe soil erosion control was taken into account. In the soil erosion control areas the sediment yield rate was about half as large as the soil erosion areas
[Zhang, 2004]. Thus in the calculation of sediment yield using S = 4.155A � 5.7 (Figure 8), A = Ase � 1/2Asec, where Ase is area of surface erosion and Asec
is the area of soil erosion control.iIn 2002, sediment discharges were 228 � 106 t at Yichang and 275 � 106 t at Datong, and the total sediment discharge from the tributaries between
Yichang and Datong were �30 � 106 t (http://www.irtces.org/nishagb_2002.asp), which suggests a �17 � 106 t net deposition in the lakes and channelsbetween Yichang and Datong.
Figure 9. Sediment budget for Lake Dongting from the1950s to the 1990s (data sources are Wu et al. [2002] and Liand Wang [2002]).
Figure 10. Three year running average sediment discharge(SD) at Datong Station from 1965 to 2001 (Y, number ofyears) (data source is the Yangtze River Water ConservancyCommittee).
F03006 YANG ET AL.: YANGTZE RIVER SEDIMENT SUPPLY TO THE SEA
8 of 12
F03006

to 2003, sediment discharge decreased by 25% while waterdischarge decreased by only 7%. The decrease in sedimentdischarge was mainly due to the deposition in TGD Reser-voir from June to December 2003. The overall decrease insediment discharge caused by TGD is shown by thecomparison of 3 year running average water discharge andsediment discharge from 2001 to 2002 in Figure 11.[34] Dams have also reduced the grain size of sediment
delivered to the sea. Themedian size at Datongwas 0.027mmduring 1956–1976 (based on data from the Yangtze RiverWater Conservancy Committee), 0.017 mm during 1976–2000 (available at http://www.irtces.org/nishagb_2000.asp),and 0.010 mm during 2001–2003 (based on data fromhttp://www.irtces.org/nishagb_2001.asp, http://www.irtces.org/nishagb_2002.asp, http://www.irtces.org/nishagb_2003.asp). The decrease in grain size is because reservoirsselectively trap a larger proportion of coarse-grained sedi-ments relatively to fines.
4.4. Response of Delta Intertidal Wetlands
[35] The progradation rate of intertidal wetlands in east-ern Chongming and eastern Hengsha decreased from11.1 km2/yr in 1971 to 1.9 km2/yr in 1991. Progradationchanged to recession from 1991 to 1998. In contrast, therecession of intertidal wetland in eastern Nanhui weakenedfrom 1971 to 1983 and changed to progradation from1983 to 1998. The progradation rate of intertidal wetlandin Jiuduansha increased from 1.9 km2/yr in 1971 to3.3 km2/yr in 1998 (Table 1). The trends of the fourintertidal wetlands as a whole suggest an overall southwardshift in the major depocenter (Table 1), probably due to asouthward shift in riverine water flow and sediment supplyto the sea (see Figure 1). This southward shift is part of thenatural evolution of the Yangtze mouth over the past 2000years [Chen et al., 1988a, 1988b]. According to Yun[2004], from 1971 to 1998, the flow volume of the NorthBranch decreased by 33% while the flow volume of theSouth Branch system increased by 35%. The enlargementof the South Branch system is expected to permit moreriverine water and sediment to pass.[36] In spite of the differences in growth rate trends
among the individual wetlands, the total growth rate of
these four intertidal wetlands shows an overall decreasingtrend (Table 1). Using regression techniques (SPSS 12.0software), total growth rate was found to be significantlycorrelated with riverine sediment discharge. The total growthrates during seven periods derived from Table 1, and theriverine sediment discharges during the corresponding peri-ods were based on the annual sediment discharges shown inFigure 10. The relationship between total growth rate andriverine sediment discharge is
Gr ¼ 0:0559Sd � 14:7; ð1Þ
where Gr represents total growth rate (km2/yr) of thestudied intertidal wetlands and Sd represents sedimentdischarge (106 t/yr) at Datong Station. The correlationcoefficient, r, for the above relation is 0.88, and the withdata number n = 7 and significance level P < 0.01. WhenGr = 0, equation (1) shows Sd = 263. Therefore when Sdis <263 � 106 t/yr at Datong, recession will occur on thestudied intertidal wetlands. In 2003, due to TGD, Sd was206 � 106 t/yr at the Datong Station (available at http://www.irtces.org/nishagb_2003.asp) below this thresholdvalue. This suggests that intertidal wetlands as a wholemay begin to degrade if the natural conditions at theintertidal wetlands are not interfered by engineeringprojects.[37] The loss of intertidal wetlands can be caused by
sediment erosion, and sediment compaction and subsidenceunder the load. When the riverine sediment supply isinsufficient to balance the combined rate at which themarine currents are transporting sediment away from thedelta and the rate at which the delta is sinking, wetlands willbe lost rather than gained. In this regard, the riverinesediment supply is the governing factor the evolvement ofthe deltaic wetlands.[38] Figure 12 shows a conceptual model for the intertidal
wetland response to decrease in riverine sediment supply. InFigure 12, the following are assumed: (1) the wetland isinitially growing; (2) the deposition rate decreases withriverine sediment supply; (3) the deposition rate can be +
Figure 11. Three year running average SD and waterdischarge (WD) at Datong Station from 1965 to 2003 (datasource is the Yangtze River Water Conservancy Committee).
Figure 12. A conceptual model of intertidal wetlandresponse to changes in deposition and sinking rates.
F03006 YANG ET AL.: YANGTZE RIVER SEDIMENT SUPPLY TO THE SEA
9 of 12
F03006
or � (sediment erosion); and (4) although the sinking rate(compaction rate + subsidence rate) decreases with deposi-tion rate, it decreases more slowly than deposition rate.From T1 to T2, deposition rate is higher than sinking rate,which leads to increase in intertidal wetland elevation.However, the growth of the intertidal wetland slows downwith decrease in difference between deposition rate andsinking rate. At T2, deposition rate equals sinking rate andthe intertidal wetland stops growing. From T2 to T3,deposition rate is insufficient to counteract sinking rate,which leads to decrease in elevation of the intertidalwetland. At this stage, the loss of wetland is acceleratingbecause the difference between sinking and deposition ratesis getting greater. As a result, the temporal trend of theintertidal wetland surface elevation with a steadily decreas-ing sediment deposition rate is arched.[39] The overall relationship between growth rate and
riverine sediment supply was unclear when the intertidalwetlands were studied individually. The growth rates of theintertidal wetlands at Jiuduansha and eastern Nanhuishowed increasing trends from 1971 to 1998 (Table 1).This suggests a negative relationship between growth rate(Table 1) and sediment supply (Figure 10). This relation-ship, however, does not account for the allotment of riverinesediment among the river mouth outlets and the interactionwith the coastal hydrodynamics. It has been shown thatalmost all the riverine sediment supply to the coastal oceanfrom theYangtzeRiverwas transported via the three outlets ofthe North Channel, North Passage, and South Passage be-tween the eastern Chongming, eastern Hengsha, Jiuduanshaand eastern Nanhui (Figure 1) [Yang et al., 2001b, 2003].Therefore the total growth rate of these four intertidal wet-lands in combination, rather than individually, should accountfor the distribution of riverine sediment between the threeoutlets. Overall the decreasing trend in total growth rate(Table 1) corresponds well to the decreasing trend in riverinesediment supply (Figure 10).[40] It should be noted that the relationship between
intertidal wetland growth rate and riverine sediment supply
discussed above does not include the decrease in grain sizementioned earlier and the relative allotment of fine-grainedsediments between the intertidal area, subtidal area, and thecoastal ocean. The finer sediment is expected to be morelikely to bypass the delta, making it out to deeper waterswithout trapping on the delta to aid in formation of wet-lands. A great quantity of sediment supplied by the YangtzeRiver is transported off the delta by littoral currents [Yang etal., 2000]. The influence of coastal sediment transportprocess on the growth rates of the intertidal wetlanddiscussed in this study sheds light on the significance anddirects toward an area for future research.
4.5. Significance of Changes in Riverine SedimentSupply to the Management of Delta Intertidal Wetlands
[41] Since TGD was put into operation in June 2003,strong sediment deposition in the reservoir has occurred.The IRR of the TGD reservoir (Table 1) is predicted to be8.8% at the 175 m water level in 2009. According to theregression equation for the Yangtze Rivers reservoirs shownin Figure 7, IRS at TGD will be 69% when the water levelrises to 175 m above sea level. In other words, nearly 70%of the sediment from the upper reaches of the Yangtze Riverwill be trapped by the TGD reservoir. Furthermore, accord-ing to Yangtze River Water Conservancy Committee [1999](available at http://www.irtces.org), due to the trappingeffects of other dams recently constructed up river fromTGD, sediment entering TGD has been reduced to from299 � 106 t/yr in 2001 to 224 � 106 t/yr in 2003. Severaladditional dams, with accumulative reservoir storagecapacities greater than TGD, are currently being con-structed or are planned for construction in the upper reachesof the river [Zhu, 2000]. These dams will further reduce theamount of sediment entering the TGD reservoir. In thecoming decades, due to construction of new dams [Zhu,2000] and afforestation [Yang et al., 2003] upstream ofTGD, sediment entering TGD will likely reach <200 �106 t/yr (estimate of this study). Because 70% of thesediment entering the TGD reservoir will be trapped byTGD [Yang et al., 2002], sediment flowing out of TGDwill likely be <60 � 106 t/yr.[42] Figure 13 reflects the regulative effect of the middle
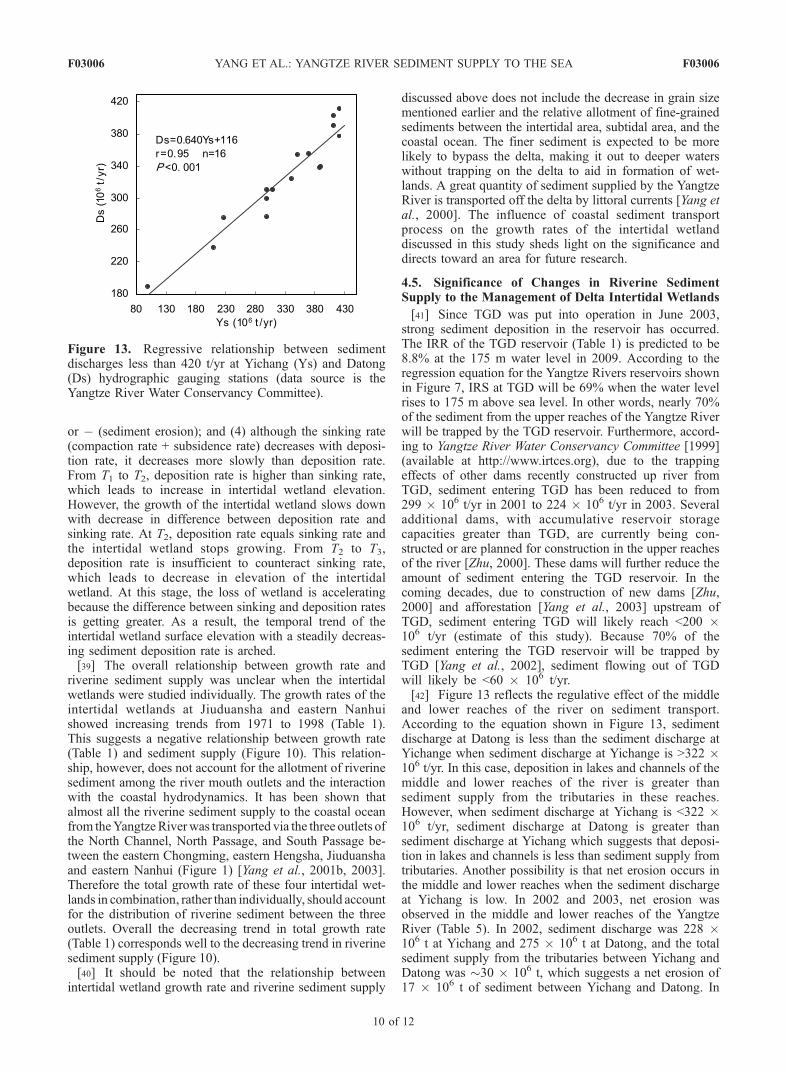
and lower reaches of the river on sediment transport.According to the equation shown in Figure 13, sedimentdischarge at Datong is less than the sediment discharge atYichange when sediment discharge at Yichange is >322 �106 t/yr. In this case, deposition in lakes and channels of themiddle and lower reaches of the river is greater thansediment supply from the tributaries in these reaches.However, when sediment discharge at Yichang is <322 �106 t/yr, sediment discharge at Datong is greater thansediment discharge at Yichang which suggests that deposi-tion in lakes and channels is less than sediment supply fromtributaries. Another possibility is that net erosion occurs inthe middle and lower reaches when the sediment dischargeat Yichang is low. In 2002 and 2003, net erosion wasobserved in the middle and lower reaches of the YangtzeRiver (Table 5). In 2002, sediment discharge was 228 �106 t at Yichang and 275 � 106 t at Datong, and the totalsediment supply from the tributaries between Yichang andDatong was �30 � 106 t, which suggests a net erosion of17 � 106 t of sediment between Yichang and Datong. In
Figure 13. Regressive relationship between sedimentdischarges less than 420 t/yr at Yichang (Ys) and Datong(Ds) hydrographic gauging stations (data source is theYangtze River Water Conservancy Committee).
F03006 YANG ET AL.: YANGTZE RIVER SEDIMENT SUPPLY TO THE SEA
10 of 12
F03006

2003, sediment discharge was 98 � 106 t at Yichang and206 � 106 t at Datong. The total sediment supply from thetributaries between Yichang and Datong was �40 � 106 t,suggesting a net erosion of 68 � 106 t of sediment betweenYichang and Datong (Table 5).[43] The regression equation in Figure 13 suggests that
the sediment discharge at Datong will be <154 � 106 t/yr,given a <60 � 106 t/yr sediment discharge at Yichang (asshown above). Therefore Yangtze sediment discharge in thecoming decades can be expected to be much less than thethreshold value below which the delta intertidal wetlandsdegrade. The effects of delta degradation will be reflecteddifferently by each of the individual wetlands in this regionbut overall, in the absence of management action for thepurpose of recession prevention and accretion promotion, anet loss of total intertidal wetland area in the Yangtze Riverdelta can be expected.
5. Summary and Conclusions
[44] Around 50,000 dams were constructed in the YangtzeRiver catchment from the 1950 to 2003. The total storagecapacity of the reservoirs is now nearly 200 � 109 m3, or22% of the annual water discharge. With the increasednumber of dams in the catchment, more and more sedimentis being trapped in reservoirs. In the late 1960s, riverinesediment supply to the sea began a decreasing trend, eventhough sediment yield has increased along with soil erosion.In the early 1980s, sediment deposited in reservoirs began toexceed the sediment supply to the sea. At present, around850 � 106 t/yr of sediment is deposited in reservoirs.Without dam construction, the Yangtze River sedimentsupply to the sea would have amounted to about 800 �106 t/yr, even if deposition in lakes and river channels wastaken into account. Owing to the impacts of TGD andother new dams, however, Yangtze River sediment dis-charge in the coming decades will probably be reduced to<150 � 106 t/yr. Intertidal wetlands at the delta front, as awhole, were shown to be sensitive to changes in riverinesediment supply, although different responses exist amongindividual wetlands. The total growth rate of intertidalwetlands in the Yangtze delta front decreased from�12 km2/yr in the early 1970s to 3.3 km2/y in 1998.Predicted sediment discharge in the coming decades willbe much less than the estimated threshold value belowwhich overall intertidal wetland degradation will occur.Thus intertidal wetlands in the Yangtze River delta as awhole (which include eastern Chongming and JiuduanshaShoal, both national wetland reserves) will degrade unlessaction in basin-wide water management strategies or effec-tive countermeasures are adopted to prevent degradation.
This will have a significant impact on environments of thedelta and nearby coastal ocean.
[45] Acknowledgments. This research was supported by the NationalGreat Science Project of China (2002CB412407), the Shanghai GreatScience and Technology Project (04DZ19305), and the Natural ScienceFoundation of China (40076027). Thanks to John D. Milliman, RobertAnderson, Suzanne Anderson, Edgar H. Guevara, and Steven Goodbred fortheir comments and suggestions, which were helpful in the improvement ofthis paper.
ReferencesBatalla, R. J., C. M. Gomez, and G. M. Kondolf (2004), Reservoir-inducedhydrological changes in the Ebro River basin (NE Spain), J. Hydrol., 290,117–136.
Carriquiry, J. D., A. Sanchez, and V. F. Camacho-Ibar (2001), Sedimenta-tion in the northern Gulf of California after cessation of the ColoradoRiver discharge, Sediment. Geol., 144, 37–62.
Chen, J. (1988), Shanghai Coastal Zone Comprehensive Investigation (inChinese), 390 pp., Shanghai Sci. and Tech. Publ., China.
Chen, J., H. Zhu, Y. Dong, and J. Sun (1985), Development of the Chang-jiang estuary and its submerged delta, Cont. Shelf Res., 4, 47–56.
Chen, J., H. Shen, and C. Yun (1988a), Introduction, in Processes ofDynamics and Geomorphology of the Changjiang (Yangtze) Estuary,edited by J. Chen, H. Shen, and C. Yun, pp. 1–11, Shanghai Sci. andTech. Publ., China.
Chen, J., C. Yun, H. Xu, and Y. Dong (1988b), The model of developmentof the Changjiang (Yangtze) estuary during the last 2000 years, in Pro-cesses of Dynamics and Geomorphology of the Changjiang (Yangtze)Estuary, edited by J. Chen, H. Shen, and C. Yun, pp. 31–37, ShanghaiSci. and Tech. Publ., China.
Chen, Y. W., and T. R. Li (1979), Land hydrology, in Physical Geographyof China (in Chinese), pp. 61–87, People’s Educ. Press, Beijing.
Compilation Committee for Yangtze River Almanac (CCYRA) (1993),Yangtze River Almanac (in Chinese), Yangtze River Almanac Press,Wuhan, China.
Compilation Committee for Yangtze River Almanac (CCYRA) (1994),Yangtze River Almanac (in Chinese), Yangtze River Almanac Press,Wuhan, China.
Compilation Committee for Yangtze River Almanac (CCYRA) (1995),Yangtze River Almanac (in Chinese), Yangtze River Almanac Press,Wuhan, China.
Compilation Committee for Yangtze River Almanac (CCYRA) (1997),Yangtze River Almanac (in Chinese), Yangtze River Almanac Press,Wuhan, China.
Compilation Committee for Yangtze River Almanac (CCYRA) (1998),Yangtze River Almanac (in Chinese), Yangtze River Almanac Press,Wuhan, China.
Compilation Committee for Yangtze River Almanac (CCYRA) (1999),Yangtze River Almanac (in Chinese), Yangtze River Almanac Press,Wuhan, China.
Compilation Committee for Yangtze River Almanac (CCYRA) (2000),Yangtze River Almanac (in Chinese), Yangtze River Almanac Press,Wuhan, China.
Compilation Committee for Yangtze River Almanac (CCYRA) (2001),Yangtze River Almanac (in Chinese), Yangtze River Almanac Press,Wuhan, China.
Compilation Committee for Yangtze River Almanac (CCYRA) (2002),Yangtze River Almanac (in Chinese), Yangtze River Almanac Press,Wuhan, China.
Compilation Committee for Yangtze River Almanac (CCYRA) (2003),Yangtze River Almanac (in Chinese), Yangtze River Almanac Press,Wuhan, China.
Du, J. L., S. L. Yang, W. X. Zhang, P. Li, and H. Y. Zhao (2005), Influenceof the Deep Channel Project in the North Passage on the stabilityof Jiuduansha intertidal wetland, Yangtze River (Chinese with Englishabstract), Ocean Eng., 23, 71–76.
Fanos, A. M. (1995), The impacts of human activities on the erosion andaccretion of the Nile Delta coast, J. Coastal Res., 11, 821–833.
Frihy, O. E., E. A. Debes, and W. R. E. Sayed (2003), Processes reshapingthe Nile delta promontories of Egypt: Pre- and post-protection, Geomor-phology, 53, 263–279.
Goodwin, P., A. J. Mehta, and J. B. Zedler (2001), Coastal wetland restora-tion: An introduction, J. Coastal Res., 27, 1–6.
Han, Q. W. (2003), Deposition in Reservoirs (in Chinese), 643 pp., Sci.Press, Beijing.
Higgitt, D. L., and X. X. Lu (2001), Sediment delivery to the Three Gorges:1. Catchment controls, Geomorphology, 41, 143–156.
Table 5. Sediment Budget Between Yichang and Datonga
Year
SedimentDischargeat Yichangb
Total SedimentDischarge of
the Tributariesb
SedimentDischargeat Datongb
Net ErosionBetween Yichang
and Datong
2002 228 30 275 172003 98 40 206 68
aSediment budgets are in 106 t.bData from http://www.irtces.org/nishagb_2002.asp and http://www.
irtces.org/nishagb_2003.asp.
F03006 YANG ET AL.: YANGTZE RIVER SEDIMENT SUPPLY TO THE SEA
11 of 12
F03006

Jiang, T., and M. Huang (2003), Discussion on ecological restoration modelof soil erosion in the Yangtze River basin, Bull. Soil Water Conserv., 23,69–71.
Li, X., and C. Wang (2002), Evolution trend of hydrologic and sedimentregime in Jingjing River and Lake Dongting, Yangtze River, 28, 6–8.
Lu, J. J. (1997), The shorebirds in the Yangtze River estuary and themigratory route of the Asia/Pacific migrating waders, in The Interna-tional Proseminar Symposium of the Wetland and Waders Conserva-tion, edited by China Aves Soc., pp. 19–25, Chin. For. Publ. House,Beijing.
Lu, X. X., and D. L. Higgitt (2001), Sediment delivery to the Three Gorges:2. Local response, Geomorphology, 41, 157–169.
Maff, L., G. Oviedo, and P. B. Larsen (2000), Indigenous and traditionalpeoples of the world and eco-region conservation: An integrated ap-proach to conserving the world’s biological and culture diversity, Res.Rep. 145, World Wildlife Fed., Gland, Switzerland.
Milliman, J. D., and R. H. Meade (1983), World-wide delivery of riversediment to the oceans, J. Geol., 91, 1–21.
Qian, C. L. (1994), Effects of dam construction and water diversion projectsin the Luanhe River on the delta (Chinese with English abstract), ActaGeogr. Sin., 49, 158–166.
Sanchez-Arcilla, A., J. A. Jimenez, and H. I. Valdemoro (1998), The EbroDelta: Morphodynamics and vulnerability, J. Coastal Res., 14, 754–772.
Shanghai City Water Affairs Programming and Designing Institute(SCWAPDI), Shanghai City Town Planning and Designing Institute,Shanghai City Water Conservancy Project Designing Institute, andShanghai City Coastal Wetland Managing Department (2002), RevisedEdition of Programs for Utilization of Shanghai Deltaic Wetlands (inChinese), Shanghai, China.
Shi, D. M. (1999), Analysis of relationship between soil and water loss andflood disasters in Yangtze River basin, J. Soil Erosion Soil Water Con-serv., 5, 1–7.
Shi, L. (1998), Soil and water conservation is the essential of riverharnessing—Deep pondering of 1998 flood disasters of the YangtzeRiver (Chinese with English abstract), Soil Water Conserv. China, 11,13–16.
Shi, L. (2002), A survey of historical expansion process of soil erosion inthe Changjiang River Valley (Chinese with English abstract), Bull. SoilWater Conserv., 22, 1–4.
Stanley, D. J., and A. G. Warne (1998), Nile Delta in its destruction phase,J. Coastal Res., 14, 794–825.
State Forestry Administration (2000), The China Wetland ConservationAction Plan, Chin. For. Publ. House, Beijing.
Trenhaile, A. S. (1997), Coastal Dynamics and Landforms, 365 pp.,Clarendon, Oxford, U. K.
Wang, S., J. Ca, and J. Zhu (2002), The interdecadal variations of annualprecipitation in China during 1880s–1990s (Chinese with Englishabstract), Acta Meteorol. Sin., 60, 637–640.
Wang, T. H., and G. Z. Qian (1988), The Waders in the Yangtze Estuary andthe Hangzhou Bay, East China Normal Univ. Publ. House, Shanghai.
Wang, Z. L., and K. S. Peng (1999), Soil erosion and influencing factors inChina, Ecol. Econ., 5, 48–51.
Wiegel, R. L. (1996), Nile delta erosion, Science, 272, 338–340.Wu, Z. P., G. L. Yang, and M. H. Gan (2002), Water-sediment relationbetween Jingjiang River and Lake Dongting and its adjustment (Chinesewith English abstract), Eng. J. Wuhan Univ., 35, 5–8.
Xu, J. X. (2003), Sediment flux to the sea as influenced by changing humanactivities and precipitation: Example of the Yellow River, China, Environ.Manage., 31, 328–341.
Yang, S. L. (1998), The role of Scirpus marsh in attenuation of hydro-dynamics and retention of fine-grained sediment in the Yangtze Estuary,Estuarine Coastal Shelf Sci., 47, 227–233.
Yang, S. L. (1999), Coastal wetland sedimentation in the Yangtze Delta,J. Coastal Res., 15, 1091–1099.
Yang, S., P. Ding, J. Zhu, Q. Zhao, and Z. Mao (2000), Tidal flat morpho-dynamic processes of the Yangtze Estuary and their engineering implica-tions, China Ocean Eng., 14, 307–320.
Yang, S. L., P. X. Ding, and S. L. Chen (2001a), Changes in progradationrate of the tidal flats at the mouth of the Changjiang River, China, Geo-morphology, 38, 167–180.
Yang, S. L., P. X. Ding, and S. L. Chen (2001b), Temporal change in bedlevel of a river mouth channel, Yangtze River mouth: With emphasis onresponse to river discharge and storm, J. Coastal Res., 17, 297–308.
Yang, S. L., Q. Y. Zhao, and I. M. Belkin (2002), Temporal variation in thesediment load of the Yangtze River and the influences of the humanactivities, J. Hydrol., 263, 56–71.
Yang, S. L., I. M. Belkin, A. I. Belkina, Q. Y. Zhao, J. Zhu, and X. D. Ding(2003), Delta response to decline in sediment supply from the YangtzeRiver: Evidence of the recent four decades and expectations for the nexthalf-century, Estuarine Coastal Shelf Sci., 57, 589–599.
Yang, Z.-S., H.-J. Wang, Y. Saito, G.-X. Li, and X.-X. Sun (2004), Phasechange of the modern Huanghe delta evolution since its last end channelshift in 1976 (and its phase change), in 5th International Conference onAsian Marine Geology, AGCP-475 DeltaMAP and APN Mega-Delta,edited by T. Jarupongsakul and Y. Saito, Bangkok.
Yangtze River Water Conservancy Committee (1999), Atlas of the YangtzeRiver Basin (in Chinese), 286 pp., Water Conserv. Minist. of China,China Map Press, Beijing.
Yin, H. F., and C. A. Li (2001), Human impact on floods and flood disasterson the Yangtze River, Geomorphology, 41, 105–109.
Yun, C. X. (2004), Recent Evolution of the Yangtze River Mouth (inChinese), 290 pp., Oceanic Press, Beijing.
Zhang, D. Q. (2000), The effect of population activity on the changes invegetation of Yangtze River valley since the ancient period of spring andautumn warring states (700–211 B.C.) (in Chinese), J. Plant Resour.Environ., 9, 47–53.
Zhang, J., H. Hu, H. Ruan, and Y. Fang (1999), The present situation andcontrol measures of soil and water loss in the Changjiang River valley (inChinese), J. Nanjing For. Univ., 23, 17–21.
Zhang, S., and C. Zhu (2001), Soil loss and its effect on flooding catas-trophe in Yangtze drainage basin, J. Soil. Water Conserv., 15, 9–16.
Zhang, X. M. (2004), Yangtze will not become a second Yellow River, WenHui Bao, 18, 2.
Zhao, P., X. Yuan, S. X. Tang, and T. H. Wang (2003), Species and habitatpreference of waterbirds at the eastern end of Chongming Island(Shanghai) in winter, Zool. Res., 24, 387–391.
Zhu, J. Y. (2000), Variation of sediment transportation in the YangtzeRiver and the way for its reduction (Chinese with English abstract),J. Hydroelectr. Eng., 70, 38–48.
�����������������������S. B. Dai, A. Gao, P. Li, S. L. Yang, and J. Zhang, State Key Laboratory
of Estuarine and Coastal Research, East China Normal University, 3663North Zhongshan Road, Shanghai 200062, China. ([email protected];[email protected]; [email protected]; [email protected];[email protected])J. P. Smith and J. Zhu, Environmental, Earth, and Ocean Sciences
Department, University of Massachusetts, 100 Morrissey Boulevard,Boston, MA 02125-3393, USA. ([email protected]; [email protected])
F03006 YANG ET AL.: YANGTZE RIVER SEDIMENT SUPPLY TO THE SEA
12 of 12
F03006