Embed Size (px)
Citation preview
“Impact of culture, brand image and price on buying decisions: Evidence fromEast Java, Indonesia”
AUTHORS
Sudaryanto Sudaryanto
Imam Suroso
Anifatul Hanim
Jaloni Pansiri
Taskiya Latifatil Umama
ARTICLE INFO
Sudaryanto Sudaryanto, Imam Suroso, Anifatul Hanim, Jaloni Pansiri and
Taskiya Latifatil Umama (2021). Impact of culture, brand image and price on
buying decisions: Evidence from East Java, Indonesia. Innovative Marketing ,
17(1), 130-142. doi:10.21511/im.17(1).2021.11
DOI http://dx.doi.org/10.21511/im.17(1).2021.11
RELEASED ON Monday, 29 March 2021
RECEIVED ON Sunday, 31 January 2021
ACCEPTED ON Thursday, 25 March 2021
LICENSE
This work is licensed under a Creative Commons Attribution 4.0 International
License
JOURNAL "Innovative Marketing "
ISSN PRINT 1814-2427
ISSN ONLINE 1816-6326
PUBLISHER LLC “Consulting Publishing Company “Business Perspectives”
FOUNDER LLC “Consulting Publishing Company “Business Perspectives”
NUMBER OF REFERENCES
69
NUMBER OF FIGURES
1
NUMBER OF TABLES
6
© The author(s) 2021. This publication is an open access article.
businessperspectives.org
130
Innovative Marketing, Volume 17, Issue 1, 2021
http://dx.doi.org/10.21511/im.17(1).2021.11
Abstract
The marketing strategy phenomenon improves significantly, narrowing from a gen-eral to a specific cultural ethnicity base and from variable to dimension analysis. This study examines the impact of culture, brand image and price on buying decisions. The study population comprised retail consumers in the sampled area of Situbondo, East Java, Indonesia. A multi-stage sampling technique was used to derive a sample of 112 respondents as a primary data source – descriptive statistics allows for the de-mographic characteristics of retail consumers in East Java, Indonesia. Surprisingly, the data showed that gender involvement in buyer decision-making was dominant. Most retail customers were identified as private-sector employees and indicated for higher income earners. Responses were then analyzed using multiple linear regressions to answer the research hypotheses. The results showed that Hofstede’s culture dimension and the brand image and price significantly affected consumer buying decisions at re-tail stores in East Java, Indonesia. Regarding the strength of Islamic culture in East Java, price was the primary consideration in buying decisions. Further research, preferably using ethnographic approaches with an emphasis on qualitative research, is needed to investigate the implications of these relationships.
Sudaryanto Sudaryanto (Indonesia), Imam Suroso (Indonesia), Anifatul Hanim (Indonesia), Jaloni Pansiri (Botswana), Taskiya Latifatil Umama (Indonesia)
Impact of culture, brand
image and price on buying
decisions: Evidence from
East Java, Indonesia
Received on: 31st of January, 2021Accepted on: 25th of March, 2021Published on: 29th of March, 2021
INTRODUCTION
Continued economic growth and high social spending will drive consum-er demand for retail stores. Retail business management in Indonesia has good prospects because of its vast market potential due to its large pop-ulation. The Indonesian Retailers Association claims that retail growth in the first quarter of 2018 ranged from 7% to 7.5%, significantly higher than the 5% growth in the previous year (www.cnbcindonesia.com).
Berman and Evans (2007, p. 3) mentioned that retail sales were the final level of the distribution process. There is a business activity in-volving the sale of goods or services to consumers. The emergence of various retail stores in Indonesia includes culture-based retailers looking for a niche market. One of the culture-based retail stores in East Java, Indonesia, was established in 1961, the Basmalah store with 257 branches across Indonesia (Sudaryanto et al., 2020). Currently, the number of followers of this ethnicity-based store is growing rapidly, such as Al-Hikmah, Al Amin, and Markaz (https://swa.co.id/swa/listed-articles/geliat-minimarket-islami).
Most of the retail stores open in a unique location in a sub-dis-trict area rather than in downtown Indonesia, and many factors,
© Sudaryanto Sudaryanto, Imam Suroso, Anifatul Hanim, Jaloni Pansiri, Taskiya Latifatil Umama, 2021
Sudaryanto Sudaryanto, Assistant Professor, Senior Lecturer, Researcher, Faculty of Economics and Business, Universitas Jember, East Java, Indonesia. (Corresponding author)
Imam Suroso, Assistant Professor, Senior Lecturer, Faculty of Economics and Business, Universitas Jember, East Java, Indonesia.
Anifatul Hanim, Doctorate Student, Faculty of Economics and Business, Universitas Jember, East Java, Indonesia.
Jaloni Pansiri, Professor in Tourism, Lecturer, Department Tourism and Hospitality, University of Botswana, Botswana.
Taskiya Latifatil Umama, Bachelor in Economics, Faculty of Economics and Business, Universitas Jember, East Java, Indonesia.
This is an Open Access article, distributed under the terms of the Creative Commons Attribution 4.0 International license, which permits unrestricted re-use, distribution, and reproduction in any medium, provided the original work is properly cited.
www.businessperspectives.org
LLC “СPС “Business Perspectives” Hryhorii Skovoroda lane, 10, Sumy, 40022, Ukraine
BUSINESS PERSPECTIVES
JEL Classification C83, L81, M31
Keywords culture, brand image, buying decisions, retail, multi-stage sampling, East Java
Conflict of interest statement:
Author(s) reported no conflict of interest
131
Innovative Marketing, Volume 17, Issue 1, 2021
http://dx.doi.org/10.21511/im.17(1).2021.11
either internal or external, can inf luence consumer purchasing decisions there. Such an internal factor is the ability to control them, inf luencing individual culture (Muruganantham & Bhakat, 2013; Cakanlar & Nguyen, 2019). The culture potentially inf luenced consumer buying decisions (Shoham et al., 2015). Culture often has a potential inf luence on consumer behavior and impacts all stages of consumer decision-making (Ng & Lee, 2015). Unlike corporate marketing programs, culture inclusion does not always support the purchase or consumption of the product but can in-stead hinder it. For example, matters relating to beliefs (religion) prevent someone from consuming a particular product prohibited by their faith.
Most of the culture-based retailers in Indonesia have adopted Islamic values and principles, and Muslim employees organize them with a strong personality in Islamic values (culture). Friendly employees (culture) will inf luence buying decisions (Vinish et al., 2020). There are five perspec-tives dimensions to measure cultural context of a community: the distance of power, avoidance of uncertainty, individualism and collectivism, masculinity and feminity, and orientation to the long or short term (Hofstede, 1983). Cakanlar and Nguyen (2019) advised for further research to use the cultural dimension of Hofstede to understand consumer behavior. On the other hand, Shoham et al. (2015) found that Asian culture strengthened in the short and long term. Cultural differences in Hofstede’s five dimensions can potentially inf luence consumer information, responses, behavioral decisions, and judgment (Ng & Lee, 2015).
In addition to culture, brand image is another variable that can also inf luence purchasing deci-sions (Sudaryanto, 2015; Sudaryanto et al., 2020). Batra and Homer (2004) observe that positioning a brand image in the consumer’s mind becomes the most affordable strategy for gaining a com-petitive advantage to inf luence buying decision-making. Schiffman and Kanuk (1997) argue that brand image is the long-lasting perception and experience formulation consistent with relativity. Therefore, retail stores in Indonesia strive to showcase excellence and illustrate their benefits by their brand image, such as a motto of “A Good Shopping Place (Basmalah); all salesgirl wearing hijab (Al-Hikmah), and many others.”
Buying decisions are inf luenced not only by brand image but also by the price of the product. The prices of products must be in line with the target market. It is easier to measure a specific target market’s purchasing power and decide the most affordable price strategy. Those retail stores in East Java have relatively lower prices than other retail stores due to their implementation of the sharia system (swa.co.id; sidogiri.net). Quiet and affordable product prices inf luence customer purchas-ing decisions. Accordingly, pricing-related findings usually constitute the most challenging and sensitive set of decisions that each company has to make, especially if it considers that the price is a critical factor in most buying (Hustić & Gregurec, 2015). Every consumer creates various alterna-tives to finding, buying, and using multiple products and brands at any given period, which is re-lated to purchasing a product that meets their needs. A consumer buying decision is a stage created by consumers from the product recognition stage to post-purchase evaluation (Engel et al., 1995; Onigbinde & Odunlami, 2015). Purchasing decisions is inf luenced by consumers’ beliefs, attitudes, values, and various social environment factors.
Based on the information above, this study investigates the following research questions: a. Does cul-ture significantly affect purchasing decisions at a retail store in Indonesia? b. Does brand image substan-tially affect purchasing decisions at a retail store in Indonesia? and c. Does the price significantly affect purchasing decisions at a retail store in Indonesia? Consequently, this study’s objectives are: (a). To test the impact of culture on buying decisions; (b). To test the effect of brand image on purchasing decisions; (c). To test the effects of prices on buying decisions.
132
Innovative Marketing, Volume 17, Issue 1, 2021
http://dx.doi.org/10.21511/im.17(1).2021.11
1. LITERATURE REVIEW
AND HYPOTHESES
1.1. Culture
Culture is a habit that one generation passes down to the next generation in a community. Culture is an external factor influencing purchasing decisions (Foscht et al., 2008; Chegini et al., 2016). Lee et al. (2007) observed that culture, behavioral learning configuration, and a member of a particular soci-ety transmit and share the result of component ele-ments of behavior. Thus, the composition of culture includes instruments such as language, religion, and values. Perception does influence consumer choices and evaluation triggered by those instru-ments (Foscht et al., 2008; Sudaryanto et al., 2020; Chegini et al., 2016; Hofstede, 1983; Nasse et al., 2019; Sedikides & Gebauer, 2021; White et al., 2021). These values, language, and religion are indeed transmitted to society members through symbols.
Authors rarely examine consumer behavior in Indonesia using the specific Hofstede dimension of culture. An analysis of the culture of the local econ-omy is essential for a company before launching or advertising a product (Hofstede, 1983; Foscht et al., 2008; Sudaryanto et al., 2020; Vinish et al., 2020; Sundararaj & Rejeesh, 2021; Johnson, 2021).
Two sides of the ruler explain how the cultural di-mension moves from left to right:
1. Individualism/collectivism; a dimension of culture that determines whether they are part of a group or an individual.
2. Certainty versus uncertainty avoidance; cul-tural dimensions that measure the conform-ity of individuals to fate and individual confi-dence in uncertainty avoidance.
3. Masculinity/femininity; a cultural dimension that measures whether individuals emphasize achievement, competition, and ambition than individuals. In contrast, in feminine societies, individuals are simple, humble, and nurturing.
4. Short versus long power distance; dimensions that measure social disparities in organizations. Individuals in a society characterized by a high-
er power distance level tend to follow a formal ethical law and are reluctant to disagree with their superiors or leaders. On the other hand, individuals in societies whose power distance is lower do not feel constrained by differences in status, power, or perceived position.
5. Short-term versus long-term orientation; Individuals in a long-term orientation culture develop virtues with a future reward orienta-tion in the form of perseverance and savings. However, those who follow short-term expo-sure think about what they can consume at that time.
1.2. Brand image
It is common sense for a customer to restore the memory of a brand image before buying or purchas-ing a product or service. Therefore, it is crucial to identify the term brand image and how it potentially influences the decision to buy.
According to Batra and Homer (2004), Serrao and Botelho (2008), Shamma and Hassan (2011), Bukhari (2011), Kotler and Keller (2012), Lee (2014), Onigbinde and Odunlami (2015), Kotler and Armstrong (2018), Sudaryanto et al. (2019), Nilasari and Saudi (2019), Ahmady and Kaluarachchi (2020), Bafna and Saini (2021), Cai et al. (2021), and Chen et al. (2021), consumers’ perceptions and beliefs reflect the associations of storing memory. Therefore, brand insight has potentially become an image and a sym-bol for the product.
Park et al. (1986), Liu (2020), Barbosa et al. (2021), Cai et al. (2021), Israfilova et al. (2021), and Karadagli et al. (2021) defined some indicators of the brand image: 1) image function, where the product solves the consumer’s problem when looking for a product; 2) image symbolic, where brands provide consum-er satisfaction and increasing self-esteem (desires), status in a social environment, recognition of them-selves and many others; and 3) the experience of im-agery is the time when brands provide consumers with a pleasant experience.
1.3. Price
Price is an important thing that customers con-sider before buying a product. Kotler and Keller
133
Innovative Marketing, Volume 17, Issue 1, 2021
http://dx.doi.org/10.21511/im.17(1).2021.11
(2012), Kotler and Armstrong (2018) defined price as the amount of money needed to obtain the combination of products and services. Prices help consumers determine their purchasing de-cisions compared to the product’s expected value (Hendalianpour, 2020; Ryu, 2020; Zielke, 2006; Sudaryanto et al., 2019). Consequently, a company must consider product prices to encourage con-sumers to buy their product ambitiously. It is nat-ural for consumers to expect a high-quality prod-uct at an affordable price.
Price then becomes the most critical factor in buy-ing decisions. According to Zielke (2006), Hustić and Gregurec (2015), Wang et al. (2021), Liu (2020), Ahmed (2020), Ryu (2020), Chan et al. (2011), Calvo-Porral and Lévy-Mangin (2015), Belton (2017), Nilasari and Saudi (2019), Bukhari (2011), Rusdiyanto et al. (2020), Yang et al. (2020), and Zhao et al. (2021), price indicators are as follows: 1) price level is the valuation of benefits and comparison with similar products regarding the price without consid-ering its quality; 2) price conformity to the product’s quality is when the company’s price is equal to the expected rate of the products aimed by consumers; and 3) price competitiveness is the price difference between companies’ prices compared to similar product offered by other companies.
1.4. Buying decisions
Pre-purchase situation initiates the consumer’s decision to buy, which consists of alternatives col-lected by the consumer and finalized by post-pur-chase evaluation (Onigbinde & Odunlami, 2015; Benton et al., 2020; Bozzi et al., 2021; Gidlöf et al., 2021; Naeem, 2021; Ozkara & Bagozzi, 2021; Richard et al., 2021; Sundararaj & Rejeesh, 2021; Zhang et al., 2020). To understand the process of consumer buying decisions, the marketer should understand the extent to which consumers buy the products and the products’ utility in consum-ers’ perceptions.
According to Engell et al. (1995), Kotler and Armstrong (2018), Ahmed (2020), Ahmed et al. (2020), Cicatiello (2020), Fahfouh et al. (2020), Hendalianpour (2020), Neumann and Mehlkop (2020), Ryu (2020), and Wang et al. (2020), there are five consumer decision-making processes in the purchase, namely:
1. Need for recognition; in the initial deci-sion-making phase, consumers recognize their needs as a reason to buy a product. The customer is aware of the difference between real needs and desires for the product. The trigger of consumer needs comes from exter-nal and internal stimulation influenced by us-ers of similar products.
2. Search for information; this is the stage at which consumers are encouraged to seek addition-al information about the goods and services or brands to be purchased. Consumers can only in-crease attention or actively seek information.
3. Alternative evaluation refers to using availa-ble data to weigh the value of alternatives and nominating products to be listed.
4. Purchase decisions: consumers organize and choose one nominated product that meets their needs and wants to buy.
5. Post-purchase behavior : this is the final stage of the purchase decision that refers to the experience after purchasing a product. The phase is an evaluation process of the benefit af-ter consuming the product. Attention should be paid to the pros and cons of whether the customer was satisfied or dissatisfied with the product being used.
Sudaryanto et al. (2019), based on a previous study of Basmalah retail stores, investigate three pur-chasing decision indicators:
1. Involvement – a situation where consumers decide to make a purchase because they are familiar with a product.
2. Interests – when a consumer chooses to buy due to the stores having the uniqueness of Islamic culture and taste of the product.
3. References – when consumers buy a product because of others’ recommendations.
This research aims to identify the influence of Hofstede’s cultural dimension, concurrently with brand image and price, on buying decisions in Indonesia’s retail customers.
134
Innovative Marketing, Volume 17, Issue 1, 2021
http://dx.doi.org/10.21511/im.17(1).2021.11
Based on these arguments, the following hypoth-eses are advanced:
Ha1: Culture has a significant impact on a buying decision.
Ha2: Brand image has a significant impact on a buying decision.
Ha3: Price has a significant impact on a buying decision.
2. METHOD
The type of research is a quantitative explanatory research work underpinned by positivist philoso-phy. The study examines the relationship between predictors toward a predicted variable (Malhotra & Birks., 2007; Zhao, 2020). Descriptive statistical analysis provides the demographic characteristics of respondents. The unit of analysis for this study is the customers of the Basmalah store in East Java, Indonesia.
The population of the study was the consumers of the retail store in East Java, Indonesia. The study adopt-ed a multi-stage sampling method as an alternative probability sampling technique, which is applicable when the population abundance and each selected sample’s trait have a high spatial structure (Kuno, 1976). In probability sampling, where there is a cluster of the population at each stage, a representative sam-ple was chosen randomly to provide equal chances for the population (Prabowo et al., 2020; Rusdiyanto et al., 2020; Syafii et al., 2020). The inevitable popula-tion in the last stage has to be known.
The stores were available in the East Java Province, so the first stage involved choosing one region out of 36 (Ind. Kabupaten and Kota); the Situbondo re-gion is the sample. At the second stage, one store was randomly selected out of five Basmalah stores avail-able in the region; the Basmalah Tenggir store cus-tomer was randomly selected as the unit of analysis. The third stage involved a sample of 112 respondents randomly selected from a total population of 209,625 young to older adult populations in the Situbondo region.
Johansson (2012) and Webb (2012), Hair et al. (2014) stated that the size of the sample depended on the number of observations. The sample size is the num-
ber of observations – a minimum of 5 to 10. The number of observations in this study was 14, so the sample size needed for this study was 112 respond-ents, calculated as follows: 14 x 8 = 112.
Primary data collection was conducted using a ques-tionnaire distributed among Basmalah consumers aged 17 and over, in particular in the Situbondo re-gion in East Java. Copies of the questionnaire were given directly to potential respondents at the store in one selected Basmalah shop. The survey instrument consisted of statements seeking responses using a five-point Likert scale ranging from one (strongly disagree) to seven (strongly agree) (Jogulu & Pansiri, 2011; Pansiri & Mmereki, 2010). These were closed questions concerning the perception of the indicator of Hofstede’s culture, brand image, and price, using indicators from marketing theory.
Descriptive statistics on the respondent’s demo-graphic profiles were presented in a qualitative analysis followed by hypothesis testing using mul-tiple-linear regression. Responses from question-naires were analyzed using multivariate analysis of multiple linear regressions. This statistical anal-ysis was used to identify the causa relationship between three independent variables (X1, culture; X2, brand image; X3, price) in relation to depend-ent variables (Y, buying decision) and to test hy-potheses. Table 1 shows the variables and indica-tors of three predictors and one predicted variable.
Table 1. Definition of operational variables and their indicators
Variables Indicators
Predictors
Culture
1.
Purchasing a product or services in the
store to cover family needs (Hofstede,
1983; Cakanlar & Nguyen, 2019)
Individualism/
collectivism
2.
Buying a product or services due to
a well-known store (Hofstede, 1983;
Cakanlar & Nguyen, 2019)
Certainty versus
uncertainty
avoidance
3.
Confidently buying a product in the store (Hofstede, 1983; Cakanlar &
Nguyen, 2019)
Masculinity/
femininity
4.
Purchasing a product in the store with
the reference of Sidogiri Boarding Hose
as the owner (Hofstede, 1983; Cakanlar
& Nguyen, 2019)
Short versus long
power distance
5.
Shopping in the store for monthly
purposes (Hofstede, 1983; Shoham et
al.,2010; Cakanlar & Nguyen, 2019)
Long-term
and short-term
orientation
135
Innovative Marketing, Volume 17, Issue 1, 2021
http://dx.doi.org/10.21511/im.17(1).2021.11
Variables Indicators
Predictors
Brand image
1.
The store helps customers to cover
their needs (Batra & Homer, 2004;
Chegini et al., 2016; Bukari, 2011;
Mhllongo & Mason 2020)
Functional imagery
2.
The store helps customers to increase
their social status (Park et al. 1986;
Shamma & Hassan, 2011; Vinish et al.,
2020)
Symbolic imagery
3.
The brand of the store provides consumers with a pleasant experience
(Onigbinde & Odunlami, 2015; Fosch et al., 2020)
Experience imagery
Price
1.
Customer evaluation of the price and its benefits compared to a similar product (Zielke 2006; Nilasari, et.al.,
2019; Ryu, 2020)
Price level
2.
Customer consideration of price to the quality of the products obtained by consumers (Barbosa et al., 2021)
Price conformity
with product quality
3.
When purchasing a product in the
store, the customer looks for lower
prices offered with other similar products(Chan et al., 2011)
Price
competitiveness
Predicted variable
Buying decision
1.
Consumers’ purchase involvement
when buying a product in the store (Engel et.al.,1995; Sudaryanto et al.,
2019)
Involvement
2.
The consumer decides to purchase
due to the uniqueness and taste of the
product (Nasse et al., 2019; Sudaryanto
et al., 2019)
Interests
3.
Consumers purchase a product due to
other’s recommendations (Nasse et al., 2019; Sudaryanto et al., 2019)
Recommendations from others
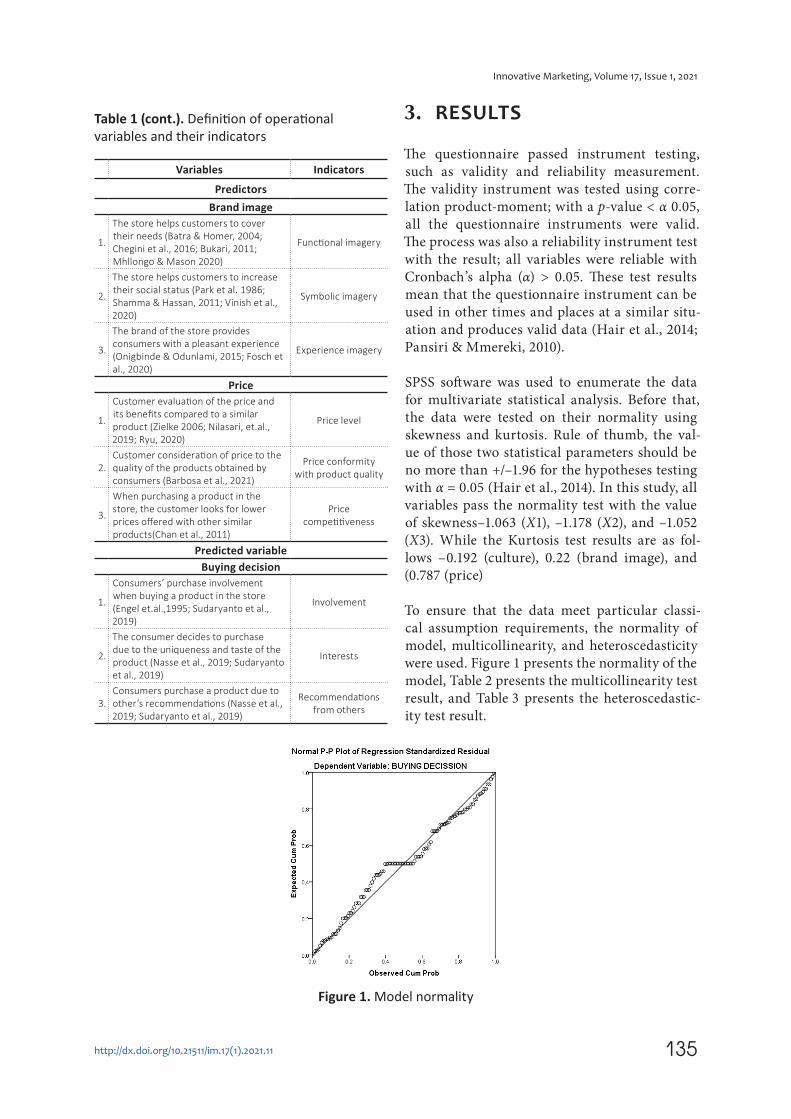
Figure 1. Model normality
3. RESULTS
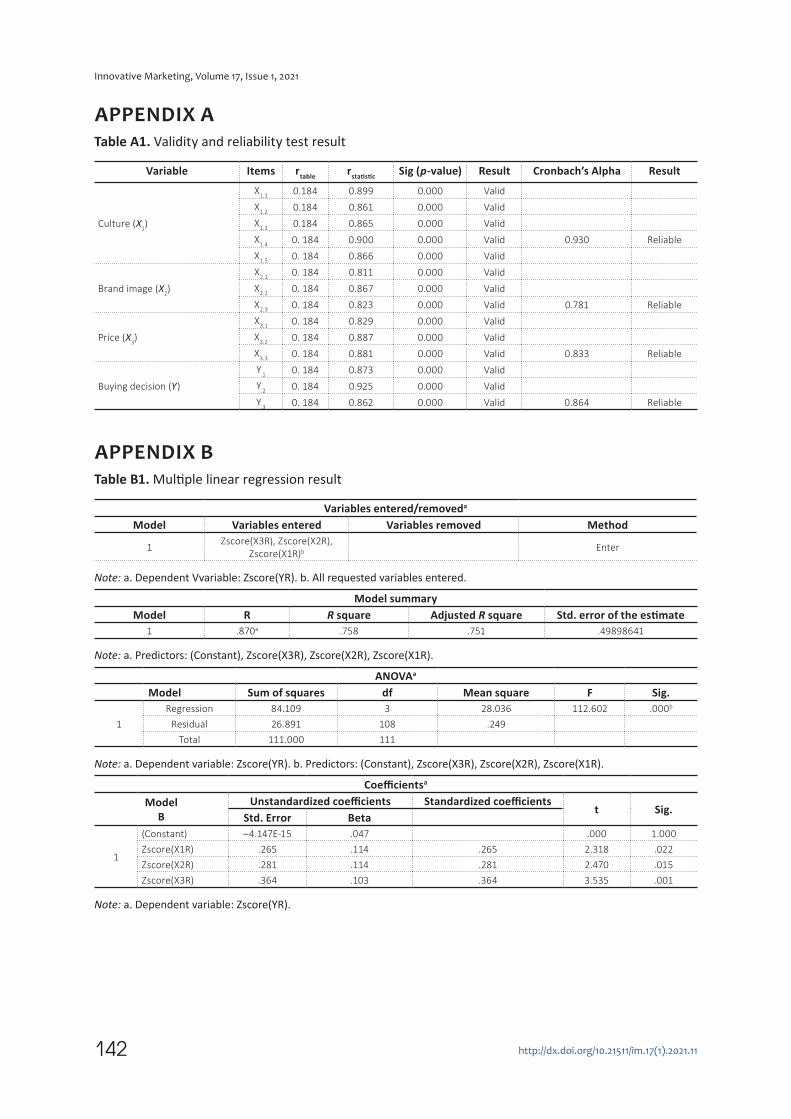
The questionnaire passed instrument testing, such as validity and reliability measurement. The validity instrument was tested using corre-lation product-moment; with a p-value < α 0.05, all the questionnaire instruments were valid. The process was also a reliability instrument test with the result; all variables were reliable with Cronbach’s alpha (α) > 0.05. These test results mean that the questionnaire instrument can be used in other times and places at a similar situ-ation and produces valid data (Hair et al., 2014; Pansiri & Mmereki, 2010).
SPSS software was used to enumerate the data for multivariate statistical analysis. Before that, the data were tested on their normality using skewness and kurtosis. Rule of thumb, the val-ue of those two statistical parameters should be no more than +/–1.96 for the hypotheses testing with α = 0.05 (Hair et al., 2014). In this study, all variables pass the normality test with the value of skewness–1.063 (X1), –1.178 (X2), and –1.052 (X3). While the Kurtosis test results are as fol-lows –0.192 (culture), 0.22 (brand image), and (0.787 (price)
To ensure that the data meet particular classi-cal assumption requirements, the normality of model, multicollinearity, and heteroscedasticity were used. Figure 1 presents the normality of the model, Table 2 presents the multicollinearity test result, and Table 3 presents the heteroscedastic-ity test result.
Table 1 (cont.). Definition of operational variables and their indicators
136
Innovative Marketing, Volume 17, Issue 1, 2021
http://dx.doi.org/10.21511/im.17(1).2021.11
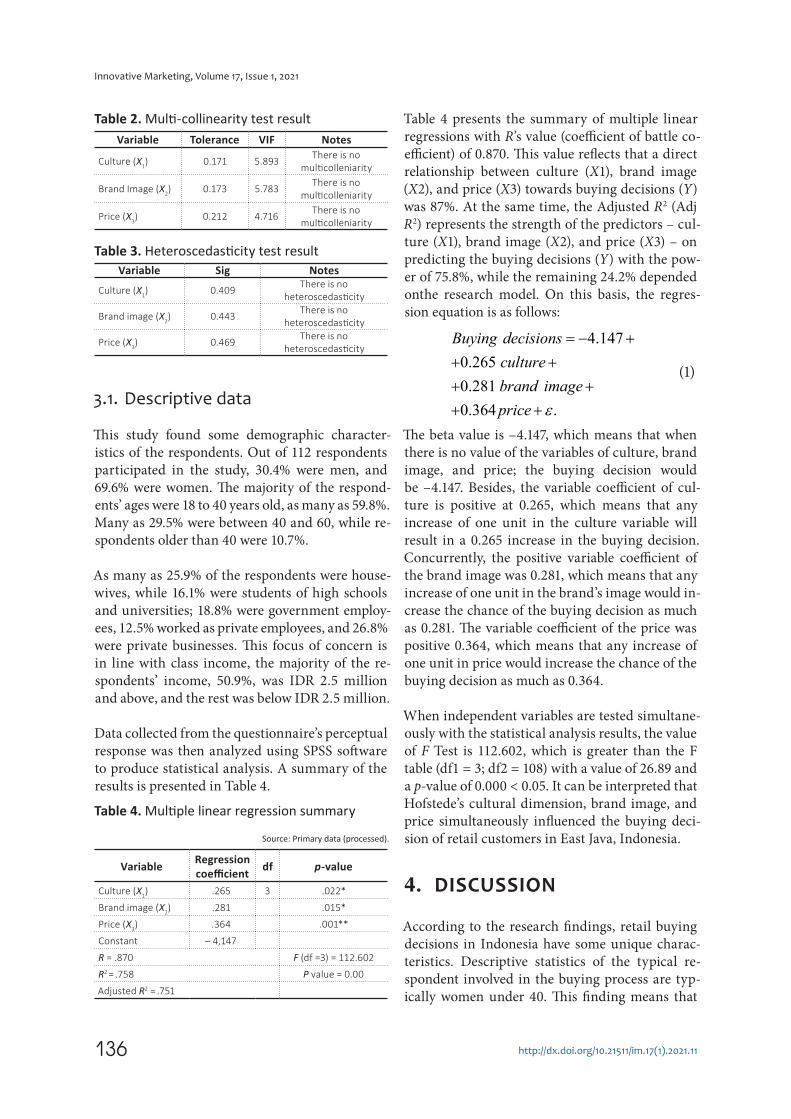
Table 2. Multi-collinearity test resultVariable Tolerance VIF Notes
Culture (X1) 0.171 5.893
There is no
multicolleniarity
Brand Image (X2) 0.173 5.783
There is no
multicolleniarity
Price (X3) 0.212 4.716
There is no
multicolleniarity
Table 3. Heteroscedasticity test resultVariable Sig Notes
Culture (X1) 0.409
There is no
heteroscedasticity
Brand image (X2) 0.443
There is no
heteroscedasticity
Price (X3) 0.469
There is no
heteroscedasticity
3.1. Descriptive data
This study found some demographic character-istics of the respondents. Out of 112 respondents participated in the study, 30.4% were men, and 69.6% were women. The majority of the respond-ents’ ages were 18 to 40 years old, as many as 59.8%. Many as 29.5% were between 40 and 60, while re-spondents older than 40 were 10.7%.
As many as 25.9% of the respondents were house-wives, while 16.1% were students of high schools and universities; 18.8% were government employ-ees, 12.5% worked as private employees, and 26.8% were private businesses. This focus of concern is in line with class income, the majority of the re-spondents’ income, 50.9%, was IDR 2.5 million and above, and the rest was below IDR 2.5 million.
Data collected from the questionnaire’s perceptual response was then analyzed using SPSS software to produce statistical analysis. A summary of the results is presented in Table 4.
Table 4. Multiple linear regression summary
Source: Primary data (processed).
VariableRegression
coefficient df p-value
Culture (X1) .265 3 .022*
Brand image (X2) .281 .015*
Price (X3) .364 .001**
Constant – 4,147
R = .870 F (df =3) = 112.602
R2 = .758 P value = 0.00
Adjusted R2 = .751
Table 4 presents the summary of multiple linear regressions with R’s value (coefficient of battle co-efficient) of 0.870. This value reflects that a direct relationship between culture (X1), brand image (X2), and price (X3) towards buying decisions (Y) was 87%. At the same time, the Adjusted R2 (Adj R2) represents the strength of the predictors – cul-ture (X1), brand image (X2), and price (X3) – on predicting the buying decisions (Y) with the pow-er of 75.8%, while the remaining 24.2% depended onthe research model. On this basis, the regres-sion equation is as follows:
4.147
0.265
0.281
0.364 .
Buying decisions
culture
brand image
price ε
= − ++ ++ ++ +
(1)
The beta value is –4.147, which means that when there is no value of the variables of culture, brand image, and price; the buying decision would be –4.147. Besides, the variable coefficient of cul-ture is positive at 0.265, which means that any increase of one unit in the culture variable will result in a 0.265 increase in the buying decision. Concurrently, the positive variable coefficient of the brand image was 0.281, which means that any increase of one unit in the brand’s image would in-crease the chance of the buying decision as much as 0.281. The variable coefficient of the price was positive 0.364, which means that any increase of one unit in price would increase the chance of the buying decision as much as 0.364.
When independent variables are tested simultane-ously with the statistical analysis results, the value of F Test is 112.602, which is greater than the F table (df1 = 3; df2 = 108) with a value of 26.89 and a p-value of 0.000 < 0.05. It can be interpreted that Hofstede’s cultural dimension, brand image, and price simultaneously influenced the buying deci-sion of retail customers in East Java, Indonesia.
4. DISCUSSION
According to the research findings, retail buying decisions in Indonesia have some unique charac-teristics. Descriptive statistics of the typical re-spondent involved in the buying process are typ-ically women under 40. This finding means that
137
Innovative Marketing, Volume 17, Issue 1, 2021
http://dx.doi.org/10.21511/im.17(1).2021.11
gender plays a vital role in shopping at the retail stores in Indonesia, which is exciting and needs attention. It was also found that the recommenda-tions of these customers were segmented by em-ployees who worked in the private sector with an income of more than IDR 2.5 million.
For the hypotheses testing purposes, three inde-pendent variables such as culture, brand image, and price were used to predict causality with the dependent variable of a buying decision. The first analysis did not accept the H01 that there is no significant influence of culture on the buying de-cision. This finding means that the proposed alter-native to the hypothesis Ha1: Culture has a signif-icant effect on buying decisions, must be accepted. Accordingly, Hofstede’s (1983) instrument culture applies to retail stores in East Java, Indonesia, and strongly influences buying decisions. This re-search finding supports Vinish et al. (2020).
Sundararaj and Rejeesh (2021) and Johnson (2021) underlined the importance of cultural influence on buying decisions. This statement is consistent with Indonesian culture, in which people are more collectivists than individualistic; therefore, infor-mation or friend recommendation would be essen-tial. The culture applies to avoiding uncertainty. The finding also identifies Indonesian culture as feminine rather than masculine in shopping; this means that customers do not like achievement, competition, and ambition to share shopping ex-perience. People in Indonesia are likely to have a long power distance; they are not well aware of the buying decision makers.
A customer also has a long-term orientation when deciding to buy a product or service. In addition to the cultural inf luence, the second hypothesis test did not accept H
02. Conversely,
this means that the proposed alternative hy-pothesis Ha2: Brand image has a significant im-pact on buying decision, has to be accepted. This finding means that brand image strongly inf lu-ences buying decisions in the retail store. This study supports the findings of Ognibinde and Odunlami (2015), Batra and Homer (2004), and Sudaryanto et al. (2019). The brand image can bring out empathy or emotional response from potential retail store customers in Indonesia. Restoring image experience is a sensitive aspect of brand imagery by the brand endorser and symbolically represents its goodwill. A false personal image of an endorser would potentially lessen the brand image of retail store’s product or services in Indonesia.
The last hypothesis test was not to accept H03 and noted no significant influence on buying decision price. This finding means that the proposed alter-native hypothesis Ha3: Price has a significant in-fluence on buying decisions, should be accepted. Price sensitivity would stimulate the decision to buy a product from the retail store in Indonesia. This finding supports the studies by Zelkie (2015) and Ryu (2020). The price elasticity will be more than 1, which means that any increase in price will decrease the product or services’ demand by more than one scale. The rationale is that women with more rigid funding are more prevalent among re-tail customers in Indonesia.
CONCLUSION
Hofstede’s (1983) cultural dimension is still present in numerous research publications and applies to any nation. In the study, the cultural dimension was applied concurrently with brand image and price towards buying decisions in East Java, Indonesia, which is culturally strong Islamic faith. An impor-tant finding from the study was that the consumer’s buying decision of the retail stores in East Java, Indonesia was dominated by educated and professional women. Gender was a central point in config-uring the decision maker.
The study also indicates that Hofstede’s cultural dimension still exists in retail business consumer be-havior in East Java, Indonesia. The urgency of this finding implies that culture plays a significant role in retail stores in the country with strong cultural values. This phenomenon is necessary to improve the innovativeness of customer retention management.
138
Innovative Marketing, Volume 17, Issue 1, 2021
http://dx.doi.org/10.21511/im.17(1).2021.11
Brand image and price have been found to positively influence buying decisions. Therefore, a better brand image by a store in East Java, Indonesia, will improve consumer purchasing decisions. Similarly, the better the retail store’s price, the more it will positively influence consumer purchasing decisions. This phenomenon was related to the gender issue.
The survey was conducted in the era leading up to the COVID-19 pandemic, therefore, the recommen-dation to future research is to conduct similar research in both pandemic and post-pandemic eras. A deeper similar study of cultural approaches in qualitative approaches is also proposed.
AUTHOR CONTRIBUTIONS
Conceptualization: Sudaryanto Sudaryanto, Imam Suroso, Taskiya Latifatil Umama.Data curation: Sudaryanto Sudaryanto, Anifatul Hanim, Jaloni Pansiri, Taskiya Latifatil Umama.Formal analysis: Sudaryanto Sudaryanto, Imam Suroso.Funding acquisition: Sudaryanto Sudaryanto, Imam Suroso, Anifatul Hanim, Jaloni Pansiri.Investigation: Sudaryanto Sudaryanto, Anifatul Hanim, Taskiya Latifatil Umama.Methodology: Sudaryanto Sudaryanto, Imam Suroso, Jaloni Pansiri.Project administration: Anifatul Hanim.Resources: Imam Suroso.Software: Sudaryanto Sudaryanto, Jaloni Pansiri, Taskiya Latifatil Umama.Supervision: Imam Suroso, Anifatul Hanim.Writing – original draft: Sudaryanto Sudaryanto, Imam Suroso, Taskiya Latifatil Umama.Writing – review & editing: Sudaryanto Sudaryanto, Jaloni Pansiri.
ACKNOWLEDGMENT
We would like to thank the Research Centre (LP2M) of University of Jember, East Java, Indonesia, for their support and funding. We also want to thank Rusdiyanto, a Ph.D. student from the Faculty of Economics and Business, Universitas Airlangga, Surabaya, Indonesia, for his helpful discussions and contributions.
REFERENCES
1. Ahmady, Y., & Kaluarachchi, Y. (2021). The influence of lighting settings on museum’s brand image and human satisfaction in exhibition halls using virtual reality. Advances in Intelligent Systems and Computing, 1253 AISC, 103-108. https://doi.org/10.1007/978-3-030-55307-4_16
2. Ahmed, B. (2020). Understanding the impact of investor sentiment on the price formation process: A review of the conduct of American stock markets. Journal of Economic Asymmetries, 22. https://doi.org/10.1016/j.jeca.2020.e00172
3. Ahmed, J., Tefera, T., & Kas-sie, G. T. (2020). Consumers’ preference and willingness to pay
for enriched snack product traits in Shashamane and Hawassa cities, Ethiopia. Agricultural and Food Economics, 8(1). https://doi.org/10.1186/s40100-020-00157-1
4. Bafna, P. B., & Saini, J. R. (2021). On readability metrics of goal statements of universities and brand-promoting lexicons for industries. Advances in Intelligent Systems and Computing, 1174, 63-72. https://doi.org/10.1007/978-981-15-5616-6_5
5. Barbosa, A. A. L., de Mou-ra, J. A., & de Medeiros, D. D. (2021). Positioning of design elements on the packaging of frozen convenience food and consumers’ levels of attention: An experiment using pizza boxes. Food Quality and Preference,
87. https://doi.org/10.1016/j.
foodqual.2020.104044
6. Batra, R., & Homer, P. M.
(2004). The situational impact
of brand image beliefs. Journal
of Consumer Psychology, 14(3),
318-330. https://doi.org/10.1207/
s15327663jcp1403_12
7. Belton, P. (2017). Competitive
Strategy: Techniques for
Analyzing Industries and
Competitors. In Competitive
Strategy: Techniques for
Analyzing Industries and
Competitors. https://doi.
org/10.4324/9781912281060
8. Berman, B. R., & Evans, J. R.
(2007). Retail management: A
strategic approach (10th ed.).
Person Prentice Hall.
139
Innovative Marketing, Volume 17, Issue 1, 2021
http://dx.doi.org/10.21511/im.17(1).2021.11
9. Benton, W. C., Prahinski, C., &
Fan, Y. (2020). The influence of
supplier development programs
on supplier performance.
International Journal of Production
Economics, 230. https://doi.
org/10.1016/j.ijpe.2020.107793
10. Bozzi, C., Neves, M., &
Mont’Alvão, C. (2021). An
exploratory approach towards
fashion e-tail. Advances in
Intelligent Systems and Computing,
1253 AISC, 49-55. https://doi.
org/10.1007/978-3-030-55307-4_8
11. Bukhari, S. S. (2011). Green
marketing and its impact on
consumer behavior. European
Journal of Business and
Management, 3(4), 375-384.
https://doi.org/10.1007/978-1-
349-13877-7_20
12. Calvo-Porral, C., & J.-P.Lév-
y-Mangin. (2015). Smooth
operators? Drivers of customer
satisfaction and switching
behavior in virtual and traditional
mobile services. Revista Española
de Investigación de Marketing
ESIC, 19, 124-138. https://doi.
org/10.1016/j.reimke.2015.03.001
13. Cai, H., Wei, X., Wu, F., Gu, Y., &
Zhang, N. (2021). Express delivery
services customer satisfaction
based on PLS_SEM. Advances in
Intelligent Systems and Computing,
1233 AISC, 112-116. https://doi.
org/10.1007/978-3-030-51431-
0_17
14. Cai, H., Wei, X., Gu, Y., & Wu,
F. (2021). Customer satisfaction
evaluation of airline based on
PLS_SEM. Advances in Intelligent
Systems and Computing, 1234
AISC, 667-671. https://doi.
org/10.1007/978-3-030-51556-
0_99
15. Chan, C. C. H., Cheng, C. B., &
Hsien, W. C. (2011). Pricing
and promotion strategies of an
online shop based on customer
segmentation and multiple
objective decision making.
Expert Systems with Applications,
38(12), 14585-14591. https://doi.
org/10.1016/j.eswa.2011.05.024
16. Cakanlar, A., & Nguyen, T.
(2019). The influence of culture
on impulse buying. Journal of
Consumer Marketing. https://doi.org/ 10.1108/JCM-03-2017-2139
17. Chegini, F., Molan, S. B., & Kasha-nifar, S. S. (2016). An examination of the impact of cultural values on brand preferences in Tehran’s fashion market. Procedia Economics and Finance, 36(16), 189-200. https://doi.org/10.1016/s2212-5671(16)30030-2
18. Chen, M., Chen, J., & Zheng, H. (2021). A study on the impact of apparel industry product image on customer purchase intention. Advances in Intelligent Systems and Computing, 1191 AISC, 301-314. https://doi.org/10.1007/978-3-030-49889-4_25
19. Cicatiello, C. (2020). Alternative food shoppers and the “quantity dilemma”: a study on the determinants of their purchases at alternative markets. Agricultural and Food Economics, 8(1). https://doi.org/10.1186/s40100-020-00160-6
20. Engell, J. F., Blackwell, R. D., & Miniard, P. W. (1995). Consumer behavior (8th ed.). Dryden Press.
21. Fahfouh, A., Riffi, J., Adnane Mahraz, M., Yahyaouy, A., & Tairi, H. (2020). PV-DAE: A hybrid model for deceptive opinion spam based on neural network architectures. Expert Systems with Applications, 157. https://doi.org/10.1016/j.eswa.2020.113517
22. Foscht, T., Maloles, C., Bernhard, I. I. I., Dirk, S., Indrajit, M., Foscht, T., & Iii, C. M. (2008). The impact of culture on brand perceptions: a six-nation study. https://doi.org/10.1108/10610420810875052
23. Gidlöf, K., Ares, G., Asche-mann-Witzel, J., & Otter-bring, T. (2021). Give us today our daily bread: The effect of hunger on consumers’ visual attention towards bread and the role of time orientation. Food Quality and Preference, 88. https://doi.org/10.1016/j.foodqual.2020.104079
24. Hair, J. F., William, C. B., Babin, B. J., & Anderson, R. E. (2014). Multivariate data analysis (7th ed.). Pearson Education Limited.
25. Hendalianpour, A. (2020).
Optimal lot-size and price of
perishable goods: A novel game-
theoretic model using double
interval grey numbers. Computers
and Industrial Engineering,
149. https://doi.org/10.1016/j.
cie.2020.106780
26. Hofstede, G. (1983). National
cultures in four dimensions:
A research-based theory of
cultural differences among
nations. International Studies of
Management & Organization, 13(1-
2), 46-74. https://doi.org/10.1080/0
0208825.1983.11656358
27. Hustić, I., & Gregurec, I. (2015).
The influence of price on customer’ s
purchase decision. Retrieved from
http://archive.ceciis.foi.hr/app/
public/conferences/1/ceciis2015/
papers/754.pdf
28. Israfilova, E., Arslan, A., Yildirim,
N., & Kaya, T. (2021). Influencer
identification system design using
machine learning techniques.
Advances in Intelligent Systems and
Computing, 1197 AISC, 1092-1099.
https://doi.org/10.1007/978-3-030-
51156-2_127
29. Jogulu, U. D., & Pansiri, J.
(2011). Mixed methods: A
research design for management
doctoral dissertations.
Management Research Review,
34(6), 687-701. https://doi.
org/10.1108/01409171111136211
30. Johansson, J. K. (2012). Global
marketing: Research on foreign
entry, local marketing, global
management. In Handbook
of Marketing. https://doi.
org/10.4135/9781848608283.n19
31. Johnson, K. A. (2021). God...
Karma, Jinn, spirits, and other
metaphysical forces. Current
Opinion in Psychology, 40, 10-14.
https://doi.org/10.1016/j.co-
psyc.2020.08.001
32. Karadagli, F., Theofanidis, F., &
Eren, B. (2021). Consumers’
evaluation of flushable products
with respect to post-disposal effects
in wastewater infrastructures.
Journal of Cleaner Production,
278. https://doi.org/10.1016/j.
jclepro.2020.123680
140
Innovative Marketing, Volume 17, Issue 1, 2021
http://dx.doi.org/10.21511/im.17(1).2021.11
33. Kotler, P., & Armstrong, G. (2018). Principles of marketing (17th ed.). Pearson Education Limited.
34. Kotler, P., & Keller, K. L. (2012). Marketing management (14th ed.). Prentice Hall.
35. Kuno, E. (1976). Multi-stage sampling for population estimation. Res Popul Ecol, 18, 39-56. Retrieved from https://link.springer.com/article/10.1007%2FBF02754081
36. Lee, C. J. (2014). Effects of sport mega-events on city brand awareness and image: Using the 2009 world games in Kaohsiung as an example. Quality and Quantity, 48(3), 1243-1256. https://doi.org/10.1007/s11135-013-9832-6
37. Liu, C. H. (2020). Integration of different perspectives of culinary brand equity. Journal of Hospitality and Tourism Management, 45, 152-161. https://doi.org/10.1016/j.jhtm.2020.08.007
38. Malhotra, N. K., & Birks, D. F. (2007). Marketing research: An applied approach (3rd European ed.) (pp. 835). Pearson Education.
39. Naeem, M. (2021). Do social media platforms develop consumer panic buying during the fear of covid-19 pandemic. Journal of Retailing and Consumer Services, 58. https://doi.org/10.1016/j.jret-conser.2020.102226
40. Nasse, T. B., Ouédraogo, A., & Sall, F. D. (2019). Religiosity and consumer behavior in developing countries: An exploratory study on Muslims in the context of Burkina Faso. African Journal of Business Management, 13(4), 116-127. Retrieved from https://aca-demicjournals.org/journal/AJBM/article-abstract/B16088460093
41. Neumann, R., & Mehlkop, G. (2020). Framing electricity plan choices to enhance green energy usage: A choice experiment with panel data from Germany. Energy Research and Social Science, 70. https://doi.org/10.1016/j.erss.2020.101741
42. Ng, S., & Lee, A.Y. (Eds) (2015). Handbook of Culture and Consumer Behavior, Oxford University Press, Oxford.
43. Nilasari, I., & Saudi, M. H. M. (2019). Do product features and brand image influence consumers’ decision to purchase the Suzuki Ignis in Bandung Indonesia? International Journal of Innovation, Creativity and Change, 6(6), 256-267. Retrieved from https://www.semantic-scholar.org/paper/Do-Product-Features-and-Brand-Image-Influence-to-in-Nilasaria-Saudib/badf3c28c4d7f907075734fb3e-b19ebeaa3a7e28
44. Onigbinde, O. I., & Odunlami, S. A. (2015). The influence of brand image and promotional mix on consumer buying decision-a study of beverage consumers in Lagos State, Nigeria. British Journal of Marketing Studies, 3(4), 97-109. Retrieved from http://www.eajournals.org/wp-content/uploads/The-Influence-of-Brand-Image-and-Promotional-Mix-on-Consumer-Buying-Decision-A-Study-of-Beverage-Consumers-in-Lagos-State-Nigeria.pdf
45. Ozkara, B. Y., & Bagozzi, R. (2021). The use of event related potentials brain methods in the study of conscious and unconscious consumer decision making processes. Journal of Retailing and Consumer Services, 58. https://doi.org/10.1016/j.jretcon-ser.2020.102202
46. Pansiri, J., & Mmereki, R. N. (2010). Using the servqual model to evaluate the impact of public service reforms in the provision of primary health care in Botswana. Journal of African Business, 11(2), 219-234. https://doi.org/10.1080/15228916.2010.509005
47. Park, C.W., Jaworski, B. J., & Maclnnis, D. J. (1986). Strategic brand image-concept management. Journal of marketing, 50(4), 135-145. https://doi.org/10.1177%2F002224298605000401
48. Prabowo, B., Rochmatulaili, E., Rusdiyanto, & Sulistyowati, E. (2020). Corporate governance and its impact in company’s stock price: case study [Gobernabilidad corporativa y su impacto en el precio de las acciones de las empresas: Estudio de caso]. Utopia y Praxis Latinoamericana,
25(Extra10), 187-196. https://doi.org/10.5281/zenodo.4155459
49. Richard, Heryadi, Y., Lukas, & Trisetyarso, A. (2021). Leverage from blockchain in commodity exchange: Asset-backed token with ethereum blockchain network and smart contract. Smart Innovation, Systems and Technologies, 182, 301-309. https://doi.org/10.1007/978-981-15-5224-3_29
50. Rusdiyanto, Hidayat, W., Tjaraka, H., Septiarini, D. F., Fayanni, Y., Utari, W., Waras, Indrawati, M., Susanto, H., Tjahjo, J. D. W., Zainal, M., & Imanawati, Z. (2020). The effect of earning per share, debt to equity ratio and return on assets on stock prices: Case study Indonesian. Academy of Entrepreneurship Journal, 26(2), 1-10. Retrieved from https://www.abacademies.org/articles/the-effect-of-earning-per-share-debt-to-equity-ratio-and-return-on-assets-on-stock-prices-case-study-indonesian-9163.html
51. Ryu, S. (2020). Online luxury goods with price discount or onsite luxury goods with luxury services: Role of situation-specific thinking styles and socio-demographics. Journal of Retailing and Consumer Services, 57. https://doi.org/10.1016/j.jretcon-ser.2020.102253
52. Sedikides, C., & Gebauer, J. E. (2021). Do religious people self-enhance? Current Opinion in Psychology, 40, 29-33. https://doi.org/10.1016/j.copsyc.2020.08.002
53. Serrao, P., & Botelho, D. (2008). Effect of brand extension on brand image: A study in the Brazilian context. Latin American Advances in Consumer Research, 2. Retrieved from https://www.acrwebsite.org/volumes/14070/la/v2_pdf/LA-02
54. Shamma, H. M., & Hassan, S. S. (2011). Impact of CSR perception on brand image, brand attitude and buying willingness: A study of a global cafe. International Journal of Marketing Studies, 6(6). https://doi.org/10.5539/ijms.v6n6p43
55. Shoham, A., Gavish, Y., & Segev, S. (2015). A cross-cultural analysis of
141
Innovative Marketing, Volume 17, Issue 1, 2021
http://dx.doi.org/10.21511/im.17(1).2021.11
Impulsive and compulsive buying behaviors among Israeli and US consumers; the influence of personal traits and cultural values. Journal of International Consumer Marketing, 27(3), 187-206. https://doi.org/10.1080/08961530.2014.1000507
56. Sudaryanto, S., Subagio, N. A., Awaliyah, I. N., Wulandari, D., & Hanim, A. (2019). Influence of brand image, price and promotion on consumer’s buying decision of fast moving consumer’s goods with culture as a moderating variable in basmallah retail store in Indonesia. International Journal of Scientific and Technology Research, 8(3). Retrieved from http://www.ijstr.org/final-print/mar2019/Influence-Of-Brand-Image-Price-And-Promotion-On-Consumers-Buying-Decision-Of-Fast-Moving-Consumers-Goods-With-Culture-As-A-Moderating-Variable-In-Basmallah-Retail-Store-In-Indonesia.pdf
57. Sudaryanto, S. (2015). Brand leverage strategy throughout sport championship and amusement: The case of Banyuwangi festival 2013. Procedia – Social and Behavioral Sciences, 211, 1171-1178. https://doi.org/10.1016/j.sbspro.2015.11.156
58. Sudaryanto, S., Hanim, A., & Utari, W. (2020). Behaviour on repurchase intention in a Moslem ethnic store in Indonesia. In International Journal of Innovation, Creativity and Change. Retrieved from https://www.ijicc.net/images/vol_13/Iss_12/131257_Sudaryanto_2020_E_R.pdf
59. Sundararaj, V., & Rejeesh, M. R. (2021). A detailed behavioral analysis on consumer and customer changing behavior with respect to social networking sites. Journal of Retailing and Consumer Services, 58. https://doi.org/10.1016/j.jretcon-ser.2020.102190
60. Syafii, M., Ulum, B., Rusdiyanto, Suparman, P., Rahayu, D. I., & Syasindy, N. B. (2020). The effect of financial performance on the company’s share price: A case study Indonesian. European Journal of Molecular and Clinical
Medicine, 7(8), 1055-1071.
Retrieved from https://www.sco-
pus.com/inward/record.uri?eid=2-
s2.0-85098454552&partnerID=40
&md5=10d4ddcf32dd4bf918ba36
22c11e86dd
61. Vinish, P., Pinto, Prakash,
Hawaldar, Iqbal Thonse, Pinto,
Slima. (2021). Impulse buying
behavior among female shoppers:
Exploring the effects of selected
store environment elements.
Innovative Marketing, 16(2), 54-
70. http://dx.doi.org/10.21511/
im.16(2).2020.05
62. Wang, L., Morabito, M., Payne,
C. T., & Robinson, G. (2020).
Identifying institutional barriers
and policy implications for
sustainable energy technology
adoption among large
organizations in California.
Energy Policy, 146. https://doi.
org/10.1016/j.enpol.2020.111768
63. Wang, T., Wu, P., Ge, Q., &
Ning, Z. (2021). Ticket prices
and revenue levels of tourist
attractions in China: Spatial
differentiation between prefectural
units. Tourism Management, 83.
https://doi.org/10.1016/j.tour-
man.2020.104214
64. White, C. J., Baimel, A., &
Norenzayan, A. (2021). How
cultural learning and cognitive
biases shape religious beliefs.
Current Opinion in Psychology, 40,
34-39. https://doi.org/10.1016/j.
copsyc.2020.07.033
65. Yang, Y., Zhang, H., & Chen, X.
(2020). Coronavirus pandemic
and tourism: Dynamic stochastic
general equilibrium modeling
of infectious disease outbreak.
Annals of Tourism Research,
February, 102913. https://doi.
org/10.1016/j.annals.2020.102913
66. Zhang, L. L., Gang, D. U., Jun, W.
U., & Yujie, M. A. (2020). Joint
production planning, pricing and
retailer selection with emission
control based on Stackelberg game
and nested genetic algorithm.
Expert Systems with Applications,
161. https://doi.org/10.1016/j.
eswa.2020.113733
67. Zhao, W. (2020). Preface. In
ACM International Conference
Proceeding Series. https://doi.org/10.4337/9781784715960.00004
68. Zhao, Z., Jiang, J., & Wang, F. (2021). An economic analysis of twenty light olefin production pathways. Journal of Energy Chemistry, 56, 193-202. https://doi.org/10.1016/j.jechem.2020.04.021
69. Zielke, S. (2006). Measurement of retailers’ price images with a multiple-item scale. The International Review of Retail Distribution and Consumer Research, 16(3), 297-316. https://doi.org/10.1080/09593960600696990
142
Innovative Marketing, Volume 17, Issue 1, 2021
http://dx.doi.org/10.21511/im.17(1).2021.11
APPENDIX A
Table A1. Validity and reliability test result
Variable Items rtable
rstatistic Sig (p-value) Result Cronbach’s Alpha Result
Culture (X1)
X1.1
0.184 0.899 0.000 Valid
X1.2
0.184 0.861 0.000 Valid
X1.3
0.184 0.865 0.000 Valid
X1.4
0. 184 0.900 0.000 Valid 0.930 ReliableX
1.50. 184 0.866 0.000 Valid
Brand image (X2)
X2.1
0. 184 0.811 0.000 Valid
X2.2
0. 184 0.867 0.000 Valid
X2.3
0. 184 0.823 0.000 Valid 0.781 Reliable
Price (X3)
X3.1
0. 184 0.829 0.000 Valid
X3.2
0. 184 0.887 0.000 Valid
X3.3
0. 184 0.881 0.000 Valid 0.833 Reliable
Buying decision (Y)
Y.1
0. 184 0.873 0.000 Valid
Y.2
0. 184 0.925 0.000 Valid
Y.3
0. 184 0.862 0.000 Valid 0.864 Reliable
APPENDIX B
Table B1. Multiple linear regression result
Variables entered/removeda
Model Variables entered Variables removed Method
1Zscore(X3R), Zscore(X2R),
Zscore(X1R)b Enter
Note: a. Dependent Vvariable: Zscore(YR). b. All requested variables entered.
Model summary
Model R R square Adjusted R square Std. error of the estimate1 .870a .758 .751 .49898641
Note: a. Predictors: (Constant), Zscore(X3R), Zscore(X2R), Zscore(X1R).
ANOVAa
Model Sum of squares df Mean square F Sig.
1
Regression 84.109 3 28.036 112.602 .000b
Residual 26.891 108 .249
Total 111.000 111
Note: a. Dependent variable: Zscore(YR). b. Predictors: (Constant), Zscore(X3R), Zscore(X2R), Zscore(X1R).
Coefficientsa
Model
B
Unstandardized coefficients Standardized coefficientst Sig.
Std. Error Beta
1
(Constant) –4.147E-15 .047 .000 1.000
Zscore(X1R) .265 .114 .265 2.318 .022
Zscore(X2R) .281 .114 .281 2.470 .015
Zscore(X3R) .364 .103 .364 3.535 .001
Note: a. Dependent variable: Zscore(YR).