Embed Size (px)
Citation preview

ISSN(E):2522-2260
ISSN(P):2522-2252
Impact of Credit Constraints on Firms
Growth: A Case Study of
Manufacturing Sector of Pakistan
Author(s)
Mughees Tahir Bhalli1
Shahid Mansoor Hashmi2
Arslan Majeed3
Affiliations 1Department of Economics, University of Tasmania, Australia 2NIBAF, State Bank of Pakistan, Pakistan 3Concordia Colleges, Pakistan
Manuscript Information
Citation in APA Style
Bhalli, M. T., Hashmi, S. M., & Majeed, A. (2017). Impact of
Credit Constraints on Firms Growth: A Case Study of
Manufacturing Sector of Pakistan. Journal of Quantitative
Methods 1(1), 4-40
This manuscript contains references to 28 other manuscripts.
The online version of this manuscript is available at
http://journals.umt.edu.pk/sbe/jqm/volume1issue1.aspx
DOI: 10.29145/2017/jqm/010102
Additional Information
Subscriptions / Email Alert: [email protected]
For further information, please visit
http://journals.umt.edu.pk/sbe/jqm/Home.aspx
Published by
Department of Quantitative
Methods
University of Management and
Technology, Lahore, Pakistan
This manuscript has been published
under the terms of Creative Commons
Attribution-ShareAlike 4.0 International License (CC-BY SA). JQM under this
license lets others distribute, remix,
tweak, and build upon the work it publishes, even commercially, as long as
the authors of the original work are
credited for the original creation and the contributions are distributed under the
same license as original.
Impact of Credit Constraints on Firms Growth 4
Journal of Quantitative Methods Volume 1(1): 2017
Impact of Credit Constraints on Firms Growth:
A Case Study of Manufacturing Sector of Pakistan
Mughees Tahir Bhalli1
Shahid Mansoor Hashmi2
Arslan Majeed3
https://10.29145/2017/jqm/010102
Abstract
This study explores the impact of credit constraint on growth
by using firm level data of manufacturing sector of Pakistan
for the period of 1974-2010 analyzing via Generalized Method
of Moments (1991) one step and two step estimation
technique. Result of full sample shows that the firms in
manufacturing sector for the period from 1974-2010 are not
facing external financial constraints and the effect of sale to
capital ratio indicates the availability of investment
opportunities for the firms in the manufacturing sector of
Pakistan. The results for pre and post financial sector reform
era shows that firms are facing tight external financial
constraints in pre financial reform era as compared to post
financial reform era. Results show that growth of firms having
small assets is constrained by internal finance whereas firms
having medium and large assets are not constrained by
internal finance. Similarly, firms’ growth that is less
dependent on debt finance is constrained by internal finance
whereas results for the firms that are moderately and highly
aggressive in financing with debt indicate that the growth of
firms belonging to these groups is not constrained by internal
finance. Similarly, low dividend paying firms growth is
constrained by internal finance whereas high dividend paying
firms’ growth is not constrained by internal finance.
Keywords: Manufacturing Sector, Credit, Investment, Growth,
GMM
1Mughees Tahir Bhalli , PhD Scholar, Department of Economics, University of
Tasmania, Australia, [email protected] 2Shahid Mansoor Hashmi, Senior Joint Director, NIBAF, State Bank of
Pakistan, Pakistan 3Lecturer Economics, Concordia Colleges, Pakistan
Impact of Credit Constraints on Firms Growth 5
Journal of Quantitative Methods Volume 1(1): 2017
1. Introduction
Economic growth has always been the central focus of many
researchers. Complex econometric modeling was introduced from
the past and is still valid to unfold the aspects which are directly or
indirectly linked to the economic growth phenomena. Economic
growth and development of a country is dependent on the growth
of various sectors operating within the economy. One of the most
important sectors in this perspective is manufacturing sector,
whose growth and investment is linked with the overall economic
growth. So, by keeping in view these important linkages, it is
important to focus on the factors that affect the business growth in
an economy.
Investment and growth of firms in an economy are of vital
importance. Pioneer works in this regard were conducted by
Bernanke (1998), Bond and Meghir (1994), Fazzari, Hubbard,
Glenn and Petersen (1998). They investigated the investment
behavior of firms for the empirical evidence of credit constraint
and developed the dynamic equilibrium model which incorporates
credit market frictions in the business cycle fluctuations. Their
works broaden the depth and diversity of work in this meadow.
Asymmetric information causes agency cost1 due to which
investment of the firms is hampered (Stein, 2003) and firms have
to rely on internally generated funds for financing available
investment opportunities.
Recent literature shows a lot of hindering factors in the
growth path of businesses in an economy. Firms themselves report
a lot of hurdles in their growth path but all these reported factors
are not equally constraining the growth of the firms. Some of these
factors directly hold back the growth and some indirectly create
hindrance in firms’ growth path. Most important hindering factors
for firms’ growth are related to finance, crime and political
instability (Ayygagri, Demirguc-Kunt, & Maksimovic, 2008).
The theory which points out positive relation between
financial growth and economic development (Schumpeter, 1911)
was verified by a lot of researcher’s up till now. This phenomenon

Impact of Credit Constraints on Firms Growth 6
Journal of Quantitative Methods Volume 1(1): 2017
also works at the micro level where firms need finance to grow
either by generating it internally or by going for external sources of
finance by considering the financial policy of the firm. Firms
finance their investment projects by using various sources of
finance. These sources include debt, equity and cash flow.
In other words, firms finance their investment
opportunities either by using external finance or by internally
generated funds. The provision of finance from the external
sources (banks and capital market) depend on firms’
characteristics’ i.e. financial performance, risk involved and asset
base of firms because of the risk averse nature of financial
institutions. Access to external finance and its cost is an important
hindering constraint for the growth of firms.2.
Financial market in
Pakistan is not perfect; because of this finance is a major hurdle in
the growth of firms in Pakistan (Ahmed & Naveed, 2011). Size
and other characteristics were also found to be important
determinants for the financial access in Pakistan.3
Literature in case of Pakistan focuses on the capital
structure of firms by using five to ten years of the data and tries to
find out the optimal capital structure for the firms or attempt is
made by dividing firms into constraint and non-constraint on the
basis of cash flow volatility.4 Some of the work is done by
incorporating the size and age in the investment model to access
their impact on investment behavior. Literature on growth of firms
in the context of credit constraint is not explored much.5 This study
tries to fill this gap in case of Pakistan by using firm level data of
publicly listed firms in the manufacturing sector ranging from
1974 -2010.
First of all, models for the full sample of firms for the period
from 1974 to 2010 are estimated.6 Secondly, the sample is further
divided in to the 1974-1990 and 1991-2010 periods that help to
analyze the degree of credit constraint in pre financial sector
reform and post financial sector reform period respectively.7
Thirdly, sample is divided into textile cotton, textile synthetic,
sugar, chemical, engineering and cement industries for analyzing
the impact of credit constraint growth in different industries.

Impact of Credit Constraints on Firms Growth 7
Journal of Quantitative Methods Volume 1(1): 2017
Lastly, this study divides the firms into three classes; low, medium
and large on the basis of total assets, debt to equity ratio and
dividend to equity ratio to access the sensitivity of credit
constraint.
2. Literature Review
2.1. Credit Constraint and Firms’ Growth
Financial constraints have different impact on the growth of firms
belonging to different groups. This division is done on the basis of
different characteristics of the firms. This section explains the
literature in context of credit constraint and growth of firms. By
classifying the firms into small and large on the basis of
employees, Becchetti and Trovato (2002) estimate a sample of
small Italian firms having employees between 5-10. Their results
show that small and younger firms have the potential to grow and
if they are financed by the external finance or having easy access
to the external finance they can grow more rapidly. But the hurdle
to their growth is the lack of access to external finance.
Subsidies provided by the state to firms have a positive
impact on the growth of firms and these firms grow faster as
compared to those which are not under the umbrella of subsidies
(Becchetti & Trovato, 2002; Hyytinen & Toivanen, 2005).
Becchetti and Trovato (2002) by estimating the firm level data
from Finland finds the impact of public policy on growth and
innovation of the firms. Financial constraints have strong adverse
effect on the growth and innovation of firms (Hyytinen &
Toivanen, 2005). Innovation is also correlated to the growth of the
firms i.e. if the firms have made innovation in the production
technology then the firms grow more rapidly. One of their most
important finding is that of the impact of the public policy on the
growth and innovation of the firms. Government funding to the
firms which rely on the external finance improves firms’ growth
and innovation activities (Hyytinen & Toivanen, 2005).
Beck, Demirguc, and Maksimovic (2005) by using a survey
based firm level dataset from 54 countries report the major

Impact of Credit Constraints on Firms Growth 8
Journal of Quantitative Methods Volume 1(1): 2017
constraints which the firms face in their path of growth. Credit
constraint is one of the important hurdles in growth of small and
medium sized firms (Beck et al., 2005). It is very interesting to see
that in spite of the not proper functioning of the financial system in
China its economy is growing faster. Because firms in China are
highly profitable, that’s why they are able to finance their
investment through the retained earnings, so the internal finance
push their growth to move forward (Guariglia, Liu, & Song, 2008).
Ownership characteristics of the firms also have an impact on the
intensity of credit constraint to the growth of firms i.e. foreign
firms are not much credit constraint as compared to that of the
domestically private owned firms.
Growth of the state owned firms is not constraint by the
internal finance because state owned firms despite of the profit
have different other political and welfare motives because of this
they can easily get finance from the financial institutions whereas
growth of the privately owned firms is affected by the internal
finance (Guariglia et al., 2008).
Growth of the privately owned firms is stunning and it is
surrogated by internal finance while state owned firms have to
response to the economic and political objectives due to which
they are less dependent on the internal finance (Bai, Lu, & Tao,
2005). On the other hand, privately owned firms don’t have too
much access to that of the external finance because of many
hurdles to their path like collateral, taxation and the most important
is asymmetric information problem. Banks consider them risky as
compared to that of the state owned enterprises (Guariglia et al.,
2008; Héricourt & Poncet, 2009).
Impact of different sources of finance on the growth of the
Spanish manufacturing firms indicates that small and new firms
have low growth rates when they enter in the business. Because of
their less access to the external finance, they heavily relay on the
cash flow and short term debts. Therefore, they are more sensitive
to that of the cash flow and short term debts while on the other
hand firms which are old and have high growth rates are more
Impact of Credit Constraints on Firms Growth 9
Journal of Quantitative Methods Volume 1(1): 2017
sensitive to that of the long term debt (Guariglia et al., 2008;
Segarra & Teruel, 2009).
External finance is of vital importance for firms’ growth
because firm uses some of its portions in research and development
activities which have positive effect on the growth of the firms. It
is also witnessed that with the increase in firm size and age, their
access to the external finance also increases (Moreno-Badia &
Slootmaekers, 2009). Access to external finance has a positive
effect on the growth of the firms (Musso & Schiavo, 2008). Musso
and Schiavo (2008), estimated panel data on French manufacturing
firms for the period of 1996-2004. Their findings show that,
because of financing constraints, newly entered firms face
difficulties in accessing the external finance due to which
probability of leaving the market increases. Financial constraint is
positively correlated to that of the productivity of the firms in the
short-run (Musso & Schiavo, 2008).
In survey of over 6,000 firms in 1992, Binks and Ennew
(1996) found that lack of access to finance is one of the major
hurdles in path of the firms’ growth and one of the important
causes of this problem is the asymmetric information whose roots
are in the imperfect capital markets. Banks and other financial
institutions do not have complete or perfect information about the
firms due to which problems of asymmetric information arises.
Younger firms which have much potential to grow face hard credit
rationing while this can be eliminated by developing linkages with
financial institutions and markets (Binks & Ennew, 1996). In short,
younger and less profitable firms are more credit constraint as
compared to that of their counterpart. Due to the imperfect capital
market in the developing countries smaller firms are much more
credit constrained as compared to their bigger and older
counterparts. The firm’s growth is affected by the credit
constrained; smaller firms are more affected as compared to the
bigger firms (Oliveira & Fortunato, 2006).
Impact of Credit Constraints on Firms Growth 10
Journal of Quantitative Methods Volume 1(1): 2017
The impact of credit constraint on the growth of firms is
different in transitional economies as compared to that of the
developed economies. Hutchinson and Xavier (2006) compared the
transitional with well-established economy and catch the impact of
financial constraints on the growth of firms in transitional
economy (Slovenia) and the established economy (Belgium). The
firms in the transition economy like Slovenia are more credit
constraint and the growth of the firms in this economy is much
more affected as compared to that of the firms in the established
market. So the growth of smaller firms in Slovenia relay on the
internal cash. Overall findings of the literature show that most
affected firms from the financial constraints are medium and small
sized firms. This issue mostly occurs in the economies where the
capital markets are not developed. Growth behavior of the firms is
also found to be effected by the abrupt polices’ shift in the
economy (Hutchinson & Xavier, 2006).
2.2. Credit Constraint: An Impediment to Growth
Carpenter and Petersen (2002) presented the internal finance
theory of growth to show the bred effect of financial constraint on
the firms’ growth. As in previous literature, only effects on
investment was explored i.e. the work of S. M. Fazzari, Hubbard,
and Petersen (2000). The main contribution of S. M. Fazzari et al.
(2000) work is introducing the liquidity into the regression to catch
the impact of credit constraint on firms’ growth.
The major and widely discussed impediment to the growth
of firms in the developing countries is credit. In the developing
countries firms have lack of access to external finance especially
smaller and younger firms (Ahmed & Naveed, 2011) along with
that the availability and cost of finance is also a hurdle which is
important to put firms on the track of growth (Binks & Ennew,
1996). Carpenter and Petersen (2002) put a milestone in this era by
estimating a panel of 1600 small manufacturing UK firms and they
find that the growth of the small firms in the UK are credit
constrained. In other words we can say that the growth of the
smaller firms in the UK is much more dependent on the internal
finance. Foreign firms are not credit constraint because of their

Impact of Credit Constraints on Firms Growth 11
Journal of Quantitative Methods Volume 1(1): 2017
easy access to the external market as compared to domestically
owned firms because domestically owned local firms are usually
small. Therefore, foreign firms are not much relying on the internal
finance for their growth they will go for the external financial
market for financing the potential investment opportunities are
available to them (Hutchinson & Xavier, 2006).
Firms’ growth has much importance not only for the
individual owners of the firms but also if one will look at them as a
whole in the economy because the aggregate growth of all these
firms in the economy is correlated with the overall growth of the
economy. From that prospective it is important for the researchers
and policymakers to have a look on the growth dynamics of the
firms especially to identify the main hindrance to the growth of the
firms.
2.3. Credit Constraint and Firms’ Growth: Theoretical
Model
This section provides the theoretical framework and analytical
model for the empirical investigation of credit constraint and
firms’ growth. In order to develop the theoretical linkages of the
model with these empirical equations, study follows the base work
of Carpenter & Petersen (2002).
2.3.1. Frictions in Financial Market
Credit rationing in a simple way can be defined as the credit
constraints or the limitations in the supply of credit from the
lenders side. Most of the literature available on credit rationing is
focused on the incomplete or asymmetric information between
debtor and lender. For example, a company is going to start a
project and that particular company is aware of complete return
and risk on the project. If company needs finance for availing this
particular project, first option is to finance it through internally
generated funds and if investment is huge and company doesn’t
have enough funds then management will go for an external source
of finance.
Impact of Credit Constraints on Firms Growth 12
Journal of Quantitative Methods Volume 1(1): 2017
Before financing, banks compute the risk of investment for
the whole group of firms i.e. risk of the industry to which the firms
belongs. Usually banks are not completely aware of the real risk of
the project for which the company is demanding finance because
of incomplete information. Financial institutions are risk averse in
nature so they want return which is slightly higher than the return
on the internal finance (cash flow) of the firm. If net returns of
firms increases then the repayment probability8 of debt also
increases. If for instance, banks increase its interest charges then
the returns of the banks might increase while the cost of the firms
on particular project decreases due to which probability of loan
return decreases because firms have to pay more interest due to the
increase in interest expense. Manager tries to go for the riskier
projects9 to get more returns to compensate the high interest
expenses from the banks. This causes moral hazard problem
because of less or incomplete information. So, there exists some
sort of incomplete information between the lenders and borrower
due to which a chock is created between the cost of internal
finance and external finance. This chock is financial expense
which the firms bear for availing the profitable investment
opportunities.
2.3.2. Firms’ Growth and Internal Finance
There is a lot of work on financing constraints and their impact on
the real activity of firms. The central focal of whole literature is the
imperfections in the capital market. Because of imperfection in the
capital market there is a chock between internal and external
finance as we explained above in the theory of credit rationing.
Literature suggests that this chock is due to the asymmetric
information and because of this asymmetric information moral
hazard and adverse selection problem occurs. Broader use of debt
finance is not earmark for firms having little collateral or small
firms. So, these firms are more exposed to that of the asymmetric
information problem whereas larger firms have soft corner to get
loans from the financial institutions because of their large asset
base. The physical asset appears to be signals from firms to
financial institutions for getting loans.
Impact of Credit Constraints on Firms Growth 13
Journal of Quantitative Methods Volume 1(1): 2017
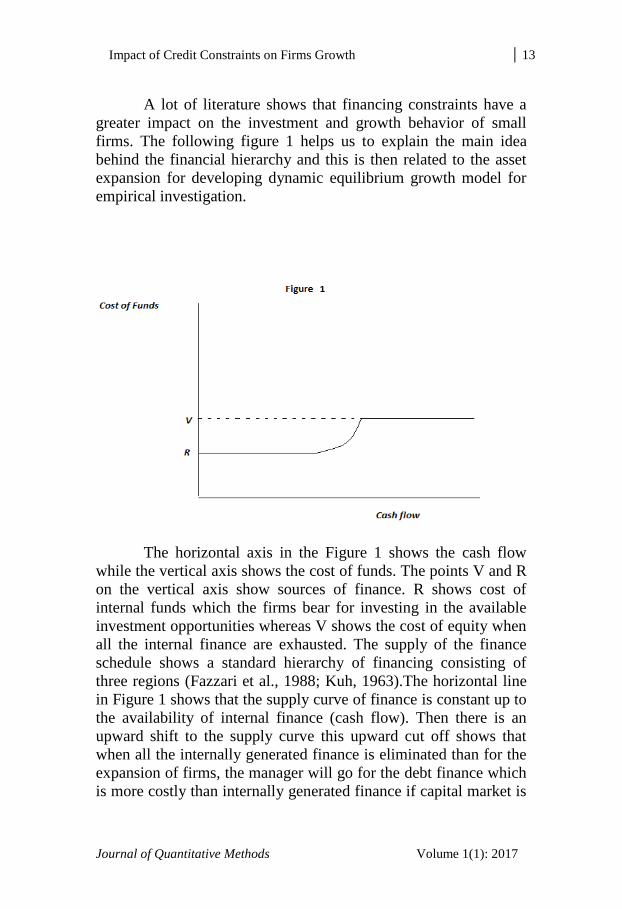
A lot of literature shows that financing constraints have a
greater impact on the investment and growth behavior of small
firms. The following figure 1 helps us to explain the main idea
behind the financial hierarchy and this is then related to the asset
expansion for developing dynamic equilibrium growth model for
empirical investigation.
The horizontal axis in the Figure 1 shows the cash flow
while the vertical axis shows the cost of funds. The points V and R
on the vertical axis show sources of finance. R shows cost of
internal funds which the firms bear for investing in the available
investment opportunities whereas V shows the cost of equity when
all the internal finance are exhausted. The supply of the finance
schedule shows a standard hierarchy of financing consisting of
three regions (Fazzari et al., 1988; Kuh, 1963).The horizontal line
in Figure 1 shows that the supply curve of finance is constant up to
the availability of internal finance (cash flow). Then there is an
upward shift to the supply curve this upward cut off shows that
when all the internally generated finance is eliminated than for the
expansion of firms, the manager will go for the debt finance which
is more costly than internally generated finance if capital market is

Impact of Credit Constraints on Firms Growth 14
Journal of Quantitative Methods Volume 1(1): 2017
imperfect. So, if the firm goes for debt finance the cost of
financing increases which is clearly seen from the upward shift of
the finance supply curve. There are several reasons for this upward
shift in the supply curve. Main reason of this increase in cost is (a)
asymmetric information (b) financial distress and (c) collateral
limits on the firms. The marginal cost of using debt is increasing
because of the increasing financial distress with the increasing use
of debt finance. This increasing use of debt finance increases the
riskiness of the firms. Because of the increase in the financial
distress banks demand more return on their provided debt. Due to
this, marginal cost of debt increases with the use of the extra unit
of debt finance. The next best alternative source of finance for
firms is to issue new shares if potential investment opportunities
are available. This is depicted in figure 1 the supply schedule of
finance by reaching up to certain extent becomes horizontal which
is showing the constant availability and cost on the externally
generated funds by issuing new shares. Because of this shift, a
chock between the cost of Internal and External Finance (V-R) is
created which is shown in the Figure 1.
Now consider the following figure 2 which explains the
demand behavior of firms in the market. This is reflected through
expansion of firms. Marginal revenue expansion here after MRP
(expansion)10
shows the return on the optimally utilized assets and
input used by the firms for production. When revenue increases, it
indicates that the firms are expanding and the return on the assets
increases. MRP (exp) is composed of MPP which is marginal
physical product of the firms which is than multiplied with the
revenue of firms. The following figure 2 explains the expansion
behavior of the small firms’ horizontal axis shows the changes in
assets. When the firms are expanding they will move along the
MRP (exp) schedule while the vertical axis shows the MRP of the
firms.
The horizontal axis in the figure 2 is the representation of
the firms’ asset growth. Now by combining figure 1 and figure 2
we obtained the following Figure 3 which is borrowed from the
work of Carpenter and Petersen (2002) for a better understanding
of the model.

Impact of Credit Constraints on Firms Growth 15
Journal of Quantitative Methods Volume 1(1): 2017
Figure 3 is a combination of both the above explained
Figure 1 and Figure 2. In figure 3 the slight downward moving of
the MRP (exp) is because of the competition which drives the
return towards internal cost of funds.
Impact of Credit Constraints on Firms Growth 16
Journal of Quantitative Methods Volume 1(1): 2017
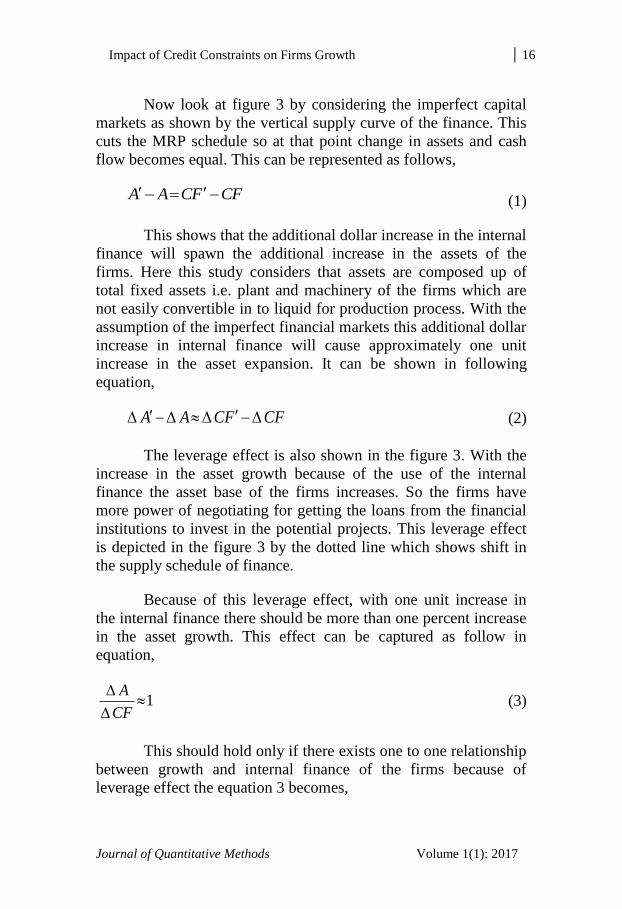
Now look at figure 3 by considering the imperfect capital
markets as shown by the vertical supply curve of the finance. This
cuts the MRP schedule so at that point change in assets and cash
flow becomes equal. This can be represented as follows,
CFFCAA (1)
This shows that the additional dollar increase in the internal
finance will spawn the additional increase in the assets of the
firms. Here this study considers that assets are composed up of
total fixed assets i.e. plant and machinery of the firms which are
not easily convertible in to liquid for production process. With the
assumption of the imperfect financial markets this additional dollar
increase in internal finance will cause approximately one unit
increase in the asset expansion. It can be shown in following
equation,
CFFCAA (2)
The leverage effect is also shown in the figure 3. With the
increase in the asset growth because of the use of the internal
finance the asset base of the firms increases. So the firms have
more power of negotiating for getting the loans from the financial
institutions to invest in the potential projects. This leverage effect
is depicted in the figure 3 by the dotted line which shows shift in
the supply schedule of finance.
Because of this leverage effect, with one unit increase in
the internal finance there should be more than one percent increase
in the asset growth. This effect can be captured as follow in
equation,
1
CF
A (3)
This should hold only if there exists one to one relationship
between growth and internal finance of the firms because of
leverage effect the equation 3 becomes,
Impact of Credit Constraints on Firms Growth 17
Journal of Quantitative Methods Volume 1(1): 2017
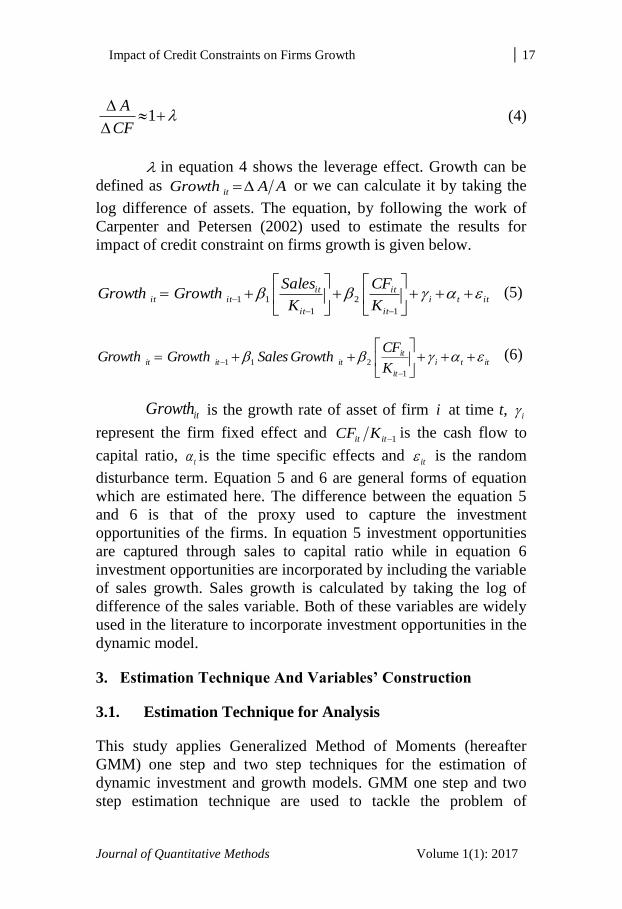
1
CF
A (4)
in equation 4 shows the leverage effect. Growth can be
defined as AAGrowth it or we can calculate it by taking the
log difference of assets. The equation, by following the work of
Carpenter and Petersen (2002) used to estimate the results for
impact of credit constraint on firms growth is given below.
itti
it
it
it
ititit
K
CF
K
SalesGrowthGrowth
1
2
1
11 (5)
itti
it
itititit
K
CFGrowthSalesGrowthGrowth
1
211
(6)
itGrowth is the growth rate of asset of firm i at time t, i
represent the firm fixed effect and 1itit KCF is the cash flow to
capital ratio, t is the time specific effects and
it is the random
disturbance term. Equation 5 and 6 are general forms of equation
which are estimated here. The difference between the equation 5
and 6 is that of the proxy used to capture the investment
opportunities of the firms. In equation 5 investment opportunities
are captured through sales to capital ratio while in equation 6
investment opportunities are incorporated by including the variable
of sales growth. Sales growth is calculated by taking the log of
difference of the sales variable. Both of these variables are widely
used in the literature to incorporate investment opportunities in the
dynamic model.
3. Estimation Technique And Variables’ Construction
3.1. Estimation Technique for Analysis
This study applies Generalized Method of Moments (hereafter
GMM) one step and two step techniques for the estimation of
dynamic investment and growth models. GMM one step and two
step estimation technique are used to tackle the problem of

Impact of Credit Constraints on Firms Growth 18
Journal of Quantitative Methods Volume 1(1): 2017
endogeniety which arises because of the inclusion of lag of
dependent variables and individual effects. The major problem
with the OLS as appeared in the literature is that the estimated
coefficients are not efficient and consistent if the independent
variables are assumed to be endogenous. So, to avoid these
problems, this study estimates the models by using GMM one step
and two step estimation technique. Brief description of estimation
technique is explained below.
3.1.1. Panel Unit Root Test
The problem of unit root leads to the biased results. Problem of
unit root may occur in the panel data because of large cross-
sections and time periods. Before going for further analysis it is
important to detect the existence of unit root in the data. There are
various tests which are used to check the presence of a unit root in
the panel data set.
The starting point of the panel unit root test is whether
there are restrictions on the autoregressive process across the
cross-section or series. Consider the following AR(1) equation for
the panel
ititititiit Xyy 1 (7)
Ni .......3,2,1
Tt ......3,2,1
whereas i represents the cross-sectional units that are
observed over the time series t., itX represents the independent
variables in the model having fixed effect or the individual trends,
while it is the error term assumed to be normal and i represents
the autoregressive coefficients. If 1i then ity is assumed to be
weakly stationary and if 1i then ity contains a unit root.
There are many tests that are used to detect the unit root
like Levin, Lin, and Chu (2002), Im, Pesaran, and Shin (2003),
Maddala and Wu (1999) as the above explained tests differ in
Impact of Credit Constraints on Firms Growth 19
Journal of Quantitative Methods Volume 1(1): 2017
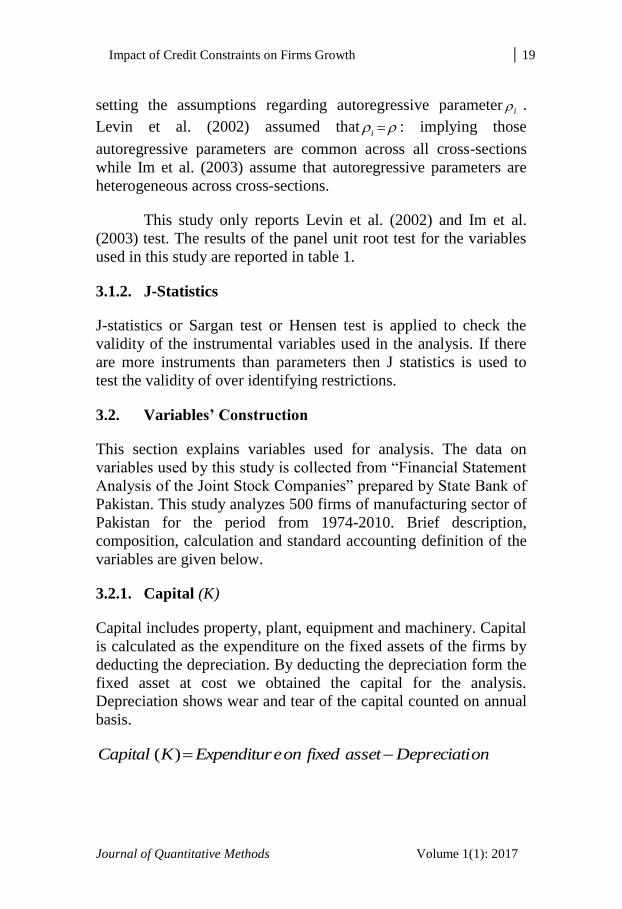
setting the assumptions regarding autoregressive parameter i .
Levin et al. (2002) assumed that i: implying those
autoregressive parameters are common across all cross-sections
while Im et al. (2003) assume that autoregressive parameters are
heterogeneous across cross-sections.
This study only reports Levin et al. (2002) and Im et al.
(2003) test. The results of the panel unit root test for the variables
used in this study are reported in table 1.
3.1.2. J-Statistics
J-statistics or Sargan test or Hensen test is applied to check the
validity of the instrumental variables used in the analysis. If there
are more instruments than parameters then J statistics is used to
test the validity of over identifying restrictions.
3.2. Variables’ Construction
This section explains variables used for analysis. The data on
variables used by this study is collected from “Financial Statement
Analysis of the Joint Stock Companies” prepared by State Bank of
Pakistan. This study analyzes 500 firms of manufacturing sector of
Pakistan for the period from 1974-2010. Brief description,
composition, calculation and standard accounting definition of the
variables are given below.
3.2.1. Capital (K)
Capital includes property, plant, equipment and machinery. Capital
is calculated as the expenditure on the fixed assets of the firms by
deducting the depreciation. By deducting the depreciation form the
fixed asset at cost we obtained the capital for the analysis.
Depreciation shows wear and tear of the capital counted on annual
basis.
onDepreciatiassetfixedoneExpenditurKCapital )(
Impact of Credit Constraints on Firms Growth 20
Journal of Quantitative Methods Volume 1(1): 2017
This is one of the important factors in determining the
performance of firms. By using this in combination of other
variables one can access the performance of the firm in different
ways. Increase in the capital of firms indicates the increase in
production capacity of firms.
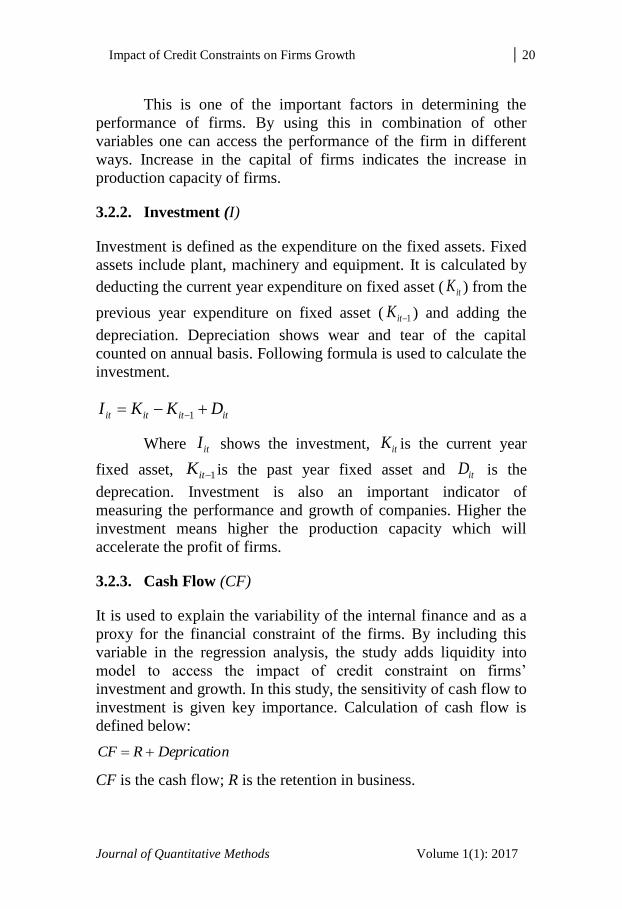
3.2.2. Investment (I)
Investment is defined as the expenditure on the fixed assets. Fixed
assets include plant, machinery and equipment. It is calculated by
deducting the current year expenditure on fixed asset ( itK ) from the
previous year expenditure on fixed asset ( 1itK ) and adding the
depreciation. Depreciation shows wear and tear of the capital
counted on annual basis. Following formula is used to calculate the
investment.
itititit DKKI 1
Where itI shows the investment, itK is the current year
fixed asset, 1itK is the past year fixed asset and itD is the
deprecation. Investment is also an important indicator of
measuring the performance and growth of companies. Higher the
investment means higher the production capacity which will
accelerate the profit of firms.
3.2.3. Cash Flow (CF)
It is used to explain the variability of the internal finance and as a
proxy for the financial constraint of the firms. By including this
variable in the regression analysis, the study adds liquidity into
model to access the impact of credit constraint on firms’
investment and growth. In this study, the sensitivity of cash flow to
investment is given key importance. Calculation of cash flow is
defined below:
nDepricatioRCF
CF is the cash flow; R is the retention in business.
Impact of Credit Constraints on Firms Growth 21
Journal of Quantitative Methods Volume 1(1): 2017
Retention in the business is obtained after deducting tax
provision and dividends from the income. Cash flow is of vital
importance for the firms. Higher cash flow indicates that high
internal finance generated by firms which can be used as a source
of investment for the potential investment opportunities. In the
financing hierarchy, cash flow is the cheapest source available for
the investment. Huge literature use cash flow for assessing that
either the firms are financially constrained or not through
investment-cash flow sensitivity.
3.2.4. Sales (S)
This variable is of significant importance for the firms. This shows
revenue generated by the firms. The ultimate goal of the firms is to
maximize the sales for their growth. The purpose to include this
variable is to capture the demand side or the investment
opportunities for the firms. The rationale behind this is that when
sales of firms’ increases in the market this gives a signal to the
firms for higher expected future demand due to which the
investment opportunities for the firms increases. For the sake of
profit firms want to invest more to capture the demand from the
market. This variable is used in place of Tobin’s Q to capture the
investment opportunities for the firms. A lot of studies used this
variable and explored it to be an important determinant of firms’
growth and investment.
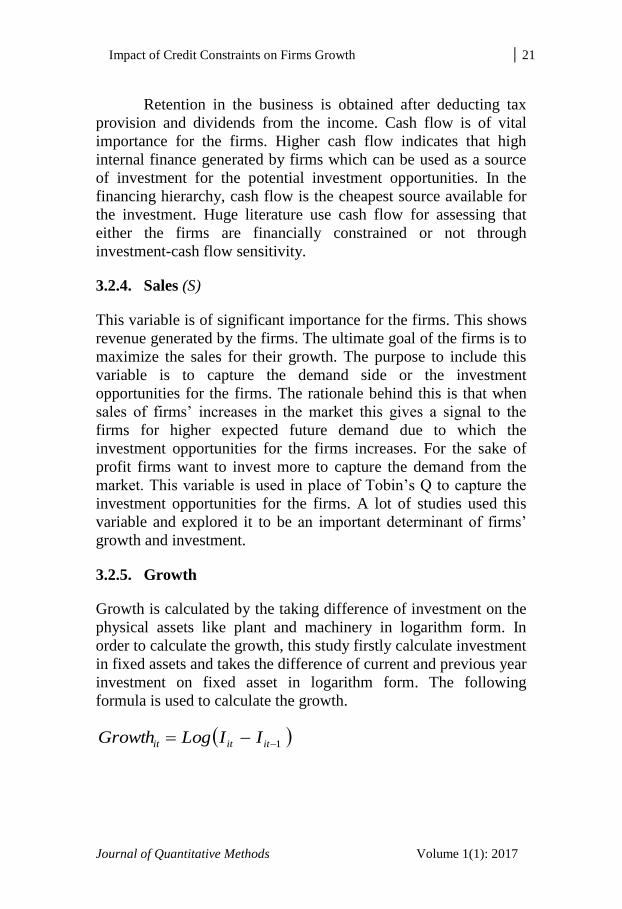
3.2.5. Growth
Growth is calculated by the taking difference of investment on the
physical assets like plant and machinery in logarithm form. In
order to calculate the growth, this study firstly calculate investment
in fixed assets and takes the difference of current and previous year
investment on fixed asset in logarithm form. The following
formula is used to calculate the growth.
1 ititit IILogGrowth

Impact of Credit Constraints on Firms Growth 22
Journal of Quantitative Methods Volume 1(1): 2017
itI shows the investment on fixed asset in current year and
1tiI is the investment on fixed asset in the previous year. This
variable is of vital importance because it directly indicates the
performance of firms either they are growing or not. In most of the
studies, growth is used as dependent variable for analyzing the
factors that affect growth of the firms. Carpenter and Peterson
(2002) used this variable in combination of internal finance to
access either the growth of small firms is constrained by internal
finance or not.
3.3. Variables for Classification
The following explained variables are not used in the regression
analysis but study uses these variables for the division of the firms
into groups of small medium and large to access the variation in
investment cash flow sensitivity and growth cash flow sensitivity
across different groups on the bases of flowing explained variables.
3.3.1. Dividend to Equity
Dividend to Equity is calculated by dividing the total dividend to
the shareholder’s equity (Ordinary Share Capital + Surplus).
Following formula is used to calculate this.
EquityHoldersShare
DividendEquitytoDividend
Study by using dividend to equity ratio divides firms into
three classes; low dividend paying, moderate dividend paying and
high dividend paying firms. Low dividend to equity ratio indicates
that firms are paying low dividends as percentage of equity
whereas high dividend to equity ratio indicates that firms are
paying high dividends as percentage of equity.
3.3.2. Debt to Equity
Debt to equity is a measure of companies’ financial leverage. This
ratio is obtained by dividing the firms’ liabilities with that of the

Impact of Credit Constraints on Firms Growth 23
Journal of Quantitative Methods Volume 1(1): 2017
shareholder equity11
. By dividing the firms into different classes
helps us to explain how the sensitivity of the relation between
investment to cash flow and growth to cash flow varies if the firms
have more, less and moderate debt to equity ratio. Higher debt to
equity ratio shows the aggressive behavior of the firms in financing
their investment with the debt whereas low debt to equity ratio
indicates less aggressive behavior of firms towards using debt.
Following formula is used to calculate
EquityHoldersShare
sLiabilitieCurrentNonsLiabilitieCurrentRatioEquitytoDebt
)(
3.3.3. Total Assets
This is used to divide the firms into small, medium and large size
firms. Total asset is obtained by adding current assets12
and
noncurrent assets13
. A lot of studies use this variable to divide
firms into small, medium and large size to access the prospect that
either investment and growth of firms is homogenous across these
different size groups or not.
AssetCurrentNonAssetCurrentAssetTotal
4. Results and Discussion
Manufacturing sector in Pakistan is of vital importance because of
its significant contribution in Gross Domestic Product (hereafter
GDP). Manufacturing sector works as a catalyst in fostering the
economic growth and development. As per 2012-2013 figures,
manufacturing sector contributes 13.2% in the GDP of Pakistan
and 13.8% of the total labor force is working in this sector. Both of
these economic indicators well explains the importance of the
manufacturing the sector in Pakistan’s economy. The results
estimated from the sample of 500 firms of the manufacturing
sector of Pakistan for the period of 1974 - 2010 are explained
below.
Impact of Credit Constraints on Firms Growth 24
Journal of Quantitative Methods Volume 1(1): 2017
4.1. Credit Constraint and Firms’ Growth
This section explains the results of credit constraint and growth for
the full sample in case of manufacturing sector of Pakistan.
Similarly, for analyzing the impact of credit constraint on firms’
growth, this study, by following the literature estimates two
equations 5 and 6. The main difference between the equations 5
and 6 lies in their method to incorporate the investment
opportunities. In equation 6 sales growth is used to capture the
investment opportunities while in equation 5 sales to capital ratio is
used for this purpose.
First both equations for the full sample from 1974 - 2010
are estimated. The results obtained from the estimation are
reported in Table 2. Results obtained from estimating both the
equations 5 and 6 point that firms in manufacturing sector of
Pakistan are not credit constraint. In other words, their growth is
not constraint by the internal finance. The results of the equation 5
demonstrate that the effect of sales to capital ratio is negative
indicating decline in the marginal productivity of capital. It is
discovered that with 1% increase in the marginal productivity of
capital there is 0.031% decline in the growth of the firms. Effect of
sales growth is positive and significant that specifies the
investment opportunities for the firms of manufacturing sector.
The effect of sales growth indicates that 1% increase in the sales
growth causes 0.59% increase in the growth of physical asset of
the firms.
The effect of cash flow in case of equations 5 and 6
explored to be significant at 5% level. But the effect of cash flow
for the equation 5 is negative whereas it is positive for the equation
6. In case of equation 6, results indicate that with the 1% increase
in the internal finance, there is 0.26% increase in the growth of the
physical assets of the firms whereas results for the equation 5
points out that with the 1% increase in the internal finance there is
0.22% decline in the growth of the physical asset of the firms.
Impact of Credit Constraints on Firms Growth 25
Journal of Quantitative Methods Volume 1(1): 2017
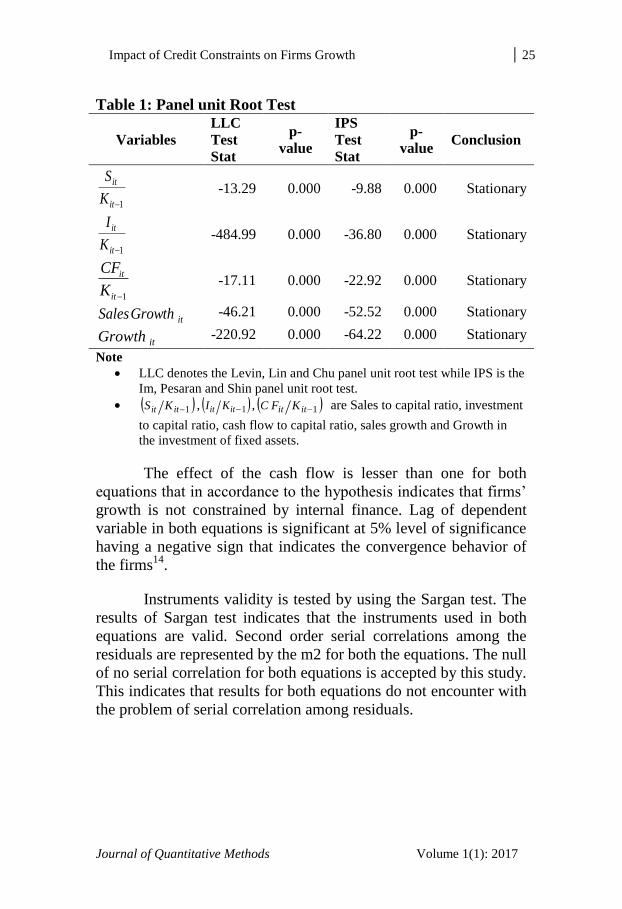
Table 1: Panel unit Root Test
Variables
LLC
Test
Stat
p-
value
IPS
Test
Stat
p-
value Conclusion
1it
it
K
S -13.29 0.000 -9.88 0.000 Stationary
1it
it
K
I -484.99 0.000 -36.80 0.000 Stationary
1it
it
K
CF -17.11 0.000 -22.92 0.000 Stationary
itGrowthSales
-46.21 0.000 -52.52 0.000 Stationary
itGrowth
-220.92 0.000 -64.22 0.000 Stationary
Note
LLC denotes the Levin, Lin and Chu panel unit root test while IPS is the
Im, Pesaran and Shin panel unit root test.
1itit KS , 1itit KI , 1itit KFC are Sales to capital ratio, investment
to capital ratio, cash flow to capital ratio, sales growth and Growth in
the investment of fixed assets.
The effect of the cash flow is lesser than one for both
equations that in accordance to the hypothesis indicates that firms’
growth is not constrained by internal finance. Lag of dependent
variable in both equations is significant at 5% level of significance
having a negative sign that indicates the convergence behavior of
the firms14
.
Instruments validity is tested by using the Sargan test. The
results of Sargan test indicates that the instruments used in both
equations are valid. Second order serial correlations among the
residuals are represented by the m2 for both the equations. The null
of no serial correlation for both equations is accepted by this study.
This indicates that results for both equations do not encounter with
the problem of serial correlation among residuals.

Impact of Credit Constraints on Firms Growth 26
Journal of Quantitative Methods Volume 1(1): 2017
4.2. Empirical Investigation of Impact of Financial Reforms
on Credit Constraint and Firms’ Growth
This section explains the results for impact of financial sector
reform on credit constraint and growth for this equation 6 is
estimated and results obtained are reported below in the table
Table 2: Credit Constraint and Growth (1974-2010):
Dependent Variable Growthit
Model Using Sale to Capital
Ratio for Investment
Opportunities
Model Using Sales Growth for
Investment Opportunities
Explanatory
Variables
Coefficients Explanatory
Variables
Coefficients
1itGrowth -0.4255*
(0.0013) 1itGrowth -0.3343*
(0.0025)
1it
it
K
S
-0.0318*
(-0.0062) 1it
it
K
CF
0.2658*
(0.1161)
1it
it
K
CF
-0.2294*
(0.0624) itGrowthSales
0.5982*
(0.0729)
m2 (Statistics
Value)
0.1466 m2 (Statistics
Value)
0.3444
Sargan (p
value)
0.1444 Sargan (p
value)
0.1131
Note
1itGrowth is the Growth of physical asset, it the lag of the dependent
variable, 1itit KS is Sales to Capital ratio and 1itit KFC cash flow
to capital ratio. Constant and Time dummies are included. (Not reported).
Standard errors are in parenthesis.
m2 is the second order serial correlation tests based on residuals
asymptotically distributed as N(0,1) under the null of no serial correlation.
Sargan is the test of instruments’ validity asymptotically distributed as 2 under the null that instrument is valid.
Statistics significant at 1% is denoted by *.
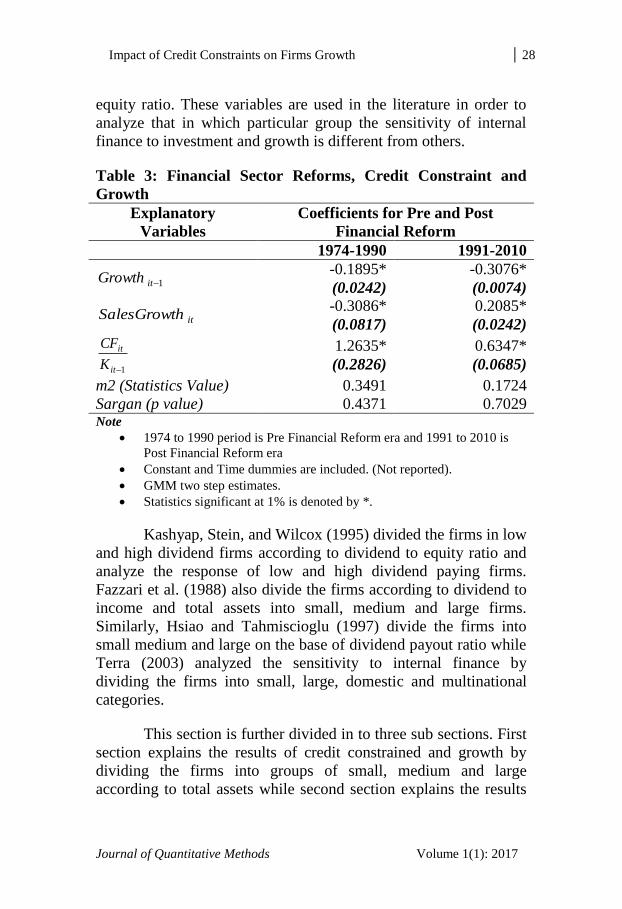
The effect of cash flow to capital ratio is positive,
significant and greater than one at 1% level of significance. In pre
financial sector reform era, results show 1% increase in internal
finance causes 1.26% increase in the firms’ fixed assets’ growth.
Impact of Credit Constraints on Firms Growth 27
Journal of Quantitative Methods Volume 1(1): 2017
Results for the pre financial sector reform era indicates that with
1% increase in internal finance firms grow at a rate more than 1%
because of the leverage effect. The effect of sales growth for pre
financial sector reform era is significant and negative at 1% level
of significance. It indicates that the firms’ investment is insensitive
to the sales during this time frame. The lag of dependent variable is
found to be negative and significant at 1% level of significance. It
is an indication of convergence of the firms.
The effect of cash flow for the post financial sector reform
era discovered to be positive and significant. Result shows that 1%
increase in the internal finance causes 0.63% increase in the
growth of firms’ fixed assets that in light of hypothesis indicates
that firms’ growth is not constrained by internal finance in post
financial sector reform era. Highly positive and significant effect
of sales growth at 1% level of significance is indication of high
investment opportunities in the post financial sector reform era.
The overall results indicate that the growth of firms in the
manufacturing sector of Pakistan is constrained by internal finance
in pre financial reform era while it is not constrained by internal
finance in post financial sector reform period. This is because of
privatization, there is a monopoly break down in financial market
and credit is dispersed widely and deeply because of the injected
competition through the privatization of the financial institutions.
Due to this, firms do not face financial constraints in post financial
sector reform.
4.3. Credit Constrained and Firms’ Growth: Homogeneity
across Different Groups
In this section results for the prospect that either credit constrained
and growth of the firms varies across different groups or not are
explained. For this purpose, firstly firms are divided into groups of
small, medium and large, on the basis of total assets. Secondly,
firms are classified into three classes on the basis of low debt to
equity ratio, moderate debt to equity ratio and high debt to equity
ratio. Lastly, firms are divided into three groups of low dividend to
equity ratio, moderate dividend to equity ratio and high dividend to
Impact of Credit Constraints on Firms Growth 28
Journal of Quantitative Methods Volume 1(1): 2017
equity ratio. These variables are used in the literature in order to
analyze that in which particular group the sensitivity of internal
finance to investment and growth is different from others.
Table 3: Financial Sector Reforms, Credit Constraint and
Growth
Explanatory
Variables
Coefficients for Pre and Post
Financial Reform
1974-1990 1991-2010
1itGrowth -0.1895*
(0.0242)
-0.3076*
(0.0074)
itGrowthSales -0.3086*
(0.0817)
0.2085*
(0.0242)
1it
it
K
CF 1.2635*
(0.2826)
0.6347*
(0.0685)
m2 (Statistics Value) 0.3491 0.1724
Sargan (p value) 0.4371 0.7029 Note
1974 to 1990 period is Pre Financial Reform era and 1991 to 2010 is
Post Financial Reform era
Constant and Time dummies are included. (Not reported).
GMM two step estimates.
Statistics significant at 1% is denoted by *.
Kashyap, Stein, and Wilcox (1995) divided the firms in low
and high dividend firms according to dividend to equity ratio and
analyze the response of low and high dividend paying firms.
Fazzari et al. (1988) also divide the firms according to dividend to
income and total assets into small, medium and large firms.
Similarly, Hsiao and Tahmiscioglu (1997) divide the firms into
small medium and large on the base of dividend payout ratio while
Terra (2003) analyzed the sensitivity to internal finance by
dividing the firms into small, large, domestic and multinational
categories.
This section is further divided in to three sub sections. First
section explains the results of credit constrained and growth by
dividing the firms into groups of small, medium and large
according to total assets while second section explains the results

Impact of Credit Constraints on Firms Growth 29
Journal of Quantitative Methods Volume 1(1): 2017
for the credit constrained and growth by dividing the firms into
low dividend to equity ratio, moderate dividend to equity ratio and
high dividend to equity ratio and lastly the results by dividing the
firms on the basis of debt to equity ratio are explained for the
period of 1974-2010.
4.4. Growth and Credit Constrained In Different Size Firms
In this section results for the prospect that credit constrained and
growth of the firms varies across different groups on the base of
their size are explained. Study estimates equation 6 for the small,
medium and large size firms and their results are reported below in
the Table 4.
Result for the small Size firms show that the effect of cash
flow is positive and significant at 1% level of significance. Result
shows that 1% increase in the cash flow to capital ratio causes
1.97% increase in the growth of the physical assets of the firms
which in the light of hypothesis shows that growth of small firms is
constrained by internal finance.
The effect of sales growth for the small firms is positive
and significant indicates that it causes 0.26% increase in the
growth of the physical assets of the firms. This is an indication of
investment opportunities of firms having small asset base or small
in size. The lag of the dependent variable is negative and
significant in all three groups which is an indication of adjustment
cost bear by the firms. Results for the medium size firms are also
reported in the Table 4.
Impact of Credit Constraints on Firms Growth 30
Journal of Quantitative Methods Volume 1(1): 2017
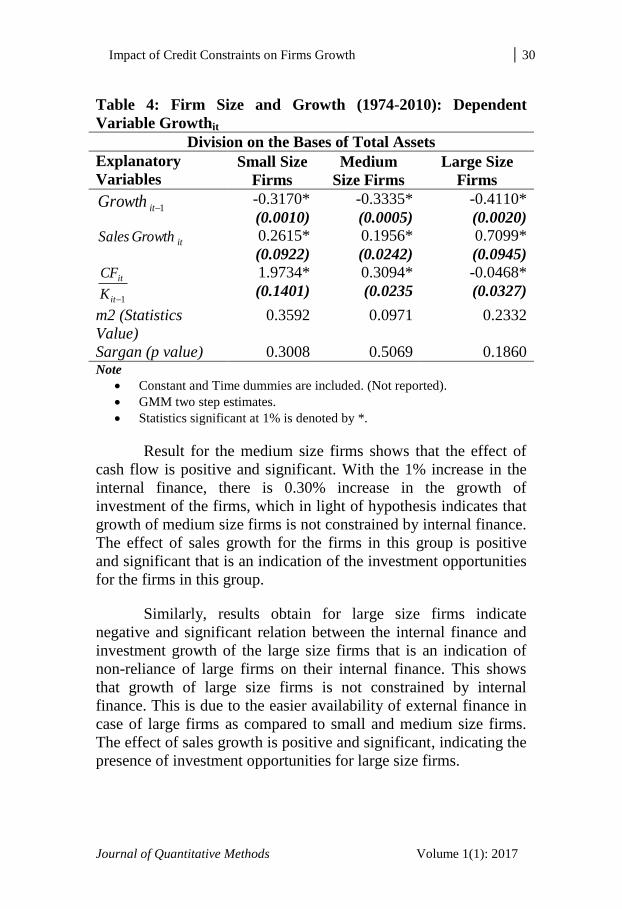
Table 4: Firm Size and Growth (1974-2010): Dependent
Variable Growthit
Division on the Bases of Total Assets
Explanatory
Variables Small Size
Firms
Medium
Size Firms
Large Size
Firms
1itGrowth -0.3170*
(0.0010)
-0.3335*
(0.0005)
-0.4110*
(0.0020)
itGrowthSales 0.2615*
(0.0922)
0.1956*
(0.0242)
0.7099*
(0.0945)
1it
it
K
CF
1.9734*
(0.1401)
0.3094*
(0.0235
-0.0468*
(0.0327)
m2 (Statistics
Value)
0.3592 0.0971 0.2332
Sargan (p value) 0.3008 0.5069 0.1860 Note
Constant and Time dummies are included. (Not reported).
GMM two step estimates.
Statistics significant at 1% is denoted by *.
Result for the medium size firms shows that the effect of
cash flow is positive and significant. With the 1% increase in the
internal finance, there is 0.30% increase in the growth of
investment of the firms, which in light of hypothesis indicates that
growth of medium size firms is not constrained by internal finance.
The effect of sales growth for the firms in this group is positive
and significant that is an indication of the investment opportunities
for the firms in this group.
Similarly, results obtain for large size firms indicate
negative and significant relation between the internal finance and
investment growth of the large size firms that is an indication of
non-reliance of large firms on their internal finance. This shows
that growth of large size firms is not constrained by internal
finance. This is due to the easier availability of external finance in
case of large firms as compared to small and medium size firms.
The effect of sales growth is positive and significant, indicating the
presence of investment opportunities for large size firms.
Impact of Credit Constraints on Firms Growth 31
Journal of Quantitative Methods Volume 1(1): 2017
To summarize, results obtained clearly show that growth of
the small firms is constrained by internal finance because of low
collateral value of firms in this group. While the impact of credit
constrained decreases as the asset size of firms increases that is
clearly shown from the results reported above. The large and
medium size firms are not found to be constrained by internal
finance. It is because that large and medium size firms have high
collateral value. So they do not have any such constrain for getting
external finance. These obtained results are similar to the findings
of Carpenter and Petersen (2002).
4.5. Leverage and Credit Constrained Across Different
Groups
This section of study explains the results by dividing the firms into
groups of less aggressive firms, moderately aggressive and highly
aggressive firms in financing their investment and growth with
debt. This division is done according to debt to equity ratio. The
higher ratio indicates that firms are aggressive in financing their
investment and growth with debt.
4.6. Debt Financing, Growth and Credit Constraint
This section explains the result for firms’ growth, credit
constrained and debt financing by dividing the firms into groups of
less aggressive firms, moderately aggressive and highly aggressive
firms in financing their growth with debt.
Division on the basis of debt to equity into less aggressive
firms, moderately aggressive and highly aggressive firms in
financing with debt helps to explain that to which extent the
growth of firms is constrained by internal finance in all three
different classes. The high debt to equity ratio indicates high use of
debt by the firms for their potential projects similarly low debt to
equity of the firms indicates that firms are less dependent on the
debt financing.
Impact of Credit Constraints on Firms Growth 32
Journal of Quantitative Methods Volume 1(1): 2017
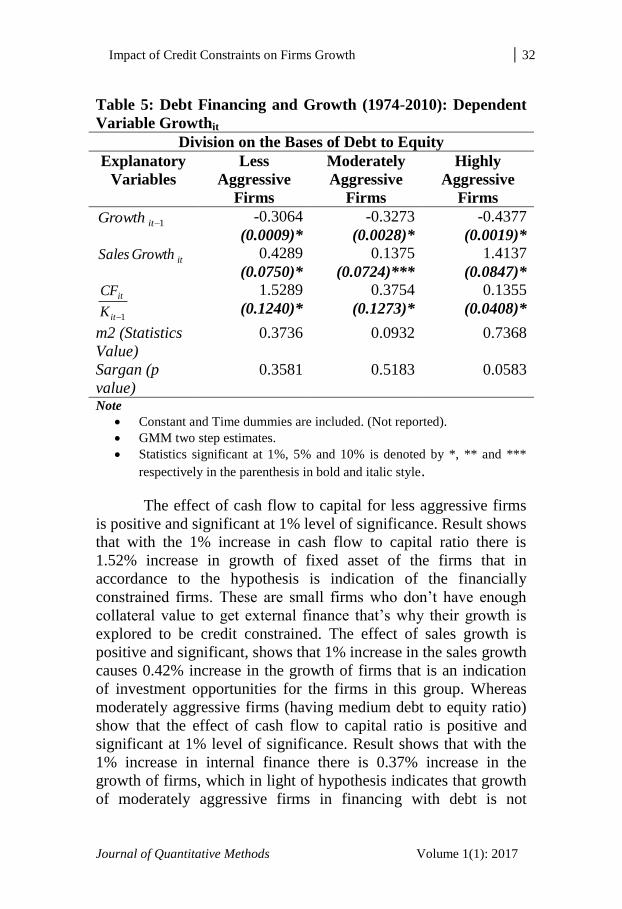
Table 5: Debt Financing and Growth (1974-2010): Dependent
Variable Growthit
Division on the Bases of Debt to Equity
Explanatory
Variables
Less
Aggressive
Firms
Moderately
Aggressive
Firms
Highly
Aggressive
Firms
1itGrowth -0.3064
(0.0009)*
-0.3273
(0.0028)*
-0.4377
(0.0019)*
itGrowthSales 0.4289
(0.0750)*
0.1375
(0.0724)***
1.4137
(0.0847)*
1it
it
K
CF
1.5289
(0.1240)*
0.3754
(0.1273)*
0.1355
(0.0408)*
m2 (Statistics
Value)
0.3736 0.0932 0.7368
Sargan (p
value)
0.3581 0.5183 0.0583
Note
Constant and Time dummies are included. (Not reported).
GMM two step estimates.
Statistics significant at 1%, 5% and 10% is denoted by *, ** and ***
respectively in the parenthesis in bold and italic style.
The effect of cash flow to capital for less aggressive firms
is positive and significant at 1% level of significance. Result shows
that with the 1% increase in cash flow to capital ratio there is
1.52% increase in growth of fixed asset of the firms that in
accordance to the hypothesis is indication of the financially
constrained firms. These are small firms who don’t have enough
collateral value to get external finance that’s why their growth is
explored to be credit constrained. The effect of sales growth is
positive and significant, shows that 1% increase in the sales growth
causes 0.42% increase in the growth of firms that is an indication
of investment opportunities for the firms in this group. Whereas
moderately aggressive firms (having medium debt to equity ratio)
show that the effect of cash flow to capital ratio is positive and
significant at 1% level of significance. Result shows that with the
1% increase in internal finance there is 0.37% increase in the
growth of firms, which in light of hypothesis indicates that growth
of moderately aggressive firms in financing with debt is not
Impact of Credit Constraints on Firms Growth 33
Journal of Quantitative Methods Volume 1(1): 2017
constrained by internal finance. The effect of sales growth for the
firms in this group is also positive and significant indicating the
presence of investment opportunities for the firms in this group.
The results for highly aggressive firms (having high debt to
equity ratio) indicate that with the 1% increase in the coefficient of
cash flow there is 0.135% increase in the growth of the firms. In
light of hypothesis indicates that growth of highly aggressive firms
in financing with debt is not constrained by the internal finance.
The effect of sales growth is positively significant and highly
sensitive as compared to their counter parts which indicate high
investment opportunities for highly aggressive firms in financing
with debt. These are large firms who do not have the limitation on
their collateral value for obtaining loans from the financial market.
That’s why they are not credit constrained and can easily get the
loans to invest in potential investment opportunities.
The overall results for this classification indicate that
growth of the firms who are less aggressive in debt financing
explored to be constrained by internal finance whereas growth of
moderately and highly aggressive firms in debt financing is not
found to be constrained by internal finance.
4.7. Credit Constrained and Growth: A Comparison on the
Base of Dividend to Equity Ratio
This section of study explains the results obtained by dividing the
firms into three groups on the basis of dividend to equity ratio.
Dividend to equity ratio explains how much dividends are paid out
as a percentage of equity. Three groups in which firms are divided
on the basis of dividend to equity are less dividend paying firms,
moderate dividend paying and high dividend paying firms as
percentage of their equity. Less dividend paying firms are the firms
who are paying fewer dividends as a percentage of equity as
compared to moderately and high dividend paying firms.
Impact of Credit Constraints on Firms Growth 34
Journal of Quantitative Methods Volume 1(1): 2017
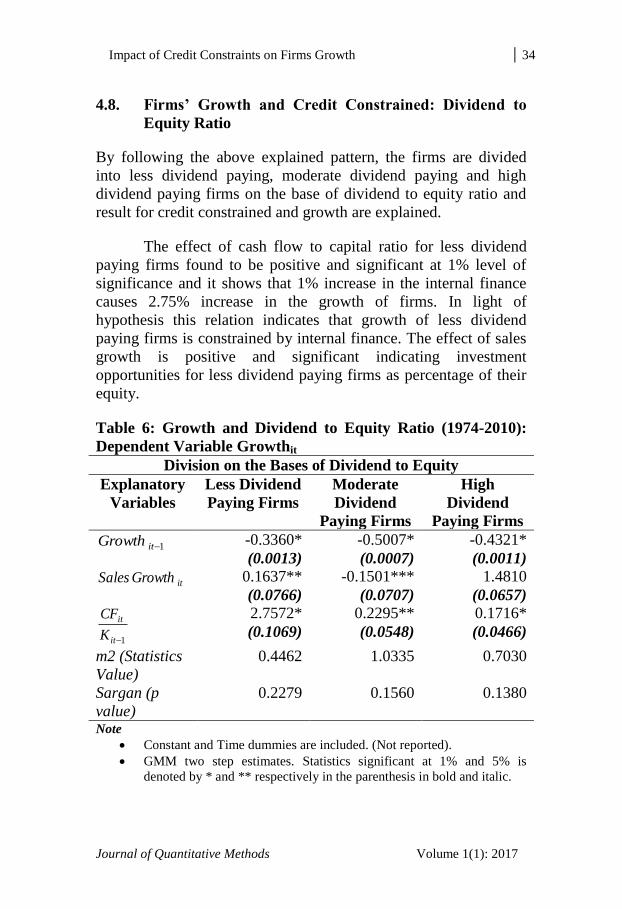
4.8. Firms’ Growth and Credit Constrained: Dividend to
Equity Ratio
By following the above explained pattern, the firms are divided
into less dividend paying, moderate dividend paying and high
dividend paying firms on the base of dividend to equity ratio and
result for credit constrained and growth are explained.
The effect of cash flow to capital ratio for less dividend
paying firms found to be positive and significant at 1% level of
significance and it shows that 1% increase in the internal finance
causes 2.75% increase in the growth of firms. In light of
hypothesis this relation indicates that growth of less dividend
paying firms is constrained by internal finance. The effect of sales
growth is positive and significant indicating investment
opportunities for less dividend paying firms as percentage of their
equity.
Table 6: Growth and Dividend to Equity Ratio (1974-2010):
Dependent Variable Growthit
Division on the Bases of Dividend to Equity
Explanatory
Variables
Less Dividend
Paying Firms
Moderate
Dividend
Paying Firms
High
Dividend
Paying Firms
1itGrowth -0.3360*
(0.0013)
-0.5007*
(0.0007)
-0.4321*
(0.0011)
itGrowthSales 0.1637**
(0.0766)
-0.1501***
(0.0707)
1.4810
(0.0657)
1it
it
K
CF
2.7572*
(0.1069)
0.2295**
(0.0548)
0.1716*
(0.0466)
m2 (Statistics
Value)
0.4462 1.0335 0.7030
Sargan (p
value)
0.2279 0.1560 0.1380
Note
Constant and Time dummies are included. (Not reported).
GMM two step estimates. Statistics significant at 1% and 5% is
denoted by * and ** respectively in the parenthesis in bold and italic.

Impact of Credit Constraints on Firms Growth 35
Journal of Quantitative Methods Volume 1(1): 2017
The effect of cash flow to capital ratio explored to be
positive and significant at 1% level of significance for moderate
and high dividend paying firms but the sensitivity of relation
between internal finance and growth is lesser than one for both
moderate and high dividend paying firms that indicates that growth
of firms in both groups are not constrained by internal finance. The
effect of cash flow to capital ratio for moderate dividend paying
firms indicates that 1% increase in cash flow coefficient causes
0.22% increase in the growth. Similarly, the effect of cash flow to
capital for high dividend paying firms show that 1% increase in the
cash flow to capital causes 0.17% increase in investment growth
firms.
The overall result for all three groups indicates that the
growth of low dividend paying firms explored to be constrained by
internal finance because of this they are highly dependent on
internal finance. These are the firms who are small in size and
small firms’ operational activities for generating profits are not
financed by external financial sources because of the limitation in
accessing the external finance. Due to this reason, they have to pay
low dividends for the aim of utilizing these resources in profit
generating activities (Fazzari et al., 1988). Whereas the growth of
moderate and high dividend paying firms are not constrained by
internal finance because of this there is no one to one relationship
between internal finance and growth of firms for moderate and
high dividend paying firms.
5. Summary and Conclusions
This study explored the impact of credit constraint on firms’
growth by using firm level data of manufacturing sector of
Pakistan for the period of 1974-2010. Generalized Method of
Moments (1991) one step and two step estimation techniques are
used due to the problem of endogeniety.
Sales to capital ratio and sales growth are used to capture
the investment opportunities while cash flow is used as a proxy for
internal finance. All these variables are constructed from more than
Impact of Credit Constraints on Firms Growth 36
Journal of Quantitative Methods Volume 1(1): 2017
12,000 financial statements of the manufacturing sector of
Pakistan.
Firstly, this study estimated the dynamic growth model for
the whole manufacturing sector. Secondly, this study analyzes the
data on the base of financial sector reforms in the history of
Pakistan. Thirdly, this study divides the data industry-wise for
industrial analysis. Lastly, growth model is estimated by dividing
the firms into three different classes on the basis of total assets,
debt to equity ratio and dividend to equity ratio.
Result of full sample shows that the firms in manufacturing
sector for the period from 1974-2010 are not facing external
financial constraints because of this effect of cash flow for the full
sample found to be insignificant indicating that investment and
growth of firms is not driven by their internal finance.
This study also explores the impact of financial sector
reforms on firms’ growth. The effect of cash flow turned out to be
positive and significant in pre and post financial reform period.
However, the effect of cash flow explored to be positive and highly
significant during nationalization era and its intensity decreases
with the decentralization of financial institutions. This indicates
that firms are facing tight external financial constraint in pre
financial reform era (1974-1990) as compared to post financial
reform era (1991-2010).
Result for the homogeneity of firms’ growth across
different classes having different characteristics like size, dividend
and debt indicates that sensitivity of firms’ investment and growth
to internal finance varies across different groups. Results show that
growth of firms having small assets is constrained by internal
finance because of this effect of cash flow for firms having small
assets are greater than one while firms having medium and large
assets are not constrained by internal finance. Similarly, firms’
growth that is less dependent on debt finance is constrained by
internal finance because these are the firms who do not have
enough collateral value to show the financial institutions for
obtaining loans, so for their growth they have to rely on their
Impact of Credit Constraints on Firms Growth 37
Journal of Quantitative Methods Volume 1(1): 2017
internal finance. The effect of cash flow for firms that are
moderately and highly aggressive in financing with debt is not
greater than one indicating that the growth of firms belonging to
these groups is not constrained by internal finance. Similarly,
growth of firms that are paying low dividends is constrained by
internal finance whereas growth of firms that are paying high
dividends is not constrained by the internal finance.
References
Ahmed, H., & Naveed, H. (2011). Financing Constraints:
Determinants and Implications for Firm Growth in
Pakistan. The Lahore Journal of Economics, 16, 317-346.
Ayygagri, M., Demirguc-Kunt, A., & Maksimovic, V. (2008).
How Important Are Financing Constraints? The Role of
Finance in the Business Environment. World Bank
Economic Review, 22, 483-516.
Bai, C. E., Lu, J., & Tao, Z. (2005). Property rights protection and
access to bank loans. Economics of transition, 14(4), 611-
628.
Becchetti, L., & Trovato, G. (2002). The Determinants of Growth
for Small and Medium Sized Firms: The Role of the
Availability of External Finance. Small Business
Economics, 19(4), 291-306.
Beck, T., Demirguc, A., & Maksimovic, V. (2005). Financial and
Legal Constraints to Growth: Does Firm Size Matter? The
journal of Finance, 60(1), 137-177.
Bernanke, B. G. (1998). The Financial Accelerator in a Quantative
Business Cycle Framework. 6455.
Binks, M. R., & Ennew, C. T. (1996). Growing Firms and the
Credit Constraint. .Small Business Economics, 8(1), 17-25.
Bond, S., & Meghir, C. (1994). Dynamic Investment Models and
the Firm's FinancialPolicy. Review of Economic Studies,
61(2), 197-222.
Impact of Credit Constraints on Firms Growth 38
Journal of Quantitative Methods Volume 1(1): 2017
Carpenter, R. E., & Petersen, B. C. (2002). Is the Growth of Small
Firms Constraint by Internal Finance. Review of Economics
and Statistics, 84(2), 298-309.
Fazzari, Hubbard, M., Glenn, R., & Petersen, B. C. (1988).
Financing Constraint and Corporate Investment Brookings
papers on Economic Activity (Vol. 1, pp. 141-195).
Fazzari, S. M., Hubbard, R. G., & Petersen, B. C. (2000).
Investment-Cash Flow Sensitivities are Useful: A
Comment on Kaplan and Zingales, The Quarterly Journal
of EconomicS, 115(2), 695-705.
Guariglia, A., Liu, X., & Song, L. (2008). Is the Growth of Chinese
Firms Constraint by Internal finance? Mimeograph:
University of Nottingham.
Héricourt, J., & Poncet, S. (2009). FDI and credit constraints:
Firm-level evidence from China. Economic systems, 33(1),
1-21.
Hsiao, C., & Tahmiscioglu, A. K. (1997). A panel analysis of
liquidity constraints and firm investment. Journal of the
American Statistical Association, 92(438), 455-465.
Hutchinson, J., & Xavier, A. (2006). Comparing the Impact of
Credit Constraints on the Growth of SMEs in a Transition
Country with an Established Market Economy. Small
Business Economics, 27(2), 169-179.
Hyytinen, A., & Toivanen, O. (2005). Do Financial Constraints
Hold Back Innovation and Growth: Evidence on the Role
of Public Policy. Research Policy, 34(9), 1385-1403.
Im, K. S., Pesaran, M. H., & Shin, Y. (2003). Testing for unit roots
in heterogeneous panels. Journal of econometrics, 115(1),
53-74.
Kashyap, A. K., Stein, J. C., & Wilcox, D. W. (1995). Monetary
policy and credit conditions: Evidence from the
composition of external finance: Reply. The American
Economic Review, 86(1), 310-314.
Impact of Credit Constraints on Firms Growth 39
Journal of Quantitative Methods Volume 1(1): 2017
Kuh, E. (1963). Theory and institutions in the study of investment
behavior. The American Economic Review, 53(2), 260-268.
Levin, A., Lin, C. F., & Chu, C. S. J. (2002). Unit root tests in
panel data: asymptotic and finite-sample properties.
Journal of econometrics, 108(1), 1-24.
Maddala, G. S., & Wu, S. (1999). A comparative study of unit root
tests with panel data and a new simple test. Oxford Bulletin
of Economics and statistics, 61(S1), 631-652.
Moreno-Badia, M., & Slootmaekers, V. (2009). The Missing Link
between Financial Constraints and Productivity.
http://www.imf.org/external/pubs/cat/longres.aspx?sk=228
23.00
Musso, P., & Schiavo, S. (2008). The Impact of Financial
Constraints on Firm Survival and Growth. Journal of
Evolutionary Economics, 18(2), 135-149.
Oliveira, B., & Fortunato, A. (2006). Firm Growth and Liquidity
Constraints: A Dynamic Analysis. Small Business
Economics, 27(2), 139-156.
Schumpeter, J. A. (1911). The Theory of Economic Development.
Segarra, A., & Teruel, M. (2009). Small Firms, Growth and
Financial Constraints. Xarxade Referència en Economia
Aplicada (XREAP).
Stein, J. C. (2003). Agency, Information and Corporate
Investment. In M. H. George Constantinides, and Rene
Stulz. Amstardam (Ed.), Handbook of the Economics of
Finance. North Holland.
Terra, M. C. T. (2003). Credit Constraints in Brazilian Firms:
Evidence from Panel Data. Revista Brasileira de
Economia, 57(2), 443-464.
Impact of Credit Constraints on Firms Growth 40
Journal of Quantitative Methods Volume 1(1): 2017
Footnotes
1For more detail see Stein (2003).
2For more detail see Binks and Ennew (1996).
3See Hamnna and Hamid (2011) for more detail.
4For more detail see Sehrishet.al. (2013).
5Hashmi (2011) concluded that firms of manufacturing sector of Pakistan are
financially constraint. Firms face imperfect competition in product market and
do not follow optimal investment path. 6See Hussain (2006) for detail regarding economic policies and their
implications in different regimes. The period form 1974-1977 and 1978-1988 in
Pakistan was Bhutto and Zia regime respectively. The period form 1989-1999
and 2000-2008b in Pakistan is termed as democratically regime and Musharaf
era respectively. 7See Zaidi (2006) for detail about Pre and Post Financial Reforms.
8Repayment probability is the ability of firms to pay back the loans. This is
linked with the net returns of the firms from the project. If the project earns
positive returns than it make firms able to pay back the loans, which is
demanded or taken from the financial institutions for availing the profitable
investment opportunities. 9Higher the risk, higher the return.
10MRP (exp) it basically shows the expansion path of the firms. (Exp) stands for
expansion. 11
SurplusCaptialShareOrdinaryEquityHolderShare 12
These include all the assets which are easily converted in liquid when needed. 13
These are assets which include physical assets i.e. which are not easily
converted in to liquid form. 14
For more detail see Carpenter Petersen (2002).