Embed Size (px)
Citation preview

Pak J Commer Soc Sci Pakistan Journal of Commerce and Social Sciences 2014, Vol. 8 (2), 305- 330
Impact of Corporate Governance on Intellectual Capital Efficiency and Financial Performance
Muhammad Abdul Majid Makki
Department of Commerce, The Islamia University of Bahawalpur, Pakistan Email: [email protected]
Suleman Aziz Lodhi
National College of Business Administration & Economics, Lahore, Pakistan Email: [email protected]
Abstract This study develops a structural model linking corporate governance, intellectual capital efficiency and financial performance then verifies it through structural equation modeling based on partial least square. Corporate governance has been conceptualized and measured through chief executive officer’s duality, ratio of non executive directors, directors’ ownership, executives’ remuneration and number of shareholders. Intellectual capital efficiency is computed through Value Added Intellectual Coefficient (VAICTM), and financial performance is represented through return on investment, return on equity and net profit after tax. The study reveals and determines the existence of critical structural relationship among corporate governance, intellectual capital efficiency and financial performance. The study concludes that corporate governance does not improve financial performance directly; rather corporate governors can enhance it significantly through exploiting intellectual capital resources. The study provides empirical evidence that a firm with good corporate governance measures enhances IC efficiency that ultimately generates more return on investment, return on equity and net profit. Keywords: Value Added Intellectual Coefficient (VAIC), partial least square, frequency of board meetings, Pakistan. 1. Introduction Corporate Governance (CG) has been recognized as a mechanism for achieving maximum efficiency and plays a very important role in sustainability, productivity and profitability to meet the new challenges of quota free global environment. This challenge can be faced by the corporate governors in the knowledge century through getting best out of its intellectual assets and view corporate knowledge as being one of the most sustainable sources of competitive advantage in business. Shift from manufacturing era to knowledge economy requires corporate governors to maximize value creation from its Intellectual Capital (IC) resources to succeed in competitive WTO regime (Roos et al. 2005).

Corporate Governance, Intellectual Capital and Financial Performance
306
In knowledge economy, IC is considered crucial for the competitiveness of companies regardless of the industry. Johnson and Kaplan (1987) have suggested that IC might be the most important consideration regarding the performance of a company. Whereas Bornemann (1999) suggested that a correlation exists between intellectual potential and financial performance of an enterprise. IC has become critical strategic intangible asset that can transform a national company into an international, multinational and transnational corporate powerhouse. The services sector play a vital role in growth of economies around the globe and its share in overall gross domestic product of a country rises rapidly than its production sector, thus IC measurement and management become extremely important (World Bank, 2006). This study focuses on an area often overlooked in CG and IC arena; namely responsibility of board of directors in developing IC and to achieve maximum efficiency from IC resources to gain higher financial performance. It attempts to assess the model of structural relations among CG measures, IC efficiency and financial performance. Using a random sample of KSE listed companies; impact of good CG practices on IC efficiency and financial performance is studied. Structural equation modeling based on partial least square has been used to draw structural relations model. Board composition, ownership structure, CEO duality and managerial remuneration have been taken as firm level CG measures. IC efficiency has been calculated through extended VAIC (Makki and Lodhi, 2008) and financial performance has been represented through net profit, return on investment and return on equity. All these variables have been collected from audited annual reports of KSE listed companies. The study extends and follows the future study directions suggested by Ho and Williams (2003); Cabrita and Bontis (2008) and Zeghal and Maaloul (2010). The study contributes to the literature by assessing first ever structural model connecting CG, IC and financial performance and proves that good CG practices lead to better IC efficiency and higher financial performance. 1.1 Research Question The study aims to explore and determine the structural links between CG, IC and financial performance. It views IC efficiency as a compound of three efficiencies; human capital efficiency, structural capital efficiency and financial capital efficiency. The study is based on the argument that overall financial performance is an outcome of the interaction between CG and IC efficiency. It views CG to be responsible to bring extra ordinary profitability for a firm after attaining maximum IC efficiency through value addition. The main research question of the research study is to check whether CG measures can be used to improve financial performance through utilizing IC resources to meet the new challenges of quota free competitive world? In this way this study would determine across the KSE listed companies that how CG components affect IC efficiency and how IC efficiency affects financial performance (return on investment, net profitability and return on equity) of a company. It is hypothesized that corporate governance measures such as board composition, role duality, ownership concentration and managerial remuneration have significant impact on enhancing IC efficiency (i.e. HCE, SCE and CEE), which ultimately plays its role towards higher financial performance.

Makki and Lodhi
307
1.2 Objectives of the Study The purpose of the study is to develop first ever structural model connecting good CG practices with IC efficiency and on financial performance through applying structural equation modeling on a random sample of all KSE listed companies. It considers widely used IC model; the VAIC, to measure the IC performance of KSE firms in this research. While some new variables related to CG and IC have also been introduced to magnify this two stage relationship. More specifically, the study would attempt to:
i) Investigate the impact of CG measures on IC efficiency ii) Explore the impact of IC efficiency on financial performance (FP) iii) Determine structural linkages between CG, IC and FP.
2. Literature Review For the purpose of reviewing the relevant literature this section has been distributed into parts. In the first part, literature related to CG and firm performance has been discussed. In the second part empirical and conceptual studies related to CG, IC and IC disclosure are covered and the final part relates to work done by practitioners and academicians purely on CG and financial performance. 2.1 Studies on CG and Firm Performance In the early literature, relationship between CG and corporate performance has been widely studied but reached no consensus. There is a widely held view that good corporate governance practices are associated with better firm performance. Prior research has linked corporate governance to firm valuation using Tobin’s Q. There are also some studies in which CG indexes and financial performance have been correlated. Some studies have found this important relationship significant (see Ehikioya, 2009; Gruszczynski, 2006; Alves and Mendes, 2002; Drobetz et al., 2003 and Gemmill and Thomas, 2004) and some found it as insignificant (Abdullah and Page, 2009; Sueyoshi et al., 2010). Couple of CG measures has also been proved as having inverse relation (Yermack, 1996). Although, many studies prove that CG is a performance driver and adds value to a firm (Ehikioya, 2009; Gemmill and Thomas, 2004 and Drobetz et al., 2003). Even those studies which provide inconclusive results related to CG and performance argue that CG has, at least, indirect effect on company performance (Maassen, 1999). Poor corporate performance has also been treated as a byproduct of poor corporate governance. For example Gompers et al. (2003) examine the relationship between CG index and long term equity returns, firm value and accounting measures of performance. Their results reveal that well governed firms show higher equity returns, higher value and better accounting results as compared to their poorly governed counterparts. In the same way Drobetz et al. (2004) find positive relationship between CG practices and expected stock return in German public firms. Brown and Caylor (2005) find that better governed firms are more profitable, enjoy high market value and pay more cash dividends to their shareholders. Shaheen and Nishat (2005) explore relationship between CG and firm performance. They find association between CG and firm performance but not causality. Black et al. (2006) while exploring the effect of CG on firm value find positive relationship between CG index and Tobin’s Q in a sample of Korean public firms.

Corporate Governance, Intellectual Capital and Financial Performance
308
Gruszczynski (2006) while advocating panel data and using Logit model to study the firms listed on Warsaw Stock Exchange concludes that there is significant association between CG rating and operating profit. Che-Haat, et al. (2008) while studying the CG, transparency and performance of Malaysian firms use hierarchical regression technique on 73 good performing companies and 73 bad performing companies and find that CG factors have strong predicting power on company performance in Malaysia mainly due to debt monitoring and foreign ownership. On the other side, Sunday-O (2008) conducted a study on CG and firm performance using twenty Nigerian listed firms between 2000 and 2006. Using panel methodology and OLS as a method of estimation, the results were mixed; CEO duality and board size were significant while board composition and audit committee were insignificant. Javed and Iqbal (2006), while analyzing the effect of CG on firm’s performance in Pakistan conclude that not all elements of CG enhance firm’s performance. They further conclude that good CG measures uncover low production and bad management practices through transparent disclosure and transparency standards. In the recent studies related to CG and firm performance, Ehikioya (2009) conducted study on CG structure and firm performance based on listed companies of Nigerian Stock Exchange and concluded that ownership concentration has positive impact on performance and greater than one family members on the board showed adverse effect on firm performance. Abdullah and Page (2009) conduct study on CG and corporate performance, using data of FTSE 350 companies of UK find little support of association between CG and corporate performance. They further that CG factors explain very little variation in risk variables. While Sueyoshi et al. (2010) bring new empirical evidence that corporate governance reforms by the Japanese government have influence on the performance of Japanese firms. They further prove that foreign shareholders bring managerial discipline and experiences which ultimately enhance the operational performance of Japanese firms. Bauer et al. (2010) while studying the impact of corporate governance of Real Estate Investment Trusts (REIT) and their performance find that Corporate Governance Quotient Index (CGQ index) is neither related to REIT value measured through Tobins’s Q nor to any of the three operating measures of performance, while REITs with greater property, plant and equipment show relationship between CGQ index and performance. In the same direction is the study done by Aboagye and Otieku (2010), who examine the association between CG of microfinance institutions and performance. The authors found no association between categories based on CG and categories based on financial performance. Renders et al. (2010) find significant positive relationship between CG ratings and performance in a Cross-European study covering fourteen countries after controlling sample selection bias and endogeneity. It is further added that strength of this relationship seems to depend on the quality of institutional environment. In the same direction is the study done by Reddy et al. (2010), who apply ordinary least squares and two stage least squares regression techniques to analyze the impact of New Zealand Securities Commission’s principles of CG on firm performance. It is concluded in their study that these CG principles have positive influence on firm performance measures.

Makki and Lodhi
309
2.2 Studies on CG and IC There are very few studies seek to analyze the association between CG and corporate performance within the context of value addition (Morck et al., 1988; Hermalin and Weisbach, 1991). The association between CG and IC efficiency has been discussed in the literature conceptually (Keenan and Aggestam, 2001) and empirically (Ho and Williams, 2003). In the knowledge economy focus of the firm is being changed from financial and physical resources to knowledge intensive activities. That’s why it is the fiduciary responsibility of CG for creating, developing and leveraging IC embedded in the people, structures, and process of the firm (Keenan and Aggestam, 2001). They argue that IC exists in every firm regardless of the efficiency of governance boards to exploit it. They further conceptualize that responsibility of creating and leveraging IC may be given to executive directors to gain the competitive advantage and goals of the firm. It is concluded by them conceptually that CG systems are themselves systems of IC. Second study done by Ho and Williams (2003), attempting to examine association between board structure and efficiency of intellectual capital resources, failed to show unconditional link between the four board features and IC efficiency. No specified board feature is associated with corporate performance. Their results further show that board of directors can be treated as an important part of HC and its composition can affect the overall IC efficiency of a firm (Ho and Williams, 2003). While exploring the effect of CG on IC disclosure in European biotechnology companies Cerbioni and Parbonetti (2007) find that proportion of non executive directors has positive impact on IC disclosures while CEO duality, board structure and board size have negative impact on quantity of IC disclosure. Li et al. (2008) examine the relationship between CG structure and IC disclosure of UK listed firms. They found that board composition, ownership structure, audit committee size and frequency of audit committee meetings have significantly positive relation with IC disclosure while role duality was found insignificant. Kraft and Ravix (2008) conceptualize that CG and the governance of knowledge is concerned with firm’s knowledge and competence rather than products and markets. They elaborate that contrary to agency problem and market valuation, corporate governance means that investors and managers interact and collaborate in a process of constructing knowledge, competence, learning process to create and effective coordination of interrelated resources and activities. Saifieddine, et al. (2009), while examining the relationship between IC and CG in a university setting, conclude that CG and IC are indeed related and CG is a major factor attracting IC in an organization. They further argue that lack of good CG can lead to an inability to attract and retain IC. 2.3 Studies on IC and Firm Performance Value Added Intellectual Coefficient (VAIC) has been widely utilized in analyzing the performance of different industrial sectors specially knowledge intensive banking industry. Mavridis (2004), Goh (2005), Kamath (2010) and Joshi et al. (2010) used VAIC
to analyze the performance of Japanese, Malaysian, Pakistani and Australian banks respectively and found it useful to analyze and evaluate differences in HC and SC performance among different banks. Mavridis (2005) again used VAIC and its subordinate concept that is best performance index (BPI) to analyze the performance of

Corporate Governance, Intellectual Capital and Financial Performance
310
Greek banking sector and focused on the role of human capital (HC) and physical capital (CA) in value addition. VAIC; a ground breaking development (Bontis and Nikitopoulos, 2001) has further been used in analyzing the IC performance of Australian hotel industry. Laing et al. (2010) found it as robust tool in assessing the value addition of IC in service industry successfully. They state that VAIC can be used by management of a company to assess their own organization’s performance without having to rely on industry standards. Tan et al. (2007), using VAIC methodology on 150 listed companies' data of Singapore Stock Exchange, conclude that IC and company performance are moderately positively correlated while contribution of IC to company performance differs by industry. They applied partial least square technique and found weak correlation between IC and future financial returns. Their results also prove higher contribution of IC in service and lower contribution in industrial sectors. One of the important studies conducted by Appuhami (2007) using VAIC method on Thai banking, finance and insurance sector found very strong and significant relationship between firm’s IC and investors’ capital gains on shares. The study also indirectly proves the relationship between capital gain on shares and corporate financial performance. Later study, conducted by Yalama and Coskun (2007) on intellectual capital performance of banking sector of Istanbul stock exchange, reveals strong association of VAIC with profitability using relatively new technique of Data Envelopment (DEA) Analysis in IC. Ghosh and Wu (2007) found IC as significant explanatory variable of firm value after controlling the effect of financial performance on firm value. Impact of IC and its components on financial performance is being studied in the last 8 years but still no consensus has been reached on its solid role due to dissimilar results in studies conducted in different countries. Firer and Williams (2003) applied VAIC on 75 listed companies of South Africa to study the association between the efficiency of value added and profitability, productivity and market valuation. But empirical results found were generally limited and mixed between three components of VAIC and dependent variables. Their mixed and inconclusive results prompt researchers to conduct more research on the role of IC. They indicate to conduct future research on the role of IC in corporate performance across time and nations in their domestic settings to conclude the matter. Another study conducted by F-Jardon and Martos (2009) find direct effect of structural capital on performance while indirect effect of other dimensions of IC on performance through structural capital. They use partial least square technique to estimate the impact through a sample of 113 small and medium size wood manufacturers in Argentina. Further, Ting and Lean (2009) while exploring intellectual capital performance of financial institutions in Malaysia found that all three components of VAIC are associated with return on assets and contribute up to 71.6% explanatory power. Zeghal and Maaloul (2010) analyze the role of value added as an indicator of intellectual capital and its consequences on company performance. They used data of 300 UK firms related to high tech, traditional and service sectors for the year 2005. Their conclusion shows that IC has significant positive impact on both economic and financial performance. In this study up to 55% variation in economic performance has been explained by IC variables. Their study indicates that IC plays a major role in reducing company’s production cost. It is further concluded by Zeghal and Maaloul (2010) that VAIC method can be an important
Makki and Lodhi
311
tool for many decision makers to integrate IC in their decision process. Sharbati et al. (2010) explore the relationship of three intellectual capital components with business performance in pharmaceutical sector of Jordon. They find that all three components of intellectual capital increase business performance and explain up to 51.7% variation in productivity, profitability and market valuation using partial least square methodology. 2.4 Concluding the Literature Review A comprehensive review of literature shows that the researchers have not reached any consensus and document that some studies find significant impact of CG on financial performance (Ehikioya, 2009; Gruszczynski, 2006; Gemmill and Thomas, 2004; Drobetz et al., 2003; Alves and Mendes, 2002 and Yermack, 1996) while others demonstrate no association (Aboagye and Otieku, 2010; Sueyoshi et al., 2010; Bauer et al., 2010; Abdullah and Page, 2009). These mixed results prompt the researchers to investigate the role of IC in the relationship between CG and financial performance. Even those studies which provide inconclusive results argue that CG has at least indirect effect on performance (Maassen, 1999). Further studies are needed to determine interplay of CG, IC and financial performance. In this way, our study attempts to test the previously untested CG and IC link suggested by Keenan and Aggestam (2001) and follows the future study directions of Ho and Williams (2003) to test and confirm the CG and IC link over the time. Our study also follows the future study directions of Cabrita and Bontis (2008); Sueyoshi et al. (2010) and Zeghal and Maaloul (2010) to test the association of IC and financial performance in different international settings and using different IC model, such as VAIC. 3. Developing Structural Links and Model This study attempts to draw structural links between CG, IC and firm financial performance based on random sample from Karachi Stock Exchange (KSE) all listed companies. The research is quantitative and based on 5 years data gathered from audited annual reports of the companies covering the period 2005-09. The KSE companies have been selected for research; keeping in view that most of the listed companies are big enough to acquire, develop and exploit IC assets. Comprehensive data on CG, IC and financial performance can be extracted from audited annual reports of these publicly traded companies easily. Moreover, the stratified random sample of KSE listed companies cover twenty six industrial sectors, thus increasing the generalizability of the research outcome. The research focuses on good CG measures and their structural connection with IC efficiency and financial performance. Further, it develops a structural model to prove these connections based on the premise that board of directors is responsible for developing IC and to achieve maximum efficiency from IC to gain higher financial performance. That’s why board composition, ownership structure, board meetings, CEO duality and managerial remuneration have been taken as firm level CG measures. While IC efficiency has been measured through VAIC methodology which provides standardized and straightforward measure to calculate and compare IC performance across various sectors at national and international level. The method uses publicly available audited information thus increases reliability and usable by internal as well as external stakeholders to check IC efficiency. The VAIC based view of the firm gives

Corporate Governance, Intellectual Capital and Financial Performance
312
better insight to scrutinize value creation efficiency of a firm. The financial performance of a firm is measured by return on investment (ROI), return on equity (ROE) and net profit after tax (NPAT) following the studies conducted by Mavridis (2005) and Tan et al. (2007). 3.1Developing Hypothesis Most of the researchers emphasize the need of systematic way of developing and testing the hypothesis. Following their view, this research study aims to develop three hypotheses. All of them deal with the structural relationship of CG measures with IC efficiency and financial performance. While partial least square based structural equation modeling has been used to test these hypotheses. 3.2 Impact of CG Measures on Financial Performance In the literature related to CG, relationship between CG and corporate performance has been widely studied but no consensus has been reached. There is a widely held view that good corporate governance practices are associated with better firm performance. At the same time, there are also scholars who are of the view that CG has remote link with performance. While poor corporate performance has also been treated as a byproduct of poor CG measures. With effective governance system corporate governors are directed towards improving their managerial performance and maximizing the corporate value. Considering these arguments, below mentioned CG measures are considered to have impact on IC efficiency and financial performance of an organization: Considering the conflicting arguments and evidences from the literature regarding the relationship between different CG measures and financial performance, it seems appropriate to revisit this link. Thus study proposes its first testable hypothesis as follows:
H1 All else being equal, companies with good corporate governance measures tend to have higher financial performance.
3.3 Impact of CG measures on IC efficiency Role of CG measures has already been discussed in detail in the above section. As far as IC measures are concerned literature is in agreement with three dimensions of IC, i.e. human capital, structural or organizational capital and relational or customer capital. As this research is based on Pulic’s model; the VAIC, which includes capital employed rather than relational capital while relational capital is considered a part of structural capital. The link between CG and IC was first discussed in the literature conceptually by Keenan and Aggestam in 2001. Ho and Williams (2003) was the first ever study attempted to check the impact of board structure on IC efficiency measured through VAIC. Keenan and Aggestam (2001) argue that it is the fiduciary responsibility of CG for creating, developing and leveraging IC embedded in the people, structures, and processes of the firm. The only empirical study attempted to confirm this relationship partially is done by Ho and Williams in 2003. They failed to show unconditional link between the four board features and IC efficiency measured through VAIC. Individual measures of CG were significant with no consistently across all three nations. In a recent study related to CG and firm performance, Saifieddine, et al. (2009), while examining the relationship

Makki and Lodhi
313
between IC and CG in a university setting, conclude that CG and IC are indeed related and CG is a major factor attracting IC in an organization. In consistent with this Abidin et al. (2009) find that proportion of NEDs and board size has positive relation with IC efficiency. This discussion provides support to the second hypothesis that good CG measures may exert positive impact on IC efficiency:
H2 All else being equal, companies with good corporate governance measures tend to have higher intellectual capital efficiency.
3.4 Impact of IC Efficiency on Financial Performance Literature is in agreement with three dimensions of IC, i.e. human capital, structural or organizational capital and relational or customer capital. In accordance with the extended model of VAIC (Pulic, 1998; Pulic, 2000; Pulic, 2004; Makki and Lodhi, 2009), IC indicators are as follows: Human Capital: HC is considered the most important asset of an organization which not only increases the operational efficiency in using tangible assets but creates intangible assets as well. From the literature it is also confirmed that successful companies always invest in HC to develop its overall working capabilities and environment. Investment in employee capabilities has direct impact on financial performance of a firm (Becker et al. 2001). While Youndt (1998) judges that influence of HC on organization performance is uncertain. So, in this situation of contradictory literature support, it is logical to check empirically whether being an important part of IC, HC has direct relationship with financial performance of a firm or not? Structural Capital: SC is deemed as foundation stone for an organization in the knowledge age. If the organizational culture, rules, procedures and system is weak, well motivated employee capabilities would not be able to add value to the firm. Strong structural capital provides supportive environment to its employees thus increasing productivity and eventually profit and decreasing total cost of product (Bozbura, 2004; Shiu, 2006; Tan et al., 2007). So, it can be pronounced that SC has direct relationship with financial performance of a firm. Capital Employed: VAIC is an aggregate measure of corporate intellectual efficiency. It includes financial capital/capital employed as part of IC efficiency considering better utilization of physical assets is possible only due to efficient HC and SC (Makki and Lodhi, 2009). Considering this argument it is proposed to examine the relationship between capital employed efficiency and firm’s financial performance. Board Meetings: Meetings of the board of directors are generally treated as intellectual exercise by executive and non executive directors. Executive directors are usually responsible for running day to day operations of the company. While non executive directors keep independent and close eye on executives in meetings and over see whether their activities and policies remain fruitful for the business. In accordance with the Companies Ordinance (1984), each listed company must hold at least four board meetings in a year. In this way, good combination of executive and non executive directors on the board with reasonable number of meetings in a year play important role towards overall performance of the company. Vafeas (1999) found that operating performance improves following years of high frequency of board meetings.

Corporate Governance, Intellectual Capital and Financial Performance
314
Number of Executives: According to the Companies Ordinance (1984), executives means officers other than CEO and directors drawing basic salary of more than Rs.500,000 in a financial year. They are usually high caliber officers and act as heads of their sections/departments. They supervise operations related to procurement, processing, system development, marketing, finance, R & D and general administration. They are not actual doers but their duty is to get the job done through their subordinates. Being intellectuals and real knowledge workers, they are important part of HC. Their efficiency contributes directly to HC, SC, CE. Due to their vital contribution towards overall IC efficiency, it is argued that impact of number of executives on IC efficiency in a firm should be studied. A study by Makki and Lodhi (2009) conclude that number of executives in an organization play moderating role towards increasing the impact of IC efficiency on financial performance. However, the above debate on the role of IC efficiency towards financial performance continues with conflicting outcomes. Keeping in view the evidences from literature, it is assumed that any increase in IC efficiency is likely to have positive impact on financial performance of an organization. In line with arguments and literature support, third hypothesis of this study is as follows:
H3 All else being equal, companies with greater intellectual capital efficiency tend to have higher financial performance.
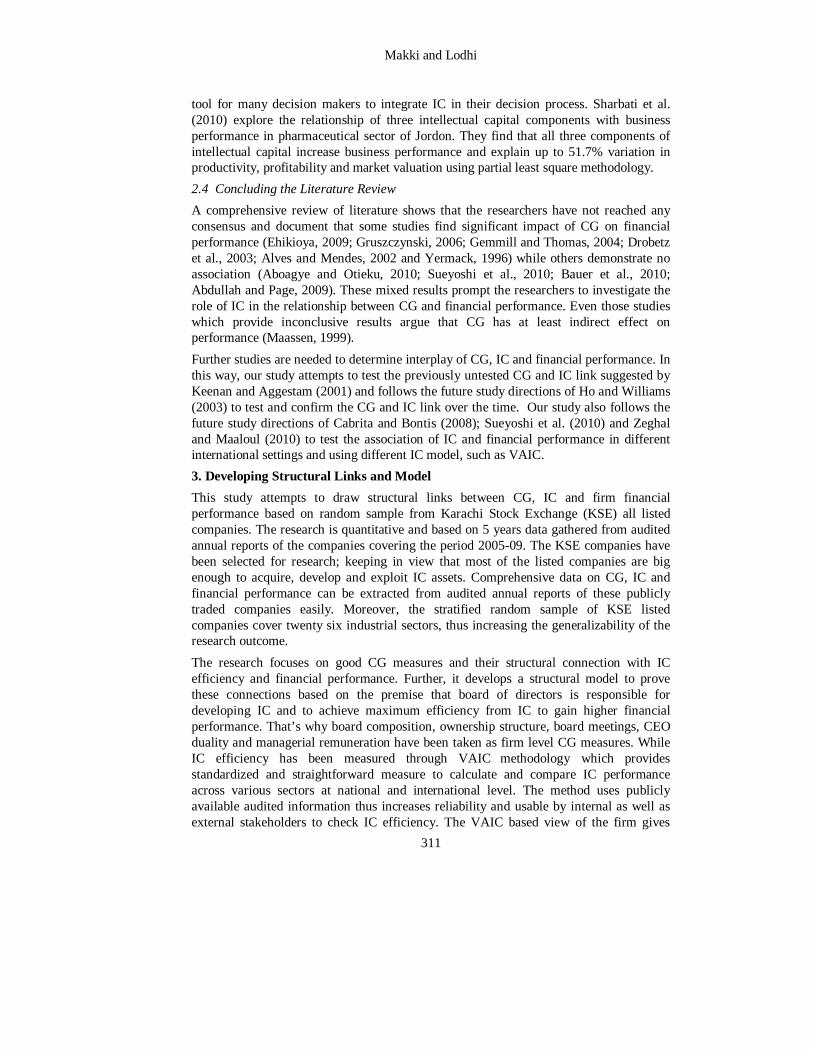
Using PLS based SEM, the following Figure shows structural connection among H1, H2 and H3 being modeled in this study.
Makki and Lodhi
315
Figure 1: Structural Model Measuring the Impact of CG on IC Efficiency and FP 3.5 Developing the Structural Equations Finally research model of this study is to be developed through generating structural equations that link CG – IC efficiency and financial performance. 3.5.1 Measurement Model Above Figure shows all indicators (shown in squares) build and influence their respective latent constructs (shown in circles). These latent constructs can be measured in mathematical terms as:
654321 654321 XXXXXX xxxxxx
54321 543211 YYYYY xxyyy
876 8762 XYY xyy
Corporate Governance, Intellectual Capital and Financial Performance
316
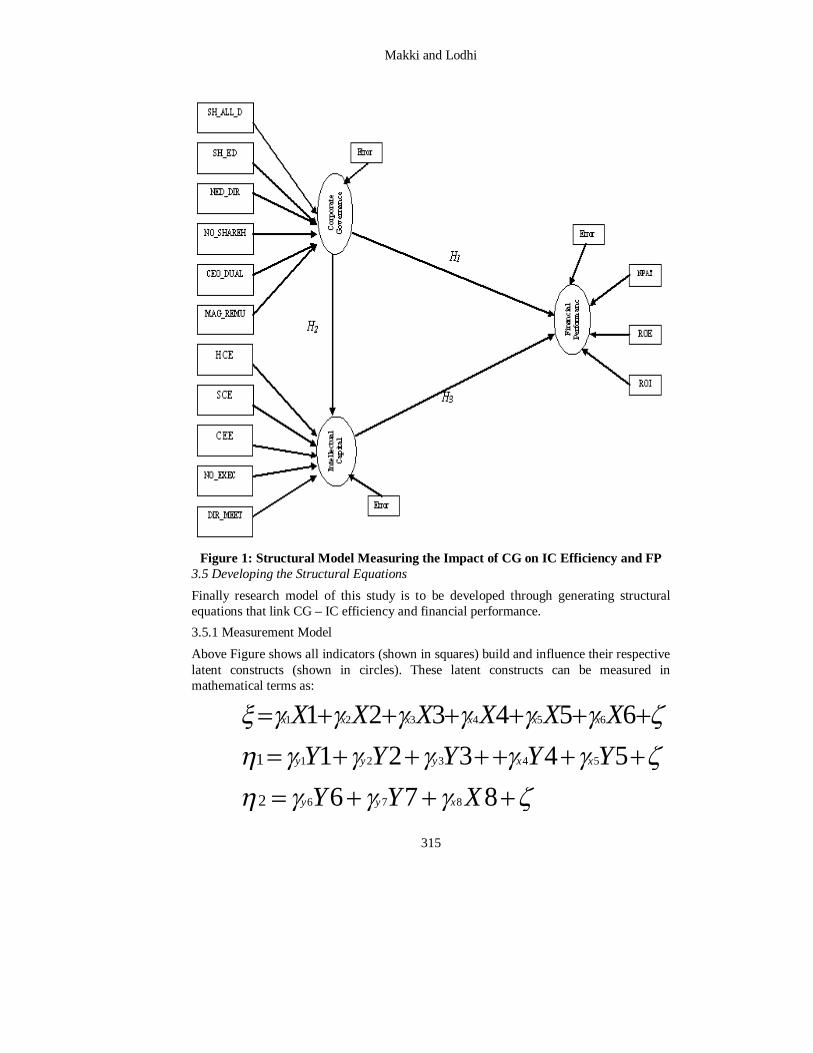
3.5.2 Structural Model The first hypothesis (H1), impact of latent exogenous variables, CG measures ( ) on latent endogenous variables, financial performance ( 2 ) would be measured through:
112 (H1) While second hypothesis (H2), impact of latent exogenous variables, CG measures ( ) on latent endogenous variables, IC efficiency ( 1 ) would be measured through:
111 (H2) In this way, last hypothesis (H3) impact of IC efficiency ( 1 ) on financial performance ( 2 ) would be calculated through:
112 (H3) While the impact of both CG measures ( ) and IC efficiency ( 1 ) on financial performance ( 2 ) would be calculated through:
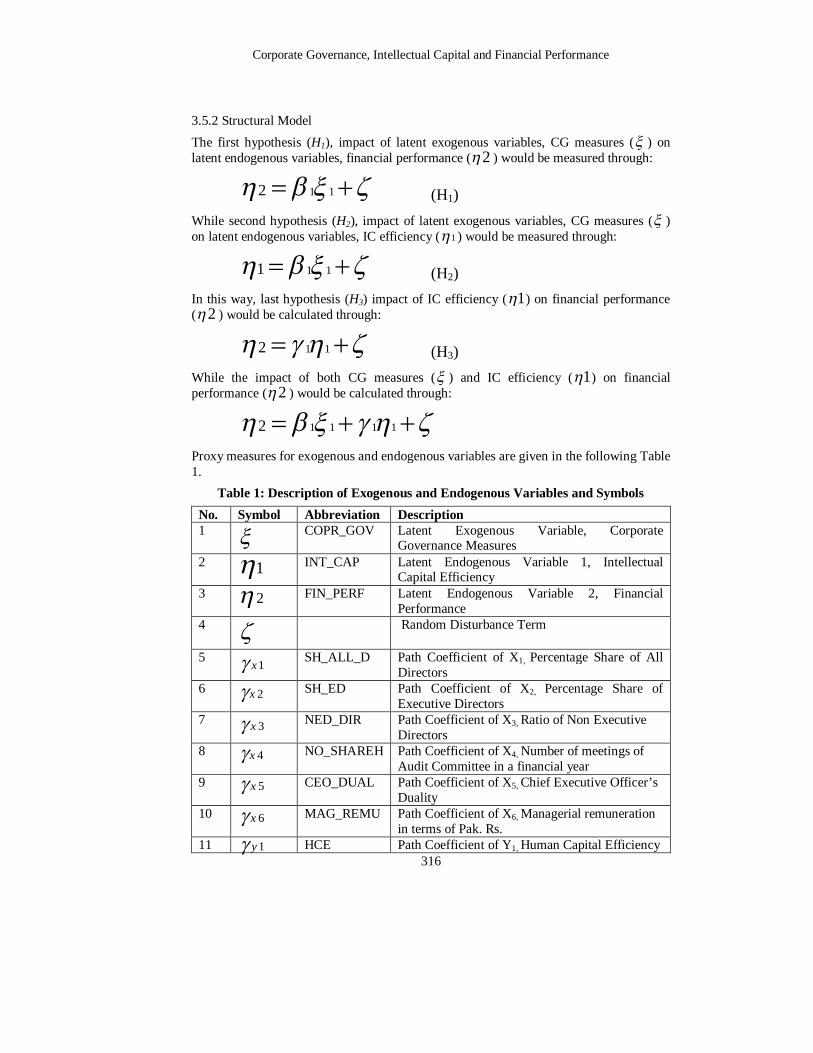
11112 Proxy measures for exogenous and endogenous variables are given in the following Table 1.
Table 1: Description of Exogenous and Endogenous Variables and Symbols No. Symbol Abbreviation Description 1
COPR_GOV Latent Exogenous Variable, Corporate Governance Measures
2 1 INT_CAP Latent Endogenous Variable 1, Intellectual
Capital Efficiency 3 2
FIN_PERF Latent Endogenous Variable 2, Financial Performance
4 Random Disturbance Term
5 SH_ALL_D Path Coefficient of X1, Percentage Share of All Directors
6 SH_ED Path Coefficient of X2, Percentage Share of Executive Directors
7 NED_DIR Path Coefficient of X3, Ratio of Non Executive Directors
8 NO_SHAREH Path Coefficient of X4, Number of meetings of Audit Committee in a financial year
9 CEO_DUAL Path Coefficient of X5, Chief Executive Officer’s Duality
10 MAG_REMU Path Coefficient of X6, Managerial remuneration in terms of Pak. Rs.
11 HCE Path Coefficient of Y1, Human Capital Efficiency
1x2x3x4x5x6x1y

Makki and Lodhi
317
12 SCE Path Coefficient of Y2, Structural Capital Efficiency
13 CEE Path Coefficient of Y3, Capital Employed Efficiency
14 NO_EXEC Path Coefficient of Y4, Number of executives 15 DIR_MEET Path Coefficient of Y5, Presence in directors
meeting 16 ROI Path Coefficient of Y6, Return on Investment
17 NPAT Path Coefficient of Y7, Net Profit after Tax
18 ROE Path Coefficient of Y8, Return on Equity The data for the study consists of stratified random sample of all KSE listed companies. Validity and reliability of all constructs have been checked before fitting the above equations to work out the structural connections. 4. Data Analysis and Results 4.1 Determining Relationship among Indicators and Constructs It is interesting to find relationship among various components of CG, IC efficiency and financial performance. Finding correlation coefficient provides a quantitative measure of the strength of relationship between independent and dependent variables. It is suggested that if correlation between independent variables is 0.90 or greater, it indicates that multicollinearity exists (Tabachnick and Fidell, 1996; Pallant, 2001). The correlation checked through applying SPSS shows that no bivariate correlation exceeds 0.90 limits given by Tabachnick and Fidell, 1996. It can be concluded that all independent variables are sufficiently independent of each other and there is no indication of multicollinearity. Pearson product-moment correlation for the year 2009-05 shows that companies with high CE efficiency are more likely to be high in ROI. This relationship remains significant in four out of the five years study period. Which emphasizes that knowledge; skill, experience, creative ideas, leadership and entrepreneurial abilities of intellectual resources have strong impact financial performance. It can be concluded from correlation matrices 2005-2009 that CE efficiency is playing most important role towards financial performance of firms. Remuneration of chief executive officer, directors and other executives show significant positive relationship with NPAT in all five years period (r = 0.66, 058, 0.73, 0.58 and 0.54 ) indicating the direct link of CG measures with financial performance. While this indicator also remains positively significant with other financial performance measures, i.e. ROI and ROE thus confirming the pay-performance relationship in KSE listed companies. Managerial remuneration has significantly positive correlation with the presence of directors in the board meetings (r = 0.30, 0.19, 0.73, 0.58 and 0.54) in all five years period 2005 to 2009. This clearly emphasizes that better remuneration policy motivates the directors to get them involved in board meetings and play their role in planning,
2y3y4y5y
6y7y8y

Corporate Governance, Intellectual Capital and Financial Performance
318
decision-making, supervision and controlling functions of the board. More activity and involvement of directors leads to increase monitoring capacity of the board and firm performance. As Vafeas (1999) concludes that firm performance improves after board activity. According to Hulland (1999) reflective indicators within a construct should have high correlation because they all are dependent on the same latent construct. But formative indicators of the same construct can have positive, negative or zero correlation with one another. Formative indicators within a construct do not assumed to be correlated nor they measure the same underlying phenomenon (Chin, 1998). In this situation of all formative indicators, it seems appropriate to analyze correlation between constructs rather than indicators through the following tables.
Table 2 Correlations Matrix - Latent Constructs (2009)
Construct Fin_Perf Corp_Gov Int_Cap
Fin_Perf. 1.000 - -
Corp_Gov 0.711 *** 1.000 -
Int_Cap 0.728 *** 0.978 *** 1.000 *** Significance at 1% (2.576)
Table 3 Correlations Matrix - Latent Constructs (2008)
Construct Fin_Perf Corp_Gov Int_Cap
Fin_Perf. 1.000 - -
Corp_Gov 0.659*** 1.000 -
Int_Cap 0.707*** 0.947*** 1.000 *** Significance at 1% (2.576)
Table 4 Correlations Matrix - Latent Constructs (2007)
Construct Fin_Perf Corp_Gov Int_Cap
Fin_Perf. 1.000 - -
Corp_Gov 0.755*** 1.000 -
Int_Cap 0.718*** 0.857*** 1.000 *** Significance at 1% (2.576)

Makki and Lodhi
319
Table 5 Correlations Matrix - Latent Constructs (2006)
Construct Fin_Perf Corp_Gov Int_Cap
Fin_Perf. 1.000 - -
Corp_Gov 0.667** 1.000 -
Int_Cap 0.741*** 0.909*** 1.000 ** Significance at 5% (1.96) *** Significance at 1% (2.576)
Table 6 Correlations Matrix - Latent Constructs (2005)
Construct Fin_Perf Corp_Gov Int_Cap
Fin_Perf. 1.000 - -
Corp_Gov 0.632*** 1.000 -
Int_Cap 0.656*** 0.940*** 1.000 *** Significance at 1% (2.576)
Above tables 2 to 6 show correlation and its significance between different construct. All relationships among three constructs; CG measures, IC efficiency and financial performance remain significant in all five years 2005-09. These relationships support the theory presented in the study regarding the impact of CG measures on IC efficiency and financial performance. 4.2 Partial Least Square Analyses The study analyses the data, estimates the path coefficients ( ), coefficient of determination (R2) and predictive relevance (Q2) by using PLS Graph Version 3.0. All constructs are measured as formative rather than reflective. PLS results are interpreted in two stages: the measurement model, which includes the assessment of reliability and validity of measures used in each construct of PLS model. In the second stage, structural model is analyzed on the basis of significance of relationship (path coefficients), amount of variance explained (R2) and the models predictive relevance (Q2) (Barclay et al. 1995). This sequence ensures that the constructs’ measures are valid and reliable before attempting to draw inference regarding path coefficients, coefficients of determination and predictive relevance (Barclay et al., 1995). 4.3 Analysis of the Structural Model Once the quality of measurement model is confirmed through above mentioned appropriate tests, the quality of structural model is assessed on the basis of significance of relations between latent constructs ( ), overall goodness of fit (R2) and predictive power of the model (Q2). To understand the dynamics of CG, IC and their impact on financial performance, it seems advantageous to apply structural equation modeling based on partial least square to measure the impact of a set of independent variables on another set of dependent variables. PLS is a non-parametric technique which combines principal component analysis and regression and does not require normality of data.

Corporate Governance, Intellectual Capital and Financial Performance
320
The PLS based SEM gives an estimation of the impact of CG on IC efficiency and financial performance. In mathematical terms it would be:
11112
Left side ( 2 ) of the equation specifies the outcome variable i.e. financial performance while right side ( 1 ) specifies the coefficient of latent endogenous variable ( 1 ), i.e. corporate governance. Secondly ( 1 ) is the coefficient of second latent endogenous variable ( 1 ) i.e. intellectual capital efficiency and ( ) is the random disturbance term.
In PLS based SEM, strength of hypotheses formulated in the research is generally measured through analyzing path coefficients ( ). Standardized path coefficients permit the fulfillment of the proposed hypotheses (Saenz et al. 2007; Serrano-Cinca et al. 2009). In order to have the statistical significance of path coefficients ( ) a bootstrapping technique through 500 resamples with replacement was applied (Table 8 to 12).
Table 7 Path Coefficients (2009) Path Beta
Coefficient t-value Significance
Corp_Gov and Fin_Perf. -0.0210 0.0137 p>0.10 Int_Cap and Fin_Perf. 0.7490** 1.9117 p<0.05 Corp_Gov and Int_Cap 0.9780*** 98.475 p<0.01
** Significance at 5% (1.96) *** Significance at 1% (2.576)
Table 8 Path Coefficients (2008) Path Beta
Coefficient t-value Significance
Corp_Gov and Fin_Perf. -0.1070 0.1788 p>0.10 Int_Cap and Fin_Perf. 0.8080** 2.3979 p<0.05 Corp_Gov and Int_Cap 0.9470*** 53.1568 p<0.01
** Significance at 5% (1.96) *** Significance at 1% (2.576)
Table 9 Path Coefficients (2007) Path Beta
Coefficient t-value Significance
Corp_Gov and Fin_Perf. 0.5280* 1.7376 p<0.10 Int_Cap and Fin_Perf. 0.2650 0.7261 p>0.10 Corp_Gov and Int_Cap 0.8570*** 11.0998 p<0.01
* Significance at 10% (1.645) *** Significance at 1% (2.576)
Makki and Lodhi
321
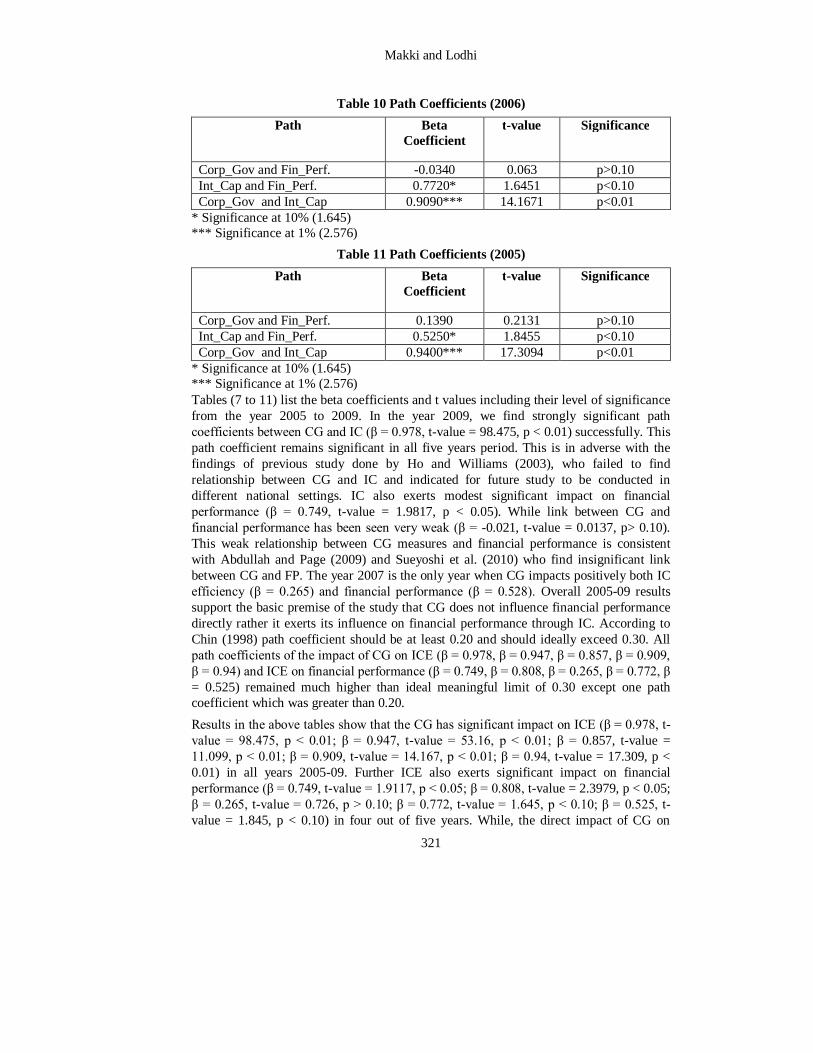
Table 10 Path Coefficients (2006) Path Beta
Coefficient t-value Significance
Corp_Gov and Fin_Perf. -0.0340 0.063 p>0.10 Int_Cap and Fin_Perf. 0.7720* 1.6451 p<0.10 Corp_Gov and Int_Cap 0.9090*** 14.1671 p<0.01
* Significance at 10% (1.645) *** Significance at 1% (2.576)
Table 11 Path Coefficients (2005) Path Beta
Coefficient t-value Significance
Corp_Gov and Fin_Perf. 0.1390 0.2131 p>0.10 Int_Cap and Fin_Perf. 0.5250* 1.8455 p<0.10 Corp_Gov and Int_Cap 0.9400*** 17.3094 p<0.01
* Significance at 10% (1.645) *** Significance at 1% (2.576) Tables (7 to 11) list the beta coefficients and t values including their level of significance from the year 2005 to 2009. In the year 2009, we find strongly significant path coefficients between CG and IC (β = 0.978, t-value = 98.475, p < 0.01) successfully. This path coefficient remains significant in all five years period. This is in adverse with the findings of previous study done by Ho and Williams (2003), who failed to find relationship between CG and IC and indicated for future study to be conducted in different national settings. IC also exerts modest significant impact on financial performance (β = 0.749, t-value = 1.9817, p < 0.05). While link between CG and financial performance has been seen very weak (β = -0.021, t-value = 0.0137, p> 0.10). This weak relationship between CG measures and financial performance is consistent with Abdullah and Page (2009) and Sueyoshi et al. (2010) who find insignificant link between CG and FP. The year 2007 is the only year when CG impacts positively both IC efficiency (β = 0.265) and financial performance (β = 0.528). Overall 2005-09 results support the basic premise of the study that CG does not influence financial performance directly rather it exerts its influence on financial performance through IC. According to Chin (1998) path coefficient should be at least 0.20 and should ideally exceed 0.30. All path coefficients of the impact of CG on ICE (β = 0.978, β = 0.947, β = 0.857, β = 0.909, β = 0.94) and ICE on financial performance (β = 0.749, β = 0.808, β = 0.265, β = 0.772, β = 0.525) remained much higher than ideal meaningful limit of 0.30 except one path coefficient which was greater than 0.20. Results in the above tables show that the CG has significant impact on ICE (β = 0.978, t-value = 98.475, p < 0.01; β = 0.947, t-value = 53.16, p < 0.01; β = 0.857, t-value = 11.099, p < 0.01; β = 0.909, t-value = 14.167, p < 0.01; β = 0.94, t-value = 17.309, p < 0.01) in all years 2005-09. Further ICE also exerts significant impact on financial performance (β = 0.749, t-value = 1.9117, p < 0.05; β = 0.808, t-value = 2.3979, p < 0.05; β = 0.265, t-value = 0.726, p > 0.10; β = 0.772, t-value = 1.645, p < 0.10; β = 0.525, t-value = 1.845, p < 0.10) in four out of five years. While, the direct impact of CG on

Corporate Governance, Intellectual Capital and Financial Performance
322
financial performance is significant (β = 0.528, t-value = 1.7376, p < 0.10) in the year 2007 and remains insignificant in the rest of four years. In this way, it can be concluded that CG does not influence financial performance directly rather it exerts its positive influence on financial performance through enhancing IC efficiency. 4.4 Overall Model Estimation and Testing R2 measures the proportion of the variance in dependent latent construct explained by independent latent constructs. R2 values of the IC construct explained by CG measures remain high (95.6%, 89.7%, 73.5%, 82.7%, 88.4%) over the five year period. While R2 values of financial performance were 53%, 50.1%, 58.9%, 54.9% and 43.2% in the period 2009-05. All the models demonstrate good explanatory power as the R2 values of endogenous construct financial performance range from 43.2% to 58.9%. Overall models demonstrate very high explanatory power up to 95.6%. According to categorization of R2 effect size (small: 10%; medium: 25% and large: 36%) given by Cohen (1998), all R2 in this study are much higher than the large effect size. Bellman (2003) considers R2 greater than 10% as satisfactory and worth reporting in exploratory research. Model’s predictive validity can be tested through non-parametric Stone Geisser test (Geisser, 1975). Stone Geisser test of predictive relevance (Q2) is applied to determine whether there is predictive relevance of independent variables in the model. For this purpose cross validated redundancy (Q2) parameter has been applied. Q2 should be greater than zero to conclude that the model has predictive validity (Chin, 1998). Otherwise the model cannot be granted predictive relevance (Fornell and Cha, 1994). In this way higher is the value of Q2 greater would be the predictive relevance of the model. The Q2 statistic is a jackknife version of the R2 statistic. It does not require assumption about the distribution of residuals. The test uses blindfolding procedure and systematically assumes that a part of the raw data matrix is missing during the parameter estimation. The blindfolding procedure removes some data from the sample and treats it as missing in the estimation. Then obtained parameter estimates are used to reconstruct the missing raw data. Thus the technique produces general cross validation metrics as well as the parameter estimates’ jackknifing standard deviation. It is interpreted without loss of degrees of freedom. The test shows how well the data can be reconstructed with the help of the model and the PLS parameters (Fornell and Cha, 1994) In this study Q2 remains greater than zero in all years 2005-09 indicating that the model has good predictive power. However, if the values are very closer to zero, it can be said that the predictive power of the model is within the recommended threshold. Forthcoming tables show that CG and IC efficiency measures taken in the models are important drivers of financial performance.

Makki and Lodhi
323
Table 12 Overall Model Statistics (2009) Path R2 Q2 Test Criterion
Corp_Gov, Int_Cap and Fin_Perf
53% - -
Corp_Gov and Int_Cap 95.6% - - Stone Geisser test of predictive relevance
- 0.0938 >0.000
Table 13 Overall Model Statistics (2008) Path R2 Q2 Test Criterion
Corp_Gov, Int_Cap and Fin_Perf
50.1% - -
Corp_Gov and Int_Cap 89.7% - - Stone Geisser test of predictive relevance
- 0.0325 >0.000
Table 14 Overall Model Statistics (2007) Path R2 Q2 Test Criterion
Corp_Gov, Int_Cap and Fin_Perf
58.9% - -
Corp_Gov and Int_Cap 73.5% - - Stone Geisser test of predictive relevance
- 0.212 >0.000
Table 15 Overall Model Statistics (2006) Path R2 Q2 Test Criterion
Corp_Gov, Int_Cap and Fin_Perf
54.9% - -
Corp_Gov and Int_Cap 82.7% - - Stone Geisser test of predictive relevance
- 0.1157 >0.000
Table 16 Overall Model Statistics (2005) Path R2 Q2 Test Criterion
Corp_Gov, Int_Cap and Fin_Perf
43.2% - -
Corp_Gov and Int_Cap 88.4% - - Stone Geisser test of predictive relevance
- 0.055 >0.000
The above data, analyses and results support the model proposed in the study that CG does not impact the financial performance directly rather it impacts the financial performance through IC efficiency. Overall findings suggest that financial performance can be predicted successfully through CG and IC up to 58.9%.

Corporate Governance, Intellectual Capital and Financial Performance
324
4.5 Results of Hypotheses Testing The study tests the hypotheses formulated in the beginning on the bases of strength of path coefficients by calculating multiple path values through PLS Graph Version 3.0. The standardized path coefficient ( ) shows the significance of relations between latent constructs and permit the fulfillment of the proposed hypotheses to be analyzed. Chin (1998) suggests value of path coefficient should be at least 0.20 and may ideally exceed 0.30 to analyze the hypothesis meaningfully. All values of the impact of CG on IC efficiency (H2) have been significant and fall between 0.857 and 0.978, that is much higher than 0.30 over the five year period. Relationship between IC efficiency and financial performance (H3) also shows significant values in all five years and remained between 0.525 and 0.808. While link between direct relation of CG with financial performance shows very weaker values and remains lesser than 0.14 in all years except in 2007 when it is insignificant but up to 0.528. In this way it can be concluded that CG exerts insignificant, inconsistent and weaker impact on financial performance directly rather it impacts the financial performance through IC efficiency. Forthcoming table shows hypotheses testing for the period 2005-09.
Table 17 Hypothesis Testing (2009)
Hypothesis Suggested effect
Path coefficient Sig. Confirmed
H1
All else being equal, companies with good corporate governance measures tend to have
higher financial performance.
+
-0.0210
p>0.10
no
H2
All else being equal, companies with good corporate governance measures tend to have
higher intellectual capital efficiency.
+
0.7490***
p<0.05
yes
H3
All else being equal, companies with greater
intellectual capital efficiency tend to have
higher financial performance.
+
0.9780***
p<0.01
yes
*** Significance at 1% (2.576) In hypothesis H1 it is suggested that CG would have positive impact on financial performance. Table shows values for the parameter of this relationship (-0.0210, -0.1070, 0.5280, -0.0340, 0.1390) for the period 2009-05. All of these path coefficients are statistically insignificant, thus it proves that CG does not exert significant impact on financial performance directly. In this way H1 related to the impact of CG on financial performance is not supported.

Makki and Lodhi
325
The hypothesis H2 suggests that CG has positive impact on IC efficiency of organizations. Above table demonstrates highly significant values for the parameter of this relationship (0.978, p < 0.01; 0.947, p < 0.01; 0.857, p < 0.01; 0.909, p < 0.01; 0.940, p < 0.01) over the period 2009-05. This indicates good support for H2 relating to the impact of CG on IC efficiency. It proves that CG construct is relevant antecedent and exerts significant impact in improving the IC efficiency of business enterprises, thus H2 is supported. The third proposition of the study is that IC efficiency in turn increases the financial performance (H3). Above table demonstrates highly significant values for the parameter of this relationship 0.749, p < 0.01; 0.808, p < 0.05; 0.265, p > 0.10; 0.772, p < 0.05; 0.525, p < 0.10 respectively over the period 2009-05. This relationship remained significant in four out of five years. It proves that IC efficiency is an important factor that stimulates the financial performance of business enterprises, hence H3 is supported. Secondly, variance explained by the endogenous constructs (R2) and prediction power of the model (Q2) were also analyzed to confirm the hypotheses. Regarding the H2, high R2 between 73.5% and 95.6% demonstrates that variance in IC efficiency can be explained by CG measures successfully. While for the H3 table shows that endogenous construct financial performance is relevant consequent and can be predicted successfully up to 58.9% through its relevant antecedents; CG and IC efficiency. Further H2 and H3 also pass the Stone Geisser test (Q2) of predictive relevance >0.00. Given the above analyses and results, the study supports rejection of H1 and acceptance of H2 and H3. It further supports the overall model proposed in the study that CG does not impact directly to financial performance rather it impacts the financial performance through IC efficiency. 5. Conclusion The main research issue of this study was to determine the structural links and resulting impacts of CG measures on IC efficiency and firm’s financial performance. Thus it was positioned to conclude CG – IC – Financial Performance relationship through empirical research. The path coefficient values (β) confirm the premise that there is a high positive correlation between CG measures, IC efficiency and financial performance. Further, all hypotheses have also been assessed through coefficient of determination (R2) and Stone Geisser test (Q2). Enough empirical support has been provided to accept H2 and H3, while H1 is not supported. It should be noted that the rejection of H1 is not surprising and consistent with the results of previous studies, such as Abdullah and Page, (2009) and Sueyoshi et al. (2010). While results of H3 are in consistent with the literature, such as Chen et al. (2005); Tseng and Goo (2005); Tan et al. (2007); Makki et al (2008) and Sharbati et al. (2010). After considering the reliability and validity of measurement model and path coefficients, coefficient of determination and Stone Geisser test of structural model, it can be concluded that through our model up to 95.6% variance in IC efficiency and up to 58.9% variance in financial performance can be explained successfully. Overall research concludes that:

Corporate Governance, Intellectual Capital and Financial Performance
326
There is a no direct impact of company’s corporate governance measures on financial performance
There is a significant positive impact of company’s corporate governance measures on intellectual capital efficiency
There is a significant positive impact of company’s intellectual capital efficiency on financial performance.
In this way, study provides first ever empirical evidence that a firm with good CG measures enhances IC efficiency that ultimately generates more return on investment, return on equity and net profit.
REFERENCES Abdullah, A. and Page, M. (2009). Corporate governance and corporate performance: UK FTSE 350 Companies, Institute of Chartered Accountants of Scotland, Edinburgh, UK. Abidin, Z. Z., Kamal, N. M., & Jusoff, K. (2009). Board structure and corporate performance in Malaysia. International Journal of Economics and Finance, 1(1), 150-164. Aboagye, A.Q. and Otieku, J. (2010). Are Ghanian MFIs’ performance associated with corporate governance? Corporate Governance, 10(3), 307-320. Alves, C. and Mendes, V. (2002). Corporate governance policy and company performance: the Portuguese case, Working paper, Centre de Estudos Macroeconomicos e Previsao (CEMPRE), Universidade do Porto, Portugal. Appuhami, B.A.R. (2007). The impact of intellectual capital on investors’ capital gain on shares: An empirical investigation in Thai banking, finance and insurance sector. Journal of Internet Banking and Commerce, 12(1), 1-14. Barclay D., Higgins, C. and Thompson, R. (1995). The partial least squares approach to causal modeling: personal computer adoption and use as an illustration. Technology Studies, 2(2), 285-309. Bauer, R., Eichholtz, P. and Kok, N. (2010). Corporate governance and performance: The REIT effect. Real Estate Economics, 38(1), 1–29. Becker, B.E., Huselid, M.A. and Ulrich, D. (2001). The HR scorecard, Harvard Business School Press; M.A. Bellman, S. (2003). How to use PLS. Graduate School of Management, University of Western Australia, Crawley, July, 2003. Black, B.S., Jang, H. and Kim, W. (2006). Does corporate governance affect firm value? Evidence from Korea. Journal of Law, Economics and Organization, 22, 366-413. Bontis, N. and Nikitopoulos, D. (2001). Thought leadership on intellectual capital. Journal of Intellectual Capital, 2(3), 183-192. Bornemann, M. (1999). Potential of value systems according to the VAICTM method. International Journal Technology Management, 18(5), 463-475. Bozbura, F.T. (2004). Measurement and application of intellectual capital in Turkey. The Learning Organization, (11(4/5), 357-367.

Makki and Lodhi
327
Brown, L.D. and Caylor, M.L. (2005). Corporate governance and firm performance. The Accounting Review, 80(2), 423-440. Cabrita, M. D. R., Bontis, N. (2008). Intellectual capital and business performance in the Portuguese banking industry. International Journal of Technology Management, 43(1-3), 212-237. Cerbioni, F. and Parbonetti, A. (2007). Exploring the effects of corporate governance on intellectual capital disclosure: An analysis of European biotechnology companies. European Accounting Review, 16(4), 791-826. Che-Haat, M.H.C., Rahman, R.A. and Mahenthiran, S. (2008). Corporate governance, transparency and performance of Malaysian companies. Managerial Auditing Journal, 23(8), 744-778. Chen, M.C., Chen, S. J., Hwang, Y. (2005). An empirical investigation of the relationship between intellectual capital and firm’s market value and financial performance. Journal of Intellectual Capital, 6(2), 159-176. Chin, W.W. (1998). The Partial Least Square Approach to Structural Equal Modeling, George A. Marcoulides (Eds.), Modern Methods for Business Research. Lawrence Erlbaum Associates, N.J. Cohen, J. (1998). Statistical Power Analysis for the Behavioral Sciences, Cohen, P., Cohen, J., Teresi, J., Marchi, M. and Velez, C.N. (Eds.). Problems in the measurement of latent variables in structural equation causal models, Applied Psychological Measurement. 14, 183-196. Companies Ordinance (1984). Govt. of Pakistan. [Online] Available at: www.secp.gov.pk Drobetz, W., Schillhofer, A. and Zimmerman, H. (2003). Corporate governance and expected stock returns: evidence from Germany, Working paper, University of Basel, Basel. Drobetz, W., Schillhofer, A. and Zimmermann, H. (2004). Corporate governance and expected stock returns: evidence from Germany. European Financial Management, 10, 267-295. Ehikioya, B.I. (2009). Corporate governance structure and firm performance in developing economies: evidence from Nigeria. Corporate Governance, 9(3), 231-243. Firer, S. and Williams S.M. (2003). Intellectual capital and traditional measures of corporate performance. Journal of Intellectual Capital, 4(3), 348-360. F-Jardon, C.M. and Martos, M.S. (2009). Intellectual capital and performance in wood industries of Argentina. Journal of Intellectual Capital, 10(4), 600-616. Fornell, C. and Cha, J. (1994). Partial Least Squares in Advanced Methods of Marketing Research, Bagozzi, R. P. edition. Blackwell , Oxford. Geisser, S. (1975). The predictive sample reuse method with applications. Journal of the American Statistical Association, 70, 320-328. Gemmill, G. and Thomas, D.C. (2004). Does governance affect the performance of closed end funds? Working paper. Available at: www.ssrn.com.

Corporate Governance, Intellectual Capital and Financial Performance
328
Ghosh, D. and Wu, A. (2007). Intellectual capital and capital market: additional evidence. Journal of Intellectual Capital, 8(2), 216-238. Goh, P.C. (2005). Intellectual capital performance of commercial banks in Malaysia. Journal of Intellectual Capital, 6(3), 382-396. Gompers, P.A., Ishii, J.L. and Metrick, A. (2003). Corporate governance and equity prices. The Quarterly Journal of Economics, 118, 107-155. Gruszczynski, M. (2006). Corporate governance and financial performance of companies in Poland, International Advances in Economic Research, 12(2), 251-259 Harris, R.J. (1989). A canonical cautionary. Multivariate Behavioral Research. 24(1), 17-39. Hermalin, B.E. and Weisbach, M.S. (1991). The effect of board composition and direct incentives on firm performance. Financial Management, 21, 101-112. Ho, C.A. and Williams S.M. (2003). International comparative analysis of the association between board structure and the efficiency of value added by a firm from its physical capital and intellectual capital resources. The International Journal of Accounting, 38(1), 465-491. Hulland, J. (1999). Use of partial least squares (PLS) in strategic management research: A review of four recent studies. Strategic Management Journal, 20, 195-203. Javed, A.Y. and Iqbal, R. (2006). Corporate governance and firm performance: evidence from Karachi stock exchange. The Pakistan Development Review, 45: 4 Part II (Winter 2006), 947–964. Johnson, H. T., Kaplan, R. S. (1987). Relevance lost: the rise and fall of management accounting. Harvard Business School Press, Boston. Joshi, M., Cahill, D. and Sidhu, J. (2010). Intellectual capital performance in the banking sector: An assessment of Australian owned banks. Journal of Human Resource Costing & Accounting, 14(2), 151–170. Kamath, G.B (2010). The intellectual capital performance of banking sector in Pakistan. Pakistan Journal of Commerce and Social Sciences, 4(1), 84-99. Keenan, J. and Aggestam, M. (2001). Corporate governance and intellectual capital: some conceptualizations. Corporate Governance: an International Review, 9(4), 259-275. Kraft, J. and Ravix, J.L. (2008). Corporate governance and the governance of knowledge: Rethinking the relationship in terms of corporate coherence. Economics of Innovation and New Technology, 17(1-2), 79-95. Laing, G., Dunn, J., Hughes-Lucas, S. (2010). Applying the VAIC™ model to Australian hotels. Journal of Intellectual Capital, 11(3), 269–283. Li, J., Pike, R. and Haniffa, R. (2008). Intellectual capital disclosure and corporate governance structure in UK firms, Accounting and Business Research, 38(2), 137-159. Maassen, G.F. (1999). An international comparison of corporate governance models, Spencer Stuart, Amsterdam.

Makki and Lodhi
329
Makki, M.A.M. and Lodhi, S.A. (2009). Impact of Intellectual Capital on Return on Investment in Pakistani Corporate Sector. Australian Journal of Basic and Applied Sciences, 3(3), 2995-3007. Makki, M.A.M. and Lodhi, S.A. (2008). Towards Extending the VAIC Model: Capturing Intellectual Capital Components. IUB Journal of Social Sciences and Humanities, 6(1), 120-141. Makki, M.M.A., Lodhi, S.A. and Rahman, R. (2008). Intellectual capital performance of Pakistani listed corporate sector. International Journal of Business and Management, 3(10), 45-51. Mavridis, D. (2004). The intellectual capital performance of Japanese banking sector. Journal of Intellectual Capital, 5(1), 92-111. Mavridis, D.G. (2005). Intellectual capital performance determinants and globalization status of Greek listed firms. Journal of Intellectual Capital, 6(1), 127-140. Morck, R., Shleifer, A., and Vishny, R. (1988). Management ownership and market valuation, Journal of Financial Economics, 20, 293-315. Pallant, J. (2001). SPSS survival manual, Allen and Unwin Publishers, Canberra. Pulic, A. (1998). Measuring the performance of intellectual potential in knowledge economy. Paper presented in 1998 at the 2nd McMaster World Congress on Measuring and Managing Intellectual Capital by the Austrian Team for Intellectual Potential. Pulic, A. (2000). VAICTM – An accounting tool for IC management, International Journal of technology management, 20 (5-8), 702-714. Pulic, A. (2004). Intellectual capital – does it create or destroy value? Measuring Business Excellence, 8(1), 62-68. Reddy, K., Locke, S. and Scrimgeour, F. (2010). The efficacy of principle-based corporate governance practices and firm financial performance: An empirical investigation, International Journal of Managerial Finance, 6(3), 190-219. Renders, A., Gaeremynck, A., and Sercu, P. (2010). Corporate governance ratings and company performance: A Cross-European study, Corporate Governance: an International Review, 18(2), 87-106. Roos, G., Pike, S., and Fernstrom. L. (2005). Managing intellectual capital in practice. Elsevier/Butterwoth-Heinemann, Oxford, UK. Saenz, J., Aramburu, N. and Rivera, O. (2007). Innovation focus and middle-up-down management model, Management Research News, 30(11), 785-802. Saifieddine, A., Jamali, D. and Noureddine, S. (2009). Corporate governance and intellectual capital: evidence from academic institution. Corporate Governance, 9(2), 146-157. Serrano-Cinca, C., Rueda-Tomas, M. and Portillo-Tarragona, P. (2009). Determinants of e-government extension. Online Information Review, 33(3), 476-498. Shaheen, R. and Nishat, M. (2005). Corporate governance and firm performance: An exploratory analysis, Paper presented at 2nd annual conference on corporate governance in Pakistan at Lahore University of Management Sciences, Lahore, Pakistan.

Corporate Governance, Intellectual Capital and Financial Performance
330
Sharabati, A.A., Jawad, S.N. and Bontis, N. (2010). Intellectual capital and business performance in the pharmaceutical sector of Jordan. Management Decision, 48(1), 105-131. Shiu, H. J (2006). The application of the value added intellectual coefficient to measure corporate performance: evidence from technological firms. International Journal of Management, 23(2), 356-365. Sueyoshi, T. Goto, M. Omi, Y. (2010). Corporate governance and firm performance: Evidence from Japanese manufacturing industries after the last decade. European Journal of Operational Research, 2(3), 724-736. Sunday-O, K. (2008). Corporate governance and firm performance: The case of Nigerian listed firms. European Journal of Economics, Finance and Administrative Sciences, 14, 16-27. Tabachnick, B.G. and Fidell, LS. (1996). Using Multiple Statistics. Harper Collins Publishers, New York, NY. Tan, H.P., Plowman, D., Hancock, P. (2007). Intellectual capital and financial returns of companies. Journal of Intellectual Capital, 8(1), 76-95. Ting, I.W.K. and Lean, H.H. (2009). Intellectual capital performance of financial institutions in Malaysia. Journal of Intellectual Capital, 10(4), 588-599. Tseng, C., Goo, Y.J. (2005). Intellectual capital and corporate value in an emerging economy: empirical studies of Taiwanese manufacturers. R & D Management, 35(2), 187-201. Vafeas, N. (1999). Board meeting frequency and firm performance. Journal of Financial Economics, 53(1), 113-142. World Bank (2006). World Development Report. [Online] Available at: www.worldbank.org. World Development Report (1998). Human Development Index, UNDP, New York. Yalama, A. and Coskun, M. (2007). Intellectual capital performance of quoted banks on the Istanbul stock exchange. Journal of Intellectual Capital, 8(2), 256-271. Yamane, T. (1967). Elementary sampling theory, Prentice-Hall, Englewood. Yermack, D. (1996). Higher market valuation for firms with a small board of directors, Journal of Financial Economics, 40, 185-211. Youndt, M.A. (1998). Human resource management system, intellectual capital and organizational performance. Unpublished Ph.D. dissertation, the Mary Jean and Frank. P Smeal College of Business Administration, Pennsylvania State University, USA. Zeghal, D. and Maaloul, A. (2010). Analyzing value added as an indicator of intellectual capital and its consequences on company performance. Journal of Intellectual Capital, 11(1), 39–60.