Embed Size (px)
Citation preview
Working Papers
Osservatorio Europa
WP - 15 The Impact of Changes in the Trade Policy on Slovak Foreign Trade after the Accession to the EU
Michaela Gajdosova

Michaela Gajdosova, è Ricercatrice presso l’ Institute of Economic
Research, Slovak Academy of Science; Bratislava
Il presente lavoro è stato realizzato nell’ambito del progetto «Monitoring the Enlargement», realizzato con il contributo di UniCredit Group
La collana ISPI Working Papers ospita analisi di varia scuola e provenienza. Le opinioni espresse sono strettamente personali e non riflettono necessariamente le posizioni dell’ISPI. Tutti i diritti sono riservati. È vietata la riproduzione, anche parziale, con qualsiasi mezzo effettuata, compresa la fotocopia, anche ad uso interno e didattico, non autorizzata.
All rights reserved. No portion of the contents may be reproduced in any form or by any means, including photocopying, nor utilized for any purpose, neither internal or didactic, without written permission from the publisher.
Copyright © 2007 by ISPI (Istituto per gli Studi di Politica Internazionale) Via Clerici, 5 - I-20121 Milano - Tel. (02) 86.33.13.1 e-mail: [email protected]
IMPACT OF CHANGES IN THE TRADE POLICY ON SLOVAK FOREIGN TRADE AFTER THE ACCESSION TO THE EU
Michaela Gajdosova
Introduction
Slovakia along with other nine countries enlarged on 1 May 2004 the European Union.
Two years that have elapsed since its accession enable to assess direct impacts of the EU membership on the Slovak economy or on its individual spheres. Accession to the EU was related to numerous changes that in larger or smaller extent have actually concerned every sphere of Slovak economy (and not only of economy), foreign trade including. In the case of Slovak foreign trade, this after accession to the EU was affected (besides other factors) by changes in trade conditions caused by implementation of the EU's Common Commercial Policy and by integration to the EU internal market, but also by change in perception of Slovakia (as EU member country) from the side of some trading partner countries. Of what these changes consisted and how they manifested in real development of Slovak foreign trade, that in the case of Slovak economy plays very important role, endeavors to find out this paper.
The first part of the paper provides a brief look at main changes in the Slovak trade policy that occurred after the accession to the EU. It outlines above all changes in a system of trade-policy agreements, tariff burden and in autonomous instruments of trade policy. Changes in trade conditions under which are realized Slovak exports in third countries are very briefly mentioned as well.
The second part of the paper evaluates development of Slovakia's foreign trade in the first two years of its membership in the EU, i.e. in 2004 and 2005, in order to obtain some insights into the early effects of the Slovakia's accession to the EU. In this context, first the analysis of main characteristics of the overall development of Slovak trade is carried out. This is followed by closer examination of commodity and territorial composition of the Slovakia's foreign trade that gets a better idea of the nature and direction of its trade flows. Finally, the analysis of trade results at product and territorial level is provided. For the purpose of comparison of the Slovak trade development of the post-accession period with that of the pre-accession period (2000-2003) the analysis is completed also with data of this period.
3
1. Main changes in the Slovak trade policy after the accession to the EU
As is well known, the external covering of the internal market of the EU is customs union that in the case of the EU is based on a Common Commercial Policy, implementation of which towards third countries is without any exception binding on all member countries of the EU. Accession to the European Union thus for Slovakia meant its integration to the internal market of the, what was connected with complete removing of all remaining tariff and non-tariff barriers in mutual trade with EU member countries and on the other hand with implementation of the EU's Common Commercial Policy towards third (non-member) countries. Having regard to differences that had existed between trade policy of Slovakia and the EU, implementation of the EU's Common Commercial Policy, which essentially consisted in application of all contractual and autonomous measures of this policy and in simultaneous termination of agreements concluded in the past by Slovakia with some countries and in abolition of applying its autonomous trade measures as well, generated changes in the set of trade-policy instruments of Slovakia with more significant impact on its import regime. However, certain impacts of Slovakia's membership in the EU manifested also in change of some trading conditions (conditions of access to some foreign markets) under which Slovak exports are realized. The main changes in Slovakia's trade policy instruments are briefly described below.
1.2. International trade agreements
Primary change in the Slovak trade-policy instrument set was related to the adoption of international agreements by which the EU regulates trade with third countries (and to simultaneous termination of trade agreements that Slovakia concluded in the past with some countries). Among the EU's agreements, preferential trade agreements, by which the EU from various reasons (economic, developing and, geopolitical, but also because of historical links) maintains a certain form of privileged relations with selected countries, play a significant role.
Adoption of these agreements for Slovakia means marked change of qualitative, but also of quantitative aspects of its contractual basis (regulation) of trade relations.
Prior to the accession, Slovakia had also concluded bilateral trade agreements of prefe-rential nature; however, their extent as regards the territorial coverage didn't reach that of the EU's preferential trade agreements. Its preferential agreements covered only countries of the European Union, countries of Central European Free Trade Agreement – CEFTA (the Czech Republic, Poland, Hungary, Slovenia, Bulgaria and Romania), countries of European Free Trade Association – EFTA (Norway, Iceland, Liechtenstein and Switzerland), Baltic countries (Estonia, Lithuania, Latvia), Turkey, Israel and Croatia.
4
Since the accession to the EU, Slovakia has become a signatory also to the Cotonou Agreement regulating trade relations of the EU with so called ACP countries1 (Africa, Caribbean and Pacific countries) as well as to association agreements concluded by the EU with Mediterranean countries (Algeria, Egypt, Israel, Jordan, Lebanon, Morocco, Palestinian Authority, Syria, Tunisia and Turkey). These agreements lay down to Slovakia a contractual obligation of preferential treatment in trade with given countries. (preferences that Slovakia granted before its accession to these countries, except for Israel and Turkey, were based only on non-contractual basis - on Generalized System of Preferences - GSP scheme). Change of preferential trade regime, from non-contractual regime (GSP regime) to contractual one was caused also by Slovakia's implementation of the cooperation agreement of the EU concluded with countries of the Gulf Co-operation Council - Bahrain, Kuwait, Oman, Qatar, Saudi Arabia and United Arab Emirates. Similar change in regulation of Slovak trade, i.e. switch from non-contractual to contractual regulation of trade relations, after accession to the EU, was also set in relations to other countries and country grouping, namely countries of Western Balkans (Macedonia, Croatia, Albania, Bosnia and Herzegovina, Serbia and Monte-negro), Andorra, San Marino, Faroe Islands, South Africa, Mexico, Chile a Mercosur (comprising Argentina, Brazil, Paraguay and Uruguay).
Patterns or regimes that the EU agreements with the above countries have set for mutual trade are differentiated in dependence on type of respective agreements and phase of their realization2 - Slovak trade with ACP countries is at present realized in conditions of non-reciprocally liberalized regime to the benefit of ACP countries (however, it is assumed that after 2007 some reciprocal liberalization actions in trade with the EU will be also demanded from them); trade with the Mediterranean countries, GCC countries, South Africa, Mexico and Faroe Islands is operated in conditions of asymmetrically (more rapidly from the side of EU member countries) fulfilled free trade agreements; trade with countries of Western Balkans in conditions of non-reciprocally liberalized regime to the benefit of the Balkans countries; trade 1 Group of ACP countries consists of 78 countries, but South Africa that is also member of this country group and signatory country of Cotonou Agreement doesn't applied its trade measures. Besides it, the group of ACP create: Angola, Benin, Botswana, , , Burkina Faso Burundi Cameroon, Cape Verde, Central African Republic, , Chad Comoros, , , , Congo (Brazzaville) Congo (Kinshasa) DjiboutiEquatorial Guinea, Eritrea, Ethiopia, , , Gabon Gambia Ghana, Guinea, Guinea Bissau, Ivory Coast, Kenya, Lesotho, Liberia, Madagascar, Malawi, Mali, Mauritania, , Mauritius Mozambique, Namibia, Niger, Nigeria, Rwanda, Sao Tome and Principe, Senegal, , Seychelles Sierra Leone, , Somalia Sudan, Swaziland, Tanzania, , Togo Uganda, , Zambia Zimbabwe, Antigua and Barbuda, , Bahamas Barbados,
, Belize Cuba, Dominica, Domican Republic, Grenada, Guyana, Haiti, Jamaica, St. Kitts and Nevis, St. Lucia, St. Vincent, Suriname, Trinidad and Tobago, Cook Islands, , East Timor Micronesia, Fiji, Kiribati, Marshall Islands, Nauru, Niue, , Palau Papua New Guinea, Samoa, Solomon Islands, , TongaTuvalu, . Vanuatu2 Majority of the above Eu agreements basically oblige Slovakia to full liberalization of imports of industrial products and to gradual liberalization of selected agricultural products specified by schedules of respective agreements. In opposite relation, i.e. for its imports (of industrial and selected agricultural products) on markets of its trade partners, there are liberalization scheme consisting mostly on gradually reduced tariffs.
5
with Andorra and San Marino in conditions of customs union and trade with Mercosur and Chile in conditions of reciprocally liberalized regimes agreed by associa-tion agreements.
1.3. Customs Tariff
Another non-overlookable change relating to the Slovak import regime resulted from implementation of the EU's Common Customs Tariff setting tariff rates which EU member countries are obliged to apply uniformly towards imports of goods from third countries. Chan-ges related to its implementation covered territorial application of tariffs based on most-favored-nation (MFN tariffs, i.e. tariffs which are the basis of the EU's Customs Tariff3) and level of rates of these tariffs as well.
Analysis of the territorial application of the Common Customs Tariff of the EU shows that, even though, this Customs Tariff is regarded as the essential instrument of the EU's commercial policy, existence of a great number of various preferential trade agreements covering selected third countries causes that its application in practice is limited only to im-ports from a small group of non-European countries, namely Usa, Canada, Japan, Australia, New Zealand, China, Chinese Taipei, Hong-Kong-China, Korean Republic and Singapore. Considering the fact that this composition of countries, except for China and Hong-Kong-China, is practically identical to a composition of country group on which imports Slovakia prior to its accession to the EU also had applied conventional tariffs (MFN tariffs), changes in the territorial application of MFN tariffs to which implementation of the EU's Common Customs Tariff led, were rather insignificant.
In view of the tariff rates, here implementation of the EU's Common Customs Tariff has led to more significant changes as tariff rates applied by the EU on imports from third countries are of different level than those that Slovakia had applied on third countries' imports before its accession to the EU.
Comparison of tariff burden on imports from third countries applied by Slovakia prior to and after the accession to the EU shows that the adoption of the EU's Common Customs Tariff (after the accession to the EU) by Slovakia led to overall increase in average MFN tariff rates on imports from third countries from 5,7% to 6,4% (i.e. by 0,7 percentage points). This increase was caused mainly by agricultural products, which registered an increase in average MFN tariff rates from 10,2% to 14,6% (i.e. by 4,4 percentage points). On the contrary, industrial products as a group reported a decrease in average MFN tariff by 0,6 percentage points from 4,3% to 3,7%. More detailed view on average MFN tariff rates applied by Slovakia on imports prior to and after the accession to the EU in classification by sections of customs tariff provides chart 1.
3 Another components of the Eu's Common Customs Tariffs are autonomous tariffs, but their use is rather marginal, therefore the paper does not deal with them.
6
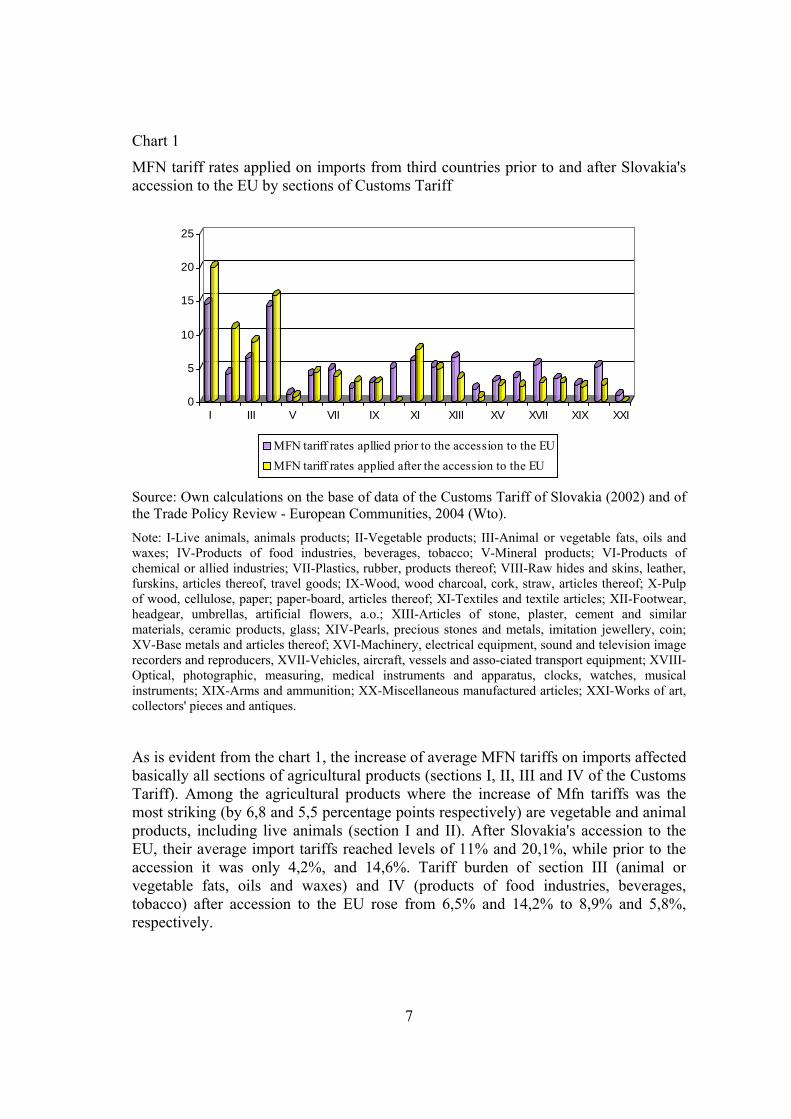
Chart 1
MFN tariff rates applied on imports from third countries prior to and after Slovakia's accession to the EU by sections of Customs Tariff
0
5
10
15
20
25
I III V VII IX XI XIII XV XVII XIX XXI
MFN tariff rates apllied prior to the accession to the EUMFN tariff rates applied after the accession to the EU
Source: Own calculations on the base of data of the Customs Tariff of Slovakia (2002) and of the Trade Policy Review - European Communities, 2004 (Wto). Note: I-Live animals, animals products; II-Vegetable products; III-Animal or vegetable fats, oils and waxes; IV-Products of food industries, beverages, tobacco; V-Mineral products; VI-Products of chemical or allied industries; VII-Plastics, rubber, products thereof; VIII-Raw hides and skins, leather, furskins, articles thereof, travel goods; IX-Wood, wood charcoal, cork, straw, articles thereof; X-Pulp of wood, cellulose, paper; paper-board, articles thereof; XI-Textiles and textile articles; XII-Footwear, headgear, umbrellas, artificial flowers, a.o.; XIII-Articles of stone, plaster, cement and similar materials, ceramic products, glass; XIV-Pearls, precious stones and metals, imitation jewellery, coin; XV-Base metals and articles thereof; XVI-Machinery, electrical equipment, sound and television image recorders and reproducers, XVII-Vehicles, aircraft, vessels and asso-ciated transport equipment; XVIII-Optical, photographic, measuring, medical instruments and apparatus, clocks, watches, musical instruments; XIX-Arms and ammunition; XX-Miscellaneous manufactured articles; XXI-Works of art, collectors' pieces and antiques.
As is evident from the chart 1, the increase of average MFN tariffs on imports affected basically all sections of agricultural products (sections I, II, III and IV of the Customs Tariff). Among the agricultural products where the increase of Mfn tariffs was the most striking (by 6,8 and 5,5 percentage points respectively) are vegetable and animal products, including live animals (section I and II). After Slovakia's accession to the EU, their average import tariffs reached levels of 11% and 20,1%, while prior to the accession it was only 4,2%, and 14,6%. Tariff burden of section III (animal or vegetable fats, oils and waxes) and IV (products of food industries, beverages, tobacco) after accession to the EU rose from 6,5% and 14,2% to 8,9% and 5,8%, respectively.
7
As regards industrial products, after accession to the EU, from the total number of 17 sections of these products only 3 sections registered a rise of tariff rates, 13 sections registered a decrease of tariffs and 1 section remained without any change of tariff burden level (section IX-wood and products of wood, tariff rate 2,9%). Product sections in which appeared a rise of tariff rates are section VI (products of chemical and allied industries), VIII (raw hides and skins, leather, furskins and articles, travel goods) and XI (textiles and textile products). Increase in their tariff rates represented in the case of section VI 0,4 percentage points (tariff burden after increase amounts 4,4%) and 1,0 and 1,7 percentage points (3,0% and 7,8% respectively) in sections VIII and XI.
Majority of product sections, as we already mentioned, in the period after accession to the EU, registered a decrease in tariff rates. The sharpest decrease in tariff rates occurred above all in section X (pulp of wood, cellulose, paper, paperboard, articles thereof) from 5% to 0%, XIII (articles of stone, plaster, cement and similar materials, ceramic products and glass) from 6,6% to 3,6%, XX (miscellaneous manufactured products, besides others, furni-ture, lights, toys or products for sports) from 5,2% to 2,5% and XVII (vehicles, aircraft, vessels and associated transport equipments) from 5,5% to 2,9%. However, a decrease in tariffs (in range between 0,3 and 1,4 percentage points) registered for example also sections V (mineral products) from 1,2% to 0,8%, VII (plastics, rubber and products thereof) from 4,8% to 3,9%, XII (footwear, headgear, umbrellas, etc.) from 5,2% to 4,9%, XV (base metals and products thereof) from 3,1% to 2,4%, XVI (machinery and electrical equipments, etc.) from 3,7% to 2,3% and XVIII (optical, photographic, measuring, medical instruments and apparatus, clocks, watches; musical instruments) from 3,4% to 2,9%.
1.3. Autonomous trade measures
Since the accession to the EU Slovakia was obliged to adopt not only all contractual, but also non-contractual (autonomous) measures of the EU commercial policy and to abolish its non-contractually applied measures as well. This above all meant to replace own (Slovak) system of tariff preferences granted to developing and least developed countries so-called General System of Preferences (GSP) by the EU Gsp scheme. The transition to the Gsp scheme of the EU showed right in several changes related not only to the country coverage, but also to scope of granted preferences and products to which these preferences are applied.
In this connection, the most significant change concerned the product coverage of the GSP scheme since the EU scheme includes considerably more products lines (7000 product lines till 2006 and 7200 product lines since 2006) than included the Slovak GSP scheme. Adoption of the EU GSP scheme simplified the categorization of products included in the GSP scheme – products are divided only into sensitive and non-sensitive products (in Slovak scheme there were 3 product categories).
However, as regards the scope of granted preferences, the EU GSP scheme is more demanding for Slovakia, since besides the « general preferences » it offers also so-
8
called « specific or additional preferences » that under certain conditions can double the overall level of granted preferences. Moreover, adoption of the EU GSP scheme also led to an increase in number of countries, which are beneficiaries of the GSP scheme (prior to the accession, the Slovak GSP scheme covered 146 countries, after the accession the GSP country coverage increased to 143 countries and 36 dependent territories). Last important change related to the adoption of the EU GSP scheme concerned the quantitative limit, after the accession Slovakia cannot restrict granting of tariff preferences within the GSP scheme by any quantitative limits as did prior to the accession.
1.4. External conditions for Slovak exports
Accession of Slovakia to the EU also brought certain changes, as regards conditions under which are realized Slovak exports (market access). On the one hand, by the integration to the EU Slovakia gained more favorable access on markets of EU member countries (as a result of removing of all remaining tariff and non-tariff barriers to trade), and on markets of third countries that are integrated with the EU by various trade agreements (see part 1. of this paper), however, on the other hand it lost a status of preferential country in trade relations with developed third countries (Usa, Canada, Japan, Australia a.o.) that these countries unilaterally conceded to Slovakia within their GSP schemes. Termination of application of these preferential regimes from the side of developed countries in relation to Slovakia (which, however, was expected as the same step was applied towards Greece in 1981 and also towards Portugal in 1986 after their accession to the EU) meant that Slovak exports in these territories are subject « only » to regimes based on most-favored-nation (MFN regimes), i.e. regimes which are by these countries normally applied towards all EU exports. In practice, this change showed in the level of tariff burden on Slovak exports in these countries that is in the case of MFN regimes higher as compared to previously applied preferential regimes (within them Slovakia exported selected products duty-free or under reduced tariffs).
2. Slovak foreign trade after the accession to the EU
Changes of trade conditions outlined above showed in development of Slovakia's foreign trade. After accession of Slovakia to the EU, this was characterized by high dynamics of imports and exports, but also by changes in territorial and commodity structure. Their more detailed analysis is provided in following parts.
9
2.1. Main features of Slovak foreign trade development
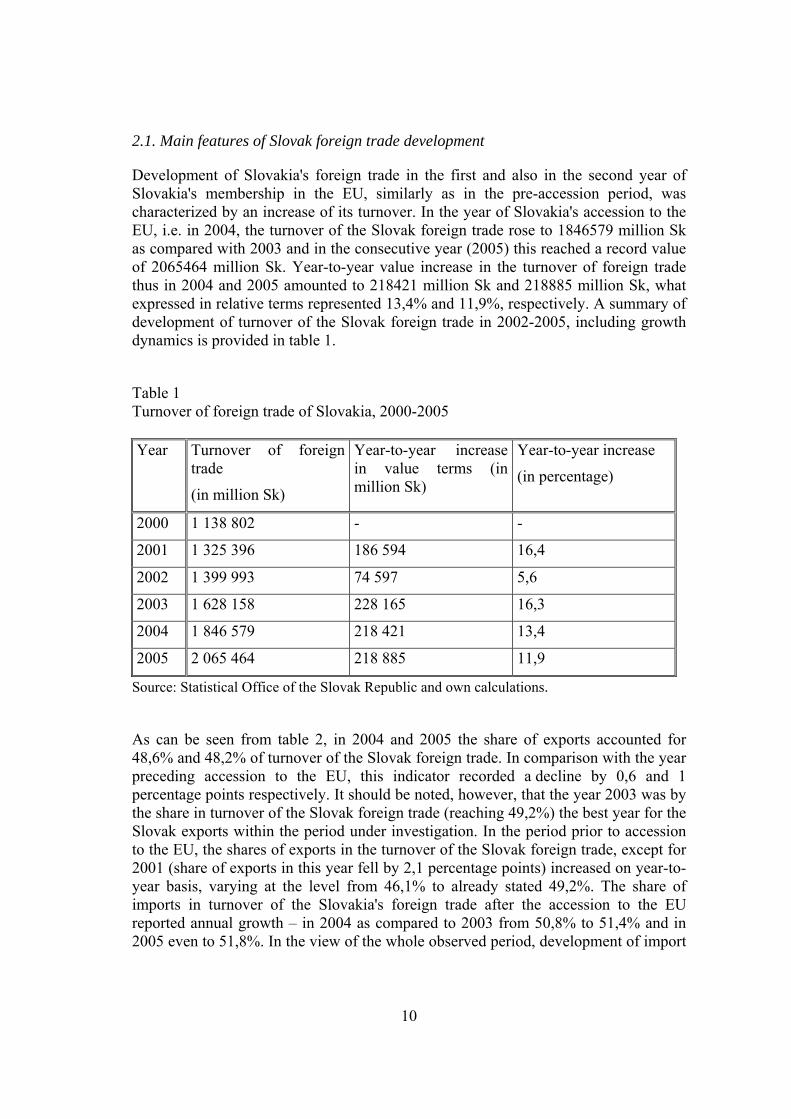
Development of Slovakia's foreign trade in the first and also in the second year of Slovakia's membership in the EU, similarly as in the pre-accession period, was characterized by an increase of its turnover. In the year of Slovakia's accession to the EU, i.e. in 2004, the turnover of the Slovak foreign trade rose to 1846579 million Sk as compared with 2003 and in the consecutive year (2005) this reached a record value of 2065464 million Sk. Year-to-year value increase in the turnover of foreign trade thus in 2004 and 2005 amounted to 218421 million Sk and 218885 million Sk, what expressed in relative terms represented 13,4% and 11,9%, respectively. A summary of development of turnover of the Slovak foreign trade in 2002-2005, including growth dynamics is provided in table 1.
Table 1 Turnover of foreign trade of Slovakia, 2000-2005 Year Turnover of foreign
trade
(in million Sk)
Year-to-year increase in value terms (in
Year-to-year increase
(in percentage) million Sk)
2000 1 138 802 - -
2001 1 325 396 186 594 16,4
2002 1 399 993 74 597 5,6
2003 1 628 158 228 165 16,3
2004 1 846 579 218 421 13,4
2005 2 065 464 218 885 11,9
Source: Statistical Office of the Slovak Republic and own calculations.
As can be seen from table 2, in 2004 and 2005 the share of exports accounted for 48,6% and 48,2% of turnover of the Slovak foreign trade. In comparison with the year preceding accession to the EU, this indicator recorded a decline by 0,6 and 1 percentage points respectively. It should be noted, however, that the year 2003 was by the share in turnover of the Slovak foreign trade (reaching 49,2%) the best year for the Slovak exports within the period under investigation. In the period prior to accession to the EU, the shares of exports in the turnover of the Slovak foreign trade, except for 2001 (share of exports in this year fell by 2,1 percentage points) increased on year-to-year basis, varying at the level from 46,1% to already stated 49,2%. The share of imports in turnover of the Slovakia's foreign trade after the accession to the EU reported annual growth – in 2004 as compared to 2003 from 50,8% to 51,4% and in 2005 even to 51,8%. In the view of the whole observed period, development of import
10
share in the turnover of the Slovak foreign trade had varying course – periods of share growth alternated with periods of share decline.
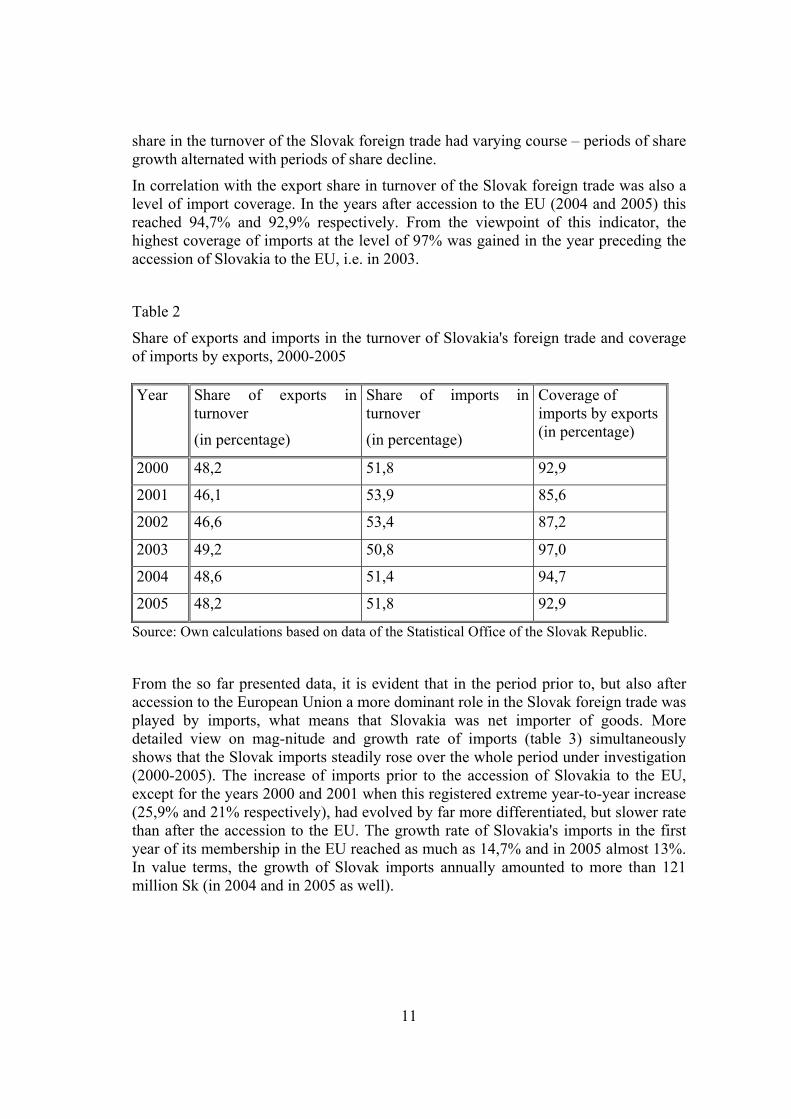
In correlation with the export share in turnover of the Slovak foreign trade was also a level of import coverage. In the years after accession to the EU (2004 and 2005) this reached 94,7% and 92,9% respectively. From the viewpoint of this indicator, the highest coverage of imports at the level of 97% was gained in the year preceding the accession of Slovakia to the EU, i.e. in 2003.
Table 2
Share of exports and imports in the turnover of Slovakia's foreign trade and coverage of imports by exports, 2000-2005 Year Share of exports in
turnover
(in percentage)
Share of imports in Coverage of turnover imports by exports
(in percentage) (in percentage)
2000 48,2 51,8 92,9
2001 46,1 53,9 85,6
2002 46,6 53,4 87,2
2003 49,2 50,8 97,0
2004 48,6 51,4 94,7
2005 48,2 51,8 92,9
Source: Own calculations based on data of the Statistical Office of the Slovak Republic.
From the so far presented data, it is evident that in the period prior to, but also after accession to the European Union a more dominant role in the Slovak foreign trade was played by imports, what means that Slovakia was net importer of goods. More detailed view on mag-nitude and growth rate of imports (table 3) simultaneously shows that the Slovak imports steadily rose over the whole period under investigation (2000-2005). The increase of imports prior to the accession of Slovakia to the EU, except for the years 2000 and 2001 when this registered extreme year-to-year increase (25,9% and 21% respectively), had evolved by far more differentiated, but slower rate than after the accession to the EU. The growth rate of Slovakia's imports in the first year of its membership in the EU reached as much as 14,7% and in 2005 almost 13%. In value terms, the growth of Slovak imports annually amounted to more than 121 million Sk (in 2004 and in 2005 as well).
11
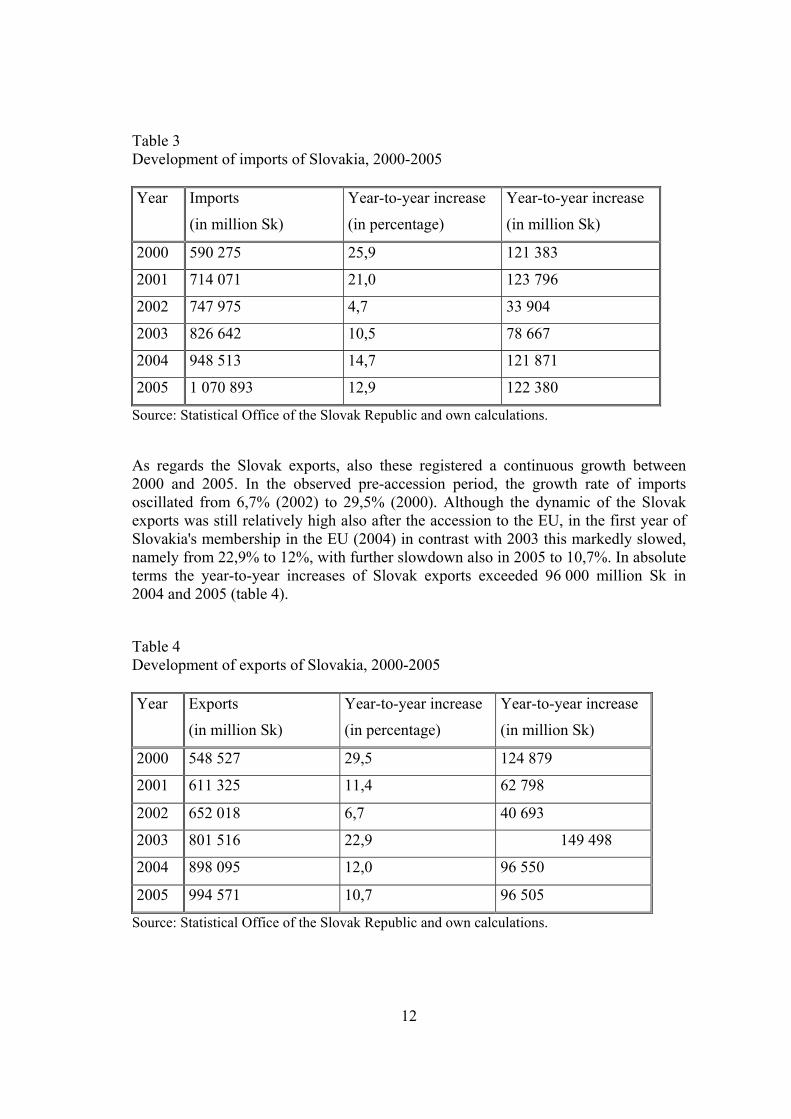
Table 3 Development of imports of Slovakia, 2000-2005 Year Imports
(in million Sk)
Year-to-year increase Year-to-year increase
(in percentage) (in million Sk)
2000 590 275 25,9 121 383
2001 714 071 21,0 123 796
2002 747 975 4,7 33 904
2003 826 642 10,5 78 667
2004 948 513 14,7 121 871
2005 1 070 893 12,9 122 380
Source: Statistical Office of the Slovak Republic and own calculations.
As regards the Slovak exports, also these registered a continuous growth between 2000 and 2005. In the observed pre-accession period, the growth rate of imports oscillated from 6,7% (2002) to 29,5% (2000). Although the dynamic of the Slovak exports was still relatively high also after the accession to the EU, in the first year of Slovakia's membership in the EU (2004) in contrast with 2003 this markedly slowed, namely from 22,9% to 12%, with further slowdown also in 2005 to 10,7%. In absolute terms the year-to-year increases of Slovak exports exceeded 96 000 million Sk in 2004 and 2005 (table 4).
Table 4 Development of exports of Slovakia, 2000-2005 Year Exports
(in million Sk)
Year-to-year increase Year-to-year increase
(in percentage) (in million Sk)
2000 548 527 29,5 124 879
2001 611 325 11,4 62 798
2002 652 018 6,7 40 693
2003 801 516 22,9 149 498
2004 898 095 12,0 96 550
2005 994 571 10,7 96 505
Source: Statistical Office of the Slovak Republic and own calculations.
12
2.2. Commodity structure
After accession to the EU, commodity structure of the Slovak foreign trade assessed by sections of the Customs Tariff (I-XXI) registered changes which displayed on the import and export sides differently.
On the import side, in 2004 as compared with 2003 individual commodity groups evolved in dimensions from which is apparent that, except for products of section VIII - raw hides and skins, leather, furskins, articles thereof and travel goods (index 99,9) whose imports slightly declined, imports of all other commodity sections increased. Among them (and taking into consideration only more significant items of Slovak imports), the sharpest annual increase in import expressed in relative terms registered products of sections I -live animals; animals products (index 153,8), XVIII - optical, photographic, measuring, medical instru-ments and apparatus, clocks, watches and musical instruments (index 145,8) and also III - animal or vegetable fats, oils and waxes (index of 132,4). Substantial increases were reported also in sections XV - base metals and articles thereof (index 127,7), V - mineral products (index 122,8), II - vegetable products (index 121,1), IV - products of food industries, beverages, tobacco (index 118,1) and VI - plastics, rubber and products thereof (index 117,1). The upward trend continued in majority of commodity sections, however, with somewhat different dynamics also in the second year of Slovakia's membership in the EU (2005). Products of the section I in 2005 again maintained the strongest import growth (index 169,7), this with an index of 145,8 was followed by products of section XVIII. Among other listed commodity sections, which reached the highest import growth in 2004, in 2005 section IV and V were the only sections which continued to record an increase (the increase was even higher than in 2004; index 126,2 and 123,7 respectively) in contrast, sections as XIV, XV or II slackened their import rates (index 58,6; 112,4 and 116,4 respectively).
On the export side, if we count out sections XIX and XIV, which in 2004 (section XIX also in 2005) reached in relative terms extreme level – index 250,4 and 164,9 respectively (section XIX in 2005 index 245,9), but which in absolute terms were rather less significant, in 2004 and also in 2005 the highest increase in relative terms was registered in section I - live animals; animals products (157,3 and 147,1 respectively). In 2004, the average annual growth of exports was markedly exceeded also by other commodity sections, particularly section III - animal or vegetable fats, oils and waxes, V - mineral products, IV - products of food industries, beverages, tobacco, XVI - machinery, electrical equipments, sound and television image recorders and reproducers, II - vegetable products an XV - base metals and articles thereof, their exports rose by index in the range of 124,2 and 147,6. Also in 2005, in comparison with 2004, exports of all listed sections, with the exception of section XVI, increased annually, however, only by index in the range of 124,1 and 130,1. On the contrary, in the year of Slovakia's accession to the EU and also in 2005, decrease of exports among more important items of Slovak exports registered especially products of section XVII - vehicles, aircraft, vessels and associated transport
13
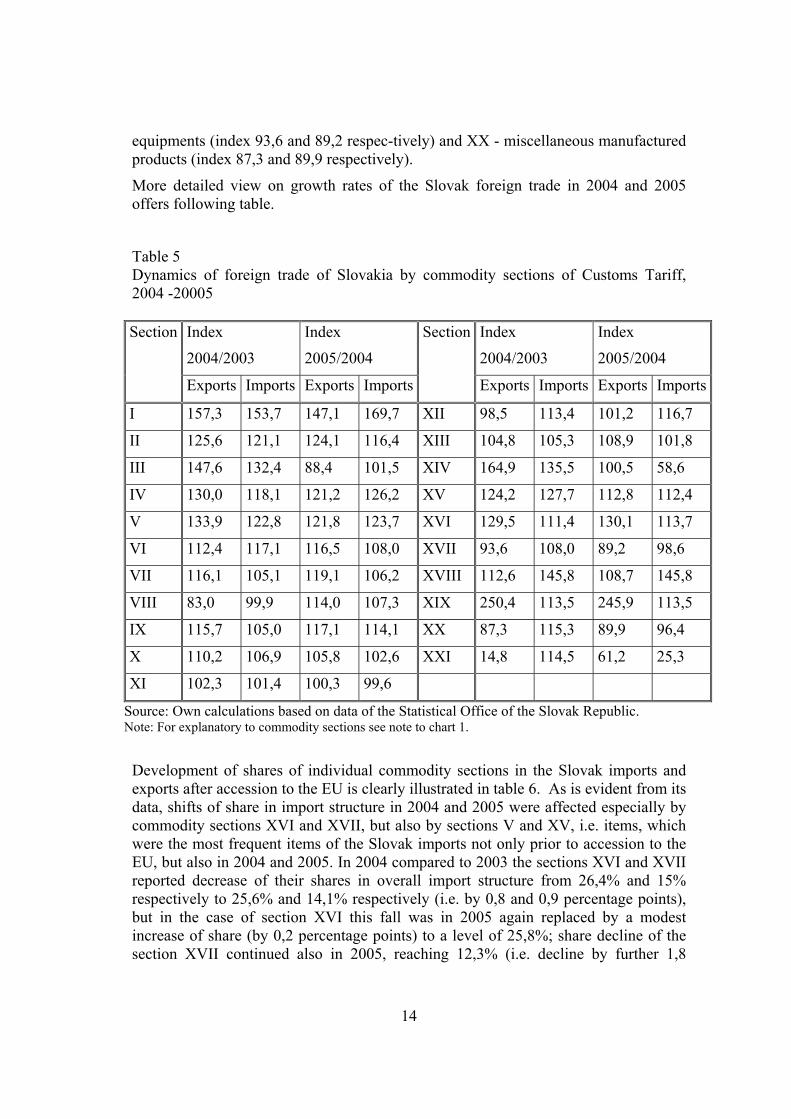
equipments (index 93,6 and 89,2 respec-tively) and XX - miscellaneous manufactured products (index 87,3 and 89,9 respectively).
More detailed view on growth rates of the Slovak foreign trade in 2004 and 2005 offers following table.
Table 5 Dynamics of foreign trade of Slovakia by commodity sections of Customs Tariff, 2004 -20005
Index
2004/2003
Index
2005/2004
Index
2004/2003
Index
2005/2004
Section Section
Exports Imports Exports Imports Exports Imports Exports Imports
I 157,3 153,7 147,1 169,7 XII 98,5 113,4 101,2 116,7
II 125,6 121,1 124,1 116,4 XIII 104,8 105,3 108,9 101,8
III 147,6 132,4 88,4 101,5 XIV 164,9 135,5 100,5 58,6
IV 130,0 118,1 121,2 126,2 XV 124,2 127,7 112,8 112,4
V 133,9 122,8 121,8 123,7 XVI 129,5 111,4 130,1 113,7
VI 112,4 117,1 116,5 108,0 XVII 93,6 108,0 89,2 98,6
VII 116,1 105,1 119,1 106,2 XVIII 112,6 145,8 108,7 145,8
VIII 83,0 99,9 114,0 107,3 XIX 250,4 113,5 245,9 113,5
IX 115,7 105,0 117,1 114,1 XX 87,3 115,3 89,9 96,4
X 110,2 106,9 105,8 102,6 XXI 14,8 114,5 61,2 25,3
XI 102,3 101,4 100,3 99,6
Source: Own calculations based on data of the Statistical Office of the Slovak Republic. Note: For explanatory to commodity sections see note to chart 1.
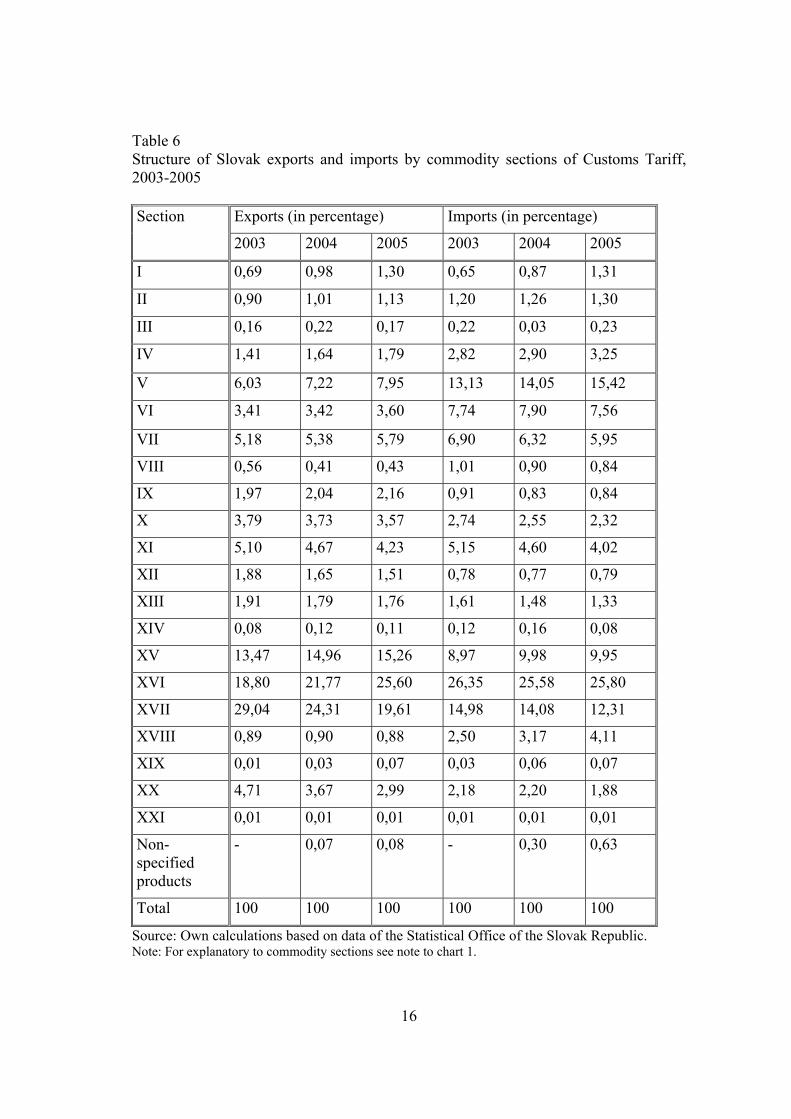
Development of shares of individual commodity sections in the Slovak imports and exports after accession to the EU is clearly illustrated in table 6. As is evident from its data, shifts of share in import structure in 2004 and 2005 were affected especially by commodity sections XVI and XVII, but also by sections V and XV, i.e. items, which were the most frequent items of the Slovak imports not only prior to accession to the EU, but also in 2004 and 2005. In 2004 compared to 2003 the sections XVI and XVII reported decrease of their shares in overall import structure from 26,4% and 15% respectively to 25,6% and 14,1% respectively (i.e. by 0,8 and 0,9 percentage points), but in the case of section XVI this fall was in 2005 again replaced by a modest increase of share (by 0,2 percentage points) to a level of 25,8%; share decline of the section XVII continued also in 2005, reaching 12,3% (i.e. decline by further 1,8
14
percentage points). Development of shares of the sections XVI and XVII influenced also positions of these sections in the Slovak import structure - since 2005 the section XVI have replaced on the second position section XVII. Section V, as another major Slovak import items, registered an increase of its share in total Slovak imports in 2004 as compared with 2003 by 0,9 percentage points, from 13,1% to 14%, and in 2005 even by 1,4 percentage points to 15,4%. Section XV influenced shifts of shares in Slovak import structure only in 2004, when its share in imports increased at 1 percentage point, from some 9% to 10%. Changes of shares of other commodity sections largely did not exceed 0,3 percentage points.
In exports, the largest change of share after Slovakia's accession to the EU was reported for section XVII. While in 2003 this section represented some 29% of the total Slovak exports, in 2004 its share amounted to 24,3% (i.e. decline by 4,7 percentage points) and in 2005 even 19,6% (i.e. further fall by 4,7 percentage points). Relatively striking change was registered also by section XVI, but contrary to the section XVII, it have increased its share in Slovak export structure from 18,8% in 2003 through 21,8% in 2004 (i.e. rise by almost 3 percentage points) to 25,6% 2005 (increase by 3,8 percentage points). Changes of shares of sections XVII and XVI were of such extent that in 2005 section XVI by its share in Slovak exports surpassed section XVII and removed this section from the first to the second position in the Slovak export structure. Larger changes of shares in the Slovak exports in 2004 and 2005 also appeared in sections V and XX. Shares of these commodity sections evolved differently - section V reported annual increase of its share in Slovak export structure in both years of the observed period (in 2004 and 2005 by some 1,2 and 0,7 percentage points to 7,2% and 8% respectively), on the other hand, section XX was characterized by declining share in the exports (decline by 1 percentage points to 3,7% in 2004 and by 0,7 percentage points to 3% in 2005). Shifts of shares of other sections in Slovak export structure mostly ranged up to 0,2 percentage points.
15
16
Table 6 Structure of Slovak exports and imports by commodity sections of Customs Tariff, 2003-2005
Exports (in percentage) Imports (in percentage) Section
2003 2004 2005 2003 2004 2005
I 0,69 0,98 1,30 0,65 0,87 1,31
II 0,90 1,01 1,13 1,20 1,26 1,30
III 0,16 0,22 0,17 0,22 0,03 0,23
IV 1,41 1,64 1,79 2,82 2,90 3,25
V 6,03 7,22 7,95 13,13 14,05 15,42
VI 3,41 3,42 3,60 7,74 7,90 7,56
VII 5,18 5,38 5,79 6,90 6,32 5,95
VIII 0,56 0,41 0,43 1,01 0,90 0,84
IX 1,97 2,04 2,16 0,91 0,83 0,84
X 3,79 3,73 3,57 2,74 2,55 2,32
XI 5,10 4,67 4,23 5,15 4,60 4,02
XII 1,88 1,65 1,51 0,78 0,77 0,79
XIII 1,91 1,79 1,76 1,61 1,48 1,33
XIV 0,08 0,12 0,11 0,12 0,16 0,08
XV 13,47 14,96 15,26 8,97 9,98 9,95
XVI 18,80 21,77 25,60 26,35 25,58 25,80
XVII 29,04 24,31 19,61 14,98 14,08 12,31
XVIII 0,89 0,90 0,88 2,50 3,17 4,11
XIX 0,01 0,03 0,07 0,03 0,06 0,07
XX 4,71 3,67 2,99 2,18 2,20 1,88
XXI 0,01 0,01 0,01 0,01 0,01 0,01
Non-specified products
- 0,07 0,08 - 0,30 0,63
Total 100 100 100 100 100 100
Source: Own calculations based on data of the Statistical Office of the Slovak Republic. Note: For explanatory to commodity sections see note to chart 1.
2.3. Territorial structure
After Slovakia’s accession to the EU compared to 2003, individual basic groups of countries, i.e. developed market economies, developing countries, European transition countries, including Commonwealth of Independent States (CIS countries), and non-European countries with transition and state-directed economies changed their positions in the total Slovak exports and imports by a range from -2,86 to 1,25 percentage points.
In observed years 2004 and 2005 developed market economies annually deteriorated their position in the Slovak export structure (by -0,34 and -1,35 percentage points respect-tively) and so did (but only in 2004) also non-European countries with transition and state-directed economies (by -0,31 percentage points). Annually repeated falls of shares of some European, but also of non-European developed market economies in Slovak exports decrea-sed also position of OECD countries as a group in Slovak export structure. On the contrary, European transition countries, including CIS countries, and developing countries increased their shares in Slovak exports by 0,73 and 0,25 percentage points in 2004 and in 2005 by 0,59 and 0,46 percentage points respectively.
Somewhat more striking changes of positions of individual territorial groups occurred after Slovakia's accession to the EU in its imports. These changes were registered particularly by developed market economies and by developing countries as well. While the share of the former decreased in 2004 and 2005 by 1,09 and 2,86 percentage points, share of the latter registered in the same period increase by 1,25 and 1,16 percentage points respectively. European transition countries, including CIS countries as a group reported weakening of its share in Slovak imports (by 0,35 percentage points), however, in 2005 their share again expanded by 1,23 percentage points. Expansion of share in Slovak imports recorded in 2004 and 2005 also non-European countries with transition and state-directed economies.
As arises from the above table, in 2004 and 2005 group of developed market economies maintained its leading position in the Slovak foreign trade despite the repeated year-to-year decline of its shares in exports (from 93,1% in 2003 through 92,8% in 2004 to 91,4%, in 2005) and in imports (from 80,3% in 2003 through 79,2% in 2004 to 76,4% in 2005). Determining influence on share changes of this country group in 2004 and also in 2005 had EU countries, but also some non-European developed economies (especially USA). During the 2004-2005 period also OECD countries as a group registered similar shift of position in the Slovak foreign trade, lowering its share in Slovak exports from 91,7% in 2003 to 89,7% in 2005 and in imports from 80,1% in 2003 to 70% in 2005 (in 2004 its shares in exports and imports amounted to 91,3% and 75,1% respectively).
17
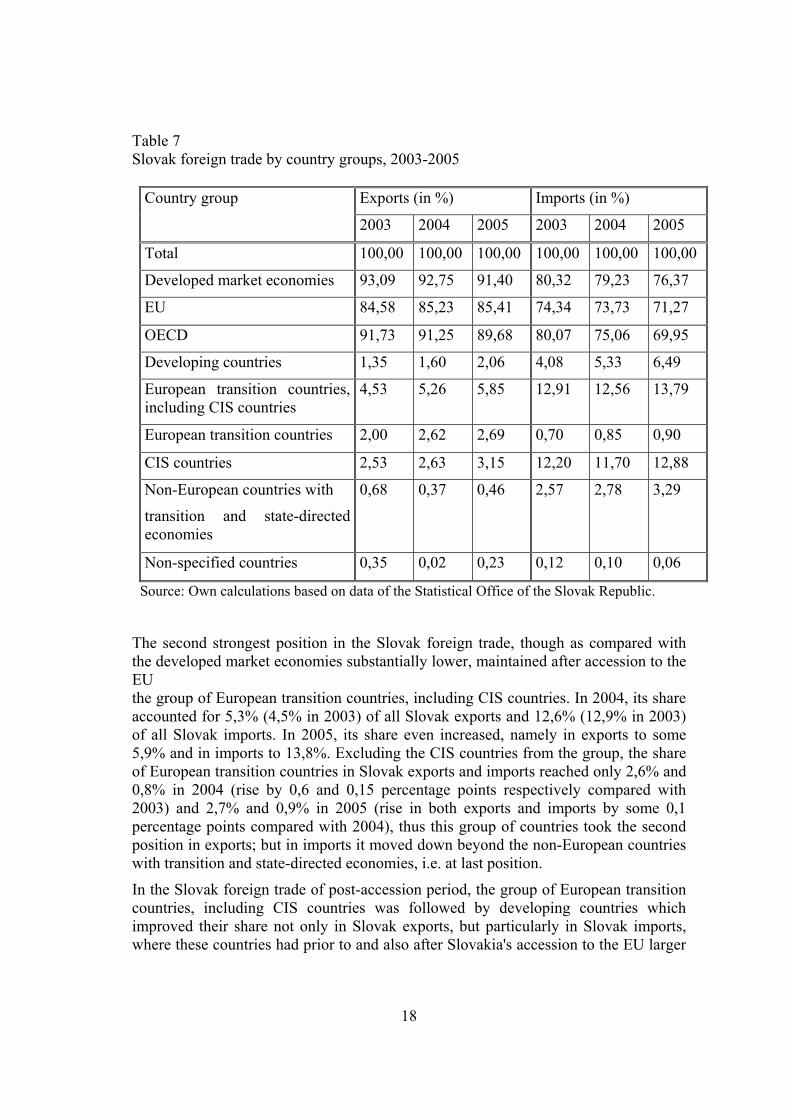
Table 7 Slovak foreign trade by country groups, 2003-2005
Exports (in %) Imports (in %) Country group
2003 2004 2005 2003 2004 2005
Total 100,00 100,00 100,00 100,00 100,00 100,00
Developed market economies 93,09 92,75 91,40 80,32 79,23 76,37
EU 84,58 85,23 85,41 74,34 73,73 71,27
OECD 91,73 91,25 89,68 80,07 75,06 69,95
Developing countries 1,35 1,60 2,06 4,08 5,33 6,49
European transition countries, including CIS countries
4,53 5,26 5,85 12,91 12,56 13,79
European transition countries 2,00 2,62 2,69 0,70 0,85 0,90
CIS countries 2,53 2,63 3,15 12,20 11,70 12,88
Non-European countries with
transition and state-directed economies
0,68 0,37 0,46 2,57 2,78 3,29
Non-specified countries 0,35 0,02 0,23 0,12 0,10 0,06
Source: Own calculations based on data of the Statistical Office of the Slovak Republic.
The second strongest position in the Slovak foreign trade, though as compared with the developed market economies substantially lower, maintained after accession to the EU the group of European transition countries, including CIS countries. In 2004, its share accounted for 5,3% (4,5% in 2003) of all Slovak exports and 12,6% (12,9% in 2003) of all Slovak imports. In 2005, its share even increased, namely in exports to some 5,9% and in imports to 13,8%. Excluding the CIS countries from the group, the share of European transition countries in Slovak exports and imports reached only 2,6% and 0,8% in 2004 (rise by 0,6 and 0,15 percentage points respectively compared with 2003) and 2,7% and 0,9% in 2005 (rise in both exports and imports by some 0,1 percentage points compared with 2004), thus this group of countries took the second position in exports; but in imports it moved down beyond the non-European countries with transition and state-directed economies, i.e. at last position.
In the Slovak foreign trade of post-accession period, the group of European transition countries, including CIS countries was followed by developing countries which improved their share not only in Slovak exports, but particularly in Slovak imports, where these countries had prior to and also after Slovakia's accession to the EU larger
18
share than in exports. Their share in Slovak exports grew repeatedly – in 2004 and also in 2005, namely from 1,4% in 2003 through 1,6% (2004) to 2,1% in 2005. Share of developing countries in Slovak imports increased even more significantly – in 2004 the share of these countries accounted for 5,3% of total Slovak imports and in 2005 6,5% (4,1% in 2003).
Among the main groups of countries, the weakest position in the Slovak foreign trade in the period under analysis registered non-European countries with transition and state-directed economies with stronger position in Slovak imports than in exports that after Slovakia's accession to the EU further sharpened. Share of these countries in Slovak imports in 2004 and 2005 amounted to 2,8% and 3,3% respectively (2,6% in 2003). In Slovak exports in 2004 as compared with 2003 their share registered at first decline from 0,7% to 0,4%, however, in 2005 share of this group of countries in Slovak exports again increased to 0,5%.
Closer view on structure of the foreign trade of Slovakia shows that after its accession to the EU just as prior it, the trade concentrated on European market, mainly on the EU countries. The EU countries' share in Slovak exports that in 2003 represented 84,6% after Slovakia's accession to the EU further increased to 85,2% in 2004 and to 85,4% in 2005. Participation of the EU countries in Slovak imports in the same period dropped – in 2004 as compared with 2003 their share decreased from 74,3% to 73,7% (i.e. by 0,6 percentage points), and further more significant fall to 71,3% (i.e. by 1,1 percentage points) continued also in 2005.
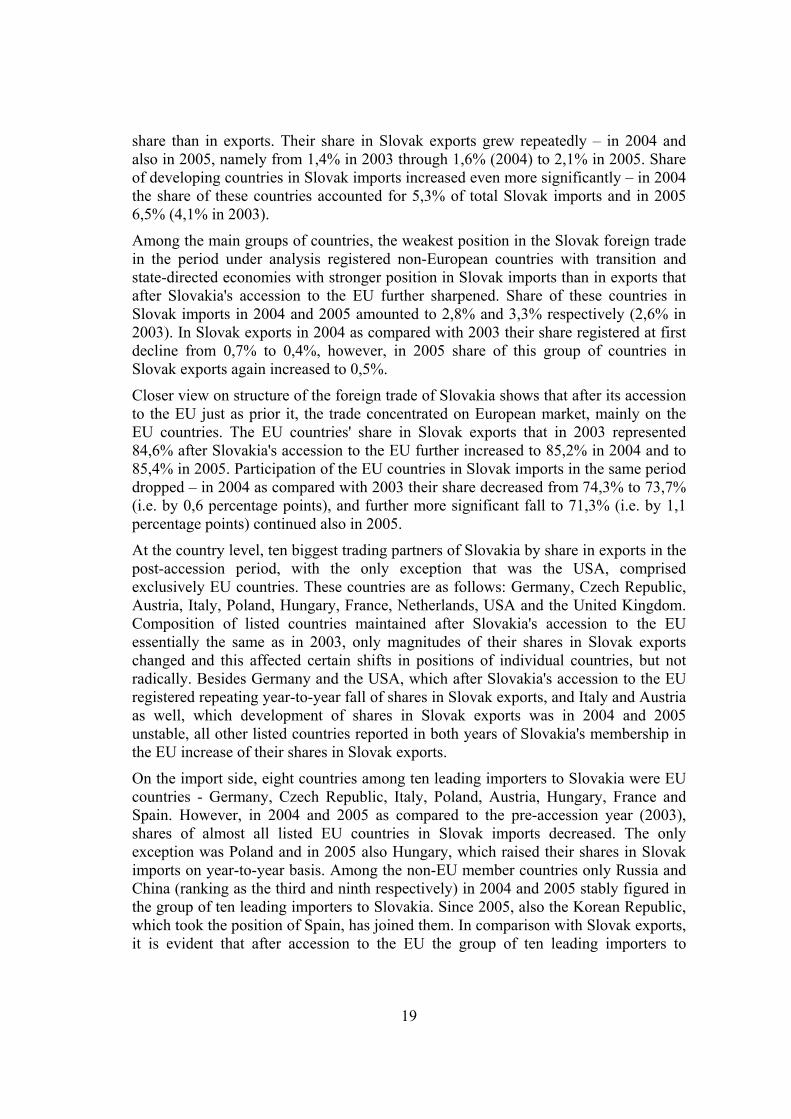
At the country level, ten biggest trading partners of Slovakia by share in exports in the post-accession period, with the only exception that was the USA, comprised exclusively EU countries. These countries are as follows: Germany, Czech Republic, Austria, Italy, Poland, Hungary, France, Netherlands, USA and the United Kingdom. Composition of listed countries maintained after Slovakia's accession to the EU essentially the same as in 2003, only magnitudes of their shares in Slovak exports changed and this affected certain shifts in positions of individual countries, but not radically. Besides Germany and the USA, which after Slovakia's accession to the EU registered repeating year-to-year fall of shares in Slovak exports, and Italy and Austria as well, which development of shares in Slovak exports was in 2004 and 2005 unstable, all other listed countries reported in both years of Slovakia's membership in the EU increase of their shares in Slovak exports.
On the import side, eight countries among ten leading importers to Slovakia were EU countries - Germany, Czech Republic, Italy, Poland, Austria, Hungary, France and Spain. However, in 2004 and 2005 as compared to the pre-accession year (2003), shares of almost all listed EU countries in Slovak imports decreased. The only exception was Poland and in 2005 also Hungary, which raised their shares in Slovak imports on year-to-year basis. Among the non-EU member countries only Russia and China (ranking as the third and ninth respectively) in 2004 and 2005 stably figured in the group of ten leading importers to Slovakia. Since 2005, also the Korean Republic, which took the position of Spain, has joined them. In comparison with Slovak exports, it is evident that after accession to the EU the group of ten leading importers to
19
Slovakia registered owing to shifts of shares more significant changes not only in its composition, but also in positions of individual countries forming this group (table 8).
Table 8 Leading exporters and importers of Slovakia's foreign trade, 2003-2005
Exporters
(Share in total Slovak exports in %)
Importers
(Share in total Slovak imports in %)
Rank
2003 2004 2005 2003 2004 2005
1. Germany
(30,9)
Germany
(28,6)
Germany
(26,1)
Germany
(25,5)
Germany Germany
(23,4) (20,9)
2. Czech rep.
(12,8)
Czech rep.
(13,6)
Czech rep.
(14,1)
Czech rep.
(14,3)
Czech rep. Czech rep.
(13,5) (12,7)
3. Italy
(7,5)
Austria
(7,9)
Austria
(7,1)
Russia
(10,8)
Russia Russia
(9,3) (10,7)
4. Austria
(7,4)
Italy
(6,4)
Italy
(6,6)
Italy
(6,1)
Italy Italy
(5,6) (4,8)
5. USA
(5,3)
Poland
(5,4)
Poland
(6,3)
Austria
(4,4)
Austria Poland
(4,2) (4,1)
6. Hungary
(4,9)
Hungary
(5,1)
Hungary
(5,7)
France
(4,2)
Poland Austria
(4,0) (3,8)
7. Poland
(4,8)
USA
(7,7)
France
(3,9)
Poland
(3,5)
France Hungary
(3,7) (3,6)
8. France
(3,5)
France
(3,6)
Netherlands
(3,5)
Hungary
(3,4)
Hungary France
(3,4) (3,2)
9. Netherlands
(2,7)
Netherlands
(3,1)
USA
(3,1)
Spain
(2,7)
China China
(2,7) (3,2)
10 UK
(2,1)
UK
(2,9)
UK
(3,1)
China
(2,5)
Spain Korean rep. (2,0) (2,6)
Source: Created on own calculations based on data of the Statistical Office of the Slovak Republic.
20
2.4. Trade balance
In all years of analyzed period (2003-2005), overall trade balance of Slovakia regis-tered deficit that was characterized by tendency of substantial increase of its value. In the year of Slovakia's accession to the EU as compared with 2003, when the deficit of its trade balance amounted to 25126 million Sk, more than doubled, reaching 50418 million Sk. In the year that followed (2005) the trade deficit increased further to 76322 million Sk.
A the commodity level, the most negative effect on trade balance of Slovakia in the period after its accession to the EU had product sections V and XVI along with sections VI and XVIII. Sections V and XVIII on year-to-year basis increased their trade deficits; in 2005 their levels rose to 85890 million Sk and 35159 million Sk respectively (in 2003 these accounted for 61047 million Sk and 13555 million Sk respectively). Trade deficit of section VI sharply increased from 36821 million Sk (2003) to 44170 million Sk in 2004, in 2005 its growth continued, but only to a level of 45091 million Sk. On the contrary, section XVI, although still included among sections with the largest trade deficits, in 2004 and 2005 it registered favorable trend - fall of its trade deficit, which thus in 2005 amounted to less than a third of that of 2003 (decline to 21629 million Sk). Marked influence on unfavorable state of Slovak trade balance had also trade performance of commodity sections IV, VII and VIII. While sections IV and VIII reported further deterioration of the trade balance in the period after Slovakia's accession to the EU, section VII sharply diminished its trade deficit on year-to-year basis (table 9). In 2004 and 2005, also sections II, III, XI and XXI (and in 2004 also sections XIV a XIX) participated with their trade deficits in the trade balance results of Slovakia, however, these sections, except for section II, did not played very important role in the structure of Slovakia's trade balance.
On the other hand, in the observed period the trade balance of Slovakia's was favorably affected by several commodity sections, but at the most by sections XVII and XV. The trade surplus of section XVII markedly lowered on year-to-year basis after Slovakia's accession to the EU; in 2004 as compared with 2003 it dropped from 109467 million Sk to 84729 million Sk and in 2005 to a level of 63118 million Sk, however, this section still remained the most successful commodity section of Slovakia's foreign trade. On the contrary, section XV increased its surplus annually, namely from z 33982 million Sk in 2003 to 39684 million Sk and to 45189 million Sk in 2004 and 2005 respectively. Favorable development was registered also in sections IX and X. Their trade surpluses were substan-tially lower in comparison with sections XVII and XV (they ranged between 10396 million Sk and 12405 million Sk), however, their values showed unambiguously increasing trend after Slovakia's accession to the EU. Not insignificant commodity sections as regards the generated surplus of trade balance were also sections XX and XII despite a sharp decrease they registered after Slovakia's accession to the EU. Group of sections which in both years of Slovakia's membership in the EU contributed with increasing surpluses to the results of trade balance is concluded by sections XVIII and I summarized view on
21
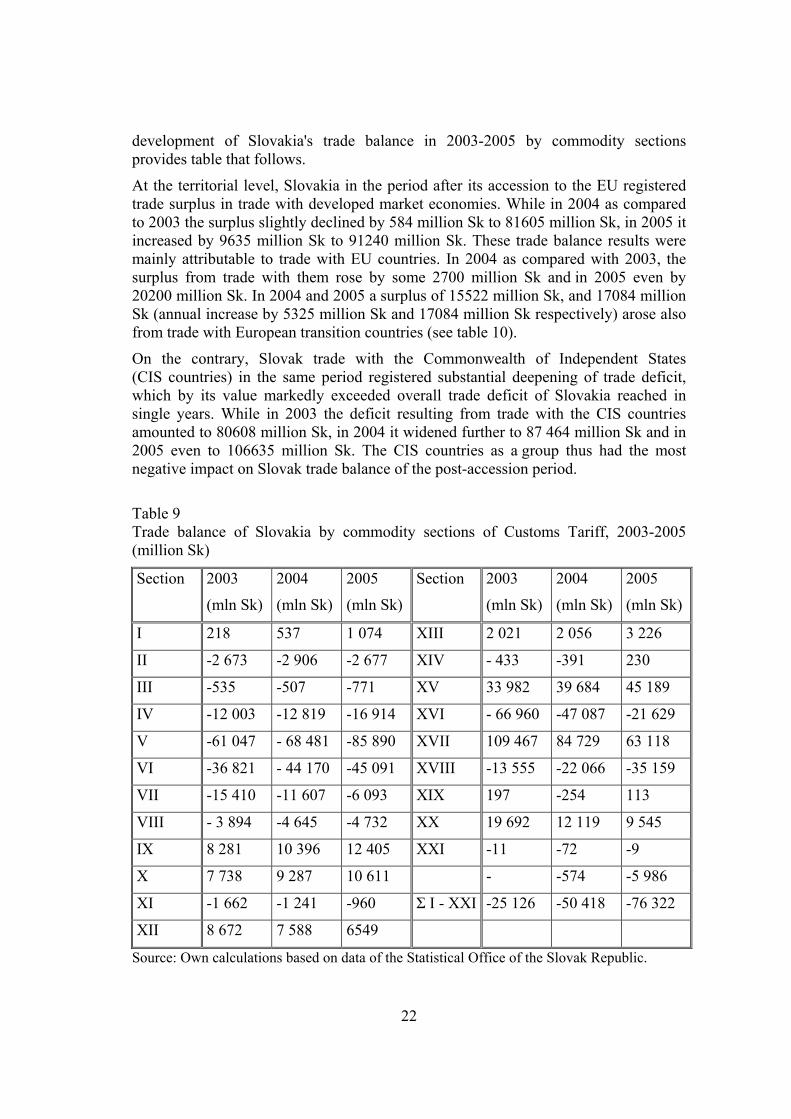
development of Slovakia's trade balance in 2003-2005 by commodity sections provides table that follows.
At the territorial level, Slovakia in the period after its accession to the EU registered trade surplus in trade with developed market economies. While in 2004 as compared to 2003 the surplus slightly declined by 584 million Sk to 81605 million Sk, in 2005 it increased by 9635 million Sk to 91240 million Sk. These trade balance results were mainly attributable to trade with EU countries. In 2004 as compared with 2003, the surplus from trade with them rose by some 2700 million Sk and in 2005 even by 20200 million Sk. In 2004 and 2005 a surplus of 15522 million Sk, and 17084 million Sk (annual increase by 5325 million Sk and 17084 million Sk respectively) arose also from trade with European transition countries (see table 10).
On the contrary, Slovak trade with the Commonwealth of Independent States (CIS countries) in the same period registered substantial deepening of trade deficit, which by its value markedly exceeded overall trade deficit of Slovakia reached in single years. While in 2003 the deficit resulting from trade with the CIS countries amounted to 80608 million Sk, in 2004 it widened further to 87 464 million Sk and in 2005 even to 106635 million Sk. The CIS countries as a group thus had the most negative impact on Slovak trade balance of the post-accession period.
Table 9 Trade balance of Slovakia by commodity sections of Customs Tariff, 2003-2005 (million Sk)
Section 2003
(mln Sk)
2004
(mln Sk)
2005
(mln Sk)
Section 2003
(mln Sk)
2004 2005
(mln Sk) (mln Sk)
I 218 537 1 074 XIII 2 021 2 056 3 226
II -2 673 -2 906 -2 677 XIV - 433 -391 230
III -535 -507 -771 XV 33 982 39 684 45 189
IV -12 003 -12 819 -16 914 XVI - 66 960 -47 087 -21 629
V -61 047 - 68 481 -85 890 XVII 109 467 84 729 63 118
VI -36 821 - 44 170 -45 091 XVIII -13 555 -22 066 -35 159
VII -15 410 -11 607 -6 093 XIX 197 -254 113
VIII - 3 894 -4 645 -4 732 XX 19 692 12 119 9 545
IX 8 281 10 396 12 405 XXI -11 -72 -9
X 7 738 9 287 10 611 - -574 -5 986
XI -1 662 -1 241 -960 Σ I - XXI -25 126 -50 418 -76 322
XII 8 672 7 588 6549
Source: Own calculations based on data of the Statistical Office of the Slovak Republic.
22
Slovakia's trade with developing countries in years after accession to the EU also reported sharp increase of trade deficit. Deficit with this territorial group rose from a level of 22927 million Sk in 2003 through 36140 million Sk in 2004 to 49122 million Sk in 2005. Annually deteriorating results were also marked in Slovak trade with non-European countries with transition and state-directed economies. Trade with this country group in 2004 and 2005 generated trade deficits amounting to 23153 million Sk and 30689 million Sk respectively, while in 2003 it was only 15800 million Sk. At a country level, after accession to the EU Slovakia registered the largest deficit in trade with Russia (77548 million Sk and 99369 million Sk in 2004 and 2005 respectively), China (23154 million Sk and 30512 million Sk), the Korean Republic (16236 million Sk and 27215 million Sk) and in trade with Japan (15926 million Sk and 17422 million Sk). The overall value of their trade deficit accounted for some 132900 million Sk in 2004 and in 2005 it rose to over 174500 million Sk. By the size of trade deficits, the listed countries were followed by Taiwan in both years - 2004 and 2005 (6736 million Sk and 12788 million Sk respectively) and by the Czech Republic in 2004 (6465 million Sk) which in 2005 was replaced in its place by Ukraine (3796 million Sk). In 2004 and 2005 in comparison with 2003, the composition of group of countries in trade with which Slovakia reported the largest deficits was different – Asian countries unambiguously predominated in the group, while up to 2003 several EU member countries - Czech Republic (ranking as 3rd), Spain and France (5th and 6th) also had figured in the group. On the contrary, after accession to the EU Slovakia registered the largest trade surplus in trade with Germany (35193 million Sk and 35464 million Sk in 2004 and 2005 respectively), Austria (30391 million Sk and 29621 million Sk),USA (27382 million Sk and 16226 million Sk), Hungary (13998 million Sk and 17628 million Sk), Netherlands (13198 million Sk and 20044 million Sk) and in trade with Poland (11136 million Sk and 18700 million Sk). This composition of countries in trade with which Slovakia after its accession to the EU ran the largest surpluses was, except for Netherlands, the same as in 2003 (in 2003 Nether-lands were not in this group, instead of it in the group was Italy). With regard to the amount of gained surpluses, in both observed years - 2004 and 2005 as compared to 2003 there were only changes in country positions (not composition) in the group. The only exception was Germany in trade with which Slovakia steadily reached the largest trade surplus (prior to and also after accession to the EU).
23
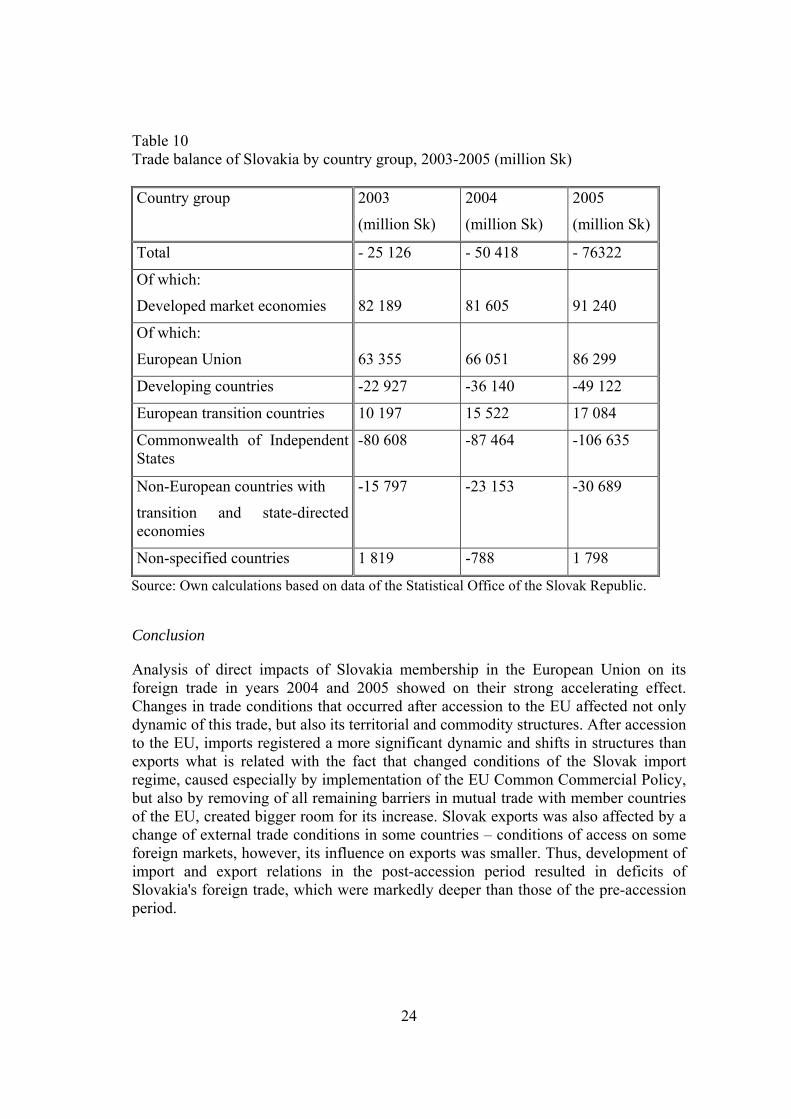
Table 10 Trade balance of Slovakia by country group, 2003-2005 (million Sk) Country group 2003
(million Sk)
2004 2005
(million Sk) (million Sk)
Total - 25 126 - 50 418 - 76322
Of which:
Developed market economies
82 189
81 605 91 240
Of which:
European Union
63 355
66 051 86 299
Developing countries -22 927 -36 140 -49 122
European transition countries 10 197 15 522 17 084
Commonwealth of Independent States
-80 608 -87 464 -106 635
Non-European countries with
transition and state-directed economies
-15 797 -23 153 -30 689
Non-specified countries 1 819 -788 1 798
Source: Own calculations based on data of the Statistical Office of the Slovak Republic.
Conclusion
Analysis of direct impacts of Slovakia membership in the European Union on its foreign trade in years 2004 and 2005 showed on their strong accelerating effect. Changes in trade conditions that occurred after accession to the EU affected not only dynamic of this trade, but also its territorial and commodity structures. After accession to the EU, imports registered a more significant dynamic and shifts in structures than exports what is related with the fact that changed conditions of the Slovak import regime, caused especially by implementation of the EU Common Commercial Policy, but also by removing of all remaining barriers in mutual trade with member countries of the EU, created bigger room for its increase. Slovak exports was also affected by a change of external trade conditions in some countries – conditions of access on some foreign markets, however, its influence on exports was smaller. Thus, development of import and export relations in the post-accession period resulted in deficits of Slovakia's foreign trade, which were markedly deeper than those of the pre-accession period.
24