Embed Size (px)
Citation preview

Impact of Bolus Dosing versus Continuous Infusion of Piperacillinand Tazobactam on the Development of Antimicrobial Resistance inPseudomonas aeruginosa
T. W. Felton,a J. Goodwin,a,b L. O’Connor,a A. Sharp,a,b L. Gregson,a,b J. Livermore,a,b S. J. Howard,a,b M. N. Neely,c W. W. Hopea,b
The University of Manchester, Manchester Academic Health Science Centre, NIHR Translational Research Facility in Respiratory Medicine, University Hospital of SouthManchester NHS Foundation Trust, Manchester, United Kingdoma; Antimicrobial Pharmacodynamics and Therapeutics, Department of Molecular and ClinicalPharmacology, University of Liverpool, Liverpool, United Kingdomb; Laboratory of Applied Pharmacokinetics, University of Southern California, School of Medicine, LosAngeles, California, USAc
Management of nosocomial pneumonia is frequently complicated by bacterial resistance. Extended infusions of beta-lactams areincreasingly being used to improve clinical outcomes. However, the impact of this strategy on the emergence of antimicrobialresistance is not known. A hollow-fiber infection model with Pseudomonas aeruginosa (PAO1) was used. Pharmacokinetic (PK)profiles of piperacillin-tazobactam similar to those in humans were simulated over 5 days. Three dosages of piperacillin-tazobac-tam were administered over 0.5 h or 4 h, with redosing every 8 h. Two initial bacterial densities were investigated (�104 CFU/mland �107 CFU/ml). The time courses of the total bacterial population and the resistant subpopulation were determined. All datawere described using a mathematical model, which was then used to define the relationship between drug concentrations, bacte-rial killing, and emergence of piperacillin resistance. There was logarithmic growth in controls in the initial 24 h, reaching a pla-teau of �9 log10 CFU/ml. Bacterial killing following administration of piperacillin via bolus dosing and that after extended infu-sions were similar. For the lower initial bacterial density, trough total plasma piperacillin concentration/MIC ratios of 3.4 and10.4 for bolus and extended-infusion regimens, respectively, were able to suppress the emergence of piperacillin resistance. Forthe higher initial bacterial density, all regimens were associated with progressive growth of a resistant subpopulation. A strati-fied approach, according to bacterial density, is required to treat patients with nosocomial pneumonia. Antimicrobial mono-therapy may be sufficient for some patients. However, for patients with a high bacterial burden, alternative therapeutic strategiesare required to maximize bacterial killing and prevent antimicrobial resistance.
The attributable mortality of hospital-acquired pneumonia(HAP) and ventilator-associated pneumonia (VAP) remains
high despite treatment with antimicrobial chemotherapy (1).Pseudomonas aeruginosa is a common cause of nosocomial pneu-monia (2). Approximately 10 to 50% of patients treated for nos-ocomial pneumonia develop antimicrobial resistance (3, 4). Thedevelopment of resistance in P. aeruginosa may account for a pro-portion of clinical failures following administration of standardtherapeutic regimens. Emergence of antimicrobial resistancecompromises the outcome of individual patients but also has sig-nificant ramifications for the treatment of critically ill populations(4, 5).
For �-lactam antibiotics, the pharmacodynamic index thatbest links drug exposure with the antibacterial effect is the fractionof the dosing interval during which the free drug concentrationsare above the bacterial MIC (fT � MIC) (6, 7). Use of extended orcontinuous infusion maximizes the time during which drug con-centrations are above the MIC (8, 9). Compared with bolus dos-ing, increased bacterial killing is seen both in vitro and in vivo withinfusions of �-lactam antibiotics (10–12). In silico models suggestthat exposures produced by infusions of �-lactam antibiotics gen-erate a greater probability of target attainment than those attainedwith bolus dosing (13). Despite this, few studies have demon-strated a clinical advantage associated with �-lactam infusions,and there is no information on the use of such regimens and thelikelihood of emergence of drug resistance (14, 15).
The pharmacodynamic index that best links drug exposure andthe emergence of antimicrobial resistance is poorly defined. For
meropenem, the ratio of minimum concentration to MIC (Cmin/MIC) has been linked to suppression of resistance (16). Studiesusing in vitro models suggest that emergence of resistance oftenfollows an “inverted U” pattern—in this case, there is no amplifi-cation of resistant subpopulations at either low or high drug con-centrations (17). Here, we used an in vitro hollow-fiber infectionmodel (HFIM), with Pseudomonas aeruginosa, to examine the im-pact of administering piperacillin-tazobactam by bolus dosingand extended infusion on the emergence of piperacillin resistance.
MATERIALS AND METHODSAntimicrobial agent. For the HFIM, the clinical formulation of pipera-cillin-tazobactam (2 g/0.25 g) was used and was supplied by Stragen UK(Surrey, United Kingdom). For in vitro susceptibility testing, develop-ment of drug-containing agar, and high-performance liquid chromatog-raphy (HPLC), pure piperacillin-tazobactam was used, which was ob-tained from Sigma-Aldrich (Dorset, United Kingdom).
Microorganism. Pseudomonas aeruginosa (PAO1) was used for all ex-periments (kindly provided by C. Winstanley [University of Liverpool,
Received 24 April 2013 Returned for modification 8 August 2013Accepted 23 August 2013
Published ahead of print 3 September 2013
Address correspondence to T. W. Felton, [email protected].
Copyright © 2013 Felton et al. This is an open-access article distributed under theterms of the Creative Commons Attribution 3.0 Unported license.
doi:10.1128/AAC.00867-13
December 2013 Volume 57 Number 12 Antimicrobial Agents and Chemotherapy p. 5811–5819 aac.asm.org 5811
on April 4, 2019 by guest
http://aac.asm.org/
Dow
nloaded from
United Kingdom]). The bacterium was stored at �80°C in cation-ad-justed Mueller-Hinton II (Ca-MH) broth with 10% glycerol (Sigma-Al-drich, Dorset, United Kingdom). For each experiment, fresh isolates weregrown on blood agar plates (Oxoid Limited, Hampshire, United King-dom) at 37°C for 24 h. The frequency of mutation to resistance was esti-mated, on two separate occasions, by plating aliquots of 0.1 ml of P.aeruginosa (PAO1) onto 10 Ca-MH agar plates containing 24 mg/literpiperacillin and 3 mg/liter of tazobactam (6� the piperacillin MIC). Thestability of piperacillin at 4°C was confirmed by quantification of the drugin the agar plates and reproducible enumeration of PAO1 over a 1-weekperiod (data not shown). The bacterial suspension was prepared as forinjection into the HFIM (see below). The concentration of the bacterialsuspension was determined by quantitative cultures. The ratio of thenumber of resistant bacteria to the total population was used to estimatethe frequency of resistant isolates.
Susceptibility studies. The MIC for PAO1 was conducted on five oc-casions, in Ca-MH broth (Sigma-Aldrich, United Kingdom), using brothmicrodilution methodology as described by the Clinical Laboratory Sci-ences Institute (CLSI) (18).
HPLC. Piperacillin concentrations were measured using a previouslyvalidated high-performance liquid chromatography (HPLC) methodwith a Shimadzu Prominence system (Shimadzu, Milton Keynes, UnitedKingdom) (19). Fifty �l of extracted sample was injected onto a Hypersiloctyldecyl silane (ODS) C18 5-�m column (150 by 4.6 mm [inside diam-eter]; Thermo Scientific, Hertfordshire, United Kingdom). A standardcurve encompassing 1.56 to 400 mg/liter was constructed in Ca-MHbroth, from stock solutions of 8,000 mg/liter piperacillin in water (FisherScientific, Loughborough, United Kingdom). The internal standard waspenicillin G in water at 1,000 mg/liter (Sigma-Aldrich, Dorset, UnitedKingdom). The starting mobile phase was 100% A, which was 0.2 Mpotassium phosphate monobasic buffer in 90:10 water-acetonitrile (vol/vol), with a gradient over 7 min progressing to 50% A and 50% B (aceto-nitrile) with a run time of 9 min and a flow rate of 1.5 ml/min. Piperacillinwas detected using UV at 220 nm. Piperacillin and the internal standardeluted after 6.8 and 7.2 min, respectively. The intra- and interassay coef-ficient of variation was �5.8%. The limit of detection and quantificationwas 1.56 mg/liter.
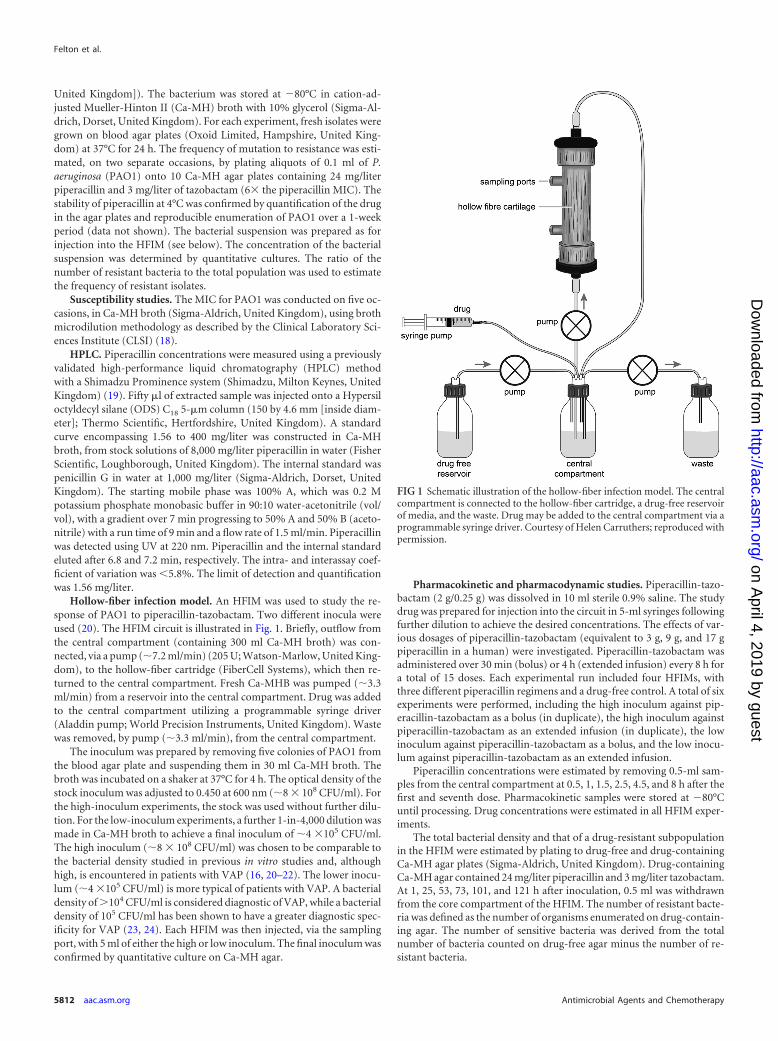
Hollow-fiber infection model. An HFIM was used to study the re-sponse of PAO1 to piperacillin-tazobactam. Two different inocula wereused (20). The HFIM circuit is illustrated in Fig. 1. Briefly, outflow fromthe central compartment (containing 300 ml Ca-MH broth) was con-nected, via a pump (�7.2 ml/min) (205 U; Watson-Marlow, United King-dom), to the hollow-fiber cartridge (FiberCell Systems), which then re-turned to the central compartment. Fresh Ca-MHB was pumped (�3.3ml/min) from a reservoir into the central compartment. Drug was addedto the central compartment utilizing a programmable syringe driver(Aladdin pump; World Precision Instruments, United Kingdom). Wastewas removed, by pump (�3.3 ml/min), from the central compartment.
The inoculum was prepared by removing five colonies of PAO1 fromthe blood agar plate and suspending them in 30 ml Ca-MH broth. Thebroth was incubated on a shaker at 37°C for 4 h. The optical density of thestock inoculum was adjusted to 0.450 at 600 nm (�8 � 108 CFU/ml). Forthe high-inoculum experiments, the stock was used without further dilu-tion. For the low-inoculum experiments, a further 1-in-4,000 dilution wasmade in Ca-MH broth to achieve a final inoculum of �4 �105 CFU/ml.The high inoculum (�8 � 108 CFU/ml) was chosen to be comparable tothe bacterial density studied in previous in vitro studies and, althoughhigh, is encountered in patients with VAP (16, 20–22). The lower inocu-lum (�4 �105 CFU/ml) is more typical of patients with VAP. A bacterialdensity of �104 CFU/ml is considered diagnostic of VAP, while a bacterialdensity of 105 CFU/ml has been shown to have a greater diagnostic spec-ificity for VAP (23, 24). Each HFIM was then injected, via the samplingport, with 5 ml of either the high or low inoculum. The final inoculum wasconfirmed by quantitative culture on Ca-MH agar.
Pharmacokinetic and pharmacodynamic studies. Piperacillin-tazo-bactam (2 g/0.25 g) was dissolved in 10 ml sterile 0.9% saline. The studydrug was prepared for injection into the circuit in 5-ml syringes followingfurther dilution to achieve the desired concentrations. The effects of var-ious dosages of piperacillin-tazobactam (equivalent to 3 g, 9 g, and 17 gpiperacillin in a human) were investigated. Piperacillin-tazobactam wasadministered over 30 min (bolus) or 4 h (extended infusion) every 8 h fora total of 15 doses. Each experimental run included four HFIMs, withthree different piperacillin regimens and a drug-free control. A total of sixexperiments were performed, including the high inoculum against pip-eracillin-tazobactam as a bolus (in duplicate), the high inoculum againstpiperacillin-tazobactam as an extended infusion (in duplicate), the lowinoculum against piperacillin-tazobactam as a bolus, and the low inocu-lum against piperacillin-tazobactam as an extended infusion.
Piperacillin concentrations were estimated by removing 0.5-ml sam-ples from the central compartment at 0.5, 1, 1.5, 2.5, 4.5, and 8 h after thefirst and seventh dose. Pharmacokinetic samples were stored at �80°Cuntil processing. Drug concentrations were estimated in all HFIM exper-iments.
The total bacterial density and that of a drug-resistant subpopulationin the HFIM were estimated by plating to drug-free and drug-containingCa-MH agar plates (Sigma-Aldrich, United Kingdom). Drug-containingCa-MH agar contained 24 mg/liter piperacillin and 3 mg/liter tazobactam.At 1, 25, 53, 73, 101, and 121 h after inoculation, 0.5 ml was withdrawnfrom the core compartment of the HFIM. The number of resistant bacte-ria was defined as the number of organisms enumerated on drug-contain-ing agar. The number of sensitive bacteria was derived from the totalnumber of bacteria counted on drug-free agar minus the number of re-sistant bacteria.
FIG 1 Schematic illustration of the hollow-fiber infection model. The centralcompartment is connected to the hollow-fiber cartridge, a drug-free reservoirof media, and the waste. Drug may be added to the central compartment via aprogrammable syringe driver. Courtesy of Helen Carruthers; reproduced withpermission.
Felton et al.
5812 aac.asm.org Antimicrobial Agents and Chemotherapy
on April 4, 2019 by guest
http://aac.asm.org/
Dow
nloaded from
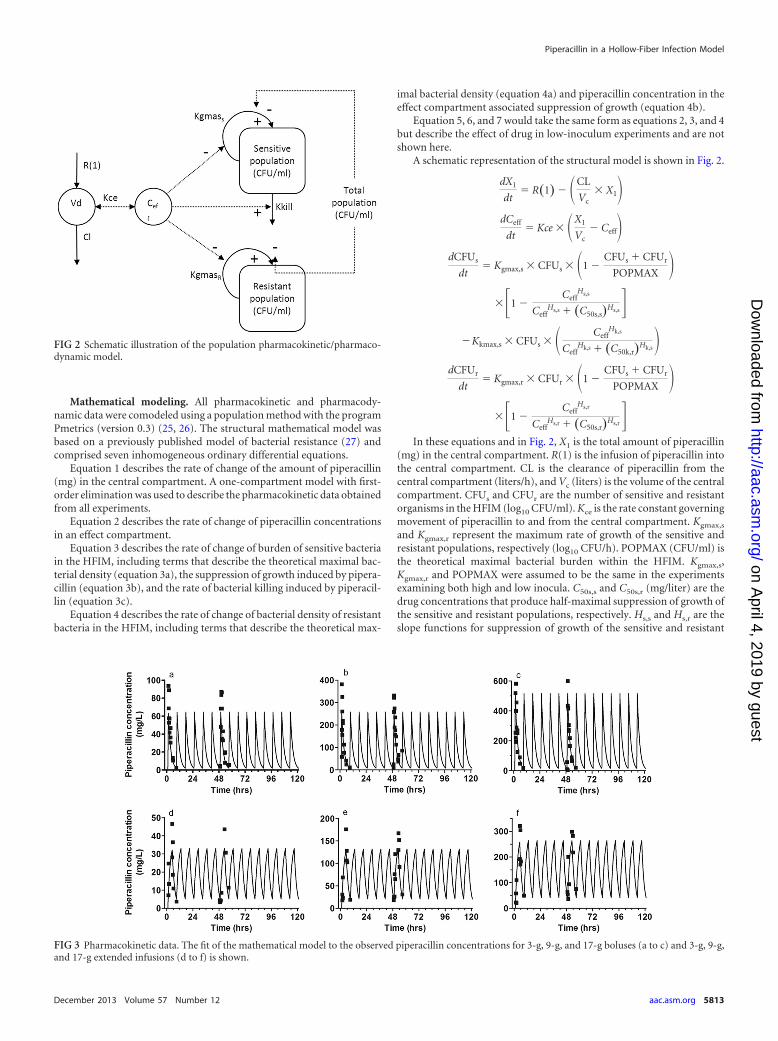
Mathematical modeling. All pharmacokinetic and pharmacody-namic data were comodeled using a population method with the programPmetrics (version 0.3) (25, 26). The structural mathematical model wasbased on a previously published model of bacterial resistance (27) andcomprised seven inhomogeneous ordinary differential equations.
Equation 1 describes the rate of change of the amount of piperacillin(mg) in the central compartment. A one-compartment model with first-order elimination was used to describe the pharmacokinetic data obtainedfrom all experiments.
Equation 2 describes the rate of change of piperacillin concentrationsin an effect compartment.
Equation 3 describes the rate of change of burden of sensitive bacteriain the HFIM, including terms that describe the theoretical maximal bac-terial density (equation 3a), the suppression of growth induced by pipera-cillin (equation 3b), and the rate of bacterial killing induced by piperacil-lin (equation 3c).
Equation 4 describes the rate of change of bacterial density of resistantbacteria in the HFIM, including terms that describe the theoretical max-
imal bacterial density (equation 4a) and piperacillin concentration in theeffect compartment associated suppression of growth (equation 4b).
Equation 5, 6, and 7 would take the same form as equations 2, 3, and 4but describe the effect of drug in low-inoculum experiments and are notshown here.
A schematic representation of the structural model is shown in Fig. 2.
dX1
dt� R�1� � �CL
Vc� X1�
dCeff
dt� Kce � �X1
Vc� Ceff�
dCFUs
dt� Kgmax,s � CFUs � �1 �
CFUs � CFUr
POPMAX ���1 �
CeffHs,s
CeffHs,s � �C50s,s�Hs,s�
�Kkmax,s � CFUs � � CeffHk,s
CeffHk,s � �C50k,r�Hk,s�
dCFUr
dt� Kgmax,r � CFUr � �1 �
CFUs � CFUr
POPMAX ���1 �
CeffHs,r
CeffHs,r � �C50s,r�Hs,r�
In these equations and in Fig. 2, X1 is the total amount of piperacillin(mg) in the central compartment. R(1) is the infusion of piperacillin intothe central compartment. CL is the clearance of piperacillin from thecentral compartment (liters/h), and Vc (liters) is the volume of the centralcompartment. CFUs and CFUr are the number of sensitive and resistantorganisms in the HFIM (log10 CFU/ml). Kce is the rate constant governingmovement of piperacillin to and from the central compartment. Kgmax,s
and Kgmax,r represent the maximum rate of growth of the sensitive andresistant populations, respectively (log10 CFU/h). POPMAX (CFU/ml) isthe theoretical maximal bacterial burden within the HFIM. Kgmax,s,Kgmax,r and POPMAX were assumed to be the same in the experimentsexamining both high and low inocula. C50s,s and C50s,r (mg/liter) are thedrug concentrations that produce half-maximal suppression of growth ofthe sensitive and resistant populations, respectively. Hs,s and Hs,r are theslope functions for suppression of growth of the sensitive and resistant
FIG 2 Schematic illustration of the population pharmacokinetic/pharmaco-dynamic model.
FIG 3 Pharmacokinetic data. The fit of the mathematical model to the observed piperacillin concentrations for 3-g, 9-g, and 17-g boluses (a to c) and 3-g, 9-g,and 17-g extended infusions (d to f) is shown.
Piperacillin in a Hollow-Fiber Infection Model
December 2013 Volume 57 Number 12 aac.asm.org 5813
on April 4, 2019 by guest
http://aac.asm.org/
Dow
nloaded from
populations. Kkmax,s (log10 CFU/ml) represent the maximum rate of kill-ing of the sensitive population. C50k,s (mg/liter) is the drug concentrationthat produces half-maximal killing of the sensitive and resistant popula-tions, respectively. Hk,s is the slope function for killing of the sensitivepopulation. Killing of resistant bacteria was not observed and thereforenot included in the mathematical model. Clearance, Vc, Kgmax,s, Kgmax,r,and POPMAX were assumed to be the same in both the high- and low-inoculum experiments. All the other pharmacodynamic parameters werespecific to the studies examining the high and low inocula.
Error polynomials were obtained by fitting the same structural math-ematical model to the pharmacokinetic and pharmacodynamic data fromeach of the 24 individual HFIMs using the maximum-likelihood estima-tor in the program ADAPT 5 (28, 29). The means, medians, and standarddeviations of the population parameters were estimated. The fit of each ofthe structural models to the data was further assessed by (i) the log likeli-hood value, (ii) the coefficient of determination (r2) from a linear regres-sion of the observed- predicted plots both before and after the Bayesianstep, (iii) the Akaike information criterion, and (iv) comparison of theobserved data with simulation based on the mean and median populationparameter estimates (1).
Pharmacokinetic and pharmacodynamic simulations. Simulationswere performed for each regimen and inoculum, using the mathematicalmodel described above. The pharmacokinetic program ADAPT 5 wasused (28). Both the population and the individual median parameter es-timates (i.e., after the Bayesian step) for each of the 24 HFIMs were used.A number of endpoints were explored and reported in the simulations.The fraction of the final 3 dosing intervals (i.e., the final 24 h of theexperiment, on day 5) during which the drug concentrations were abovethe MIC and 4 times the MIC and the area under the piperacillin concen-tration-time curve were estimated (30).
A second set of simulations was performed for 17 piperacillin regi-mens between 0 and 20 g three times daily, administered by bolus orextended infusion. The median parameter estimates for the populationwere used. The density of total bacteria and the resistant subpopulationsafter 121 h (15 doses) and trough piperacillin concentration were esti-
mated. The trough piperacillin concentration was adjusted for MIC(Cmin/MIC ratio).
Extrapolating from the HFIM to humans. To explore the clinicalimplication of the experimental observations, the results obtained withthe HFIM were extrapolated to humans. A previously published parallelfirst-order Michaelis-Menten clearance model for piperacillin plasmapharmacokinetics was used (13). Four regimens were investigated using a5,000-patient Monte Carlo simulation. The regimens were (i) 4 g pipera-cillin administered over 30 min with repeat dosing every 8 h, (ii) 4 gpiperacillin administered over 4 h with repeat dosing every 8 h, (iii) 4 gpiperacillin administered over 30 min with repeat dosing every 6 h, and(iv) 4 g piperacillin administered every 3 h with repeat dosing every 6 h.The mean parameter values and their associated variance (obtained fromthe output of the original population pharmacokinetic model (13) wereembedded in the subroutine PRIOR of the ADAPT 5 program (28). Theparameter estimates standard deviations were as follows: Vmax, 898.91 402.61 mg/h; Km, 90.13 74.14 mg/liter; Vc, 13.67 7.20 liters; Kcp, 9.19 10.25 h�1; Kpc, 20.95 16.91 h�1; and SCL, 6.62 3.81 liters/h (13). Alog-normal parameter distribution was used in the simulations. Proteinbinding for piperacillin was assumed to be 30% (31). For each regimen,the fraction of simulated subjects who achieved the pharmacodynamictarget of a trough total piperacillin concentration/MIC ratio of either 3.4for bolus regimens or 10.4 for extended infusions, for a range of MICsfrom 0.0625 to 64 mg/liter, was determined.
RESULTSMICs. The piperacillin MICs in Ca-MH broth for PAO1 were 2, 4,4, 8, and 8 mg/liter. A median MIC of 4 mg/liter was used insubsequent analyses.
Mutational frequency to resistance. The frequency of muta-tion of PAO1 to piperacillin resistance was 1.04 � 10�7 at 6 timesthe MIC (i.e., there was 1 resistant bacterium for every 1.04 � 107
bacteria).Results of the hollow-fiber infection model. (i) Pharmacoki-
netics. Extended-infusion regimens maintained the piperacillin
TABLE 1 Parameter estimates from the mathematical model
Inoculum
Mean SD (median)
CL (liters/h) V (liters)POPMAX (log10
CFU/ml)Kgmax,s (log10
CFU/ml/h)Kgmax,r (log10
CFU/ml/h) Kce (h�1)C50s,s
(mg/liters)
High and low 0.167 0.037(0.164)
0.367 0.073(0.355)
3.89 � 1092.91 � 109
(3.25 � 109)0.642 0.035
(0.630)0.450 0.044
(0.445)High 0.064 0.015
(0.061)2.805 1.588
(3.458)Low 0.056 0.018
(0.060)3.189 1.211
(3.093)
TABLE 2 Selected pharmacokinetic data for piperacillina
Piperacillin dosageand regimen
T � MIC(%)
T � 4� MIC(%)
AUC (mg/liter/24 h) (mg/liter)
3-g bolus 81 43 457.8 2.03-g extended
infusion100 59 457.8 5.2
9-g bolus 100 81 1,831.3 8.19-g extended
infusion100 100 1,831.3 20.8
17-g bolus 100 100 3,662.5 16.217-g extended
infusion100 100 3,662.5 41.6
a T � MIC and T � 4� MIC, time the free piperacillin concentration in the centralcompartment was above the MIC and above four times the MIC.
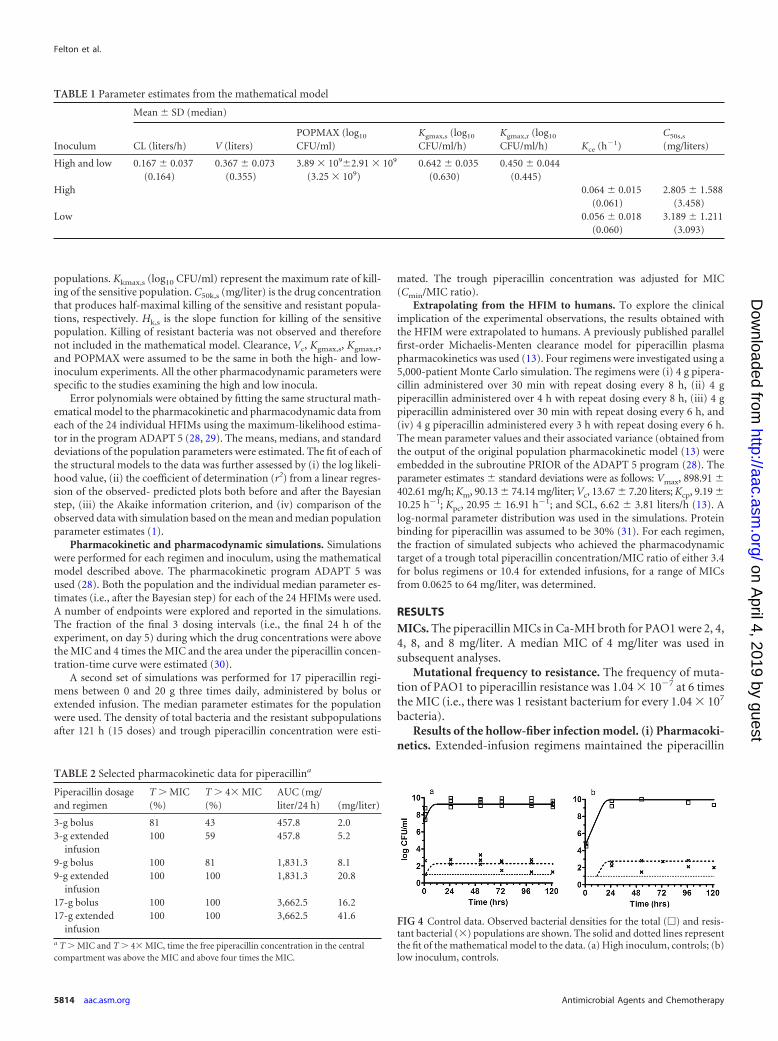
FIG 4 Control data. Observed bacterial densities for the total (�) and resis-tant bacterial (�) populations are shown. The solid and dotted lines representthe fit of the mathematical model to the data. (a) High inoculum, controls; (b)low inoculum, controls.
Felton et al.
5814 aac.asm.org Antimicrobial Agents and Chemotherapy
on April 4, 2019 by guest
http://aac.asm.org/
Dow
nloaded from
concentration above the MIC for a greater proportion of the dos-ing interval. Trough piperacillin concentrations were lower withthe bolus regimen than with the same total dosage delivered byextended infusion (Fig. 3; Table 1 and 2).
(ii) Untreated controls at the high and the low inoculum.Logarithmic growth occurred in the total bacterial populationwith an estimated maximum bacterial density of 3.89 � 109
CFU/ml (Table 1; Fig. 4). Growth of the resistant subpopula-tion achieved a maximum density of �102 CFU/ml, at whichpoint there was no further growth of the resistant subpopula-tion. The final bacterial densities of both the total population(POPMAX) and the resistant subpopulation were similar forboth inocula.
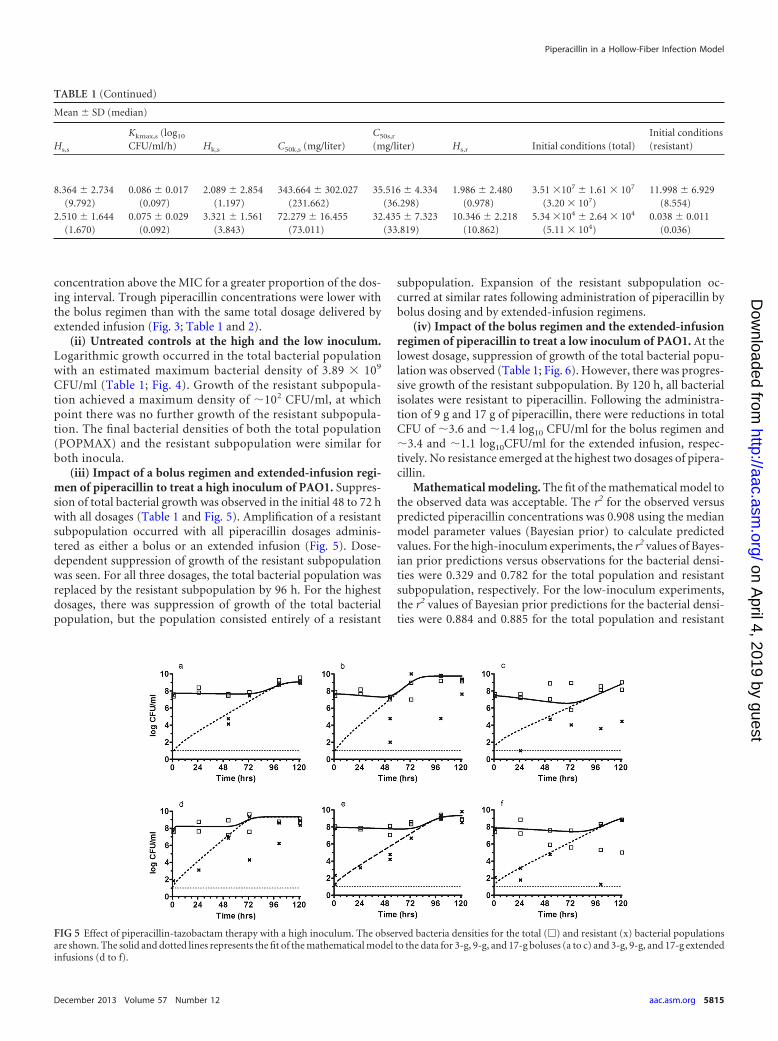
(iii) Impact of a bolus regimen and extended-infusion regi-men of piperacillin to treat a high inoculum of PAO1. Suppres-sion of total bacterial growth was observed in the initial 48 to 72 hwith all dosages (Table 1 and Fig. 5). Amplification of a resistantsubpopulation occurred with all piperacillin dosages adminis-tered as either a bolus or an extended infusion (Fig. 5). Dose-dependent suppression of growth of the resistant subpopulationwas seen. For all three dosages, the total bacterial population wasreplaced by the resistant subpopulation by 96 h. For the highestdosages, there was suppression of growth of the total bacterialpopulation, but the population consisted entirely of a resistant
subpopulation. Expansion of the resistant subpopulation oc-curred at similar rates following administration of piperacillin bybolus dosing and by extended-infusion regimens.
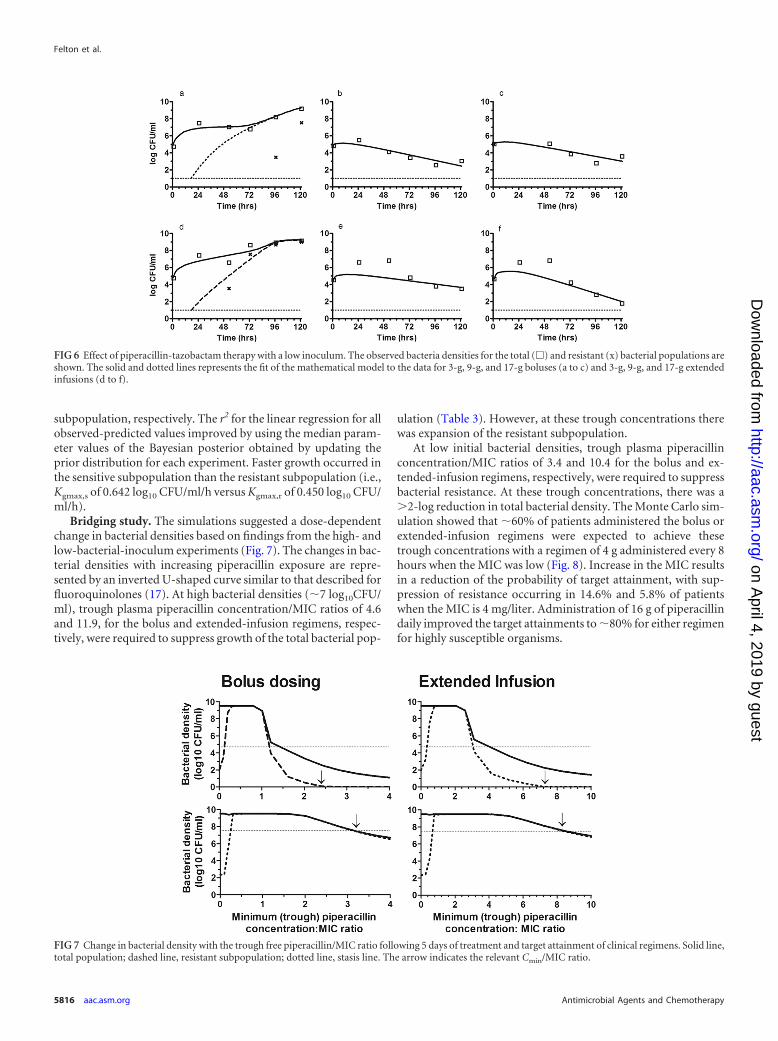
(iv) Impact of the bolus regimen and the extended-infusionregimen of piperacillin to treat a low inoculum of PAO1. At thelowest dosage, suppression of growth of the total bacterial popu-lation was observed (Table 1; Fig. 6). However, there was progres-sive growth of the resistant subpopulation. By 120 h, all bacterialisolates were resistant to piperacillin. Following the administra-tion of 9 g and 17 g of piperacillin, there were reductions in totalCFU of �3.6 and �1.4 log10 CFU/ml for the bolus regimen and�3.4 and �1.1 log10CFU/ml for the extended infusion, respec-tively. No resistance emerged at the highest two dosages of pipera-cillin.
Mathematical modeling. The fit of the mathematical model tothe observed data was acceptable. The r2 for the observed versuspredicted piperacillin concentrations was 0.908 using the medianmodel parameter values (Bayesian prior) to calculate predictedvalues. For the high-inoculum experiments, the r2 values of Bayes-ian prior predictions versus observations for the bacterial densi-ties were 0.329 and 0.782 for the total population and resistantsubpopulation, respectively. For the low-inoculum experiments,the r2 values of Bayesian prior predictions for the bacterial densi-ties were 0.884 and 0.885 for the total population and resistant
TABLE 1 (Continued)
Mean SD (median)
Hs,s
Kkmax,s (log10
CFU/ml/h) Hk,s C50k,s (mg/liter)C50s,r
(mg/liter) Hs,r Initial conditions (total)Initial conditions(resistant)
8.364 2.734(9.792)
0.086 0.017(0.097)
2.089 2.854(1.197)
343.664 302.027(231.662)
35.516 4.334(36.298)
1.986 2.480(0.978)
3.51 �107 1.61 � 107
(3.20 � 107)11.998 6.929
(8.554)2.510 1.644
(1.670)0.075 0.029
(0.092)3.321 1.561
(3.843)72.279 16.455
(73.011)32.435 7.323
(33.819)10.346 2.218
(10.862)5.34 �104 2.64 � 104
(5.11 � 104)0.038 0.011
(0.036)
FIG 5 Effect of piperacillin-tazobactam therapy with a high inoculum. The observed bacteria densities for the total (�) and resistant (x) bacterial populationsare shown. The solid and dotted lines represents the fit of the mathematical model to the data for 3-g, 9-g, and 17-g boluses (a to c) and 3-g, 9-g, and 17-g extendedinfusions (d to f).
Piperacillin in a Hollow-Fiber Infection Model
December 2013 Volume 57 Number 12 aac.asm.org 5815
on April 4, 2019 by guest
http://aac.asm.org/
Dow
nloaded from
subpopulation, respectively. The r2 for the linear regression for allobserved-predicted values improved by using the median param-eter values of the Bayesian posterior obtained by updating theprior distribution for each experiment. Faster growth occurred inthe sensitive subpopulation than the resistant subpopulation (i.e.,Kgmax,s of 0.642 log10 CFU/ml/h versus Kgmax,r of 0.450 log10 CFU/ml/h).
Bridging study. The simulations suggested a dose-dependentchange in bacterial densities based on findings from the high- andlow-bacterial-inoculum experiments (Fig. 7). The changes in bac-terial densities with increasing piperacillin exposure are repre-sented by an inverted U-shaped curve similar to that described forfluoroquinolones (17). At high bacterial densities (�7 log10CFU/ml), trough plasma piperacillin concentration/MIC ratios of 4.6and 11.9, for the bolus and extended-infusion regimens, respec-tively, were required to suppress growth of the total bacterial pop-
ulation (Table 3). However, at these trough concentrations therewas expansion of the resistant subpopulation.
At low initial bacterial densities, trough plasma piperacillinconcentration/MIC ratios of 3.4 and 10.4 for the bolus and ex-tended-infusion regimens, respectively, were required to suppressbacterial resistance. At these trough concentrations, there was a�2-log reduction in total bacterial density. The Monte Carlo sim-ulation showed that �60% of patients administered the bolus orextended-infusion regimens were expected to achieve thesetrough concentrations with a regimen of 4 g administered every 8hours when the MIC was low (Fig. 8). Increase in the MIC resultsin a reduction of the probability of target attainment, with sup-pression of resistance occurring in 14.6% and 5.8% of patientswhen the MIC is 4 mg/liter. Administration of 16 g of piperacillindaily improved the target attainments to �80% for either regimenfor highly susceptible organisms.
FIG 6 Effect of piperacillin-tazobactam therapy with a low inoculum. The observed bacteria densities for the total (�) and resistant (x) bacterial populations areshown. The solid and dotted lines represents the fit of the mathematical model to the data for 3-g, 9-g, and 17-g boluses (a to c) and 3-g, 9-g, and 17-g extendedinfusions (d to f).
FIG 7 Change in bacterial density with the trough free piperacillin/MIC ratio following 5 days of treatment and target attainment of clinical regimens. Solid line,total population; dashed line, resistant subpopulation; dotted line, stasis line. The arrow indicates the relevant Cmin/MIC ratio.
Felton et al.
5816 aac.asm.org Antimicrobial Agents and Chemotherapy
on April 4, 2019 by guest
http://aac.asm.org/
Dow
nloaded from

DISCUSSION
This study investigated the impact on antibacterial activity and theemergence of piperacillin resistance following administration ofpiperacillin-tazobactam by bolus versus extended infusion. Pip-eracillin administration by bolus and that by extended infusionresult in comparable antibacterial activities and rates of emer-gence of antimicrobial resistance. In the setting of a high bacterialinoculum, expansion of a resistant subpopulation occurs evenwhen there is an overall decline in bacterial density. In a clinicalsetting, a decline in bacterial density may be achieved only at theexpense of the development of a resistant bacterial subpopulation.These resistant bacteria may be responsible for a subsequent clin-ical relapse in an individual patient or serve as a source for hori-zontal transmission. Prevention of the emergence of a resistantsubpopulation in the setting of a high bacterial inoculum mayrequire an alternative therapeutic approach, such as combinationchemotherapy. In the low-bacterial-inoculum experiments,trough plasma total piperacillin concentration/MIC ratios of 3.4and 10.4, from the bolus and extended-infusion regimens, respec-
tively, were required to suppress the emergence of antimicrobialresistance. Results of the Monte Carlo simulation suggest that thatfewer than 11% of patients achieve these concentrations whenregimens of piperacillin of 12 g/day in three divided dosages for anorganism with an MIC of 4 mg/liter are used. Although treatmentof organisms with lower MICs or increasing the total piperacillindosage to 16 g daily leads to an increase the rates of target attain-ment, this is still far from optimal.
A bacterial density of �104 CFU/ml in bronchoalveolar lavagefluid is required for a diagnosis of VAP (23, 32). However, bacte-rial densities as high as 108 CFU/ml are frequently encountered inpatients with this syndrome (21). Bacterial densities spanning asimilar range (104 to 108 CFU/ml) are also present in patients withHAP (33). The high and low inocula used in this in vitro studywere selected to encompass the range of these clinically relevantbacterial densities. Antimicrobial management for patients withHAP and VAP is complex, with many conflicting results fromboth clinical and preclinical studies (23). In vitro studies, includ-ing this study, suggest that monotherapy with a �-lactam agent totreat high densities of Pseudomonas aeruginosa is insufficient tosuppress the emergence of antimicrobial resistance (30, 34). Theaddition of a second agent to a �-lactam (e.g., an aminoglycosideor fluoroquinolone) may enable suppression of emergence of re-sistance, but this requires further study (35).
The pharmacokinetic variability of �-lactam antibiotics in crit-ically ill patients has led to suggestions that therapeutic drug mon-itoring may be a useful adjunct to therapy (36). Trough concen-trations are a clinically convenient therapeutic target because ofthe ease with which samples can be interpreted. The fraction of thedosing interval during which drug concentrations are above athreshold (e.g., some multiple of the MIC) requires more inten-sive sampling. When the bacterial burden is �104 CFU/ml (thedensity required for a diagnosis of VAP), the piperacillin concen-tration/MIC ratios within the HFIM that suppresses the emer-gence of piperacillin resistance are 2.4 and 7.3 for the bolus andextended-infusion regimens, respectively. This corresponds toplasma Cmin/MIC ratios of 3.4 and 10.4 for the bolus and extend-ed-infusion regimens, respectively, assuming that piperacillinprotein binding is 30%. The Cmin/MIC ratio is consistent with theratio of 6.2 for bolus regimens of meropenem (16). The Cmin/MICratios identified in the HFIM are achieved in insufficient numbers
TABLE 3 Cmin/MIC ratios required to achieve stasis, 1-, 2-, and 3-logbacterial killing and suppression of emergence of resistance
Bacterial density andstatus
Cmin/MIC (mg/liter)
Bolus Extended infusion
Hollowfiber
Predictedplasmaa
Hollowfiber
Predictedplasmaa
LowBacterial stasis (total
bacteria)1.4 2.0 4.1 5.9
1-log reduction in totalCFU/ml
1.8 2.6 5.2 7.4
2-log reduction in totalCFU/ml
2.4 3.4 6.7 9.6
3-log reduction in totalCFU/ml
3.2 4.6 8.8 12.6
Suppression ofresistance
2.4 3.4 7.3 10.4
HighBacterial stasis (total
bacteria)3.2 4.6 8.3 11.9
a Protein binding is assumed to be 30% (31).
FIG 8 Results of the Monte Carlo simulation with the probability of target attainments against a range of MICs for the following regimens: 4 g piperacillinadministered intravenously (i.v.) for either 30 min or 4 h every 8 h as well as for 30 min or 3 h every 6 h.
Piperacillin in a Hollow-Fiber Infection Model
December 2013 Volume 57 Number 12 aac.asm.org 5817
on April 4, 2019 by guest
http://aac.asm.org/
Dow
nloaded from

of critically ill patients, suggesting that considerable dosage esca-lation may be required to achieve adequate drug exposure.
A limitation of the HFIM is the lack of immune-mediated bac-terial killing. Nevertheless, the absence of immune function per-mits the direct estimation of the extent of antimicrobial activitythat can be attributed to a drug. The pharmacodynamic targetsidentified in the HFIM may be different if immune-mediated bac-terial killing is also present. This provides a safety margin when theresults are extrapolated to humans by delineating a “worst-casescenario.” Additionally, the results from the HFIM may be appliedto immunocompromised patients. The pharmacodynamic targetsidentified with the HFIM require validation with additionalstrains of Pseudomonas with different MICs and/or mechanismsof antimicrobial resistance.
In summary, this study suggests the following: (i) bolus regi-mens are equivalent to intermittent infusion in terms of the anti-bacterial effect and the emergence of drug resistance, and (ii) bac-terial burden has a significant influence on the ultimate outcomeof antibacterial therapy. Patients with low bacterial burdens (e.g.,�104 CFU/ml) of Pseudomonas aeruginosa may potentially betreated with monotherapy, with little chance of driving resistance.This will minimize the potential adverse events associated withcombination chemotherapy, such as nephrotoxicity from amin-oglycosides. In contrast, patients with a higher bacterial densitymay require additional adjunctive therapies, such as combinationchemotherapy, to prevent the emergence of antimicrobial resis-tance. The impact on bacterial density on emergence of antimi-crobial resistance in other bacterial species warrants further invitro investigation. Future clinical management of patients withHAP and VAP may require patients to be stratified according tothe antimicrobial resistance pattern of the bacterial species andpathogen density in order to select the optimal individual regi-men.
ACKNOWLEDGMENTS
T. W. Felton is an MRC Clinical Training Fellow supported by the NorthWest England Medical Research Council Fellowship Scheme in ClinicalPharmacology and Therapeutics, which is funded by the Medical Re-search Council (grant number G1000417/94909), ICON, GlaxoSmith-Kline, AstraZeneca, and the Medical Evaluation Unit. W. W. Hope issupported by a National Institute of Health Research (NIHR) ClinicianScientist Fellowship. M. N. Neely is supported by NIH grants R01GM068968 and R01 HD070996.
REFERENCES1. Garnacho-Montero J, Sa-Borges M, Sole-Violan J, Barcenilla F, Escor-
esca-Ortega A, Ochoa M, Cayuela A, Rello J. 2007. Optimal manage-ment therapy for Pseudomonas aeruginosa ventilator-associated pneu-monia: an observational, multicenter study comparing monotherapy withcombination antibiotic therapy. Crit. Care Med. 35:1888 –1895.
2. Fujitani S, Sun H-Y, Yu VL, Weingarten JA. 2011. Pneumonia due toPseudomonas aeruginosa. Part I: epidemiology, clinical diagnosis, andsource. Chest 139:909 –919.
3. Réa-Neto A, Niederman MS, Lobo SM, Schroeder E, Lee M, Kaniga K,Ketter N, Prokocimer P, Friedland I. 2008. Efficacy and safety of dorip-enem versus piperacillin/tazobactam in nosocomial pneumonia: a ran-domized, open-label, multicenter study. Curr. Med. Res. Opin. 24:2113–2126.
4. Fink MP, Snydman DR, Niederman MS, Leeper KV, Johnson RH,Heard SO, Wunderink RG, Caldwell JW, Schentag JJ, Siami GA. 1994.Treatment of severe pneumonia in hospitalized patients: results of a mul-ticenter, randomized, double-blind trial comparing intravenous cipro-floxacin with imipenem-cilastatin. The Severe Pneumonia Study Group.Antimicrob. Agents Chemother. 38:547–557.
5. Depuydt PO, Vandijck DM, Bekaert Ma, Decruyenaere JM, Blot SI,Vogelaers DP, Benoit DD. 2008. Determinants and impact of multidrugantibiotic resistance in pathogens causing ventilator-associated-pneumonia. Crit. Care 12:R142. doi:10.1186/cc7119.
6. Drusano GL. 2004. Antimicrobial pharmacodynamics: critical interac-tions of “bug and drug.” Nat. Rev. Microbiol. 2:289 –300.
7. Ambrose PG, Bhavnani SM, Rubino CM, Louie A, Gumbo T, Forrest A,Drusano GL. 2007. Pharmacokinetics-pharmacodynamics of antimicro-bial therapy: it’s not just for mice anymore. Clin. Infect. Dis. 44:79 – 86.
8. Dulhunty JM, Roberts JA, Davis JS, Webb SAR, Bellomo R, GomersallC, Shirwadkar C, Eastwood GM, Myburgh J, Paterson DL, Lipman J.2013. Continuous infusion of beta-lactam antibiotics in severe sepsis: amulticenter double-blind, randomized controlled trial. Clin. Infect. Dis.56:236 –244.
9. Roberts JA, Kirkpatrick CM, Roberts MS, Robertson TA, Dalley AJ,Lipman J. 2009. Meropenem dosing in critically ill patients with sepsisand without renal dysfunction: intermittent bolus versus continuous ad-ministration? Monte Carlo dosing simulations and subcutaneous tissuedistribution. J. Antimicrob. Chemother. 64:142–150.
10. Alou L, Aguilar L, Sevillano D, Giménez M-J, Echeverría O, Gómez-LusM-L, Prieto J. 2005. Is there a pharmacodynamic need for the use ofcontinuous versus intermittent infusion with ceftazidime against Pseu-domonas aeruginosa? An in vitro pharmacodynamic model. J. Antimi-crob. Chemother. 55:209 –213.
11. Mouton JW, den Hollander JG. 1994. Killing of Pseudomonas aerugi-nosa during continuous and intermittent infusion of ceftazidime in an invitro pharmacokinetic model. Antimicrob. Agents Chemother. 38:931–936.
12. Kim A, Banevicius MA, Nicolau DP. 2008. In vivo pharmacodynamicprofiling of doripenem against Pseudomonas aeruginosa by simulatinghuman exposures. Antimicrob. Agents Chemother. 52:2497–2502.
13. Felton TW, Hope WW, Lomaestro BM, Butterfield JM, Kwa AL, Dru-sano GL, Lodise TP, Jr. 2012. Population pharmacokinetics of extended-infusion piperacillin-tazobactam in hospitalized patients with nosocomialinfections. Antimicrob. Agents Chemother. 56:4087– 4094.
14. Falagas ME, Tansarli GS, Ikawa K, Vardakas KZ. 2013. Clinical out-comes with extended or continuous versus short-term intravenous infu-sion of carbapenems and piperacillin/tazobactam: a systematic review andmeta-analysis. Clin. Infect. Dis. 56:272–282.
15. Lodise TP Jr, Lomaestro BM, Drusano GL. 2007. Piperacillin-tazobactam for Pseudomonas aeruginosa infection: clinical implicationsof an extended-infusion dosing strategy. Clin. Infect. Dis. 44:357–363.
16. Tam VH, Schilling A, Neshat S. 2005. Optimization of meropenemminimum concentration/MIC ratio to suppress in vitro resistance ofPseudomonas aeruginosa. Antimicrob. Agents Chemother. 49:4920 –4927.
17. Tam VH, Louie A, Deziel MR, Liu W, Drusano GL. 2007. The relation-ship between quinolone exposures and resistance amplification is charac-terized by an inverted U: a new paradigm for optimizing pharmacody-namics to counterselect resistance. Antimicrob. Agents Chemother. 51:744 –747.
18. CLSI. 2009. Methods for dilution antimicrobial susceptibility tests forbacteria that grow aerobically. Approved standard— eighth ed. CLSI doc-ument M07-A8. CLSI, Wayne, PA.
19. Di Giovamberardino G, Ferrannini M, Testore GP, Federici G, PastoreA. 2009. High performance liquid chromatographic determination ofplasma free and total tazobactam and piperacillin. J. Chromatogr. B Anal.Technol. Biomed. Life Sci. 877:86 – 88.
20. Tam VH, Louie A, Deziel MR, Liu W, Leary R, Drusano GL. 2005.Bacterial-population responses to drug-selective pressure: examination ofgarenoxacin’s effect on Pseudomonas aeruginosa. J. Infect. Dis. 192:420 –428.
21. Zedtwitz-Liebenstein K, Schenk P, Apfalter P, Fuhrmann V, Stoiser B,Graninger W, Schuster E, Frass M, Burgmann H. 2005. Ventilator-associated pneumonia: increased bacterial counts in bronchoalveolar la-vage by using urea as an endogenous marker of dilution. Crit. Care Med.33:756 –759.
22. Drusano GL, Liu W, Fregeau C, Kulawy R, Louie A. 2009. Differingeffects of combination chemotherapy with meropenem and tobramycinon cell kill and suppression of resistance of wild-type Pseudomonasaeruginosa PAO1 and its isogenic MexAB efflux pump-overexpressedmutant. Antimicrob. Agents Chemother. 53:2266 –2273.
Felton et al.
5818 aac.asm.org Antimicrobial Agents and Chemotherapy
on April 4, 2019 by guest
http://aac.asm.org/
Dow
nloaded from
23. American Thoracic Society, Infectious Diseases Society of America.2005. Guidelines for the management of adults with hospital-acquired,ventilator-associated, and healthcare-associated pneumonia. Am. J. Re-spir. Crit. Care Med. 171:388 – 416.
24. Gerbeaux P, Ledoray V, Boussuges A, Molenat F, Jean P, Sainty JM.1998. Diagnosis of nosocomial pneumonia in mechanically ventilated pa-tients: repeatability of the bronchoalveolar lavage. Am. J. Respir. Crit. CareMed. 157:76 – 80.
25. Neely MN, van Guilder MG, Yamada WM, Schumitzky A, Jelliffe RW.2012. Accurate detection of outliers and subpopulations with Pmetrics, anonparametric and parametric pharmacometric modeling and simula-tion package for R. Ther. Drug Monit. 34:467– 476.
26. The R Development Core Team. 2011. R: a language and environmentfor statistical computing. U.S. patent 2.13.1. R Foundation for StatisticalComputing, Vienna, Austria.
27. Gumbo T, Louie A, Deziel MR, Parsons LM, Salfinger M, Drusano GL.2004. Selection of a moxifloxacin dose that suppresses drug resistance inMycobacterium tuberculosis, by use of an in vitro pharmacodynamic in-fection model and mathematical modeling. J. Infect. Dis. 190:1642–1651.
28. D’Argenio DZ, Schumitzky A, Xiaoning W. 2009. ADAPT 5 user’s guide:pharmacokinetic/pharmacodynamic systems analysis software. Biomedi-cal Simulations Resource, Los Angeles, CA.
29. Warn PA, Sharp A, Parmar A, Majithiya J, Denning DW, Hope WW.2009. Pharmacokinetics and pharmacodynamics of a novel triazole, isa-vuconazole: mathematical modeling, importance of tissue concentra-tions, and impact of immune status on antifungal effect. Antimicrob.Agents Chemother. 53:3453–3461.
30. Drusano GL, Bonomo RA, Bahniuk N, Bulitta JB, Vanscoy B, Defiglio
H, Fikes S, Brown D, Drawz SM, Kulawy R, Louie A. 2012. Resistanceemergence mechanism and mechanism of resistance suppression by to-bramycin for cefepime for Pseudomonas aeruginosa. Antimicrob. AgentsChemother. 56:231–242.
31. Roberts JA, Roberts MS, Robertson Ta, Dalley AJ, Lipman J. 2009.Piperacillin penetration into tissue of critically ill patients with sepsis—bolus versus continuous administration? Crit. Care Med. 37:926 –933.
32. Masterton RG, Galloway A, French G, Street M, Armstrong J, Brown E,Cleverley J, Dilworth P, Fry C, Gascoigne AD, Knox A, Nathwani D,Spencer R, Wilcox M. 2008. Guidelines for the management of hospital-acquired pneumonia in the UK: report of the working party on hospital-acquired pneumonia of the British Society for Antimicrobial Chemother-apy. J. Antimicrob. Chemother. 62:5–34.
33. Pirali F, Longo M, Gelmi M, Colombrita D, Ravizzola G, Pinsi G,Peroni L, Manca N, Turano A. 1994. Diagnosis of bronchopulmonaryinfections by quantification of microflora. Eur. J. Epidemiol. 10:703–706.
34. Louie A, Grasso C, Bahniuk N, Van Scoy B, Brown DL, Kulawy RW,Drusano GL. 2010. The combination of meropenem and levofloxacin issynergistic with respect to both Pseudomonas aeruginosa kill rate andresistance suppression. Antimicrob. Agents Chemother. 54:2646 –2654.
35. Bergen PJ, Forrest A, Bulitta JB, Tsuji BT, Sidjabat HE, Paterson DL, LiJ, Nation RL. 2011. Clinically relevant plasma concentrations of colistinin combination with imipenem enhance pharmacodynamic activityagainst multidrug-resistant Pseudomonas aeruginosa at multiple inocula.Antimicrob. Agents Chemother. 55:5134 –5142.
36. Roberts JA, Hope WW, Lipman J. 2010. Therapeutic drug monitoring ofbeta-lactams for critically ill patients: unwarranted or essential? Int. J.Antimicrob. Agents 35:419 – 420.
Piperacillin in a Hollow-Fiber Infection Model
December 2013 Volume 57 Number 12 aac.asm.org 5819
on April 4, 2019 by guest
http://aac.asm.org/
Dow
nloaded from