Embed Size (px)
Citation preview
. . . Published ahead of Print
Medicine & Science in Sports & Exercise® Published ahead of Print contains articles in unedited manuscript form that have been peer reviewed and accepted for publication. This manuscript will undergo copyediting, page composition, and review of the resulting proof before it is published in its final form. Please note that during the production process errors may be discovered that could affect the content.
Copyright © 2017 American College of Sports Medicine
Impact of Blood Flow Restriction Exercise on Muscle Fatigue
Development and Recovery
Florian Husmann
1, Thomas Mittlmeier
2, Sven Bruhn
1, Volker Zschorlich
1, and Martin Behrens
1
1Institute of Sport Science, University of Rostock, Rostock, Germany;
2Department of
Traumatology, Hand and Reconstructive Surgery, University Medicine Rostock, Rostock, Germany
Accepted for Publication: 23 October 2017
ACCEPTED
Impact of Blood Flow Restriction Exercise on Muscle Fatigue Development
and Recovery
Florian Husmann1, Thomas Mittlmeier
2, Sven Bruhn
1, Volker Zschorlich
1, and Martin Behrens
1
1Institute of Sport Science, University of Rostock, Rostock, Germany;
2Department of
Traumatology, Hand and Reconstructive Surgery, University Medicine Rostock, Rostock,
Germany
Corresponding author:
Florian Husmann
Institute of Sport Science
University of Rostock
Ulmenstrasse 69
18057 Rostock, Germany
phone: +49 381 4982744
fax: +49 381 4949308
e-mail: [email protected]
ACCEPTED
Medicine & Science in Sports & Exercise, Publish Ahead of Print
DOI: 0.1249/MSS.0000000000001475
Copyright © 2017 by the American College of Sports Medicine. Unauthorized reproduction of this article is prohibited.

The authors did not receive any funding to carry out the present study. No conflicts of interest
are directly relevant to this article. The present results do not constitute endorsement by the
American College of Sports Medicine. The results of the present study are presented clearly,
honestly, and without fabrication, falsification, or inappropriate data manipulation.
ACCEPTED
Copyright © 2017 by the American College of Sports Medicine. Unauthorized reproduction of this article is prohibited.
Abstract
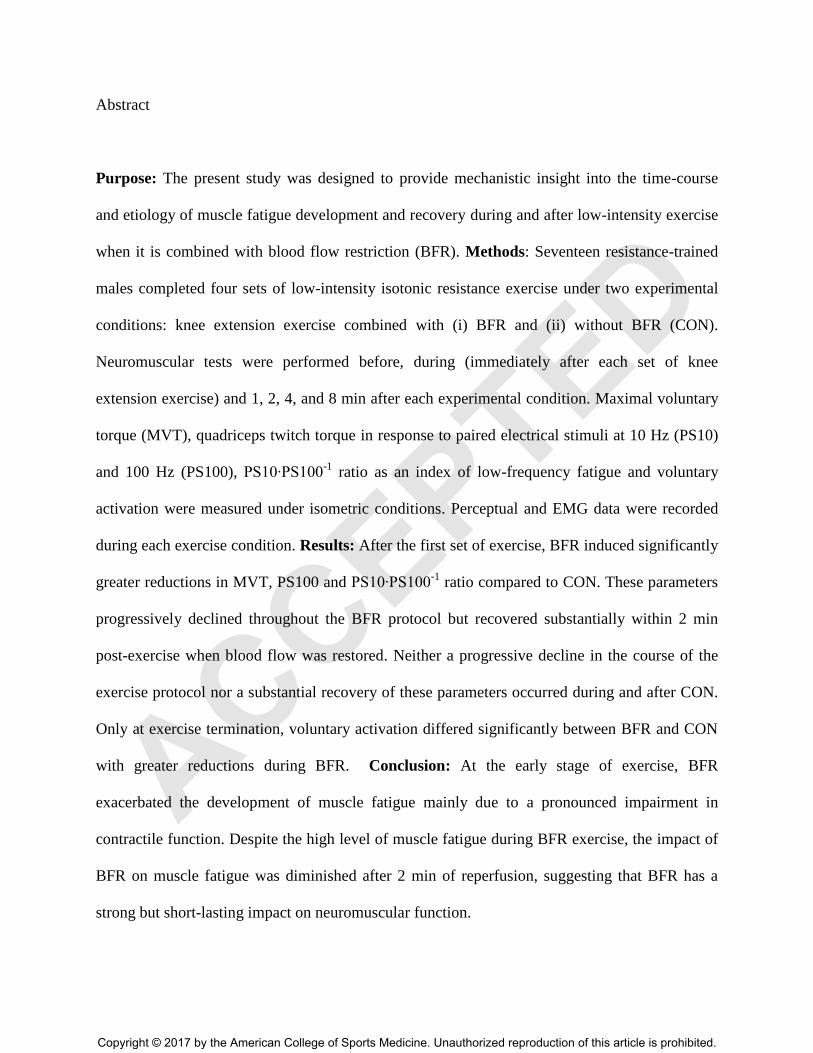
Purpose: The present study was designed to provide mechanistic insight into the time-course
and etiology of muscle fatigue development and recovery during and after low-intensity exercise
when it is combined with blood flow restriction (BFR). Methods: Seventeen resistance-trained
males completed four sets of low-intensity isotonic resistance exercise under two experimental
conditions: knee extension exercise combined with (i) BFR and (ii) without BFR (CON).
Neuromuscular tests were performed before, during (immediately after each set of knee
extension exercise) and 1, 2, 4, and 8 min after each experimental condition. Maximal voluntary
torque (MVT), quadriceps twitch torque in response to paired electrical stimuli at 10 Hz (PS10)
and 100 Hz (PS100), PS10∙PS100-1
ratio as an index of low-frequency fatigue and voluntary
activation were measured under isometric conditions. Perceptual and EMG data were recorded
during each exercise condition. Results: After the first set of exercise, BFR induced significantly
greater reductions in MVT, PS100 and PS10∙PS100-1
ratio compared to CON. These parameters
progressively declined throughout the BFR protocol but recovered substantially within 2 min
post-exercise when blood flow was restored. Neither a progressive decline in the course of the
exercise protocol nor a substantial recovery of these parameters occurred during and after CON.
Only at exercise termination, voluntary activation differed significantly between BFR and CON
with greater reductions during BFR. Conclusion: At the early stage of exercise, BFR
exacerbated the development of muscle fatigue mainly due to a pronounced impairment in
contractile function. Despite the high level of muscle fatigue during BFR exercise, the impact of
BFR on muscle fatigue was diminished after 2 min of reperfusion, suggesting that BFR has a
strong but short-lasting impact on neuromuscular function.
ACCEPTED
Copyright © 2017 by the American College of Sports Medicine. Unauthorized reproduction of this article is prohibited.
Key Words: CENTRAL FATIGUE, HYPOXIA, METABOLIC STRESS, PERIPHERAL
FATIGUE, QUADRICEPS MUSCLE; VASCULAR OCCLUSION.
ACCEPTED
Copyright © 2017 by the American College of Sports Medicine. Unauthorized reproduction of this article is prohibited.
Introduction
It has been traditionally suggested that muscle growth can only be achieved with high-intensity
resistance exercise (70-80% one repetition maximum (1RM)) whereas no significant
hypertrophic effects were expected after low-intensity exercise. Mechanical stress was therefore
considered as the essential stimulus for muscle hypertrophy (1). However, when low-intensity
resistance exercise (20-30% 1RM) was combined with blood flow restriction (BFR), similar
gains in muscle mass were observed (2). BFR is utilized to limit intramuscular oxygen delivery
and to prevent venous clearance of metabolites that, in turn, lead to increased metabolic stress
(i.e. depletion of phosphocreatine (PCr), increased accumulation of inorganic phosphate (Pi),
protons and lactate). Even without heavy loads, metabolic stress is thought to trigger certain
mechanisms (i.e. systemic hormone production, increased fast-twitch fiber recruitment, cell
swelling) which potentially mediate muscle growth (for a review see (3)).
Besides the effect of metabolic stress as an obvious key stimulator for hypertrophic adaptations,
disturbances in the intra- and extracellular environment induced by BFR exercise are strongly
associated with a reduction in maximal voluntary force production (i.e. (4, 5)). The impaired
force or power-generating capacity of a muscle or muscle group is indicative of muscle fatigue
which stems from a decrease in neural activation of the muscle (i.e. commonly termed „central
fatigue‟) and/or alterations at or distal to the neuromuscular junction that result in contractile
dysfunction (commonly termed „peripheral fatigue‟) (6). Muscle fatigue is typically considered
to be task dependent (i.e. exercise intensity, duration, contraction mode, active muscle mass) and
particularly affected by local and systemic hypoxia (7, 8). As might be expected, initial findings
by Karabulut et al. (9) have demonstrated that BFR exacerbates the end-exercise level of muscle
ACCEPTED
Copyright © 2017 by the American College of Sports Medicine. Unauthorized reproduction of this article is prohibited.
fatigue after work-matched low-intensity exercise. In detail, higher contributions of peripheral
and central factors were responsible for the pronounced muscle fatigue as indicated by
reductions in voluntary activation (−13%) and contractile twitch torque (−44%) after BFR
exercise compared to the free blood flow condition (+4%, −19%, respectively).
Previous work investigating the impact of BFR on neuromuscular function is currently limited to
pre- and post-exercise measurements (i.e. (4, 9)). Considering the fact that the development and
recovery of muscle fatigue heavily rely on the characteristics of the task (6, 10), it is still unclear
how the central and the peripheral sites of the neuromuscular system respond in the course of
BFR exercise and how these sites acutely recover from such strong impairments. From a
practical point of view, knowledge about the recovery process after low-intensity BFR exercise
is crucial to understand the exercise-adaptation cycle in order to determine the optimal balance
between training and recovery. Therefore, the present study was designed to provide mechanistic
insight into the time-course of changes in neuromuscular function during and after exercise
under conditions of limited blood flow. By using various electrical stimulation methods at short
time-intervals during and after each exercise condition, we were able to investigate the impact of
low-intensity exercise with BFR on central and peripheral aspects of muscle fatigue development
and recovery.
Methods
Subjects.
Seventeen healthy males volunteered to participate in this study. A sample comprising
exclusively male subjects was chosen based on the common finding that the level of muscle
ACCEPTED
Copyright © 2017 by the American College of Sports Medicine. Unauthorized reproduction of this article is prohibited.
fatigue differs between sexes (for a review see (11)). All subjects were physically active
(training > 4 times per week) and regularly engaged in a total body resistance training program
for at least two times per week. Descriptive data of the subject characteristics are presented in
Table 1. Participants were excluded if they were hypertensive (< 140/90 mmHg) or had more
than one risk factor for thromboembolism (12). Subjects were asked to refrain from vigorous
exercise, analgesics, caffeine and alcohol consumption for 24 h prior to the investigations. The
study was approved by the university ethics committee and was conducted according to the
declaration of Helsinki. All subjects were informed about possible risks and discomfort
associated with the investigations prior to giving their written consent to participate.
Experimental procedure.
All subjects visited the laboratory on three different occasions. During the first visit, subjects‟
knee extension 1RM and arterial occlusion pressure were determined. Furthermore, subjects
were thoroughly familiarized with the following procedures: (i) ratings of perceived exertion
(RPE) and leg muscle pain; (ii) neuromuscular testing procedures comprising maximal voluntary
contractions (MVC) and peripheral nerve stimulation; (iii) metronome pacing of knee extension
exercise; and (iv) two submaximal sets (2 sets of 10 repetitions at 30% 1RM) of knee extension
exercise under BFR at 60% arterial occlusion pressure. Furthermore, subjects‟ knee extension
1RM and arterial occlusion pressure were determined within the first session. Using a
randomized, counterbalanced, within-subjects design, participants underwent two experimental
conditions across two separate visits: four sets (30, 15, 15, 15 repetitions; total exercise time: 315
s) of low-intensity knee extensions combined (i) with BFR and (ii) without BFR (CON). Testing
sessions were separated by 7 ± 1 days and took place at the same time of the day. Based on the
ACCEPTED
Copyright © 2017 by the American College of Sports Medicine. Unauthorized reproduction of this article is prohibited.

protocol previously used by Froyd et al. (13), neuromuscular tests were performed before, during
(immediately after each set of knee extension exercise) and 1, 2, 4, and 8 min after each
experimental condition (Fig. 1). Furthermore, RPE and leg muscle pain were assessed after each
set. EMG data were continuously recorded during each experimental trial.
Upon arrival at the laboratory, subjects‟ blood pressure and arterial occlusion pressure were
determined. Prior to baseline measurements, subjects performed an initial warm-up on a
stationary bicycle (5 min; 120 W; 90 rpm) followed by a specific warm-up on the dynamometer
comprising two isometric contractions for 5 s at 50, 70 and 90% of maximal voluntary torque
(MVT; determined during the familiarization session), respectively. Neuromuscular tests
comprised supramaximal electrical stimulations of the femoral nerve during and after an
isometric MVC (Fig. 1B-C). All measurements were conducted on the quadriceps muscle of the
dominant leg (i.e. kicking preference). During knee extension exercise and neuromuscular
testing, subjects were comfortably seated and secured on a CYBEX NORM dynamometer
(Computer Sports Medicine®, Inc., Stoughton, MA, USA). The seating position was adjusted for
each subject, and settings were documented for the subsequent sessions.
Determination of arterial occlusion pressure.
Arterial occlusion pressure was determined in a lying position using a hand-held bidirectional
Doppler probe (Hadeco Bidop ES-100V3, Kawasaki, Japan) which was placed over the posterior
tibial artery. Pressure was automatically adjusted using a cuff inflator system (HeidiTM
, Ulrich
Medical, Ulm, Germany). A 10 × 76 cm pneumatic cuff (Ulrich Medical, Ulm, Germany) affixed
to the most proximal part of the right thigh was incrementally inflated until the pulse of the tibial
ACCEPTED
Copyright © 2017 by the American College of Sports Medicine. Unauthorized reproduction of this article is prohibited.
artery was interrupted. The inflation procedure was performed as described in detail by
Loenneke et al. (14). Arterial occlusion pressure was determined within the familiarization
session and again at baseline of each experimental condition in order to evaluate its
reproducibility.
One repetition maximum.
Subjects‟ unilateral knee extension 1RM was determined using the isotonic mode of a CYBEX
NORM dynamometer (Computer Sports Medicine®, Inc., Stoughton, MA, USA). 1RM was
defined as the heaviest load that can be lifted through a controlled, full range of motion. Prior to
isotonic testing, subjects performed an initial warm-up on a stationary bicycle (5 min, 120 W, 90
rpm). A second warm-up comprised six isotonic knee extensions with a submaximal load and
two further contractions with a higher load. During the actual testing procedure, the load was
progressively increased until 1RM was determined. Between each attempt, subjects rested for 90
s. All 1RM were determined within five attempts.
Torque recordings.
A CYBEX NORM dynamometer (Computer Sports Medicine®, Inc., Stoughton, MA, USA) was
used to record instantaneous torques. Subjects were positioned on an adjustable chair with the
hip fixed at 80° (0° = full extension). To avoid excessive movements during data recording,
straps were fixed tightly across the subjects‟ waist and chest. The dynamometer rotation axis was
aligned with the knee joint rotation axis and the lever arm was attached to the lower leg just
above the lateral malleolus. Isometric MVC were performed at 90° knee flexion (0° = full
extension). For each trial, subjects were instructed to cross their arms in front of their chest and
ACCEPTED
Copyright © 2017 by the American College of Sports Medicine. Unauthorized reproduction of this article is prohibited.
to push as hard and as fast as possible against the lever arm of the dynamometer. Strong verbal
encouragement was given by the investigator. Visual feedback of the torque-time curve was
provided on a digital oscilloscope (HM1508, HAMEG Instruments, Mainhausen, Germany).
EMG recordings.
A detailed description of the EMG recordings can be found in a previously published study from
our laboratory (15). Briefly, myoelectrical signals from the vastus medialis (VM), rectus femoris
(RF) and vastus lateralis (VL) were recorded using surface electrodes (EMG Ambu Blue Sensor
N). EMG signals were amplified (2500 ×), band-pass filtered (10-450 Hz) and digitized with a
sampling frequency of 3 kHz using an analog-to-digital converter (NI PCI-6229, National
Instruments, Austin, USA).
Electrical nerve stimulation.
In order to assess the neuromuscular function of the quadriceps muscle, the femoral nerve was
stimulated percutaneously using electrical stimulation. A constant-current stimulator (Digitimer
DS7A, Herfordshire, UK) was used to deliver square-wave pulses of 1 ms duration with maximal
voltage of 400 V. A ball probe cathode (10 mm diameter) was pressed in the femoral triangle
always by the same investigator. The anode, a self-adhesive electrode (35 × 45 mm, Spes
Medica, Genova, Italy), was affixed over the greater trochanter. After determining the optimal
site for stimulation, the position was marked onto the subjects‟ skin to ensure repeatable
measurements within each session. Individual stimulation intensity was progressively increased
until the maximum compound muscle action potential (Mmax) of VM, RF and VL as well as a
plateau in knee extensor twitch torque was achieved. During the subsequent testing procedures,
ACCEPTED
Copyright © 2017 by the American College of Sports Medicine. Unauthorized reproduction of this article is prohibited.
the stimulation intensity was increased by additional 40% to guarantee supramaximal stimulation
(~ 50 mA). Potentiated quadriceps twitch torque evoked by paired electrical stimuli at 100 Hz
(PS100), 10 Hz (PS10) and single stimuli (SS) were elicited 2, 4 and 6 s after MVC,
respectively. As recommended previously (16), quadriceps twitch torque in response to PS100
was used to characterize changes in contractile function. To determine the level of voluntary
activation during isometric MVC, the interpolated twitch technique was applied (17). Electrical
paired stimuli were delivered to the femoral nerve at 90° knee flexion 2 s after torque onset
(during the plateau phase) and 2 s after MVC.
Exercise protocol.
The exercise protocol comprised 30 repetitions of unilateral isotonic knee extensions followed by
three sets of 15 repetitions at 30% of 1RM. Each set was separated by 30 s of rest. This protocol
was chosen because it is typically used for research purposes and practical applications in the
context of BFR (2). A metronome set at 40 bpm was used to ensure a cadence of 1.5 s for
concentric and 1.5 s for eccentric muscle actions. During the BFR condition, a pneumatic cuff
applied to the subjects‟ thigh was inflated prior to the first set of exercise and deflated
immediately after termination of the fourth set. The target pressure was set at 60% arterial
occlusion pressure.
Ratings of perceived exertion and leg muscle pain.
During the first session at the laboratory, subjects were thoroughly familiarized with RPE and
ratings of leg muscle pain. Subjects‟ perception of effort was assessed by using the 15-point
Borg scale. Prior to each testing session, participants received written instructions based on
ACCEPTED
Copyright © 2017 by the American College of Sports Medicine. Unauthorized reproduction of this article is prohibited.
guidelines recently proposed by Pageaux (18). Briefly, instructions included the definition of
effort, exercise-specific descriptions (“How hard is it for you to drive your leg?”), exercise-
anchoring (i.e. “maximal exertion corresponds to the effort you experienced while you were
performing a maximal voluntary contraction”) and the distinction of effort, pain and other
exercise-related sensations (18). Leg muscle pain was recorded using a modified category-ratio
10 (CR-10) scale as proposed by Cook et al. (19). RPE and CR-10 ratings were taken
immediately after each set of knee extension exercise.
Data analyses.
Peak twitch torques (i.e. highest values of the torque-time curve) were determined for SS, PS10
and PS100, respectively. The PS10·PS100–1
torque ratio was calculated as an index of low-
frequency fatigue (20). Isometric MVT was defined as the highest torque value before the
superimposed twitch. Mmax amplitudes elicited by SS were measured peak-to-peak. Muscle
activity during exercise was estimated by calculating the root mean square of the EMG signal
(RMS-EMG) averaged for the first three and the last three repetitions of each set, respectively
(21). Only EMG data during the concentric phase of each repetition were taken into account for
analysis. RMS-EMG of VM, RF and VL were normalized to the corresponding Mmax values
(RMS·M–1
). The level of voluntary activation was calculated using a corrected formula: [1 –
superimposed twitch (Tb × MVT –1
) × control twitch–1
] × 100 (22). MVT is the maximal torque
level and Tb the torque value immediately before the superimposed twitch. The corrected formula
is used to avoid the potential problem that the superimposed stimuli are not applied during the
maximum torque level. Our group has recently shown that voluntary activation of the knee
extensors can be reliably assessed during isometric contractions using the corrected formula (23).
ACCEPTED
Copyright © 2017 by the American College of Sports Medicine. Unauthorized reproduction of this article is prohibited.
Statistical analysis.
All data were screened for normal distribution using the Shapiro-Wilk test. Two-way ANOVA
with repeated measures on time and condition were conducted for all neuromuscular parameters.
Post-hoc tests for all time and condition comparisons were performed with Bonferroni
adjustments. The effect size was determined by calculating partial eta squared (ηp²). Differences
in RPE and leg muscle pain (CR-10) across the experimental conditions were tested using
Friedman‟s tests. Post-hoc analyses with Wilcoxon signed-rank tests were conducted with a
Bonferroni correction applied, resulting in a significance level of P ≤ 0.0125. Absolute and
relative intersession reliability of arterial occlusion pressure was computed using an Excel
spreadsheet (24). Absolute reliability was determined by computing the coefficient of variation
(CV). Relative reliability was determined by calculating the intraclass correlation coefficient
(ICC, low: < 0.80, moderate: 0.80 – 0.90, high: >0.90) (25). Data were analyzed using the SPSS
statistical package 22.0 (SPSS Inc., Chicago, IL, USA) and statistical significance was accepted
at P ≤ 0.050.
Results
All participants successfully completed both exercise protocols at the required cadence.
Intersession reliability of arterial occlusion pressure.
Arterial occlusion pressure of the thigh was reliably assessed as indicated by an acceptable
absolute (CV = 5.5%) and a moderate relative intersession reliability (ICC = 0.80).
ACCEPTED
Copyright © 2017 by the American College of Sports Medicine. Unauthorized reproduction of this article is prohibited.
Maximal voluntary torque.
A significant time × condition interaction was found for MVT (F8,16 = 12.47, P < 0.001, ηp² =
0.44). Already after the first set of exercise there was a significant group difference between
BFR and CON (P = 0.048). This difference persisted up to and including the first min of
recovery (all P < 0.010). A consistently greater MVT reduction was observed during BFR (Fig.
2A). For both conditions, MVT differed significantly from baseline values until the eighth min of
recovery (all P < 0.050; Table 2). Immediately after exercise termination (= Set 4), there was a
significantly greater decrease in MVT for BFR (−44.5 ± 14.1%) compared to CON (−24.3 ±
11.8%; P < 0.001). For the BFR condition, MVT progressively declined throughout the exercise
protocol, recovered progressively within 4 min after exercise termination but remained depressed
by 13.4 ± 10.3% after 8 min of rest. During CON, there was a significant decrease in MVT after
the first set of exercise but no further decline throughout the exercise protocol. After exercise
termination, MVT values gradually recovered within 4 min post-exercise but remained depressed
compared to pre-exercise values after 8 min of rest. Absolute values and the percentage MVT
changes during BFR and CON are shown in Table 2 and Fig. 2A.
Electrically evoked twitch torque.
There were significant time × condition interactions for PS100 (F8,16 = 23.48, P < 0.001, ηp² =
0.60), SS (F8,16 = 26.54, P < 0.001, ηp² = 0.62) and PS10·PS100-1
ratio (F8,16 = 9.08, P < 0.001,
ηp² = 0.39). After the first set of exercise, there were significant group differences for PS100, SS
and PS10·PS100-1
ratio between BFR and CON (all P < 0.001; Fig. 2B-D). Group differences for
SS and PS10·PS100-1
ratio persisted during the entire recovery period (all P < 0.050; Fig. 2C-D).
For PS100, group differences were still present up to and including 4 min post-exercise (P <
ACCEPTED
Copyright © 2017 by the American College of Sports Medicine. Unauthorized reproduction of this article is prohibited.
0.046). At exercise termination, significantly greater reductions in PS100, SS and PS10·PS100-1
ratio were found for BFR (−40.4 ± 16.9%, −58.2 ± 19.6%, −38.0 ± 13.1%, respectively)
compared to CON (−20.9 ± 17.6%, −34.6 ± 22.1%, −21.4 ± 13.4%, respectively). For each
stimulation method, twitch torques progressively declined throughout the BFR condition and
recovered substantially within the first 2 min after exercise termination (Fig. 2B-D). Exercise-
induced reductions in PS100 and SS persisted over the entire recovery period (all P < 0.050;
Table 2). However, PS10·PS100-1
ratio progressively decreased from 2 to 8 min of recovery (Fig.
2D).
Electrically evoked potentials.
No significant time × condition interactions were found for VM (F8,16 = 1.32, P = 0.241, ηp² =
0.08), RF (F8,16 = 0.30, P = 0.964, ηp² = 0.02) and VL Mmax amplitude (F8,16 = 0.9, P = 0.486, ηp²
= 0.06), respectively. Absolute values for Mmax at each time point and condition are shown in
Table 2.
Voluntary activation.
A significant time × condition interaction was observed for voluntary activation (F8,16 = 3.30, P
= 0.002, ηp² = 0.17). Significant group differences between BFR and CON were found after
exercise termination (P = 0.018) with a greater reduction in voluntary activation for BFR (−10.2
± 12.3%) compared to CON (−3.2 ± 5.5%; Fig. 2E). From the first to the eighth min of recovery,
voluntary activation for BFR and CON remained significantly reduced compared to baseline
values (all P < 0.050; Table 2). Absolute values and percentage changes in voluntary activation
during BFR and CON are presented in Table 2 and Fig. 2E.
ACCEPTED
Copyright © 2017 by the American College of Sports Medicine. Unauthorized reproduction of this article is prohibited.
EMG recordings during exercise.
There were significant time × condition interactions for VM RMS·M-1
(F7,16 = 14.38, P < 0.001,
ηp² = 0.47) and VL RMS·M-1
during exercise (F7,16 = 6.71, P < 0.001, ηp² = 0.30). No significant
time × condition interaction was found for RF RMS·M-1
(F7,16 = 1.93, P = 0.071, ηp² = 0.30).
Regardless of the experimental condition, normalized muscle activity of VM and VL
progressively increased during each exercise set (all P < 0.01; Fig. 3A and 3C). For normalized
VM muscle activity, significant group differences between BFR and CON were evident for the
last three repetitions of the first exercise set (P = 0.015), thereafter significant differences could
be documented for all time points with a consistently higher activation during BFR (P < 0.001;
Fig. 3A). Significant group differences for normalized VL muscle activity were evident for the
last repetitions of the second set (P = 0.003). In the following, significant differences between
BFR and CON could be found for all time points with a higher activation during BFR (all P <
0.010; Fig. 3C).
Perception of effort and leg muscle pain.
There were significant changes in RPE over time for BFR (χ2
(3) = 33.28, P < 0.001) and CON
(χ2
(3) = 16.57, P = 0.001). Except for the first exercise set (P = 0.016), RPE was significantly
different between BFR and CON (all P < 0.001; Table 3). There were also significant differences
in leg muscle pain over time for BFR (χ2
(3) = 32.9, P < 0.001) and CON (χ2
(3) = 13.90, P =
0.003). Except for the first exercise set (P = 0.040), leg muscle pain was significantly different
between BFR and CON (all P < 0.001; Table 3).
ACCEPTED
Copyright © 2017 by the American College of Sports Medicine. Unauthorized reproduction of this article is prohibited.
Discussion
The present study investigated the time-course and origin of changes in neuromuscular function
during and after a bout of low-intensity exercise with and without BFR. The main findings were:
(i) BFR accelerated the exercise-induced development of muscle fatigue; (ii) peripheral factors
mainly contributed to muscle fatigue during low-intensity BFR exercise with major impairments
during the early phase of the exercise bout; (iii) neural factors also contributed to the pronounced
end-exercise level of muscle fatigue under the condition of limited blood flow; (iv) BFR-induced
muscle fatigue recovered substantially within 2 min after exercise termination; and (v) the initial
recovery of muscle fatigue is mainly caused by a rapid restoration of contractile function.
Interestingly, (vi) the effect of BFR on muscle fatigue was already diminished after 2 min of
reperfusion. We also provide evidence that (vii) the augmented muscle activity during low-
intensity BFR exercise compensated for the exacerbated contractile torque loss.
Development of muscle fatigue.
As expected from other studies (i.e. (5, 9)), the magnitude of muscle fatigue development during
low-intensity exercise was exacerbated when blood flow to the working muscle was restricted.
To our knowledge, this is the first study describing the development of muscle fatigue in the
course of low-intensity exercise with and without BFR. In detail, we found a substantial loss in
knee extensor MVT after the first set of exercise, irrespective of the condition. This large drop in
knee extensor MVT is likely influenced by the greater number of contractions performed in the
first compared to the following exercise sets (2). The exercise-induced MVT reduction was
significantly greater for BFR compared to CON. In the course of the BFR condition, MVT
progressively declined until exercise termination, whereas no further decrease in MVT was
ACCEPTED
Copyright © 2017 by the American College of Sports Medicine. Unauthorized reproduction of this article is prohibited.
observed after the first set during CON. At exercise termination there was a significantly greater
MVT reduction for BFR (−45 ± 14%) compared to CON (−24 ± 12%). Studies using various
exercise protocols reported BFR-induced MVT reductions of −30% to −62% whereas minor
reductions were observed for the free blood flow condition (−14% to −22%; (4, 9, 26, 27)).
Discrepancies in acute responses to BFR exercise are likely due to methodological differences
(i.e. cuff pressure, continuous or intermittent cuff application, exercise volume/intensity and if
exercise was performed to volitional task failure or not).
We also found that limited blood flow significantly increased the exercise-induced loss in
quadriceps twitch torque, supporting previous observations that peripheral factors mainly
contribute to muscle fatigue during low-intensity exercise with BFR (9, 26). In detail, there was a
substantial decrease in quadriceps twitch torque after the first exercise set, irrespective of the
condition. Peripheral fatigue was more pronounced during BFR compared to CON. Throughout
the BFR protocol, quadriceps twitch torque progressively declined until exercise termination,
whereas quadriceps twitch torque during CON remained largely unchanged after the first set.
Consequently, BFR resulted in a greater end-exercise level of peripheral fatigue as indicated by a
twitch torque reduction of −40 ± 17% (PS100) from the pre-exercise value during BFR
compared to CON (−21 ± 18%). Karabulut et al. (9), who also used work-matched exercise
protocols, reported a similar reduction in quadriceps twitch torque (PS100) after BFR exercise
(−44%) compared to the free blood flow condition (−19%). The fact that BFR exacerbated the
exercise-induced accumulation of fatigue-related metabolites and prevented the recovery of
contractile function within the inter-set rest periods might be the most obvious explanation for
the pronounced development of peripheral fatigue. To our knowledge, this is the first study
ACCEPTED
Copyright © 2017 by the American College of Sports Medicine. Unauthorized reproduction of this article is prohibited.
which investigated the etiology of peripheral fatigue after a bout of low-intensity BFR exercise.
M-wave amplitude, commonly interpreted as an index of neuromuscular propagation (28),
remained unchanged in the course of the exercise protocol in both conditions. In contrast, low-
frequency fatigue (estimated via PS10·PS100-1
ratio) was more pronounced during BFR
compared to CON. Together, these findings suggest that low-intensity exercise combined with
BFR exacerbated the contractile torque loss likely due to alterations distal to the sarcolemma,
including the direct inhibition of the cross-bridge cycle, reduced myofibrillar sensitivity to
calcium (Ca2+
) and/or impaired Ca
2+ release from the sarcoplasmatic reticulum (SR)
(29). As
shown previously (30, 31), the rate of PCr hydrolysis and concomitant Pi accumulation is
accelerated when exercise is performed under conditions of limited blood flow. The latter is
thought to be the main contributor to exercise-induced impairments in Ca2+
handling (29) and the
most likely explanation for the exacerbated development of peripheral fatigue during low-
intensity BFR exercise. As recently described (32), a large portion of the initial drop in
quadriceps twitch torque might be explained by impairments in myofibrillar function (i.e. direct
inhibition of the cross-bridge cycle and reduced Ca2+
sensitivity) whereas the progressive decline
in muscle function during the later phases of the exercise bout might be largely explained by
impaired Ca2+
release from the SR.
The progressive loss in quadriceps twitch torque during exercise was accompanied by significant
increases in VM and VL RMS·M-1
throughout both exercise protocols. Quadriceps muscle
activity, as already observed by others (i.e. (21)), was significantly augmented in the course of
exercise under conditions of limited blood flow. Higher muscle activation during BFR is
commonly interpreted as an increased recruitment of type II muscle fibers which is thought to be
ACCEPTED
Copyright © 2017 by the American College of Sports Medicine. Unauthorized reproduction of this article is prohibited.
a potential rational for hypertrophic adaptations (3). Few researchers speculated that an increased
inhibitory feedback of metabosensitive muscle afferents to the alpha motoneurons resulted in an
augmented fiber recruitment to maintain adequate force output (21, 33). However, the most
plausible explanation is that the increased muscle activation during BFR compensates for the
pronounced contractile force loss during BFR exercise (34). We also found that the augmented
muscle activity was accompanied by higher RPE when exercise was performed under conditions
of limited blood flow. Increased effort perception as a result of low-intensity work-matched
exercise with BFR was frequently reported in the literature (i.e. (5)). It is well accepted that
neuronal processing of sensory signals are involved in effort perception (35). In the present
study, the stronger perception of effort during BFR exercise might result from an increased
central motor command and a concomitant corollary discharge to compensate for the augmented
contractile dysfunction (36) and/or from an increased afferent feedback from the working
muscles due to stronger metabolic disturbances in the periphery (37, 38). However, the exact
sensory signals generating perception of effort are still debated (36).
Furthermore, by using the interpolated twitch technique, we found that central factors also
contribute to the pronounced end-exercise level of quadriceps muscle fatigue during low-
intensity BFR exercise. In contrast to the strong impairments in quadriceps twitch torque already
observed after the first exercise set, the reduction in voluntary activation was not evident until
the last set of BFR exercise (−10 ± 12%). After exercise termination, no significant changes in
voluntary activation could be found during CON. This observation is in line with Karabulut et al.
(9) who reported a 13% decline in voluntary activation at exercise termination induced by five
sets of 20 dynamic knee extensions at 20% 1RM with BFR and a 4% increase following CON.
ACCEPTED
Copyright © 2017 by the American College of Sports Medicine. Unauthorized reproduction of this article is prohibited.
Together, restricted blood flow appears to promote the development of central fatigue after
multiple sets of work-matched low-intensity exercise. Although several mechanisms have been
proposed to cause a reduction in voluntary activation (6), one mechanism which presumably
accounts for decreased motoneuron firing rates under conditions of limited blood flow is the
inhibitory feedback of group III/IV muscle afferents (39). A distinction is made between
ergoreceptive group III/IV muscle afferents which respond to low levels of interstitial ATP, H+
and lactate associated with freely perfused, mostly aerobic exercise and nociceptive muscle
afferents which are sensitive to high levels of metabolites associated with painful and/or
ischemic exercise (40). The fact that higher ratings of leg muscle pain were recorded during BFR
compared to CON might be a plausible but indirect indicator that nociceptive group III/IV
muscle afferents were activated to a greater extent when exercise is performed under conditions
of limited blood flow. Furthermore, it has been shown that group IV afferents can also be
stimulated by venous distension (41); hence, it is conceivable that BFR-induced venous pooling
itself has contributed to increased discharge rates. Since group III/IV afferents are thought to
decrease neural drive by acting at the spinal and/or supraspinal level, changes at spinal and/or
supraspinal sites might have contributed to central fatigue after multiple sets of BFR exercise.
However, by using peripheral nerve stimulation to assess voluntary activation we were unable to
determine whether spinal and/or supraspinal factors contributed to impairments in neural drive
immediately after BFR exercise.
Recovery of muscle fatigue
To our knowledge, this is the first study investigating the time-course and origin of
neuromuscular recovery after fatiguing low-intensity exercise with and without BFR. We found
ACCEPTED
Copyright © 2017 by the American College of Sports Medicine. Unauthorized reproduction of this article is prohibited.
a progressive but incomplete recovery of maximal voluntary quadriceps strength within 8 min
post-exercise, irrespective of the condition. Compared to CON, reperfusion following BFR
exercise induced a markedly faster restitution of maximal voluntary quadriceps strength within
the first 2 min after exercise termination. Despite the exacerbated muscle fatigue during BFR
exercise, group differences were no longer evident after 2 min of rest, suggesting that the impact
of limited blood flow on muscle fatigue was abolished shortly after reperfusion. However, MVT
values did not recover completely within 8 min of rest. This observation is in accordance with
Loenneke et al. (5), who measured maximal voluntary quadriceps strength 1, 24 and 48 h after
the same BFR exercise protocol and found that MVT reductions persisted for 1 h post-exercise
and were no longer significantly different after 24 h.
The initial recovery of muscle fatigue after BFR exercise was mainly determined by peripheral
factors as indicated by a rapid restitution of quadriceps twitch torque within the first 2 min after
blood flow was restored. Despite the smaller extent to which muscle fatigue developed during
CON, quadriceps twitch torque did not recover significantly after exercise termination.
Interestingly, the impact of limited blood flow on contractile function was no longer evident
following 8 min of reperfusion. The initial restitution of contractile function with reperfusion can
be largely explained by the recovery of metabolically induced impairments in intracellular Ca2+
handling and/or sensitivity as indicated by a significant rebound of the PS10·PS100-1
ratio during
the first 2 min after exercise termination. The fast initial restitution of quadriceps twitch torque
might also be facilitated by a reactive hyperemic blood flow following cuff deflation (42) which,
in turn, could have accelerated the removal of fatigue-related metabolites. However, contractile
function did not recover completely within 8 min post-exercise. This is not unusual, since
ACCEPTED
Copyright © 2017 by the American College of Sports Medicine. Unauthorized reproduction of this article is prohibited.
incomplete muscle function was shown to persist for some hours due to prolonged impairments
in intracellular Ca2+
release from the SR or myofibrillar Ca2+
sensitivity (29). The exercise-
induced production of reactive oxygen/nitrogen species has been recently linked to those
prolonged impairments in contractile function (43).
It is important to emphasize that there was a progressive decline in PS10·PS100-1
ratio after 2
min of rest, whereas quadriceps twitch torque in response to SS and PS100 slightly increased or
remained unchanged. This is in line with data from Froyd et al. (13), who also observed a decline
in PS10·PS100-1
ratio after 2 min of recovery. This rather contradictory behavior might question
the validity of the PS10·PS100-1
ratio as an index of low-frequency fatigue during the later
phases of the recovery period after single-joint exercise.
Compared to the rapid restitution of quadriceps twitch torque shortly after reperfusion, there was
no significant recovery of voluntary activation after BFR exercise. Group differences between
BFR and CON were only evident at exercise termination and disappeared 1 min post-exercise.
Therefore, the present data suggest that voluntary drive is only affected when multiple sets of
low-intensity exercise were performed under conditions of restricted blood flow and that this
effect disappeared shortly after reperfusion. In line with the present findings, studies using post-
exercise ischemia to investigate the impact of group III/IV muscle afferents on central factors of
muscle fatigue have demonstrated that the restoration of blood flow rapidly abolished the
inhibitory effects of metabosensitive muscle afferents on voluntary activation (44, 45). However,
voluntary activation was significantly reduced 1 min post-exercise, irrespective of the condition,
suggesting that multiple sets of low-intensity dynamic exercise per se impaired neural drive to
ACCEPTED
Copyright © 2017 by the American College of Sports Medicine. Unauthorized reproduction of this article is prohibited.
the quadriceps muscle which, in turn, is not evident immediately after exercise-termination.
Reductions in neural drive persisted for the entire recovery period, irrespective of the condition.
This is in line with studies showing a slow and incomplete recovery of voluntary activation after
sustained low-intensity isometric contractions (for a review see (10)). Furthermore, since
voluntary drive has been found to recover slowly after eccentric muscle actions (46), the
eccentric portions might have contributed to the long-lasting depression of neural drive observed
in the present study. The mechanisms underlying this delayed recovery of central fatigue after
low-intensity contractions are currently unknown (10).
Limitations
A limitation to highlight is that the present findings are limited to male subjects. Previous
research by Labarbera et al. (47) suggested that females are less fatigable compared to males,
even when performing isotonic knee extensions under conditions of limited blood flow (47).
Further studies are therefore needed to understand the role of sex during muscle fatigue in the
time-course of low-intensity BFR exercise.
Conclusion
The present study provides, for the first time, mechanistic insight into the etiology of muscle
fatigue development and recovery when low-intensity exercise is performed under conditions of
limited blood flow. We found that BFR accelerated the development of muscle fatigue mainly
due to pronounced impairments in contractile function. The major change in contractile function
occurred early during the BFR exercise bout whereas the impairment in neural drive did not play
a significant role until exercise termination. Despite the pronounced level of muscle fatigue
ACCEPTED
Copyright © 2017 by the American College of Sports Medicine. Unauthorized reproduction of this article is prohibited.
during BFR exercise, the effect of limited blood flow on muscle fatigue was diminished after 2
min of reperfusion, suggesting that BFR has a strong but short-lasting impact on neuromuscular
function of the quadriceps muscle. The strong decline in neuromuscular function and the fast
recovery after low-intensity BFR exercise seem to provide a strong adaptive stimulus for
muscular growth without long-lasting impairments in motor performance which are typically
associated with heavy-load resistance training. From a practical point of view, low-intensity BFR
exercise should be favored when applying high-frequency training regimes for muscle
hypertrophy.
ACCEPTED
Copyright © 2017 by the American College of Sports Medicine. Unauthorized reproduction of this article is prohibited.
Acknowledgements
The authors would like to thank all subjects who participated in this study. We also show
appreciation to Martin Gube, Toni Hampel and Alexander Kurfürst for their support in
conducting the present experiment. The authors did not receive any funding to carry out the
present study. No conflicts of interest are directly relevant to this article. The present results do
not constitute endorsement by the American College of Sports Medicine. The results of the
present study are presented clearly, honestly, and without fabrication, falsification, or
inappropriate data manipulation.
ACCEPTED
Copyright © 2017 by the American College of Sports Medicine. Unauthorized reproduction of this article is prohibited.
References
1. Schoenfeld BJ. Potential mechanisms for a role of metabolic stress in hypertrophic
adaptations to resistance training. Sport Med. 2013;43(3):179–94.
2. Loenneke JP, Wilson JM, Marín PJ, Zourdos MC, Bemben MG. Low intensity blood flow
restriction training: A meta-analysis. Eur J Appl Physiol. 2012;112(5):1849–59.
3. Pearson SJ, Hussain SR. A Review on the Mechanisms of Blood-Flow Restriction
Resistance Training-Induced Muscle Hypertrophy. Sport Med. 2014;45(2):187–200.
4. Cook SB, Clark BC, Ploutz-Snyder LL. Effects of exercise load and blood-flow restriction
on skeletal muscle function. Med Sci Sports Exerc. 2007;39(10):1708–13.
5. Loenneke JP, Thiebaud RS, Fahs CA, Rossow LM, Abe T, Bemben MG. Blood flow
restriction does not result in prolonged decrements in torque. Eur J Appl Physiol.
2013;113(4):923–31.
6. Gandevia SC. Spinal and supraspinal factors in human muscle fatigue. Physiol Rev.
2001;81(4):1725–89.
7. Millet GY, Aubert D, Favier FB, Busso T, Benoît H. Effect of acute hypoxia on central
fatigue during repeated isometric leg contractions. Scand J Med Sci Sport.
2009;19(5):695–702.
8. Goodall S, Ross EZ, Romer LM. Effect of graded hypoxia on supraspinal contributions to
fatigue with unilateral knee-extensor contractions. J Appl Physiol. 2010;109(6):1842–51.
9. Karabulut M, Cramer JT, Abe T, Sato Y, Bemben MG. Neuromuscular fatigue following
low-intensity dynamic exercise with externally applied vascular restriction. J
Electromyogr Kinesiol. 2010;20(3):440–7.
10. Carroll TJ, Taylor JL, Gandevia SC. Recovery of central and peripheral neuromuscular
ACCEPTED
Copyright © 2017 by the American College of Sports Medicine. Unauthorized reproduction of this article is prohibited.
fatigue after exercise. J Appl Physiol. 2016; DOI: 10.1152.
11. Hunter SK. Sex differences in human fatigability: Mechanisms and insight to
physiological responses. Acta Physiol. 2014;210(4):768–89.
12. Motykie GD, Zebala LP, Caprini JA, et al. A guide to venous thromboembolism risk
factor assessment. J Thromb Thrombolysis. 2000;9(3):253–62.
13. Froyd C, Millet GY, Noakes TD. The development of peripheral fatigue and short-term
recovery during self-paced high-intensity exercise. J Physiol. 2013;591(5):1339–46.
14. Loenneke JP, Fahs CA, Rossow LM, et al. Effects of cuff width on arterial occlusion:
Implications for blood flow restricted exercise. Eur J Appl Physiol. 2012;112(8):2903–12.
15. Behrens M, Mau-Moeller A, Weippert M, et al. Caffeine-induced increase in voluntary
activation and strength of the quadriceps muscle during isometric, concentric and
eccentric contractions. Sci Rep. 2015;5:10209.
16. Place N, Maffiuletti NA, Martin A, Lepers R. Assessment of the reliability of central and
peripheral fatigue after sustained maximal voluntary contraction of the quadriceps muscle.
Muscle Nerve. 2007;35(4):486–95.
17. Shield A, Zhou S. Assessing voluntary muscle activation with the twitch interpolation
technique. Sports Med. 2004;34(4):253–67.
18. Pageaux B. Perception of effort in Exercise Science: Definition, measurement and
perspectives. Eur J Sport Sci. 2016;16(8):1–10.
19. Cook DB, O‟Connor PJ, Eubanks SA, Smith JC, Lee M. Naturally occurring muscle pain
during exercise: assessment and experimental evidence. Med Sci Sports Exerc.
1997;29(8):999–1012.
20. Verges S, Maffiuletti N a, Kerherve H, Decorte N, Wuyam B, Millet GY. Comparison of
ACCEPTED
Copyright © 2017 by the American College of Sports Medicine. Unauthorized reproduction of this article is prohibited.
electrical and magnetic stimulations to assess quadriceps muscle function. J Appl Physiol.
2009;106(2):701–10.
21. Loenneke JP, Kim D, Fahs CA, et al. Effects of exercise with and without different
degrees of blood flow restriction on torque and muscle activation. Muscle Nerve.
2015;51(5):713–21.
22. Strojnik V, Komi P V. Neuromuscular fatigue after maximal stretch-shortening cycle
exercise. J Appl Physiol. 1998;84(1):344–50.
23. Behrens M, Husmann F, Gube M, et al. Intersession reliability of the interpolated twitch
technique applied during isometric, concentric, and eccentric actions of the human knee
extensor muscles. Muscle and Nerve. 2017; 56(2):324–327.
24. Hopkins WG. Reliability from consecutive pairs of trials. Internet Soc Sport Sci. 2000;
available from URL: http://www.sportsci.org/resource/stats/xrely.xls
25. Atkinson G, Nevill A. Statistical Methods for Assssing Measurement Error (Reliability) in
Variables Relevant to Sports Medicine. Sport Med. 1998;26(4):217–38.
26. Cook SB, Murphy BG, Labarbera KE. Neuromuscular function after a bout of low-load
blood flow-restricted exercise. Med Sci Sports Exerc. 2013;45(1):67–74.
27. Wernbom M, Paulsen G, Nilsen TS, Hisdal J, Raastad T. Contractile function and
sarcolemmal permeability after acute low-load resistance exercise with blood flow
restriction. Eur J Appl Physiol. 2012;112(6):2051–63.
28. Fuglevand AJ, Zackowski KM, Huey KA, Enoka RM. Impairment of neuromuscular
propagation during human fatiguing contractions at submaximal forces. J Physiol.
1993;460:549–72.
29. Allen DG, Lamb GD, Westerblad H. Skeletal muscle fatigue: cellular mechanisms.
ACCEPTED
Copyright © 2017 by the American College of Sports Medicine. Unauthorized reproduction of this article is prohibited.
Physiol Rev. 2008;88(1):287–332.
30. Suga T, Okita K, Takada S, et al. Effect of multiple set on intramuscular metabolic stress
during low-intensity resistance exercise with blood flow restriction. Eur J Appl Physiol.
2012;112(11):3915–20.
31. Sugaya M, Yasuda T, Suga T, Okita K, Abe T. Change in intramuscular inorganic
phosphate during multiple sets of blood flow-restricted low-intensity exercise. Clin
Physiol Funct Imaging. 2011;31(5):411–3.
32. Cheng AJ, Place N, Westerblad H. Molecular Basis for Exercise-Induced Fatigue: The
Importance of Strictly Controlled Cellular Ca 2+
Handling. Cold Spring Harb Perspect
Med. 2017; DOI: 5149–60.
33. Yasuda T, Abe T, Brechue WF, et al. Venous blood gas and metabolite response to low-
intensity muscle contractions with external limb compression. Metabolism.
2010;59(10):1510–9.
34. Moritani T, Sherman WM, Shibata M, Matsumoto T, Shinohara M. Oxygen availability
and motor unit activity in humans. Eur J Appl Physiol Occup Physiol. 1992;64(6):552–6.
35. Noble BJ, Robertson RJ. Perceived Exertion. 1996: 236–336.
36. Marcora SM. Perception of effort during exercise is independent of afferent feedback
from skeletal muscles, heart, and lungs. J Appl Phyiology. 2009;106:2060–2.
37. Proske U, Gandevia SC, Adrian ED, et al. The proprioceptive senses: their roles in
signaling body shape, body position and movement, and muscle force. Physiol Rev.
2012;92(4):1651–97.
38. Amann M, Blain GM, Proctor LT, Sebranek JJ, Pegelow DF, Dempsey JA. Group III and
IV muscle afferents contribute to ventilatory and cardiovascular response to rhythmic
ACCEPTED
Copyright © 2017 by the American College of Sports Medicine. Unauthorized reproduction of this article is prohibited.
exercise in humans. J Appl Physiol. 2010;109(4):966–76.
39. Butler JE, Taylor JL, Gandevia SC. Responses of human motoneurons to corticospinal
stimulation during maximal voluntary contractions and ischemia. J Neurosci.
2003;23(32):10224–30.
40. Jankowski MP, Rau KK, Ekmann KM, Anderson CE, Koerber HR. Comprehensive
phenotyping of group III and IV muscle afferents in mouse. J Neurophysiol.
2013;109(9):2374–81.
41. Haouzi P, Hill JM, Lewis BK, Kaufman MP. Responses of group III and IV muscle
afferents to distension of the peripheral vascular bed. J Appl Physiol. 1999;87(2):545–53.
42. Loscalzo J, Vita JA. Ischemia, hyperemia, exercise, and nitric oxide. Complex physiology
and complex molecular adaptations. Circulation. 1994;90(5):2556–9.
43. Cheng AJ, Yamada T, Rassier D, Andersson DC, Westerblad H, Lanner JT. Reactive
oxygen/nitrogen species and contractile function in skeletal muscle during fatigue and
recovery. J Physiol. 2016; 594(18):5149–60.
44. Kennedy DS, McNeil CJ, Gandevia SC, Taylor JL. Fatigue-related firing of distal muscle
nociceptors reduces voluntary activation of proximal muscles of the same limb. J Appl
Physiol. 2014;116(4):385–94.
45. Gandevia SC, Allen GM, Butler JE, Taylor JL. Supraspinal factors in human muscle
fatigue: evidence for suboptimal output from the motor cortex. J Physiol.
1996;490(2):529–36.
46. Goodall S, Thomas K, Barwood M, et al. Neuromuscular changes and the rapid adaptation
following a bout of damaging eccentric exercise. Acta Physiol. 2017;220(4):486–500.
47. Labarbera KE, Murphy BG, Laroche DP, Cook SB. Sex differences in blood flow
restricted isotonic knee extensions to fatigue. J Sports Med Phys Fitness. 2013;53(4):444–
52.
ACCEPTED
Copyright © 2017 by the American College of Sports Medicine. Unauthorized reproduction of this article is prohibited.
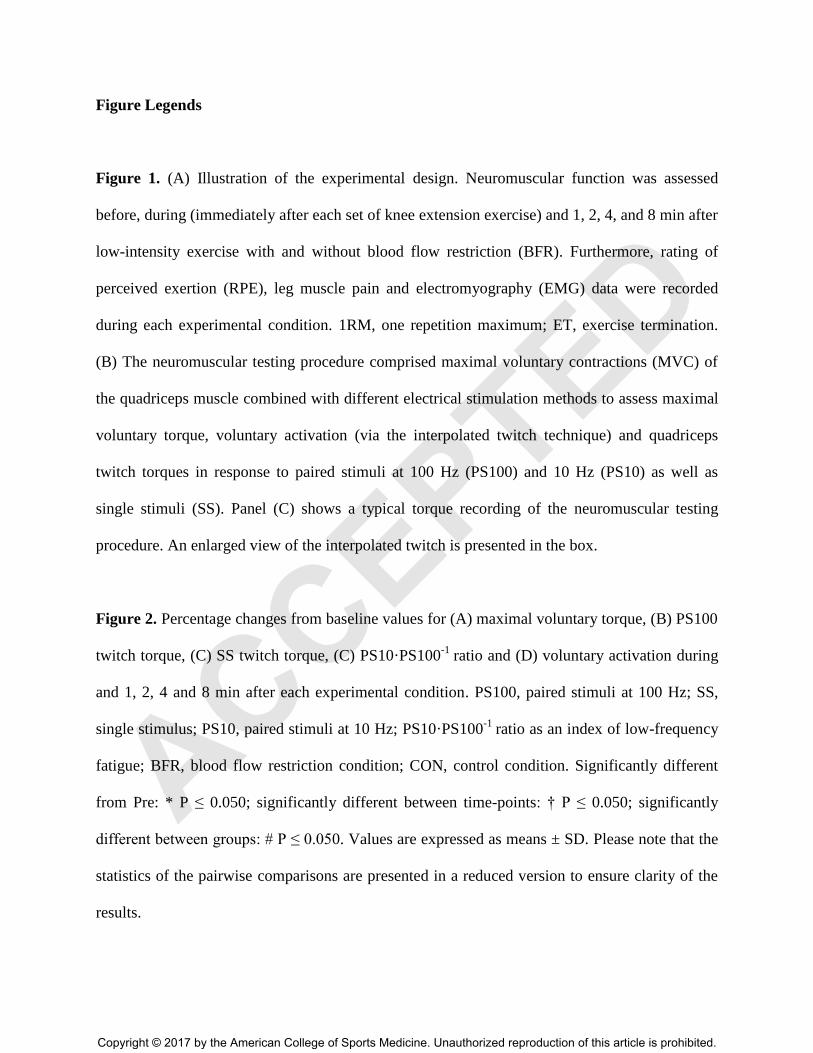
Figure Legends
Figure 1. (A) Illustration of the experimental design. Neuromuscular function was assessed
before, during (immediately after each set of knee extension exercise) and 1, 2, 4, and 8 min after
low-intensity exercise with and without blood flow restriction (BFR). Furthermore, rating of
perceived exertion (RPE), leg muscle pain and electromyography (EMG) data were recorded
during each experimental condition. 1RM, one repetition maximum; ET, exercise termination.
(B) The neuromuscular testing procedure comprised maximal voluntary contractions (MVC) of
the quadriceps muscle combined with different electrical stimulation methods to assess maximal
voluntary torque, voluntary activation (via the interpolated twitch technique) and quadriceps
twitch torques in response to paired stimuli at 100 Hz (PS100) and 10 Hz (PS10) as well as
single stimuli (SS). Panel (C) shows a typical torque recording of the neuromuscular testing
procedure. An enlarged view of the interpolated twitch is presented in the box.
Figure 2. Percentage changes from baseline values for (A) maximal voluntary torque, (B) PS100
twitch torque, (C) SS twitch torque, (C) PS10·PS100-1
ratio and (D) voluntary activation during
and 1, 2, 4 and 8 min after each experimental condition. PS100, paired stimuli at 100 Hz; SS,
single stimulus; PS10, paired stimuli at 10 Hz; PS10·PS100-1
ratio as an index of low-frequency
fatigue; BFR, blood flow restriction condition; CON, control condition. Significantly different
from Pre: * P ≤ 0.050; significantly different between time-points: † P ≤ 0.050; significantly
different between groups: # P ≤ 0.050. Values are expressed as means ± SD. Please note that the
statistics of the pairwise comparisons are presented in a reduced version to ensure clarity of the
results.
ACCEPTED
Copyright © 2017 by the American College of Sports Medicine. Unauthorized reproduction of this article is prohibited.
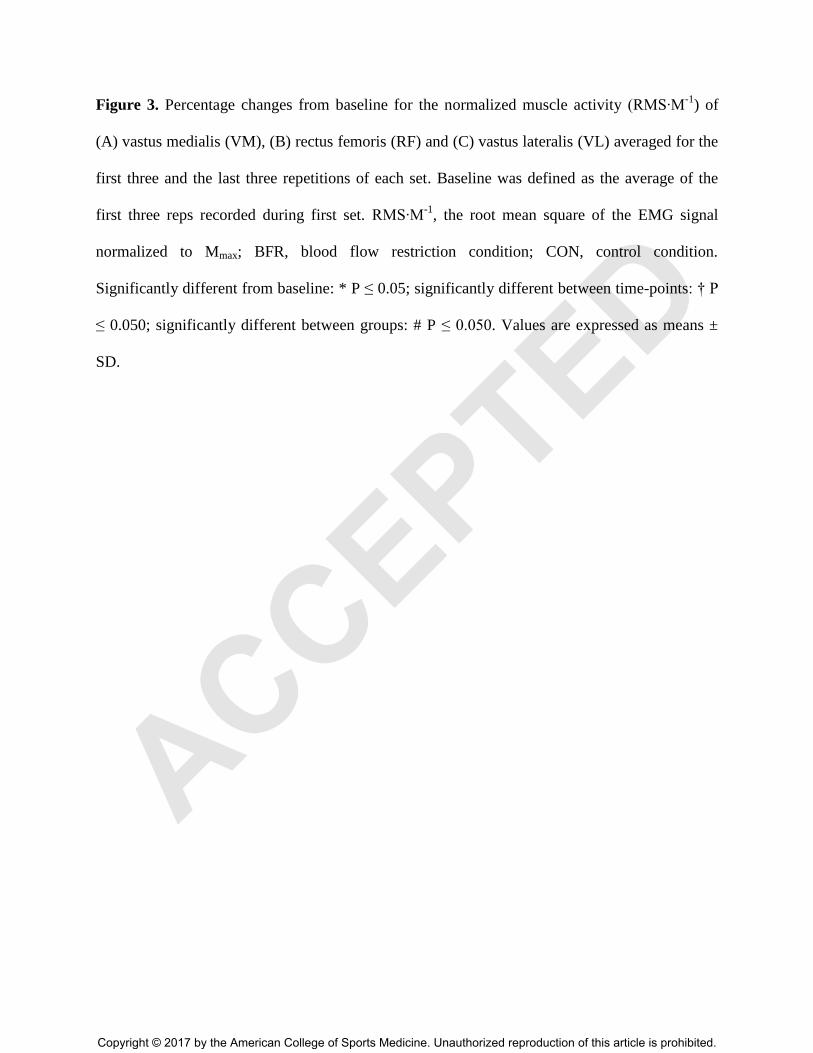
Figure 3. Percentage changes from baseline for the normalized muscle activity (RMS∙M-1
) of
(A) vastus medialis (VM), (B) rectus femoris (RF) and (C) vastus lateralis (VL) averaged for the
first three and the last three repetitions of each set. Baseline was defined as the average of the
first three reps recorded during first set. RMS∙M-1
, the root mean square of the EMG signal
normalized to Mmax; BFR, blood flow restriction condition; CON, control condition.
Significantly different from baseline: * P ≤ 0.05; significantly different between time-points: † P
≤ 0.050; significantly different between groups: # P ≤ 0.050. Values are expressed as means ±
SD.
ACCEPTED
Copyright © 2017 by the American College of Sports Medicine. Unauthorized reproduction of this article is prohibited.
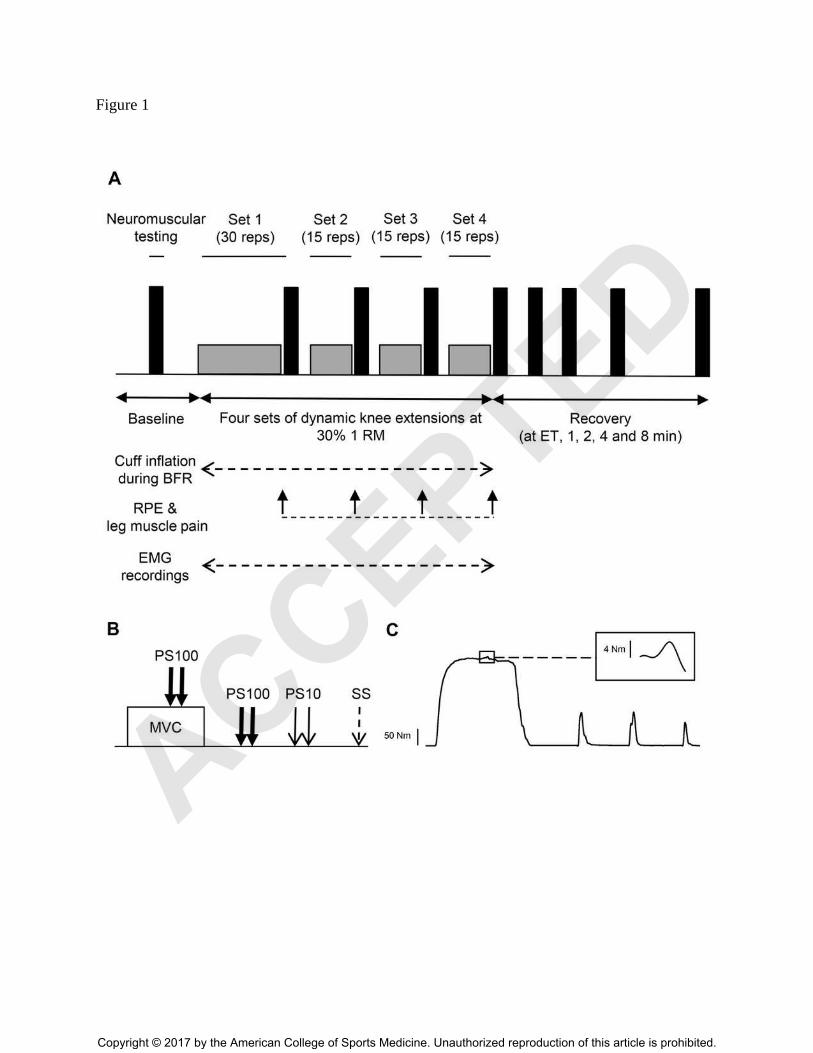
Figure 1
ACCEPTED
Copyright © 2017 by the American College of Sports Medicine. Unauthorized reproduction of this article is prohibited.
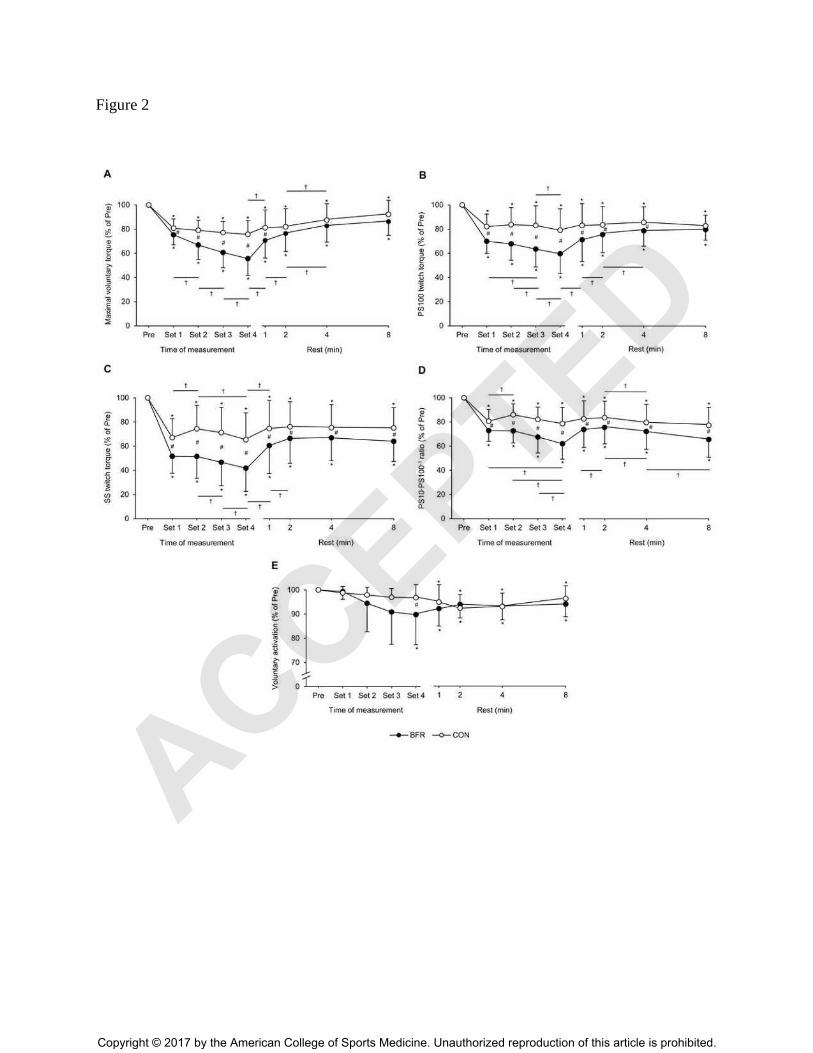
Figure 2
ACCEPTED
Copyright © 2017 by the American College of Sports Medicine. Unauthorized reproduction of this article is prohibited.
Figure 3
ACCEPTED
Copyright © 2017 by the American College of Sports Medicine. Unauthorized reproduction of this article is prohibited.
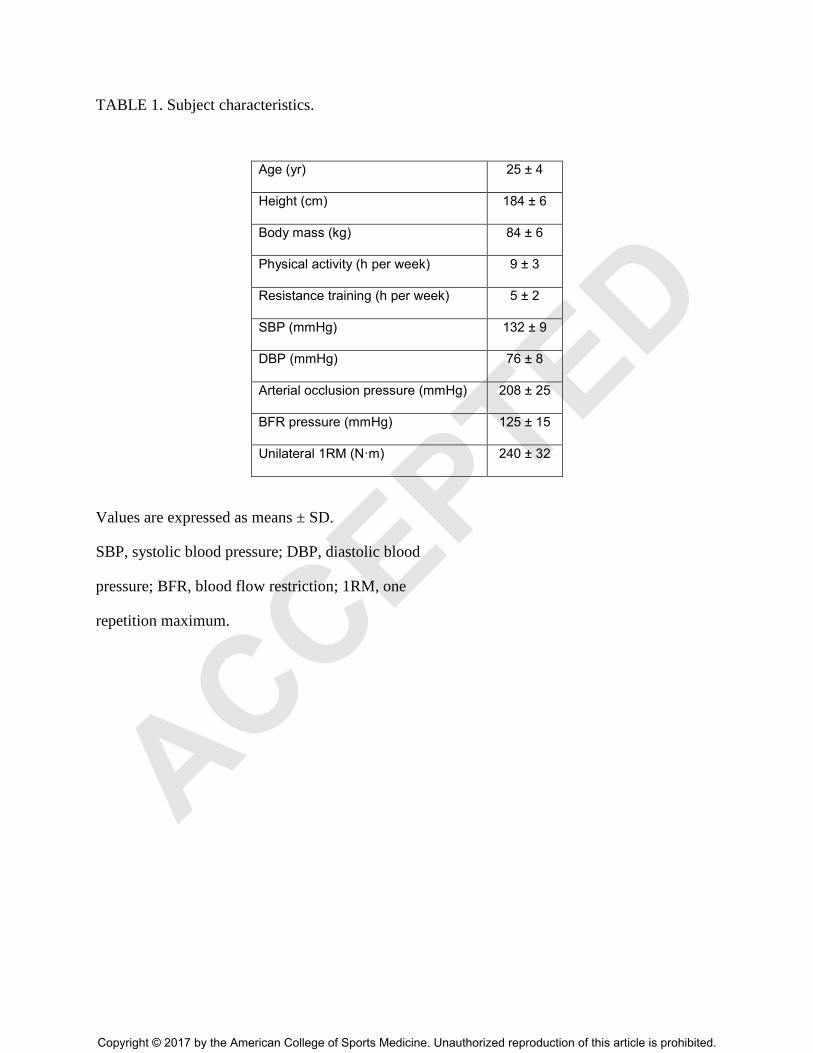
TABLE 1. Subject characteristics.
Age (yr) 25 ± 4
Height (cm) 184 ± 6
Body mass (kg) 84 ± 6
Physical activity (h per week) 9 ± 3
Resistance training (h per week) 5 ± 2
SBP (mmHg) 132 ± 9
DBP (mmHg) 76 ± 8
Arterial occlusion pressure (mmHg) 208 ± 25
BFR pressure (mmHg) 125 ± 15
Unilateral 1RM (N·m) 240 ± 32
Values are expressed as means ± SD.
SBP, systolic blood pressure; DBP, diastolic blood
pressure; BFR, blood flow restriction; 1RM, one
repetition maximum.
ACCEPTED
Copyright © 2017 by the American College of Sports Medicine. Unauthorized reproduction of this article is prohibited.
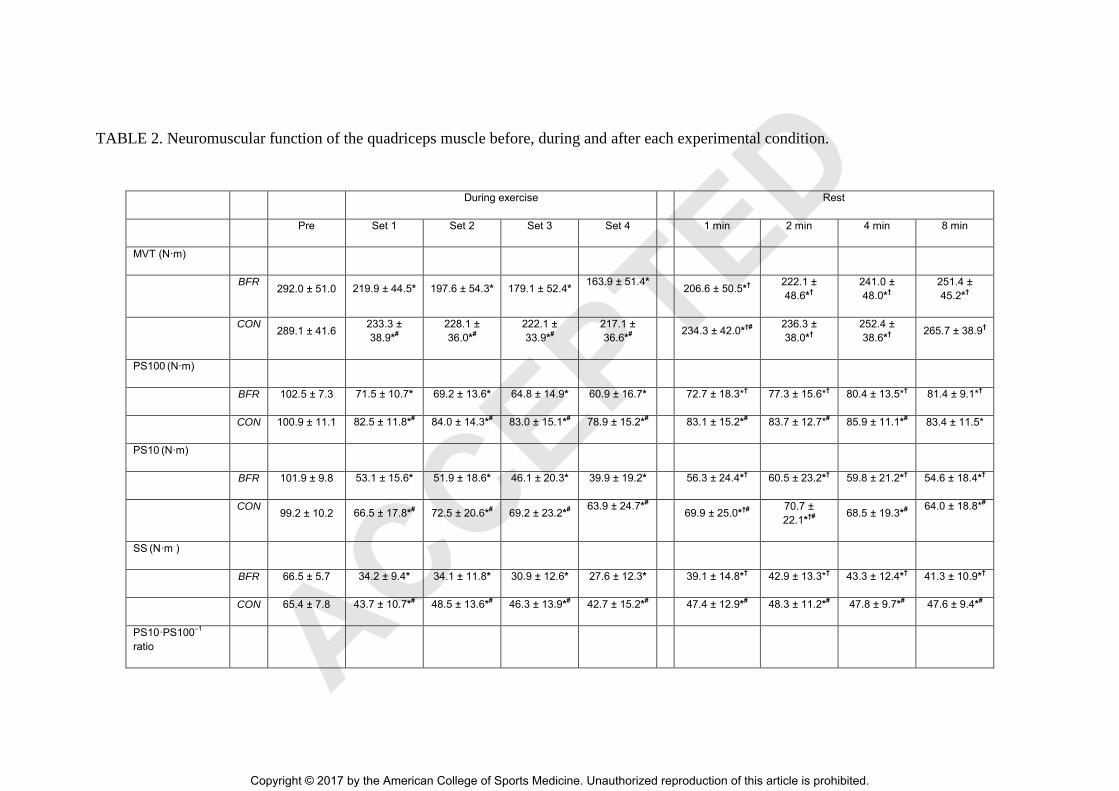
TABLE 2. Neuromuscular function of the quadriceps muscle before, during and after each experimental condition.
During exercise Rest
Pre Set 1 Set 2 Set 3 Set 4 1 min 2 min 4 min 8 min
MVT (N·m)
BFR
292.0 ± 51.0 219.9 ± 44.5* 197.6 ± 54.3* 179.1 ± 52.4* 163.9 ± 51.4* 206.6 ± 50.5*† 222.1 ±
48.6*† 241.0 ±
48.0*† 251.4 ±
45.2*†
CON
289.1 ± 41.6 233.3 ±
38.9*#
228.1 ±
36.0*#
222.1 ±
33.9*#
217.1 ±
36.6*#
234.3 ± 42.0*†#
236.3 ±
38.0*† 252.4 ±
38.6*† 265.7 ± 38.9†
PS100 (N·m)
BFR 102.5 ± 7.3 71.5 ± 10.7* 69.2 ± 13.6* 64.8 ± 14.9* 60.9 ± 16.7* 72.7 ± 18.3*† 77.3 ± 15.6*
† 80.4 ± 13.5*
† 81.4 ± 9.1*
†
CON 100.9 ± 11.1 82.5 ± 11.8*# 84.0 ± 14.3*#
83.0 ± 15.1*# 78.9 ± 15.2*#
83.1 ± 15.2*# 83.7 ± 12.7*
# 85.9 ± 11.1*#
83.4 ± 11.5*
PS10 (N·m)
BFR 101.9 ± 9.8 53.1 ± 15.6* 51.9 ± 18.6* 46.1 ± 20.3* 39.9 ± 19.2* 56.3 ± 24.4*† 60.5 ± 23.2*† 59.8 ± 21.2*† 54.6 ± 18.4*†
CON
99.2 ± 10.2 66.5 ± 17.8*# 72.5 ± 20.6*#
69.2 ± 23.2*# 63.9 ± 24.7*#
69.9 ± 25.0*†#
70.7 ±
22.1*†#
68.5 ± 19.3*# 64.0 ± 18.8*#
SS (N·m )
BFR 66.5 ± 5.7 34.2 ± 9.4* 34.1 ± 11.8* 30.9 ± 12.6* 27.6 ± 12.3* 39.1 ± 14.8*† 42.9 ± 13.3*† 43.3 ± 12.4*† 41.3 ± 10.9*†
CON 65.4 ± 7.8 43.7 ± 10.7*# 48.5 ± 13.6*#
46.3 ± 13.9*# 42.7 ± 15.2*#
47.4 ± 12.9*# 48.3 ± 11.2*#
47.8 ± 9.7*# 47.6 ± 9.4*#
PS10·PS100–1
ratio
ACCEPTED
Copyright © 2017 by the American College of Sports Medicine. Unauthorized reproduction of this article is prohibited.
BFR 1.00 ± 0.09 0.73 ± 0.13* 0.73 ± 0.13* 0.68 ± 0.16* 0.62 ± 0.15* 0.74 ± 0.18*† 0.76 ± 0.18*† 0.73 ± 0.19* 0.66 ± 0.19*
CON 0.99 ± 0.09 0.80 ± 0.14*#
0.85 ± 0.13*#
0.81 ± 0.15*#
0.78 ± 0.18*#
0.82 ± 0.18*# 0.83 ± 0.17*#
0.79 ± 0.18*# 0.77 ± 0.21*#
VM Mmax (mV)
BFR 13.1 ± 2.8 12.7 ± 2.9 12.8 ± 2.9 12.8 ± 2.9 12.6 ± 2.9 12.7 ± 2.4 12.7 ± 2.4 12.6 ± 2.4 12.7 ± 2.5
CON 13.1 ± 2.0 13.0 ± 2.0 13.1 ± 2.0 13.1 ± 2.0 13.2 ± 2.0 12.9 ± 1.7 13.0 ± 1.7 13.1 ± 1.8 13.0 ± 1.9
RF Mmax (mV)
BFR 3.7 ± 1.1 3.8 ± 1.2 3.9 ± 1.2 3.9 ± 1.2 4.0 ± 1.2 3.9 ± 1.2 4.0 ± 1.2 3.9 ± 1.2 3.8 ± 1.2
CON 4.1 ± 1.6 4.0 ± 1.4 4.2 ± 1.5 4.3 ± 1.4 4.3 ± 1.5 4.1 ± 1.4 4.2 ± 1.5 4.1 ± 1.5 4.0 ± 1.3
VL Mmax (mV)
BFR 12.8 ± 3.8 12.7 ± 3.6 12.8 ± 3.5 12.8 ± 3.5 12.9 ± 3.6 12.3 ± 3.5 12.3 ± 3.5 11.9 ± 3.5 11.4 ± 3.5
CON 12.9 ± 3.8 12.2 ± 3.9 12.4 ± 3.7 12.5 ± 3.6 12.6 ± 3.7 11.8 ± 3.6 11.7 ± 3.7 11.5 ± 3.8 11.2 ± 4.0
VA (%)
BFR 95.9 ± 3.3 95.2 ± 2.3 90.4 ± 10.7 87.1 ± 12.7 86.0 ± 11.2* 88.4 ± 7.7* 90.1 ± 6.7* 89.3 ± 6.9* 90.3 ± 6.5*
CON 95.8 ± 3.2 94.6 ± 2.4 93.7 ± 2.2 92.8 ± 4.4 92.6 ± 4.4# 90.9 ± 4.0* 93.7 ± 2.2* 92.8 ± 4.4* 92.6 ± 4.4*
Values are expressed as mean ± standard deviation.
MVT, maximum voluntary torque; PS100, paired stimuli twitch torque at 100 Hz; PS10, paired stimuli twitch torque at 10 Hz; SS, single
stimulus twitch torque; PS10·PS100–1
ratio, index of low-frequency fatigue; Mmax, maximum M-wave; VM, vastus medialis; RF, rectus femoris;
VL, vastus lateralis; VA, voluntary activation; BFR, blood flow restriction condition; CON, control condition. Significantly different from Pre: *
P ≤ 0.050; significantly different from exercise termination (=Set 4): † P < 0.050; significantly different between groups: # P ≤ 0.050. Please
note that the statistics of the pairwise comparisons are presented in a reduced version to ensure clarity of the results. ACCEPTED
Copyright © 2017 by the American College of Sports Medicine. Unauthorized reproduction of this article is prohibited.
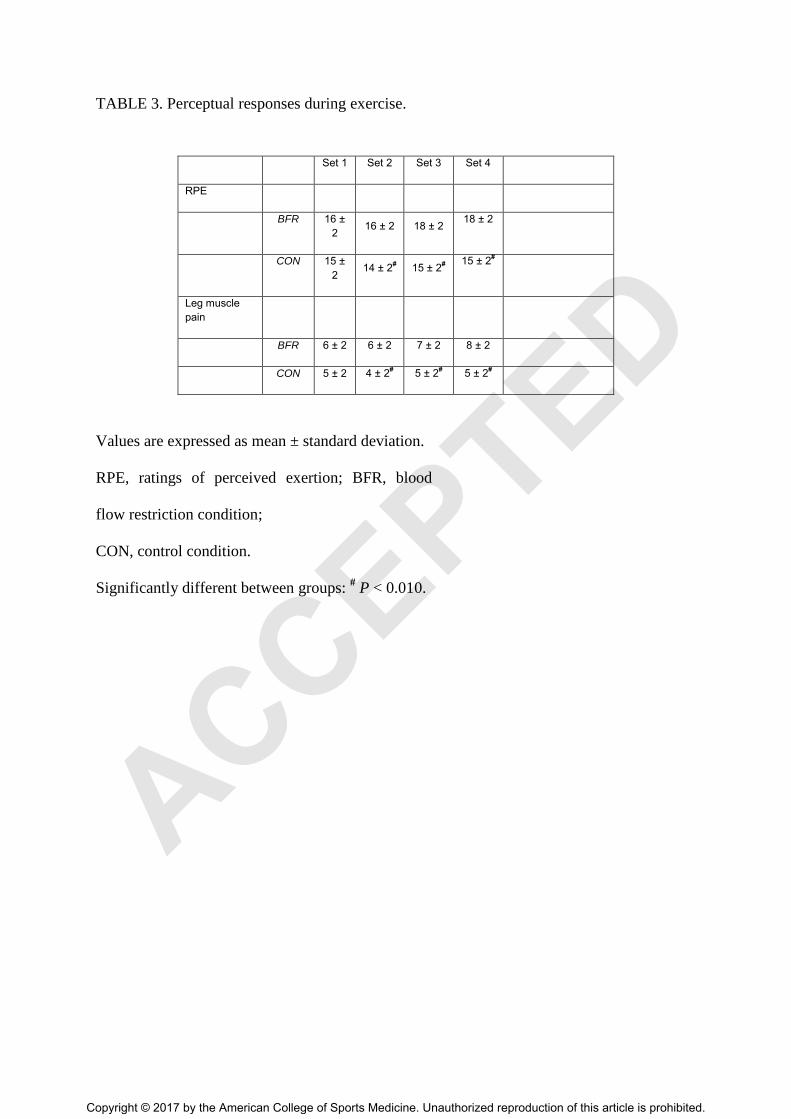
TABLE 3. Perceptual responses during exercise.
Set 1 Set 2 Set 3 Set 4
RPE
BFR 16 ±
2 16 ± 2 18 ± 2
18 ± 2
CON 15 ±
2 14 ± 2
# 15 ± 2
#
15 ± 2#
Leg muscle
pain
BFR 6 ± 2 6 ± 2 7 ± 2 8 ± 2
CON 5 ± 2 4 ± 2# 5 ± 2
# 5 ± 2
#
Values are expressed as mean ± standard deviation.
RPE, ratings of perceived exertion; BFR, blood
flow restriction condition;
CON, control condition.
Significantly different between groups: # P < 0.010.
ACCEPTED
Copyright © 2017 by the American College of Sports Medicine. Unauthorized reproduction of this article is prohibited.