Embed Size (px)
Citation preview
Aerosol and Air Quality Research, 19: 1188–1204, 2019 Copyright © Taiwan Association for Aerosol Research ISSN: 1680-8584 print / 2071-1409 online doi: 10.4209/aaqr.2018.08.0324
Impact of Biomass Burning in South and Southeast Asia on Background Aerosol in Southwest China Yuanxin Liang1, Huizheng Che1*, Ke Gui1, Yu Zheng1, Xianyi Yang1,2, Xiaopan Li1,2, Chao Liu1,3, Zhizhong Sheng1,2, Tianze Sun1, Xiaoye Zhang1
1 State Key Laboratory of Severe Weather (LASW) and Institute of Atmospheric Composition, Chinese Academy of Meteorological Sciences, CMA, Beijing 100081, China 2 Plateau Atmospheric and Environment Laboratory of Sichuan Province, College of Atmospheric Science, Chengdu University of Information Technology, Chengdu 610225, China 3 School of Surveying and Land Information Engineering, Henan Polytechnic University, Jiaozuo 454000, China ABSTRACT
Biomass burning (BB) in Southeast Asia is particularly pronounced during the dry season. However, the complex
topography and long-range transport inherent to Southeast Asia have limited local research on pollution resulting from BB. In this study, the monthly variation in aerosol optical properties at six sites in Southeast Asia (Chiang Mai, Mukdahan, Bac-Lieu, Penang, Singapore, and Bandung) and the fire-point distribution have been analyzed in detail. The Hybrid Single Particle Lagrangian Integrated Trajectory (HYSPLIT) model was used to simulate the 72-hour back-trajectory from the Shangri-La atmospheric background station in Yunnan Province, China. Our results showed that BB was more common on the Indochinese Peninsula from March to May, whereas it was more common on the Malay Archipelago from August to October due to the latitudinal difference and crop harvest season. Significant BB activity on the Indochinese Peninsula in March resulted in a high surge in extinction (AODt440nm = 1.32 ± 0.69, AODf440nm = 1.24 ± 0.59) by particles with a smaller diameter (AE = 1.68 ± 0.13) in Chiang Mai. Mapping the long-range transport of BB aerosols reveals that Shangri-La’s pollution was primarily affected by emissions from northern-central India (accounting for 45.2%), and Bangladesh and northern Myanmar (accounting for 38.7%), which indicates that the aerosol pollution on the Yunnan-Guizhou Plateau in springtime could have originated on the southern periphery of the Tibetan Plateau. The results also indicate that BB emission in Southeast Asia had a limited impact on pollution in Southwest China but a relatively large effect on local areas. This study is the first to analyze the trend of aerosols produced from BB in Southeast Asia via ground-based observation, which deepens our understanding of the potential effects of BB aerosols transported long-range from outside Southwest China. Keywords: Aerosol optical properties; Biomass burning; Southeast Asia; Yunnan-Guizhou Plateau. INTRODUCTION
Atmospheric aerosols from natural and anthropogenic sources have crucial effects on climate, air quality, and human health (Charlson et al., 1992; Tie et al., 2009; Matus et al., 2012). Li et al. (2017, 2018a) indicated the importance of aerosol-cloud interactions on cloud properties. In addition, climate change can indirectly affect aerosol spatial distribution influenced by total precipitation, as reported by Yang et al. (2010) and Yang et al. (2017). Biomass burning (BB) produces large amounts of aerosol * Corresponding author.
Tel.: 86-10-58993116; Fax: 86-10-62176414 E-mail address: [email protected]
particles, and emissions from BB can be transported widely across a region. Therefore, BB can have a marked impact on global climate (Andreae and Merlet, 2001; Streets et al., 2003; Marlon et al., 2008). BB occurs frequently in the tropics; Andreae et al. (2001) studied the transport of BB aerosols in the equatorial region, finding that they can be transported to the top of the troposphere through deep convection. In Africa, Ansmann et al. (2009) found that dust from the deserts of northern Africa and BB could be transported to South America. In China, Wang et al. (2015a) studied the impact of straw burning on regional aerosol properties in the North China Plain. BB during the dry seasons in Southeast Asia is commonplace, especially around the Indonesian island of Sumatra (Field et al., 2009). The large amount of haze produced during BB can cause severe fine-mode particulate pollution over a short period, and such pollution can harm human respiratory systems (Koe
Liang et al., Aerosol and Air Quality Research, 19: 1188–1204, 2019
1189
et al., 2001). Consequently, BB in Southeast Asia has a marked impact on regional environments, with long-range transportation of aerosol particles to southern China and East Asia in particular attracting scholars’ attention (Chan et al., 2000; Kondo, 2004; Tsay et al., 2016).
The Yunnan-Guizhou Plateau is characterized by a high altitude and low latitude, making it a unique climate (Zheng et al., 2008; Li et al., 2018b). Southwest China is affected by year-long intense solar radiation, which causes the region’s temperature to vary substantially from day to day. Wet and dry seasons exhibit completely different monthly temperature changes. The wet season (May–October) contributes 85% of annual rainfall, and during this time little direct sunlight reaches the surface (Qin et al., 2010). By contrast, the region has a monthly average of 20 days of sunshine during the dry season from November to April (Zheng et al., 2008). According to a previous study (Zhu et al., 2016), the unique topography, regional climate, and long-distance transport make the properties of aerosol in Southwest China differ from those of other areas. The county-level city of Shangri-La is located on the northwestern Yunnan-Guizhou Plateau, connected with the Tibetan Plateau, and lies at an average elevation of 3300 m. The air quality is good under clear conditions, with few sources of local pollution, the majority being from external transport (Zhang et al., 2012a; Gao et al., 2013). Therefore, we can speculate aerosol absorption process may lead to varied aerosol properties in the dry and wet seasons.
Southeast Asia comprises the Indochinese Peninsula and Malay Archipelago. The Indochinese Peninsula (comprising Vietnam, Laos, Cambodia, Thailand, and Myanmar) has a tropical monsoon climate with a high annual temperature. The region has wet and dry seasons, with the wet season running from June to August. Crops are usually planted in the wet season and harvested in the dry season. The Malay Archipelago (including Malaysia, Singapore, and Indonesia) has a tropical rainforest climate with high annual temperatures and adequate rainfall (Manton et al., 2001); rainfall occurs more frequently from November to January. In this region, tropical rainforests are widely distributed and crops are planted year round and can be harvested in all seasons.
Atmospheric aerosol optical depth (AOD) and Ångström exponent (AE) are two basic parameters for studying the optical properties of aerosol (Che et al., 2013; Yu et al., 2015). The atmospheric AOD reflects the degree of extinction of solar radiation by particles across the entire atmosphere, and it is a key parameter for evaluating atmospheric particulate pollution and aerosol radiation effects (Zheng et al., 2018). AE is a vital optical parameter for qualitatively measuring aerosol particle size, and it can be used to initially distinguish aerosol types. Single-scattering albedo (SSA), asymmetry factor, fine-mode aerosol fraction, and particle volume size distributions are also primary parameters of aerosol optical properties (Che et al., 2015b). Numerous studies have demonstrated that BB aerosols make a vital contribution to air pollution in Asia (Deng et al., 2008; Deka and Hoque, 2014). Some studies have determined that aerosol and gases from BB in South and
Southeast Asia can be transported to southeastern China and the northwestern Pacific (Jacob, 2003; Zhang et al., 2012b). Aerosol chemical composition data analysis (Wei and Liu, 1994; Streets et al., 2003) has ascertained that BB aerosols can travel far and reach Southwest China. However, due to the large regional span, its complex geographical features, and the lack of ground-based observations in some areas, few studies have directly examined the impact of BB emissions from South and Southeast Asia on air quality and regional climate in Southwest China.
This study is the first to analyze the trend of aerosols produced from BB in Southeast Asia on the basis of ground-based observed AOD and investigate the BB aerosol impact on Southwest China (Che et al., 2014). In order to consider topographical factors (Venkataraman et al., 2005; Engling et al., 2011), we choose the Shangri-La (Yunnan Province, China) atmospheric background station, which can be used to represent the changes of background aerosols in Southwest China, combined with European Centre for Medium-Range Weather Forecasts (ECMWF) wind field data, the Moderate Resolution Imaging Spectroradiometer (MODIS) satellite data, and particulate pollution 72-hour back-trajectory modeling. The findings are scientific significance of the sources of spring pollutants in Southwest China and changes in aerosol optical properties during the biomass burning in Southeast Asia. The remainder of this paper is structured as follows: “Introduction” summarizes the research on BB, the climatic conditions of the Yunnan-Guizhou Plateau and Southeast Asia, and the challenges of investigating BB in Southeast Asia. “Data and methodology” introduces the research location, observation instruments, and data source. In Section 3, the monthly aerosol optical properties in Southeast Asia are analyzed. In Section 4, the aerosol optical properties and sources of spring pollutants in Shangri-La are analyzed. Finally, Section 5 presents the discussion and conclusions. DATA AND METHODOLOGY Site Information
The county-level city of Shangri-La is located in the Diqing Tibetan Autonomous Prefecture of Yunnan Province, China, and it borders the provinces of Sichuan and Tibet. Shangri-La is located on the eastern edge of the Tibetan Plateau; it is east of the Sanjiang area’s longitudinal valley and to the southeast of the Hengduan Mountains. The overall trend of the geography is northwest high and southeast low, with an average altitude of 3459 m (Fig. 1). The atmospheric background observation station (28.01°N, 99.44°E) used for data collection in this study is located on the top of a hill 12 km northeast of Shangri-La. The observation field is 3583 m above sea level and was completed in 2009 (Wang et al., 2015b). It is one of the key atmospheric background observation stations in China and a member of the World Meteorological Organization’s Global Atmosphere Network. The atmospheric background observation station in Shangri-La is the most advanced in China; thus, it can accurately measure the background atmospheric environment in Southwest China and reflect
Liang et al., Aerosol and Air Quality Research, 19: 1188–1204, 2019
1190
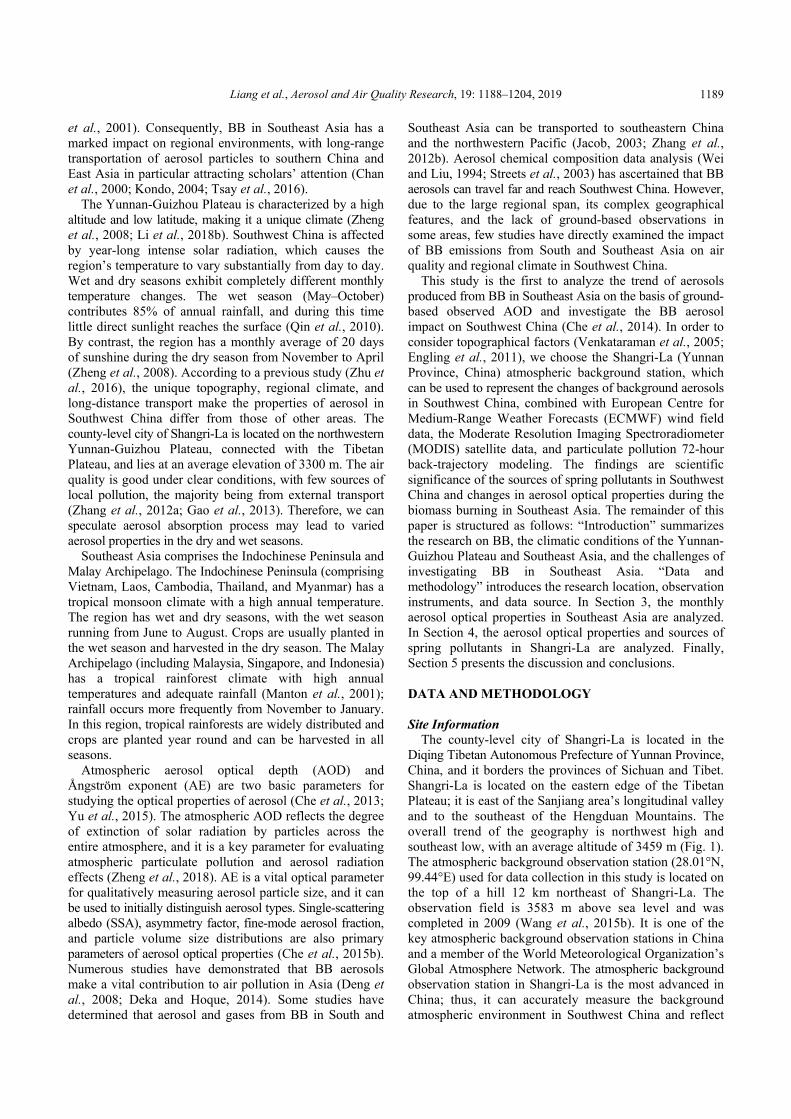
Fig. 1. Distribution of observation stations in Southeast Asia and Southwest China.
any changes in atmospheric composition (Zhang et al., 2012a).
As shown in Fig. 1, based on the latitude distribution (from north to south), long-term data observation and dense fire-point areas, the six selected observation sites in Southeast Asia were as follows: Chiang Mai, Thailand (18.77°N, 98.97°E); Mukdahan, Thailand (16.61°N, 104.68°E); Bac-Lieu, Vietnam (9.28°N, 105.73°E); Penang, Malaysia (5.36°N, 100.30°E); Singapore (1.30°N, 103.78°E); and Bandung, Indonesia (6.89°S, 107.61°E). Detailed information regarding these locations is presented in Table 1. Data and Methodology
The aerosol optical properties in this study were derived from AERONET (http://aeronet.gsfc.nasa.gov/), which is developed and supported by the U.S. National Aeronautics and Space Administration, using the direct radiation observation data and scattered radiation observation data (Holben et al., 1998; Dubovik et al., 2000). The AOD used in this study was version 3 of the Direct Sun Algorithm with Level 1.5 Cloud Filtering. Shangri-La data comes from the China Aerosol Remote Sensing Network (CARSNET) using CE318 sun photometers (Che et al., 2009). This is an automatic multispectral sun tracking photometer, designed for accurate sun measurements (Che et al., 2008). Sun photometers are basic instruments used for observing the optical properties of the atmosphere (Estellés et al., 2012). Employing eight observation channels measured direct solar radiation data using the CE318 sun photometer can be used to inversely calculate atmospheric transmittance, AOD, total amount of atmospheric water vapor, and total amount of ozone. Moreover, CE318 sun photometers can be used to survey the entire columnar atmosphere in the vertical direction, obtain column-integrated aerosol optical properties, and verify aerosol parameters retrieved by
satellites (Dubovik and King, 2000). We applied the Hybrid Single Particle Lagrangian
Integrated Trajectory (HYSPLIT) model (Stein et al., 2015) in MeteoInfo (Wang, 2014) to conduct 72-hour back-trajectory analysis from March 1, 2012, to May 30, 2012, in Shangri-La. The clustering mode was employed to cluster the main back trajectory according to the velocity and direction of the air mass.
Wind field data were derived from reanalysis of the ECMWF (http://apps.ecmwf.int/datasets/). The wind field changes were illustrated using the monthly average wind direction and speed data at 850, 700, and 500 hPa from March to May 2012.
Fire count maps were obtained from MODIS satellite (https://modis.gsfc.nasa.gov/data/) images, which display areas that were burning at the time of overpass. The MODIS electromagnetic spectrum distribution is 0.4–0.14 nm, with resolutions of 250, 500, and 1000 m, and acquires global data four times per day; therefore, it can accurately monitor forest fire points (Giglio, 2013).
RESULTS AND DISCUSSION Monthly Variation in Aerosol Optical Properties in Southeast Asia Variation in AOD
In this section, the changes in daily average AOD data at the six selected stations in Southeast Asia (Chiang Mai, Mukdahan, Bac-Lieu, Penang, Singapore, and Bandung) are analyzed. As shown in Figs. 2(a)–2(b), AOD at 440 nm in the six areas was larger than AOD at other wavelengths, and the optical depth decreased with increasing wavelength in accordance with the variation in AOD in urban aerosol (Eck et al., 1999). In mainland Asia, anthropogenic aerosol particle emissions tend to exhibit greater wavelength-selective attenuation of sunlight than do larger particles
Liang et al., Aerosol and Air Quality Research, 19: 1188–1204, 2019
1191
Table 1. The information of stations in Southeast Asia.
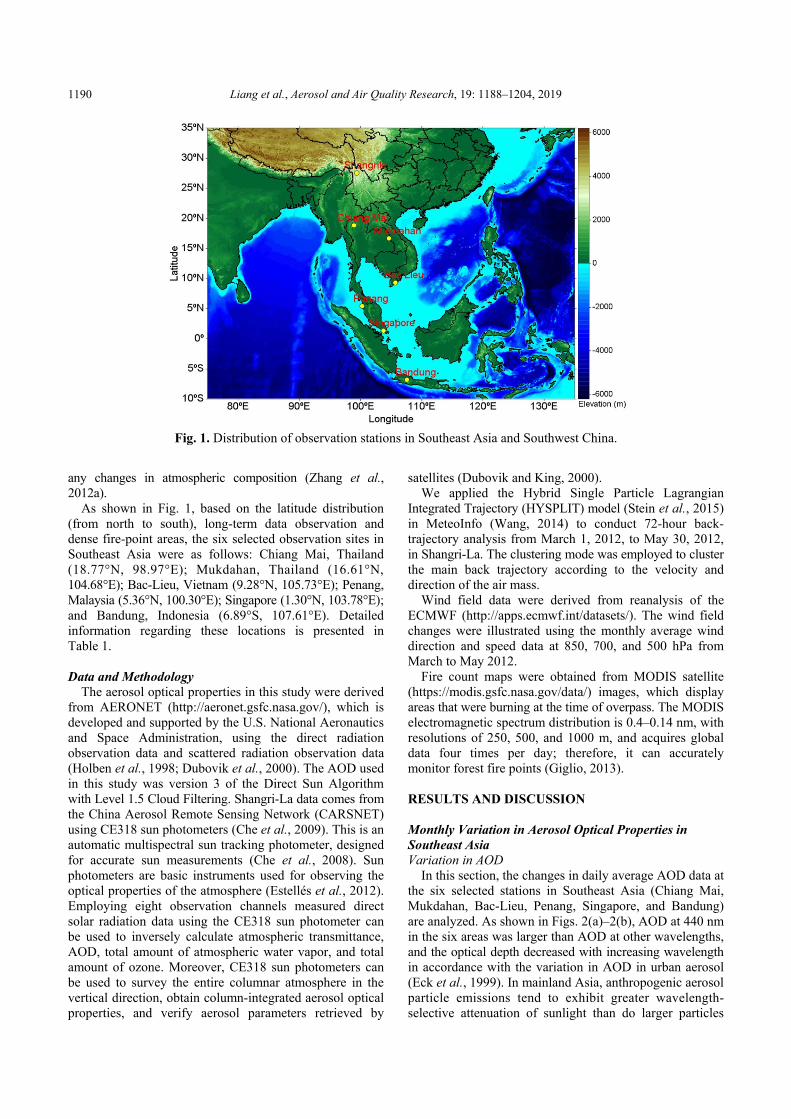
Station Country Latitude Longitude Altitude (m) Starting Time Chiang Mai Thailand 18.77°N 98.97°E 312.0 2006 Mukdahan Thailand 16.61°N 104.68°E 166.0 2003 Bac-Lieu Vietnam 9.28°N 105.73°E 10.0 2003 Penang Malaysia 5.36°N 100.30°E 51.0 2011 Singapore Singapore 1.30°N 103.78°E 30.0 2006 Bandung Indonesia 6.89°S 107.61°E 826.0 2009
(a)
Fig. 2. Box plots depicting monthly variation of AOD at 440 nm, 675 nm, 870 nm, and 1020 nm wavelengths at six stations in Southeast Asia: (a) Chiang Mai, Mukdahan, and Bac-lieu and (b) Penang, Singapore, and Bandung. The central line in each box is the median, and the lower and upper limits are the first and third quartiles, respectively. The lines extending vertically from the box indicate the spread of the distribution with the length being 1.5 times the difference between the first and third quartiles. The square symbols indicate the geometric means.

Liang et al., Aerosol and Air Quality Research, 19: 1188–1204, 2019
1192
(b)
Fig. 2. (continued).
such as dust aerosol (Che et al., 2015a). Therefore, this study focused on AOD changes at 440 nm. In sunny conditions, AOD440nm should be less than 0.50; AOD440nm greater than 1.0 indicates poor air quality and polluted weather with abundant particulates.
Chiang Mai, Mukdahan, and Bac-Lieu are all located on the Indochinese Peninsula and exhibited approximately equal AOD changes (Fig. 2(a)): From January to March, AOD440nm increased significantly, peaking in March (Chiang Mai: 1.32 ± 0.69; Mukdahan: 0.98 ± 0.38); this finding is consistent with the peak in AOD500nm (PM2.5 = 120 µg·m–3) on April 3, 2014, in Chiang Mai (Pani et al., 2018). From March to May, AOD440nm decreased gradually but remained
above the mean value. AOD440nm values were lowest during the wet season (June–August) before markedly increasing from September to November. This trend was most obvious in Thailand, with two peaks in the monsoon rainfall season. This finding is consistent with the results of Gautam et al. (2013). Overall, AOD440nm on the Indochinese Peninsula varies depending on the timing of the rainy season and thus follows a strong seasonal cycle. However, the overall value at Bac-Lieu was lower than at the other two stations, indicating higher air quality.
Penang, Singapore, and Bandung are located on the Malay Archipelago and all exhibited approximately equivalent changes (Fig. 2(b)): AOD440nm varied little from
Liang et al., Aerosol and Air Quality Research, 19: 1188–1204, 2019
1193
January to July and increased significantly from August to October; however, only the October AOD440nm average value of Penang (1.07 ± 1.36) was higher than 1.0. AOD440nm values were lowest during the wet season (November–January). Notably, the three areas’ variation tendencies differed: Changes in AOD440nm in Penang were relatively flat in August and September but more prominent in October, AOD440nm in Singapore was highest in September and October, and AOD440nm fluctuation in Bandung was low from January to October. Variation in Fine-mode AOD
The total aerosol optical depth (AOD-T) can be further divided into fine-mode particle extinction optical depth (AOD-F) and coarse-mode particle extinction optical depth (AOD-C). The distribution of aerosols from a 1997 Indonesian forest fire indicated that BB produces numerous fine particles, known as black carbon aerosol (Narukawa et al., 1999). Whether the fine particulate matter is the dominant particle in aerosol can be determined by analyzing the proportion of fine-mode particles in the total AOD.
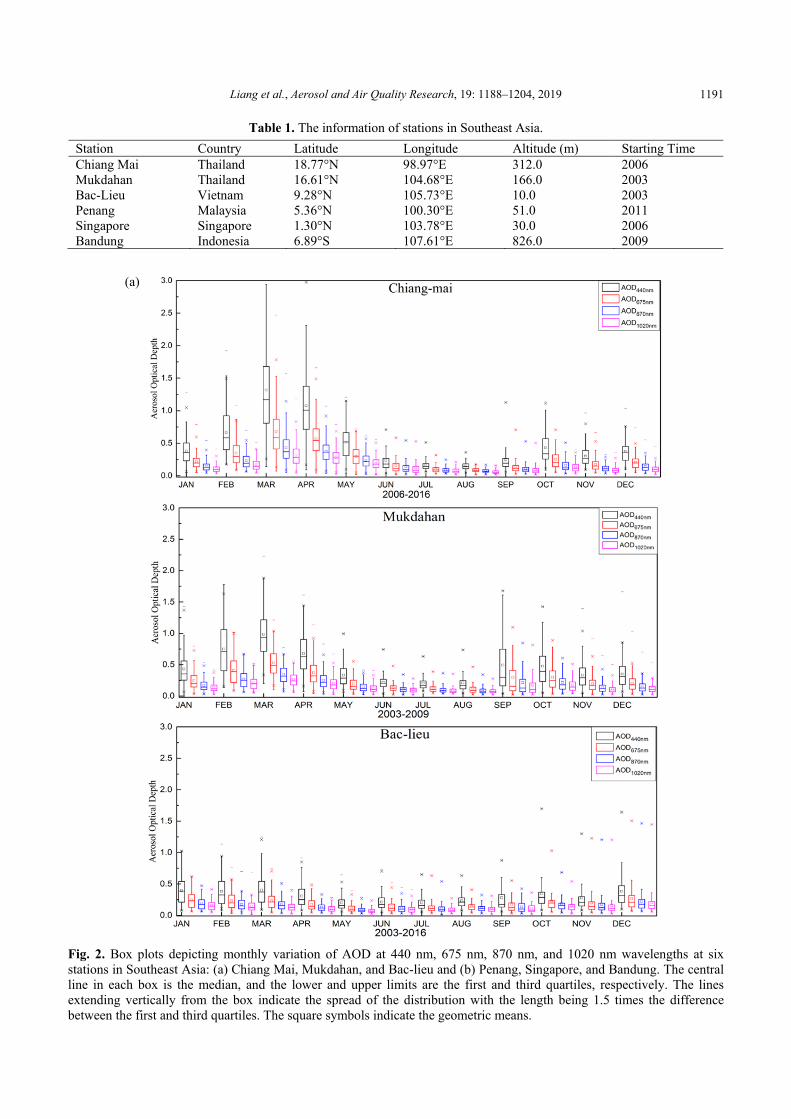
Fig. 3 illustrates that in Chiang Mai, Thailand, the maximum FAOD440nm was 1.24 ± 0.59 in March, and the minimum was 0.12 ± 0.06 in August. After the rainy season, FAOD440nm fluctuated from September to November but peaked in October (0.44 ± 0.23), indicating that fine-mode particles dominated from February to May with another fine-mode particle increase from September to November. Changes in the Mukdahan area largely mirrored those in Chiang Mai. In Bac-Lieu, Penang, and Singapore, the fine-mode particles exhibited a significant increase from August to October, with peaks occurring in mostly September or October (Bac-Lieu: 0.30 ± 0.29 in September; Penang: 0.758 ± 0.80 in September, 0.756 ± 0.89 in October;
Singapore 0.87 ± 0.57 in October). However, the overall FAOD440nm value (0.25 ± 0.07) in Bac-Lieu was low; combined with AOD440nm (0.30 ± 0.08), fine-mode particles still dominated in this area’s air pollution. Variation in AE
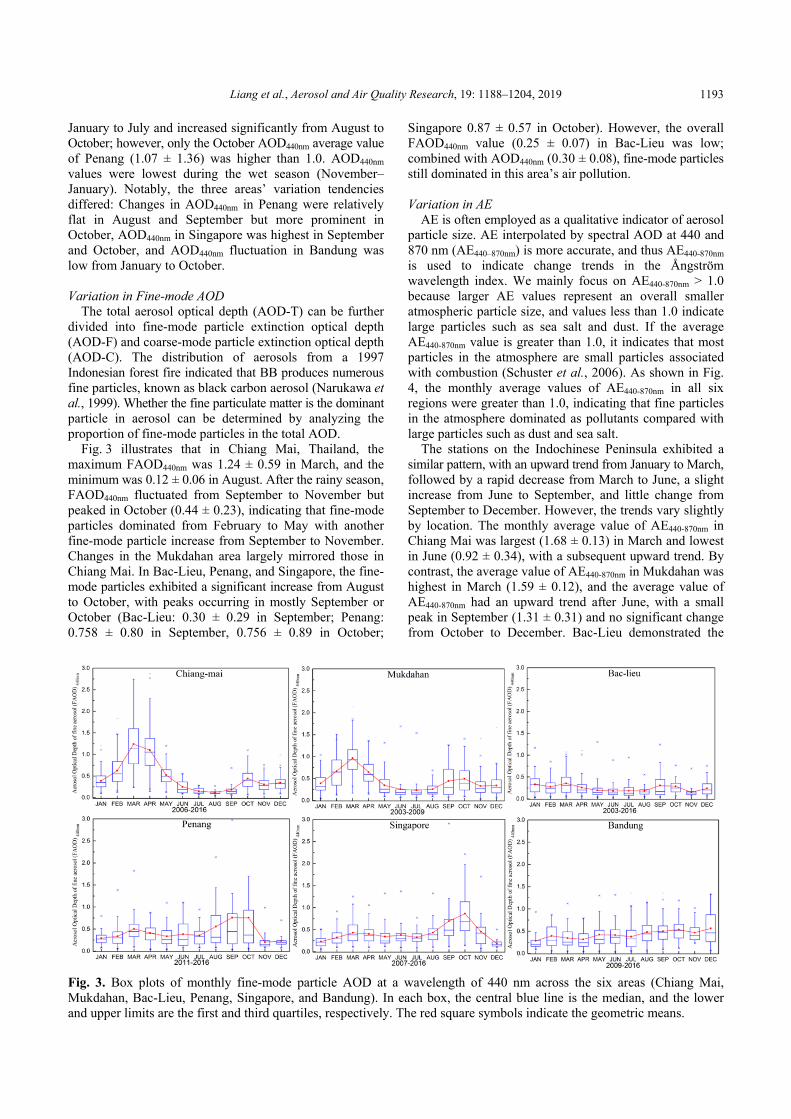
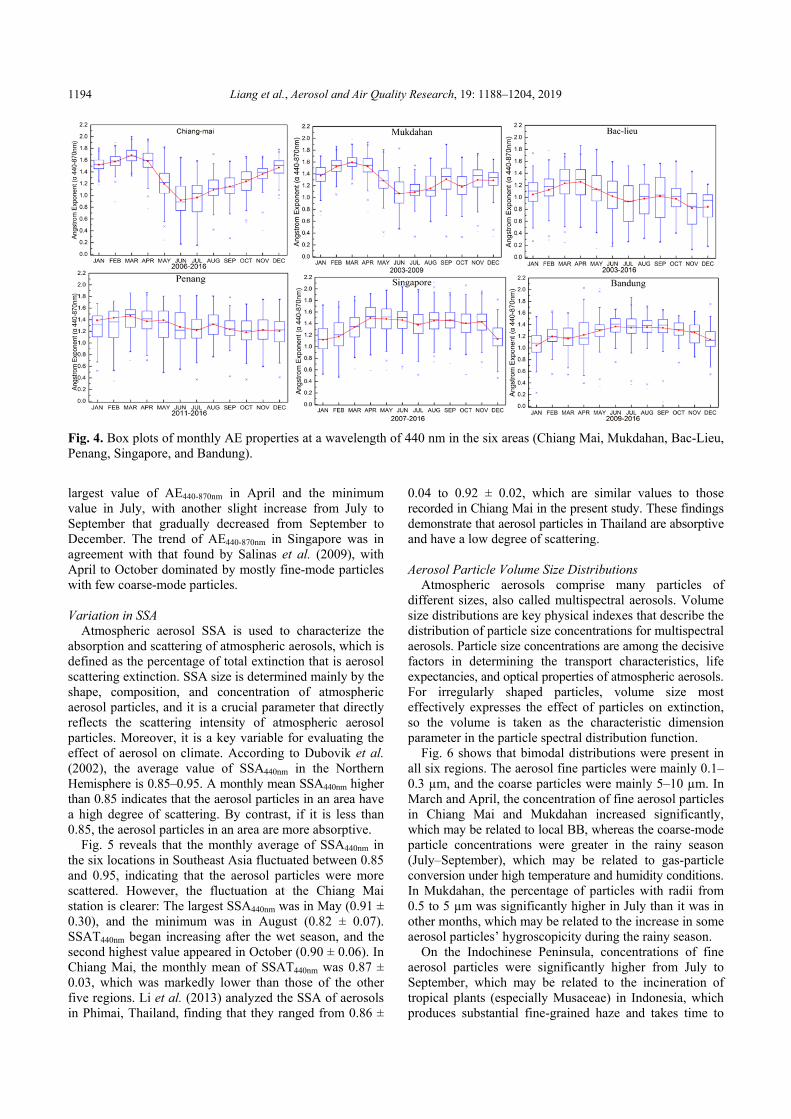
AE is often employed as a qualitative indicator of aerosol particle size. AE interpolated by spectral AOD at 440 and 870 nm (AE440–870nm) is more accurate, and thus AE440-870nm is used to indicate change trends in the Ångström wavelength index. We mainly focus on AE440-870nm > 1.0 because larger AE values represent an overall smaller atmospheric particle size, and values less than 1.0 indicate large particles such as sea salt and dust. If the average AE440-870nm value is greater than 1.0, it indicates that most particles in the atmosphere are small particles associated with combustion (Schuster et al., 2006). As shown in Fig. 4, the monthly average values of AE440-870nm in all six regions were greater than 1.0, indicating that fine particles in the atmosphere dominated as pollutants compared with large particles such as dust and sea salt.
The stations on the Indochinese Peninsula exhibited a similar pattern, with an upward trend from January to March, followed by a rapid decrease from March to June, a slight increase from June to September, and little change from September to December. However, the trends vary slightly by location. The monthly average value of AE440-870nm in Chiang Mai was largest (1.68 ± 0.13) in March and lowest in June (0.92 ± 0.34), with a subsequent upward trend. By contrast, the average value of AE440-870nm in Mukdahan was highest in March (1.59 ± 0.12), and the average value of AE440-870nm had an upward trend after June, with a small peak in September (1.31 ± 0.31) and no significant change from October to December. Bac-Lieu demonstrated the
Fig. 3. Box plots of monthly fine-mode particle AOD at a wavelength of 440 nm across the six areas (Chiang Mai, Mukdahan, Bac-Lieu, Penang, Singapore, and Bandung). In each box, the central blue line is the median, and the lower and upper limits are the first and third quartiles, respectively. The red square symbols indicate the geometric means.
Liang et al., Aerosol and Air Quality Research, 19: 1188–1204, 2019
1194
Fig. 4. Box plots of monthly AE properties at a wavelength of 440 nm in the six areas (Chiang Mai, Mukdahan, Bac-Lieu, Penang, Singapore, and Bandung).
largest value of AE440-870nm in April and the minimum value in July, with another slight increase from July to September that gradually decreased from September to December. The trend of AE440-870nm in Singapore was in agreement with that found by Salinas et al. (2009), with April to October dominated by mostly fine-mode particles with few coarse-mode particles. Variation in SSA
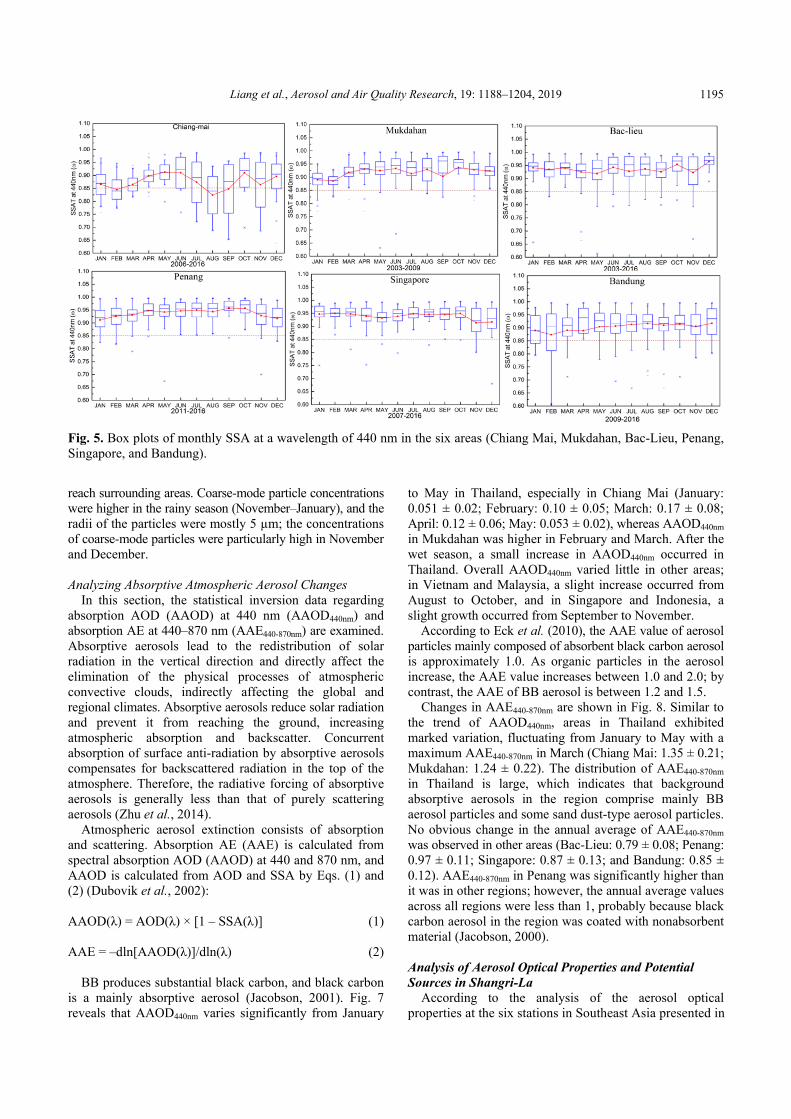
Atmospheric aerosol SSA is used to characterize the absorption and scattering of atmospheric aerosols, which is defined as the percentage of total extinction that is aerosol scattering extinction. SSA size is determined mainly by the shape, composition, and concentration of atmospheric aerosol particles, and it is a crucial parameter that directly reflects the scattering intensity of atmospheric aerosol particles. Moreover, it is a key variable for evaluating the effect of aerosol on climate. According to Dubovik et al. (2002), the average value of SSA440nm in the Northern Hemisphere is 0.85–0.95. A monthly mean SSA440nm higher than 0.85 indicates that the aerosol particles in an area have a high degree of scattering. By contrast, if it is less than 0.85, the aerosol particles in an area are more absorptive.
Fig. 5 reveals that the monthly average of SSA440nm in the six locations in Southeast Asia fluctuated between 0.85 and 0.95, indicating that the aerosol particles were more scattered. However, the fluctuation at the Chiang Mai station is clearer: The largest SSA440nm was in May (0.91 ± 0.30), and the minimum was in August (0.82 ± 0.07). SSAT440nm began increasing after the wet season, and the second highest value appeared in October (0.90 ± 0.06). In Chiang Mai, the monthly mean of SSAT440nm was 0.87 ± 0.03, which was markedly lower than those of the other five regions. Li et al. (2013) analyzed the SSA of aerosols in Phimai, Thailand, finding that they ranged from 0.86 ±
0.04 to 0.92 ± 0.02, which are similar values to those recorded in Chiang Mai in the present study. These findings demonstrate that aerosol particles in Thailand are absorptive and have a low degree of scattering.
Aerosol Particle Volume Size Distributions
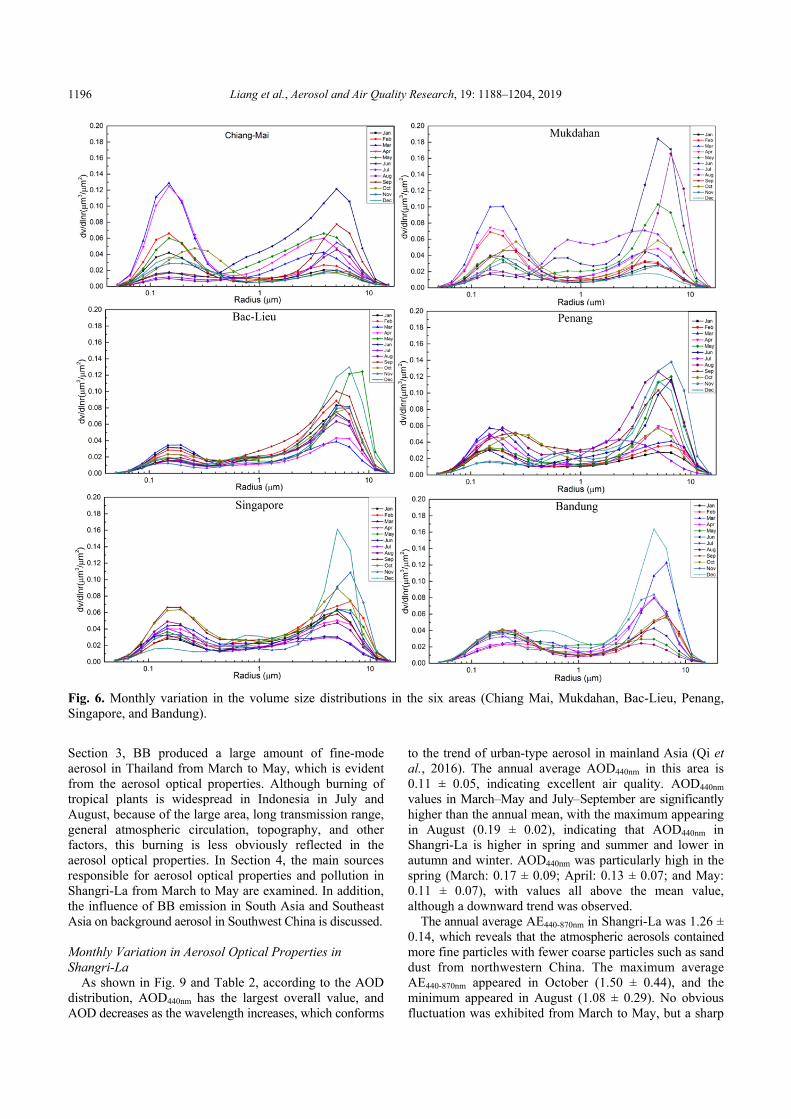
Atmospheric aerosols comprise many particles of different sizes, also called multispectral aerosols. Volume size distributions are key physical indexes that describe the distribution of particle size concentrations for multispectral aerosols. Particle size concentrations are among the decisive factors in determining the transport characteristics, life expectancies, and optical properties of atmospheric aerosols. For irregularly shaped particles, volume size most effectively expresses the effect of particles on extinction, so the volume is taken as the characteristic dimension parameter in the particle spectral distribution function.
Fig. 6 shows that bimodal distributions were present in all six regions. The aerosol fine particles were mainly 0.1–0.3 µm, and the coarse particles were mainly 5–10 µm. In March and April, the concentration of fine aerosol particles in Chiang Mai and Mukdahan increased significantly, which may be related to local BB, whereas the coarse-mode particle concentrations were greater in the rainy season (July–September), which may be related to gas-particle conversion under high temperature and humidity conditions. In Mukdahan, the percentage of particles with radii from 0.5 to 5 µm was significantly higher in July than it was in other months, which may be related to the increase in some aerosol particles’ hygroscopicity during the rainy season.
On the Indochinese Peninsula, concentrations of fine aerosol particles were significantly higher from July to September, which may be related to the incineration of tropical plants (especially Musaceae) in Indonesia, which produces substantial fine-grained haze and takes time to
Liang et al., Aerosol and Air Quality Research, 19: 1188–1204, 2019
1195
Fig. 5. Box plots of monthly SSA at a wavelength of 440 nm in the six areas (Chiang Mai, Mukdahan, Bac-Lieu, Penang, Singapore, and Bandung).
reach surrounding areas. Coarse-mode particle concentrations were higher in the rainy season (November–January), and the radii of the particles were mostly 5 µm; the concentrations of coarse-mode particles were particularly high in November and December. Analyzing Absorptive Atmospheric Aerosol Changes
In this section, the statistical inversion data regarding absorption AOD (AAOD) at 440 nm (AAOD440nm) and absorption AE at 440–870 nm (AAE440-870nm) are examined. Absorptive aerosols lead to the redistribution of solar radiation in the vertical direction and directly affect the elimination of the physical processes of atmospheric convective clouds, indirectly affecting the global and regional climates. Absorptive aerosols reduce solar radiation and prevent it from reaching the ground, increasing atmospheric absorption and backscatter. Concurrent absorption of surface anti-radiation by absorptive aerosols compensates for backscattered radiation in the top of the atmosphere. Therefore, the radiative forcing of absorptive aerosols is generally less than that of purely scattering aerosols (Zhu et al., 2014).
Atmospheric aerosol extinction consists of absorption and scattering. Absorption AE (AAE) is calculated from spectral absorption AOD (AAOD) at 440 and 870 nm, and AAOD is calculated from AOD and SSA by Eqs. (1) and (2) (Dubovik et al., 2002): AAOD(λ) = AOD(λ) × [1 – SSA(λ)] (1) AAE = –dln[AAOD(λ)]/dln(λ) (2)
BB produces substantial black carbon, and black carbon is a mainly absorptive aerosol (Jacobson, 2001). Fig. 7 reveals that AAOD440nm varies significantly from January
to May in Thailand, especially in Chiang Mai (January: 0.051 ± 0.02; February: 0.10 ± 0.05; March: 0.17 ± 0.08; April: 0.12 ± 0.06; May: 0.053 ± 0.02), whereas AAOD440nm in Mukdahan was higher in February and March. After the wet season, a small increase in AAOD440nm occurred in Thailand. Overall AAOD440nm varied little in other areas; in Vietnam and Malaysia, a slight increase occurred from August to October, and in Singapore and Indonesia, a slight growth occurred from September to November.
According to Eck et al. (2010), the AAE value of aerosol particles mainly composed of absorbent black carbon aerosol is approximately 1.0. As organic particles in the aerosol increase, the AAE value increases between 1.0 and 2.0; by contrast, the AAE of BB aerosol is between 1.2 and 1.5.
Changes in AAE440-870nm are shown in Fig. 8. Similar to the trend of AAOD440nm, areas in Thailand exhibited marked variation, fluctuating from January to May with a maximum AAE440-870nm in March (Chiang Mai: 1.35 ± 0.21; Mukdahan: 1.24 ± 0.22). The distribution of AAE440-870nm in Thailand is large, which indicates that background absorptive aerosols in the region comprise mainly BB aerosol particles and some sand dust-type aerosol particles. No obvious change in the annual average of AAE440-870nm was observed in other areas (Bac-Lieu: 0.79 ± 0.08; Penang: 0.97 ± 0.11; Singapore: 0.87 ± 0.13; and Bandung: 0.85 ± 0.12). AAE440-870nm in Penang was significantly higher than it was in other regions; however, the annual average values across all regions were less than 1, probably because black carbon aerosol in the region was coated with nonabsorbent material (Jacobson, 2000). Analysis of Aerosol Optical Properties and Potential Sources in Shangri-La
According to the analysis of the aerosol optical properties at the six stations in Southeast Asia presented in
Liang et al., Aerosol and Air Quality Research, 19: 1188–1204, 2019
1196
Fig. 6. Monthly variation in the volume size distributions in the six areas (Chiang Mai, Mukdahan, Bac-Lieu, Penang, Singapore, and Bandung).
Section 3, BB produced a large amount of fine-mode aerosol in Thailand from March to May, which is evident from the aerosol optical properties. Although burning of tropical plants is widespread in Indonesia in July and August, because of the large area, long transmission range, general atmospheric circulation, topography, and other factors, this burning is less obviously reflected in the aerosol optical properties. In Section 4, the main sources responsible for aerosol optical properties and pollution in Shangri-La from March to May are examined. In addition, the influence of BB emission in South Asia and Southeast Asia on background aerosol in Southwest China is discussed. Monthly Variation in Aerosol Optical Properties in Shangri-La
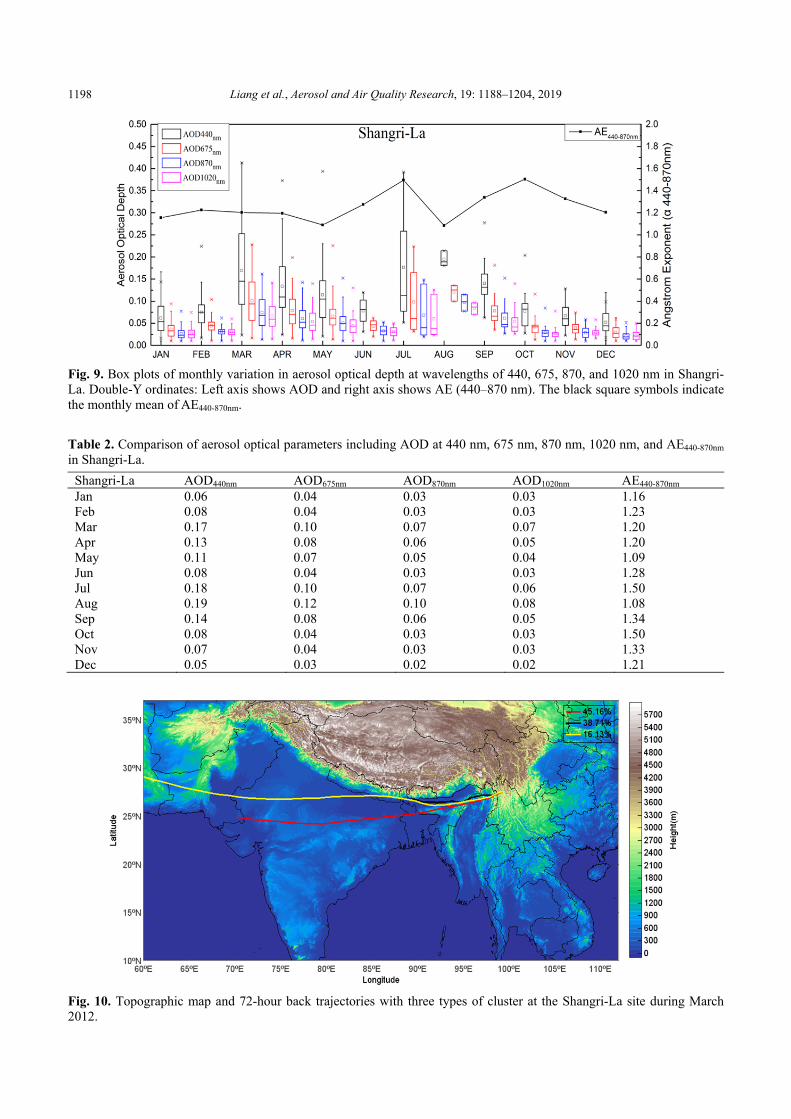
As shown in Fig. 9 and Table 2, according to the AOD distribution, AOD440nm has the largest overall value, and AOD decreases as the wavelength increases, which conforms
to the trend of urban-type aerosol in mainland Asia (Qi et al., 2016). The annual average AOD440nm in this area is 0.11 ± 0.05, indicating excellent air quality. AOD440nm values in March–May and July–September are significantly higher than the annual mean, with the maximum appearing in August (0.19 ± 0.02), indicating that AOD440nm in Shangri-La is higher in spring and summer and lower in autumn and winter. AOD440nm was particularly high in the spring (March: 0.17 ± 0.09; April: 0.13 ± 0.07; and May: 0.11 ± 0.07), with values all above the mean value, although a downward trend was observed.
The annual average AE440-870nm in Shangri-La was 1.26 ± 0.14, which reveals that the atmospheric aerosols contained more fine particles with fewer coarse particles such as sand dust from northwestern China. The maximum average AE440-870nm appeared in October (1.50 ± 0.44), and the minimum appeared in August (1.08 ± 0.29). No obvious fluctuation was exhibited from March to May, but a sharp

Liang et al., Aerosol and Air Quality Research, 19: 1188–1204, 2019
1197
Fig. 7. Box plots of monthly AAOD at a wavelength of 440 nm in the six areas (Chiang Mai, Mukdahan, Bac-Lieu, Penang, Singapore, and Bandung).
Fig. 8. Box plots of monthly variation in AAE in the six areas (Chiang Mai, Mukdahan, Bac-Lieu, Penang, Singapore, and Bandung).
fluctuation was noted from June to October; these findings indicated that most pollutants were fine particles that are more prevalent during the spring. The values for AE440-870nm in March (1.20 ± 0.37), April (1.20 ± 0.33), and May (1.09 ± 0.41) demonstrated that the trend of AE440-870nm for this period was the same as that of AOD, with fine particles in the atmosphere dominating. However, AE440-870nm was slightly lower in May, which may be because of more rainfall in May and increased humidity leading to hygroscopic growth in aerosol. Alternatively, more dust
may have been transported from the Middle East; either of these reasons could cause a decline in the mean value of AE440-870nm. Analysis of the Sources of Pollutants in Shangri-La from March to May
Particle back-trajectory analysis of the Shangri-La region in March to May 2012 (Fig. 10) revealed that pollutants over the 72-hour period were primarily from northern Indian, Bangladesh, and northern Myanmar and were transmitted
Liang et al., Aerosol and Air Quality Research, 19: 1188–1204, 2019
1198
Fig. 9. Box plots of monthly variation in aerosol optical depth at wavelengths of 440, 675, 870, and 1020 nm in Shangri-La. Double-Y ordinates: Left axis shows AOD and right axis shows AE (440–870 nm). The black square symbols indicate the monthly mean of AE440-870nm.
Table 2. Comparison of aerosol optical parameters including AOD at 440 nm, 675 nm, 870 nm, 1020 nm, and AE440-870nm in Shangri-La.
Shangri-La AOD440nm AOD675nm AOD870nm AOD1020nm AE440-870nm Jan 0.06 0.04 0.03 0.03 1.16 Feb 0.08 0.04 0.03 0.03 1.23 Mar 0.17 0.10 0.07 0.07 1.20 Apr 0.13 0.08 0.06 0.05 1.20 May 0.11 0.07 0.05 0.04 1.09 Jun 0.08 0.04 0.03 0.03 1.28 Jul 0.18 0.10 0.07 0.06 1.50 Aug 0.19 0.12 0.10 0.08 1.08 Sep 0.14 0.08 0.06 0.05 1.34 Oct 0.08 0.04 0.03 0.03 1.50 Nov 0.07 0.04 0.03 0.03 1.33 Dec 0.05 0.03 0.02 0.02 1.21
Fig. 10. Topographic map and 72-hour back trajectories with three types of cluster at the Shangri-La site during March 2012.
Liang et al., Aerosol and Air Quality Research, 19: 1188–1204, 2019
1199
along the southern periphery of the Tibetan Plateau. Indo-Asian pollution has a great influence on Southwest China (45.16%), which is consistent with previous research on the great Indo-Asian haze (Ramanathan et al., 2001). Due to the uplift area of the Tibetan Plateau, potential pollution sources from as far as the Middle East and North Africa
can be transported to Southwest China (Xin et al., 2016). However, apart from northern Myanmar, few trajectories are from Southeast Asia, and therefore pollution from BB in northern Thailand has limited effect on Shangri-La.
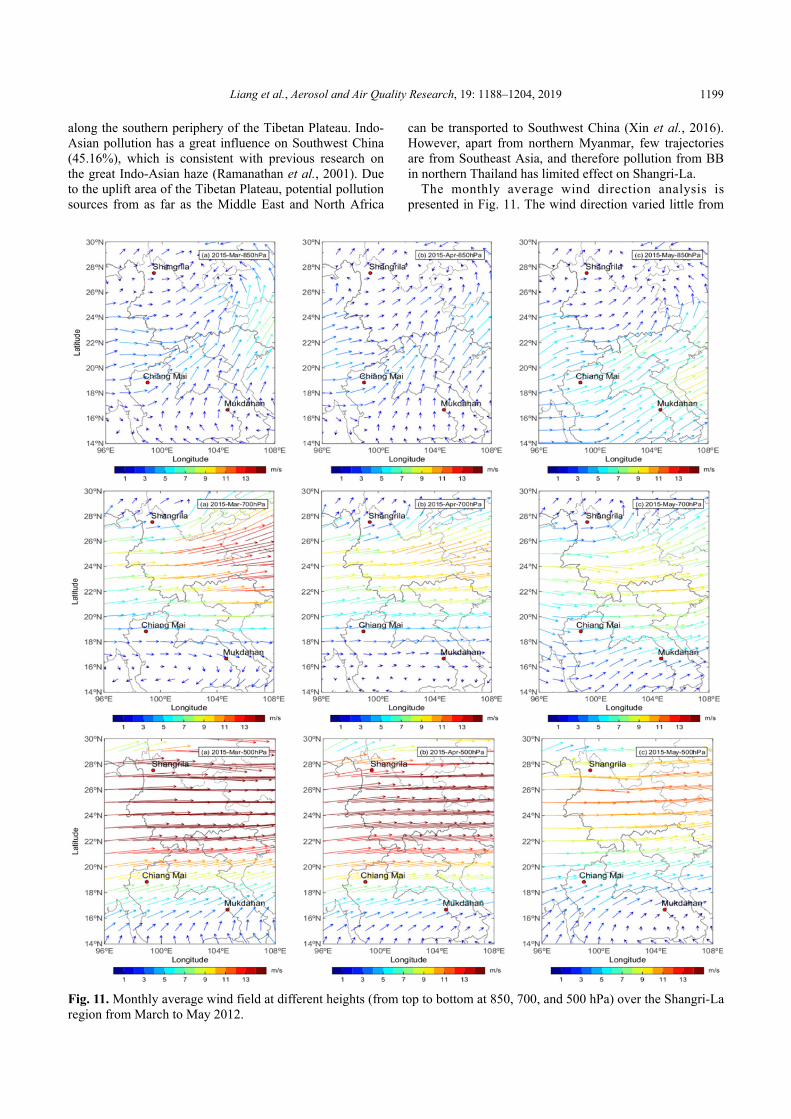
The monthly average wind direction analysis is presented in Fig. 11. The wind direction varied little from
Fig. 11. Monthly average wind field at different heights (from top to bottom at 850, 700, and 500 hPa) over the Shangri-La region from March to May 2012.
Liang et al., Aerosol and Air Quality Research, 19: 1188–1204, 2019
1200
March to May, which was dominated by a southwesterly wind at the ground level, with a horizontal westerly wind at higher levels. Wind speed was low but increased with altitude. The wind field at 850 hPa was dominated by a southwesterly wind, indicating that pollution in northern Myanmar could easily be delivered to Shangri-La but diminishing the possibility of pollution transport to Shangri-La from northern Thailand. Westerly winds prevailed at 700 and 500 hPa, indicating that pollution from Bangladesh, northern India, and even the Middle East could be transmitted to Southwest China. At the same time, pollutants in Southeast Asia can also be transported downwind efficiently to the Guangxi and Guangdong regions in China.
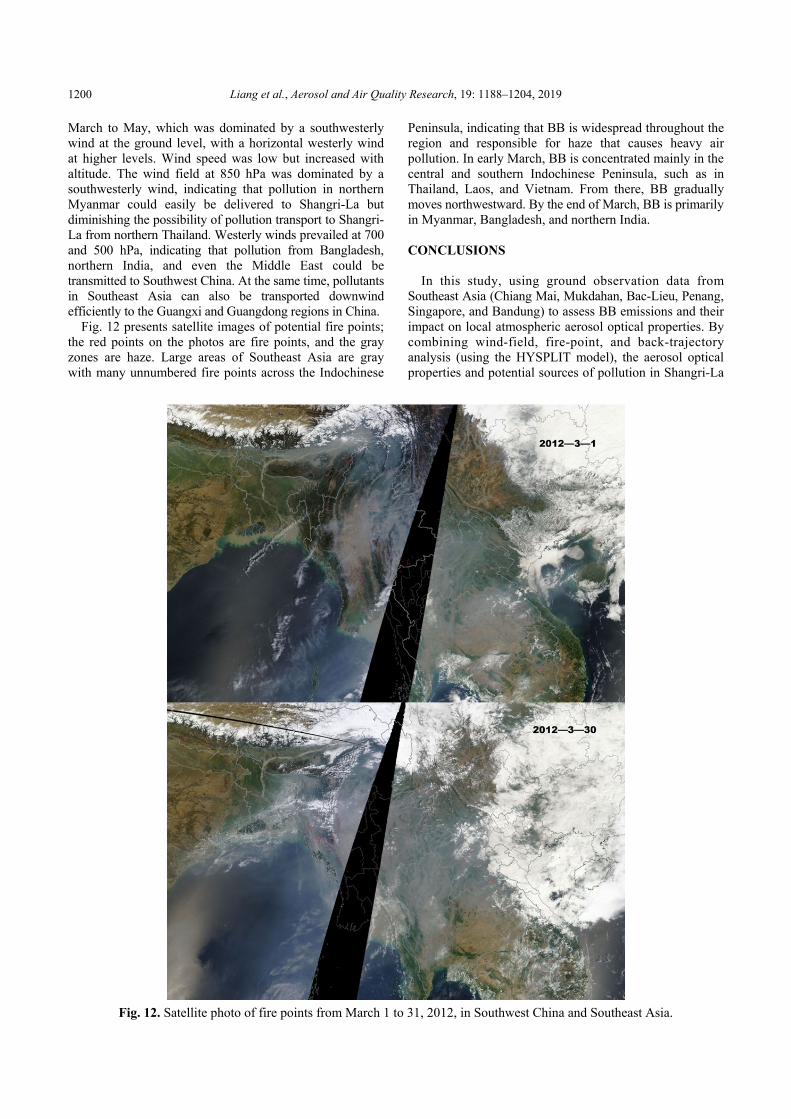
Fig. 12 presents satellite images of potential fire points; the red points on the photos are fire points, and the gray zones are haze. Large areas of Southeast Asia are gray with many unnumbered fire points across the Indochinese
Peninsula, indicating that BB is widespread throughout the region and responsible for haze that causes heavy air pollution. In early March, BB is concentrated mainly in the central and southern Indochinese Peninsula, such as in Thailand, Laos, and Vietnam. From there, BB gradually moves northwestward. By the end of March, BB is primarily in Myanmar, Bangladesh, and northern India.
CONCLUSIONS
In this study, using ground observation data from Southeast Asia (Chiang Mai, Mukdahan, Bac-Lieu, Penang, Singapore, and Bandung) to assess BB emissions and their impact on local atmospheric aerosol optical properties. By combining wind-field, fire-point, and back-trajectory analysis (using the HYSPLIT model), the aerosol optical properties and potential sources of pollution in Shangri-La
Fig. 12. Satellite photo of fire points from March 1 to 31, 2012, in Southwest China and Southeast Asia.
Liang et al., Aerosol and Air Quality Research, 19: 1188–1204, 2019
1201
were analyzed and discussed with a focus on the impact of BB pollution from northern Thailand and Myanmar in spring. The potential effects of long-range-transported BB aerosols on the study area were evaluated, and the main sources of emissions arriving in Southwest China were identified. The major conclusions from the results are summarized as follows: (1) Due to the large latitudinal range and different climatic
factors in Southeast Asia, the prevalence of BB differs by nation. Based on the analysis of aerosol optical properties in Southeast Asia, countries located on the Indochinese Peninsula tend to conduct large-scale BB activities from March to May of each year. Following the wet season (September–November), small-scale BB may occur in some areas, or BB in Indonesia and other regions may emit large amounts of fine particulate matter that are transmitted to the Indochinese Peninsula. By contrast, countries and regions located on the Malay Archipelago have no obvious and frequent incidents of BB. However, the period of August to November (prior to the wet season) is deeply affected by BB emissions from Indonesia’s southern island. Moreover, some small-scale BB activities may occur in other regions.
(2) Whereas BB emissions from Thailand have only a slight impact on pollution in Shangri-La, those from northern Myanmar during the spring clearly affect this city. Furthermore, although BB emissions from other parts of Southeast Asia have a limited impact on Shangri-La, pollutants can be transported downwind efficiently to China.
(3) The pollution in Shangri-La from March to May is primarily contributed by sources along the pollution conveyor belt on the southern periphery of the Tibetan Plateau, including anthropogenic emissions from northern-central India, Bangladesh, and northern Myanmar, which account for 45.16% of the total external pollution. Pollution from the Middle East and northern Africa can also be transported to Shangri-La. Therefore, springtime background aerosol pollution on the Yunnan-Guizhou Plateau comes mainly from South Asia and northern Myanmar (in Southeast Asia). Although BB in Southeast Asia is not the main external source of pollutants in Southwest China, it has a notable local impact on the Indochinese Peninsula and Malay Archipelago.
ACKNOWLEDGMENTS
This project was supported by the National Natural
Science Foundation of China (41590874 and 41375153), the CAMS Basis Research Project (2016Z001 and 2014R17), and the Climate Change Special Fund of CMA (CCSF201504). This manuscript was edited by Wallace Academic Editing. We acknowledge the AERONET team members and thank the AERONET site managers at the sites in Southeast Asia for maintaining the instruments that made collecting these data possible. We also thank Wang Yaqiang’s team at MeteoInfo for assisting with meteorological data visualization and analysis. The authors
also thank the anonymous reviewers and editor for their constructive suggestions and comments.
REFERENCES Andreae, M.O. and Merlet, P. (2001). Emission of trace
gases and aerosols from biomass burning. Global Biogeochem. Cycles 15: 955–966.
Andreae, M.O., Artaxo, P., Fischer, H., Freitas, S.R., Grégoire, J.M., Hansel, A., Hoor, P., Kormann, R., Krejci, R., Lange, L., Lelieveld, J., Lindinger, W., Longo, K., Peters, W., de Reus, M., Scheeren, B., Silva Dias, M.A.F., Ström, J., van Velthoven, P.F.J. and Williams, J. (2001). Transport of biomass burning smoke to the upper troposphere by deep convection in the equatorial region. Geophys. Res. Lett. 28: 951–954.
Ansmann, A., Baars, H., Tesche, M., Müller, D., Althausen, D., Engelmann, R., Pauliquevis, T. and Artaxo, P. (2009). Dust and smoke transport from Africa to South America: Lidar profiling over Cape Verde and the Amazon rainforest. Geophys. Res. Lett. 36: L11802.
Chan, L.Y., Chan, C.Y., Liu, H.Y., Christopher, S., Oltmans, S.J. and Harris, J.M. (2000). A case study on the biomass burning in Southeast Asia and enhancement of tropospheric ozone over Hong Kong. Geophys. Res. Lett. 27: 1479–1482.
Charlson, R.J., Schwartz, S.E., Hales, J.M., Cess, R.D., Coakley, J.A. Jr., Hansen, J.E. and Hofmann, D.J. (1992). Climate forcing by antlropogenic aerosols. Science 255: 423–430.
Che, H., Shi, G., Uchiyama, A., Yamazaki, A., Chen, H., Goloub, P. and Zhang, X. (2008). Intercomparison between aerosol optical properties by a PREDE skyradiometer and CIMEL sunphotometer over Beijing, China. Atmos. Chem. Phys. 8: 3199–3214.
Che, H., Zhang, X., Chen, H., Damiri, B., Goloub, P., Li, Z., Zhang, X., Wei, Y., Zhou, H., Dong F., Li, D. and Zhou, T. (2009). Instrument calibration and aerosol optical depth validation of the China Aerosol Remote Sensing Network. J. Geophys. Res. 114: D03206.
Che, H., Wang, Y., Sun, J., Zhang, X., Zhang, X. and Guo, J. (2013). Variation of aerosol optical properties over the Taklimakan Desert in China. Aerosol Air Qual. Res. 13: 777–785.
Che, H., Xia, X., Zhu, J., Li, Z., Dubovik, O., Holben, B., Goloub, P., Chen, H., Estelles, V., Cuevas-Agulló, E., Blarel, L., Wang, H., Zhao, H., Zhang, X., Wang, Y., Sun, J., Tao, R., Zhang, X. and Shi, G. (2014). Column aerosol optical properties and aerosol radiative forcing during a serious haze-fog month over North China Plain in 2013 based on ground-based sunphotometer measurements. Atmos. Chem. Phys. 14: 2125–2138.
Che, H., Zhao, H., Wu, Y., Xia, X., Zhu, J., Wang, H., Wang, Y., Sun, J., Yu, J., Zhang, X. and Shi, G. (2015a). Analyses of aerosol optical properties and direct radiative forcing over urban and industrial regions in Northeast China. Meteorol. Atmos. Phys. 127: 345–354.
Che, H., Zhao, H., Xia, X., Wu, Y., Zhu, J., Ma, Y., Wang,
Liang et al., Aerosol and Air Quality Research, 19: 1188–1204, 2019
1202
Y., Wang, H., Wang, Y., Zhang, X. and Shi, G. (2015b). Fine mode aerosol optical properties related to cloud and fog processing over a cluster of cities in Northeast China. Aerosol Air Qual. Res. 15: 2065–2081.
Deka, P. and Hoque, R.R. (2014). Incremental effect of festive biomass burning on wintertime PM10 in brahmaputra valley of Northeast India. Atmos. Res. 143: 380–391.
Deng, X., Tie, X., Zhou, X., Wu, D., Zhong, L., Tan, H., Li, F., Huang, X., Bi, X. and Deng, T. (2008). Effects of Southeast Asia biomass burning on aerosols and ozone concentrations over the Pearl River Delta (PRD) region. Atmos. Environ. 42: 8493–8501.
Dubovik, O. and King, M.D. (2000). A flexible inversion algorithm for retrieval of aerosol optical properties from sun and sky radiance measurements. J. Geophys. Res. 105: 20673–20696.
Dubovik, O., Smirnov, A., Holben, B.N., King, M.D., Kaufman, Y.J., Eck, T.F. and Slutsker, I. (2000). Accuracy assessments of aerosol optical properties retrieved from Aerosol Robotic Network (AERONET) Sun and sky radiance measurements. J. Geophys. Res. 105: 9791–9806.
Dubovik, O., Holben, B., Eck, T.F., Smirnov, A., Kaufman, Y.J., King, M.D., Tanré, D. and Slutsker, I. (2002). Variability of absorption and optical properties of key aerosol types observed in worldwide locations. J. Atmos. Sci. 59: 590–608.
Eck, T.F., Holben, B.N., Reid, J.S., Dubovik, O., Smirnov, A., O'Neill, N.T., Slutsker, I. and Kinne, S. (1999). Wavelength dependence of the optical depth of biomass burning, urban, and desert dust aerosols. J Geophys. Res. 104: 31333–31349.
Eck, T.F., Holben, B.N., Sinyuk, A., Pinker, R.T., Goloub, P., Chen, H., Chatenet, B., Li, Z., Singh, R.P., Tripathi, S.N., Reid, J.S., Giles, D.M., Dubovik, O., O'Neill, N.T., Smirnov, A., Wang, P. and Xia, X. (2010). Climatological aspects of the optical properties of fine/coarse mode aerosol mixtures. J. Geophys. Res. 115: D19205.
Engling, G., Zhang, Y.N., Chan, C.Y., Sang, X.F., Lin, M., Ho, K.F., Li, Y.S., Lin, C.Y. and Lee, J.J. (2011). Characterization and sources of aerosol particles over the southeastern Tibetan Plateau during the Southeast Asia biomass-burning season. Tellus B 63: 117–128.
Estellés, V., Campanelli, M., Smyth, T.J., Utrillas, M.P. and Martínez-Lozano, J.A. (2012). Evaluation of the new ESR network software for the retrieval of direct sun products from CIMEL CE318 and PREDE POM01 sun-sky radiometers. Atmos. Chem. Phys. 12: 11619–11630.
Field, R.D., van der Werf, G.R. and Shen, S.S.P. (2009). Human amplification of drought-induced biomass burning in indonesia since 1960. Nat. Geosci. 2: 185–188.
Gao, C., Yang, H. and Zhou, H. (2013). An analysis of air pollution characteristics and its development trend in urban center of Shangri-La. Environ. Sci. Surv. 32: 49–50.
Gautam, R., Hsu, N.C., Eck, T.F., Holben, B.N., Janjai, S., Jantarach, T., Tsay, S.C. and Lau, W.K. (2013).
Characterization of aerosols over the Indochina peninsula from satellite-surface observations during biomass burning pre-monsoon season. Atmos. Environ. 78: 51–59.
Giglio, L. (2013). MODIS collection 5 active fire product user's guide version 2.5. Science Systems and Applications, Inc., Department of Geographical Sciences, University of Maryland.
Holben, B.N., Eck, T.F., Slutsker, I., Tanre´, D., Buis, J.P., Setzer, A., Vermote, E., Reagan, J.A., Kaufman, Y.J., Nakajima, T., Lavenu, F., Jankowiak, I. and Smirnov, A. (1998). Aeronet—A federated instrument network and data archive for aerosol characterization. Remote Sens. Environ. 66: 1–16.
Jacob, D.J. (2003). Transport and Chemical Evolution over the Pacific (TRACE-P) aircraft mission: Design, execution, and first results. J. Geophys. Res. 108: 9000.
Jacobson, M.Z. (2000). A physically-based treatment of elemental carbon optics: Implications for global direct forcing of aerosols. Geophys. Res. Lett. 27: 217–220.
Jacobson, M.Z. (2001). Strong radiative heating due to the mixing state of black carbon in atmospheric aerosols. Science 409: 695–697.
Koe, L.C.C., Arellano, A.F. and McGregor, J.L. (2001). Investigating the haze transport from 1997 biomass burning in Southeast Asia: its impact upon Singapore. Atmos. Environ. 35: 2723–2734.
Kondo, Y. (2004). Impacts of biomass burning in southeast asia on ozone and reactive nitrogen over the western pacific in spring. J. Geophys. Res. 109: D15S12.
Li, C., Tsay, S.C., Hsu, N.C., Kim, J.Y., Howell, S.G., Huebert, B.J., Ji, Q., Jeong, M.J., Wang, S.H., Hansell, R.A. and Bell, S.W. (2013). Characteristics and composition of atmospheric aerosols in Phimai, central Thailand during BASE-ASIA. Atmos. Environ. 78: 60–71.
Li, J., Lv, Q., Zhang, M., Wang, T., Kawamoto, K., Chen, S. and Zhang, B. (2017). Effects of atmospheric dynamics and aerosols on the fraction of supercooled water clouds. Atmos. Chem. Phys. 17: 1847–1863.
Li, J., Jian, B., Huang, J., Hu, Y., Zhao, C., Kawamoto, K., Liao, S. and Wu, M. (2018a). Long-term variation of cloud droplet number concentrations from space-based lidar. Remote Sens. Environ. 213: 144–161.
Li, J., Lv, Q., Jian, B., Zhang, M., Zhao, C., Fu, Q., Kawamoto, K. and Zhang, H. (2018b). The impact of atmospheric stability and wind shear on vertical cloud overlap over the Tibetan Plateau. Atmos. Chem. Phys. 18: 7329–7343.
Manton, M.J., Della-Marta, P.M., Haylock, M.R., Hennessy, K.J., Nicholls, N., Chambers, L.E., Collins, D.A., Daw, G., Finet, A., Gunawan, D., Inape, K., Isobe, H., Kestin, T.S., Lefale, P., Leyu, C.H., Lwin, T., Maitrepierre, L., Ouprasitwong, N., Page, C.M., Pahalad, J., Plummer, N., Salinger, M.J., Suppiah, R., Tran, V.L., Trewin, B., Tibig, I. and Yee, D. (2001). Trends in extreme daily rainfall and temperature in Southeast Asia and the South Pacific: 1961–1998. Int. J. Climatol. 21: 269–284.
Marlon, J.R., Bartlein, P.J., Carcaillet, C., Gavin, D.G.,
Liang et al., Aerosol and Air Quality Research, 19: 1188–1204, 2019
1203
Harrison, S.P., Higuera, P.E., Joos, F., Power, M.J. and Prentice, I.C. (2008). Climate and human influences on global biomass burning over the past two millennia. Nat. Geosci. 1: 697–702.
Matus, K., Nam, K.M., Selin, N.E., Lamsal, L.N., Reilly, J.M. and Paltsev, S. (2012). Health damages from air pollution in China. Global Environ. Change 22: 55–66.
Narukawa, M., Kawamura, K., Takeuchi, N. and Nakajima, T. (1999). Distribution of dicarboxylic acids and carbon isotopic compositions in aerosols from 1997 Indonesian forest fires. Geophys. Res. Lett. 26: 3101–3104.
Pani, S.K., Lin, N.H., Chantara, S., Wang, S.H., Khamkaew, C., Prapamontol, T. and Janjai, S. (2018). Radiative response of biomass-burning aerosols over an urban atmosphere in northern peninsular Southeast Asia Sci. Total Environ. 633: 892–911.
Qi, B., Hu, D., Che, H., Du, R., Wu, Y., Xia, X., Zha, B., Liu, J., Niu, Y., Wang, H., Zhang, X. and Shi, G. (2016). Seasonal variation of aerosol optical properties in an urban site of the Yangtze Delta Region of China. Aerosol Air Qual. Res. 16: 2884–2896.
Qin, N., Chen, X., Fu, G., Zhai, J. and Xue, X. (2010). Precipitation and temperature trends for the Southwest China: 1960–2007. Hydrol. Process. 24: 3733–3744.
Ramanathan, V., Crutzen, P.J., Lelieveld, J., Mitra, A.P., Althausen, D., Anderson, J., Andreae, M.O., Cantrell, W., Cass, G.R., Chung, C.E., Clarke, A.D., Coakley, J.A., Collins, W.D., Conant, W.C., Dulac, F., Heintzenberg, J., Heymsfield, A.J., Holben, B., Howell, S., Hudson, J., Jayaraman, A., Kiehl, J.T., Krishnamurti, T.N., Lubin, D., McFarquhar, G., Novakov, T., Ogren, J.A., Podgorny, I.A., Prather, K., Priestley, K., Prospero, J.M., Quinn, P.K., Rajeev, K., Rasch, P., Rupert, S., Sadourny, R., Satheesh, S.K., Shaw, G.E., Sheridan, P. and Valero, F.P.J. (2001). Indian Ocean Experiment: An integrated analysis of the climate forcing and effects of the great Indo-Asian haze. J. Geophys. Res. 106: 28371–28398.
Salinas, S.V., Chew, B.N. and Liew, S.C. (2009). Retrievals of aerosol optical depth and Ångström exponent from ground-based Sun-photometer data of Singapore. Appl. Opt. 48: 1473–1484.
Schuster, G.L., Dubovik, O. and Holben, B.N. (2006). Angstrom exponent and bimodal aerosol size distributions. J. Geophys. Res. 111: D07207.
Stein, A.F., Draxler, R.R., Rolph, G.D., Stunder, B.J.B., Cohen, M.D. and Ngan, F. (2015). NOAA's HYSPLIT atmospheric transport and dispersion modeling system. Bull. Am. Meteorol. Soc. 96: 2059–2077.
Streets, D.G., Yarber, K.F., Woo, J.H. and Carmichael, G.R. (2003). Biomass burning in Asia: Annual and seasonal estimates and atmospheric emissions. Global Biogeochem. Cycles 17: 10.
Tie, X., Wu, D. and Brasseur, G. (2009). Lung cancer mortality and exposure to atmospheric aerosol particles in Guangzhou, China. Atmos. Environ. 43: 2375–2377.
Tsay, S.C., Maring, H.B., Lin, N.H., Buntoung, S., Chantara, S., Chuang, H.C., Wiriya, W., Yen, M.C., Pani, S.K., Pantina, P., Sayer, A.M., Tao, W.K., Wang, S.H., Welton, E.J., Lau, W.K.M., Lee, C.T., Lee, J., Loftus,
A.M., Nguyen, A.X., Nguyen, C.M., Gabriel, P.M., Goodloe, C.S., Holben, B.N., Hsiao, T.C., Hsu, N.C. and Janjai, S. (2016). Satellite-surface perspectives of air quality and aerosol-cloud effects on the environment: An overview of 7-SEAS/BASELInE. Aerosol Air Qual. Res. 16: 2581–2602.
Venkataraman, C., Habib, G., Eiguren-Fernandez, A., Miguel, A.H. and Friedlander, S.K. (2005). Residential biofuels in South Asia: carbonaceous aerosol emissions and climate impacts. Science 307: 1454–1456.
Wang, L., Xin, J., Li, X. and Wang, Y. (2015a). The variability of biomass burning and its influence on regional aerosol properties during the wheat harvest season in North China. Atmos. Res. 157: 153–163.
Wang, Y.Q. (2014). MeteoInfo: GIS software for meteorological data visualization and analysis. Meteorol. Appl. 21: 360–368.
Wang, Y.Q., Zhang, X.Y., Sun, J.Y., Zhang, X.C., Che, H.Z. and Li, Y. (2015b). Spatial and temporal variations of the concentrations of PM10, pM2.5 and PM1 in China. Atmos. Chem. Phys. 15: 13585–13598.
Wei, M. and Liu, M.H. (1994). Spatial and temporal distribution of tropical biomass burning. Global Biogeochem. Cycles 8: 495–503.
Xin, Y., Wang, G. and Chen, L. (2016). Identification of long-range transport pathways and potential sources of PM10 in Tibetan Plateau uplift area: Case study of Xining, China in 2014. Aerosol Air Qual. Res. 16: 1044–1054.
Yang, R., Tao, Y. and Cao, J. (2010). A mechanism for the interannual variation of the early summer East Asia-Pacific teleconnection wave train. Acta Meteorol. Sin. 24: 452–458.
Yang, R., Xie, Z. and Cao, J. (2017). A dynamic index for the westward ridge point variability of the Western Pacific subtropical high during summer. J. Climate 30: 3325–3341.
Yu, J., Che, H., Chen, Q., Xia, X., Zhao, H., Wang, H., Wang, Y., Zhang, X. and Shi, G. (2015). Investigation of aerosol optical depth (AOD) and Angstrom Exponent over the desert region of Northwestern China based on measurements from the China Aerosol Remote Sensing Network (CARSNET). Aerosol Air Qual. Res. 15: 2024–2036.
Zhang, X.Y., Wang, Y.Q., Niu, T., Zhang, X.C., Gong, S.L., Zhang, Y.M. and Sun, J.Y. (2012a). Atmospheric aerosol compositions in China: spatial/temporal variability, chemical signature, regional haze distribution and comparisons with global aerosols. Atmos. Chem. Phys. 12: 779–799.
Zhang, Y.N., Zhang, Z.S., Chan, C.Y., Engling, G., Sang, X.F., Shi, S. and Wang, X.M. (2012b). Levoglucosan and carbonaceous species in the background aerosol of coastal southeast China: Case study on transport of biomass burning smoke from the Philippines. Environ. Sci. Pollut. Res. Int. 19: 244–255.
Zheng, X., Kang, W., Zhao, T., Luo, Y., Duan, C. and Chen, J. (2008). Long-term trends in sunshine duration over Yunnan-Guizhou Plateau in Southwest China for

Liang et al., Aerosol and Air Quality Research, 19: 1188–1204, 2019
1204
1961–2005. Geophys. Res. Lett. 35: L15707. Zheng, Y., Kang, B., Zhang, D., Zhao, C., Liu, C., Shu, Z.,
Sun, Y., Huang, B., Chai, R., Zhao, T., Zhang, X., Che, H., Xia, X., Wang, Y., Zhao, H., Wang, H., Estellés, V., An, L., Gui, K. and Sun, T. (2018). A comparative analysis of aerosol microphysical, optical and radiative properties during the Spring Festival holiday over Beijing and surrounding regions. Aerosol Air Qual. Res. 18: 1774–1787.
Zhu, J., Che, H., Xia, X., Chen, H., Goloub, P. and Zhang, W. (2014). Column-integrated aerosol optical and physical properties at a regional background atmosphere
in North China Plain. Atmos. Environ. 84: 54–64. Zhu, J., Xia, X., Che, H., Wang, J., Zhang, J. and Duan, Y.
(2016). Study of aerosol optical properties at Kunming in southwest China and long-range transport of biomass burning aerosols from North Burma. Atmos. Res. 169: 237–247.
Received for review, August 31, 2018 Revised, January 16, 2019
Accepted, January 25, 2019