Embed Size (px)
Citation preview
Impact of Aviation Electrification on Airports: FlightScheduling and Charging
Boya Hou1,∗, Subhonmesh Bose1, Lavanya Marla2, Kiruba Haran1
Abstract
Electrification can help to reduce the carbon footprint of aviation. The transition awayfrom jet fuel-powered conventional airplane towards battery-powered electrified aircraftwill impose extra charging requirements on airports. In this paper, we first quantify theincrease in energy demands at several airports across the United States (US), when com-mercial airline carriers partially deploy hybrid electric aircraft (HEA). We then illustratethat smart charging and minor modifications to flight schedules can substantially reducepeak power demands, and in turn the needs for grid infrastructure upgrade. Motivatedby our data analysis, we then formulate an optimization problem for slot allocation thatincorporates HEA charging considerations. This problem jointly decides flight sched-ules and charging profiles to manage airport congestion and peak power demands. Weillustrate the efficacy of our formulation through a case study on the John F. KennedyInternational Airport.
Keywords:Electric aircraft, Slot Allocation, Smart charging
1. Introduction
Commercial aviation produced 915 million tonnes of CO2 worldwide in 2019, respon-sible for 2% of all human-induced CO2 emissions from energy consumption, as per theAir Transport Action Group [1]. The carbon footprint of aviation is projected to increasewith predicted annual growth of 4.2% in demand for air travel over 2018-2038, accordingto the International Civil Aviation Organization [2]. The corresponding increase in green-house gas emissions will pose a serious threat to the vision of a carbon-neutral future.Electrification has been identified as a potential path to reduce said emissions, e.g., by theNational Academies of Sciences Engineering and Medicine [3].
∗Corresponding authorEmail address: [email protected] (Boya Hou)
1Department of Electrical and Computer Engineering, University of Illinois at Urbana-Champaign,Urbana, IL, 61801, USA
2Department of Industrial and Enterprise Systems Engineering, University of Illinois at Urbana-Champaign, Urbana, IL, 61801, USA
Preprint submitted to Transportation Research Part D: Transport and Environment August 23, 2021
arX
iv:2
108.
0896
3v1
[ee
ss.S
Y]
20
Aug
202
1
Electrified aircraft are an emergent technology, largely enabled by the development ef-forts supported by NASA’s Advanced Air Transport Technologies program in the UnitedStates and similar programs by the respective agencies in the European Union and Asia.Various aircraft configurations such as turbo-electric, hybrid-electric and all-electric havebeen proposed and analyzed. For example, flight performance of parallel turbofan sys-tems has been analyzed in Gladin et al. [4]. The benefits of a parallel hybrid propulsionsystem for boosting power during takeoff and climb has been demonstrated in Lents et al.[5] and Bertrand et al. [6]. Small electric airplanes for general aviation are already avail-able. Flight demonstrations are underway for the commuter class with planes carrying<20 passengers. The next step is to electrify regional airplanes that accommodate 30 - 100passengers. Various studies such as those in Schafer et al. [7], Wroblewski and Ansell [8]predict commercial aviation to adopt electric aircraft over the next few decades (2030-2050time-frame).
To handle the impending electrification of commercial aviation, airports must invest inappropriate charging infrastructure. Investment into building such infrastructure must beforward-looking and account for plausible growth trajectories of electrification technol-ogy. The first aim of this paper is to provide a framework to gauge the energy and powerneeds of hybrid electric aircraft (HEA) at major airports across the United States (US). Byhybrid electric configuration, we mean those airplanes which are propelled partly by elec-tric motor through a battery system and partly by gas turbines through jet fuel. As willbecome clear, we only consider those configurations that are deemed to become viableover 2030-2050, according to academic and industrial research. Scheduling of flights at anairport is intimately related to when and how much the electrified ones can be charged.As we demonstrate, one substantially impacts the other. The second and final aim of thispaper is the formulation and solution of a slot allocation problem that models chargingconsiderations of HEA at airports. That is, the slot allocation problem jointly schedulesflight arrivals/departures and decides the charging profiles of HEA, aiming to minimizeairport congestion and peak electric power demands from HEA.
Not all flights can be operated using HEA. Energy densities of today’s batteries arein the 200-250 Wh/kg range. They are substantially smaller than that of jet fuel withdensities of ∼13,000 Wh/kg. As a result, the size and the weight of a battery requiredon board limits the range of an HEA. The battery size also depends on the extent theaircraft relies on electric propulsion as opposed to jet fuel. With plausible configurationsof battery energy densities and degree of hybridization, we compute the energy needs foroperating HEA on domestic flight paths within continental US in Section 2. By switchingflights from current schedules that can be operated by HEA, we estimate the increase inannual energy needs at various US airports. Our estimates indicate that accommodatingHEA in commercial aviation will require substantial upgrades to the grid infrastructurethat powers these airports.
While flight distance, number of passengers and airplane type largely dictate the en-ergy needs for an HEA, peak power requirements from the grid on the other hand, dependon the rate of charging. Grid components must be sized properly to support such peaks.In Section 3, we show that charging HEA at constant power levels over their dwell times
2
at airports can lead to substantial peak power demands. Optimizing charging schedulescan significantly lower these peaks at airports.
Flight arrival and departure schedules define the dwell times of flights at airports.For HEA, these schedules put constraints on when and how much to charge each air-plane. Not surprisingly, alterations in schedules of some flights can further shrink peakpower requirements over and above that obtained from optimizing charging schedulesalone. Our results in Section 3 indeed align with this expectation. Charging considera-tions alone cannot define flight schedules, however. Airlines tailor their requests for flightarrivals and departures to suit passenger demand patterns. As a result, busy airports of-ten witness congestion during peak hours, given the runway capacities. Congestion leadsto flight delays at these airports. Such delays for multi-hop flight paths tend to cascadeacross airports. Planning flight schedules via slot allocation for congestion managementhas been widely recognized, e.g., see Zografos et al. [9] for a survey. We formulate a slotallocation problem that accounts for charging considerations of HEA in Section 4. Specifi-cally, we design an optimization program that seeks to jointly minimize the displacementsof flights from their requested schedules and flatten the power profile required to chargethe HEA aircraft operating these schedules.
We run a representative case study of slot allocation problem with HEA charging forthe John F. Kennedy International Airport (JFK) in Section 5. Our experiments revealthe importance of jointly considering slot allocation and smart HEA charging with rea-sonable HEA adoption. In particular, we solve a slot allocation problem without HEAcharging considerations and then construct charging profiles for HEA under a constantpower charging scheme. Such a construction results in a high peak power demand of 35.9MW. Enforcing a limit of 20 MW on power drawn for charging, our slot allocation prob-lem reduces that peak to 14.6 MW with a different flight schedule. Using our simulationframework, we also study how runway capacities at the airport and charging constraintson airplane batteries impact both flight schedules and charging profiles. The results il-lustrate that congestion and charging considerations are inter-dependent and cannot betackled separately.
The key contributions of this paper are as follows. First, we present a framework tostudy the impact of HEA adoption within commercial aviation. To the best of our knowl-edge, this is the first paper that jointly tackles transportation and grid considerationswith HEA. Second, we demonstrate that charging schedules for HEA must be optimizedcarefully to prevent large peak power demands. Lacking such a design, peak power re-quirements will put unnecessary burdens on the supporting grid infrastructure. Our thirdcontribution is the slot allocation model with HEA charging. To our knowledge, this is thefirst work that provides a framework for managing airport congestion and HEA chargingtogether. The case study on JFK airport indicates how one cannot disentangle these twoproblems.
1.1. Literature reviewWe draw on two lines of work– one that characterizes the capabilities and impacts
of electric airplanes, and the other that studies slot allocation for flight scheduling. In
3
the first line of research, the most relevant works are those of Wroblewski and Ansell[8], Gnadt et al. [10] that quantify the capabilities of HEA concepts. We focus on retrofittedregional and single-aisle HEA configurations in Table 1 that academic and industry re-search deem viable over the next few decades. Leveraging the technology growth sce-narios envisioned in these works, we examine the impacts of HEA adoption on airportoperations. We remark that aggregate electricity consumption in the US from electric air-planes has been estimated in Schafer et al. [7]. These estimates are based on the uniformadoption scenario of a 180-passenger all-electric airplane, studied in Gnadt et al. [10]. Incontrast, we provide a detailed systematic framework to study airport operations withmuch more realistic retrofitted HEA.
Table 1: Summary of regional and single-aisle hybrid electric aircraft concepts and research. BSEDstands for battery specific energy density.
Research group Hybrid ar-chitecture
BSED (Wh/kg) Reference
Boeing-GESUGAR Volt
Parallel 750 Bradley and Droney [11, 12]
Bauhaus Parallel 1000-1500 Pornet et al. [13]UTRC Parallel Not spec. National Academies of Sciences
Engineering and Medicine [3]Airbus Series 800 Delhaye and Rostek [14]Cambridge Parallel 750 Friedrich and Robertson [15]Georgia Tech Parallel 750 National Academies of Sciences
Engineering and Medicine [3]
In the second category, there is a growing literature on flight scheduling at capacity-constrained airports. See NERA Economic Consulting [16], Czerny et al. [17], Corolliet al. [18], Benlic [19], Zografos et al. [9], Pyrgiotis and Odoni [20], Jacquillat and Odoni[21], Ribeiro et al. [22, 23] among others. These papers optimize flight schedules to limitcongestion during peak hours at airports to avoid flight delays, the total cost of which inthe US has been estimated to be $33 billion by the Federal Aviation Administration [24].We build on these models to co-optimize schedules of all flights and the charging profilesof HEA at capacity-constrained airports.
2. Estimating Energy Requirements of HEA
Energy needs of operating a flight path with HEA will depend on the the type of air-craft being electrified and the distances traveled. For flight paths, we focus on short-hauldomestic commercial flights that had a dwell time longer than 15 minutes at the originat-ing airport in 2018. We use flight information from the airline on-time performance datafrom the US Department of Transportation’s Bureau of Transportation Statistics (BTS)
4
[25]. The range of an HEA is limited by the size and weight of the battery on-board. Bat-tery technology for electric airplanes is constantly improving. These batteries are char-acterized by two parameters—its battery specific energy density (BSED) and its motorfactor (MF). BSED, measured in Wh/kg, dictates the weight of the battery required todeliver a given amount of electrical energy. And, MF defines the ratio of the peak powerthat can be delivered by the battery and that required by the aircraft. For a specific BSED-MF combination, we utilize the range capabilities of retrofit hybrid electric regional jetsand narrow body aircraft from Wroblewski and Ansell [8], reproduced in Appendix TableA.2. A specific flight can utilize HEA only if the flight distance is within this range.
We now formally describe the electrical energy requirement of operating a flight pathwith HEA. Assume that each HEA arrives at an airport with a depleted battery and needsto be charged up to the level required for its next flight. The required energy is calculatedas E = p × d × b0, where d describes the next flight distance in miles, p is the numberof passengers and b0 denotes the battery energy usage per passenger-mile. This calcula-tion assumes that the electrical power drawn from the battery remains roughly constantduring different phases of the flight, e.g. taxi, take-off and landing. For each flight in thedatabase from the US Department of Transportation’s Bureau of Transportation Statistics(BTS) [25], we use the tail-number to identify the aircraft type from airplane manufac-turer’s websites; which in turn, yields the total number of seats on the plane. Throughoutthis analysis, we uniformly assume that 85% of all seats are filled in each flight to esti-mate p. This load factor matches the yearly average estimates of the same in the industry,based on the US Department of Transportation’s Bureau of Transportation Statistics (BTS)[26]. The values of parameter b0 for HEA are adopted from Wroblewski and Ansell [8], re-produced in Table A.1 in the Appendix, assuming a battery-pack voltage of 128V. Sizingof such batteries accounts for battery energy consumed during taxi, takeoff, cruise, ap-proach, and landing. For regional jets, we use b0 for ERJ-175 and for single-aisle aircraft,we use that for Boeing 737-700.
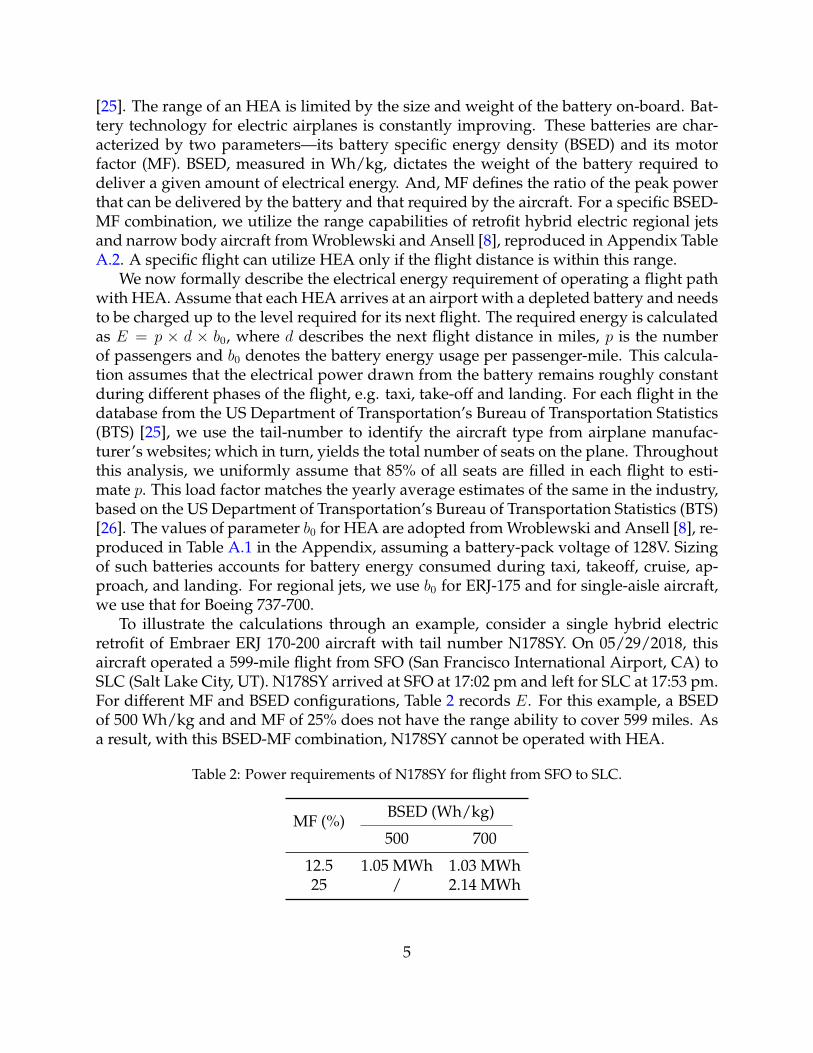
To illustrate the calculations through an example, consider a single hybrid electricretrofit of Embraer ERJ 170-200 aircraft with tail number N178SY. On 05/29/2018, thisaircraft operated a 599-mile flight from SFO (San Francisco International Airport, CA) toSLC (Salt Lake City, UT). N178SY arrived at SFO at 17:02 pm and left for SLC at 17:53 pm.For different MF and BSED configurations, Table 2 records E. For this example, a BSEDof 500 Wh/kg and and MF of 25% does not have the range ability to cover 599 miles. Asa result, with this BSED-MF combination, N178SY cannot be operated with HEA.
Table 2: Power requirements of N178SY for flight from SFO to SLC.
MF (%) BSED (Wh/kg)
500 700
12.5 1.05 MWh 1.03 MWh25 / 2.14 MWh
5
2.1. Annual Energy Requirements at US AirportsThe energy demands for individual flights under BSED-MF combinations prove use-
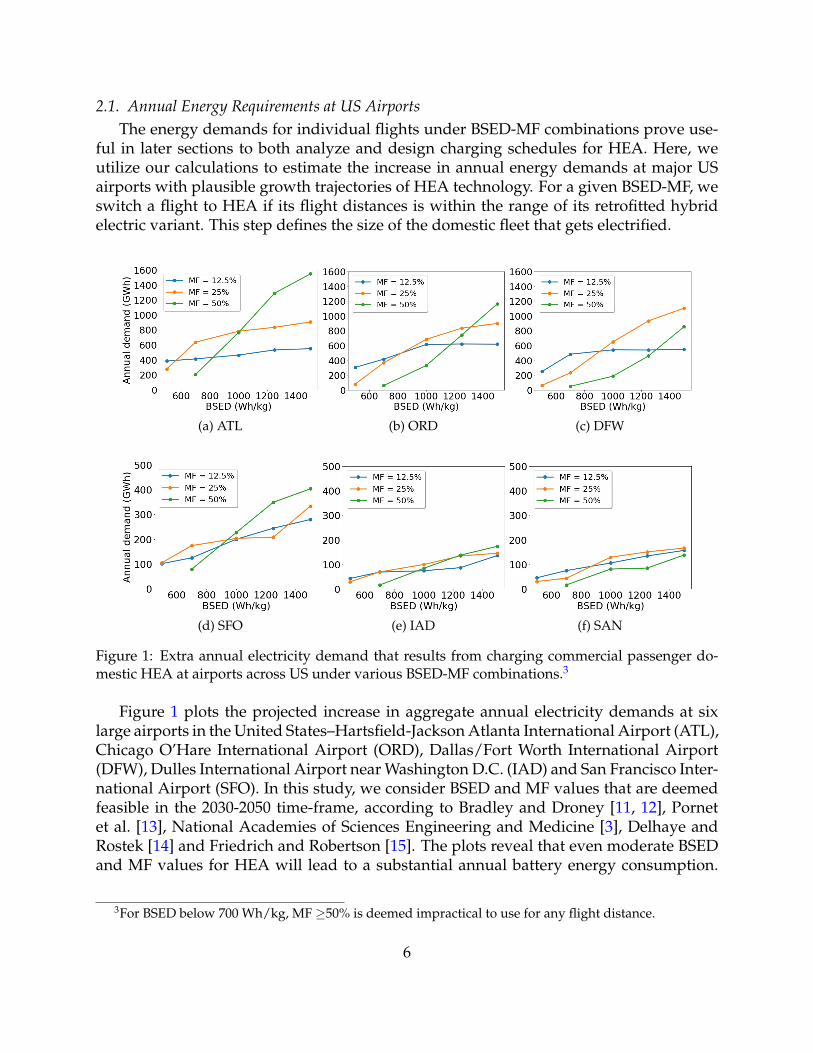
ful in later sections to both analyze and design charging schedules for HEA. Here, weutilize our calculations to estimate the increase in annual energy demands at major USairports with plausible growth trajectories of HEA technology. For a given BSED-MF, weswitch a flight to HEA if its flight distances is within the range of its retrofitted hybridelectric variant. This step defines the size of the domestic fleet that gets electrified.
(a) ATL (b) ORD (c) DFW
(d) SFO (e) IAD (f) SAN
Figure 1: Extra annual electricity demand that results from charging commercial passenger do-mestic HEA at airports across US under various BSED-MF combinations.3
Figure 1 plots the projected increase in aggregate annual electricity demands at sixlarge airports in the United States–Hartsfield-Jackson Atlanta International Airport (ATL),Chicago O’Hare International Airport (ORD), Dallas/Fort Worth International Airport(DFW), Dulles International Airport near Washington D.C. (IAD) and San Francisco Inter-national Airport (SFO). In this study, we consider BSED and MF values that are deemedfeasible in the 2030-2050 time-frame, according to Bradley and Droney [11, 12], Pornetet al. [13], National Academies of Sciences Engineering and Medicine [3], Delhaye andRostek [14] and Friedrich and Robertson [15]. The plots reveal that even moderate BSEDand MF values for HEA will lead to a substantial annual battery energy consumption.
3For BSED below 700 Wh/kg, MF ≥50% is deemed impractical to use for any flight distance.
6
To illustrate the magnitude of that increase, notice that aggregate energy demand of SFOin 2018 was 311 GWh, according to the DataSanFrancisco program. Figure 1d confirmsthat electrification at SFO with any BSED-MF combination will substantially amplify saiddemand of 311 GWh. The phenomenon is similar for other airports. For example, ORDhad an annual total energy demand of 441 GWh in 2002 according to the O’Hare Mod-ernization Final Environmental Impact Statement. The projected increase in ORD willmore than double that requirement even at BSED = 700 Wh/kg and MF = 25%. We ignorethe possibility that an HEA may need to charge enough to complete a round-trip journeyfrom and to that airport if the destination location lacks necessary charging infrastructure.Accounting for such possibilities will only increase our demand estimates.
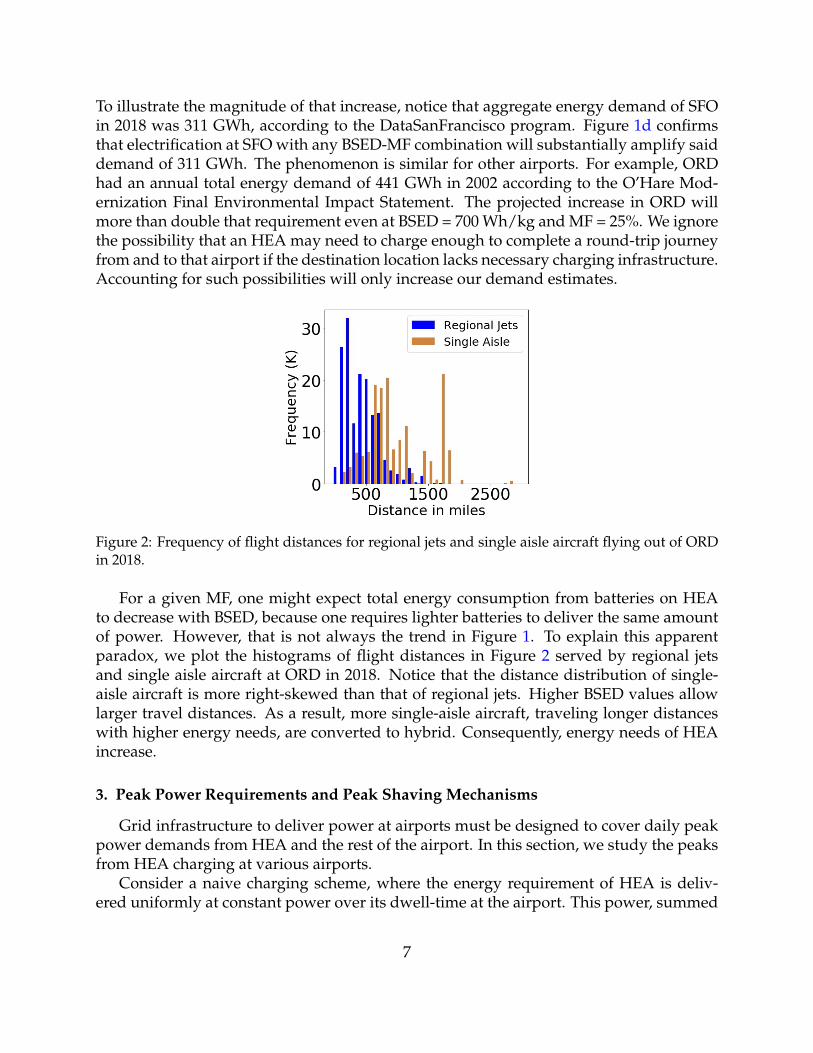
Figure 2: Frequency of flight distances for regional jets and single aisle aircraft flying out of ORDin 2018.
For a given MF, one might expect total energy consumption from batteries on HEAto decrease with BSED, because one requires lighter batteries to deliver the same amountof power. However, that is not always the trend in Figure 1. To explain this apparentparadox, we plot the histograms of flight distances in Figure 2 served by regional jetsand single aisle aircraft at ORD in 2018. Notice that the distance distribution of single-aisle aircraft is more right-skewed than that of regional jets. Higher BSED values allowlarger travel distances. As a result, more single-aisle aircraft, traveling longer distanceswith higher energy needs, are converted to hybrid. Consequently, energy needs of HEAincrease.
3. Peak Power Requirements and Peak Shaving Mechanisms
Grid infrastructure to deliver power at airports must be designed to cover daily peakpower demands from HEA and the rest of the airport. In this section, we study the peaksfrom HEA charging at various airports.
Consider a naive charging scheme, where the energy requirement of HEA is deliv-ered uniformly at constant power over its dwell-time at the airport. This power, summed
7
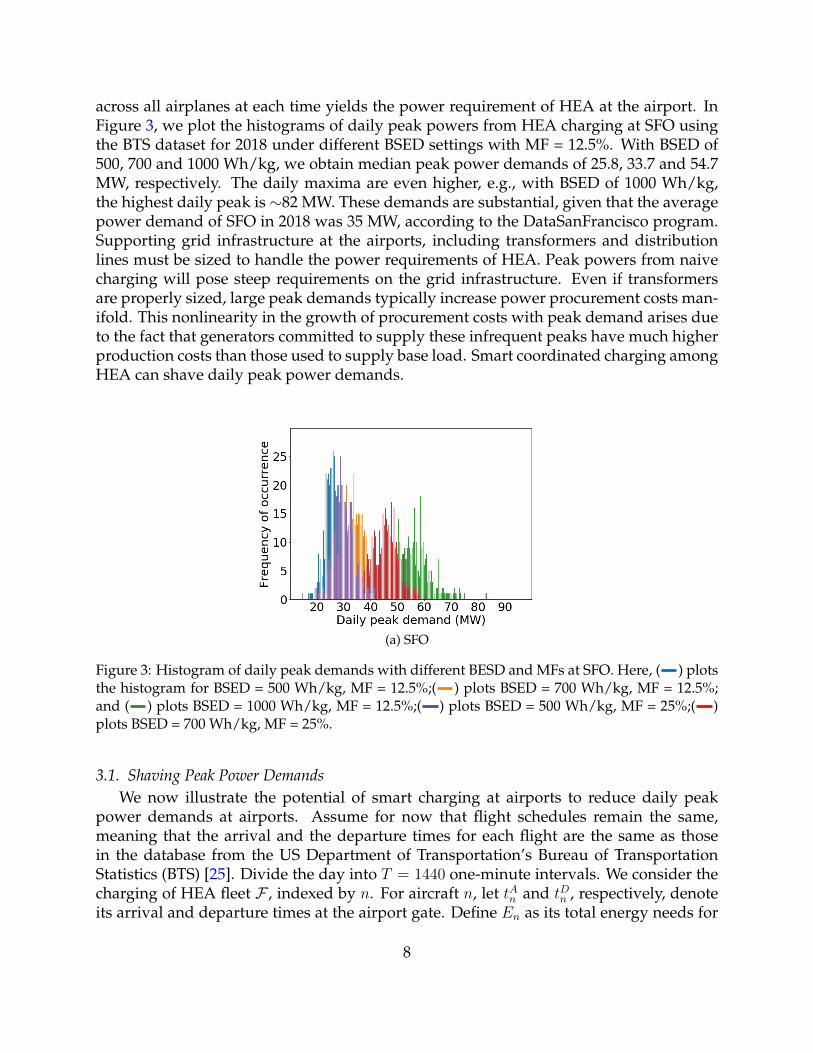
across all airplanes at each time yields the power requirement of HEA at the airport. InFigure 3, we plot the histograms of daily peak powers from HEA charging at SFO usingthe BTS dataset for 2018 under different BSED settings with MF = 12.5%. With BSED of500, 700 and 1000 Wh/kg, we obtain median peak power demands of 25.8, 33.7 and 54.7MW, respectively. The daily maxima are even higher, e.g., with BSED of 1000 Wh/kg,the highest daily peak is ∼82 MW. These demands are substantial, given that the averagepower demand of SFO in 2018 was 35 MW, according to the DataSanFrancisco program.Supporting grid infrastructure at the airports, including transformers and distributionlines must be sized to handle the power requirements of HEA. Peak powers from naivecharging will pose steep requirements on the grid infrastructure. Even if transformersare properly sized, large peak demands typically increase power procurement costs man-ifold. This nonlinearity in the growth of procurement costs with peak demand arises dueto the fact that generators committed to supply these infrequent peaks have much higherproduction costs than those used to supply base load. Smart coordinated charging amongHEA can shave daily peak power demands.
(a) SFO
Figure 3: Histogram of daily peak demands with different BESD and MFs at SFO. Here, ( ) plotsthe histogram for BSED = 500 Wh/kg, MF = 12.5%;( ) plots BSED = 700 Wh/kg, MF = 12.5%;and ( ) plots BSED = 1000 Wh/kg, MF = 12.5%;( ) plots BSED = 500 Wh/kg, MF = 25%;( )plots BSED = 700 Wh/kg, MF = 25%.
3.1. Shaving Peak Power DemandsWe now illustrate the potential of smart charging at airports to reduce daily peak
power demands at airports. Assume for now that flight schedules remain the same,meaning that the arrival and the departure times for each flight are the same as thosein the database from the US Department of Transportation’s Bureau of TransportationStatistics (BTS) [25]. Divide the day into T = 1440 one-minute intervals. We consider thecharging of HEA fleet F , indexed by n. For aircraft n, let tAn and tDn , respectively, denoteits arrival and departure times at the airport gate. Define En as its total energy needs for
8
the next flight leg. With γtn denoting the charging rate (power) drawn by HEA n in periodt, we formulate the smart charging problem as
minimizeT−1∑t=0
(∑n∈F
γtn
)2
,
subject toT−1∑t=0
γtn∆t = En, γtn = 0 for t /∈
[tAn , t
Dn
], n ∈ F ,
0 ≤ γn ≤ Qn
(1)
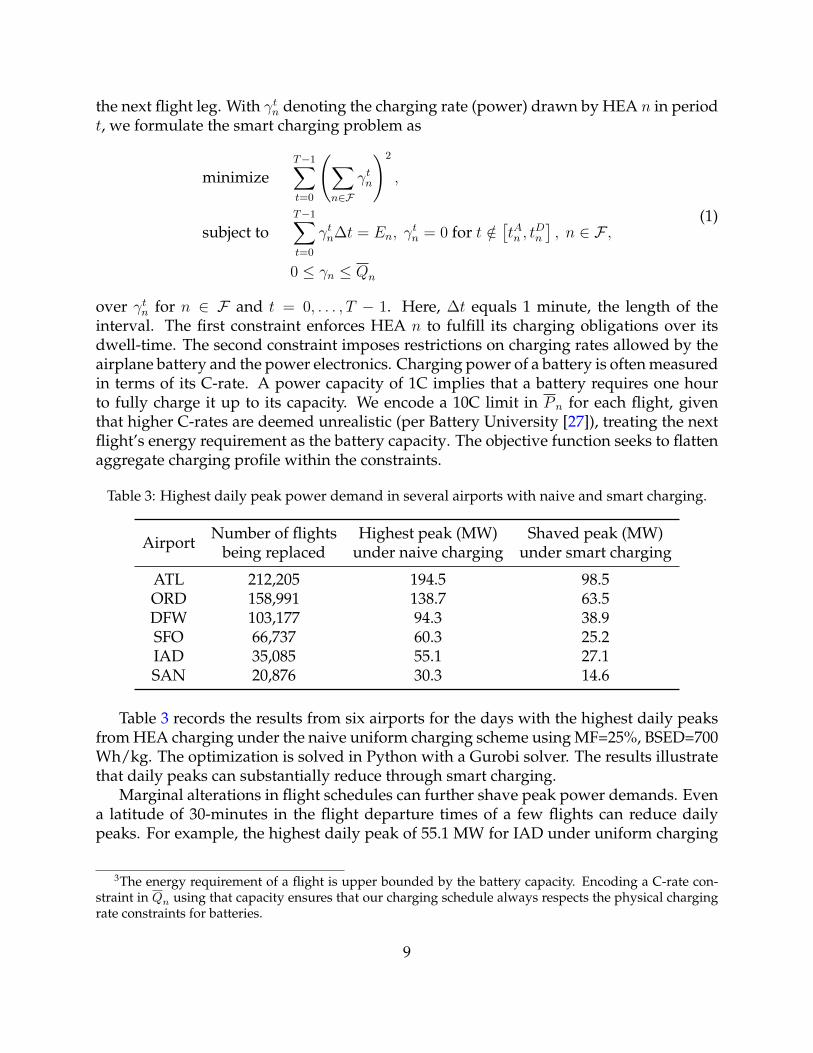
over γtn for n ∈ F and t = 0, . . . , T − 1. Here, ∆t equals 1 minute, the length of theinterval. The first constraint enforces HEA n to fulfill its charging obligations over itsdwell-time. The second constraint imposes restrictions on charging rates allowed by theairplane battery and the power electronics. Charging power of a battery is often measuredin terms of its C-rate. A power capacity of 1C implies that a battery requires one hourto fully charge it up to its capacity. We encode a 10C limit in P n for each flight, giventhat higher C-rates are deemed unrealistic (per Battery University [27]), treating the nextflight’s energy requirement as the battery capacity. The objective function seeks to flattenaggregate charging profile within the constraints.
Table 3: Highest daily peak power demand in several airports with naive and smart charging.
Airport Number of flightsbeing replaced
Highest peak (MW)under naive charging
Shaved peak (MW)under smart charging
ATL 212,205 194.5 98.5ORD 158,991 138.7 63.5DFW 103,177 94.3 38.9SFO 66,737 60.3 25.2IAD 35,085 55.1 27.1SAN 20,876 30.3 14.6
Table 3 records the results from six airports for the days with the highest daily peaksfrom HEA charging under the naive uniform charging scheme using MF=25%, BSED=700Wh/kg. The optimization is solved in Python with a Gurobi solver. The results illustratethat daily peaks can substantially reduce through smart charging.
Marginal alterations in flight schedules can further shave peak power demands. Evena latitude of 30-minutes in the flight departure times of a few flights can reduce dailypeaks. For example, the highest daily peak of 55.1 MW for IAD under uniform charging
3The energy requirement of a flight is upper bounded by the battery capacity. Encoding a C-rate con-straint in Qn using that capacity ensures that our charging schedule always respects the physical chargingrate constraints for batteries.
9
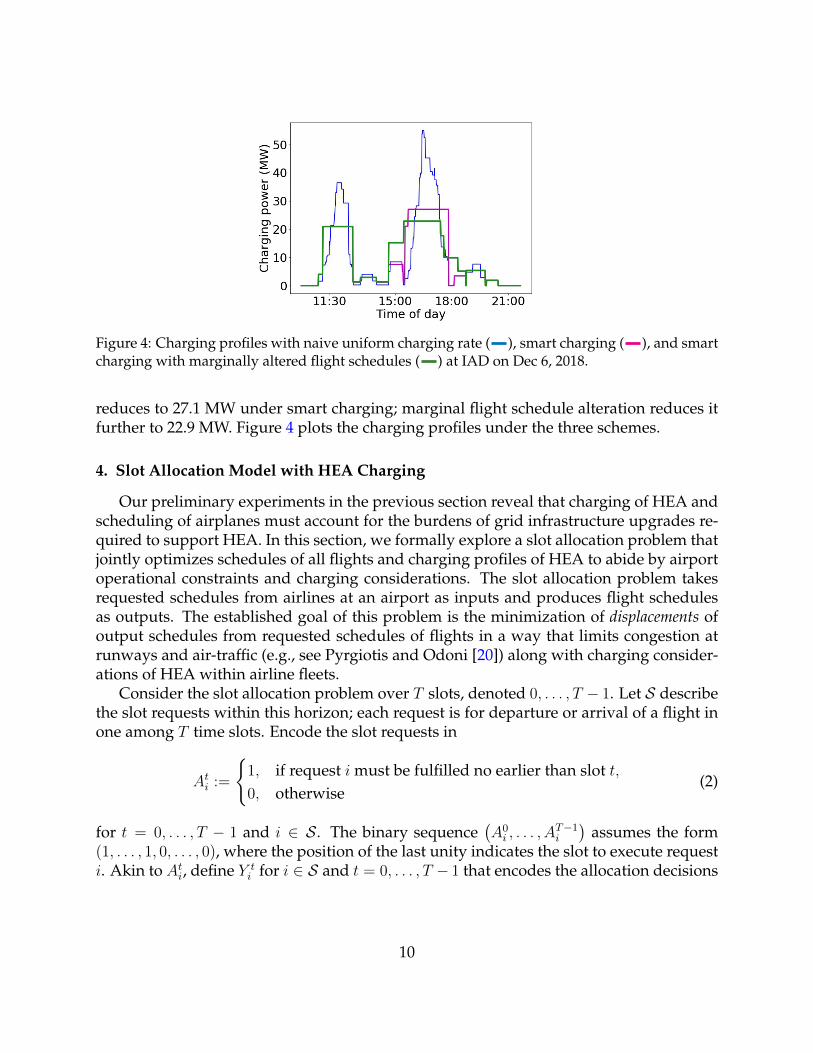
Figure 4: Charging profiles with naive uniform charging rate ( ), smart charging ( ), and smartcharging with marginally altered flight schedules ( ) at IAD on Dec 6, 2018.
reduces to 27.1 MW under smart charging; marginal flight schedule alteration reduces itfurther to 22.9 MW. Figure 4 plots the charging profiles under the three schemes.
4. Slot Allocation Model with HEA Charging
Our preliminary experiments in the previous section reveal that charging of HEA andscheduling of airplanes must account for the burdens of grid infrastructure upgrades re-quired to support HEA. In this section, we formally explore a slot allocation problem thatjointly optimizes schedules of all flights and charging profiles of HEA to abide by airportoperational constraints and charging considerations. The slot allocation problem takesrequested schedules from airlines at an airport as inputs and produces flight schedulesas outputs. The established goal of this problem is the minimization of displacements ofoutput schedules from requested schedules of flights in a way that limits congestion atrunways and air-traffic (e.g., see Pyrgiotis and Odoni [20]) along with charging consider-ations of HEA within airline fleets.
Consider the slot allocation problem over T slots, denoted 0, . . . , T − 1. Let S describethe slot requests within this horizon; each request is for departure or arrival of a flight inone among T time slots. Encode the slot requests in
Ati :=
{1, if request i must be fulfilled no earlier than slot t,0, otherwise
(2)
for t = 0, . . . , T − 1 and i ∈ S. The binary sequence(A0i , . . . , A
T−1i
)assumes the form
(1, . . . , 1, 0, . . . , 0), where the position of the last unity indicates the slot to execute requesti. Akin to Ati, define Y t
i for i ∈ S and t = 0, . . . , T − 1 that encodes the allocation decisions
10

instead of requests. That is,
Y ti :=
{1, if allocation i is fulfilled no earlier than slot t,0, otherwise
(3)
for t = 0, . . . , T − 1 and i ∈ S. For meaningful allocations, we must have
Y ti ≥ Y t+1
i , Y 1i = 1, Y t
i ∈ {0, 1} (4)
for all i ∈ S and t = 0, . . . , T − 1. These constraints imply that(Y 0i , . . . , Y
T−1i
)becomes
a sequence of the form (1, . . . , 1, 0, . . . , 0), where the position of the last unity describesthe slot allocated to request i. Runway capacity is typically limited and is described bythe number R of arrivals and departures that an airport can handle within a horizon of Lslots. Thus, we impose the constraint
∑i∈S
min{t+L,T−1}∑τ=t
(Y τi − Y τ+1
i
)≤ R (5)
for each t = 0, . . . , T − 1.Let C describe the set of pairs (j, j′) of requests from S, where j is an arrival request
and j′ is the corresponding departure request. Then, we impose a lower bound W j,j′ onconnecting times for flights at the airport as
T−1∑t=0
(Y tj′ − Y t
j
)≥ W j,j′ (6)
for all (j, j′) ∈ C. We assume that all requests in S are in arrival-departure pairs in C.Let CH denote the subset of C with requests of HEA. For (j, j′) ∈ CH, let Ej,j′ denote
the total energy demand for the aircraft whose arrival/departure requests are indexed byj, j′. Let γtj,j′ denote the charging rate during slot t for the battery of the aircraft that isidentified by the requests j, j′. The energy needs of that aircraft is enforced via
T−1∑t=0
(Y tj′ − Y t
j
)γtj,j′∆t = Ej,j′ , γtj,j′ ≥ 0. (7)
Here, ∆t is the length of the time slot. Such a constraint is enforced for all (j, j′) ∈ CH. Inaddition, we impose two sets of constraints on the power delivered to the HEA. First, theaggregate power for charging all HEA across the airport is constrained by P , the capacitydefined by the grid infrastructure at the airport, as∑
(j,j′)∈CH
(Y tj′ − Y t
j
)γtj,j′ ≤ P (8)
11
for each t = 0, . . . , T−1. Second, we enforce that charging rates for each individual batterydoes not exceed 10C. Specifically, we impose an upper bound Qj,j′ on the charging rate ofthe form
γtj,j′ ≤ Qj,j′ (9)
for each (j, j′) ∈ CH and t = 0, . . . , T − 1. Similar to that in (1), we use the energy require-ment of the flight as a proxy for the battery capacity to compute Qj,j′ .
For a request i ∈ S, define its displacement as the positive (respectively, negative) dif-ference X+
i (respectively, X−i ) between the slot time allocated and the slot time requested,i.e.,
X+i :=
T−1∑t=0
(1− Ati
)Y ti , X−i :=
T−1∑t=0
Ati(1− Y t
i
). (10)
With this notation, we formally present the slot allocation problem as the followingoptimization problem.
minimize maxi∈S
max{X+i , X
−i
}+∑i∈S
(X+i +X−i
)+ w
T−1∑t=0
∑(j,j′)∈CH
γtj,j′
2
,
subject to (4) for i ∈ S, t = 0, . . . , T − 1,
(5) for t = 0, . . . , T − 1,
(6) for (j, j′) ∈ C,(7), (8) for (j, j′) ∈ CH,(9) for (j, j′) ∈ CH, t = 0, . . . , T − 1,
(10) for i ∈ S
(11)
over the variables Y , γ and X . The objective function is a weighted combination of threeterms. The first term is the maximum displacement. The second summand equals the to-tal displacement over all flights. The third summand is a penalty that is designed in a waythat minimizing it favors flat aggregate charging profiles of HEA across flights, similar inspirit to the smart charging problem in (1). The positive constant w controls the trade-offbetween minimizing displacements and peak-shaving in charging the HEA. Assigning alow weight w amounts to prioritizing the minimization of displacements of slot requestsat the expense of higher peak powers required to charge the HEA. Note that while P in(8) imposes a hard constraint on the total power drawn by HEA at the airport, the thirdterm in the objective function with w > 0 seeks to additionally flatten the demand profilewithin these limits. P encodes capacity constraints of the supporting grid infrastructureat the airport. Operating within these limits, peak shaving is crucial to minimize energycosts of airports. Sharp peaks in power demands are typically met with expensive gen-erators, the added expense of which are levied on consumers. Given the magnitude of
12
the peak charging power requirements of airports due to HEA charging, electric peak de-mand charges can prove costly for airports. Airlines paying for such charges will likelypass on these costs to passengers, increasing travel costs. Positive w can aid in flatteningthe power profile and reducing the peak power below P .
5. Case Study of Slot Allocation for the JFK Airport
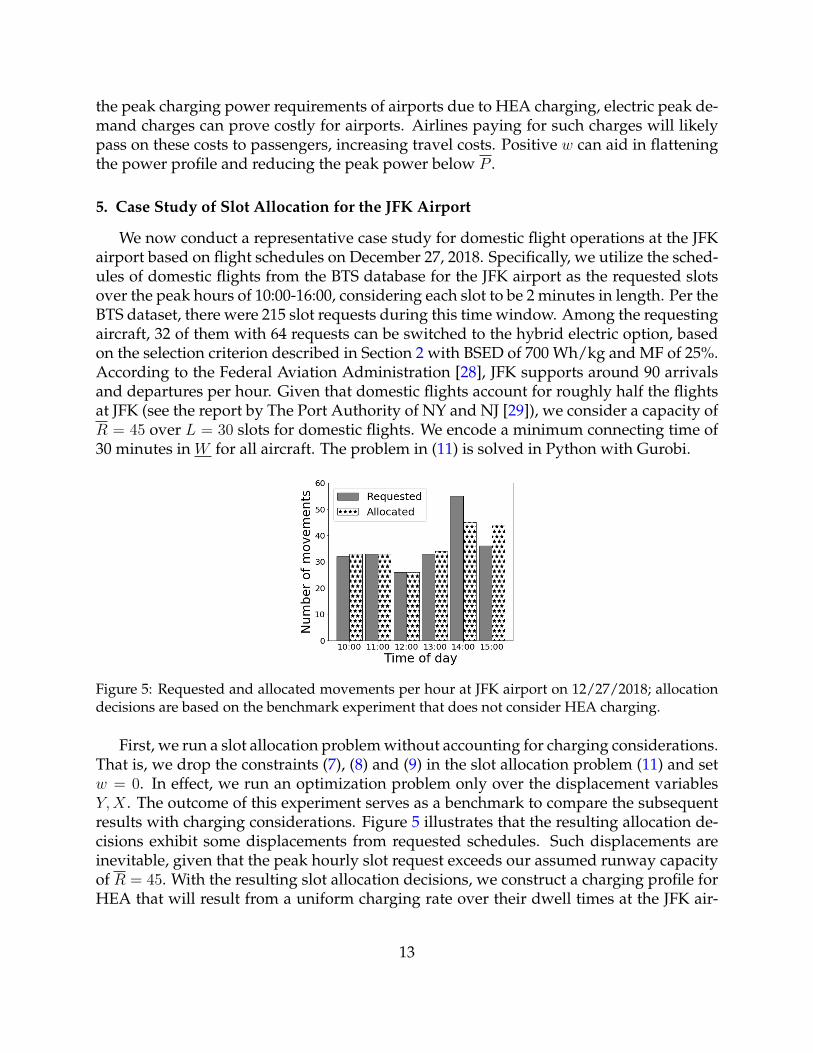
We now conduct a representative case study for domestic flight operations at the JFKairport based on flight schedules on December 27, 2018. Specifically, we utilize the sched-ules of domestic flights from the BTS database for the JFK airport as the requested slotsover the peak hours of 10:00-16:00, considering each slot to be 2 minutes in length. Per theBTS dataset, there were 215 slot requests during this time window. Among the requestingaircraft, 32 of them with 64 requests can be switched to the hybrid electric option, basedon the selection criterion described in Section 2 with BSED of 700 Wh/kg and MF of 25%.According to the Federal Aviation Administration [28], JFK supports around 90 arrivalsand departures per hour. Given that domestic flights account for roughly half the flightsat JFK (see the report by The Port Authority of NY and NJ [29]), we consider a capacity ofR = 45 over L = 30 slots for domestic flights. We encode a minimum connecting time of30 minutes in W for all aircraft. The problem in (11) is solved in Python with Gurobi.
Figure 5: Requested and allocated movements per hour at JFK airport on 12/27/2018; allocationdecisions are based on the benchmark experiment that does not consider HEA charging.
First, we run a slot allocation problem without accounting for charging considerations.That is, we drop the constraints (7), (8) and (9) in the slot allocation problem (11) and setw = 0. In effect, we run an optimization problem only over the displacement variablesY,X . The outcome of this experiment serves as a benchmark to compare the subsequentresults with charging considerations. Figure 5 illustrates that the resulting allocation de-cisions exhibit some displacements from requested schedules. Such displacements areinevitable, given that the peak hourly slot request exceeds our assumed runway capacityof R = 45. With the resulting slot allocation decisions, we construct a charging profile forHEA that will result from a uniform charging rate over their dwell times at the JFK air-
13
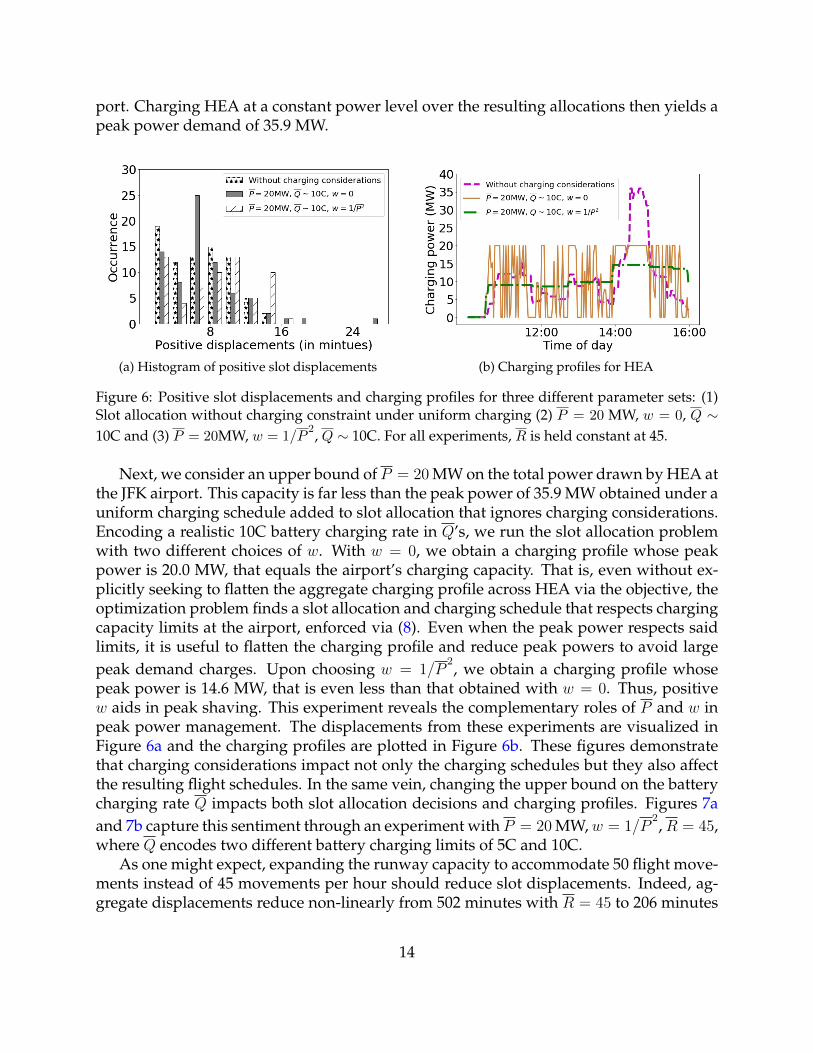
port. Charging HEA at a constant power level over the resulting allocations then yields apeak power demand of 35.9 MW.
(a) Histogram of positive slot displacements (b) Charging profiles for HEA
Figure 6: Positive slot displacements and charging profiles for three different parameter sets: (1)Slot allocation without charging constraint under uniform charging (2) P = 20 MW, w = 0, Q ∼10C and (3) P = 20MW, w = 1/P
2, Q ∼ 10C. For all experiments, R is held constant at 45.
Next, we consider an upper bound of P = 20 MW on the total power drawn by HEA atthe JFK airport. This capacity is far less than the peak power of 35.9 MW obtained under auniform charging schedule added to slot allocation that ignores charging considerations.Encoding a realistic 10C battery charging rate in Q’s, we run the slot allocation problemwith two different choices of w. With w = 0, we obtain a charging profile whose peakpower is 20.0 MW, that equals the airport’s charging capacity. That is, even without ex-plicitly seeking to flatten the aggregate charging profile across HEA via the objective, theoptimization problem finds a slot allocation and charging schedule that respects chargingcapacity limits at the airport, enforced via (8). Even when the peak power respects saidlimits, it is useful to flatten the charging profile and reduce peak powers to avoid largepeak demand charges. Upon choosing w = 1/P
2, we obtain a charging profile whose
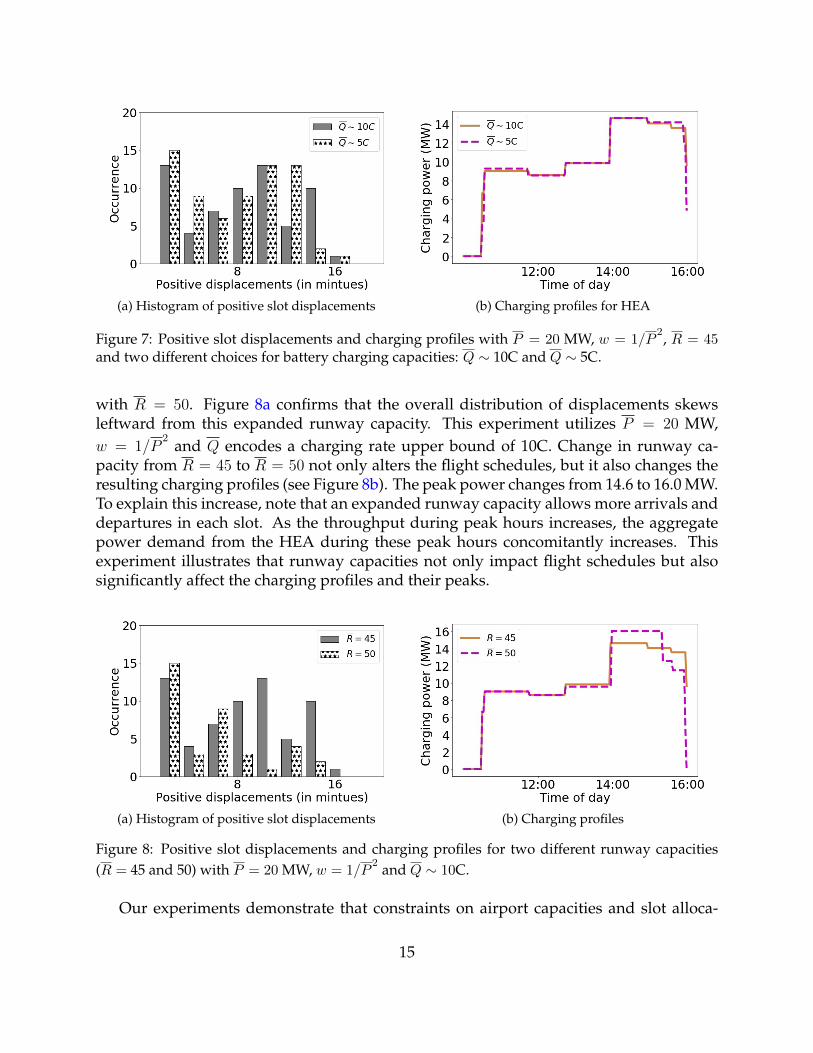
peak power is 14.6 MW, that is even less than that obtained with w = 0. Thus, positivew aids in peak shaving. This experiment reveals the complementary roles of P and w inpeak power management. The displacements from these experiments are visualized inFigure 6a and the charging profiles are plotted in Figure 6b. These figures demonstratethat charging considerations impact not only the charging schedules but they also affectthe resulting flight schedules. In the same vein, changing the upper bound on the batterycharging rate Q impacts both slot allocation decisions and charging profiles. Figures 7aand 7b capture this sentiment through an experiment with P = 20 MW,w = 1/P
2,R = 45,
where Q encodes two different battery charging limits of 5C and 10C.As one might expect, expanding the runway capacity to accommodate 50 flight move-
ments instead of 45 movements per hour should reduce slot displacements. Indeed, ag-gregate displacements reduce non-linearly from 502 minutes with R = 45 to 206 minutes
14
(a) Histogram of positive slot displacements (b) Charging profiles for HEA
Figure 7: Positive slot displacements and charging profiles with P = 20 MW, w = 1/P2, R = 45
and two different choices for battery charging capacities: Q ∼ 10C and Q ∼ 5C.
with R = 50. Figure 8a confirms that the overall distribution of displacements skewsleftward from this expanded runway capacity. This experiment utilizes P = 20 MW,w = 1/P
2and Q encodes a charging rate upper bound of 10C. Change in runway ca-
pacity from R = 45 to R = 50 not only alters the flight schedules, but it also changes theresulting charging profiles (see Figure 8b). The peak power changes from 14.6 to 16.0 MW.To explain this increase, note that an expanded runway capacity allows more arrivals anddepartures in each slot. As the throughput during peak hours increases, the aggregatepower demand from the HEA during these peak hours concomitantly increases. Thisexperiment illustrates that runway capacities not only impact flight schedules but alsosignificantly affect the charging profiles and their peaks.
(a) Histogram of positive slot displacements (b) Charging profiles
Figure 8: Positive slot displacements and charging profiles for two different runway capacities(R = 45 and 50) with P = 20 MW, w = 1/P
2 and Q ∼ 10C.
Our experiments demonstrate that constraints on airport capacities and slot alloca-
15
tion as well as those imposed on HEA charging affect both flight schedules and chargingprofiles with adoption of HEA in commercial aviation. One cannot simply tackle flightscheduling and HEA charging separately; these two questions are inextricably linked. Weremark that while we only report the results from JFK, the framework is general and canbe applied to any airport.
6. Conclusions and Future Directions
HEA technology is maturing fast. They are projected to become viable for commer-cial aviation over the next few decades. While their overall energy needs at a nationalscale had been estimated before, we took a much more nuanced view of airport opera-tions with HEA in this paper. Specifically, we provided a framework to gauge the energyneeds of operating a specific flight path with plausible hybrid electric options. This cal-culation allowed us to estimate the substantial increase in energy demands at major USairports with likely technology growth scenarios. We showed through various examplesthat one must carefully design the charging profile of HEA at airports to reduce peakpower demands. Smart management of HEA charging profiles and slight alterations offlight schedules can help to significantly reduce peak power demands at airports. Suchreductions can lighten the burdens of required grid infrastructure upgrades and allowairports to avoid peak electric demand charges. Building on this observation, we thenproposed a slot allocation model that seeks to both minimize displacements of slots fromrequested schedules and flatten aggregate charging profiles. We illustrated our proposedformulation through a case study for JFK airport. The key insight from our analysis is thatadoption of HEA within airline fleets will require coordination between flight schedulingand HEA charging. Scheduling and charging cannot be solved separately.
Our slot allocation model with HEA charging is designed for a single airport. Sucha framework can be extended to jointly schedule flights and charge HEA across severalairports. That framework will allow us to relax the requirement that each airport mustfulfill the charging needs of all its outgoing flights. Rather, one can charge HEA at onlya few airports that upgrade their grid infrastructure. We do not anticipate conceptualdifficulties in formulating such a problem. However, solving such a optimization problemat scale will invariably require careful algorithm design. Note that our slot allocationmodel is meant as a planning tool that solves the problem prior to the date the flightsare operated. Real-time contingencies inevitably require modifications of such plans. Weplan to enhance our slot allocation model to include tactical recourse decisions that adaptto said contingencies. In this paper, we have not explicitly modeled the costs of HEAcharging. In future work, we aim to study the design of contracts among electric utilities,airports and airlines to pay for powering HEA. Such a study will allow us to estimate howHEA adoption will impact flight ticket prices as such costs trickle down to passengers.
16
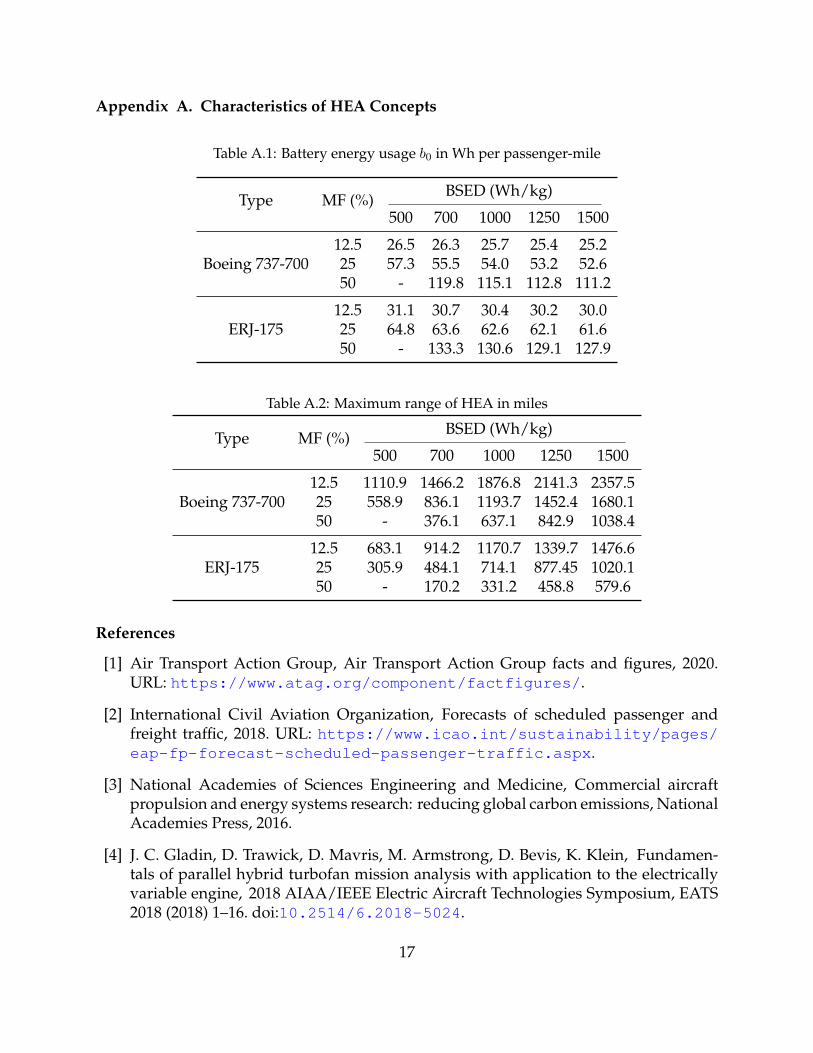
Appendix A. Characteristics of HEA Concepts
Table A.1: Battery energy usage b0 in Wh per passenger-mile
Type MF (%) BSED (Wh/kg)
500 700 1000 1250 1500
Boeing 737-70012.5 26.5 26.3 25.7 25.4 25.225 57.3 55.5 54.0 53.2 52.650 - 119.8 115.1 112.8 111.2
ERJ-17512.5 31.1 30.7 30.4 30.2 30.025 64.8 63.6 62.6 62.1 61.650 - 133.3 130.6 129.1 127.9
Table A.2: Maximum range of HEA in miles
Type MF (%) BSED (Wh/kg)
500 700 1000 1250 1500
Boeing 737-70012.5 1110.9 1466.2 1876.8 2141.3 2357.525 558.9 836.1 1193.7 1452.4 1680.150 - 376.1 637.1 842.9 1038.4
ERJ-17512.5 683.1 914.2 1170.7 1339.7 1476.625 305.9 484.1 714.1 877.45 1020.150 - 170.2 331.2 458.8 579.6
References
[1] Air Transport Action Group, Air Transport Action Group facts and figures, 2020.URL: https://www.atag.org/component/factfigures/.
[2] International Civil Aviation Organization, Forecasts of scheduled passenger andfreight traffic, 2018. URL: https://www.icao.int/sustainability/pages/eap-fp-forecast-scheduled-passenger-traffic.aspx.
[3] National Academies of Sciences Engineering and Medicine, Commercial aircraftpropulsion and energy systems research: reducing global carbon emissions, NationalAcademies Press, 2016.
[4] J. C. Gladin, D. Trawick, D. Mavris, M. Armstrong, D. Bevis, K. Klein, Fundamen-tals of parallel hybrid turbofan mission analysis with application to the electricallyvariable engine, 2018 AIAA/IEEE Electric Aircraft Technologies Symposium, EATS2018 (2018) 1–16. doi:10.2514/6.2018-5024.
17
[5] C. Lents, L. Hardin, J. Rheaume, L. Kohlman, Parallel hybrid gas-electric gearedturbofan engine conceptual design and benefits analysis, 52nd AIAA/SAE/ASEEJoint Propulsion Conference, 2016 (2016) 1–13. doi:10.2514/6.2016-4610.
[6] P. Bertrand, T. Spierling, C. E. Lents, Parallel hybrid propulsion system for a regionalturboprop: Conceptual design and benefits analysis (2019) 4466.
[7] A. W. Schafer, S. R. Barrett, K. Doyme, L. M. Dray, A. R. Gnadt, R. Self, A. O’Sullivan,A. P. Synodinos, A. J. Torija, Technological, economic and environmental prospectsof all-electric aircraft, Nature Energy 4 (2019) 160–166.
[8] G. E. Wroblewski, P. J. Ansell, Mission Analysis and Emissions for Conventionaland Hybrid-Electric Commercial Transport Aircraft, Journal of Aircraft (2019) 1–14.doi:10.2514/1.c035070.
[9] K. Zografos, M. Madas, K. Androutsopoulos, Increasing airport capacity utilisationthrough optimum slot scheduling:review of current developments and identificationof future needs, Journal of Scheduling 20 (2017) 3–24.
[10] A. R. Gnadt, R. L. Speth, J. S. Sabnis, S. R. Barrett, Technical and environmentalassessment of all-electric 180-passenger commercial aircraft, Progress in AerospaceSciences 105 (2019) 1–30.
[11] M. K. Bradley, C. K. Droney, Subsonic ultra green aircraft research: Phase I, 2011.
[12] M. K. Bradley, C. K. Droney, Subsonic ultra green aircraft research: Phases II, 2015.
[13] C. Pornet, C. Gologan, P. C. Vratny, A. Seitz, O. Schmitz, A. T. Isikveren, M. Hornung,Methodology for Sizing and Performance Assessment of Hybrid Energy Aircraft,Journal of Aircraft 52 (2014) 341–352. doi:10.2514/1.c032716.
[14] J. Delhaye, P. Rostek, Hybrid Electric Propulsion Europe-Japan Symposium Electri-cal Technologies for the Aviation of the Future, Europe-Japan Symposium ElectricalTechnologies for the Aviation of the Future (2015).
[15] C. Friedrich, P. Robertson, Hybrid-Electric Propulsion for Aircraft, Journal of Air-craft 52 (2014) 176–189. doi:10.2514/1.c032660.
[16] NERA Economic Consulting, Study to assess the effects of different slot allocationschemes, Report, European Commission, DG TREN, London, 2004.
[17] A. Czerny, P. Forsyth, D. Gillen, H. Niemeier, Airport Slots: International Experi-ences and Options for Reform, Ashgate Publishing, Farnham, UK, 2008.
[18] L. Corolli, G. Lulli, L. Ntaimo, The time slot allocation problem under uncertaincapacity, Transportation Research Part C: Emerging Technologies 46 (2014) 16–29.
18
[19] U. Benlic, Heuristic search for allocation of slots at network level, TransportationResearch Part C: Emerging Technologies 86 (2018) 488–509.
[20] N. Pyrgiotis, A. Odoni, On the impact of scheduling limits: A case study at NewarkLiberty International airport, Transportation Science 50 (2016) 150–165.
[21] A. Jacquillat, A. R. Odoni, A roadmap toward airport demand and capacity man-agement, Transportation Research Part A: Policy and Practice 114 (2018) 168–185.
[22] N. A. Ribeiro, A. Jacquillat, A. P. Antunes, A. R. Odoni, J. P. Pita, An optimizationapproach for airport slot allocation under IATA guidelines, Transportation ResearchPart B: Methodological 112 (2018) 132–156.
[23] N. A. Ribeiro, A. Jacquillat, A. P. Antunes, A large-scale neighborhood search ap-proach to airport slot allocation, Transportation Science 53 (2019) 1772–1797.
[24] Federal Aviation Administration, Cost of delay estimates, 2020. URL:https://www.faa.gov/data_research/aviation_data_statistics/media/cost_delay_estimates.pdf, Accessed: 2021-08-16.
[25] US Department of Transportation’s Bureau of Transportation Statistics (BTS), Air-line on-time performance data, 2018. URL: https://www.transtats.bts.gov/Fields.asp?gnoyr_VQ=FGK.
[26] US Department of Transportation’s Bureau of Transportation Statistics (BTS), US AirCarrier Traffic Statistics through June 2020, 2020. URL: https://www.transtats.bts.gov/TRAFFIC/.
[27] Battery University, BU-401a: Fast and Ultra-fast Chargers, 2021. URL:https://batteryuniversity.com/article/bu-401a-fast-and-ultra-fast-chargers, Accessed: 2021-08-16.
[28] Federal Aviation Administration, John F. Kennedy International (New York) (JFK)Airport Capacity Profile, 2014. URL: https://www.faa.gov/airports/planning_capacity/profiles/media/JFK-Airport-Capacity-Profile-2014.pdf.
[29] The Port Authority of NY and NJ, The Port Authority Aviation Department’s 2018Annual Traffic Report, 2018. URL: https://www.panynj.gov/content/dam/airports/statistics/statistics-general-info/annual-atr/ATR2018.pdf.
19