Embed Size (px)
Citation preview
Impact of Automated Dispensing Cabinet Optimization on the Incidence of Medication
Stockouts
by
OGE AMAKA, PHARM.D.
A thesis proposal submitted in partial fulfillment of
the requirement for the degree of
MASTER OF SCIENCE
IN
Pharmacy Leadership and Administration
Chair of Committee: Divya Varkey
Co-Chair of Committee: Avani Desai
Committee Member: Oliver Egwim
Committee Member: Martina Iwuorie
University of Houston College of Pharmacy
March 2020
2
ACKNOWLEDGEMENTS
Oliver Egwim, PharmD, MBA, Pharmacy Director, LBJ Hospital, Harris Health System
Martina Iwuorie, PharmD, MBA, Pharmacy Operations Manager, LBJ Hospital, Harris
Health System
Divya Varkey, PharmD, MS, Clinical Associate Professor, University of Houston
College of Pharmacy
Avani Desai, PharmD, MS, BCPS, Clinical Assistant Professor, University of Houston
College of Pharmacy
Goldina Erowele, PharmD, MBA, Administrative Director of Pharmacy, Clinical
Pharmacy Services & Residency Program Director, Harris Health System
Abel Davila, RPh, Ed.D., Pharmacy Practice Advancement Manager and Residency
Program Coordinator, Harris Health System
Sunny Ogbonnaya, PharmD, MBA, Pharmacy Business Director, Harris Health System
Pharmacy Operations Team, LBJ Hospital, Harris Health System
3
IMPACT OF AUTOMATED DISPENSING CABINET OPTIMIZATION ON THE
INCIDENCE OF MEDICATION STOCKOUTS. Oge Amaka, Oliver Egwim, Martina
Iwuorie, Avani Desai, Divya Varkey. Harris Health System, Houston, TX. University of Houston
College of Pharmacy, Houston, TX.
PURPOSE: Assess the change in the incidence of medication stockouts and median stockout
duration, and to determine the amount of drug wastage before and after an ADC optimizat ion
project.
METHODS: Par levels were adjusted for several medications in all ADCs hospital wide based on
the BD Pyxis® Enterprise Server Stockout Summary Report suggested par levels during the initial
static intervention. There are six profile ADCs located on the 4th floor that will be included in this
study as the control group. After a one week washout period, a second dynamic intervention was
performed on medications in six profile ADCs located on the third floor of the hospital, which
make up the study group. This intervention involved a second par level adjustment that was
completed utilizing Epic® predictive analytics. This intervention incorporated current patient
census data, active medication orders, and frequency of administration to determine the number of
medication units necessary to care for each patient. Par levels for the study group were adjusted
frequently based on each unit’s patient census. The primary endpoint is to compare the stockout
percentage at one, two, and three months after two, unique ADC optimization interventions and
determine the cost of the impact of each intervention. Secondary endpoints include the change in
median stockout duration and the amount of expired or wasted medications after optimizat ion
compared to baseline data.
RESULTS: The dynamic intervention contributed to a greater reduction in stockouts in the study
group when compared to the static intervention, but was associated with a higher labor cost to
perform during the implementation phase. The median stockout duration improved in each study
group for two months after the respective optimizations. The interventions also contributed to a
reduction in the amount of medication wasted from the ADCs.
CONCLUSION: ADC optimization led to an overall reduction in the incidence of stockouts, and
contributed to a reduction in median stockout duration and medication waste. The labor costs to
carry out the interventions should be considered when performing ADC optimization.
4
TABLE OF CONTENTS
ACKNOWLEDGMENTS ............................................................................... 2
ABSTRACT .................................................................................................... 3
LIST OF TABLES .......................................................................................... 5
LIST OF FIGURES......................................................................................... 6
REFERENCES......................................................................................................16

5
LIST OF TABLES
1 Percent Difference in Average Weekly Stockout Percentage ................................. 11
2 Cost per Impact of Static and Dynamic Interventions .......................................... 12
3 Monthly Median Stockout Duration ............................................................... 12

6
LIST OF FIGURES
1 ADC Optimization Methodology at LBJ Hospital ................................................ 9
2 Average Weekly Stockout Percentage Trend .................................................... 11
3 Average Weekly Stockout Percentage Trend - Controlled Substances and Non-Controlled
Substances .............................................................................................. 11
7
Background
Automated dispensing cabinet (ADCs) technology is widely used within the medication use process. These cabinets provide decentralized medication distribution in close proximity to the patient, with increased efficiency without compromising patient safety1,2. ADCs provide
medications in a timely manner and can also help improve charge capture and documentation, assist with controlled substance management, and reduce overall labor costs for the pharmacy department.3 As of 2007, more than 80% of hospitals use ADCs for medication distribution. 4
According to a national survey of hospitals conducted in 2017, the percentage of hospitals utilizing
ADC technology for maintenance dose distribution continues to rise each year.5 Stockouts in the ADC occur when a particular medication’s supply reaches zero, and the medication is unavailable for immediate administration to the patient. Stockouts have significant
implications on pharmacy and nursing workflows, and can lead to medication delays and negatively impact patient care if not replenished in an appropriate time frame. At times, nurses may borrow medications from a neighboring unit if a medication has stocked out in their unit, as this is often a quicker solution than waiting for pharmacy to replenish the medication.
The Institute for Safe Medication Practices (ISMP) provides guidelines for safe use of automated dispensing cabinets. Among the processes within the guidelines is selecting and maintaining optimal ADC inventory. Select ISMP recommendations include: (1) Having an interdisciplinary
committee provide medication safety oversight of drug availability in the ADC by establishing criteria for including or excluding medications, (2) Limiting the overall quantity of medications and variety of medication concentrations to a number/selection sufficient to care for patients, (3) Assigning appropriate minimum and maximum periodic automatic replenishment (PAR) levels
designed to address drug shortages and the risk of multifold overdosing, and (4) Regularly analyzing ADC activity reports to determine the appropriate quantity and variety of medications available based on patient unit needs1. As a result, healthcare institutions utilizing ADCs often devote significant resources to ADC maintenance to ensure that medications are readily available
for administration when needed. In a study conducted by McCarthy et al., ADC optimization initiatives led to a decrease in pharmacy technician labor, reduction in stockouts, and improved medication turnaround times.
Interventions included an adjustment of par inventory levels and expansion of medications considered “standard stock” in the ADC. It also included removal of infrequently prescribed or used medications, which led to cost savings since those medications were less likely to expire in the ADC. Pharmacy department ADC super users along with vendor-provided education and
system data reports proved to be useful resources in the success of the project implementation.6
Two ADC optimization methods were compared in a study by O’Neil, et al. Eight ADCs were optimized by removal of medications unused in over 180 days, movement of stock to account for
space and unit needs, and one of two par level adjustment methods. A standard inventory formula , which accounted for average daily vend count, the highest daily vend counts, and the maximum time between deliveries, was used to adjust par levels for four of the ADCs while average daily usage was used for the other four ADCs. Optimization via the standard inventory formula resulted
in a positive impact on the study outcomes, including stockout percentage and vend:fill ratio.7
8
Lyndon B. Johnson (LBJ) Hospital, a level three trauma center in Houston, TX, dispenses roughly 90% of its medication doses from ADCs. The remaining medications are prepared and dispensed
from the central pharmacy. Over three million doses were dispensed by the pharmacy department between March 2018 and February 2019, fiscal year 2019. The hospital’s average stockout rate for the year was consistently above 1%, which equates to an estimated minimum of 40 to 50 stockouts per day. A stockout percentage goal of less than 1% is widely accepted in health-systems and
supported by BD®, the institution’s ADC vendor. Scheduled daily ADC replenishment occurs at night in order to minimize workflow interruptions. During this time, the ADCs are refilled by technicians based on the predetermined par levels. Stockouts, however, must be refilled throughout the day as they occur, which often takes time away from other duties that need to be performed
during the day and evening. A large number of stockouts can significantly impact central pharmacy operations. As a result, stockout management remains a priority for the pharmacy department. In March 2019, BD® performed an on-site assessment of ADC utilization at LBJ Hospital. Their assessment uncovered opportunities for improvement in areas that increase the potential for
stockouts, frequent refills, and stagnant inventory. Given this background, the specific aims of this project are to assess the change in the rate of stockouts, assess the change in stockout replenishment turnaround time via the stockout duration, and to determine the amount of drug wastage before and after an ADC optimization project.
Methods
LBJ Hospital is a community-owned, 215-bed academic hospital within Harris Health System that
utilizes the BD Pyxis Medstation® ES System for decentralized medication distribution. LBJ Hospital services include medical, surgical, and neonatal intensive care units, general medical-surgical units, and several in-house clinics. 66 ADCs are in use hospital-wide, including Anesthesia-stations (A-stations). Stockouts and ordered medications that are not loaded in the
ADCs are replenished throughout the day on demand by one runner pharmacy technician, while all ADCs are refilled on a nightly basis based on predetermined par inventory levels. Prior to ADC optimization, BD® performed preventative maintenance on the ADC system in
February 2019, which included software and antiviral/firmware updates, hardware and RAM health checks, and hardware defragmentation. A complete ADC overhaul was also performed throughout the hospital over a 22 day period in March through April 2019. This overhaul included removal of expired or damaged medications from inventory, replacement of missing cubies,
dividers, and damaged bins, reconfiguration and reorganization of storage space, and cleaning of machinery and refrigerators. Technicians were also re-educated on proper techniques for loading and unloading of ADCs.
During the initial static intervention, par levels were adjusted for several medications in all ADCs hospital wide based on the BD Pyxis® Enterprise Server Stockout Summary Report suggested par levels. This tool provides a recommended minimum and maximum using the historical number of vends per day for a three and ten day supply. The goal of this intervention was to rapidly correct
several minimums (i.e., minimums of zero, one, and two) that were suspected to be contributing to stockouts. In the event that the recommended maximum was not feasible due to configuration or space constraints in the ADC, the maximum was adjusted to accommodate the capacity of the ADC.
After a one week washout period, a second dynamic intervention was performed on medications in the study group, servicing medical/surgical units. This intervention involved a second par level
9
adjustment that was completed utilizing Epic® predictive analytics. Using current patient census data, active medication orders, and frequency of administration, the number of medication units
necessary to care for each patient for one day was determined. This information was then used to identify the quantity necessary for a minimum of three days’ supply and maximum of five days’ supply for each medication. Par levels for medications that were loaded but not ordered within the week of census data collection were adjusted to accommodate a three day minimum and five day
maximum for one patient. In the event that the five day supply was unable to be achieved in the ADC due to space limitations, a four day supply was used. Par levels for the six ADCs were adjusted frequently based on each unit’s patient census. The census report is run daily, and captures active orders as of midnight each day.
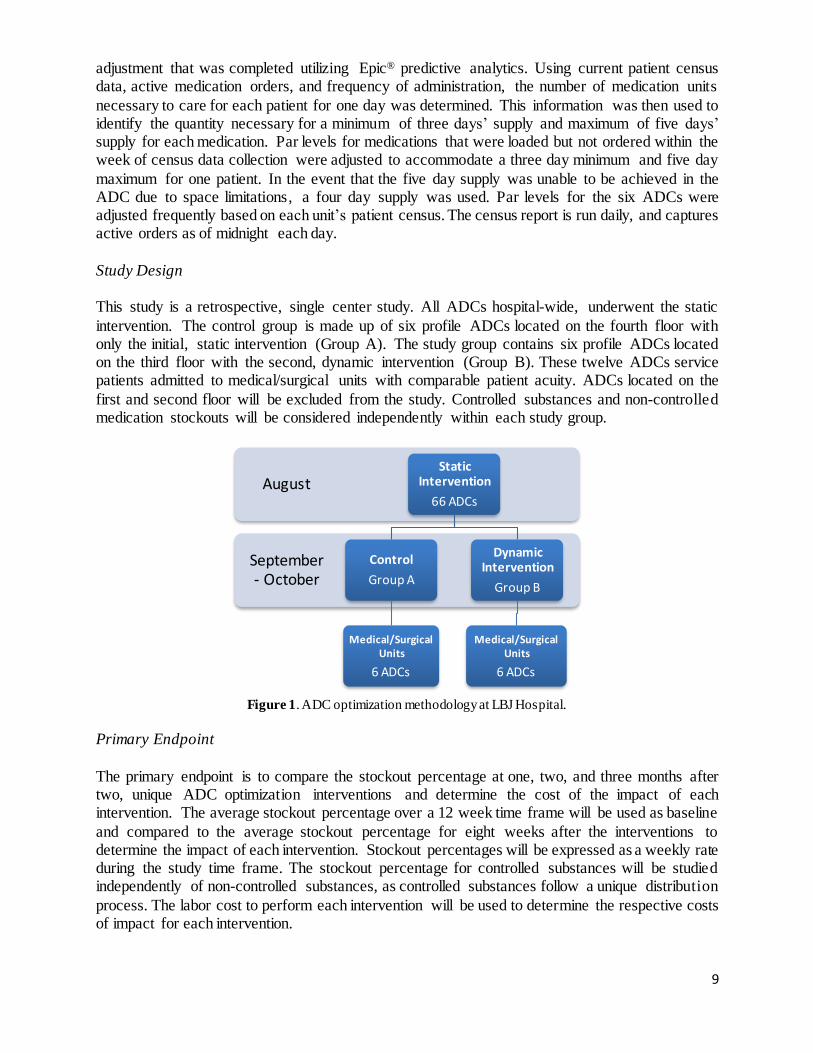
Study Design This study is a retrospective, single center study. All ADCs hospital-wide, underwent the static
intervention. The control group is made up of six profile ADCs located on the fourth floor with only the initial, static intervention (Group A). The study group contains six profile ADCs located on the third floor with the second, dynamic intervention (Group B). These twelve ADCs service patients admitted to medical/surgical units with comparable patient acuity. ADCs located on the
first and second floor will be excluded from the study. Controlled substances and non-controlled medication stockouts will be considered independently within each study group.
Figure 1. ADC optimization methodology at LBJ Hospital.
Primary Endpoint
The primary endpoint is to compare the stockout percentage at one, two, and three months after two, unique ADC optimization interventions and determine the cost of the impact of each intervention. The average stockout percentage over a 12 week time frame will be used as baseline
and compared to the average stockout percentage for eight weeks after the interventions to determine the impact of each intervention. Stockout percentages will be expressed as a weekly rate during the study time frame. The stockout percentage for controlled substances will be studied independently of non-controlled substances, as controlled substances follow a unique distribution
process. The labor cost to perform each intervention will be used to determine the respective costs of impact for each intervention.
September - October
August Static
Intervention
66 ADCs
Control
Group A
Medical/Surgical Units
6 ADCs
Dynamic Intervention
Group B
Medical/Surgical Units
6 ADCs

10
Secondary Endpoints Secondary endpoints include the change in stockout duration and the amount of expired or wasted medications after optimization compared to baseline data. Stockout duration captures the length
of time between the creation of a stockout and time of medication replenishment. The Stockout Duration report provided by BD® will be used to analyze the median duration. The median will be used as a measure of central tendency due to the presence of outliers. Durations greater than 24 hours will be excluded to prevent skewing of the data, as the extended time to refill could be a
result of national backorders, shortages, or non-formulary medications.
Statistical and Financial Analysis
Descriptive statistics will be used to analyze the primary and secondary endpoints. The cost of the impact of each intervention will be determined using an approximate 12 hours (static) and 80 hours (dynamic) of labor performed by a registered pharmacy technician at an hourly rate of $18 per hour. The financial impact will be based on the labor required to optimize six ADCs.
Results Automated dispensing cabinets throughout the hospital were optimized via the static intervention in week 16. ADCs in Group B underwent a second optimization weekly via the dynamic
intervention between weeks 19 and 26. Eight weeks of the mean number of stockouts data was collected for the study group, Group B. The six ADCs in Group B were stocked with a total of 1,332 medications prior to optimization, while the six ADCs in Group A were stocked with a total of 1,657 medications prior to optimization.
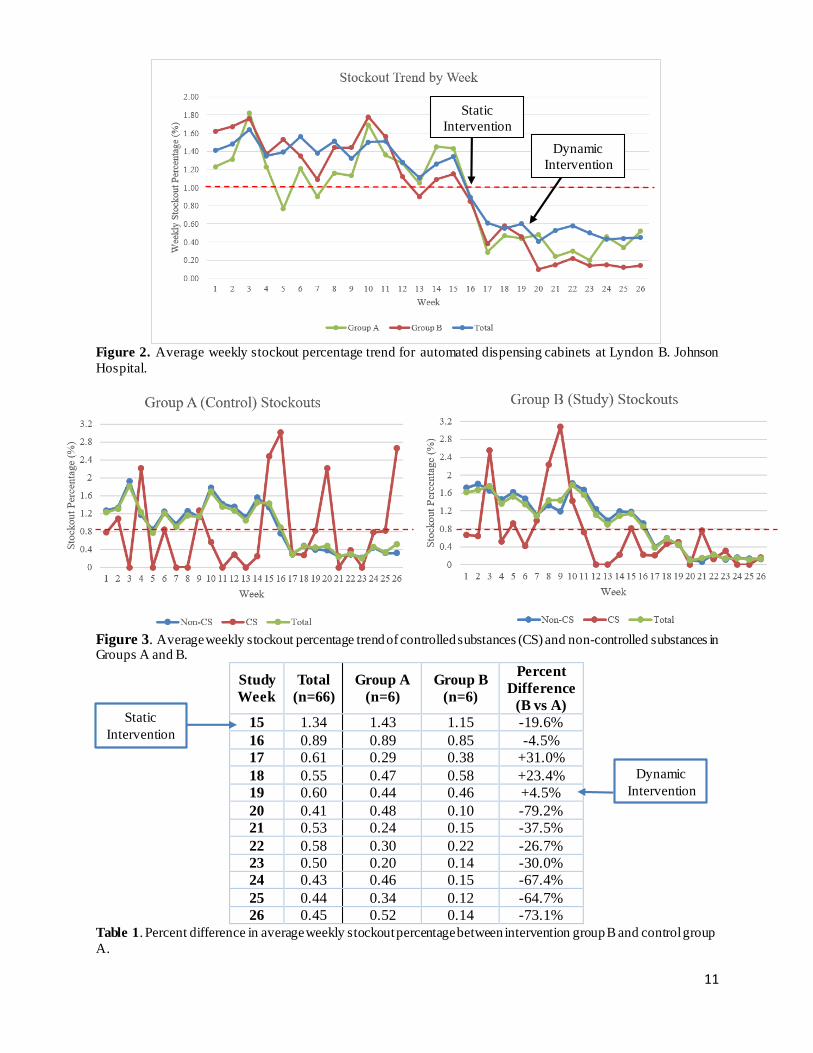
Primary Endpoint The initial, static, intervention was completed throughout the hospital during week 16, and led to
a reduction in the overall stockout percentage, as evidenced by the total downtrend (Figure 2). The dynamic intervention began during week 19 in Group B and continued throughout the duration of the study (Figure 2). The average stockout percentage during the study period decreased to 0.42% in the control group and 0.30% in the study group. The dynamic intervention contributed to a
greater reduction in stockouts in Group B in comparison to Group A, as shown by the percent difference in mean stockout percentages (Table 1). Figure 3 depicts the average weekly stockout percentages for controlled substances and non-controlled substance in each group, with greater variation appearing in the controlled substances. In Group A, the average stockout percentage for
non-controlled substances and controlled substances during the study period was 0.34% and 0.88%, respectively. In Group B, the average stockout percentage for non-controlled substances and controlled substances during the study period was 0.22% and 0.26%, respectively.
11
Figure 2. Average weekly stockout percentage trend for automated dispensing cabinets at Lyndon B. Johnson
Hospital.
Figure 3. Average weekly stockout percentage trend of controlled substances (CS) and non-controlled substances in Groups A and B.
Study
Week
Total
(n=66)
Group A
(n=6)
Group B
(n=6)
Percent
Difference
(B vs A)
15 1.34 1.43 1.15 -19.6%
16 0.89 0.89 0.85 -4.5%
17 0.61 0.29 0.38 +31.0%
18 0.55 0.47 0.58 +23.4%
19 0.60 0.44 0.46 +4.5%
20 0.41 0.48 0.10 -79.2%
21 0.53 0.24 0.15 -37.5%
22 0.58 0.30 0.22 -26.7%
23 0.50 0.20 0.14 -30.0%
24 0.43 0.46 0.15 -67.4%
25 0.44 0.34 0.12 -64.7%
26 0.45 0.52 0.14 -73.1%
Table 1. Percent difference in average weekly stockout percentage between intervention group B and control group
A.
0.000.200.400.600.801.001.201.401.601.802.00
1 2 3 4 5 6 7 8 9 10 11 12 13 14 15 16 17 18 19 20 21 22 23 24 25 26
Ave
rage
Sto
cko
ut P
erce
nta
ge (%
)
Week
Stockout Trend by Week
Group A Group B Total
Static
Intervention
Dynamic
Intervention
Static
Intervention
Dynamic
Intervention
12
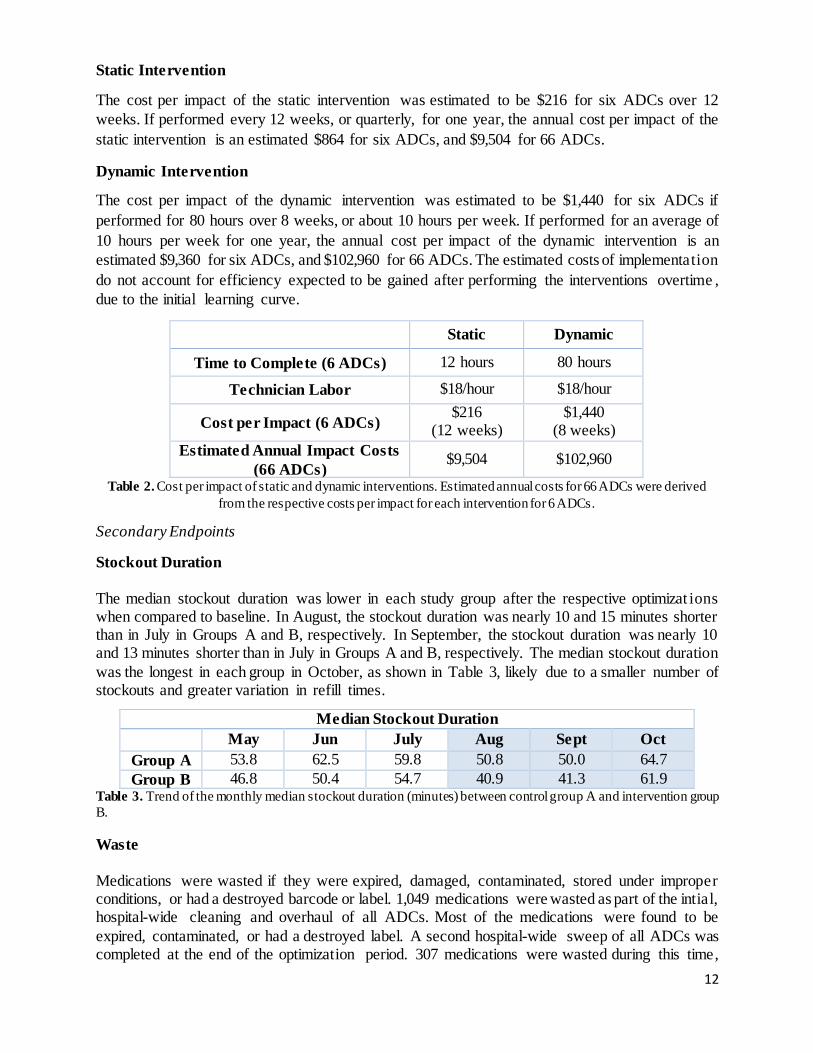
Static Intervention
The cost per impact of the static intervention was estimated to be $216 for six ADCs over 12
weeks. If performed every 12 weeks, or quarterly, for one year, the annual cost per impact of the
static intervention is an estimated $864 for six ADCs, and $9,504 for 66 ADCs.
Dynamic Intervention
The cost per impact of the dynamic intervention was estimated to be $1,440 for six ADCs if
performed for 80 hours over 8 weeks, or about 10 hours per week. If performed for an average of
10 hours per week for one year, the annual cost per impact of the dynamic intervention is an
estimated $9,360 for six ADCs, and $102,960 for 66 ADCs. The estimated costs of implementation
do not account for efficiency expected to be gained after performing the interventions overtime ,
due to the initial learning curve.
Static Dynamic
Time to Complete (6 ADCs) 12 hours 80 hours
Technician Labor $18/hour $18/hour
Cost per Impact (6 ADCs) $216
(12 weeks) $1,440
(8 weeks)
Estimated Annual Impact Costs
(66 ADCs) $9,504 $102,960
Table 2. Cost per impact of static and dynamic interventions. Estimated annual costs for 66 ADCs were derived
from the respective costs per impact for each intervention for 6 ADCs.
Secondary Endpoints
Stockout Duration
The median stockout duration was lower in each study group after the respective optimizat ions when compared to baseline. In August, the stockout duration was nearly 10 and 15 minutes shorter than in July in Groups A and B, respectively. In September, the stockout duration was nearly 10 and 13 minutes shorter than in July in Groups A and B, respectively. The median stockout duration
was the longest in each group in October, as shown in Table 3, likely due to a smaller number of stockouts and greater variation in refill times.
Table 3. Trend of the monthly median stockout duration (minutes) between control group A and intervention group
B.
Waste
Medications were wasted if they were expired, damaged, contaminated, stored under improper conditions, or had a destroyed barcode or label. 1,049 medications were wasted as part of the intial, hospital-wide cleaning and overhaul of all ADCs. Most of the medications were found to be
expired, contaminated, or had a destroyed label. A second hospital-wide sweep of all ADCs was completed at the end of the optimization period. 307 medications were wasted during this time,
Median Stockout Duration
May Jun July Aug Sept Oct
Group A 53.8 62.5 59.8 50.8 50.0 64.7
Group B 46.8 50.4 54.7 40.9 41.3 61.9
13
primarily due to expiration or contamination, which is significantly lower than the preliminary waste collection.
Discussion Prior to this study, the average stockout percentage at LBJ Hospital was consistently greater than
1%, often leading to significant delays in patient care. Several factors contributed to the high stockout percentage including lack of logic-guided par levels, incorrect linking of medications in the ADCs, poor space utilization, and inconsistent loading practices. The results of this study demonstrate that ADC optimization efforts contributed to an overall reduction in the incidence of
stockouts, ultimately allowing for more optimal patient care, and a reduction in the amount of medication waste collected from the ADCs. The turning on of a critical low feature in the ADCs was briefly considered, but was determined not to be necessary given the results of the study. The critical low feature would alert pharmacy staff to refill the ADC once medication supply reaches
pre-determined amount at any given time. Group A experienced an increase in stockouts between weeks 24 – 26. This increase can be explained by either medications that were loaded with suboptimal par levels after the initial
optimization period was completed, medications with unusually high usage that contributed to stockouts, or errors caused by staff. On occasion, technicians inadvertently generated stockouts during the study period when attempting to unload a medication in the ADC. In week 26, more than half of the stockouts for Group A were controlled medications that were loaded for a specific
patient. Loading practices for controlled substances differ from non-controlled substances, in that typically a 24-hour supply of controlled substances are loaded for a patient. At times, this may be only one tablet, generating a stockout once the supply is depleted. These nuances likely explain the increase seen in week 26 in addition to the wide variation seen in Figure 2 in the controlled
substances compared to non-controlled substances. On average, controlled substances account for less than 10% of the total stockouts, thus, the smaller sample size may also contribute to the variation.
Optimization efforts did not significantly impact daily pharmacy workflows as technicians were not required to change how they refill stockouts or complete the nightly replenishment. Thus, the effects on stockout duration are likely attributed to the reduction in overall stockouts. The median stockout duration in August and September was found to be shorter than months prior, though a
longer stockout duration was noted in October for both groups. Group B had approximately 50% less stockouts in October than September, however, there was significant variation in the stockout durations. Additional trends were not identified, therefore, this is a probable explanation for the increase. Group A had a similar number of stockouts in September and October, however, more
controlled medications stocked out in October in comparison to previous months. Controlled substances are typically refilled by a dedicated technician outside of the central pharmacy workflow, and refill time varies significantly based on the individual’s workload. This variation was likely a strong contributor to the longer duration seen in October for Group A. Lastly,
significant drug shortages impacting morphine and fentanyl supply in October were unplanned events that also contributed. The dynamic intervention led to a sustained reduction in stockouts throughout the study period,
however, there were several limitations regarding its implementation. A macro was created in order to establish a database that could be refreshed on demand with updated data from the daily census report. The macro was designed to populate the 3-day minimum and 5-day maximum for
14
the user for each patient’s active medication orders. The complexity of the macro required weeks for completion. The patient census report was scheduled to run each day at midnight. Medications
ordered after this time or ordered as one-time doses were not captured in the daily report, thus, were more likely to appear on the stockout report. Par level recommendations for medications ordered to be given on an “as needed” basis, such as insulin, were determined based on the historical average daily usage data. While the results of the dynamic intervention were promising,
it was a more labor intensive and costly process than the static intervention, as it required par level changes for an average of three days weekly. The review of the patient census data and adjustment of par levels required an average of two to three hours to complete for the six ADCs. Some par level changes required visualization of the assigned pocket in the ADC and verification of
inventory in the central pharmacy, lengthening the process. Although a reduction in waste was achieved at the end of the optimization, the study was not designed to determine a difference in the amount of waste between the study groups. The first
waste collection was collected during the overhaul period and returned a large amount of waste, which was expected. If the first sweep is done comprehensively, a reduction in waste during the second collection is also expected, as most medications loaded are unlikely to expire within six months. The amount of time between the two collections was likely not enough to determine that
optimization contributed to a reduction in waste. Future studies may involve analysis of the waste collected from each study group a year prior to the two interventions compared to waste after the interventions.
Space limitations affected the ability to fill the ADCs with the recommended amount of some medications. Refrigerated items and bulkier items such as nutritional supplement cartons, patient -controlled analgesia (PCA), and large pre-mixed medication bags, frequented the stockout list throughout the study period as a result of this. Many spaces were consolidated and rearranged in
an effort to accommodate larger quantities. To create additional space, medications unused in 60 days or more were unloaded on a monthly basis, with the exception of emergency medications. In theory, this should also reduce the number of expiring medications and waste.
In order to sustain the results of the study, dedicated resources would be required for ADC management. The investment would be expected to result in cost savings of $5,000 from medication waste over three months and $4,000 in savings from unplanned labor to replenish stockouts over 8 weeks. Although the estimated annual savings of $48,000 do not exceed the costs
of implementing the dynamic intervention, there are additional intangible benefits. Anecdotally, the results were felt by pharmacy staff members who recognized that stockouts were occurring infrequently, reducing the number of medication refills. The time that pharmacy staff previously spent refilling stockouts became time saved that could be used to complete outstanding operational
tasks and improve workflow. Nursing staff also noted increased satisfaction as a result of medications being more readily available in their units than they previously were. At the time of this study, there was not a dedicated individual for Pyxis maintenance, thus there
were challenges with ensuring that the data was reviewed consistently. Depending on the desired stockout reduction, resources to perform the static intervention, as opposed to the dynamic intervention, may be sufficient. The benefits of an optimized ADC system are felt across disciplines, therefore the investment of resources will be rewarding to not only the pharmacy
department, but also external customers.
15
Conclusion
Routine ADC optimization is an integral part of pharmacy operations that helps ensure that patient care needs are being met in a timely manner. There are several methods to perform optimizat ion, which may vary between institutions. The static intervention provided a favorable reduction in stockouts, however, the dynamic intervention led to an even greater reduction. Proactive review
of active orders and as-needed par adjustments is necessary in order to minimize the incidence stockouts as much as feasible. The labor costs to carry out the interventions should be considered in addition to benefits when performing ADC optimization. The dynamic intervention requires a significantly greater investment, but provides a more favorable reduction in stockouts. As
efficiency is gained after routine performance of the dynamic intervention, a reduction in the implementation costs is expected.

16
References
1. Institute for Safe Medication Practices. Guidelines for the Safe Use of Automated Dispensing Cabinets. 2019.
2. Douglas et al. Automated dispensing cabinets and nursing satisfaction. Nursing
Management. 2017. 48(11):21-24
3. Rough S, Temple J. Automation in practice: Handbook of Institutional Pharmacy Practice. Bethesda, MD: American Society of Health-System Pharmacists; 2006:329-
352
4. Institute for Safe Medication Practices. Follow ISMP Guidelines to Safeguard the Design and Use of Automated Dispensing Cabinets (ADCs). 2009.
5. Pedersen CA et al. ASHP national survey of pharmacy practice in hospital settings:
prescribing and transcribing—2017. Am J Health-Syst Pharm. 2018; 75:1203-26
6. McCarthy et al. Implementation and optimization of automated dispensing cabinet technology. Am J Health-Syst Pharm. 2016; 73:1531-6
7. O’Neil et al. A comparison of automated dispensing cabinet optimization methods. Am
J Health-Syst Pharm. 2016; 73:975-80