Embed Size (px)
Citation preview

Report ITU-R BS.2213-4 (10/2017)
Impact of audio signal processing and compression techniques on terrestrial FM
sound broadcasting emissions at VHF
BS Series
Broadcasting service (sound)

ii Rep. ITU-R BS.2213-4
Foreword
The role of the Radiocommunication Sector is to ensure the rational, equitable, efficient and economical use of the radio-
frequency spectrum by all radiocommunication services, including satellite services, and carry out studies without limit
of frequency range on the basis of which Recommendations are adopted.
The regulatory and policy functions of the Radiocommunication Sector are performed by World and Regional
Radiocommunication Conferences and Radiocommunication Assemblies supported by Study Groups.
Policy on Intellectual Property Right (IPR)
ITU-R policy on IPR is described in the Common Patent Policy for ITU-T/ITU-R/ISO/IEC referenced in Annex 1 of
Resolution ITU-R 1. Forms to be used for the submission of patent statements and licensing declarations by patent holders
are available from http://www.itu.int/ITU-R/go/patents/en where the Guidelines for Implementation of the Common
Patent Policy for ITU-T/ITU-R/ISO/IEC and the ITU-R patent information database can also be found.
Series of ITU-R Reports
(Also available online at http://www.itu.int/publ/R-REP/en)
Series Title
BO Satellite delivery
BR Recording for production, archival and play-out; film for television
BS Broadcasting service (sound)
BT Broadcasting service (television)
F Fixed service
M Mobile, radiodetermination, amateur and related satellite services
P Radiowave propagation
RA Radio astronomy
RS Remote sensing systems
S Fixed-satellite service
SA Space applications and meteorology
SF Frequency sharing and coordination between fixed-satellite and fixed service systems
SM Spectrum management
Note: This ITU-R Report was approved in English by the Study Group under the procedure detailed in
Resolution ITU-R 1.
Electronic Publication
Geneva, 2017
ITU 2017
All rights reserved. No part of this publication may be reproduced, by any means whatsoever, without written permission of ITU.

Rep. ITU-R BS.2213-4 1
REPORT ITU-R BS.2213-4
Impact of audio signal processing and compression techniques on
terrestrial FM sound broadcasting emissions at VHF
(2011-2013-2015-2016-2017)
TABLE OF CONTENTS
Page
Annex 1 Measurement specification used in Germany for the measurement of the frequency
deviation and multiplex power of FM sound broadcasting transmitters ....................... 4
1 Purpose and scope .......................................................................................................... 4
2 Terms and definitions ..................................................................................................... 4
3 Limits .............................................................................................................................. 5
4 Technical non-compliance values .................................................................................. 6
5 Measurement method ..................................................................................................... 6
5.1 Measuring equipment requirements ................................................................... 6
5.2 Measurement principle ....................................................................................... 7
5.3 Required measurement conditions ...................................................................... 7
5.4 Measurement set-up ............................................................................................ 11
5.5 Measurement procedure ...................................................................................... 11
5.6 Evaluation of frequency deviation and multiplex power .................................... 13
6 Documentation of the results .......................................................................................... 13
7 Standards and Recommendations ................................................................................... 13
Attachment 1 to Annex 1 ........................................................................................................ 14
Record 1 to measurement report .............................................................................................. 19
Annex 2 Measurement results performed in Hungary on the protection levels against
interferers with exceeded MPX power in the FM sound broadcasting .......................... 20
1 Measurement setup and measurement methods ............................................................. 21
1.1 Measurement of RF protection curves ................................................................ 23
1.2 Measurement of the reduction of the peak deviation that can compensate the
effect of the higher MPX power ......................................................................... 24
2 Measurement results ....................................................................................................... 24

2 Rep. ITU-R BS.2213-4
Page
2.1 Measurement of RF protection curves ................................................................ 24
2.2 Measurement of the reduction of the peak deviation that can compensate the
effect of the higher MPX power of the unwanted transmitter ............................ 26
Attachment to Annex 1 List of instruments ........................................................................... 29
Annex 3 Results of measurements performed in France on the protection levels against
interferers with exceeded MPX power in the FM sound broadcasting .......................... 30
1 The bench test ................................................................................................................. 30
2 Measurement results ....................................................................................................... 30
2.1 Statistical figure for the measurement analysis .................................................. 30
2.2 Results ................................................................................................................. 30
3 Conclusion ...................................................................................................................... 33
Attachment to Annex 3 Measurement protocol ...................................................................... 34
1 Introduction .................................................................................................................... 34
2 Bench test design ............................................................................................................ 34
2.1 Filtered white noise according to Recommendation ITU-R BS.559-2 ............... 34
2.2 Multiplex power (MPX) variations on interfering transmitter ........................... 35
2.3 Bench test description ......................................................................................... 37
2.4 Measuring process .............................................................................................. 39
Annex 4 Impact of multiplex power levels higher than 0 dBr on the RF protection ratio of
sound broadcasting emissions in VHF band II ............................................................... 41
1 Introduction .................................................................................................................... 41
2 Measurement setup and measurement methods ............................................................. 44
3 Measurement results ....................................................................................................... 45
4 Consequences ................................................................................................................. 48
5 Conclusions .................................................................................................................... 49
Attachment 1 to Annex 4 Single results of the measurements .............................................. 51
Attachment 2 to Annex 4 Spectrum plots of the unwanted signal ......................................... 56
Annex 5 Measurements of the relationship between loudness and multiplex power in FM
radio performed in France .............................................................................................. 60
1 Introduction .................................................................................................................... 60
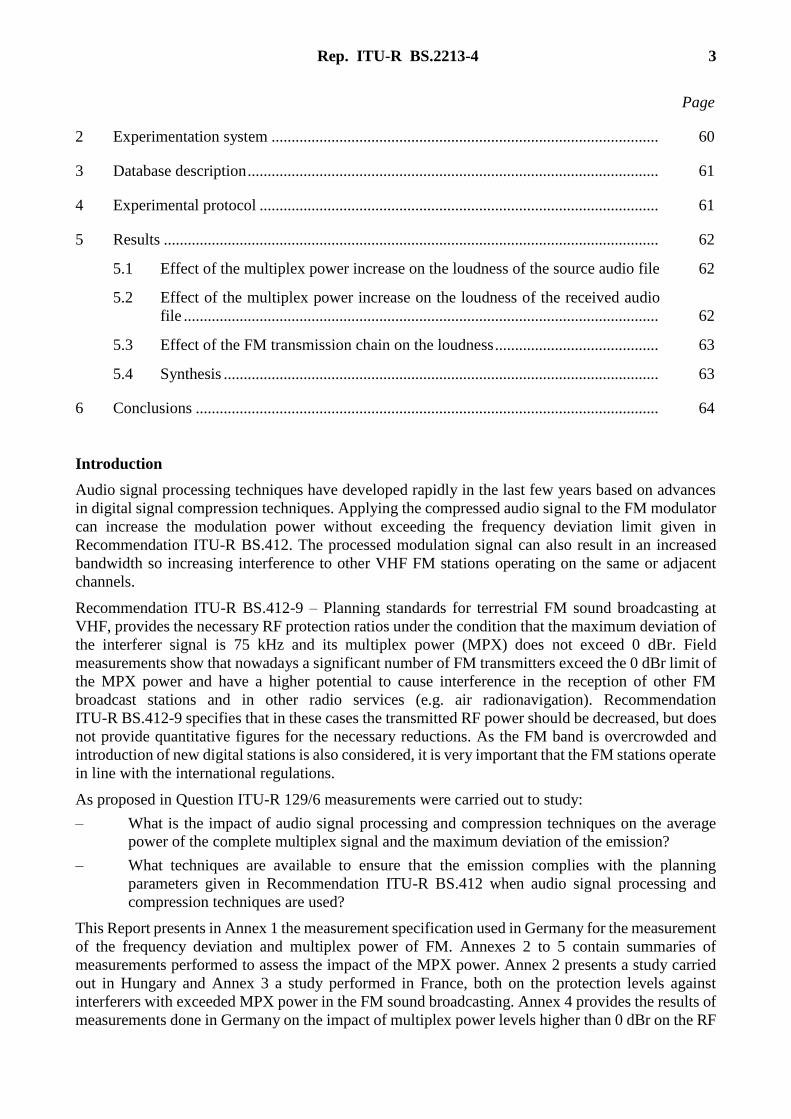
Rep. ITU-R BS.2213-4 3
Page
2 Experimentation system ................................................................................................. 60
3 Database description ....................................................................................................... 61
4 Experimental protocol .................................................................................................... 61
5 Results ............................................................................................................................ 62
5.1 Effect of the multiplex power increase on the loudness of the source audio file 62
5.2 Effect of the multiplex power increase on the loudness of the received audio
file ....................................................................................................................... 62
5.3 Effect of the FM transmission chain on the loudness ......................................... 63
5.4 Synthesis ............................................................................................................. 63
6 Conclusions .................................................................................................................... 64
Introduction
Audio signal processing techniques have developed rapidly in the last few years based on advances
in digital signal compression techniques. Applying the compressed audio signal to the FM modulator
can increase the modulation power without exceeding the frequency deviation limit given in
Recommendation ITU-R BS.412. The processed modulation signal can also result in an increased
bandwidth so increasing interference to other VHF FM stations operating on the same or adjacent
channels.
Recommendation ITU-R BS.412-9 – Planning standards for terrestrial FM sound broadcasting at
VHF, provides the necessary RF protection ratios under the condition that the maximum deviation of
the interferer signal is 75 kHz and its multiplex power (MPX) does not exceed 0 dBr. Field
measurements show that nowadays a significant number of FM transmitters exceed the 0 dBr limit of
the MPX power and have a higher potential to cause interference in the reception of other FM
broadcast stations and in other radio services (e.g. air radionavigation). Recommendation
ITU-R BS.412-9 specifies that in these cases the transmitted RF power should be decreased, but does
not provide quantitative figures for the necessary reductions. As the FM band is overcrowded and
introduction of new digital stations is also considered, it is very important that the FM stations operate
in line with the international regulations.
As proposed in Question ITU-R 129/6 measurements were carried out to study:
– What is the impact of audio signal processing and compression techniques on the average
power of the complete multiplex signal and the maximum deviation of the emission?
– What techniques are available to ensure that the emission complies with the planning
parameters given in Recommendation ITU-R BS.412 when audio signal processing and
compression techniques are used?
This Report presents in Annex 1 the measurement specification used in Germany for the measurement
of the frequency deviation and multiplex power of FM. Annexes 2 to 5 contain summaries of
measurements performed to assess the impact of the MPX power. Annex 2 presents a study carried
out in Hungary and Annex 3 a study performed in France, both on the protection levels against
interferers with exceeded MPX power in the FM sound broadcasting. Annex 4 provides the results of
measurements done in Germany on the impact of multiplex power levels higher than 0 dBr on the RF
4 Rep. ITU-R BS.2213-4
protection ratio of sound broadcasting emissions in VHF band II and presents some comparisons with
Annexes 2 and 3. Finally, Annex 5 presents a study performed in France on the relationship between
loudness and multiplex power. The results of these measurements and analysis may help to
understand better the potential impact of the multiplex power in FM sound broadcasting when the
0 dBr MPX power limit is exceeded due to application of audio signal processing and compression
techniques.
Annex 1
Measurement specification used in Germany
for the measurement of the frequency deviation and multiplex power
of FM sound broadcasting transmitters
1 Purpose and scope
This measurement specification describes the methods used by the Bundesnetzagentur to measure
the frequency deviation and multiplex power of FM sound broadcasting transmitters in VHF band II
at the air interface and to document the measurement results. The aim is to lay down a uniform
procedure for measurement and evaluation.
The measurement can also be carried out as described at the measurement output of the transmitter.
In this case the requirements specified in §§ 5.3.2 to 5.3.4 do not apply.
2 Terms and definitions
The following terms are used for stereophonic transmission using the pilot-tone system:
Signal L: Signal L corresponds to the information in the left stereophonic channel.
Signal R: Signal R corresponds to the information in the right stereophonic
channel.
Sum signal M: M = (L+R)/2 (monophonic or compatible signal)
Difference signal S: S = (L-R)/2 (side information)
Stereo sub-carrier: The sub-carrier (38 kHz) is used to transpose the S signal to the carrier
frequency (between 23 kHz and 53 kHz). It is suppressed before
transmission to reduce the signal energy of the difference signal on the
transmission path.
Pilot tone: The pilot tone (19 kHz) is used to retrieve the stereo sub-carrier, which is
suppressed before transmission, in the stereophonic receiver.
ARI signal: The ARI signal indicates and switches traffic information on a 57 kHz
sub-carrier locked in phase with the stereo sub-carrier.
RDS signal: Radio data signal as defined in DIN EN 50067 and
Recommendation ITU-R BS.643-2
Supplementary signal: According to Recommendation ITU-R BS.450 all additional signals in
the 15-23 kHz and 53-76 kHz bands (e.g. DARC, SWIFT)
Rep. ITU-R BS.2213-4 5
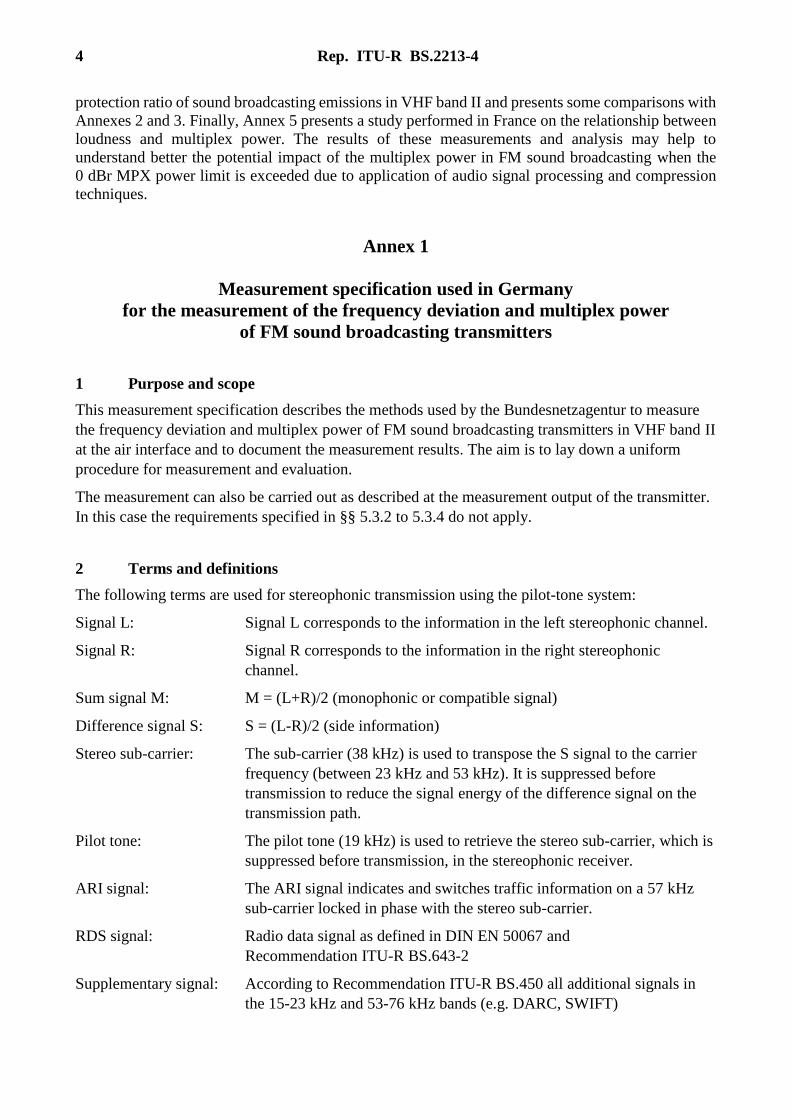
Multiplex signal: The multiplex (MPX) signal includes all stereo information (including
the pilot tone, ARI and RDS). It is the signal added to the modulator (the
"modulating signal").
Multiplex power: According to Recommendation ITU-R BS.412, the power of the
multiplex signal must be averaged over a floating measurement interval
of 60 s. The multiplex power (modulation power) Pmod is derived from
the instantaneous deviation ∆f(t) using the following formula:
dBrdkHz19
)(
60
2log10
602
ttf
sP
sT
T
mod
The value 0 dBr thus corresponds to the modulation power of a
sinusoidal signal (without the pilot tone and without supplementary
signals) which causes a peak deviation of ±19 kHz.
Frequency deviation: In the case of frequency modulation, the deviation of the instantaneous
frequency from the unmodulated carrier frequency f0. Where no further
information is given, the peak deviation ∆F is meant.
Instantaneous deviation: In the case of frequency modulation, the instantaneous deviation of the
frequency at any given time t from the frequency of the unmodulated
carrier f0:
f(t) = f0 + ∆f(t)
Peak deviation: In the case of frequency modulation with any signals, the maximum
deviation of the frequency f from the frequency of the unmodulated
carrier f0. In frequency modulation with sinusoidal signals:
f = f0 + ∆F*sin(ωt). The peak deviation ∆F is given in kHz.
3 Limits
According to Recommendation ITU-R BS.450-2, the peak deviation may not exceed ±75 kHz at
any time. This limit is likewise to be complied with where supplementary signals such as ARI
and/or RDS are also transmitted.
The multiplex power must, in accordance with Recommendation ITU-R BS.412-9, not exceed
0 dBr over any measurement interval of 60 s.

6 Rep. ITU-R BS.2213-4
These limits are also a constituent part of the basic characteristics in the frequency assignments
granted by the Bundesnetzagentur for VHF sound broadcasting transmitters.
4 Technical non-compliance values
Taking into account the measurement uncertainties specified in Recommendation ITU-R SM.1268,
including the possible influence of reflections, co-channel and adjacent channel emissions and
individual, unnoticed interferers on the measurement, the limits can be assumed to be exceeded in
terms of the measurement if:
• the cumulative frequency of the instantaneous deviations relative to a frequency deviation of
77 kHz exceeds 1*10-4% within a measurement period of one hour, or
• the multiplex power exceeds 0.2 dBr.
The values of 77 kHz frequency deviation and 0.2 dBr multiplex power, derived taking into account
the measurement uncertainties, are based on the limits given in § 3 and assuming a confidence level
of 95%.
5 Measurement method
5.1 Measuring equipment requirements
The measurement system must meet the requirements in Recommendation ITU-R SM.1268.
Accordingly, the maximum permissible measurement error of the system used to measure frequency
deviation may not exceed the following values:
Instantaneous
deviation
Measurement
error1
≤ 80 kHz ≤ ±2 kHz
> 80 kHz ≤ ±5 %
The maximum permissible measurement error of the system used to measure multiplex power may
not exceed the following values:
Multiplex power Measurement
error1
< −2 dBr ≤ ±0.4 dB
−2 dBr to +2 dBr ≤ ±0.2 dB
> 2 dBr ≤ ±0.4 dB
1 In determining the non-compliance values, the measurement error of the measurement system is taken to
be the measurement uncertainty given an equal distribution of the measured value with a confidence level
of 100%.
Rep. ITU-R BS.2213-4 7
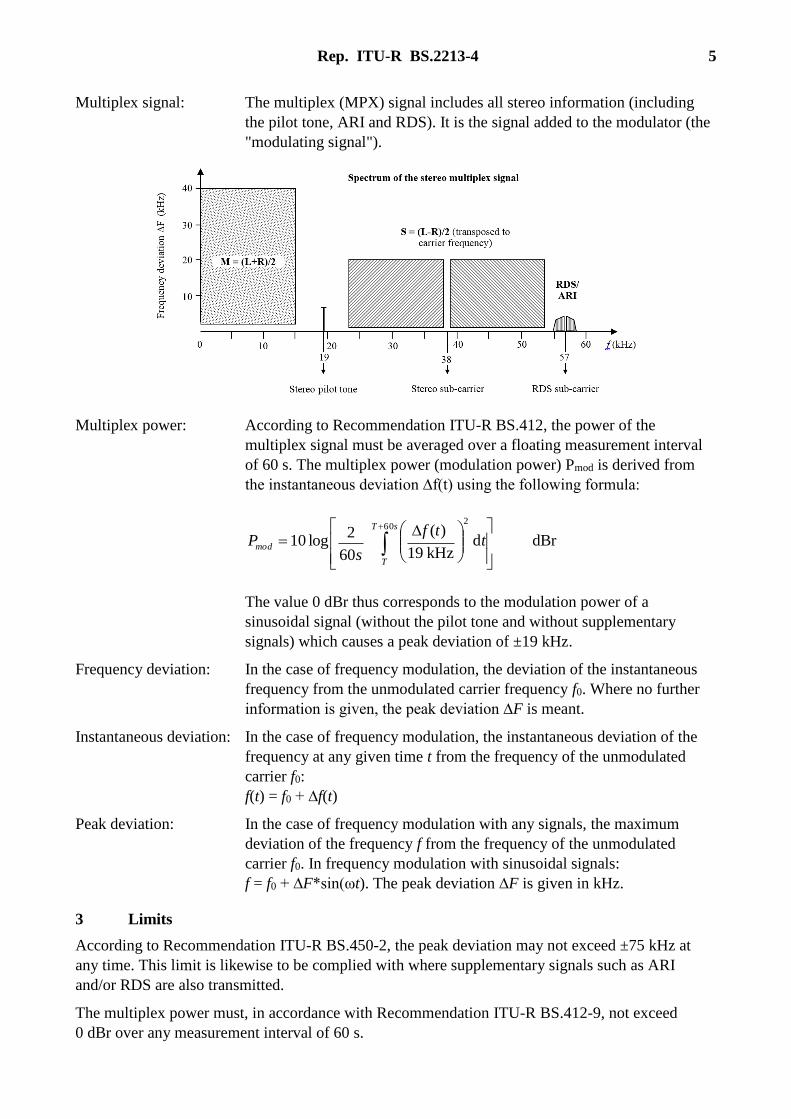
5.2 Measurement principle
The frequency deviation and multiplex power measurements are carried out at the Bundesnetzagentur
using digital methodology by measuring the intervals between the zero crossings of the signal mixed
down to IF or baseband level.
To achieve sufficient measurement accuracy, the measuring equipment must have the following
characteristics:
– The receiver may have either Gaussian IF filters or rectangular “channel” filters. Rectangular
filtering applies in particular where the signal to be measured is limited in bandwidth
digitally, e.g. in the case of broadband receivers using FFT. The type of filter used and its
frequency characteristic must be known in particular to determine the required protection
ratio in relation to adjacent channel transmitters.
– The IF bandwidth (3 dB) of Gaussian filters must be at least 150 kHz and that of
rectangular/channel filters at least 200 kHz.
– The sampling rate for the periodic time measurement must be at least 200 times higher than
the (intermediate) frequency at which sampling is carried out.
– The counter resolution must be at least 8 bits.
5.3 Required measurement conditions
To ensure the required measurement accuracy, the following measurement conditions must be met.
5.3.1 Wanted signal input level
To ensure a sufficient signal-to-noise ratio, the wanted signal input level must be at least 80 dBµV.
5.3.2 Degree of distortion and reflection
Multipath reception caused by reflections leads to frequency-selective increases or decreases in the
resulting signal amplitude and hence to an apparent amplitude modulation of the wanted signal, which
can distort the deviation measurement value. This effect can also be caused by co-channel and
adjacent channel transmitters. A measure for such interference to the wanted signal is the degree of
distortion. The degree of distortion S is defined as the maximum gradient of the complex sum
envelope normalised to the wanted signal envelope through changes to the instantaneous frequency
(caused by modulation with the modulating signal) expressed in %/kHz.
8 Rep. ITU-R BS.2213-4
3
2
10
110
1
2 N
K
U)F)t(v(
UMaxS [%/kHz]
where:
Uk: complex envelope of the FM signal in front of the demodulator
UN: complex envelope of the wanted signal
v(t): normalised modulating signal (|v(t)| <1)
∆F: peak deviation (Hz).
Where the interference is caused exclusively by reflections, the degree of distortion is equal to the
degree of reflection R:
3
2
10
102
rR [%/kHz]
where:
: time delay of the reflected wave in relation to the direct wave in seconds
r: complex reflection factor.
The maximum permissible degree of reflection is 0.4%/kHz.
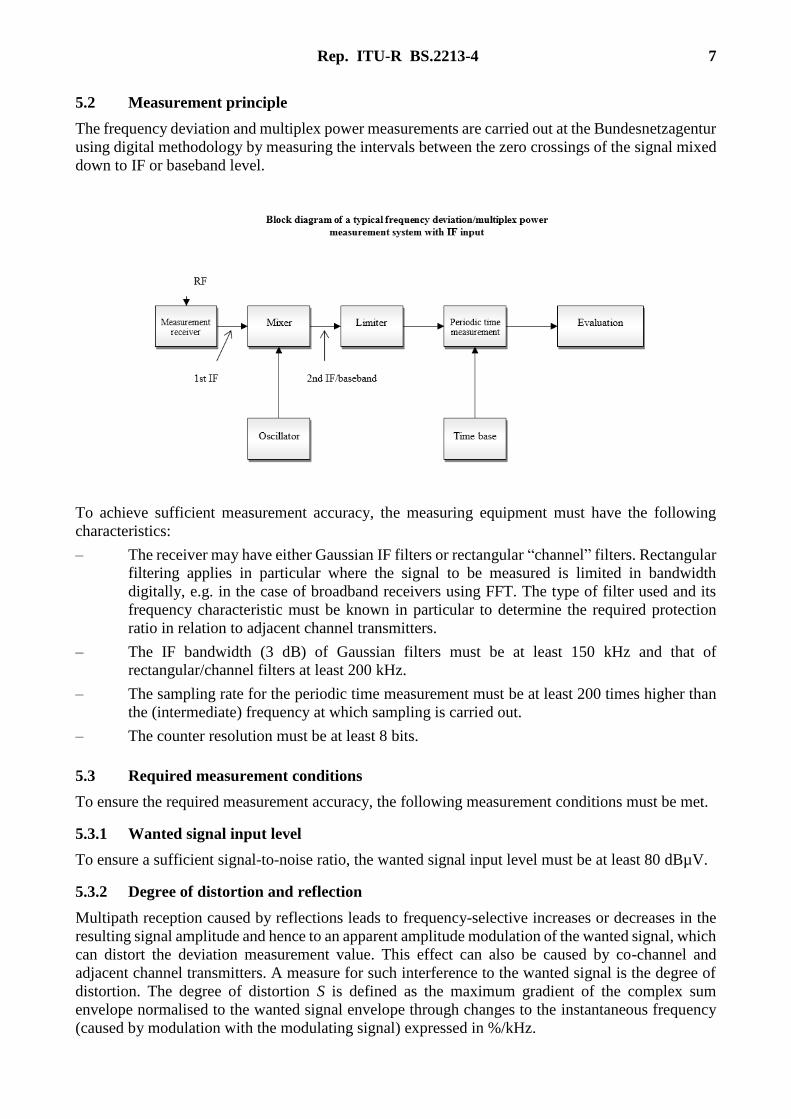
Environmental and weather conditions (e.g. vehicle traffic) can also influence the reflection factor.
An exact measurement of the degree of reflection is only possible if the reflection meter has a
measurement bandwidth of at least 75 kHz. Since most reflection meters currently available have a
narrower bandwidth, measurements may be erroneous in that the degree of reflection indicated is too
low. The following diagram shows the maximum indicated degree of reflection as a function of the
measurement bandwidth of the reflection meter.
5.3.3 Co-channel and adjacent channel protection ratios
The required protection ratios in relation to co-channel and adjacent channel transmitters depend on
the type, width and frequency characteristic of the IF filter used.
Rep. ITU-R BS.2213-4 9
Emissions from other radiocommunication services in adjacent bands (public safety agencies and the
aeronautical service) must be treated as co-band, adjacent channel interferers with a corresponding
frequency separation.
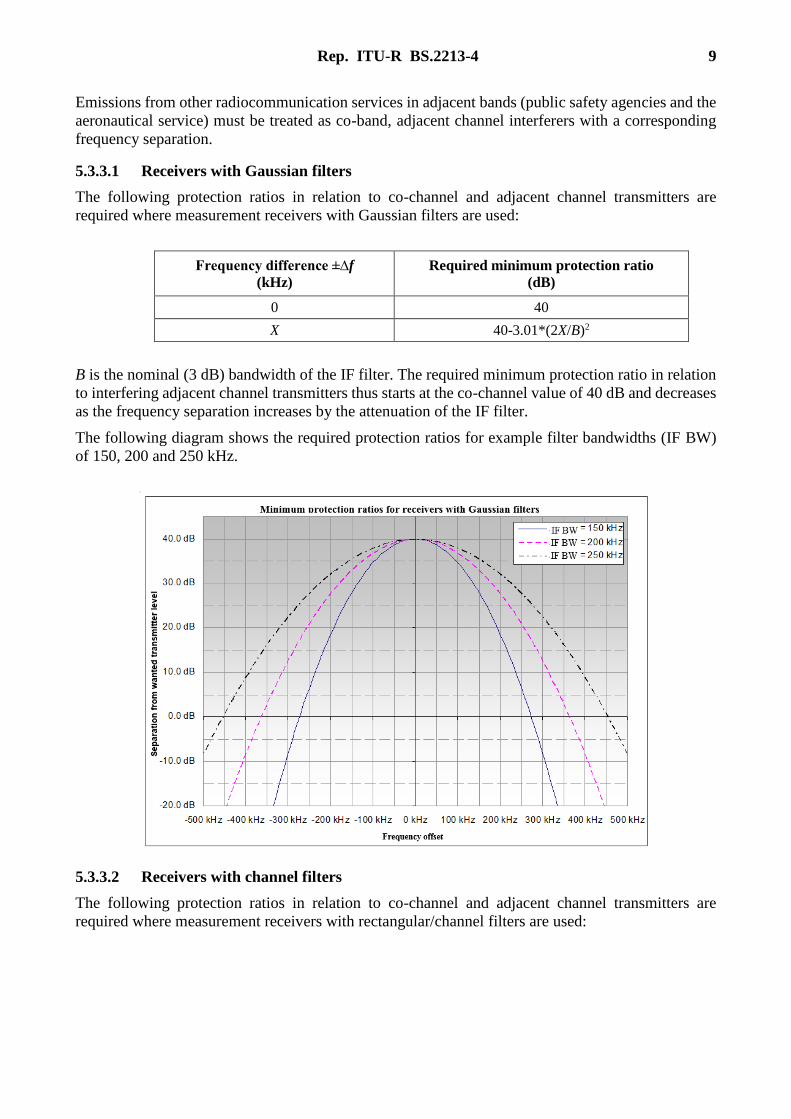
5.3.3.1 Receivers with Gaussian filters
The following protection ratios in relation to co-channel and adjacent channel transmitters are
required where measurement receivers with Gaussian filters are used:
Frequency difference ±∆f
(kHz)
Required minimum protection ratio
(dB)
0 40
X 40-3.01*(2X/B)2
B is the nominal (3 dB) bandwidth of the IF filter. The required minimum protection ratio in relation
to interfering adjacent channel transmitters thus starts at the co-channel value of 40 dB and decreases
as the frequency separation increases by the attenuation of the IF filter.
The following diagram shows the required protection ratios for example filter bandwidths (IF BW)
of 150, 200 and 250 kHz.
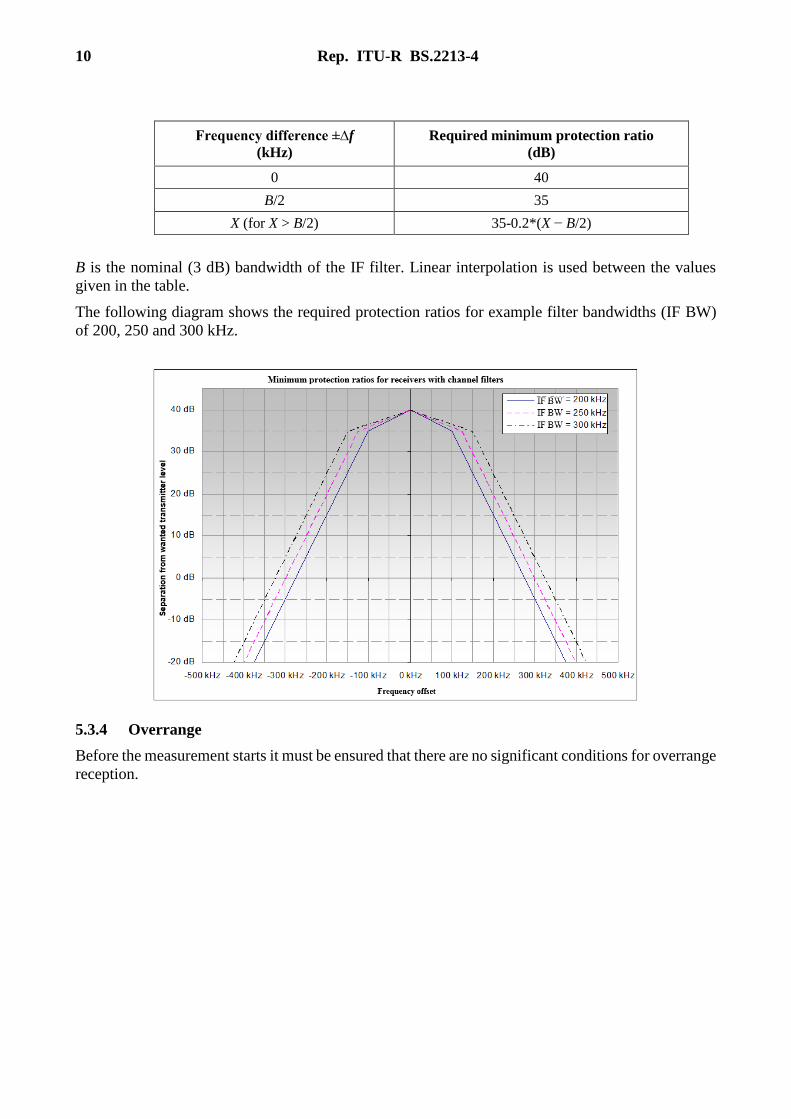
5.3.3.2 Receivers with channel filters
The following protection ratios in relation to co-channel and adjacent channel transmitters are
required where measurement receivers with rectangular/channel filters are used:
10 Rep. ITU-R BS.2213-4
Frequency difference ±∆f
(kHz)
Required minimum protection ratio
(dB)
0 40
B/2 35
X (for X > B/2) 35-0.2*(X − B/2)
B is the nominal (3 dB) bandwidth of the IF filter. Linear interpolation is used between the values
given in the table.
The following diagram shows the required protection ratios for example filter bandwidths (IF BW)
of 200, 250 and 300 kHz.
5.3.4 Overrange
Before the measurement starts it must be ensured that there are no significant conditions for overrange
reception.

Rep. ITU-R BS.2213-4 11
5.4 Measurement set-up
The separate functional blocks can be incorporated in one or more items of equipment.
5.5 Measurement procedure
5.5.1 Determination of the measurement location
The measurement location is chosen on the basis of an analysis of the antenna patterns of the
transmitter to be measured and the determination of the locations of the adjacent channel transmitters
such that a sufficient adjacent channel protection ratio can be expected.
Once the location has been reached, a check is first made to determine any possible interfering
conditions (e.g. traffic near the measurement location, high voltage lines).
5.5.2 Measurement of the wanted transmitter and adjacent channels
The wanted signal level is measured using the measurement receiver.
12 Rep. ITU-R BS.2213-4
Settings:
• Frequency: (centre frequency of the wanted transmitter)
• Measurement bandwidth: ≥120 kHz
• Detector: Average (AV) or RMS
The required wanted signal input level is described in § 5.3.1. If the required level is not achieved, a
different measurement location must be chosen.
The adjacent channels are measured using the spectrum analyser for the entire duration of the
measurement.
Settings:
• Centre frequency: (centre frequency of the wanted transmitter)
• RBW: 10 kHz
• VBW: 30 kHz
• Span: 1 MHz
• Sweeptime: auto
• Trace 1: max hold
• Trace 2: clear/write
• Attenuation: dependent on input level
• Scale: 10 dB/div
To measure the 100 kHz adjacent channels the clear/write curve (trace 2) must be frozen in a
modulation interval or, in the case of a wanted transmitter with low modulation, using the view
function of the analyser.
The level of the adjacent channel transmitters with a separation ≥200 kHz are measured in the
max hold curve (trace 1).
The protection ratios must be optimised by rotating the antenna. The required protection ratios are
described in § 5.3.3. If they are not achieved, a different measurement location must be chosen.
Further improvement can be achieved by using a bandpass filter. Such filters must have a bandwidth
of at least 150 kHz. If the filter edge coincides with the wanted emission, however, the measurement
results may be erroneous. To rule this out, it is necessary to check the indicated degrees of reflection
for compliance with the values in § 5.3.2.
The spectrum analyser plot is saved for later documentation.
5.5.3 Measurement of the reflection factor and determination of the RDS programme name
and PI code
The degree of reflection in the antenna signal is determined using a reflection meter.
The maximum permissible degree of reflection is described in §5.3.2. If this is exceeded, a different
measurement location must be chosen.
Since frequency deviation and multiplex power also depend on the level and characteristics of the
audio signal fed from the studio to the transmitter, the values measured may differ if there is a change
of programme provider. To enable clear identification of the programme provider transmitting the
measured signal, the programme identification code (PI code) is to be determined using the RDS
decoder and documented in the measurement report.

Rep. ITU-R BS.2213-4 13
5.5.4 Determination of the measurement location coordinates
The coordinates of the final measurement location are to be determined using a GPS receiver and
documented in the measurement report together with the address or as accurate a description as
possible of the location.
5.5.5 Measurement of the frequency deviation and multiplex power
Receiver settings:
• Centre frequency: (centre frequency of the wanted transmitter)
• Bandwidth: ≥150 kHz (receivers with Gaussian IF filters)
≥200 kHz (receivers with rectangular/channel filters)
• Attenuation: dependent on the input level such that the level at the IF output complies with
the specification of the subsequent measurement system
Start of recording:
Depending on the measurement system the deviation and multiplex power measurement programme
or recording is started. The measuring/recording time must be at least 60 minutes.
During the measurement:
Unusual events such as a change of programme provider or studio or a transmission outage that can
have an influence on frequency deviation and multiplex power must be documented.
If during the measurement interfering signals (for example from electrical equipment, vehicles or
machines) that have an effect on the measurement results or transmitter outages occur, the
measurement must be restarted. Impulse interferences are characterised for instance by short
deviation peaks that are considerably higher than the peaks caused by modulation that occur at
intervals throughout the whole measurement period.
5.6 Evaluation of frequency deviation and multiplex power
The evaluation software is used to present at least the following in diagram form:
• peak deviation as a function of time (measurement interval: 10 s)
• multiplex power as a function of time
• cumulative frequency of all deviations measured
The following measurement results are presented in numerical form:
• frequency of individual deviations above 77 kHz in %
• maximum multiplex power during the measurement in dBr
The diagrams and figures form part of the measurement report.
6 Documentation of the results
A measurement report is to be drawn up to document the measurement results. An example is
contained in the Attachment 1 to this Annex 1.
7 Standards and Recommendations
This measurement specification was drawn up on the basis of in particular the following national and
international standards and Recommendations:
14 Rep. ITU-R BS.2213-4
• FTZ 175 R4 "Directive for the assessment of VHF sound broadcasting (mono and stereo)
transmissions by ARD and DBP"
Contents: minimum wanted field strengths, degree of reflection, protection ratios, receiving
antenna characteristics
• ITU-R BS.412-9 ‒ Planning standards for terrestrial FM sound broadcasting at VHF
Contents: minimum usable field strengths, protection ratios (monophonic/stereophonic)
• ITU-R BS.450-2 ‒ Transmission standards for FM sound broadcasting at VHF
Contents: description of the signal in the case of monophonic and stereophonic transmissions,
e.g. pre-emphasis, peak deviation, supplementary signal; description of pilot-tone system and
polar-modulation system, table of transmission systems (including parameters) used in
different countries worldwide
• ITU-R SM.1268-1 ‒ Method of measuring the maximum frequency deviation of FM
broadcast emissions at monitoring stations
Contents: description of a method for standards-based indicative measurements of the
frequency deviation and multiplex power of frequency modulated sound broadcasting
transmitters, measuring equipment requirements
Attachment 1
to Annex 1
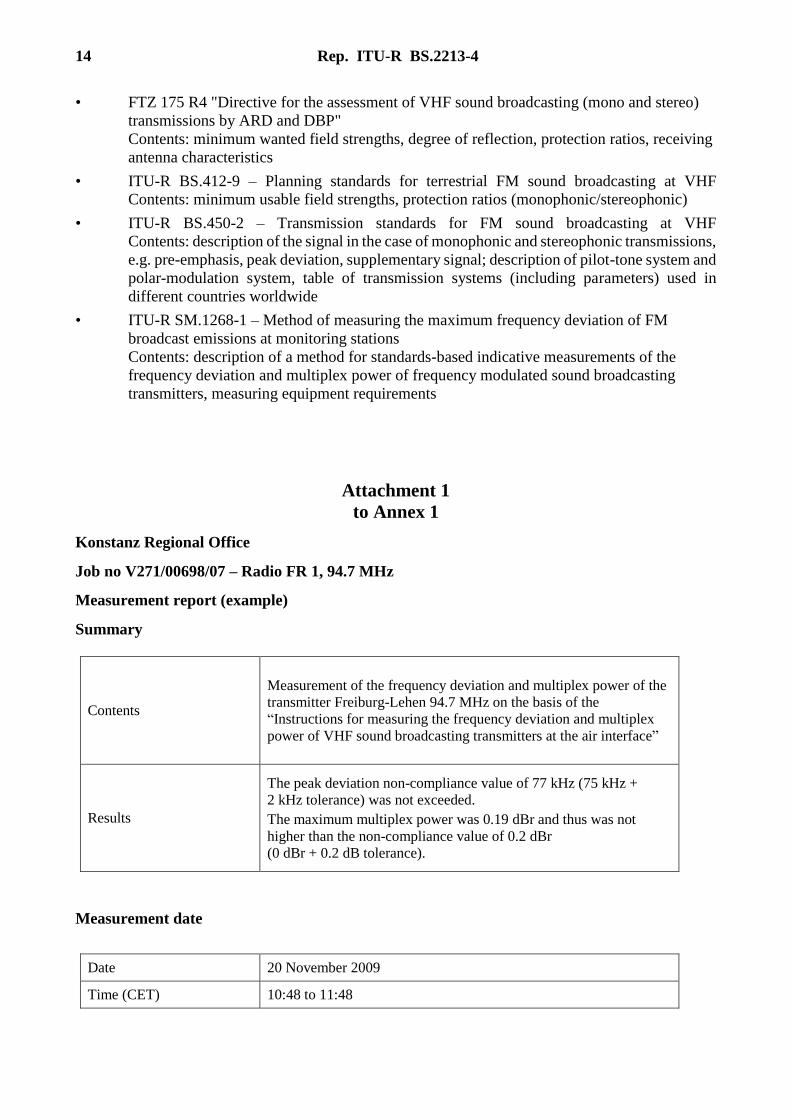
Konstanz Regional Office
Job no V271/00698/07 – Radio FR 1, 94.7 MHz
Measurement report (example)
Summary
Contents
Measurement of the frequency deviation and multiplex power of the
transmitter Freiburg-Lehen 94.7 MHz on the basis of the
“Instructions for measuring the frequency deviation and multiplex
power of VHF sound broadcasting transmitters at the air interface”
Results
The peak deviation non-compliance value of 77 kHz (75 kHz +
2 kHz tolerance) was not exceeded.
The maximum multiplex power was 0.19 dBr and thus was not
higher than the non-compliance value of 0.2 dBr
(0 dBr + 0.2 dB tolerance).
Measurement date
Date 20 November 2009
Time (CET) 10:48 to 11:48

Rep. ITU-R BS.2213-4 15
Transmitter data
Name Freiburg-Lehen
Coordinates (WGS84) 07E47’36“ 48N00’47“
Frequency (MHz) 94.7
Polarisation Horizontal
Measurement location
Location description Freiburg (Lehen) on a farm track south of the transmitter
Coordinates (WGS84) 07E47’24“ / 48N00’31“
Weather Sunny, dry
Map extract

16 Rep. ITU-R BS.2213-4
Photograph of measurement location
Equipment used
Name Type/number Inventory no Calibration
date
Monitoring vehicle MKW 822
MZ-10712
Measurement antenna FT01; UKW-Z BAPT 6047581 22.09.08
Measurement receiver ESVB BAPT 6020861 15.01.09
Spectrum analyser ESPI RegTP 11007500 21.11.08
Broadcasting measurement
receiver RME 320 BAPT 2003629 09/08
Coupler BN923050
FM analyser RBT BAPT 6020926 28.04.09
Software USB-FM-Analysator Version
1.1
Laptop IBM Thinkpad RegTP 6005406
Measurement error
The measurement system was checked for proper functioning.
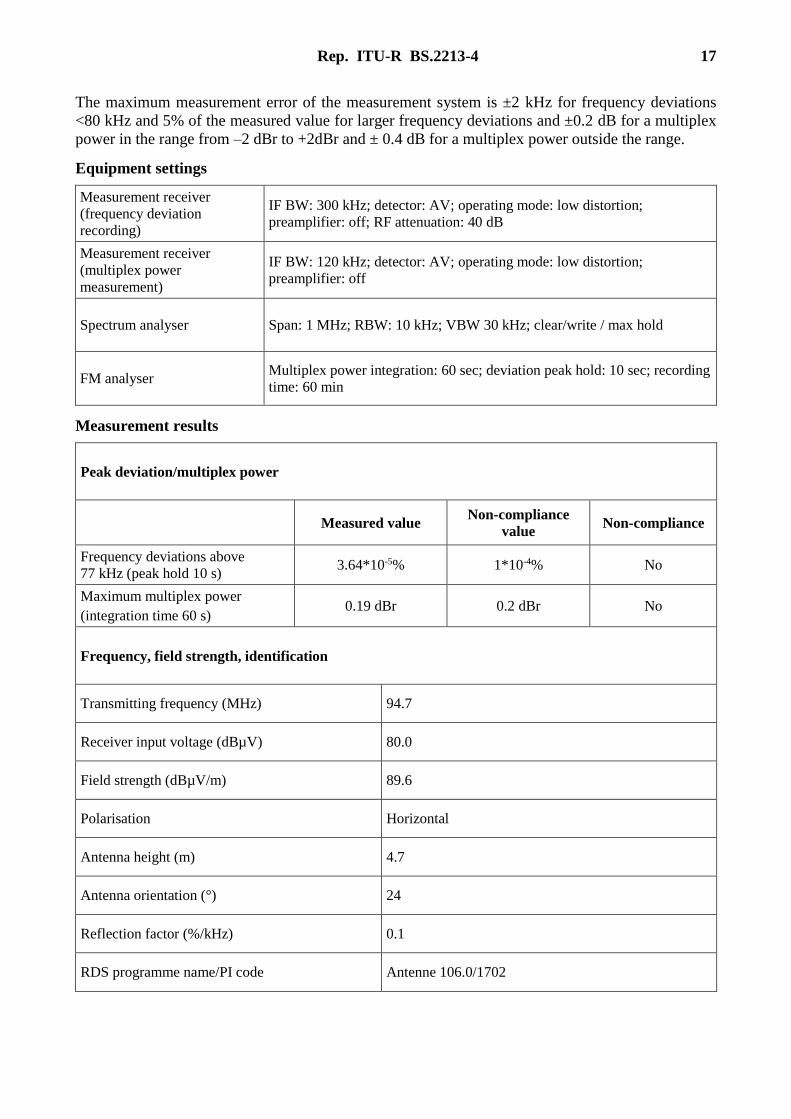
Rep. ITU-R BS.2213-4 17
The maximum measurement error of the measurement system is ±2 kHz for frequency deviations
<80 kHz and 5% of the measured value for larger frequency deviations and ±0.2 dB for a multiplex
power in the range from ‒2 dBr to +2dBr and ± 0.4 dB for a multiplex power outside the range.
Equipment settings
Measurement receiver
(frequency deviation
recording)
IF BW: 300 kHz; detector: AV; operating mode: low distortion;
preamplifier: off; RF attenuation: 40 dB
Measurement receiver
(multiplex power
measurement)
IF BW: 120 kHz; detector: AV; operating mode: low distortion;
preamplifier: off
Spectrum analyser Span: 1 MHz; RBW: 10 kHz; VBW 30 kHz; clear/write / max hold
FM analyser Multiplex power integration: 60 sec; deviation peak hold: 10 sec; recording
time: 60 min
Measurement results
Peak deviation/multiplex power
Measured value Non-compliance
value Non-compliance
Frequency deviations above
77 kHz (peak hold 10 s) 3.64*10-5% 1*10-4% No
Maximum multiplex power
(integration time 60 s) 0.19 dBr 0.2 dBr No
Frequency, field strength, identification
Transmitting frequency (MHz) 94.7
Receiver input voltage (dBµV) 80.0
Field strength (dBµV/m) 89.6
Polarisation Horizontal
Antenna height (m) 4.7
Antenna orientation (°) 24
Reflection factor (%/kHz) 0.1
RDS programme name/PI code Antenne 106.0/1702

18 Rep. ITU-R BS.2213-4
Appendices
1 Wanted-to-unwanted signal ratio with spectrum plot
2 Record of special events during frequency deviation recording
3 Recording results
Measurement staff
(First name, surname, official title/grade)
Drawn up by (surname, first name, official title/grade, date) Checked by (surname, first name, official title/grade, date)
(Surname, first name, grade), 20.11.09 (Surname, first name, grade), 20.11.09
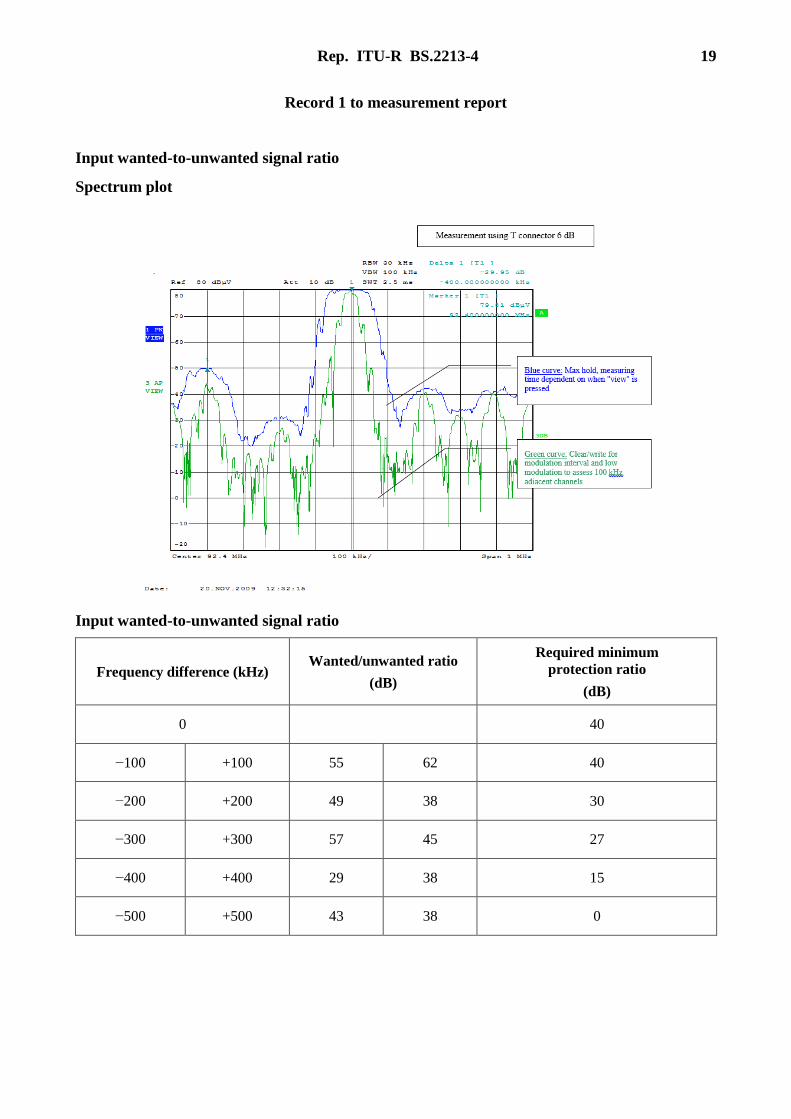
Rep. ITU-R BS.2213-4 19
Record 1 to measurement report
Input wanted-to-unwanted signal ratio
Spectrum plot
Input wanted-to-unwanted signal ratio
Frequency difference (kHz) Wanted/unwanted ratio
(dB)
Required minimum
protection ratio
(dB)
0 40
−100 +100 55 62 40
−200 +200 49 38 30
−300 +300 57 45 27
−400 +400 29 38 15
−500 +500 43 38 0
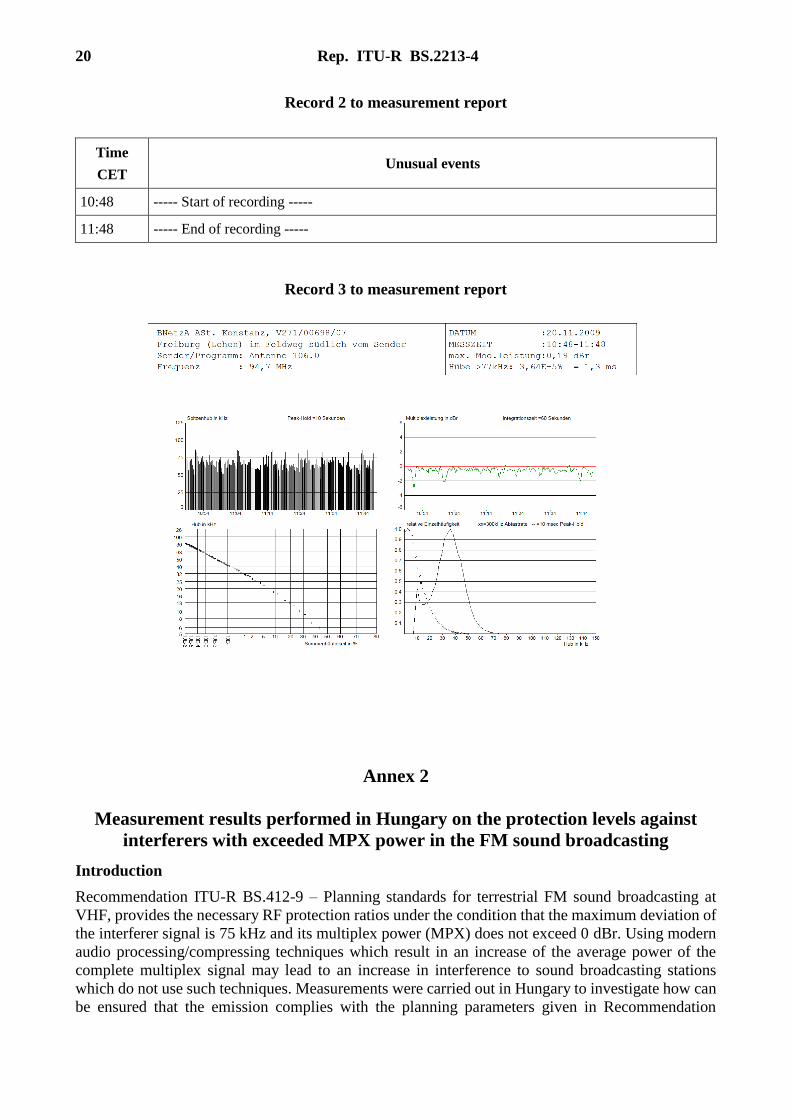
20 Rep. ITU-R BS.2213-4
Record 2 to measurement report
Time
CET Unusual events
10:48 ----- Start of recording -----
11:48 ----- End of recording -----
Record 3 to measurement report
Annex 2
Measurement results performed in Hungary on the protection levels against
interferers with exceeded MPX power in the FM sound broadcasting
Introduction
Recommendation ITU-R BS.412-9 – Planning standards for terrestrial FM sound broadcasting at
VHF, provides the necessary RF protection ratios under the condition that the maximum deviation of
the interferer signal is 75 kHz and its multiplex power (MPX) does not exceed 0 dBr. Using modern
audio processing/compressing techniques which result in an increase of the average power of the
complete multiplex signal may lead to an increase in interference to sound broadcasting stations
which do not use such techniques. Measurements were carried out in Hungary to investigate how can
be ensured that the emission complies with the planning parameters given in Recommendation

Rep. ITU-R BS.2213-4 21
ITU-R BS.412 when the 0 dBr MPX power limit is exceeded due to application of audio signal
processing and compression techniques.
Using modern audio processing/compressing techniques the 0 dBr MPX power limit can be exceeded
while the 75 kHz limit for the maximum deviation is kept. The increased interference potential of the
processed/compressed higher MPX power signal can be compensated either by decreasing the
transmitted RF power or by reducing the maximum FM deviation of the transmitter. The aim of the
measurements was to find quantitative figures for the reduction of the RF power and the peak
deviation of the FM broadcast signal exceeding the 0 dBr MPX power limit, which can restore the
audio signal-to-noise ratio (S/N) of the interfered FM broadcast service to the required 50 dB value.
1 Measurement setup and measurement methods
The measurements were carried out using the setup shown in Fig. 1 based on Recommendation ITU-R
BS.641 – Determination of radio-frequency protection ratios for frequency-modulated sound
broadcasting. The list of the instruments used and the main settings can be found in the Annex.
The signals of the wanted (Generator 6) and the interfering (Generator 7) transmitters were combined
and applied to the FM receiver. The output audio signal of the receiver was then measured by an
audio analyser.
The wanted signal was a stereo FM broadcast signal modulated by the output of the stereo coder while
the stereo coder was driven by internal 500 Hz sinusoidal sources in both (left and right) channels.
The level of the modulating signal was adjusted so that the peak FM deviation of the wanted signal
was 75 kHz and it remained unchanged during the whole measurement.
The interfering transmitter was modulated by processed/compressed noise plus RDS signal. The input
sound signal was a weighted (coloured) noise defined by Recommendation ITU-R BS.559-2
(see Fig. 1), which was recorded on a CD. The level of the modulating signal was adjusted so that the
peak FM deviation of the unwanted signal was 75 kHz and it was checked by the modulation meter
(8). The RF level of the interferer signal could be adjusted by two cascaded step attenuators ((10) and
(11)) in 1 dB steps.
22 Rep. ITU-R BS.2213-4
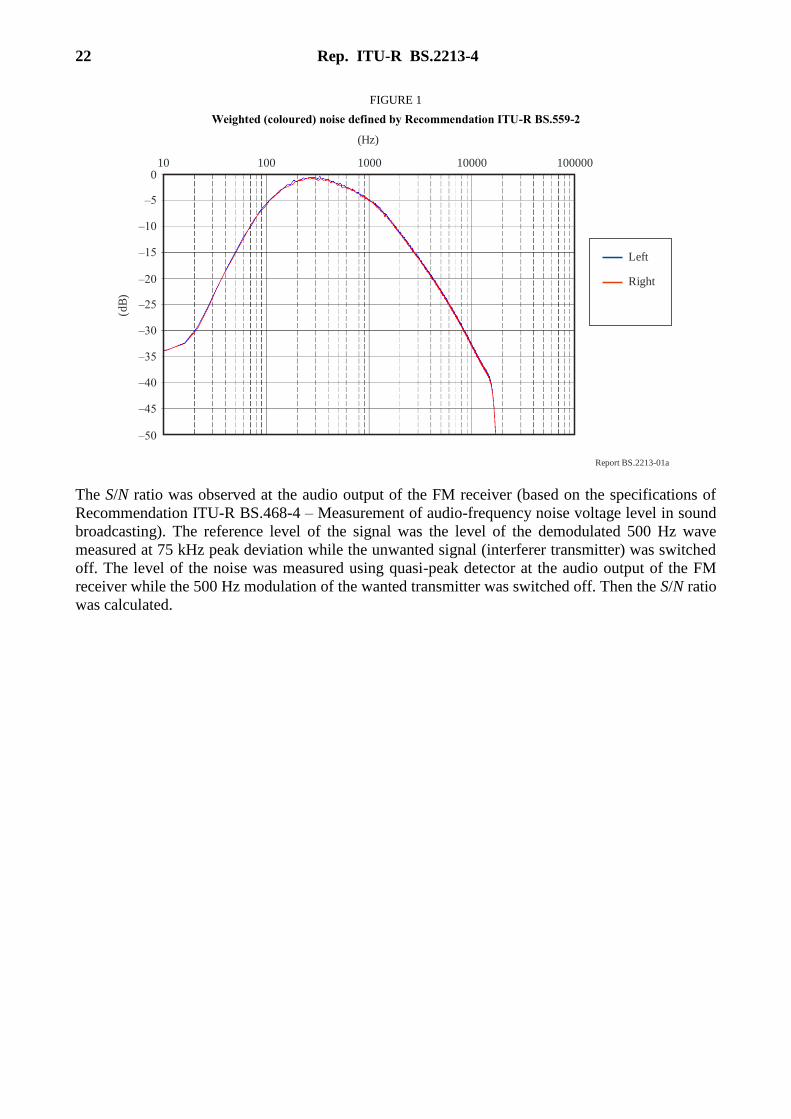
FIGURE 1
Weighted (coloured) noise defined by Recommendation ITU-R BS.559-2
Report BS.2213-01a
–50
–45
–40
–35
–30
–25
–20
–15
–10
–5
010 100 1000 10000 100000
(dB
)
(Hz)
Left
Right
The S/N ratio was observed at the audio output of the FM receiver (based on the specifications of
Recommendation ITU-R BS.468-4 – Measurement of audio-frequency noise voltage level in sound
broadcasting). The reference level of the signal was the level of the demodulated 500 Hz wave
measured at 75 kHz peak deviation while the unwanted signal (interferer transmitter) was switched
off. The level of the noise was measured using quasi-peak detector at the audio output of the FM
receiver while the 500 Hz modulation of the wanted transmitter was switched off. Then the S/N ratio
was calculated.

Rep. ITU-R BS.2213-4 23
FIGURE 2
Measurement setup (the numbers in bracket refer to the list of equipment in Table 5)
Report BS.2213-01
RDS coder(2)
Sound proc.(3)
Generator(SMR-20)
(7)
CD player(1)
Dir. coupler(9)
Mod. meter(8)
Step atten. 10 dB(10)
Step atten. 1 dB(11)
Splitter (6 dB)(12)
50/75 (13)
W
FM receiver(14)
UPL Analyzer(16)
Generator(Marconi)
(6)
Stereo coder(5)
The RF level of the wanted transmitter at the input of the FM receiver was set to 49 dB(µV). It was
the lowest RF level where the S/N ratio at the output of the receiver reached the required 56 dB while
the interferer transmitter was switched off.
1.1 Measurement of RF protection curves
The measurement procedure of the RF protection curves was as follows. The multiplex power of the
interferer signal was set at the sound processor and was checked by the modulation and MPX power
24 Rep. ITU-R BS.2213-4
meter (8). The interferer transmitter was tuned to the required frequency distance from the wanted
transmitter. The audio S/N ratio was observed at the output of the receiver and the step attenuators
were adjusted until the S/N ratio was set to 50 dB. The actual value of the RF protection ratio was the
difference in dB-s between the RF signal levels of the two transmitters. The measurement was
repeated with different frequency distances and with different multiplex powers.
1.2 Measurement of the reduction of the peak deviation that can compensate the effect of
the higher MPX power
The measurement setup was almost the same as in Fig. 1, except that a different type of audio analyser
(UPA) was used (for availability reasons). This measurement was completed only for 100 kHz
frequency difference between the two transmitters. The RF level of the interferer signal was 33 dB
below the wanted signal.
First the peak deviation of the interferer signal was set to 75 kHz in the test mode of the audio
processor. The processor keeps this peak value in normal operation mode regardless of the parameters
of the input sound signal and the programmed multiplex power. After setting a certain value of the
MPX power the signal-to-noise ratio was observed at the audio output of the FM receiver. Then the
level of the modulating signal at the output of the audio processor was adjusted until the observed
S/N ratio became 50 dB. This adjustment caused of course a change in the peak deviation of the FM
signal as well. The processor was then switched to test mode and the peak deviation was checked by
the modulation meter (8).
2 Measurement results
2.1 Measurement of RF protection curves
The results of the RF protection curve measurements are summarized in Table 1 and Fig. 3.
TABLE 1
RF protection ratios for different multiplex power and
frequency difference values
Δf (kHz) Multiplex power (dBr)
0 0.5 1.5 2.5 3.5 4.5 5.5 6.5 7.5
0 42.5 43 44 46 47 48 48 49 49
50 52 52 52 52 51 51 51 50 50
100 32.5 33 35 36 38 39 41 43 44
150 11 13 16 18 20 23 25 26 27
200 −11 −10 −7 −3 0 2 5 7 8
250 −26.5 −26 −25 −23 −21 −19 −16 −15 −13
300 −28 −28 −28 −28 −26 −28 −28 −28 −26

Rep. ITU-R BS.2213-4 25
FIGURE 3
RF protection ratios for different multiplex power and
frequency difference values
Report BS.2213-02
–40
–30
–20
–10
0
10
20
30
40
50
60
0 50 100 150 200 250 300 350
RF
pro
tect
ion r
atio
(d
B)
Frequency difference between the wanted and the unwanted signals (kHz)
RF protection ratio curves
0 dBr
0.5 dBr
1.5 dBr
2.5 dBr
3.5 dBr
4.5 dBr
5.5 dBr
6.5 dBr
7.5 dBr
It can be seen that – in spite of certain expectations – the measured 0 dBr protection curve is not
identical with the S1 curve shown in Recommendation ITU-R BS.412-9. The most likely reasons of
the difference is that the S1 curve of Recommendation ITU-R BS.412-9:
a) represents an average of the measurements made on a great number of different consumer
radio sets while for the present measurements only two different, medium quality radio sets
were used; and
b) it was measured with an interferer signal with less than 0 dBr MPX power.
However, the curves clearly indicate the tendency that the higher the MPX power the more protection
is needed against it.
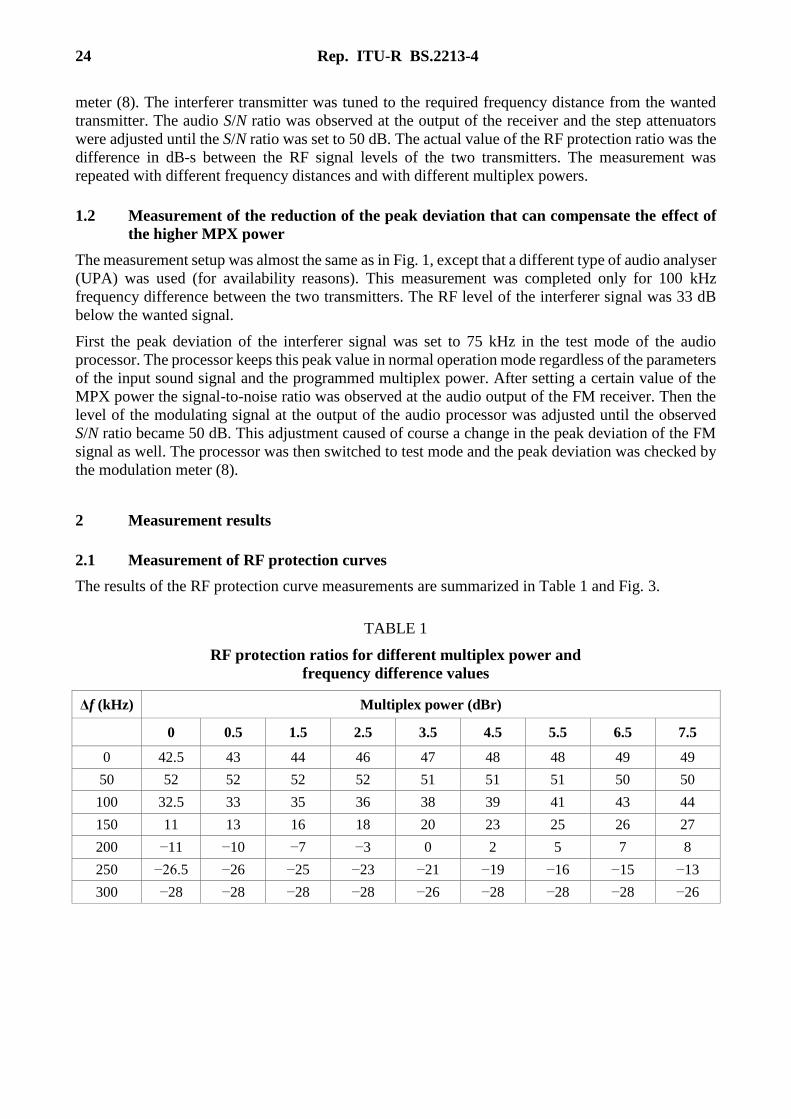
From the above results we can also derive curves that show how much reduction of the RF power
level of an interferer signal can compensate its increased interfering effect if its MPX power exceeds
0 dBr, keeping the baseband audio S/N ratio at the required 50 dB. The three curves on Fig. 4 refer to
the 0 kHz, 100 kHz and 200 kHz difference between the carrier frequencies of the wanted and the
unwanted signal.
TABLE 2
RF power reduction that can compensate the effect of
the higher MPX power of the unwanted transmitter
Δf
(kHz) MPX power (dBr)
0.5 1.5 2.5 3.5 4.5 5.5 6.5 7.5
0 0.5 1.5 3.5 4.5 5.5 5.5 6.5 6.5
100 0.5 2.5 3.5 5.5 6.5 8.5 10.5 11.5
200 1 4 8 11 13 16 18 19
26 Rep. ITU-R BS.2213-4
FIGURE 4
RF power reduction that can compensate the effect of
the higher MPX power of the unwanted transmitter
Report BS.2213-03
0
0
2 4 6 8
2
4
6
8
10
12
14
16
18
20
Car
rier
po
wer
red
uct
ion
(dB
)
Multiplex power (dBr)
RF power reduction vs. MPX power
100 kHz
0 kHz
200 kHz
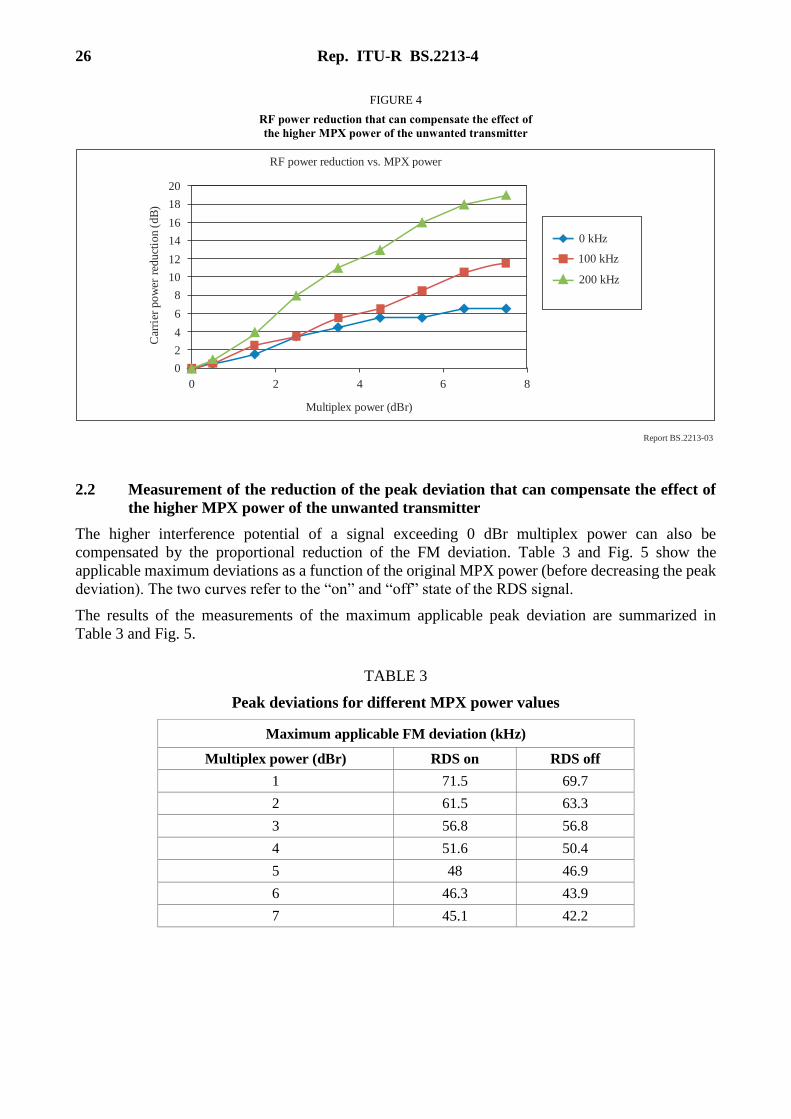
2.2 Measurement of the reduction of the peak deviation that can compensate the effect of
the higher MPX power of the unwanted transmitter
The higher interference potential of a signal exceeding 0 dBr multiplex power can also be
compensated by the proportional reduction of the FM deviation. Table 3 and Fig. 5 show the
applicable maximum deviations as a function of the original MPX power (before decreasing the peak
deviation). The two curves refer to the “on” and “off” state of the RDS signal.
The results of the measurements of the maximum applicable peak deviation are summarized in
Table 3 and Fig. 5.
TABLE 3
Peak deviations for different MPX power values
Maximum applicable FM deviation (kHz)
Multiplex power (dBr) RDS on RDS off
1 71.5 69.7
2 61.5 63.3
3 56.8 56.8
4 51.6 50.4
5 48 46.9
6 46.3 43.9
7 45.1 42.2
Rep. ITU-R BS.2213-4 27
FIGURE 5
Applicable peak deviations that can compensate the effect of
the higher MPX power of the unwanted transmitter
Report BS.2213-04
0 2 4 6 8
0
10
20
30
40
50
60
70
80
Multiplex power (dBr)
Maximum FM deviation vs. MPX power (kHz)
RDS on
RDS off
Max
imal
FM
dev
iati
on (
kH
z)
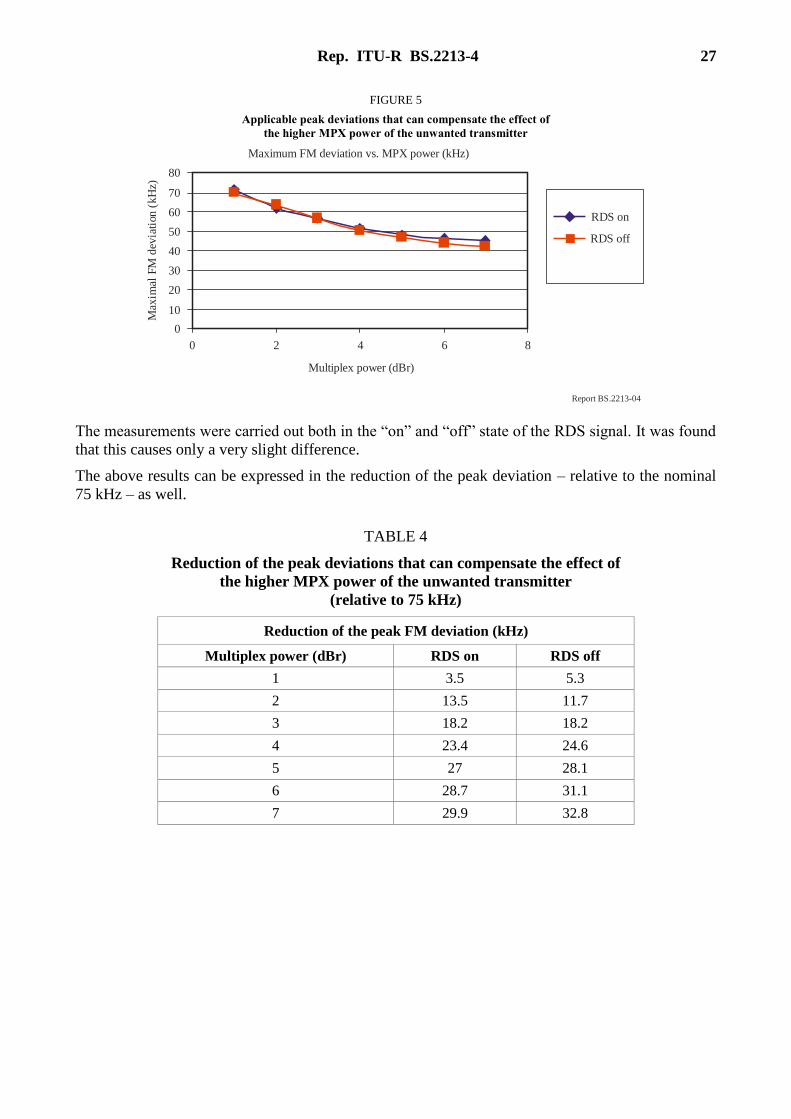
The measurements were carried out both in the “on” and “off” state of the RDS signal. It was found
that this causes only a very slight difference.
The above results can be expressed in the reduction of the peak deviation – relative to the nominal
75 kHz – as well.
TABLE 4
Reduction of the peak deviations that can compensate the effect of
the higher MPX power of the unwanted transmitter
(relative to 75 kHz)
Reduction of the peak FM deviation (kHz)
Multiplex power (dBr) RDS on RDS off
1 3.5 5.3
2 13.5 11.7
3 18.2 18.2
4 23.4 24.6
5 27 28.1
6 28.7 31.1
7 29.9 32.8

28 Rep. ITU-R BS.2213-4
FIGURE 6
Reduction of the peak deviations that can compensate the effect of
the higher MPX power of the unwanted transmitter
(relative to 75 kHz)
Report BS.2213-05
0 2 4 6 8
Multiplex power (dBr)
0
5
10
15
20
25
30
35
FM
dev
iati
on r
edu
ctio
n (
kH
z)Reduction of FM deviation vs. MPX power (kHz)
RDS on
RDS off
Conclusion
The laboratory measurements confirmed that FM broadcast signals with higher multiplex power can
cause higher degradation in the quality of the interfered FM broadcast signal. This degradation can
be compensated by decreasing either the RF level or the peak deviation of the interferer signal.
The above described measurements provide quantitative figures for the amount of these reductions.

Rep. ITU-R BS.2213-4 29
Attachment
to Annex 1
List of instruments
TABLE 5
List of instruments
No. Equipment/type Serial or Reg. No.
1 CD player (in an industrial PC) L0064576
2 RDS coder
3 Audio processor Orban 5300 FM 53000135
4 Function generator Tektronix AFG 3252
5 Stereo coder R&S MSC-2 890340/017
6 Signal generator Marconi 2031 (wanted transm.) 119848/053
7 Signal generator R&S SMR-20 (unwanted transm.) 11040002.20
8 Modulation (and MPX) meter Audemat Aztek FM-MC4 L0062277
9 High power directional coupler C5091 (Werlaton) 10279
10 Step attenuator 8496A 10 dB 3308A14564
11 Step attenuator 8494A 11 dB 3308A32544
12 Resistive power splitter Aeroplex1870A 8134
13 50/75 Ohm match RAM 100131
14 Radio set Sony S-master CMT-CPZ1 122234
15 Radio set Denon DN-U100
16 UPL Audio Analyzer R&S DC…110 kHz 100091
17 UPA Audio Analyzer R&S 10 Hz 100 kHz
Signal and instrument settings
Signal level of the wanted transmitter at the receiver input: 49 dB(µV)
Pilot signal: 9%
FM deviation caused by the RDS signal: 3 kHz
UPL audio analyzer
Low-pass filter: on (15 kHz)
Detector: quasy-peak
Weighting filter: on (weighting characteristics according to Recommendation
ITU-R BS.468-4)
UPA audio analyzer
Low-pass filter: on (22 kHz)
Detector: quasy-peak
Weighting filter: on (weighting characteristics according to Recommendation
ITU-R BS.468-4)
30 Rep. ITU-R BS.2213-4
Audemat Aztec FM-MC4 modulation (and MPX) analyzer
Mode of operation: MPX Analysis Mode (In this mode the averaging time is automatically set to
200 ms and the MPX processing mode to “linear”).
Orban 5300 FM audio processor
Applied factory preset: “Extreme”.
Annex 3
Results of measurements performed in France on the protection levels against
interferers with exceeded MPX power in the FM sound broadcasting
1 The bench test
The French Administration has carried out a bench test using 26 receivers to study the impact of the
increase of multiplex power on protection ratios. The results of these measurements carried out in
France to quantify the impact of multiplex power over protection ratios (PR) when the limit of 0 dBr
is exceeded are included in this Annex, which provides quantitative figures of required protection
ratios, according to the values of multiplex power (MPX) used by some broadcasting FM stations.
2 Measurement results
2.1 Statistical figure for the measurement analysis
The ninth decile statistical figure has been chosen in order to show a representative analysis of the
measurement results. It was more representative than the median or the average to describe the
statistical behaviour of receivers during the experimentation.
Furthermore, the statistical ninth decile figures represent protection ratios of a theoretical receiver
which is less efficient than the 90% of the sample receivers tested.
The PR values taken as reference are given in Recommendation ITU-R BS.412-9 (§ 2.3.2, Table 3:
Stereophonic mode and steady interference).
2.2 Results
As shown in Fig. 7 below, some receivers (more than 10%) are protection ratio values close to those
found in Recommendation ITU-R BS.412-9, where no multiplex power applies to the interfered
signal at 100, 200, 300 and 400 kHz of the carrier frequency spacing.
Rep. ITU-R BS.2213-4 31
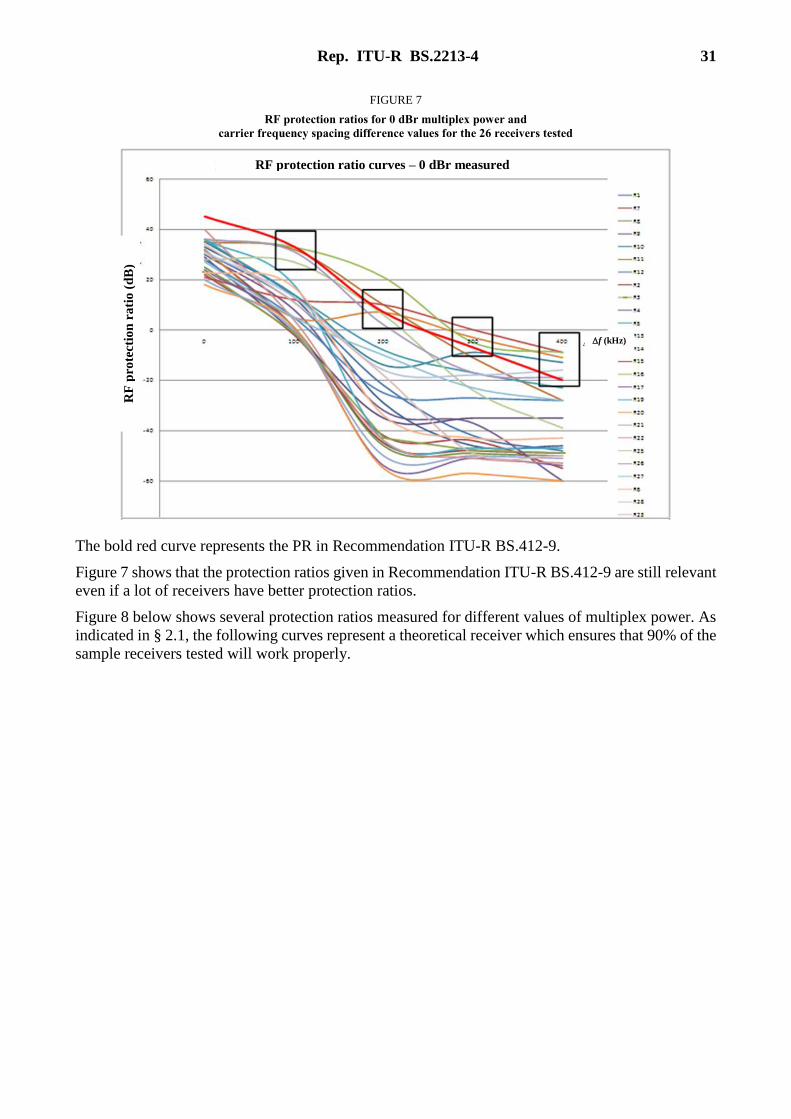
FIGURE 7
RF protection ratios for 0 dBr multiplex power and
carrier frequency spacing difference values for the 26 receivers tested
The bold red curve represents the PR in Recommendation ITU-R BS.412-9.
Figure 7 shows that the protection ratios given in Recommendation ITU-R BS.412-9 are still relevant
even if a lot of receivers have better protection ratios.
Figure 8 below shows several protection ratios measured for different values of multiplex power. As
indicated in § 2.1, the following curves represent a theoretical receiver which ensures that 90% of the
sample receivers tested will work properly.
RF protection ratio curves – 0 dBr measured
RF
pro
tecti
on
ra
tio
(d
B)
f (kHz)
32 Rep. ITU-R BS.2213-4
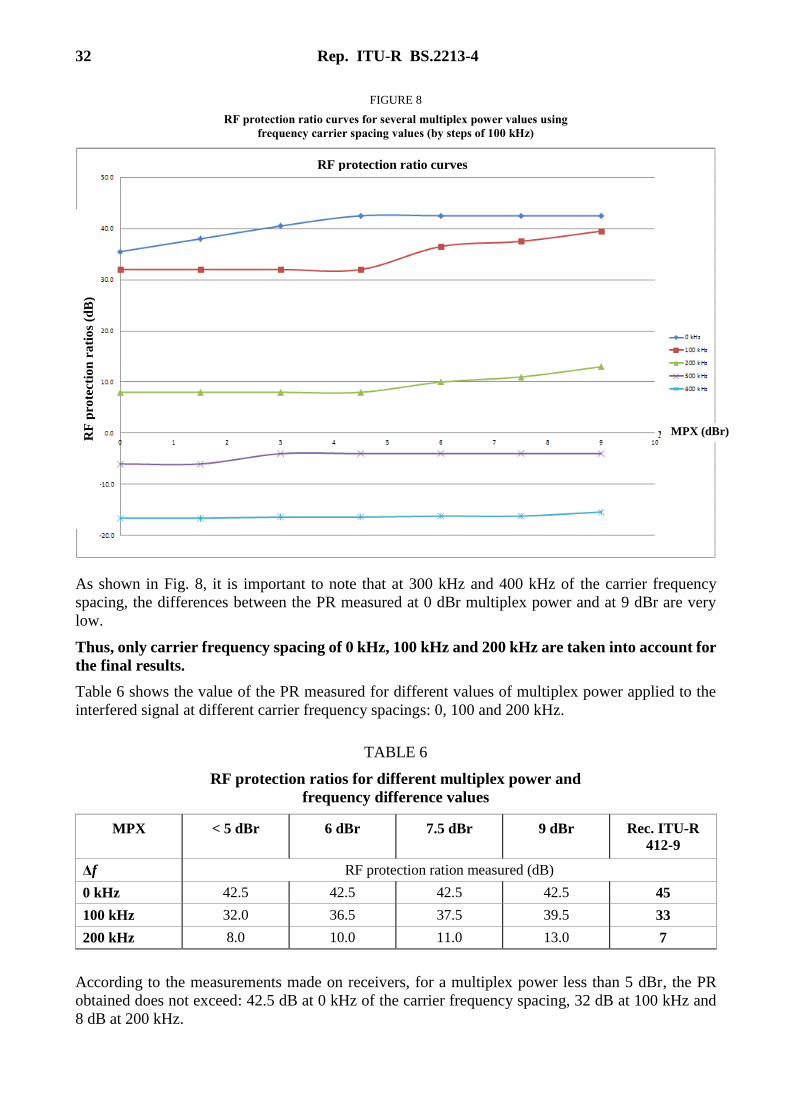
FIGURE 8
RF protection ratio curves for several multiplex power values using
frequency carrier spacing values (by steps of 100 kHz)
As shown in Fig. 8, it is important to note that at 300 kHz and 400 kHz of the carrier frequency
spacing, the differences between the PR measured at 0 dBr multiplex power and at 9 dBr are very
low.
Thus, only carrier frequency spacing of 0 kHz, 100 kHz and 200 kHz are taken into account for
the final results.
Table 6 shows the value of the PR measured for different values of multiplex power applied to the
interfered signal at different carrier frequency spacings: 0, 100 and 200 kHz.
TABLE 6
RF protection ratios for different multiplex power and
frequency difference values
MPX < 5 dBr 6 dBr 7.5 dBr 9 dBr Rec. ITU-R
412-9
Δf RF protection ration measured (dB)
0 kHz 42.5 42.5 42.5 42.5 45
100 kHz 32.0 36.5 37.5 39.5 33
200 kHz 8.0 10.0 11.0 13.0 7
According to the measurements made on receivers, for a multiplex power less than 5 dBr, the PR
obtained does not exceed: 42.5 dB at 0 kHz of the carrier frequency spacing, 32 dB at 100 kHz and
8 dB at 200 kHz.
RF protection ratio curves
RF
pro
tecti
on
ra
tio
s (d
B)
MPX (dBr)
Rep. ITU-R BS.2213-4 33
But for a multiplex power greater than 5 dBr, the PR measured keeps growing as the multiplex power
increases.
Compared to the PR values mentioned in Recommendation ITU-R BS.412-9, the decrease of RF
power that can counterbalance the effect of a higher multiplex power of the unwanted transmitter is
shown in Table 7.
TABLE 7
Decrease of RF power that can compensate the effect of the higher MPX
power of the unwanted transmitter
MPX < 5 dBr 6 dBr 7.5 dBr 9 dBr Rec. ITU-R
412-9
Δf RF protection ration measured (dB)
0 kHz +2.5 +2.5 +2.5 +2.5 45
100 kHz +1.0 –3.5 –4.5 –6.5 33
200 kHz –1.0 –3.0 –4.0 –6.0 7
The negative figures represent the necessary decrease of RF power that can compensate the effect of
multiplex power to ensure the protection of the wanted signal.
The positive figures show that PR values of Recommendation ITU-R BS.412-9 can be decreased by
each value according to the case considered. For example, for a carrier frequency spacing of 0 kHz,
the trial has shown the possibility to use 42.5 dB of protection ratio (between a wanted signal which
did not use the multiplex power and an unwanted signal which did use the multiplex power) instead
of 45 dB as indicated in Recommendation ITU-R BS.412-9.
3 Conclusion
The test bench results performed in France in 2012 have confirmed that FM broadcast signals with
higher multiplex power are degrading protection ratios and can worsen the quality of the interfered
FM broadcast signal. However, by widening the amount of receivers taken into account in the
measurements, the figures of the protection ratio obtained in Annex 1 are slightly different.
The main conclusion is that PRs in Recommendation ITU-R BS.412-9 are still relevant for multiplex
power that do not exceed 5 dBr for any frequency spacing between the wanted and the unwanted
signals. For signals that exceed 5 dBr, it is necessary to reduce the transmitter RF power according to
the values shown in Table 7.
Furthermore, the measurements show better performance for receivers put into market after 2010
(35% of the tested receivers). This could be due to a majority of 2010’s FM receivers using digital
components. This trend could enable the use of a lower protection ratio in the long term and a possible
revision of Recommendation ITU-R BS.412 if a new measurements campaign assessed it.
34 Rep. ITU-R BS.2213-4
Attachment
to Annex 3
Measurement protocol
1 Introduction
The bench test is based on Recommendation ITU-R BS.641 used to set protection ratios according to
the multiplex power variations and the spacing of carrier frequencies. The bench test involved a
representative sample of 26 receivers.
This document explains the methodology and the means used to carry out the bench test.
2 Bench test design
This first part explains how to get some technical elements required for the bench test:
1) the coloured noise signal;
2) the equipment that enables the multiplex power variations.
After that, the bench test is set up according to the diagram of measuring given in
Recommendation ITU-R BS.641.
The second part describes the bench test configuration, which is adapted in order to match with the
modern metrology methods.
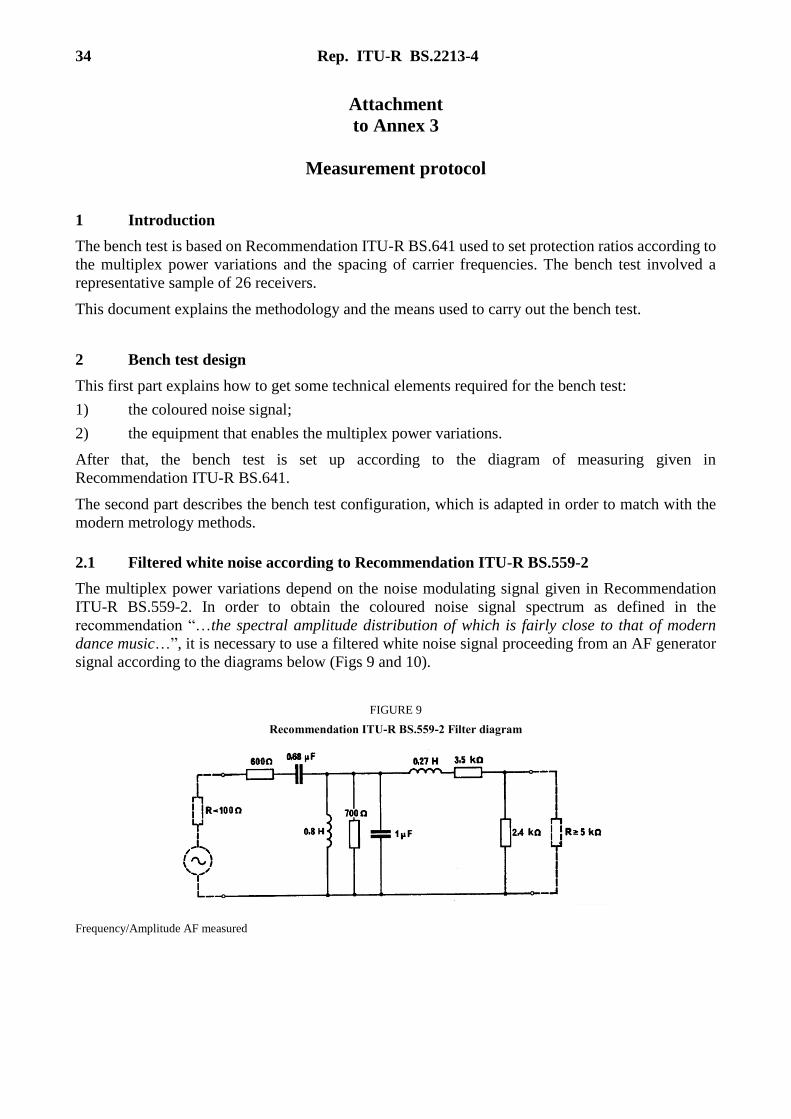
2.1 Filtered white noise according to Recommendation ITU-R BS.559-2
The multiplex power variations depend on the noise modulating signal given in Recommendation
ITU-R BS.559-2. In order to obtain the coloured noise signal spectrum as defined in the
recommendation “…the spectral amplitude distribution of which is fairly close to that of modern
dance music…”, it is necessary to use a filtered white noise signal proceeding from an AF generator
signal according to the diagrams below (Figs 9 and 10).
FIGURE 9
Recommendation ITU-R BS.559-2 Filter diagram
Frequency/Amplitude AF measured

Rep. ITU-R BS.2213-4 35
FIGURE 10
Weighted (coloured) noise defined by Recommendation ITU-R BS.559-2
------- Filter ------- Filtered white noise measured
The coloured noise obtained was recorded in a specific VX222HR audio card from DIGIGRAM.
This file was saved in a PCM (48 kHz – 16 bit) format and can be read by any professional audio
card. It just requires a digital or analog audio output.
The device SYSTEM TWO from AUDIO PRECISION was selected to provide a white noise signal.
(Set up: Noise – White Pseudo).
2.2 Multiplex power (MPX) variations on interfering transmitter
A Principle
The MPX variation is achieved by using a sound processing system often used in the FM sound
broadcasting service.
The device selected is an OMNI ONE FM. It consists of a stereo coder, which embeds processing
and optimization sound features, used in FM sound broadcasting.
The OMNIA ONE FM can achieve the following functionalities:
1 Filtering at 15 kHz
2 Pre-emphasis of 50 µs
3 Limitation and optimization of level composite output in order to comply with the maximal
level fixed at 8.72Vc/c. This condition ensures that the maximum frequency deviation of
±75 kHz would not be exceeded.
The audio processing is based on AF signals dynamic compression techniques. The processing is
achieved by a set of cells working in a specific frequency band. Each audio frequency band, cut out
beforehand, is handled by a set of functions: dynamic compressor and limiter.
Then, the audio spectrum is reconstructed in order to be injected in the stereo coder. This last function
includes a clipper, which eliminates the over-shoot. This handling ensures to keep the MPX in a
tension range (8.72 Vc/c) and the maximum frequency deviation less than 75 kHz.
Audio Precision
Sty2_ANA_Bruit_Rec-559.ats2
ColorSweep Trace Line Style Thick Data Axis Comment
1 1 Cyan Solid 1 FFT.ChA Amplitude Left
1 2 Cyan Solid 1 FFT.ChB Amplitude Right
Limit Red Solid 2 Data 1 upperlimit Left
Limit Red Solid 2 Data 2 upperlimit Right
Click the "Sweep Spectrum/Waveform" swap button to switch between Frequency and Time
domain displays.
-35
+0
-32.5
-30
-27.5
-25
-22.5
-20
-17.5
-15
-12.5
-10
-7.5
-5
-2.5
d
B
r
A
-35
+0
-32.5
-30
-27.5
-25
-22.5
-20
-17.5
-15
-12.5
-10
-7.5
-5
-2.5
d
B
r
B
20 20k50 100 200 500 1k 2k 5k 10k
Hz

36 Rep. ITU-R BS.2213-4
Therefore, the AF signal dynamic range could be reduced according to the device settings. This
reduction increases the MPX of the signal.
The RF wanted signal is generated by a FM THOMSON-LGT RAMSES II transmitter. The stereo
coder integrated is put into operation.
B Interfering signal line
The bench test interfering signal line consists of the following devices:
– A PUC 2 YELLOWTEC card, which generates a coloured noise as a AES/UER signal
– A set up Mono OMNIA ONE FM
– A FM RVR PTX 100LCD transmitter.
Concerning the measurement in static mode, the following settings are used:
– The control of the maximum deviation is achieved by the FMA of Rohde & Schwarz;
– The spectrum analyser E4402B of HP shows the J0 carrier cancellation;
– The modulating signal MPX is measured with the ADFM02 analyser.
Concerning the measurement in dynamic, following settings are used:
– MPX variations and frequency deviations are analysed with the ADFM02.
This part of the bench test and its measurements modes are shown on Fig. 11.
FIGURE 11
Diagram of the interfering signal line
Sound card
(Laptop)
OMNIA
ONE FM
RVR
Transmitter
Dynamic modulation
analyser
ADFM02
RF
MPX
INPUT
FMA
RF spectrum analyser AF spectrum analyser
AF generator
AES/UER

Rep. ITU-R BS.2213-4 37
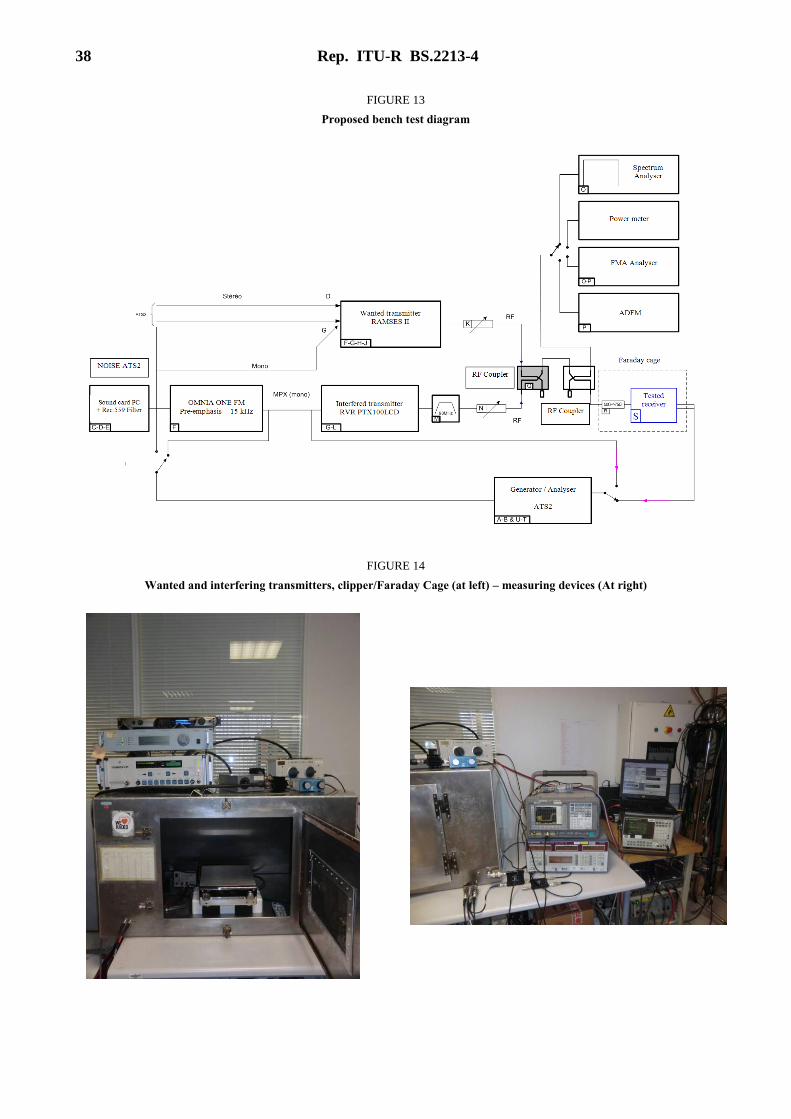
2.3 Bench test description
The bench test is built according to the diagram of measuring apparatus reproduced below:
FIGURE 12
Diagram of the measuring apparatus
A modern version of this bench test is presented below. It contains, in a macroscopic model, all the
elements given in the reference diagram (Recommendation ITU-R BS.641). A correspondence
between the diagram given in the recommendation and the new version is shown below (Letters “A”
to “U”).
The tested equipment (the receiver) is put in a Faraday cage that shields the receiver from any radio
interferences around.
D01-sc
38 Rep. ITU-R BS.2213-4
FIGURE 13
Proposed bench test diagram
FIGURE 14
Wanted and interfering transmitters, clipper/Faraday Cage (at left) – measuring devices (At right)

Rep. ITU-R BS.2213-4 39
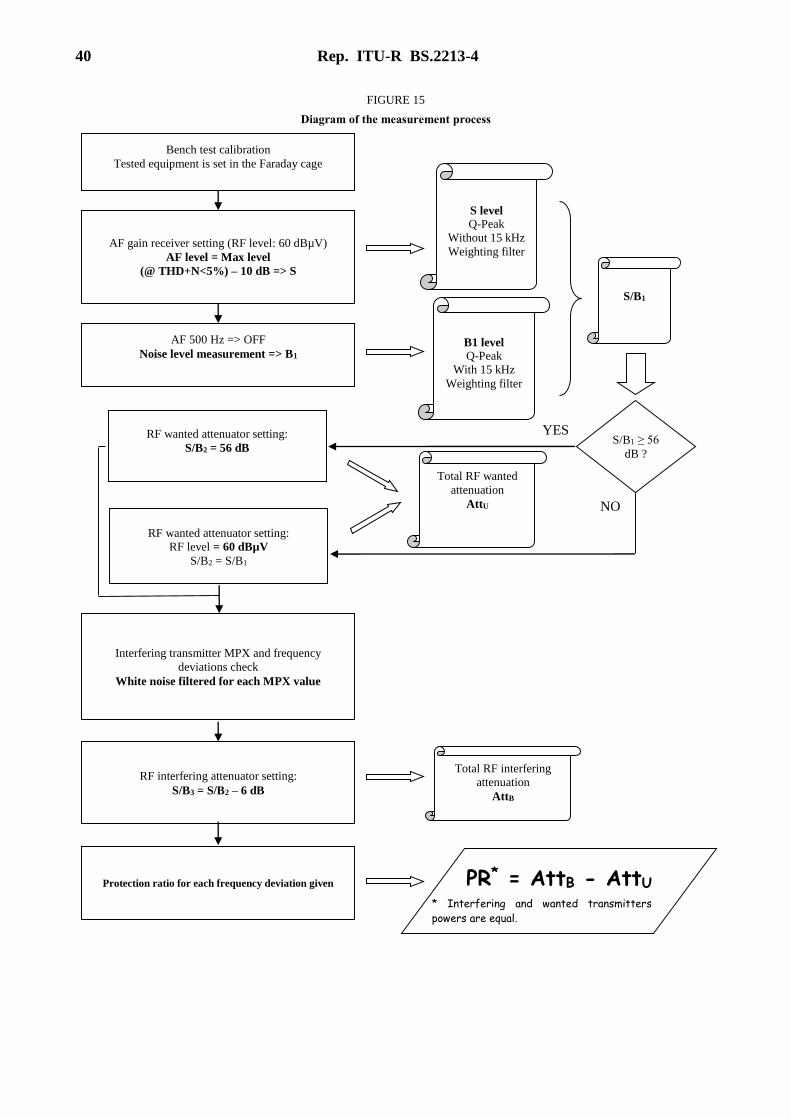
2.4 Measuring process
The measurement process used for the bench test follows exactly the methodology described in
Recommendation ITU-R BS.641.
The protection ratio is obtained when the following calculation is achieved:
PR = (PU – AttU) – (PB – AttB)
where:
PU is the RF wanted transmitter power
AttU is the RF wanted transmitter attenuation that enables to fix the S/N at 56 dB,
when the interfering transmitter is not activated, as recommended
PB is the RF interfering transmitter power
AttB is the RF interfering transmitter attenuation that enables to fix the S/N at 50 dB,
when the interfering transmitter is activated.
In order to ease the protection ratio calculation, the power level of wanted and interfering signal is
the same.
So the protection ratio is: PR = AttB – AttU.
This measurement process is also described in Fig. 15.
40 Rep. ITU-R BS.2213-4
FIGURE 15
Diagram of the measurement process
Bench test calibration
Tested equipment is set in the Faraday cage
AF gain receiver setting (RF level: 60 dBµV)
AF level = Max level
(@ THD+N<5%) – 10 dB => S
AF 500 Hz => OFF
Noise level measurement => B1
RF wanted attenuator setting:
RF level = 60 dBµV
S/B2 = S/B1
Interfering transmitter MPX and frequency
deviations check
White noise filtered for each MPX value
RF interfering attenuator setting:
S/B3 = S/B2 – 6 dB
Protection ratio for each frequency deviation given PR* = AttB - AttU * Interfering and wanted transmitters
powers are equal.
S level
Q-Peak
Without 15 kHz
Weighting filter
B1 level
Q-Peak
With 15 kHz
Weighting filter
S/B1
S/B1 ≥ 56
dB ?
RF wanted attenuator setting:
S/B2 = 56 dB
YES
Total RF wanted
attenuation
AttU NO
Total RF interfering
attenuation
AttB
Rep. ITU-R BS.2213-4 41
Annex 4
Impact of multiplex power levels higher than 0 dBr on the RF protection
ratio of sound broadcasting emissions in VHF band II
1 Introduction
The RF protection ratios given in Recommendation ITU-R BS.412 are valid for MPX power not
exceeding 0 dBr and a maximum frequency deviation of ±75 kHz. Annexes 2 and 3 of this Report
investigate the impact on a wanted signal from an interfering unwanted FM modulated signal whose
MPX power is higher than 0 dBr, i.e. up to 7.5 dBr or 9 dBr respectively:
• Annex 2: Results of measurements performed in Hungary on the protection levels against
interferers with exceeded MPX power in the FM sound broadcasting
• Annex 3: Results of measurements performed in France on the protection levels against
interferers with exceeded MPX power in the FM sound broadcasting
For 0 kHz, 100 kHz and 200 kHz frequency difference between wanted and unwanted signal, Annex 2
shows an increase of the measured RF protection ratios when increasing MPX power beyond the
values given in Recommendation ITU-R BS.412. (In this Annex frequency differences of 50 kHz,
150 kHz and 250 kHz are assumed to be irrelevant in practice, since only 100 kHz steps are used in
Band II.)
Annex 3 also shows an increase of the protection ratios with increasing MPX power but far less than
Annex 2.
Although it is mentioned that the measurement was executed according to Recommendation
ITU-R BS.641, it seems to be conspicuous that the measured protection ratios for 0 dBr are
remarkably low. For example, all measured protection ratios for 0 kHz frequency difference are
between 19 dB and 40 dB though experience in Germany is that nearly all receivers show values
between about 43 dB and 47 dB with a very low deviation between different receivers. The same
applies for the values for 100 kHz frequency difference: the measured values are in a very wide range
between –5 dB and 33 dB. Experience in Germany is that the majority of receivers show values
around 30 dB with a deviation between different receivers of about 3 or 4 dB, but not much more
(when measured in stereo).
For comparison, Fig. 16 shows the data from Annex 2 and measurement results in § 3 of this Annex.
Figure 17 shows the data from Annex 2 compared with the results from Annex 3 and with
measurement results in § 3 of this Annex.
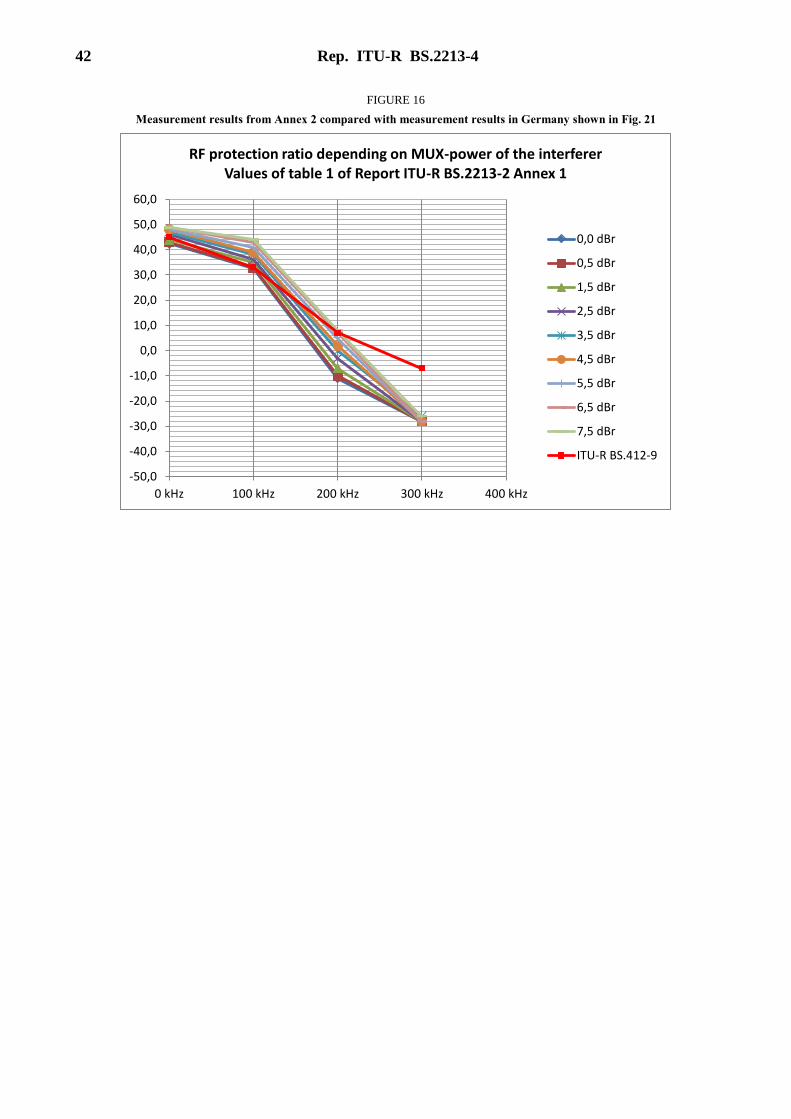
42 Rep. ITU-R BS.2213-4
FIGURE 16
Measurement results from Annex 2 compared with measurement results in Germany shown in Fig. 21
-50,0
-40,0
-30,0
-20,0
-10,0
0,0
10,0
20,0
30,0
40,0
50,0
60,0
0 kHz 100 kHz 200 kHz 300 kHz 400 kHz
RF protection ratio depending on MUX-power of the interfererValues of table 1 of Report ITU-R BS.2213-2 Annex 1
0,0 dBr
0,5 dBr
1,5 dBr
2,5 dBr
3,5 dBr
4,5 dBr
5,5 dBr
6,5 dBr
7,5 dBr
ITU-R BS.412-9
Rep. ITU-R BS.2213-4 43
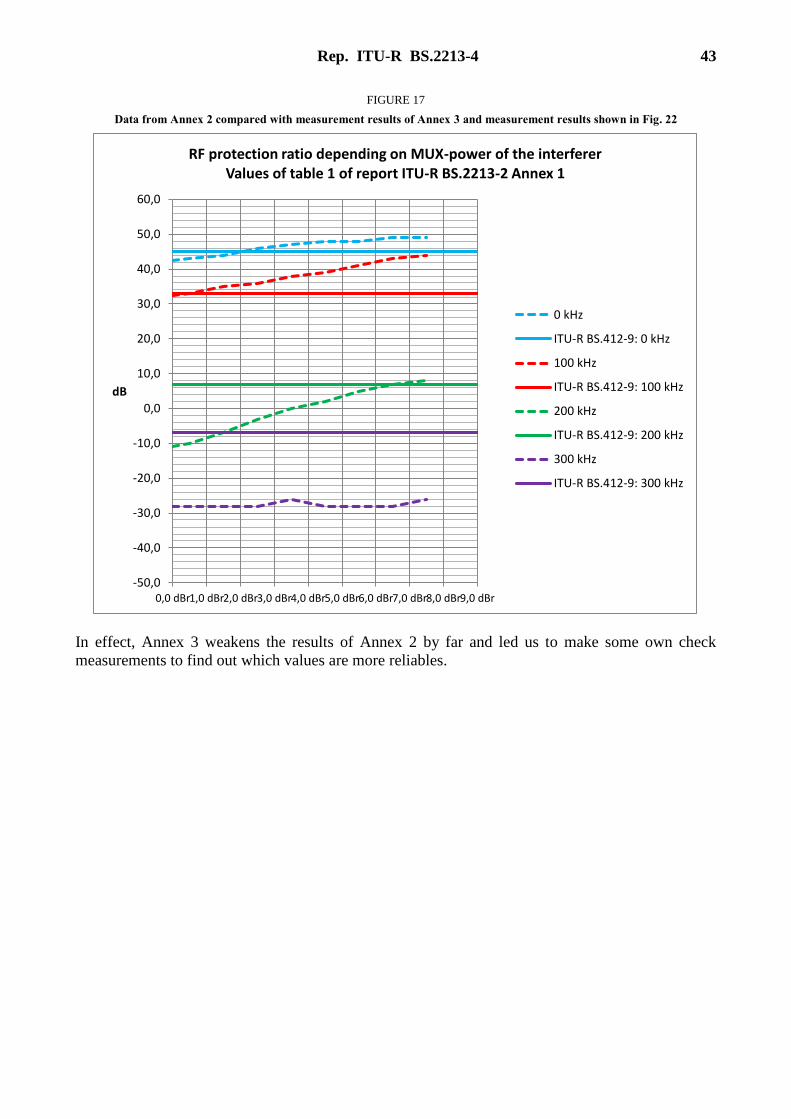
FIGURE 17
Data from Annex 2 compared with measurement results of Annex 3 and measurement results shown in Fig. 22
In effect, Annex 3 weakens the results of Annex 2 by far and led us to make some own check
measurements to find out which values are more reliables.
-50,0
-40,0
-30,0
-20,0
-10,0
0,0
10,0
20,0
30,0
40,0
50,0
60,0
0,0 dBr1,0 dBr2,0 dBr3,0 dBr4,0 dBr5,0 dBr6,0 dBr7,0 dBr8,0 dBr9,0 dBr
dB
RF protection ratio depending on MUX-power of the interfererValues of table 1 of report ITU-R BS.2213-2 Annex 1
0 kHz
ITU-R BS.412-9: 0 kHz
100 kHz
ITU-R BS.412-9: 100 kHz
200 kHz
ITU-R BS.412-9: 200 kHz
300 kHz
ITU-R BS.412-9: 300 kHz

44 Rep. ITU-R BS.2213-4
FIGURE 18
Copy of the results of Fig. 7 of Report ITU-R BS.2213-2 Annex 2 with inserted values given from
Recommendation ITU-R BS.412 for comparison with Fig. 2 and Fig. 6
It is noticeable that the measured values for 0 kHz and 100 kHz seem to be too low (see text), while
the measured values at 200 kHz, 300 kHz and 400 kHz seem to be too high and are generally above
the values from Recommendation ITU-R BS.412.
2 Measurement setup and measurement methods
The measurements were carried out based on Recommendation ITU-R BS.641 except for the
unwanted signal with multiplex power more than 0 dBr: the transmitter of the unwanted signal was
modulated from a CD player with pink noise according to Recommendation ITU-R BS.559. This AF
signal was clipped by a limiter (2 anti-parallel diodes). The limiting rate was adjusted by an adjustable
attenuator before the clipper. With this method it was possible to generate signals with a multiplex
power from 0 dBr to 9 dBr in steps of 1 dB with a maximum deviation not exceeding ±75 kHz, clipped
by a depth modelling mode stereo coder (see Fig. 19). Unfortunately it was forgotten to switch off
the stereo pilot tone of this stereo coder. So, differing to Recommendation ITU-R BS.641 the
unwanted signal included a stereo pilot tone (19 kHz) with ±6.8 kHz frequency deviation, with left
channel = right channel like a mono signal. But comparisons with former measurements showed a
negligible influence of the stereo pilot tone.
The wanted signal was a stereo signal (19 kHz pilot with ±6.8 kHz deviation) with no further
modulation or with additional 500 Hz respectively (±75 kHz sum deviation).
Figure 19 shows the complete measurement arrangement.
Rep. ITU-R BS.2213-4 45
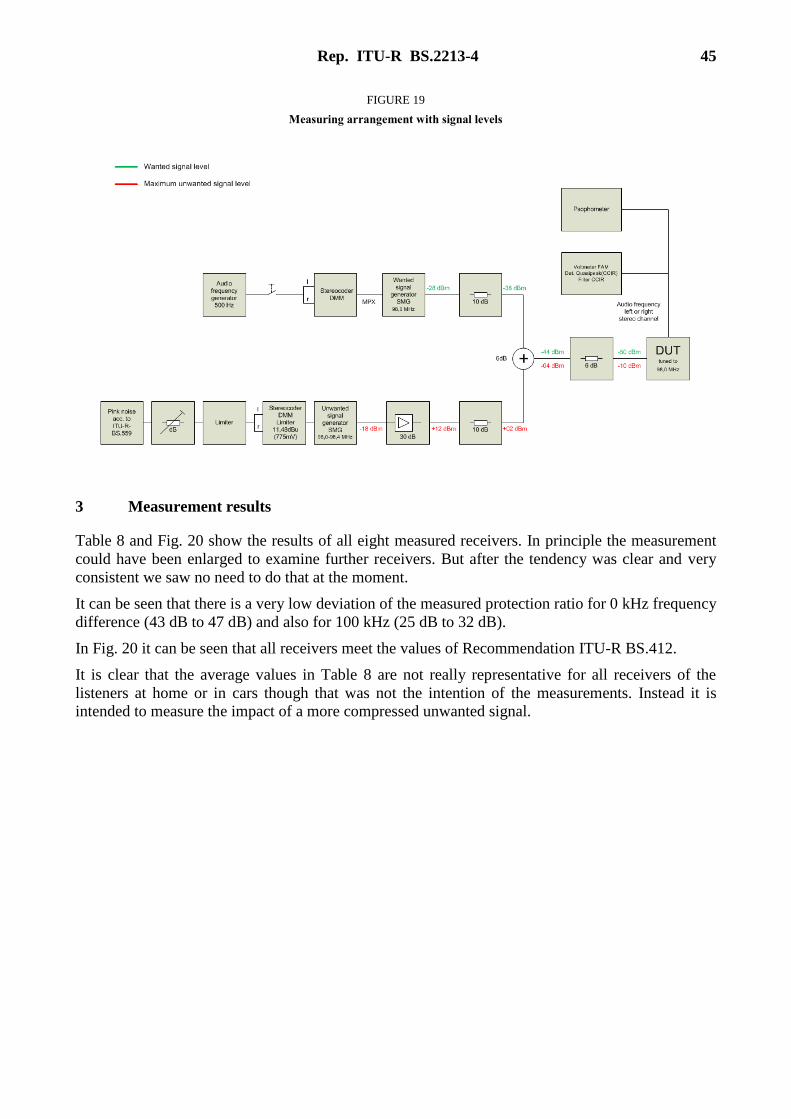
FIGURE 19
Measuring arrangement with signal levels
3 Measurement results
Table 8 and Fig. 20 show the results of all eight measured receivers. In principle the measurement
could have been enlarged to examine further receivers. But after the tendency was clear and very
consistent we saw no need to do that at the moment.
It can be seen that there is a very low deviation of the measured protection ratio for 0 kHz frequency
difference (43 dB to 47 dB) and also for 100 kHz (25 dB to 32 dB).
In Fig. 20 it can be seen that all receivers meet the values of Recommendation ITU-R BS.412.
It is clear that the average values in Table 8 are not really representative for all receivers of the
listeners at home or in cars though that was not the intention of the measurements. Instead it is
intended to measure the impact of a more compressed unwanted signal.
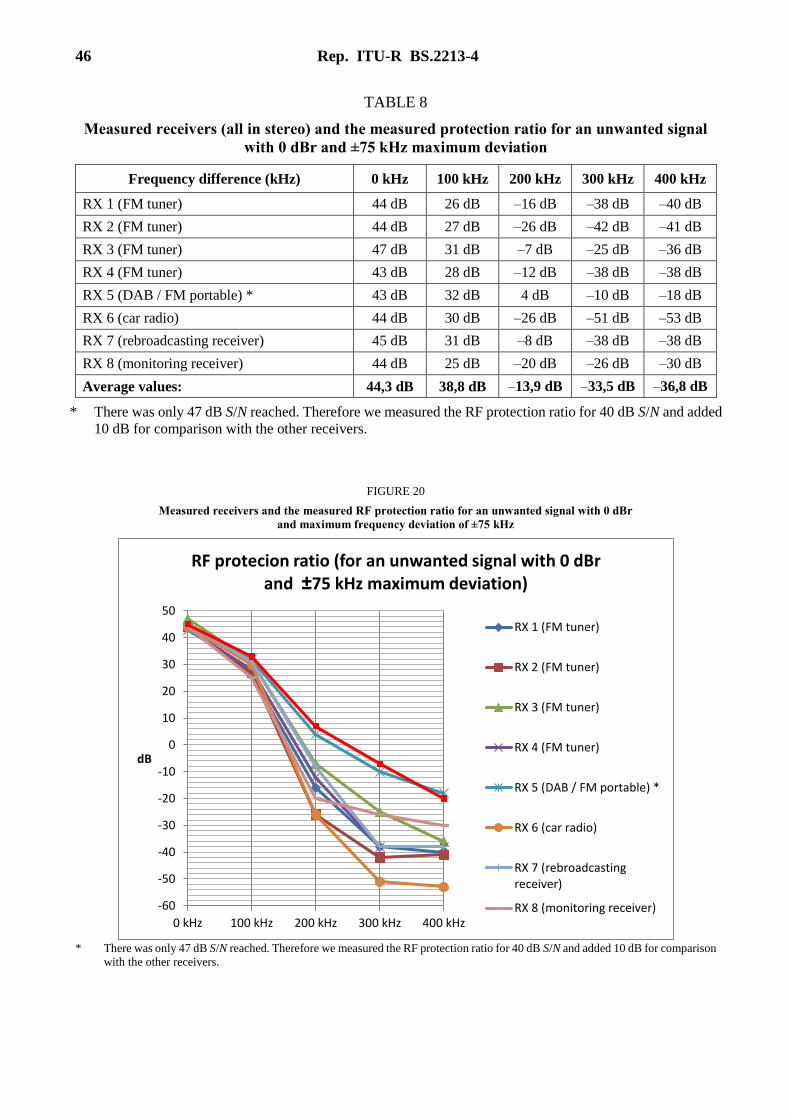
46 Rep. ITU-R BS.2213-4
TABLE 8
Measured receivers (all in stereo) and the measured protection ratio for an unwanted signal
with 0 dBr and ±75 kHz maximum deviation
Frequency difference (kHz) 0 kHz 100 kHz 200 kHz 300 kHz 400 kHz
RX 1 (FM tuner) 44 dB 26 dB –16 dB –38 dB –40 dB
RX 2 (FM tuner) 44 dB 27 dB –26 dB –42 dB –41 dB
RX 3 (FM tuner) 47 dB 31 dB –7 dB –25 dB –36 dB
RX 4 (FM tuner) 43 dB 28 dB –12 dB –38 dB –38 dB
RX 5 (DAB / FM portable) * 43 dB 32 dB 4 dB –10 dB –18 dB
RX 6 (car radio) 44 dB 30 dB –26 dB –51 dB –53 dB
RX 7 (rebroadcasting receiver) 45 dB 31 dB –8 dB –38 dB –38 dB
RX 8 (monitoring receiver) 44 dB 25 dB –20 dB –26 dB –30 dB
Average values: 44,3 dB 38,8 dB –13,9 dB –33,5 dB –36,8 dB
* There was only 47 dB S/N reached. Therefore we measured the RF protection ratio for 40 dB S/N and added
10 dB for comparison with the other receivers.
FIGURE 20
Measured receivers and the measured RF protection ratio for an unwanted signal with 0 dBr
and maximum frequency deviation of ±75 kHz
* There was only 47 dB S/N reached. Therefore we measured the RF protection ratio for 40 dB S/N and added 10 dB for comparison
with the other receivers.
-60
-50
-40
-30
-20
-10
0
10
20
30
40
50
0 kHz 100 kHz 200 kHz 300 kHz 400 kHz
dB
RF protecion ratio (for an unwanted signal with 0 dBr and ±75 kHz maximum deviation)
RX 1 (FM tuner)
RX 2 (FM tuner)
RX 3 (FM tuner)
RX 4 (FM tuner)
RX 5 (DAB / FM portable) *
RX 6 (car radio)
RX 7 (rebroadcastingreceiver)
RX 8 (monitoring receiver)

Rep. ITU-R BS.2213-4 47
Figure 21 shows the results when the MPX power of the unwanted signal is increased from 0 dBr to
9 dBr by steps of 1 dB. It can be seen that the major impact happens at 100 kHz frequency difference.
Also the values given by Recommendation ITU-R BS.412 are exceeded by far.
Although at 0 kHz frequency difference there is a lesser impact, the values given by Recommendation
ITU-R BS.412 are exceeded anyway.
At 200 kHz frequency difference there is also an impact but all values are still under the values given
by ITU-R BS.412, so this influence seems not that critical than at 0 kHz and 100 kHz frequency
difference.
At 300 kHz and 400 kHz the influence of the MPX power is very low and in practice negligible.
FIGURE 21
Average of measured RF protection ratios of eight receivers (see Table 8) in comparison
with the values given by Recommendation ITU-R BS.412
Figure 22 shows the influence of the MPX power more clearly. It can be seen that at 2 dBr the
protection ratio given by Recommendation ITU-R BS.412 are reached (100 kHz) though at 0 kHz
frequency difference the value of 45 dB (Recommendation ITU-R BS.412) is still exceeded by 2 dB.
-50,0
-40,0
-30,0
-20,0
-10,0
0,0
10,0
20,0
30,0
40,0
50,0
60,0
0 kHz 100 kHz 200 kHz 300 kHz 400 kHz
dB
RF protection ratio depending on MUX-power of the interfererAverage of 8 receivers
0 dBr
1 dBr
2 dBr
3 dBr
4 dBr
5 dBr
6 dBr
7 dBr
8 dBr
9 dBr
ITU-R BS.412-9
48 Rep. ITU-R BS.2213-4
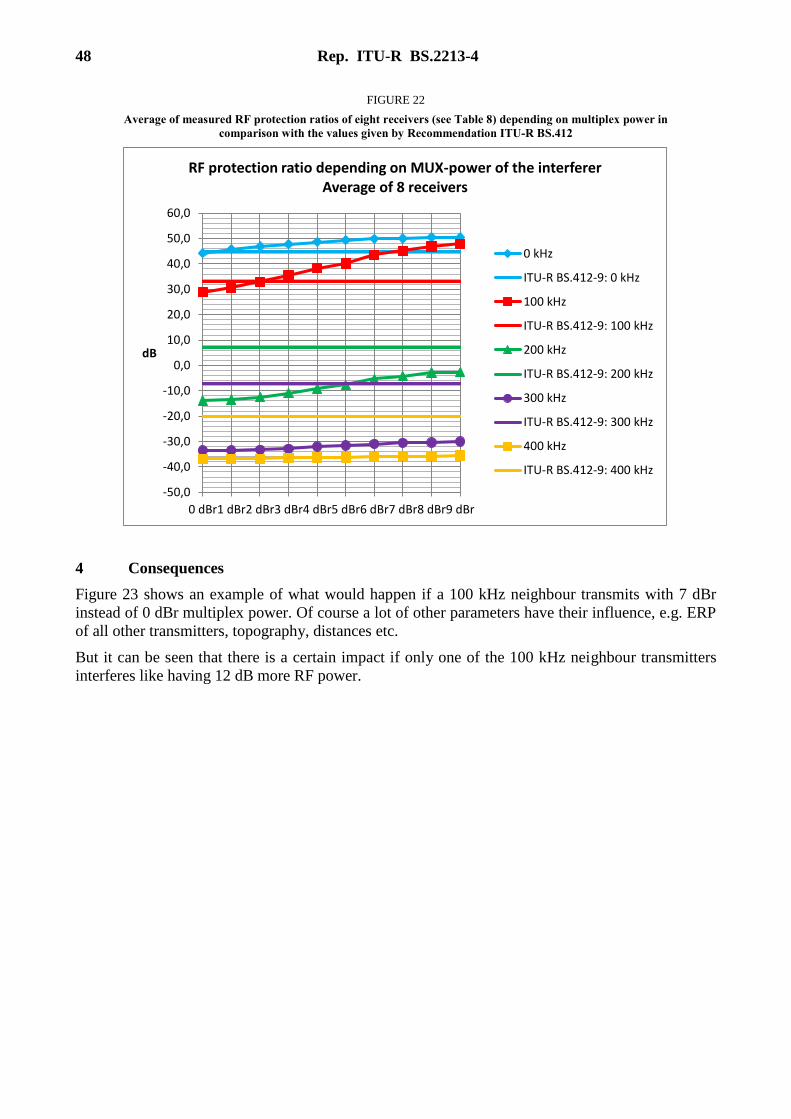
FIGURE 22
Average of measured RF protection ratios of eight receivers (see Table 8) depending on multiplex power in
comparison with the values given by Recommendation ITU-R BS.412
4 Consequences
Figure 23 shows an example of what would happen if a 100 kHz neighbour transmits with 7 dBr
instead of 0 dBr multiplex power. Of course a lot of other parameters have their influence, e.g. ERP
of all other transmitters, topography, distances etc.
But it can be seen that there is a certain impact if only one of the 100 kHz neighbour transmitters
interferes like having 12 dB more RF power.
-50,0
-40,0
-30,0
-20,0
-10,0
0,0
10,0
20,0
30,0
40,0
50,0
60,0
0 dBr1 dBr2 dBr3 dBr4 dBr5 dBr6 dBr7 dBr8 dBr9 dBr
dB
RF protection ratio depending on MUX-power of the interfererAverage of 8 receivers
0 kHz
ITU-R BS.412-9: 0 kHz
100 kHz
ITU-R BS.412-9: 100 kHz
200 kHz
ITU-R BS.412-9: 200 kHz
300 kHz
ITU-R BS.412-9: 300 kHz
400 kHz
ITU-R BS.412-9: 400 kHz
Rep. ITU-R BS.2213-4 49
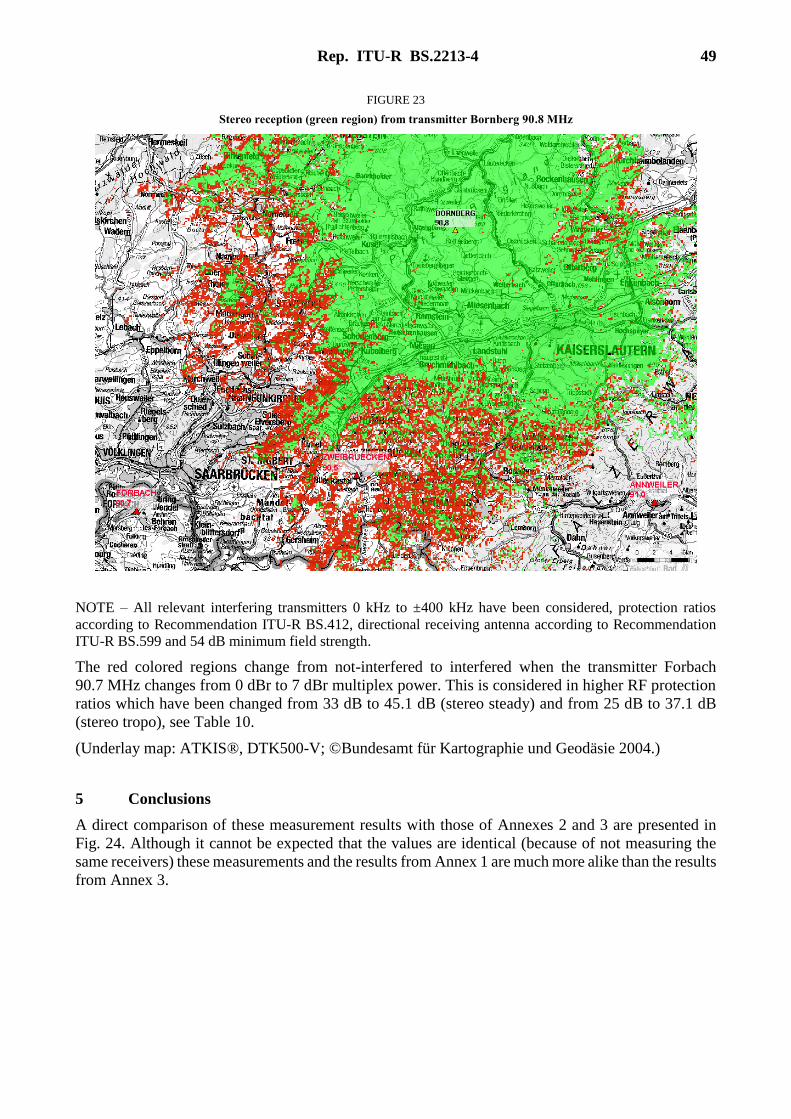
FIGURE 23
Stereo reception (green region) from transmitter Bornberg 90.8 MHz
NOTE – All relevant interfering transmitters 0 kHz to ±400 kHz have been considered, protection ratios
according to Recommendation ITU-R BS.412, directional receiving antenna according to Recommendation
ITU-R BS.599 and 54 dB minimum field strength.
The red colored regions change from not-interfered to interfered when the transmitter Forbach
90.7 MHz changes from 0 dBr to 7 dBr multiplex power. This is considered in higher RF protection
ratios which have been changed from 33 dB to 45.1 dB (stereo steady) and from 25 dB to 37.1 dB
(stereo tropo), see Table 10.
(Underlay map: ATKIS®, DTK500-V; ©Bundesamt für Kartographie und Geodäsie 2004.)
5 Conclusions
A direct comparison of these measurement results with those of Annexes 2 and 3 are presented in
Fig. 24. Although it cannot be expected that the values are identical (because of not measuring the
same receivers) these measurements and the results from Annex 1 are much more alike than the results
from Annex 3.
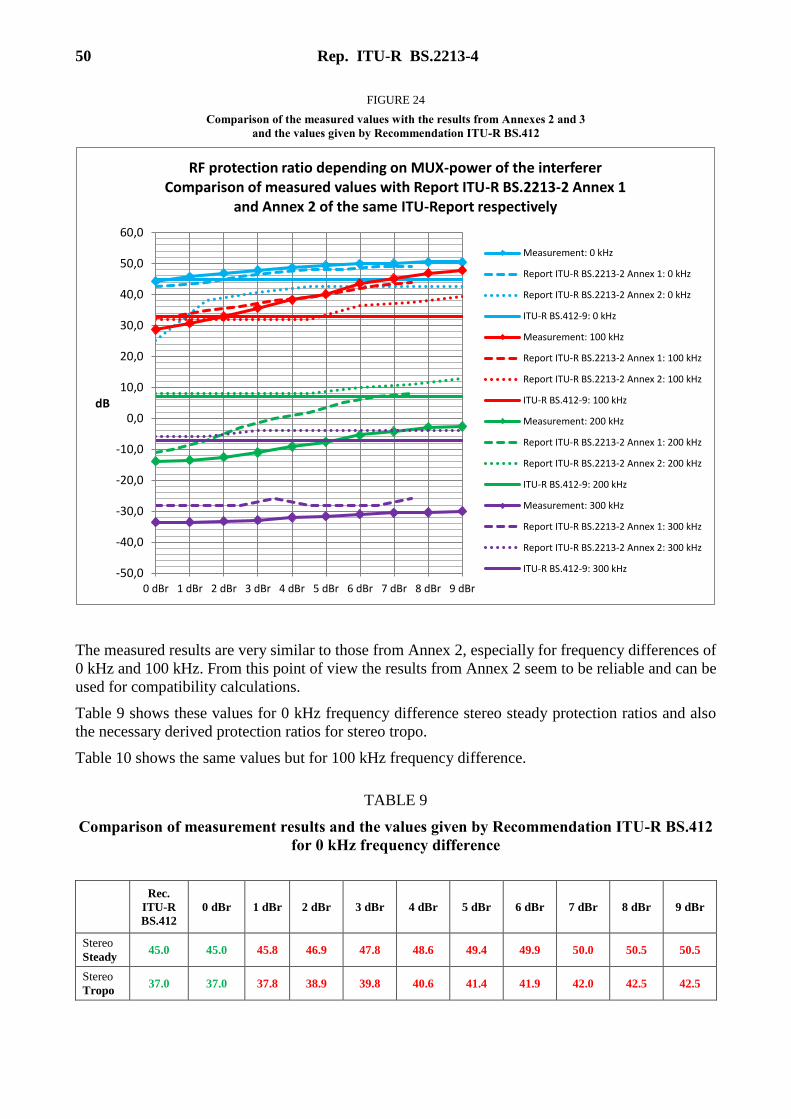
50 Rep. ITU-R BS.2213-4
FIGURE 24
Comparison of the measured values with the results from Annexes 2 and 3
and the values given by Recommendation ITU-R BS.412
The measured results are very similar to those from Annex 2, especially for frequency differences of
0 kHz and 100 kHz. From this point of view the results from Annex 2 seem to be reliable and can be
used for compatibility calculations.
Table 9 shows these values for 0 kHz frequency difference stereo steady protection ratios and also
the necessary derived protection ratios for stereo tropo.
Table 10 shows the same values but for 100 kHz frequency difference.
TABLE 9
Comparison of measurement results and the values given by Recommendation ITU-R BS.412
for 0 kHz frequency difference
Rec.
ITU-R
BS.412
0 dBr 1 dBr 2 dBr 3 dBr 4 dBr 5 dBr 6 dBr 7 dBr 8 dBr 9 dBr
Stereo
Steady 45.0 45.0 45.8 46.9 47.8 48.6 49.4 49.9 50.0 50.5 50.5
Stereo
Tropo 37.0 37.0 37.8 38.9 39.8 40.6 41.4 41.9 42.0 42.5 42.5
-50,0
-40,0
-30,0
-20,0
-10,0
0,0
10,0
20,0
30,0
40,0
50,0
60,0
0 dBr 1 dBr 2 dBr 3 dBr 4 dBr 5 dBr 6 dBr 7 dBr 8 dBr 9 dBr
dB
RF protection ratio depending on MUX-power of the interfererComparison of measured values with Report ITU-R BS.2213-2 Annex 1
and Annex 2 of the same ITU-Report respectively
Measurement: 0 kHz
Report ITU-R BS.2213-2 Annex 1: 0 kHz
Report ITU-R BS.2213-2 Annex 2: 0 kHz
ITU-R BS.412-9: 0 kHz
Measurement: 100 kHz
Report ITU-R BS.2213-2 Annex 1: 100 kHz
Report ITU-R BS.2213-2 Annex 2: 100 kHz
ITU-R BS.412-9: 100 kHz
Measurement: 200 kHz
Report ITU-R BS.2213-2 Annex 1: 200 kHz
Report ITU-R BS.2213-2 Annex 2: 200 kHz
ITU-R BS.412-9: 200 kHz
Measurement: 300 kHz
Report ITU-R BS.2213-2 Annex 1: 300 kHz
Report ITU-R BS.2213-2 Annex 2: 300 kHz
ITU-R BS.412-9: 300 kHz
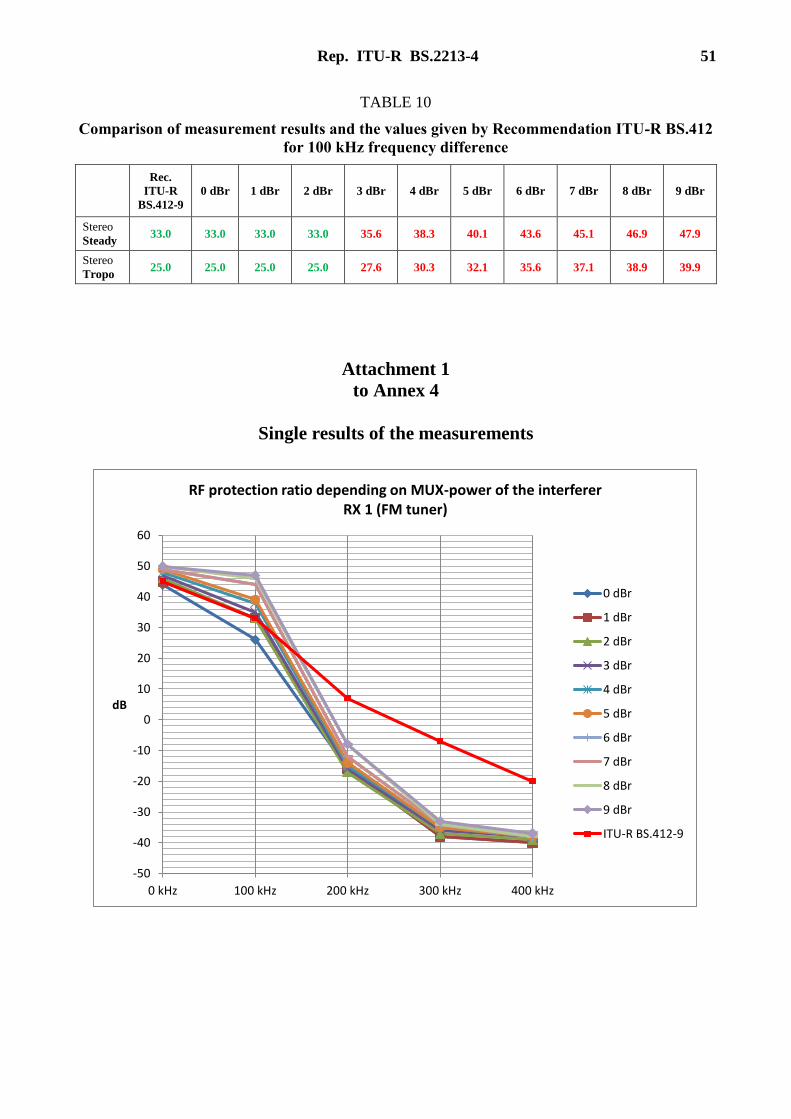
Rep. ITU-R BS.2213-4 51
TABLE 10
Comparison of measurement results and the values given by Recommendation ITU-R BS.412
for 100 kHz frequency difference
Rec.
ITU-R
BS.412-9
0 dBr 1 dBr 2 dBr 3 dBr 4 dBr 5 dBr 6 dBr 7 dBr 8 dBr 9 dBr
Stereo
Steady 33.0 33.0 33.0 33.0 35.6 38.3 40.1 43.6 45.1 46.9 47.9
Stereo
Tropo 25.0 25.0 25.0 25.0 27.6 30.3 32.1 35.6 37.1 38.9 39.9
Attachment 1
to Annex 4
Single results of the measurements
-50
-40
-30
-20
-10
0
10
20
30
40
50
60
0 kHz 100 kHz 200 kHz 300 kHz 400 kHz
dB
RF protection ratio depending on MUX-power of the interfererRX 1 (FM tuner)
0 dBr
1 dBr
2 dBr
3 dBr
4 dBr
5 dBr
6 dBr
7 dBr
8 dBr
9 dBr
ITU-R BS.412-9
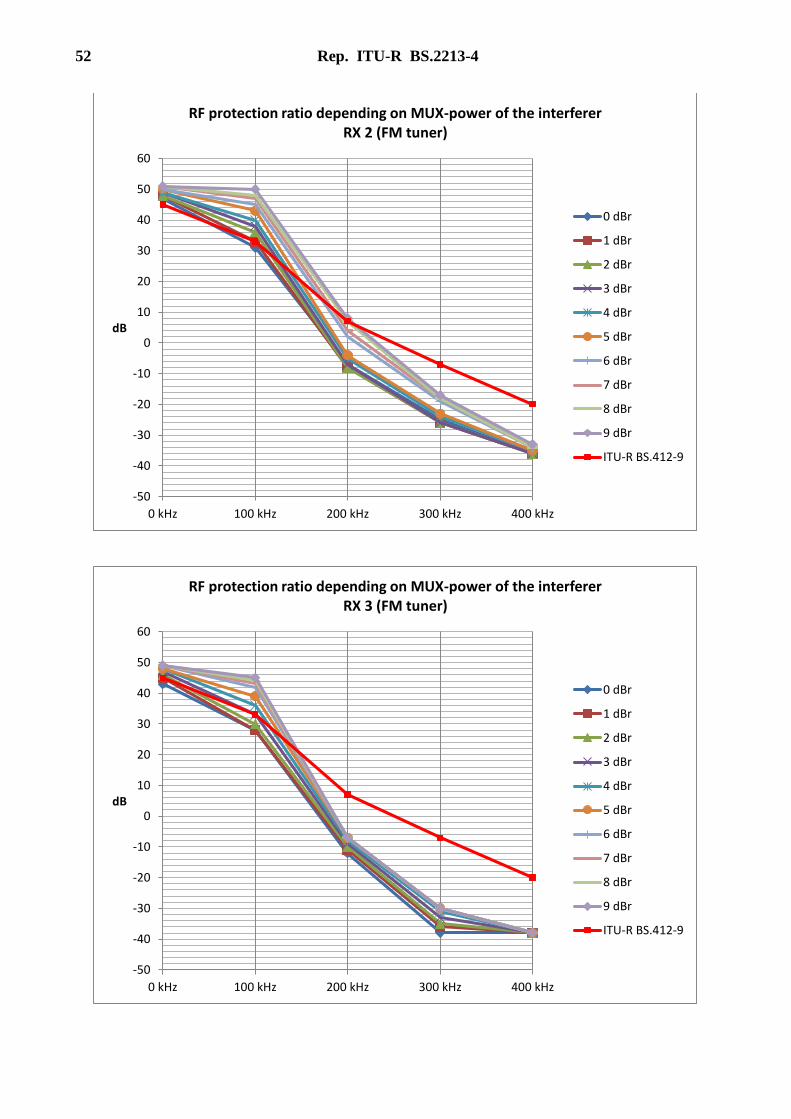
52 Rep. ITU-R BS.2213-4
-50
-40
-30
-20
-10
0
10
20
30
40
50
60
0 kHz 100 kHz 200 kHz 300 kHz 400 kHz
dB
RF protection ratio depending on MUX-power of the interfererRX 2 (FM tuner)
0 dBr
1 dBr
2 dBr
3 dBr
4 dBr
5 dBr
6 dBr
7 dBr
8 dBr
9 dBr
ITU-R BS.412-9
-50
-40
-30
-20
-10
0
10
20
30
40
50
60
0 kHz 100 kHz 200 kHz 300 kHz 400 kHz
dB
RF protection ratio depending on MUX-power of the interfererRX 3 (FM tuner)
0 dBr
1 dBr
2 dBr
3 dBr
4 dBr
5 dBr
6 dBr
7 dBr
8 dBr
9 dBr
ITU-R BS.412-9

Rep. ITU-R BS.2213-4 53
Note to RX 5: There was only 47 dB S/N reached. Therefore we measured the RF protection ratio for 40 dB
S/N and added 10 dB for comparison with the other receivers.
-50
-40
-30
-20
-10
0
10
20
30
40
50
60
0 kHz 100 kHz 200 kHz 300 kHz 400 kHz
dB
RF protection ratio depending on MUX-power of the interfererRX 4 (FM tuner)
0 dBr
1 dBr
2 dBr
3 dBr
4 dBr
5 dBr
6 dBr
7 dBr
8 dBr
9 dBr
ITU-R BS.412-9
-50
-40
-30
-20
-10
0
10
20
30
40
50
60
0 kHz 100 kHz 200 kHz 300 kHz 400 kHz
dB
RF protection ratio depending on MUX-power of the interfererRX 5 (portable DAB/FM receiver)
0 dBr
1 dBr
2 dBr
3 dBr
4 dBr
5 dBr
6 dBr
7 dBr
8 dBr
9 dBr
ITU-R BS.412-9

54 Rep. ITU-R BS.2213-4
-50
-40
-30
-20
-10
0
10
20
30
40
50
60
0 kHz 100 kHz 200 kHz 300 kHz 400 kHz
dB
RF protection ratio depending on MUX-power of the interfererRX 6 (car radio)
0 dBr
1 dBr
2 dBr
3 dBr
4 dBr
5 dBr
6 dBr
7 dBr
8 dBr
9 dBr
ITU-R BS.412-9
-50
-40
-30
-20
-10
0
10
20
30
40
50
60
0 kHz 100 kHz 200 kHz 300 kHz 400 kHz
dB
RF protection ratio depending on MUX-power of the interfererRX 7 (rebroadcasting receiver)
0 dBr
1 dBr
2 dBr
3 dBr
4 dBr
5 dBr
6 dBr
7 dBr
8 dBr
9 dBr
ITU-R BS.412-9

Rep. ITU-R BS.2213-4 55
-50
-40
-30
-20
-10
0
10
20
30
40
50
60
0 kHz 100 kHz 200 kHz 300 kHz 400 kHz
dB
RF protection ratio depending on MUX-power of the interfererRX 8 (FM monitoring receiver)
0 dBr
1 dBr
2 dBr
3 dBr
4 dBr
5 dBr
6 dBr
7 dBr
8 dBr
9 dBr
ITU-R BS.412-9

56 Rep. ITU-R BS.2213-4
Attachment 2
to Annex 4
Spectrum plots of the unwanted signal
-120,00
-110,00
-100,00
-90,00
-80,00
-70,00
-60,00
-50,00
-40,00
97
,75
97
,80
97
,85
97
,90
97
,95
98
,00
98
,05
98
,10
98
,15
98
,20
98
,25
dB
m
RF spectrum 0 dBr MUX-power
0dBr av
0dBr peakhold
-120,00
-110,00
-100,00
-90,00
-80,00
-70,00
-60,00
-50,00
-40,00
97
,75
97
,80
97
,85
97
,90
97
,95
98
,00
98
,05
98
,10
98
,15
98
,20
98
,25
dB
m
RF spectrum 1 dBr MUX-power
1dBr av
1dBr peakhold
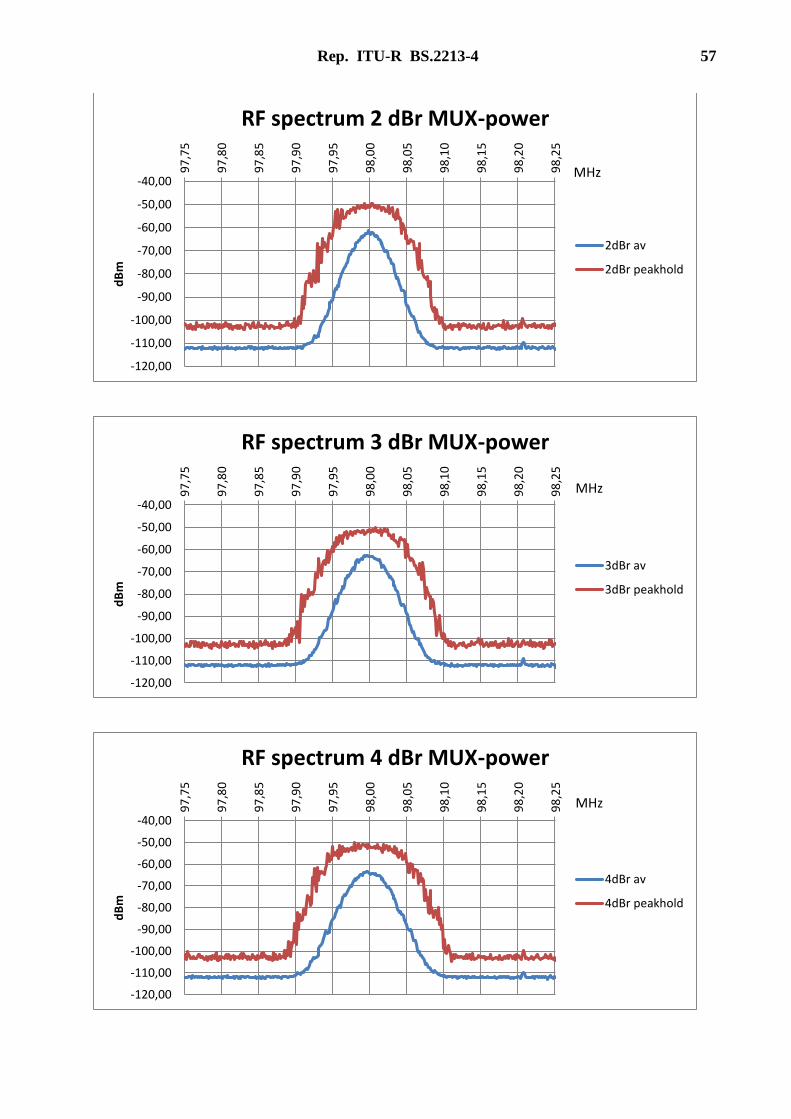
Rep. ITU-R BS.2213-4 57
-120,00
-110,00
-100,00
-90,00
-80,00
-70,00
-60,00
-50,00
-40,009
7,7
5
97
,80
97
,85
97
,90
97
,95
98
,00
98
,05
98
,10
98
,15
98
,20
98
,25
dB
mRF spectrum 2 dBr MUX-power
2dBr av
2dBr peakhold
MHz
-120,00
-110,00
-100,00
-90,00
-80,00
-70,00
-60,00
-50,00
-40,00
97
,75
97
,80
97
,85
97
,90
97
,95
98
,00
98
,05
98
,10
98
,15
98
,20
98
,25
dB
m
RF spectrum 3 dBr MUX-power
3dBr av
3dBr peakhold
MHz
-120,00
-110,00
-100,00
-90,00
-80,00
-70,00
-60,00
-50,00
-40,00
97
,75
97
,80
97
,85
97
,90
97
,95
98
,00
98
,05
98
,10
98
,15
98
,20
98
,25
dB
m
RF spectrum 4 dBr MUX-power
4dBr av
4dBr peakhold
MHz
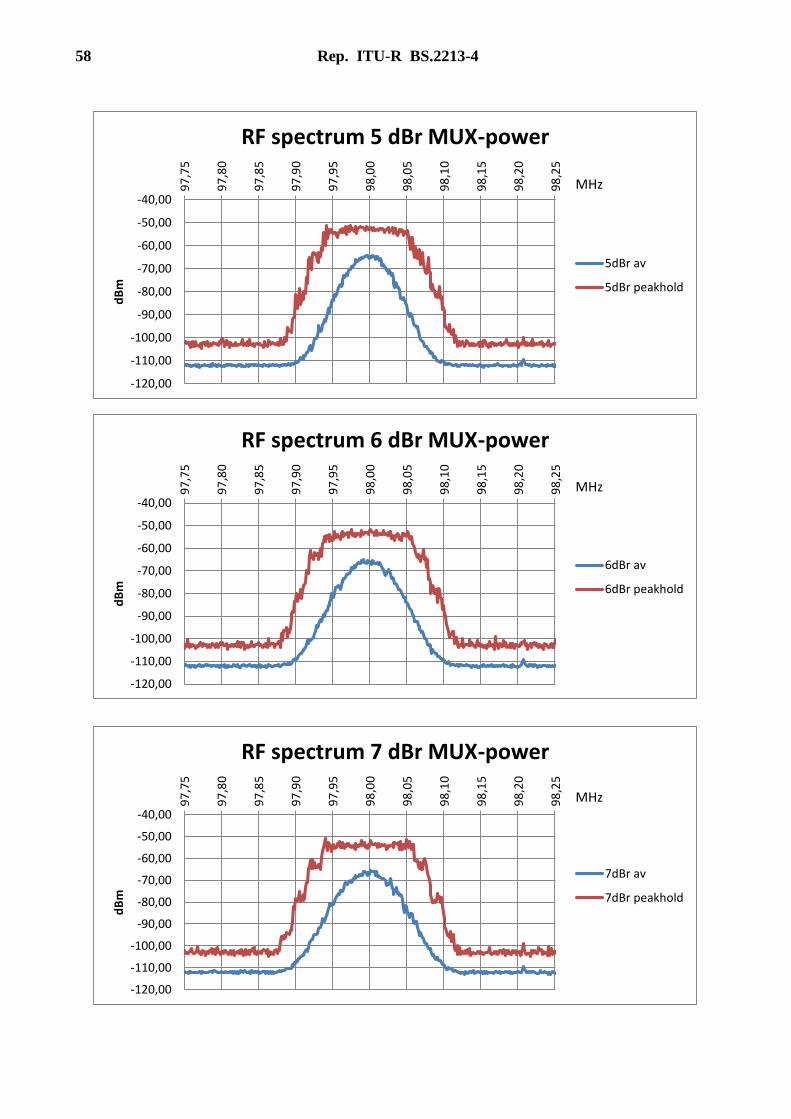
58 Rep. ITU-R BS.2213-4
-120,00
-110,00
-100,00
-90,00
-80,00
-70,00
-60,00
-50,00
-40,009
7,7
5
97
,80
97
,85
97
,90
97
,95
98
,00
98
,05
98
,10
98
,15
98
,20
98
,25
dB
m
RF spectrum 5 dBr MUX-power
5dBr av
5dBr peakhold
MHz
-120,00
-110,00
-100,00
-90,00
-80,00
-70,00
-60,00
-50,00
-40,00
97
,75
97
,80
97
,85
97
,90
97
,95
98
,00
98
,05
98
,10
98
,15
98
,20
98
,25
dB
m
RF spectrum 6 dBr MUX-power
6dBr av
6dBr peakhold
MHz
-120,00
-110,00
-100,00
-90,00
-80,00
-70,00
-60,00
-50,00
-40,00
97
,75
97
,80
97
,85
97
,90
97
,95
98
,00
98
,05
98
,10
98
,15
98
,20
98
,25
dB
m
RF spectrum 7 dBr MUX-power
7dBr av
7dBr peakhold
MHz
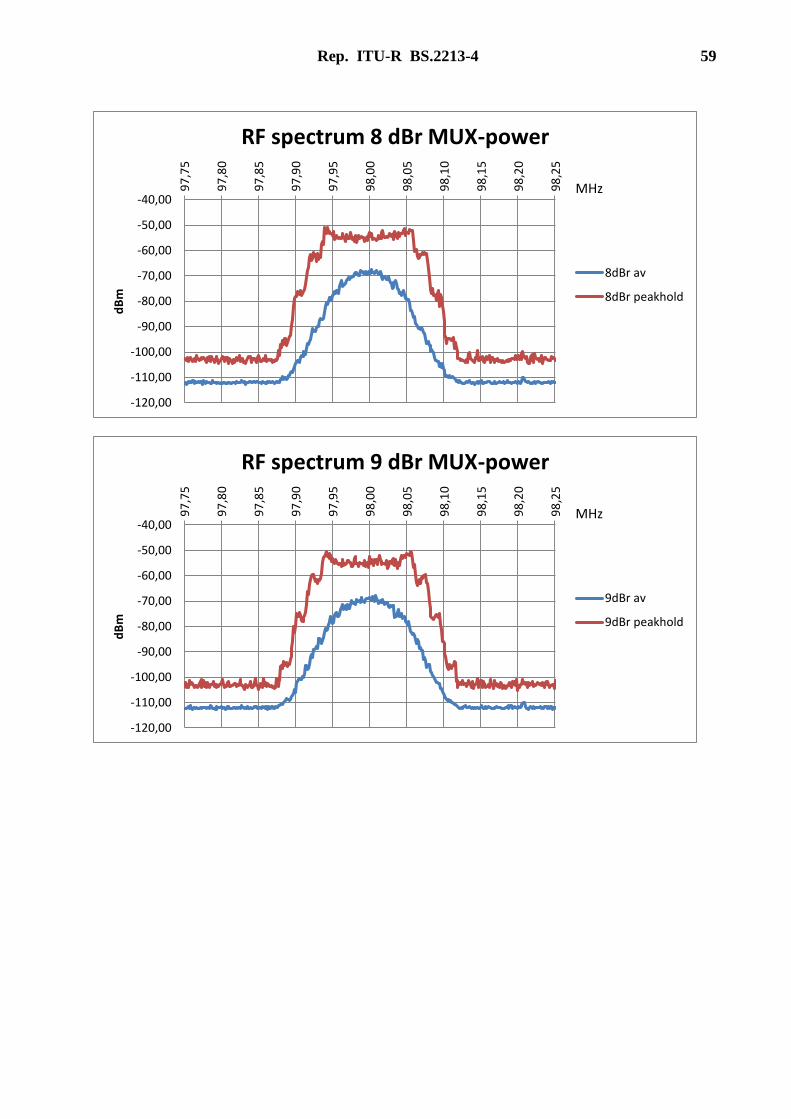
Rep. ITU-R BS.2213-4 59
-120,00
-110,00
-100,00
-90,00
-80,00
-70,00
-60,00
-50,00
-40,009
7,7
5
97
,80
97
,85
97
,90
97
,95
98
,00
98
,05
98
,10
98
,15
98
,20
98
,25
dB
m
RF spectrum 8 dBr MUX-power
8dBr av
8dBr peakhold
MHz
-120,00
-110,00
-100,00
-90,00
-80,00
-70,00
-60,00
-50,00
-40,00
97
,75
97
,80
97
,85
97
,90
97
,95
98
,00
98
,05
98
,10
98
,15
98
,20
98
,25
dB
m
RF spectrum 9 dBr MUX-power
9dBr av
9dBr peakhold
MHz
60 Rep. ITU-R BS.2213-4
Annex 5
Measurements of the relationship between loudness
and multiplex power in FM radio performed in France
1 Introduction
The multiplex power is a broadcast parameter whose value influences the reception quality and the
loudness of the received signal: the loudness increases with the multiplex power. In France, this
parameter is not regulated and no consensus exists for its value. Each radio operator fixes the value
of this parameter according to his own criteria.
By using high multiplex power, some radio operators pretend extending their coverage area, preserve
their audio “signature”, satisfy their audience and compete in the worldwide radio market. These
practices have many harmful consequences. One of these is a radio landscape with heterogeneous
loudness between radio stations. It can damage the audio quality of the program with high multiplex
power, but also disturb the good receiving of other program and increases the risks on the hearings
health, particularly when using headphones. The imbalance in the practices leads to conflicts between
radio operators.
In this context, Conseil Supérieur de l’Audiovisuel (CSA), the French regulatory body for
broadcasting, thought about regulating the multiplex power in France, and an international
harmonization on the use of MPX power could be a way forward for avoiding difficulties among
countries at border level.
1. A previous experimentation has been led in 2012, which has allowed estimating the impact
of the multiplex power on the protection ratios in FM broadcasting (see Annex 2). It has
seemed interesting to evaluate the impact of the multiplex power from the ‘loudness’ point
of view.
2. This analysis presents the measurements realized in 2015 in France by the CSA, which aimed
at establishing the dependence between multiplex power and loudness and concluded on the
degradation of the quality of a signal due to the use of high multiplex powers.
2 Experimentation system
Figure 25 describes the test bench for the experimentation.

Rep. ITU-R BS.2213-4 61
FIGURE 25
Experimentation system
3 Database description
The database is initially composed of three audio tracks which are a good representation of content
usually broadcasted in FM radio:
‒ an information sequence (speech voice);
‒ a pop music sequence (singing voice and acoustic instrument);
‒ a rap music sequence (speech and singing voices, percussions and electronic music).
Each audio track is compressed with two different levels (3 dB and 6 dB). All audio files are
normalized to ‒23 LUFS. The tests are made on the three versions (0 dB, 3dB and 6 dB compression)
of each track. More information about the audio files is available in the Annex of the document.
4 Experimental protocol
The experimentation respects the following protocol for each audio track:
1 Submit of the audio source signal to the modulation chain2;
2 Tuning of the gain of the audio source signal in order to reach the target multiplex power by
controlling the frequency deviation3;
3 After stabilization of the multiplex power:
‒ measurement of the gain applied to the audio source signal (which allows to obtain the
loudness),
‒ measurement of the loudness of the received signal,
‒ recording of the received signal,
‒ recording of the RF spectrum over one minute.
2 The signal is looped until a stable multiplex power is reached.
3 The frequency deviation is controlled to the value of 63,9 kHz, which corresponds to the deviation of a
composite stereo signal of 75 kHz to which the carrier and the RDS signal are removed.
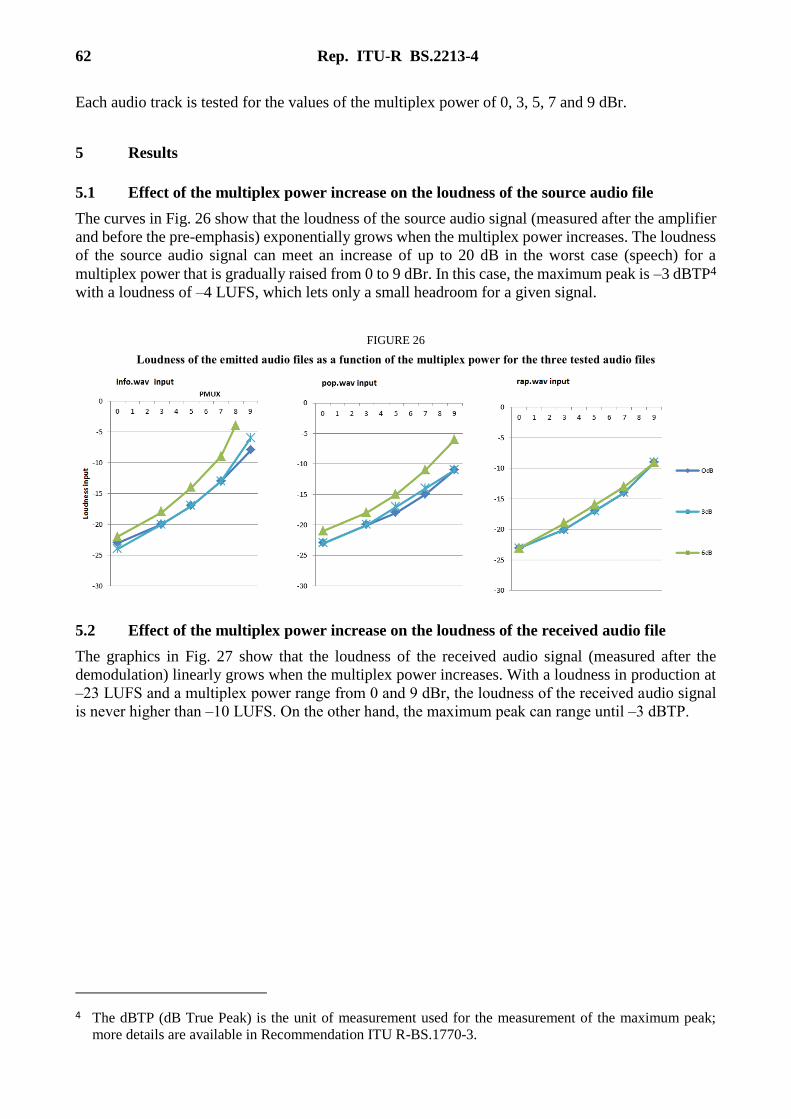
62 Rep. ITU-R BS.2213-4
Each audio track is tested for the values of the multiplex power of 0, 3, 5, 7 and 9 dBr.
5 Results
5.1 Effect of the multiplex power increase on the loudness of the source audio file
The curves in Fig. 26 show that the loudness of the source audio signal (measured after the amplifier
and before the pre-emphasis) exponentially grows when the multiplex power increases. The loudness
of the source audio signal can meet an increase of up to 20 dB in the worst case (speech) for a
multiplex power that is gradually raised from 0 to 9 dBr. In this case, the maximum peak is ‒3 dBTP4
with a loudness of ‒4 LUFS, which lets only a small headroom for a given signal.
FIGURE 26
Loudness of the emitted audio files as a function of the multiplex power for the three tested audio files
5.2 Effect of the multiplex power increase on the loudness of the received audio file
The graphics in Fig. 27 show that the loudness of the received audio signal (measured after the
demodulation) linearly grows when the multiplex power increases. With a loudness in production at
‒23 LUFS and a multiplex power range from 0 and 9 dBr, the loudness of the received audio signal
is never higher than ‒10 LUFS. On the other hand, the maximum peak can range until ‒3 dBTP.
4 The dBTP (dB True Peak) is the unit of measurement used for the measurement of the maximum peak;
more details are available in Recommendation ITU R-BS.1770-3.
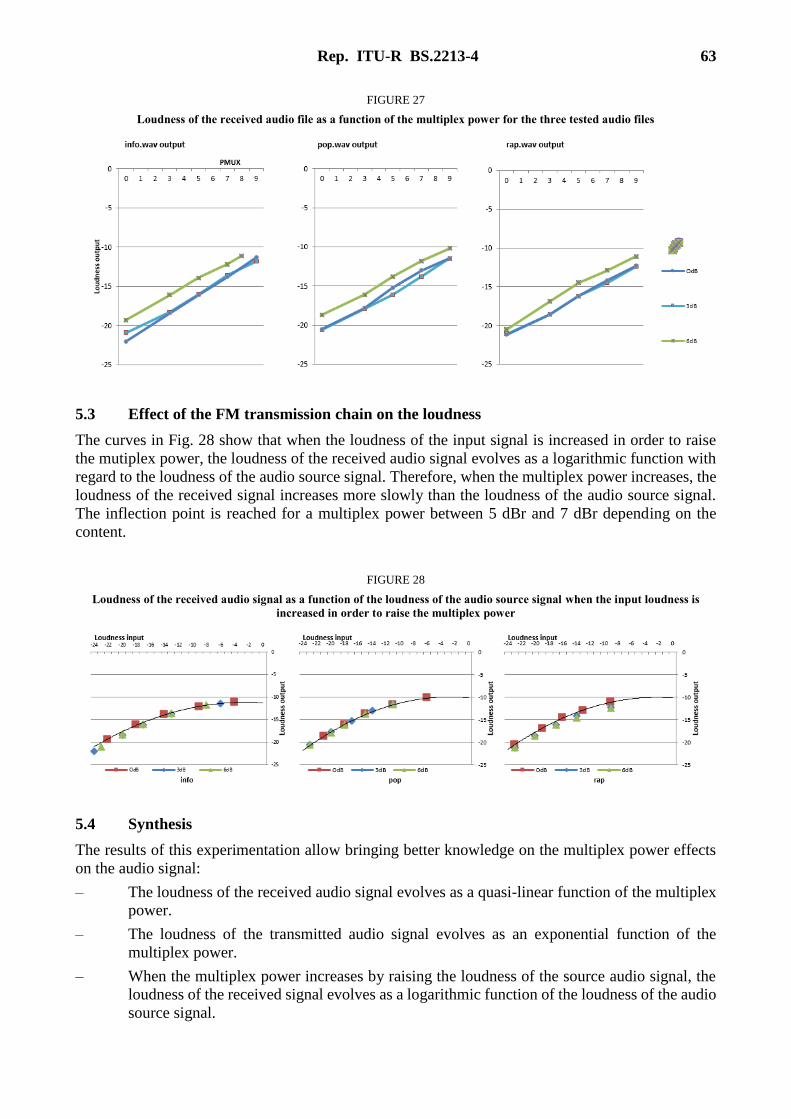
Rep. ITU-R BS.2213-4 63
FIGURE 27
Loudness of the received audio file as a function of the multiplex power for the three tested audio files
5.3 Effect of the FM transmission chain on the loudness
The curves in Fig. 28 show that when the loudness of the input signal is increased in order to raise
the mutiplex power, the loudness of the received audio signal evolves as a logarithmic function with
regard to the loudness of the audio source signal. Therefore, when the multiplex power increases, the
loudness of the received signal increases more slowly than the loudness of the audio source signal.
The inflection point is reached for a multiplex power between 5 dBr and 7 dBr depending on the
content.
FIGURE 28
Loudness of the received audio signal as a function of the loudness of the audio source signal when the input loudness is
increased in order to raise the multiplex power
5.4 Synthesis
The results of this experimentation allow bringing better knowledge on the multiplex power effects
on the audio signal:
– The loudness of the received audio signal evolves as a quasi-linear function of the multiplex
power.
– The loudness of the transmitted audio signal evolves as an exponential function of the
multiplex power.
– When the multiplex power increases by raising the loudness of the source audio signal, the
loudness of the received signal evolves as a logarithmic function of the loudness of the audio
source signal.

64 Rep. ITU-R BS.2213-4
This experimentation has been lead with a modulating monophonic signal. In stereophonic mode, for
each FM radio with a high multiplex power, the spectrum of the resulting FM signal is more spread
out in spite of the control of the frequency deviation (±75 kHz).
6 Conclusions
This experimentation has proved the negative effect of a high multiplex power on the audio quality
of the signal itself. More precisely, it is shown that an increase of the multiplex power higher than
5 dBr causes some raise and degradation of loudness.
To conclude, the results of the experimentation allow:
– to demonstrate the relationship between the multiplex power and the loudness;
– to show an important degradation of the audio signal itself caused by a multiplex power
higher than 5 dBr.
Attachment to Annex 5
Measurements
Database description:
– Sampling frequency: 44.1 kHz
– Resolution: 16 bits
– Duration: 30 s
File Content Integrated
loudness
Max True
Peak
Max
Short-term
Loudness
Max
Momentary
Loudness
info Speech of the type
“information” without dynamic
compression
−23.3 −3.4 −20.4 −16.8
info_3 dB Speech of the type
“information” with 3 dB
dynamic compression
−23.1 −2.9 −21.7 −20.6
info_6 dB
Speech of the type
“information” with 6 dB
dynamic compression
−23.1 −3.5 −22.1 −21.1
rap
Music of type “rap” in two
parts:
– rapper voice
– singer voice
−23.1 −9.5 −21.5 −19.9
rap_3 dB Music of type “rap” with 3 dB
dynamic compression −23.0 −4.1 −22.1 −21.2
rap_6 dB Music of type “rap” with 6 dB
dynamic compression −23.0 −4.4 −22.3 −21.4
pop Music of type “pop” −23.2 −7.3 −21.0 −18.7
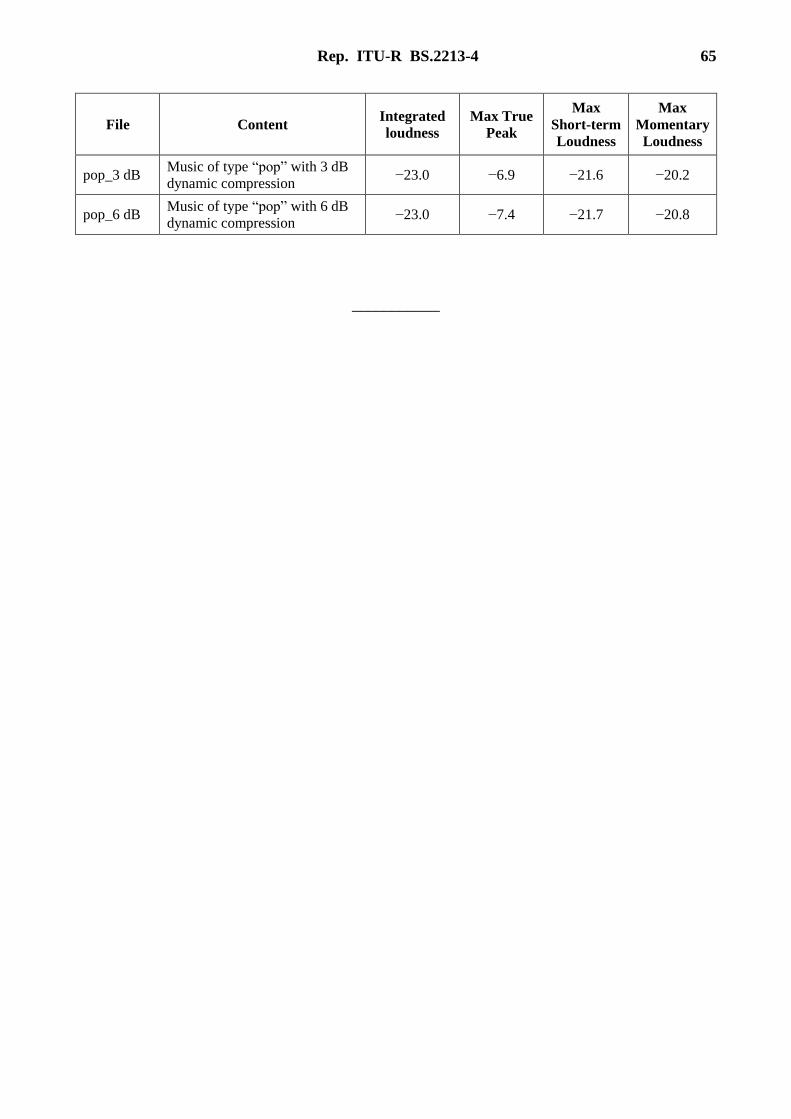
Rep. ITU-R BS.2213-4 65
File Content Integrated
loudness
Max True
Peak
Max
Short-term
Loudness
Max
Momentary
Loudness
pop_3 dB Music of type “pop” with 3 dB
dynamic compression −23.0 −6.9 −21.6 −20.2
pop_6 dB Music of type “pop” with 6 dB
dynamic compression −23.0 −7.4 −21.7 −20.8
___________

![AP1650 3G Audio Broadcasting Terminal PT [호환 모드] 3G based Audio/Voice Broadcasting Terminal Solution • Hardware Architecture for Audio Broadcasting Terminal Service • One(1)](https://img.pdfslide.us/doc/110x75/5f29b47487404c33e72423d2/ap1650-3g-audio-broadcasting-terminal-pt-eeoe-3g-based-audiovoice-broadcasting.jpg)


![Lossless compression of digital audio - HP LabsLossless compression of digital audio - HP Labs ... y > ] >](https://img.pdfslide.us/doc/110x75/5e8ec5c8b729fb6de750814f/lossless-compression-of-digital-audio-hp-labs-lossless-compression-of-digital.jpg)