Embed Size (px)
Citation preview

IMPACT OF ALEXANDRA TOWNSHIP ON THE WATER QUALITY OF THE
JUKSKEI RIVER
Wadzanai Matowanyika
A research report submitted to the Faculty of Science, University of the Witwatersrand,
Johannesburg, in partial fulfillment of the requirements for the degree of Master of Science.
Johannesburg, October 2010

i
DECLARATION
I declare that this research report is my own, unaided work. It is being submitted for the
Degree of Master of Science in Environmental Science in the University of the
Witwatersrand, Johannesburg. It has not been submitted before for any degree or examination
in any other University.
6th day of October 2010

ii
ABSTRACT
Accommodation shortage in Alexandra Township, South Africa, has resulted in the
establishment of informal settlements on any open land including Jukskei River banks. The
closely built dwellings among several other factors have made refuse removal difficult and
sanitation facilities inadequate, hence waste including human excreta is discharged on open
lands or into the Jukskei. These wastes affect the water quality of the Jukskei River. This
study, therefore, determined the changes in water quality as the Jukskei River flowed past
Alexandra. Eleven physical, chemical and microbiological parameters were monitored
between May and December 2009 at four sites in the Jukskei catchment using standard
methods. Water entering Alexandra was only significantly high in turbidity (27.1 ± 4.5 NTU)
while water exiting Alexandra contained significantly high pH (7.7 ± 0.1), nitrate (0.36 ±
0.07 mgN/l) and orthophosphate (0.41 ± 0.17 mgP/l). There was no statistical difference in
Escherichia coli in the water upstream and downstream of Alexandra. The high nitrate-N,
orthophosphate and E. coli downstream of Alexandra were likely to be associated with raw
sewage, domestic and animal waste. Most measured parameters in water exiting Alexandra
were within the acceptable ranges of aquatic ecosystems guidelines. Ammonium-N and
electrical conductivity, however, fell into the bad categories of the aquatic and domestic
guidelines respectively. E. coli concentrations were above the drinking water (0 cfu/ml) and
recreational (<1.3 cfu/ml) guidelines. Turbidity and total suspended solids were significantly
higher in the wet season than in the dry season while orthophosphate, suspended particulate
organic matter, pH and electrical conductivity were higher in the dry season at all sites. The
changing seasons had no significant influence on temperature, nitrate-N and dissolved
oxygen at all the sites. The results suggest that some activities like poor waste disposal in
Alexandra can reduce the water quality of the Jukskei River.

iii
DEDICATION
To my father and mother,
my siblings, Tapiwa, Elliot and Wongayi.
iv
ACKNOWLEDGEMENTS
I would like to express my heartfelt appreciation to my supervisor, Dr D. Drake, for
providing the necessary guidance and aid that ensured the success of this study. I would also
like to thank the Environmental Department of the City of Johannesburg, especially, Mr B.
Mbete for all the assistance they gave me during this project. Thank you to the staff at Royal
Johannesburg and Kensington Golf Club for allowing me to collect water samples from their
premises. I wish to thank Mrs Thelma Booysen for helping in the analysis of my water
samples. Lastly, I wish to thank all my friends and colleagues who assisted me in sample
collection.

v
TABLE OF CONTENTS
CONTENTS PAGE
DECLARATION ................................................................................................................... i
ABSTRACT ......................................................................................................................... ii
DEDICATION ..................................................................................................................... iii
ACKNOWLEDGEMENTS.................................................................................................. iv
TABLE OF CONTENTS ...................................................................................................... v
LIST OF FIGURES ............................................................................................................ vii
LIST OF TABLES ............................................................................................................. viii
ABBREVIATIONS AND ACRONYMS ............................................................................. ix
1. INTRODUCTION ......................................................................................................... 1
1.2 Background of Alexandra Township ............................................................................ 3
1.3 Problem Statement ....................................................................................................... 6
1.4 Aim and Objectives ..................................................................................................... 8
2. WATER QUALITY ....................................................................................................... 9
2.1 Physical Water Quality Variables ............................................................................... 10
2.1.1 Temperature ........................................................................................................ 10
2.1.2 Turbidity, total suspended solids and suspended particulate organic matter .......... 10
2.2 Chemical water quality variables.............................................................................. 11
2.2.1 pH ....................................................................................................................... 11
2.2.2 Dissolved oxygen (DO) ....................................................................................... 11
2.2.3 Electrical conductivity (EC) ................................................................................ 11
2.2.4 Nitrate, ammonium and phosphate....................................................................... 12
2.3 Microbiology ............................................................................................................. 13
2.4 Seasonal Variation in water quality ............................................................................ 14
3. METHODS .................................................................................................................. 15
3.1 Study Area ................................................................................................................. 15
3.2 Sampling Sites and Data Collection ........................................................................... 15
3.2.1 Sampling sites ..................................................................................................... 15
3.2.2 Sample collection ................................................................................................ 18
3.3 Field and Laboratory Analysis of Water Samples ....................................................... 19
3.4 Statistical Analysis..................................................................................................... 20
4. RESULTS .................................................................................................................... 22

vi
4.1 Water Quality at the Four Sampling Sites................................................................... 22
4.1.1 Turbidity ............................................................................................................. 22
4.1.2 Total suspended solids (TSS)............................................................................... 23
4.1.3 Suspended particulate organic matter (SPOM) ..................................................... 24
4.1.4 Temperature ........................................................................................................ 25
4.1.5 pH, electrical conductivity (EC) and dissolved oxygen (DO) ............................... 26
4.1.6 Nitrate-N (NO3- - N) ............................................................................................ 31
4.1.7 Ammonium-N (NH4+
- N) .................................................................................... 33
4.1.8 Orthophosphate (P).............................................................................................. 34
4.1.9 E. coli .................................................................................................................. 36
5. DISCUSSION .............................................................................................................. 37
5.1 Water Quality Changes upstream and Downstream of Alexandra Township .............. 37
5.1.1 Physical quality ................................................................................................... 37
5.1.2 Chemical quality ................................................................................................. 39
5.1.3 Microbial quality ................................................................................................. 43
6. CONCLUSIONS AND RECOMMENDATIONS ........................................................... 45
6.1 Conclusions ............................................................................................................... 45
6.2 Recommendations...................................................................................................... 46
7. APPENDIX ................................................................................................................. 48
8. REFERENCES ............................................................................................................ 51

vii
LIST OF FIGURES
FIGURE PAGE
Figure 1.1: Map showing Alexandra Township and its location relative to Johannesburg ................... 4
Figure 1.2 Dwellings on the bank of Jukskei River and litter that is dumped straight into the river. .... 6
Figure 3.1: Sampling points for the study ........................................................................................ 18
Figure 3.2: Water collection at midstream of the PRE3 sampling site ............................................... 19
Figure 4.1: Mean site turbidity values for the nine months of sampling ........................................... 22
Figure 4.2: Monthly site turbidity time series ................................................................................... 23
Figure 4.3: Mean site total suspended solids values for the nine months of sampling ........................ 23
Figure 4.4: Monthly site total suspended solids time series............................................................... 24
Figure 4.5: Monthly site suspended particulate organic matter time series ........................................ 25
Figure 4.6: Mean site suspended particulate organic matter mg/l for nine months of sampling .......... 25
Figure 4.7: Monthly site temperature time series .............................................................................. 26
Figure 4.8: Mean site pH for nine months of sampling ..................................................................... 27
Figure 4.9: Monthly site pH time series ........................................................................................... 28
Figure 4.10: Monthly site electrical conductivity time series ............................................................ 28
Figure 4.11: Mean site electrical conductivity for nine months of sampling ..................................... 29
Figure 4.12: Mean site % dissolved oxygen saturation for nine months of sampling ......................... 30
Figure 4.13: Mean site dissolved oxygen concentration (mg/l) for nine months of sampling ............. 30
Figure 4.14: Monthly site % dissolved oxygen saturation time series ............................................... 31
Figure 4.15: Monthly site dissolved oxygen concentration (mg/l) time series ................................... 31
Figure 4.16: Mean site nitrate-N concentration for nine months of sampling .................................... 32
Figure 4.17: Monthly site nitrate-N concentration time series ........................................................... 32
Figure 4.18: Mean site ammonium-N concentrations for nine months of sampling ........................... 33
Figure 4.19: Monthly site ammonium-N concentrations time series................................................. 34
Figure 4.20: Mean site phosphate-P for nine months of sampling ..................................................... 35
Figure 4.21: Monthly site phosphate-P time series ........................................................................... 35
Figure 4.22: Mean site E. coli counts for four months of sampling ................................................... 36
Figure 5.1: Maintenance work at PRE3 site ..................................................................................... 38
Figure 5.2: Debris and algae at the PRE1 site ................................................................................... 41

viii
LIST OF TABLES
TABLE PAGE Table 1.1: Water quality history in the Jukskei River downstream of Alexandra Township ................ 2
Table 3.1: Geographic locations of sampling sites in the study ......................................................... 16
Table 4.1: The concentrations for the replicates sampled in August 2009 ........................................ 26

ix
ABBREVIATIONS AND ACRONYMS
C degrees Celsius
ARP Alexandra Renewal Project
cfu colony forming units
COCCOS Co-ordinating Committee for Community Open Space
CoJ City of Johannesburg
DO dissolved oxygen
DWAF Department of Water Affairs and Forestry
DWEA Department of Water and Environmental Affairs
EC electrical conductivity
IWQGKRC In-stream water quality guidelines for Klip River Catchment
km kilometre(s)
km2 square kilometre(s)
m metre(s)
mg/l milligrams per litre
ml millilitre(s)
mm millimetre(s)
mS/m milliSiemens per meter
NTU Nephelometric Turbidity Units
RJK Royal Johannesburg and Kensington
SPOM suspended particulate organic matter
TSS total suspended solids
WHO World Health Organisation
WRC Water Research Commission
α alpha
µg/l micro grams per litre

1
1. INTRODUCTION
The water quality of the Jukskei River in the Gauteng Province of South Africa has
been monitored since 1955 by organizations such as the DWAF, WRC and City of
Johannesburg. Different water quality parameters have been measured at different times
depending on the objectives of the various studies. Most studies indicate that the Jukskei is
polluted to some degree (e.g. Campbell 1996; Huizenga and Harmse 2005; Van Veelen
2002). Huizenga and Harmse (2005) conducted a study to compare the water quality in the
Jukskei River to the Klein Jukskei River which was used as a reference stream. The Klein
Jukskei River emerges from the suburbs west of the Johannesburg whereas Jukskei River’s
source is in the east of Johannesburg. Both rivers flow in a northerly direction and their
confluence is in the north of Johannesburg (Van Veelen 2002). Huizenga and Harmse (2005)
observed that between 1979 and 2002 the Klein Jukskei River had relatively low phosphate
(< 0.02 mg/l) and nitrate (< 3 mg/l) concentrations whereas phosphate concentrations for the
Jukskei River were mainly above 0.5 mg/l and nitrate concentrations were above 3 mg/l
(Table 1.1). In 1996, the average turbidity in the Jukskei River upstream of Alexandra
Township was fivefold higher than that measured downstream of the township (Campbell
1996). High nutrient concentrations in the Jukskei River have been blamed for the
eutrophication of the Hartbeespoort Dam as the Jukskei is a tributary of the dam. Water
quality problems of the Jukskei, especially high bacterial load, are related to urbanization
(Van Veelen 2002). In 2003, the concentration of Escherichia coli in the Jukskei was 300 000
cfu/ ml, more than four orders of magnitude higher than the recommended 1 to 2 cfu/ ml
(DWAF 2003). Surface water quality problems are not unique to Jukskei River, in fact most
South African rivers that flow through informal settlements experience similar problems
(Van Niekerk 2000).

2
Table 1.1: Water quality history in the Jukskei River downstream of Alexandra Township
Parameters
Years Phosphate
(mg/l)
Nitrate
(mg/l)
Ammonium
(mg/l)
Electrical
conductivity
(mS/m)
pH
Turbidity
(NTU)
1994 0.80 5.00 22.50 89.00 8.25 25.00
1995 1.00 7.80 22.00 81.00 8.60 18.00
1996 0.75 7.80 30.00 90.00 8.25 6.00
1997 0.45 7.80 25.00 85.00 8.90 19.00
1998 0.50 5.80 16.30 75.00 8.70 20.00
1999 1.00 3.70 10.00 63.00 8.50 21.00
2006 <0.5 2.48 0.61 52.25 8.05 4.65
2007 <0.5 3.25 0.75 43.75 7.83 4.60
2008 0.55 2.78 1.07 38.93 7.58 10.73
Adapted from Campbell (1996), Van Veelen (2002) and City of Johannesburg (2009)
There are 22 primary drainage regions in South Africa, the largest of which is the
Orange with an annual discharge of 90.7 cubic meters per second (Chakhela 1981). Most
major rivers like the Orange, Crocodile and Oliphants flow through or supply urban areas
with water (Ashton and Haasbroek 2002). They are an important source of water to rural
communities, agriculture, mining, domestic use in towns, wildlife, recreational activities and
they also create habitats for a diverse range of aquatic animals (Davies and Day 1998). In
addition to these services, rivers especially urban rivers, also affect the psychological well-
being of people. In a study conducted by Maas et al. (2006) in Netherlands, it was observed
that urban natural capital such as rivers and parks reduces the stress associated with urban
environments and generates emotional and psychological benefits for people. Furthermore,
urban rivers enhance air quality by releasing moisture and removing dust and pollutants from
the atmosphere (Maas et al. 2006).
Most of the rivers that flow through urban areas are under pressure partly due to the
large and dense human populations that depend on the products and services that these rivers
provide (Ashton and Haasbroek 2002). In 1950, 43.1 % of South Africa’s population lived in
urban areas, in 2005, it increased to 57.9 % and it is anticipated that by 2015 it will be 62.7 %

3
(United Nations Database 2005). The rate of population increase is higher than the number of
formal houses available for people to live in which makes accommodation a problem in the
country’s urban areas. This has resulted in informal settlements developing to meet the
demand for accommodation. According to the Department of Housing, in 1989 Gauteng
contained 412 000 formal houses in the province’s townships, with 422 000 shacks in their
backyards and 635 000 shacks on vacant land. In 2008, 30 % of all urban housing in South
Africa was classified as ―shacks‖ (Population Reference Bureau, 2008). Additionally, of the
11.89 % of South Africa’s population that resides in shacks, 19.94 % of these people are in
Gauteng (Statistics South Africa 2007). Informal settlements lie outside of the formal
planning process and usually lack or have low levels of basic services such as water and
sanitation (Abbott 2002). Overcrowding makes the removal of wastes (garbage collection)
difficult and residents end up creating their own waste dumps. Informal settlements are
frequently formed in the vicinity of rivers and streams, which serve as water supplies
(Hranova et al. 2006). For example, the Klip River is a source of water for Gauteng Province
but informal settlements near Kagiso, Durban Roodepoort Deep and western Soweto are
diffuse sources of pollution to the Klip River (DWAF 1999). In addition, the informal
settlements in the township of Alexandra are potential diffuse source polluters of the Jukskei
River which is a tributary to the Crocodile River. The Crocodile River flows to the eutrophic
Hartbeespoort Dam which provides drinking water to the city of Pretoria (Campbell 1996).
1.2 Background of Alexandra Township
Alexandra Township, located 13 km North East of Central Johannesburg, South
Africa (Figure 1.1), was established as a ―Native Township‖ in 1912 (Vogel 1996). The
Jukskei River flows through the township and informal settlements occur mainly on the
western side of the river (Figure 1.1).

4
Figure 1.1: Map showing Alexandra Township and its location relative to Johannesburg

5
The 800 hectare township saw a large population influx between 1945 and 1948 (de
Jager 1990). During that period, Alexandra was not serviced with any form of basic
infrastructure (de Jager 1990). Population continued to increase in the township and in 1963,
in an effort to upgrade Alexandra, the government legislated that a limit of 35 000 people
were to be housed in single dwelling units (de Jager 1990). As a result, between 1964 and
1973, 56 000 people were forcibly moved to Soweto and about 15 000 to Tembisa (de Jager
1990; Morris 2000). Nevertheless, Alexandra’s population continually increased.
Between the years 1987 and 1990 an ―Urban Renewal Plan‖ was implemented. Full
engineering services, including a water reticulation system, water-borne sewage, electrical
reticulation and on-stand ablution facilities were provided to all dwelling units in Alexandra
(Campbell 1996). The improvements, however, attracted more people.
Alexandra’s population increased from approximately 30 000 in the mid 1920s to an
estimated range of 470 000 to 750 000 in 2001 (Wilson 2002). This was partly due to
depleted economies and wars in neighboring countries which resulted in influx of immigrants
into Johannesburg (de Wet et al. 2001). Furthermore, with the abolition of the influx
legislation in 1986, many people moved from rural to urban areas to seek employment.
Alexandra became a destination, and mass immigration resulted in informal settlements
putting a heavy demand on the township’s infrastructure. Faced with this situation, President
Thabo Mbeki, in 2001 launched the Alexandra Renewal Project (ARP) which aimed to
replace informal settlements with formal government housing (ARP 2001). By May 2008, 1
400 free houses had been built in the Extension 7 area of Alexandra (ARP 2008), but
accommodation is still limited and sanitation standards are still low in Alexandra. People
dwelling on the banks of the Jukskei discard sewage and litter directly into the river.
Overflowing chemical toilets, oil, kitchen waste and detergents are potential sources of
pollution to the Jukskei River.

6
1.3 Problem Statement
The rate of increase of the population in Alexandra has outpaced the availability of
formal accommodation. Thus informal houses (shacks) have been constructed on any open
space including the banks of the Jukskei River (Figure 1.2). Of the estimated 20 000 shacks
in Alexandra, 7 000 are located in backyards. Alexandra’s infrastructure was designed for a
population of about 70 000 (World Bank 2001) but the significant, unplanned population in
Alexandra Township has overloaded the infrastructure such that water pressures are low and
sewers frequently overflow (Dudula 2008). This problem is especially pronounced in Old
Alexandra where sanitation facilities like water provision and sewer coverage are inadequate
(de Wet et al. 2001). Furthermore maintenance is difficult because overcrowding in the area
prevents waste removal and repair of damaged sewer pipes (World Bank 2001). Hence, litter
and waste (raw sewage, wash water, kitchen waste and other domestic wastewater) is either
dumped on free land or straight into the Jukskei River.
Figure 1.2 Dwellings on the bank of Jukskei River and litter that is dumped straight into the river.

7
In the informal areas of the Township, stagnant pools frequently occur alongside
refuse such that during the wet season, refuse is easily washed into the Jukskei River (Figure
A1). Agriculture and construction of shacks on Jukskei’s River banks lead to bank erosion
(Figure A2, Appendix and Figure 1.2), and in the rainy season this eroded matter is washed
down the river. Dwellers of Jukskei’s banks are at the risk of losing their property or even
their lives when the river banks overflow during the rainy season.
Pollution of the Jukskei River is frequently discussed in light of the negative impacts
that it has on the health of informal settlers in Alexandra. But less attention is paid to the
alternative perspective; the possible contribution of pollution that the informal population of
Alexandra Township might have on the ecology of the Jukskei River. After flowing through
Alexandra, Jukskei River flows west of Pretoria to join the Crocodile River, and eventually
into the Hartbeespoort Dam. This dam supplies water to the city of Pretoria and is highly
eutrophied (Dudula 2008). The Jukskei is an example of a water quality deterioration
problem that is becoming more frequent in informal and residential development areas of
South Africa.
In this study, I attempted to quantify the possible effect that informal developments
(especially those on Jukskei River banks) in Alexandra Township have on the physico-
chemical and microbiological water quality of the Jukskei River. Water quality parameters
were examined at three sites high in the catchment of the Jukskei and one site downstream of
Alexandra over a period of nine months. The parameters examined were: temperature, pH,
electrical conductivity (EC), turbidity, total suspended solids (TSS), suspended particulate
organic matter (SPOM), dissolved oxygen (DO), ammonium, nitrate, orthophosphate and
Escherichia coli (E. coli).
8
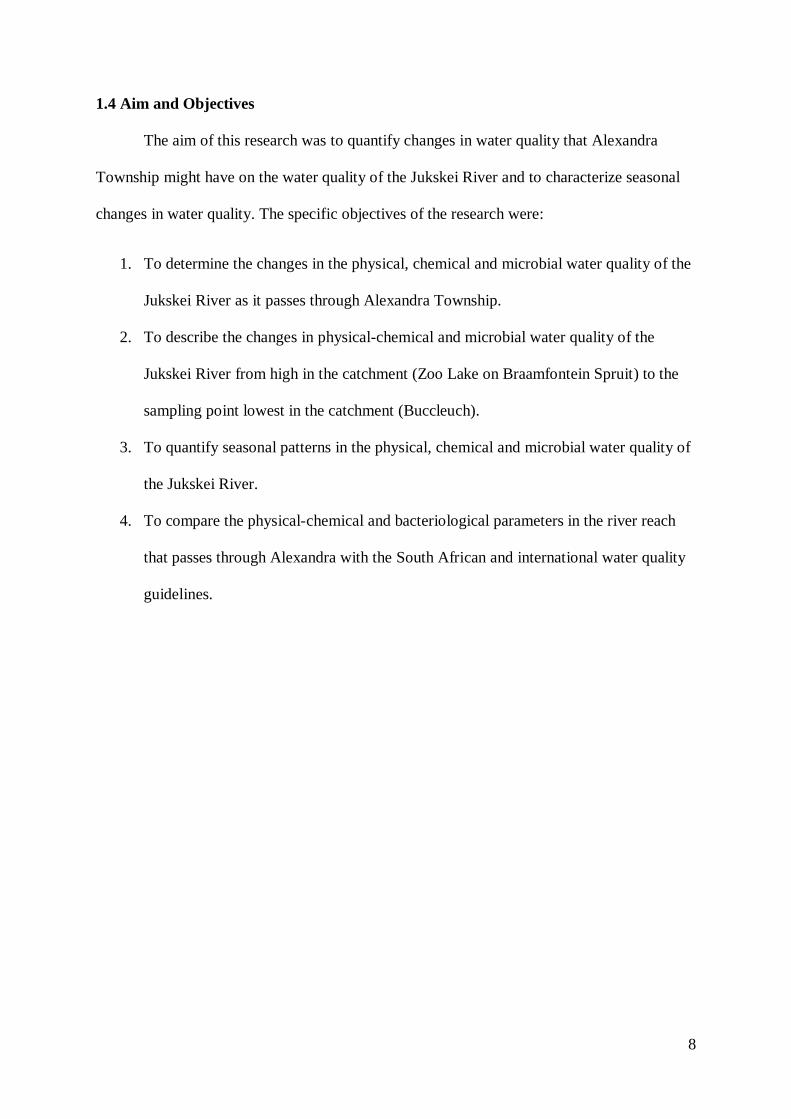
1.4 Aim and Objectives
The aim of this research was to quantify changes in water quality that Alexandra
Township might have on the water quality of the Jukskei River and to characterize seasonal
changes in water quality. The specific objectives of the research were:
1. To determine the changes in the physical, chemical and microbial water quality of the
Jukskei River as it passes through Alexandra Township.
2. To describe the changes in physical-chemical and microbial water quality of the
Jukskei River from high in the catchment (Zoo Lake on Braamfontein Spruit) to the
sampling point lowest in the catchment (Buccleuch).
3. To quantify seasonal patterns in the physical, chemical and microbial water quality of
the Jukskei River.
4. To compare the physical-chemical and bacteriological parameters in the river reach
that passes through Alexandra with the South African and international water quality
guidelines.
9
2. WATER QUALITY
Water quality includes the microbiological, physical, chemical and radiological
properties of water (WRC 1998). Many of these properties are controlled or influenced by
substances which are either dissolved or suspended in water (Palmer et al. 2004). Water
quality affects the biota that live in a river and it also affects the suitability of the water in the
river for uses such as drinking, agriculture or recreation (Skoroszewski 1999). A river is
polluted when it is either directly or indirectly altered due to human activity resulting in the
modification of ecological systems to an extent that harm occurs to the resident aquatic life or
to humans (Lloyd 1992; Ellis 2005).
Pollution can come from point or diffuse sources. Point or ―end of pipe‖ sources are
associated with man-made discharges from industrial activities, municipal wastewater
collection and treatment systems and other activities (Hranova 2006). Diffuse or non-point
sources are associated mainly with land drainage and surface runoff, which enters a water
body by dispersed and poorly defined ways. Diffuse pollution in urban areas is associated
mainly with polluted urban runoff (drainage) contaminated with materials washed off of
streets, roads, roofs, open spaces etc. (Hranova 2006). According to DWEA (2009)
urbanisation in South Africa is associated with increased non-point pollution of rivers.
Organic wastes produced by humans are not very different in composition to natural
products of leachates of plant and animal origin from land surfaces (Lamb 1985). The main
distinction between the two inputs is the much higher concentration of pollutants discharged
by humans living in high density settlements. Dilution here is insufficient to reduce these
concentrations to natural levels, the quality of the receiving water declines and its capacity to
support various uses is impaired (Tchobanoglous and Schroeder 1985). Anthropogenic
alteration of the biological and chemical functions in a river can result in increased primary

10
production, algal blooms and reduced habitat availability. Furthermore, anthropogenic
influences on water systems can cause ecosystem destruction, which results in species and
population extinction (Malmqvist and Rundle 2002).
2.1 Physical Water Quality Variables
2.1.1 Temperature
Climate, structural features and anthropogenic activities of a river catchment area
influence its thermal conditions (Palmer et al. 2004). Increases in water temperature normally
result in decreased oxygen solubility and may also increase the toxicity of certain chemicals,
both of which may result in increased stress in many aquatic organisms (Palmer et al. 2004).
Aquatic organisms like some fishes require specific temperature for spawning and the
development of eggs and young (Petts 1984).
2.1.2 Turbidity, total suspended solids and suspended particulate organic matter
Turbidity and total suspended solids (TSS) are important physical water quality
parameters where turbidity is a measure of water clarity. TSS refers to the suspended
materials in a water column comprising an inorganic fraction (silts and clays) and an organic
fraction SPOM, which includes algae, zooplankton, bacteria, and detritus (McAlister and
Ormsbee 2005). Small particles suspended in water scatter and absorb light, giving the water
a murky or turbid appearance (Lamb 1985). High concentrations of TSS reduce water clarity
and decrease light available to support photosynthesis. TSS in high concentrations has also
been shown to alter predator-prey relationships – e.g. turbid water might make it difficult for
fish to see their prey (Lamb 1895). Increases in turbidity often result from release of domestic
sewage, industrial discharge (including mining, pulp and paper manufacturing) and physical
perturbations such as road use, road and bridge construction (Palmer et al. 2004).

11
2.2 Chemical water quality variables
2.2.1 pH
The concentration of hydrogen (H+) and hydroxyl ions (OH
-) in water give a measure
of pH (Palmer et al. 2004). Most fresh waters are almost neutral, pH of 6-8 (Davies and Day
1998). The type of rocks and minerals in a catchment usually determines the pH of a river
(Lamb 1985). pH is a critical determinant of many biological functions; pH that is too high
or too low may damage an organism by interfering with its metabolic processes (Lamb 1985).
Human-induced acidification of rivers is normally the result of industrial effluents, mine
drainage and acid precipitation.
2.2.2 Dissolved oxygen (DO)
Dissolved oxygen is of fundamental importance in maintaining aquatic life and is
therefore one of the most widely used water quality variables (Tchobanoglous and Schroeder
1985). DO is the amount of gaseous oxygen dissolved in water, which enters surface waters
through reaeration. Oxygen is also released into water as a product of photosynthesis (Selman
2007). Factors causing a decrease in DO (hypoxic conditions) in rivers include elevated
temperature and salinity, respiration of aquatic organisms, decomposition of organic
materials by microorganisms and chemical breakdown of pollutants (Palmer et al. 2004).
Dissolved oxygen concentrations in water should range from 70 to 120 % saturation (Selman
2007). Hypoxic systems, having DO concentrations below 30 %, have detrimental effects on
some aquatic organisms depending on a species sensitivity and stage of development (eggs,
larvae or adult) (DWAF 1996a).
2.2.3 Electrical conductivity (EC)
Another important chemical water quality parameter is EC, the ability of water to
conduct electrical current (Palmer et al. 2004). EC increases as the concentration of ions
(most importantly, calcium, magnesium and bicarbonate) increases (Tchobanoglous and
Schroeder 1985).

12
2.2.4 Nitrate, ammonium and phosphate
Nitrogen (as nitrate or ammonium) and phosphorous (orthophosphate) are essential
nutrients for the growth of aquatic plants and animals (Lamb 1985). For this reason, these
compounds are nutrients or biostimulants when discharged as wastewater to rivers
(Tchobanoglous and Schroeder 1985). On entering rivers, phosphorous is dissolved in the
water column as PO43-
or adsorbed onto soil and other particles (Lamb 1985). High
concentrations of phosphorous occur in waters that receive sewage, leaching or runoff from
cultivated land (Palmer et al. 2004) and also detergents. In South Africa, phosphorous is
seldom present in high concentrations in unimpacted surface waters because it is actively
taken up by plants and thus under natural conditions concentrations between 10 and 50 µg/l
are commonly found (DWAF 1996a).
Nitrogen enters rivers via sewage, municipal and industrial wastewater and runoff
from fertilized agricultural fields (Lamb 1985). Sewage waste is high in nitrogen in the form
of urea and upon entering water bodies; the urea is converted into ammonium (NH4+). NH4
+
is then converted to nitrite (NO2-) through the assimilation of the bacteria Nitrosomonas.
Nitrobacter bacteria convert NO2- to nitrate (NO3
-) and this nitrification process consumes
oxygen thereby decreasing the concentration of dissolved oxygen in the water (Brisbin and
Runka 1995). Nitrate-N and ammonium-N are essential plant nutrients (Skoroszewski 1999).
In well oxygenated waters (80 – 120 % DO), ammonium-N concentrations will be below 0.1
mg/l N (DWAF 1996a). NH4+-N + NO3
--N concentrations less than 0.5 mg/l N are considered
to be sufficiently low that they can limit eutrophication (DWAF 1996a).
Nitrogen and phosphate can stimulate the growth of algae which provide food for
higher organisms (invertebrates and fish). However an excess of nitrogen or phosphorous can
result in the over-production of plankton. When the plankton die and decompose, they

13
consume oxygen in the water leaving other oxygen-dependent organisms stressed (Palmer et
al. 2004).
2.3 Microbiology
Total coliform bacteria concentration is normally used as an indicator of the
microbiological quality of water (Keller 1960). These bacteria are a collection of relatively
harmless microorganisms that live in the intestines of both warm- and cold-blooded animals
(Lamb 1985). A specific subgroup of this collection is the fecal coliform bacteria, the most
common member being Escherichia coli (E. coli) (Tchobanoglous and Schroeder 1985). The
difference between E. coli and other coliforms is that E. coli is found exclusively in the
faeces of warm-blooded animals while other coliforms are naturally found in vegetation, soil,
water and faeces. E. coli in water bodies indicates recent contamination by sewage or animal
waste and it also indicates the presence of disease-causing bacteria, viruses and protozoa
(Health Canada 2006). For these reasons, E. coli is considered to be the species of coliform
bacteria that is the best indicator of human fecal pollution and the possible presence of
pathogens (Keller 1960). Pathogenic organisms in water can be transferred to humans
through water consumption (Diesch, 1970). For example potential diseases that can be
transferred to humans from cattle waste containing pathogens are salmonellosis, anthrax,
tuberculosis, tetanus, colibacilosus etc (Azevedo and Stout 1978).
The presence of E. coli, especially when above 100-200 counts per 100 ml, is an
indicator of a potential health risk for individuals exposed to this water (DWAF 1996c).
According to Dallas and Day (2004), it is possible that South African rivers that pass through
or those close to informal settlements with no waterborne sanitation and meagre water
supplies are severely contaminated by faecal pathogens.

14
2.4 Seasonal Variation in water quality
Surface water quality generally changes with seasons (McAlister and Ormsbee 2005).
Seasonal variations have been reported in water quality parameters such as EC, TSS, pH,
temperature, oxygen and nutrients (Nelson et al. 1996). For example, in a study conducted on
the Long Indian River in Florida, ammonium, nitrite and phosphate concentrations were
significantly higher in the wet season than in the dry season (Doering 1996). Seasonal
variations in precipitation, surface runoff and ground water flow have a strong effect on the
concentration of pollutants in river water (Vega et al. 1998). In South Africa, Highveld cold
dry seasons (May to October) lead to decreased water temperature. TSS, EC and turbidity
tend to be lower during winter periods as there is less rainfall and runoff from a river’s
catchment (Clarke 1993). During the wet season (November to April), increased discharge,
high turbulence and increased aeration in rivers result in high DO concentrations. Rivers also
tend to be more turbid during the rainy season due to increased eroding power (Koning and
Roos 1999).

15
3. METHODS
3.1 Study Area
The Jukskei River is one of the ten river catchments in Metropolitan Johannesburg
(COCCOS 1986) and forms part of the catchment of the Limpopo River which flows into the
Indian Ocean. The river catchment is 800 km2 (Campbell 1996) and its source is situated
upstream of Bruma Lake at the foot of the Witwatersrand area. It flows north through the
Bezuidenhout Valley whereby the river is covered by storm water culverts. It then flows
through several residential areas including the 2.5 km reach through Alexandra. The Jukskei
flows in a northerly direction where it joins the Crocodile River which then flows into the
Hartbeespoort Dam. Three major tributaries that join the Jukskei before it joins the Crocodile
River are the Braamfontein Spruit, Klein Jukskei Spruit and the Modderfontein Spruit. The
Jukskei catchment is located in the Johannesburg Granite Dome and is composed of granitoid
gneisses and migmatites (Anhaeusser 1999 as cited by Dudula 2008).
The Jukskei catchment has a warm and moderate climate. It lies within the summer
rainfall region of South Africa, which is characterised by afternoon thunderstorms. Mean
annual air temperatures range from 10.1 C in June to 20.1 C in January. Average daily
maxima range from 16 C (winter) to 25.6 C (summer). The average annual rainfall is 713
mm. The wettest month is January with an average monthly rainfall of 125 mm. The driest
month is July with an average monthly rainfall of 4 mm (Weather Bureau 1997).
3.2 Sampling Sites and Data Collection
3.2.1 Sampling sites
Sampling was conducted monthly from May to December 2009. This period is
representative of the dry season (May to October) and the wet season (November to
December). Sampling sites were selected on the basis of safety, accessibility and
16
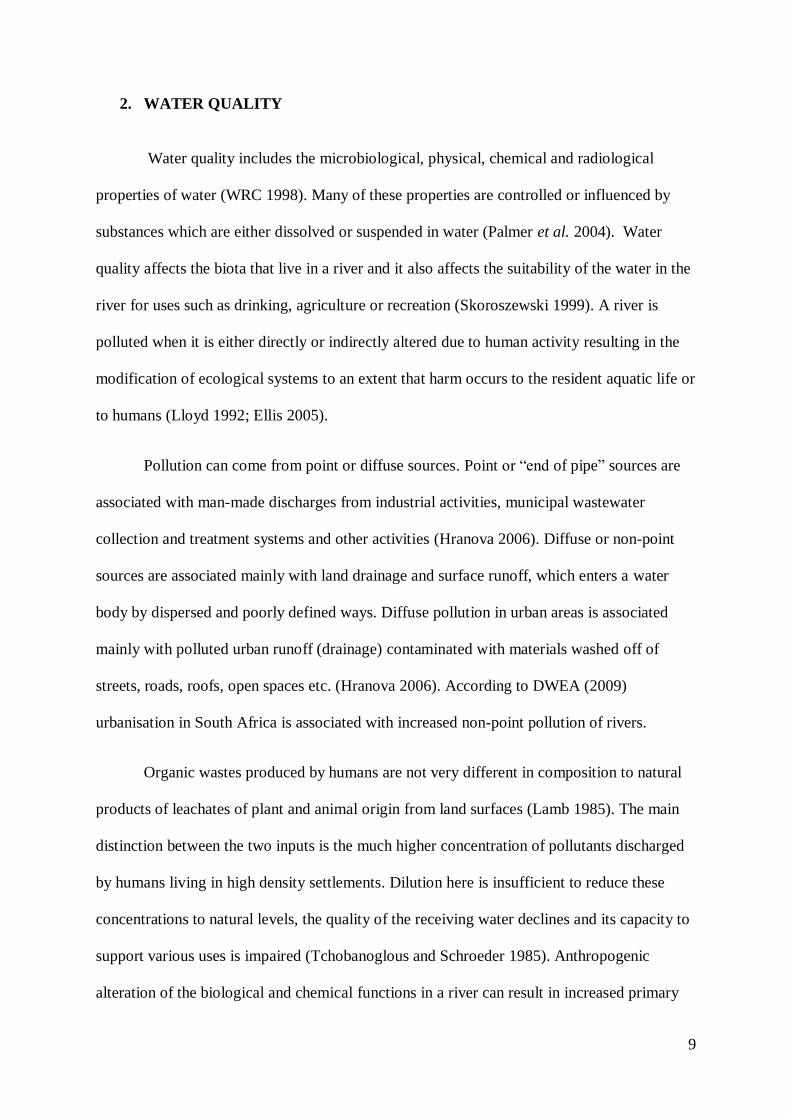
representativeness of the study area. Water was sampled at Zoo Lake (PRE1), Royal
Johannesburg and Kensington Golf Club (PRE2 and PRE3), and Buccleuch Drive (POST)
(Figure 3.1). The sites were named according to their location from Alexandra, therefore the
furthest site relative to Alexandra high in the catchment is PRE1 and the site low in the
catchment is POST. These sites lie between latitudes 263S and latitude 269S, and between
longitudes 281E and 286E (Table 3.1).
Table 3.1: Geographic locations of sampling sites in the study
Sampling site Area sampled GPS co-ordinates
PRE1 Zoo Lake, Parkview 269’35‖E
281’48‖S
PRE2 Royal Johannesburg and Kensington
Golf Club, Linksfield North 269’26‖E
286’7S
PRE3 Royal Johannesburg and Kensington
Golf Club, Linksfield North 269’4‖E
286’28‖S
POST Buccleuch Drive, Buccleuch 263’29‖E
286’13‖S
PRE1 – the sampling site is along the Braamfontein Spruit which is a tributary to the
Jukskei River. The site is uppermost in the catchment in the study area and is
approximately 500 m downstream from Johannesburg Zoo. The Braamfontein Spruit
is not in the Alexandra catchment as its confluence with the Jukskei River is
downstream of the township. Therefore, PRE1 site represents areas high in the
Jukskei catchment.
Royal Johannesburg and Kensington Golf Club (RJKGC) – two sampling sites were
selected within the golf course, both lower in the catchment than PRE1 but higher in
the catchment than Alexandra Township. These two sites are on the Sandringham
Stream which is also a tributary to the Jukskei.

17
As part of the maintenance system at RJKGC, the turf at the course is fertilized in
March and September every year (Malcolm Bromley, Course Manageri). Golf courses
can contribute substantially to pollution of rivers passing through them, due to
frequent fertilizer application and irrigation which washes excess nutrients into runoff
thereby increasing nutrient loads in the rivers (Wilkes University Center for
Environmental Quality 1999). Therefore, water quality was measured at a point where
the river enters the golf course (PRE2) and at about 700 m downstream of PRE2. This
second downstream site (PRE3) was used to determine whether the golf course
changes the chemical quality of Jukskei water before it enters Alexandra
POST – this site is approximately 1.5 km downstream of Alexandra Township. At this
site, the river would have collected runoff and debris from the Township and therefore
comparison of this to the golf course samples would reflect the degree of impact
Alexandra has on the river.

18
Figure 3.1: Sampling points for the study
3.2.2 Sample collection
Two grab samples of water were collected from each site on each date. One litre
acid-washed opaque plastic bottles (Figure A3) were used (Clesceri et al. 1998). Samples for
microbial analysis were collected in sterile whirl pack bags (Figure A4). Samples were
collected from mid-stream (Figure 3.2), to avoid the scouring effects near the river banks
(WRC 1998). After collection, samples were stored in a cooler box on ice and in the dark to

19
maintain a low temperature and limit photosynthesis of phytoplankton and microbes during
transport to the laboratories (Clesceri et al. 1998).
Figure 3.2: Water collection at midstream of the PRE3 sampling site
3.3 Field and Laboratory Analysis of Water Samples
Electrical conductivity, dissolved oxygen, pH and temperature were measured
immediately after sample collection at every site because these properties of water can
change quickly (Tchobanoglous and Schroeder 1985). The following instruments were used:
HANNA H19210N ATC pH Meter, HANNA H19143 Auto Cal Dissolved Oxygen Meter
and HANNA H199300 Conductivity Meter (Figure A5). Temperature was measured using
the DO and EC meters.

20
All the other physical and chemical variables were measured in laboratories at the University
of the Witwatersrand. Turbidity was measured from unfiltered water samples using an
electronic laboratory nephelometer. TSS and SPOM were measured based on the standard
methods from Dallas et al. (1994).
Samples for ammonium, nitrate and phosphate analysis were filtered using a
Whatman glass fibre filter paper and frozen. These were all analysed at once after sampling
was complete using standard methods adapted from Clesceri et al (1998). E. coli was
determined at the M and L Laboratory Services in Johannesburg.
3.4 Statistical Analysis
The parametric one-way analysis of variance (ANOVA) was used for the detection of
differences in water quality among the four sites since nine samples were collected per
parameter at each site throughout the sampling period. Statistica software version 6 (2001)
was used. The level of significance (α) was 0.05 and the P values obtained were referred to
as model Ps in the results section. A model P less than 0.05 indicates that at least two of the
sites differ in parameters from each other. To determine where differences lie between
specific sites, the Tukey Studentized Range was used (α =0.05). Tukey’s test was used
because it is least conservative, that is, chances of missing where the real differences lie are
small. Tukey’s test is more powerful when testing for variance in small numbers of groups
and is appropriate in this case where only four sites were tested for differences in variables
(Maxwell and Delaney 2003). The Kruskal Wallis test was used to detect differences in E.
coli concentrations among the sites as the sample size was small since E. coli was enumerated
for four months only.
The Wilcoxon Mann-Whitney test for two independent samples (Statistica) was used
in determining whether parameters varied with changing seasons (wet and dry). The

21
Wilcoxon Mann-Whitney test was used as the data were from two different populations
(Conover 1971) that is, from the dry and the wet seasons. The significance levels that were
considered in this analysis were α = 0.05 and 0.10.
Microsoft Office Excel software (2007) was used to produce time series graphs.

22
4. RESULTS
4.1 Water Quality at the Four Sampling Sites
4.1.1 Turbidity
Turbidity varied from 5.6 to 50 NTU and differed significantly by site (model P <
0.05) (Figure 4.1). These differences were observed between the PRE2 site (at the upper end
of the Royal Johannesburg and Kensington golf club) and the POST site (downstream of
Alexandra) where turbidity at PRE2 site was significantly higher than at the POST site (P <
0.03). Turbidity at the PRE2 site was approximately two times higher relative to the site
downstream of Alexandra and this pattern was fairly consistent throughout the sampling
period (Figure 4.2). It is surprising that the mean turbidity was much lower downstream of
Alexandra Township (Figure 4.1) where a lot of waste from the township is dumped into the
Jukskei River. Seasonal influences on turbidity were only observed at PRE2 and PRE3 sites
(at the golf club), where values recorded in November and December (wet season) were
highest and this coincided with the onset of the rains (P < 0.05) (Figure 4.2).
Figure 4.1: Mean site turbidity values for the nine months of sampling (n = 9). Model P < 0.05. ±SE
(standard error). Groups a and b are significantly different at P < 0.05; ab and a, and ab and b are not
significantly different. The blue line represents the upper limit for the ideal turbidity of 7-16 NTU for aquatic ecosystems in the Jukskei catchment (Van Veelen 2002).

23
Figure 4.2: Monthly site turbidity time series. PRE1: dry season mean (DS) – 14.43 ± 3.26 NTU, wet
season mean (WS) – 19.50 ± 1.50 NTU; PRE2: DS – 20.80 ± 1.66** NTU, WS – 43.00 ± 7.00 NTU;
PRE3: DS – 18.17 ± 1.70** NTU, WS – 33.50 ± 1.50 NTU; POST: DS – 13.33 ± 3.69 NTU, WS –
11.50 ± 6.50 NTU. **Significant at 5% significance level.
4.1.2 Total suspended solids (TSS)
The TSS concentrations varied from 6.65 to 103.98 mg/l and were not significantly
different among sites (P > 0.05) (Figure 4.3). Dry season (May to October) TSS
concentrations at the PRE3 site (just before the water enters Alexandra Township) were
significantly lower than the wet season concentrations (P < 0.05) (Figure 4.4). There were no
significant seasonal variations at the other three sites (Figure 4.4).
Figure 4.3: Mean site total suspended solids values for the nine months of sampling (n = 9). Model P
> 0.05.The blue line represents the acceptable range of TSS of aquatic environments in the Klip River catchment of 20-30 mg/l (In-stream water quality guidelines for the Klip River catchment
(IWQGKRC) 2003).
0
10
20
30
40
50
60
May June July Aug Sept Oct Nov Dec
Tu
rbid
ity (
NT
U)
Time (months)
PRE1
PRE2
PRE3
POST
Sites

24
Figure 4.4: Monthly site total suspended solids time series. PRE1: DS – 30.69 ± 10.81 mg/l, WS –
27.99 ± 15.89 mg/l; PRE2: DS – 40.22 ± 15.98 mg/l, WS – 55.22 ± 15.50 mg/l; PRE3: DS – 21.41 ± 1.70** mg/l, WS – 40.49 ± 3.55 mg/l; POST: DS – 27.56 ± 5.85 mg/l, WS – 13.74 ± 5.68 mg/l.
**Significant at 5% significance level.
4.1.3 Suspended particulate organic matter (SPOM)
The mean suspended solids were comprised of 57 to 63 % organic matter (4.56-88.28
mg/l) at the four sampling sites. Suspended organic matter content was fairly consistent at all
sites throughout the sampling period except for the high concentrations measured at PRE2 in
June (Figure 4.5). Thus there were no significant differences in organic content in the water
entering and exiting Alexandra (P > 0.05) (Figure 4.6). Water exiting Alexandra (at POST
site) contained significantly lower concentrations of organic matter content in November and
December than during the dry season months (P < 0.10) (Figure 4.5). Seasonal variations in
SPOM were not observed at the other three sampling sites (Figure 4.5).
0
20
40
60
80
100
120
May June July August Sept October Nov Dec
TS
S (
mg/l
)
Time (months)
PRE1
PRE2
PRE3
POST
Sites

25
Figure 4.5: Monthly site suspended particulate organic matter time series. PRE1: DS – 70.63 ± 7.34** mg/l, WS – 41.90 ± 4.20 mg/l; PRE2: DS – 63.54 ± 11.87 mg/l, WS – 53.65 ± 5.25 mg/l; PRE3: DS –
65.73 ± 6.47*mg/l, WS – 33.35 ± 7.75 mg/l; POST: DS – 67.00 ± 10.17 mg/l, WS – 50.70 ± 6.90
mg/l. **Significant at 5% significance level. *Significant at 10% significance level.
Figure 4.6: Mean site suspended particulate organic matter mg/l for nine months of sampling (n = 9).
Model P > 0.05.
4.1.4 Temperature
Water temperature ranged from 8.3 to 27.9 C and was not significantly different
among the four sampling sites (P > 0.05) (Figure 4.7) although temperature was measured at
different times of day. There were also no significant seasonal temperature variations at all
the sites (P > 0.10) (Figure 4.7).
0102030405060708090
100
May June July Aug Sept Oct Nov Dec
SP
OM
(m
g/l
)
Time (months)
PRE1
PRE2
PRE3
POST
Sites

26
Figure 4.7: Monthly site temperature time series. PRE1: DS – 14.0 ± 2.0 C, WS – 19.5 ± 1.8 C;
PRE2: DS – 18.0 ± 2.5 C, WS – 22.2 ± 3.2 C; PRE3: DS – 17.8 ± 2.1 C, WS – 21.8 ± 3.3 C;
POST: DS – 19.9 ± 2.2 C, WS – 23.1 ± 4.4 C.
4.1.5 pH, electrical conductivity (EC) and dissolved oxygen (DO)
Replicate samples from August for pH, EC and DO at the PRE3 and POST sites were
collected from the streams at one minute intervals. This was done to detect variations in
readings over short time periods and to determine how consistent instruments were. The
parameters for the five replicates at both sites were fairly constant (Table 4.1).
Table 4.1: The concentrations for the replicates sampled in August 2009
Site Replicate Parameters
pH Electrical
conductivity
(mS/m)
Dissolved
oxygen (%
saturation)
PRE3 1 8.4 410 66
2 8.5 421 62
3 8.6 421 61
4 8.6 422 63
5 8.4 421 70
POST 1 8.9 497 74
2 9.0 513 74
3 8.9 514 77
4 8.9 515 77
5 8.9 519 65
0
5
10
15
20
25
30
May June July August Sept October Nov Dec
Tem
per
atu
re (
°C)
Time (months)
PRE1
PRE2
PRE3
POST
Sites

27
Variations in pH among the sites were observed (model P < 0.05). The mean pH of
the water exiting Alexandra (8.3 ± 0.1) was significantly higher than that at the PRE1 site
(highest site in the Jukskei catchment, mean = 7.7 ± 0.1; P < 0.05) (Figure 4.8). There were
no other significant differences observed between the sites (Figure 4.8). The pH values for
water sampled in November and December at the PRE1 and PRE2 sites were significantly
lower than pH for the dry season months (P < 0.10) (Figure 4.9). There were no other
seasonal variations observed at the other two sites (Figure 4.9).
Figure 4.8: Mean site pH for nine months of sampling (n = 9). Model P < 0.05. Groups a and b are
different.
28
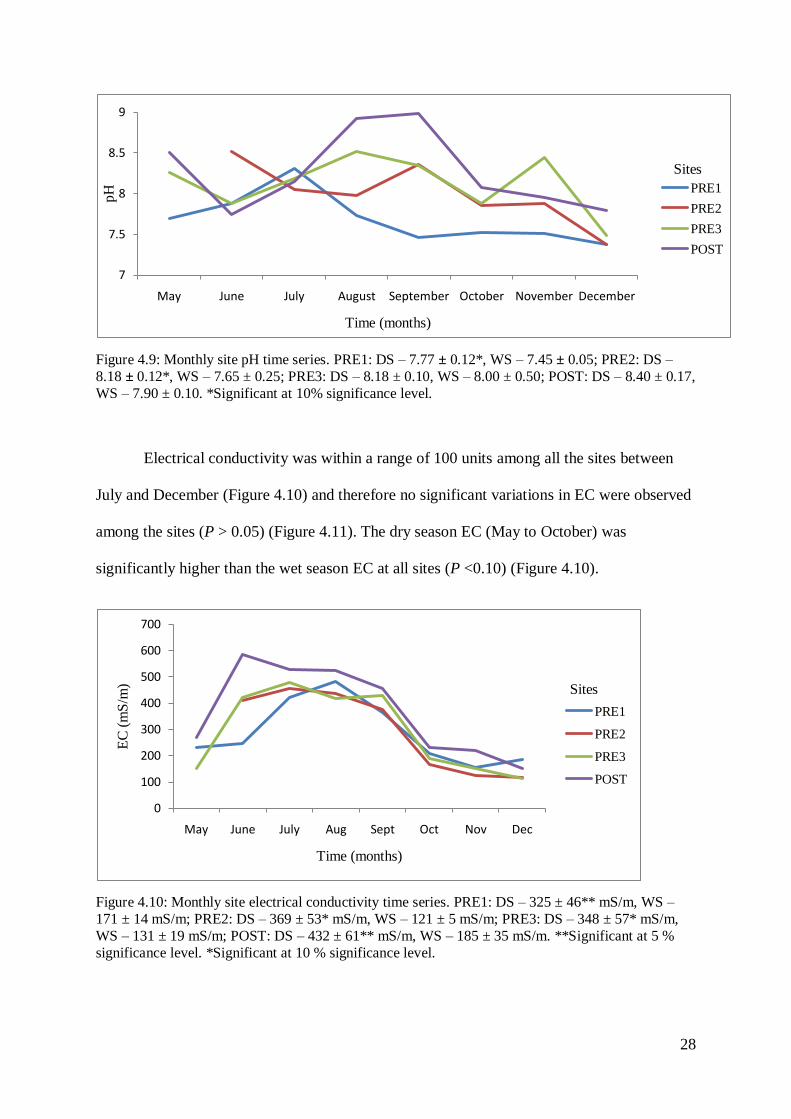
Figure 4.9: Monthly site pH time series. PRE1: DS – 7.77 ± 0.12*, WS – 7.45 ± 0.05; PRE2: DS –
8.18 ± 0.12*, WS – 7.65 ± 0.25; PRE3: DS – 8.18 ± 0.10, WS – 8.00 ± 0.50; POST: DS – 8.40 ± 0.17,
WS – 7.90 ± 0.10. *Significant at 10% significance level.
Electrical conductivity was within a range of 100 units among all the sites between
July and December (Figure 4.10) and therefore no significant variations in EC were observed
among the sites (P > 0.05) (Figure 4.11). The dry season EC (May to October) was
significantly higher than the wet season EC at all sites (P <0.10) (Figure 4.10).
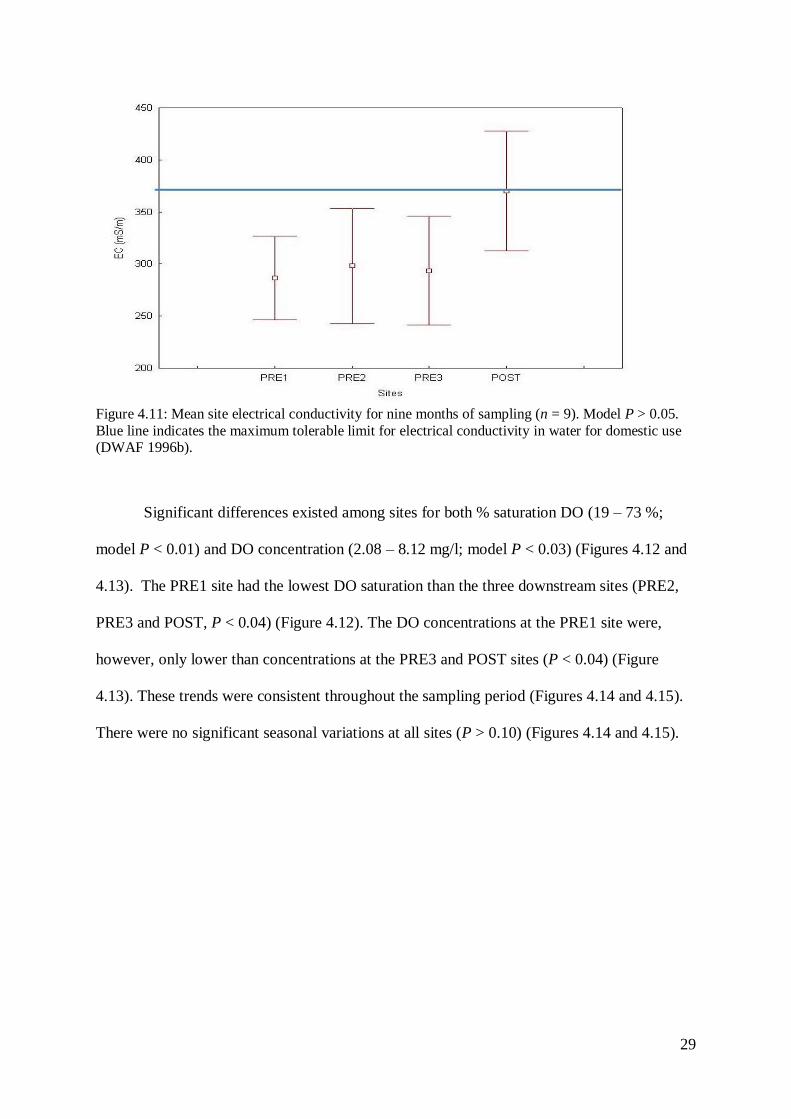
Figure 4.10: Monthly site electrical conductivity time series. PRE1: DS – 325 ± 46** mS/m, WS –
171 ± 14 mS/m; PRE2: DS – 369 ± 53* mS/m, WS – 121 ± 5 mS/m; PRE3: DS – 348 ± 57* mS/m,
WS – 131 ± 19 mS/m; POST: DS – 432 ± 61** mS/m, WS – 185 ± 35 mS/m. **Significant at 5 %
significance level. *Significant at 10 % significance level.
7
7.5
8
8.5
9
May June July August September October November December
pH
Time (months)
PRE1
PRE2
PRE3
POST
Sites
0
100
200
300
400
500
600
700
May June July Aug Sept Oct Nov Dec
EC
(m
S/m
)
Time (months)
PRE1
PRE2
PRE3
POST
Sites
29
Figure 4.11: Mean site electrical conductivity for nine months of sampling (n = 9). Model P > 0.05.
Blue line indicates the maximum tolerable limit for electrical conductivity in water for domestic use (DWAF 1996b).
Significant differences existed among sites for both % saturation DO (19 – 73 %;
model P < 0.01) and DO concentration (2.08 – 8.12 mg/l; model P < 0.03) (Figures 4.12 and
4.13). The PRE1 site had the lowest DO saturation than the three downstream sites (PRE2,
PRE3 and POST, P < 0.04) (Figure 4.12). The DO concentrations at the PRE1 site were,
however, only lower than concentrations at the PRE3 and POST sites (P < 0.04) (Figure
4.13). These trends were consistent throughout the sampling period (Figures 4.14 and 4.15).
There were no significant seasonal variations at all sites (P > 0.10) (Figures 4.14 and 4.15).

30
Figure 4.12: Mean site % dissolved oxygen saturation for nine months of sampling (n = 9). Model P
<0.01. Groups a and b are different.
Figure 4.13: Mean site dissolved oxygen concentration (mg/l) for nine months of sampling (n = 9).
Model P < 0.03. Groups a and b are different.

31
Figure 4.14: Monthly site % dissolved oxygen saturation time series. PRE1: DS – 29.00 ± 2.27 %,
WS – 35.50 ± 16.50 %; PRE2: DS – 46.60 ± 3.11 %, WS – 54.00 ± 12.00 %; PRE3: DS – 52.30 ±
3.73 %, WS – 53.00 ± 10.00 %; POST: DS – 55.00 ± 6.23 %, WS – 59.00%.
Figure 4.15: Monthly site dissolved oxygen concentration (mg/l) time series. PRE1: DS – 3.38 ± 0.35 mg/l, WS – 3.79 ± 1.82 mg/l; PRE2: DS – 5.11 ± 0.47 mg/l, WS – 5.48 ± 1.52 mg/l; PRE3: DS – 5.80
± 0.60 mg/l, WS – 5.36 ± 1.32 mg/l; POST: DS – 5.69 ± 0.79 mg/l, WS – 5.72 ± 0.37 mg/l.
4.1.6 Nitrate-N (NO3- - N)
Nitrate-N concentrations ranged from < 0.05 to 2.2 mg NO3- - N /l among the sites
and significant differences were observed (P < 0.01) (Figure 4.16). Nitrate-N concentrations
were at least double (1.4 - 2.2 mg NO3- - N /l) in water exiting Alexandra than concentrations
measured in the water upstream of the township (P < 0.01) (Figures 4.16 and 4.17). The
lowest NO3- - N concentrations were measured in the water at the golf club (PRE1 and PRE2
0
10
20
30
40
50
60
70
80
May June July Aug Sept Oct Nov Dec
DO
(%
)
Time (months)
PRE1
PRE2
PRE3
POST
Sites
0
1
2
3
4
5
6
7
8
9
May June July Aug Sept Oct Nov Dec
DO
(m
g/l
)
Time (months)
PRE1
PRE2
PRE3
POST
Sites

32
sites) and these were also significantly lower than concentrations in the water at the PRE1
site (P < 0.03). This pattern was consistent throughout the sampling period (Figures 4.16 and
4.17). There were no significant differences in NO3- - N between the golf club sites (P > 0.05)
(Figure 4.16). The changing seasons had no influence on the NO3- - N concentrations at all
the sites (Figure 4.17).
Figure 4.16: Mean site nitrate-N concentration for nine months of sampling (n = 9). Model P < 0.01.
Groups a, b and c are different. Groups a and b are different.
Figure 4.17: Monthly site nitrate-N concentration time series. PRE1: DS – 0.41 ± 0.07 mg NO3- - N /l,
WS – 0.22 ± 0.17 mg NO3- - N /l; PRE2: DS – 0.09 ± 0.02 mg NO3
- - N /l, WS – 0.05 mg NO3
- - N /l;
PRE3: DS – 0.07 ± 0.02 mg NO3- - N /l, WS – 0.08 ± 0.03 mg NO3
- - N /l; POST: DS – 1.67 ± 0.13
mg NO3- - N /l, WS – 1.65 ± 0.25 mg NO3
- - N /l.
0
0.5
1
1.5
2
2.5
May June July Aug Sept Oct Nov Dec
Nit
rate
-N
(m
g/l
)
Time (months)
PRE1
PRE2
PRE3
POST
Sites

33
4.1.7 Ammonium-N (NH4+
- N)
Differences in NH4+
- N were observed high in the catchment before the water entered
Alexandra. Here, NH4+
- N concentrations at the PRE1 site were higher (mean: 5.17 ± 2.13
mg NH4+
- N /l) than concentrations at the golf club sites (mean: 0.09 ± 0.04 mg NH4+
- N /l)
and this pattern was consistent throughout the sampling period (P < 0.03) (Figures 4.18 and
4.19). There were no significant differences in nitrate concentrations between the PRE1 and
POST sites (Figure 4.18). The onset of the wet season resulted in NH4+
- N concentrations
becoming significantly lower than those recorded for the dry season only in the water exiting
Alexandra Township (P > 0.10) (Figure 4.19).
Figure 4.18: Mean site ammonium-N concentrations for nine months of sampling (n = 9). Model P <
0.01. Groups a and b are different.

34
Figure 4.19: Monthly site ammonium-N concentrations time series. PRE1: DS – 6.73 ± 2.55 mg
NH4+
- N /l, WS – 0.49 ± 0.09 mg NH4+
- N /l; PRE2: DS – 0.14 ± 0.05 mg NH4+
- N /l, WS – 0.05
mg NH4+
- N /l; PRE3: DS – 0.10 ± 0.03 mg NH4+
- N /l, WS – 0.08 ± 0.01 mg NH4+
- N /l; POST:
DS – 4.00 ± 0.89* m NH4+
- N g/l, WS – 1.55 ± 0.35 mg NH4+
- N /l. *Significant at 10 %
significance level. The black line depicts the maximum tolerable limit of ammonium concentrations
for aquatic ecosystems in the Klip River catchment (IWQGKRC 2003).
4.1.8 Orthophosphate (P)
The orthophosphate concentrations among the four sampling sites differed
significantly and ranged from less than 0.05 to 0.83 mgP/l (model P < 0.01) (Figures 4.20
and 4.21). The differences were only observed between the golf club sites (PRE2 and PRE3)
and the PRE1 and POST sites (Figure 4.20). The mean orthophosphate concentrations at the
PRE1 and POST sites (0.41 ± 0.17 mgP/l and 0.46 ± 0.07 mgP/l respectively) were higher
than the concentrations at the PRE2 and PRE3 sites (0.05 mgP/l at both sites) (P < 0.03). It is
important here to note that orthophosphate concentrations increased the Jukskei River flowed
past Alexandra Township (Figure 4.20). The wet season orthophosphate concentrations at the
PRE1 and POST sites were significantly lower than the dry season concentrations (P < 0.05)
(Figure 4.21). No significant seasonal variations were observed at the golf club sites (Figure
4.21).

35
Figure 4.20: Mean site phosphate-P for nine months of sampling (n = 9). Model P < 0.01. Groups a and b are different.
Figure 4.21: Monthly site phosphate-P time series. PRE1: DS – 0.58 ± 0.11** mgP/l, WS – 0.07 ±
0.01 mgP/l; PRE2: DS – 0.05 mgP/l, WS – 0.05 mgP/l; PRE3: DS – 0.05 mgP/l, WS – 0.05 mgP/l;
POST: DS – 0.54 ± 0.07 mgP/l, WS – 0.22 ± 0.06 mgP/l. **Significant at 5 % significant level. The black line represents the upper limit for the acceptable range for phosphate in the Jukskei River
catchment (City of Johannesburg, 2009).

36
4.1.9 E. coli
E. coli counts downstream of Alexandra were at least two orders of magnitude higher
than those measured at the other three upstream sites. Despite these high counts, there were
no statistical significant differences in the E. coli concentrations in the water both upstream
and downstream of Alexandra even after the data were logarithmically transformed (Figure
4.22).
Figure 4.22: Mean site E. coli counts for four months of sampling (n = 4). Model P > 0.05.

37
5. DISCUSSION
5.1 Water Quality Changes upstream and Downstream of Alexandra Township
The Zoo Lake site (PRE1) on the Braamfontein Spruit is not in the same catchment as the
golf course sampling sites as the confluence of the Spruit and Jukskei River is more than 5
km downstream of Alexandra. The site, however, is representative of high catchment areas in
the Jukskei catchment.
5.1.1 Physical quality
Release of domestic sewage into rivers can increase turbidity levels and TSS
concentrations in a river (Boulton and Brock 1999). It was strange, however, that despite the
release of raw sewage into the Jukskei River from Alexandra Township, turbidity levels
downstream of the township were lower than those recorded in the water entering the
township. The PRE1 site receives water that is treated 100 % from Johannesburg Zoo,
however, turbidity levels at the site were slightly higher than the ones measured downstream
of Alexandra.
Turbidity normally increases in the rainy season for most South African rivers
(Chutter 1969) and this might be one of the reasons for the increased turbidity levels in the
wet season at the RJK golf course sites. Anthropogenic activities like road and bridge
construction can result in increased levels of turbidity (Ogbeibu and Victor 1989). This could
have caused the high turbidity and TSS levels at the golf club sites in the wet season since
bridge maintenance was taking place there (Figure 5.1). The turbidity levels for most of the
sampling period at all sampling sites were below the maximum tolerable limit of 35 NTU for
the Jukskei catchment (Van Veelen 2002) except the wet season levels (36-50 NTU) at the
PRE2 site which were above the tolerable limit. The mean and wet season TSS
concentrations at the PRE2 site were above the Klip River catchment acceptable range of 20

38
to 30 mg/l (IWQGKRC 2003). High turbidity levels reduce light penetration leading to a
decrease in the rate of photosynthesis and therefore primary production in a river (Dallas and
Day 2004).
Figure 5.1: Maintenance work at PRE3 site
Cattle grazing and domestic sewage are among the major human sources of SPOM
(Hellawell 1986). Organic matter from these sources requires oxygen for decomposition and
often depletes oxygen upon entering surface waters thereby decreasing DO concentrations in
that system. Other effects of high SPOM levels are an increase in turbidity levels, TSS and
nitrate concentrations, and possible bacterial contamination (Dallas and Day 2004). High
SPOM levels at the PRE2 site could have resulted in the high TSS and turbidity levels
recorded at the site.

39
The temperature recorded at all the sampling sites during the sampling period was
within the range for aquatic ecosystems in the Jukskei catchment of 11.9 to 29.9 C (Van
Veelen 2002).
5.1.2 Chemical quality
Changes in pH influence the availability and toxicity of important plant nutrients such
as phosphate and ammonium. For example, pH values > 8.0 cause ammonium ions to be
converted to toxic unionized ammonia (DWAF 1996a; Horne and Goldman 1995). Most
southern African surface waters are neutral or alkaline (pH 7.0 to 8.0) (Skelton 2001). The
pH for all the sampling sites in the study were alkaline (7.4-9.0) for the whole sampling
period and most were within the Jukskei catchment aquatic ecosystems ―ideal range‖ of 6.5
to 8.5 (CoJ 2009). Campbell (1996) also measured pH of 7.0 – 8.0 in the Jukskei River. The
significantly high dry season mean pH at PRE1 and PRE2 could have been a result of low
flow although flow rate was not measured in this study. Skoroszeweski (1999) observed that
pH was significantly higher in the dry season when there was low flow than during the wet
season on the main rivers of the Lesotho Highlands Water Project. During the wet season,
decaying matter from the ground is washed down by rain into rivers. Decomposing matter
produces carbonic acid which can lower the pH in a river (Hem 1985). This could have been
the reason for the significantly lower pH in the wet season at the PRE1 and PRE2 sites. The
seasonality in pH at these two sites could also have been due to rain. Rainfall that is not
affected by pollution has pH varying from 4.3 to 6.0 (Mphepya et al. 2004) and it lowers pH
upon entering rivers (Hem 1985).
The mean EC levels in water upstream of Alexandra (Figure 4.4) was within the
―tolerable‖ category of the DWAF domestic use water quality guidelines of 150 to 370 mS/m
(DWAF 1996b) while the mean EC levels downstream of the township were in the ―bad‖
category (>370 mS/m) of the domestic guidelines. High EC levels in a water body indicate

40
high ion concentrations. According to DWAF (1996b), EC >370 mS/m gives water an
extreme salty taste. Consumption of water containing high EC can have adverse effects on
patients with heart problems as well as high blood pressure (DWAF 1998). High EC can also
impact on the biochemical reaction system, blood circulation and the nerve conduction
system of the human body (Virkutye and Sillanpaa 2006).
It was expected that DO concentrations would be lowest at PRE1 and highest at the
POST site. This is because samples were first collected at the PRE1 site in the morning and
last at the POST site in the afternoon. Dissolved oxygen concentrations in rivers vary
throughout the day due to photosynthesis and respiration processes of aquatic biota. There is
minimum DO concentrations at night and near dawn, maximum concentrations normally
occur by mid afternoon (DWAF 1996a). Decaying debris at the PRE1 site (Figure 5.2) could
have also caused the low DO concentrations measured at the site. The presence of oxidizable
organic matter can lead to reduction in the concentration of DO in surface waters due to
oxygen depletion by aerobic decomposition of organic waste by microorganisms (Dallas and
Day 2004).
The DO concentrations at all the sites were below DWAF’s aquatic ecosystems target
water quality range of 80 to 120 %. Concentrations of DO less than 100 % of saturation
indicate that DO has been depleted from the theoretical equilibrium concentration (DWAF
1996a) and can be indicative of contamination of water by solid waste (Mvungi et al. 2003)
although this can occur naturally. Continuous exposures of less than 80 % saturation of DO
can be harmful leading to conditions such as physiological and behavioural stress of aquatic
organisms (DWAF 1996a). Insufficient oxygen may result in tissue damage, bleeding, and
extreme loss of blood from, the gills, liver, kidneys and spleen of exposed fish (Drewett and
Abel 1983).

41
Figure 5.2: Debris and algae at the PRE1 site
Water entering Alexandra Township had nitrate-N and ammonium-N concentrations
of <0.20 mg N/l throughout the sampling period, even in September when foliar fertilisers
were applied to the turf at the RJK golf club. Foliar fertilizers are more efficiently taken up
by plants than those applied to soils (Ling and Silberbush 2002) and thus theoretically small
concentrations are washed down to water bodies. Natural levels of ammonium in surface
water are usually less than 0.20 mg/l (WHO 1993), which makes the water at PRE2 and
PRE3 ideal for aquatic ecosystems.
Water exiting Alexandra contained nitrate-N and ammonium-N concentrations of
>1.50 mg nitrate-N/l and >3.00 mg ammonium-N/l. These high concentrations could have
resulted from raw sewage and animal waste which were washed down or dumped into the
Jukskei from the township as sewage contains high concentrations of ammonium (DWAF
1996a). Animal waste probably from Johannesburg Zoo and at Zoo Lake could have caused

42
the high ammonium-N concentrations in the water at the PRE1 site. It is most important to
note that ammonium concentrations at the PRE1 site peaked in August while one of the
lowest concentrations at the POST site were recorded in that month (Figure 4.19). The peak
at the PRE1 site might have resulted from an overflow from a burst sewer pipe near the site.
The high nitrate-N and ammonium-N concentrations downstream of Alexandra could
also have been attributable to the application of commercial fertilizers to the crops cultivated
in the township. Ammonium in rivers is converted to nitrate under aerobic conditions
(Brisbin and Runka 1995). The fertilisers contain highly soluble ammonium salts (DWAF
1996a). These fertilizers could have been washed or leached into Jukskei River thereby
contributing to the high ammonium and nitrate concentrations in the water exiting Alexandra.
The high ammonium-N concentrations recorded at the PRE1 and POST sites (0.28-
15.00 mgN/l and 1.20-7.40 mgN/l respectively) were too high for many fresh water
organisms as concentrations ranging from 0.53 to 22.8 mg/l are toxic (McAlister and
Ormsbee 2005). Nitrate concentrations at all the sites were below the maximum limit for the
acceptable concentrations for the Jukskei catchment of <6 mgN/l (CoJ 2009).
Water exiting Alexandra contained higher orthophosphate concentrations than water
entering it. High concentrations of phosphate are likely to occur in waters that receive raw or
treated sewage (Dallas and Day 2004). This might have been the case at the PRE1 and POST
sites as orthophosphate concentrations at these sites were higher than the ones at the golf
course sites (Figure 4.21). The wet season concentrations of orthophosphate at the POST and
PRE1 sites (0.06 to 0.28 mgP/l) indicate P enrichment as this condition occurs when
phosphate concentrations in a river exceed 0.025 mg/l in the summer season (DWAF 1996a).
Concentrations for PRE2 and PRE3 were within the ―ideal‖ category (<0.2 mg/l) for aquatic

43
ecosystems of the Jukskei catchment while those for the PRE1 and POST sites fell in the
―bad‖ category of >4.00 mgP/l (CoJ 2009) for most of the sampling period (see Figure 4.21).
High nutrient concentrations at the PRE1 site were probably due to Zoo effluent and
decomposing matter at the site (Figure 5.2) which results in the depletion of oxygen in water
and may explain the low DO concentrations at the site. Phosphorous and nitrogen
concentrations higher than threshold values can cause proliferation of primary producers and
eutrophication thereby decreasing DO concentrations and increasing pH in a water body
(Dodds and Welch 2000). This may inhibit the growth and survival of macroinvertebrates and
fish (Dallas and Day 2004). About six fish species have been identified in the Jukskei River,
yet under natural conditions seventeen indigenous species are expected to occur in the river
(Van Veelen 2002). The high nutrient concentrations in the water exiting Alexandra could be
contributing to the death or migration of macroinvertebrates to healthier sections of the river.
In general, the water exiting Alexandra has poor quality with regards to nutrients such as
nitrate-N and orthophosphate whose concentrations were too high for average surface water.
5.1.3 Microbial quality
E. coli concentrations varied substantially between sites and over the seasons from 1
to 100 000 cfu/ml. E. coli concentrations at all the sites were above WHO (2008) drinking
water guidelines (0 cfu/ml) and DWAF (1996c) ideal recreation guidelines (<1.3 cfu/ml). The
E. coli concentrations found downstream of Alexandra (at the POST site) could have resulted
from raw sewage entering Jukskei from the township and possibly animal waste was entering
the river as there are a number of backyard poultry projects in the township.
High nutrient and E. coli concentrations are associated with improper human and
animal excreta and other domestic waste disposal which results in waste entering rivers
(Mvungi et al. 2003; Dallas and Day 2004). Despite the provision of 1 200 chemical toilets,
600 septic tanks and 72 000 individual property connections to the sewage system in

44
Alexandra (Makungo 2006), nutrient and E. coli concentrations downstream of the township
still remain high (31-100 000 cfu/ml). In an interview study conducted by Makungo (2006),
residents do not use facilities like chemical toilets during the night as it risky for them due to
the high crime rate in the area. Therefore they resort to using bucket latrines which they
empty in the Jukskei River or in the drainage system. Apart from this, the chemical toilets
supplied to the informal settlements are costly to service and some of these end up
overflowing (Makungo 2006).

45
6. CONCLUSIONS AND RECOMMENDATIONS
6.1 Conclusions
Temperature, pH, nitrate-N and orthophosphate were significantly higher in river
water exiting Alexandra than in the water entering the township. E. coli concentrations at all
the sites were not statistically different. The significantly high parameters measured in the
water downstream of Alexandra could be a result of improper waste disposal in the township
particularly in the informal settlements. This is a clear indication that the activities carried out
in the informal settlements have detrimental significant impacts on the river’s water quality.
It was surprising though that turbidity levels, TSS and SPOM concentrations in the water
entering Alexandra were at least twice higher than those measured downstream of the
township considering the poor waste disposal methods in Alexandra. The high turbidity and
TSS in water upstream of Alexandra could be attributable to natural factors e.g. the streams
up in the catchment could be abundant in benthic feeders which cause resuspension of
sediments due to frequent stir up. Natural causes for the high SPOM concentrations upstream
of Alexandra could be due to decomposed matter from the large amounts of low surface area
litter that are washed down into the streams.
Seasonal effects were observed in some parameters at some sampling sites; turbidity levels
and TSS concentrations were significantly higher in the wet season than in the dry season at
some sites. Orthophosphate and SPOM concentrations and pH were significantly higher in
the dry season at some sites while EC levels were significantly higher in the dry season at all
sites. The changing seasons had no influence on temperature, nitrate and DO concentrations
at all sites.
Most measured parameters downstream of Alexandra were in the acceptable ranges
for aquatic ecosystems except for EC levels and ammonium-N concentrations which fell in

46
the bad categories of the national and international domestic and aquatic guidelines.
Dissolved oxygen concentrations at all sites, however, were too low for aquatic life of
between 80 and 120 % (DWAF 1996a). The mean E. coli concentrations at all the sites were
above DWAF’S (1996c) target water quality range of 0 – 1.3 cfu/ml; they were also higher
than the standard guidelines for drinking water of 0 cfu/ml (WHO 2008).
6.2 Recommendations
Pollution levels in the Jukskei River downstream of Alexandra were not as high as
expected, and are less detrimental to the water quality of the Jukskei River according to the
guidelines except for E. coli, nitrogen (as ammonium and nitrate) and orthophosphate. It is
not known, however, to what extent activities like continual improper waste disposal in the
township will impact on the water quality of the Jukskei River since population in the
township is five times more than its infrastructure can support. It is also worrying that the
chemical toilets provided in the township are not used as most people reside far from them.
Implementation of sewage sanitation services in the informal areas of Alexandra is
difficult. This is because the shacks are built so close together such that there is hardly space
to place or build other structures. Main sewer lines are far (at least 1.5 km) from the informal
settlements such that it would be costly to lay sewer pipes and connect them to the informal
houses. One of the informal settlements is right on one of the banks of Jukskei River, thus
even if it were possible to provide sanitation services there; it would attract more people there
and pollution problems would continue in the Jukskei River. Additionally, it is risky for
people to live there as this area is prone to flooding during the rainy season. Any other
options for remedying the pollution problem like decentralising waste treatment to Alexandra
might be impossible to implement, e.g. a duckweed biological treatment system might require
at least 100 ha of land (one-eighth of land in Alexandra) to efficiently treat sewage from the

47
township. Therefore, the most economical option that the informal settlement dwellers might
have is to be relocated to other areas where there are sanitation services and people can built
their dwellings around the sanitation facilities while they await decent accommodation from
the government.
The PRE1 site (Zoo Lake) had high nutrient and E. coli concentrations. This shows
that not only townships in Johannesburg experience water quality problems; these are also
systematic in relatively wealthy parts of the city.

48
7. APPENDIX
Figure A1: One of the stagnant pools with litter in the informal settlements
Figure A2: Agricultural activities on the bank of the Jukskei

49
Figure A3: Sampling bottle
Figure A4: Whirl pack with a sample for E. coli analysis

50
Figure A5: Meters used for measuring pH, EC and DO.

51
8. REFERENCES
Abbott, J. 2002. A method-based planning framework for informal settlement upgrading.
Habitat International 26 (3): 317-333.
Alexandra Renewal Project. 2001. Introduction to the Alexandra Renewal Project
(http://www.alexandra.co.za). Accessed 5 November 2009.
Alexandra Renewal Project. 2008. Social dynamics and housing allocations in Alexandra:
mid 2008 update. (http://www.alexandra.co.za). Accessed 5 November 2009.
Anhaeusser, C.R. 1999. Archaen crustal evolution of the central Kaapvaal Craton, South
Africa: evidence from the Johannesburg Dome. South African Journal of Geology
102: 303-322.
Ashton, P.J. and Haasbroek, B. 2002. Water Demand Management and Social Adaptive
Capacity: A South African Case Study. Pp 187-204 in A.R. Turton, and R. Henwood,
editors. Hydropolitics in the Developing World: A Southern African Perspective.
African Water Issues Research Unit (AWIRU), Pretoria, South Africa.
Azevedo, J. And Stout, P.R. 1978. Farm animal manures: an overview of their role in the
agriculture environments. Manual 44. California Agricultural Experimental Station
Extension Service, CA, USA .
Boulton, A.J. and Brock M.A. 1999. Australian Freshwater Ecology: Process and
Management. Cooperative research centre for freshwater ecology, Canberra,
Australia.
Brisbin, P.E. and Runka, G.G. 1995. Agricultural Nutrient Pathways: Management of
Livestock and Poultry Manure in Lower Fraser Valley. Report 3, Ministry of
Environment, Lands and Parks, Edmunton, Canada.
Campbell, L.A. 1996. A Study of Storm Water Runoff from Alexandra Township in the
Jukskei River. MSc dissertation, University of the Witwatersrand, Johannesburg,
South Africa.
Chakela Q.K. 1981. Soil Erosion and Reservoir and Sedimentation in Lesotho, Scandinavian
Institute of African Studies, Uppsala, Sweden.
Chutter, F.M. 1969. The effects of silt and sand on the invertebrate fauna of streams and
rivers. Hydrobiologia. 34: 57-76.
City of Johannesburg (2006-2009). Water quality data for the period 2006 to 2009 and water
quality guidelines for the Jukskei catchment. Department of Environment,
Johannesburg, South Africa.
Clarke, R. 1993. Water: The International Crisis. Earthscan Publications Ltd., London, UK.
52
Clesceri L.S., Greenberg A.E. and Eaton A.D. 1998. Standard Methods for the Examination
of Water and Wastewater. Twentieth edition. American Public Health Association.
United Books Press, Maryland, USA.
Co-ordinating Committee for Community Open Space, 1986: Co-ordinated Planning and
Development of the Jukskei River and Adjoining Rivers. Report of a study
undertaken under the leadership of the Sandton Town Council, Parks and Recreation
Branch, and prepared by a working group of COCCOS, the Co-ordinating
Community for Community Open Space, South Africa.
Conover, W.J. 1971. Practical Nonparametric Statistics. John Wiley and sons, New York,
USA.
Dallas, H.F. and Day, J.A. 2004. The effect of water quality variables on aquatic ecosystems:
a review. WRC No. TT224/04, report to the Water Research Commission by
Freshwater Research Unit. University of Cape Town, Cape Town, South Africa.
Dallas, H.F., Day, J.A. and Reynolds, E.G. 1994. The effects of water quality variables on
riverine biota. WRC Report No. 351/1/94, final report to the Water Research
Commission by the Zoology Department of the University of Cape Town, Cape
Town, South Africa.
Davies D and Day J. 1998. Vanishing Waters. University of Cape Town Press, Cape Town,
South Africa.
De Jager, T. 1990: Alexandra, a town planner’s dream / nightmare? Housing in South Africa
(March 1990): 16-19.
de Wet, T., Mathee, A. and Barnes, B. 2001. Anthropology and epidemiology: a case study of
health and environment in Alexandra , Johannesburg. Africanus 31(1): 75-106.
Department of Housing. 2004. Human Settlements. South Africa’s progress report submitted
to the United Nations Commission for sustainable development twelfth session,
Johannesburg, South Africa.
Department of Water and Environmental Affairs, 2009. Diffuse and point sources. Water
quality management in South Africa.
(http://www.dwaf.gov.za/Dir_WQM/pollutedWater.asp). Accessed 13 November
2009.
Department of Water Affairs and Forestry (DWAF), 2003. Water Conservation and Water
Demand Management Strategy for Industry, Mining and Commercial Water Use.
(http://www.dwaf.gov.za/WaterConservation/Programs_IMP.htm). Accessed 16
November 2009.
Department of Water Affairs and Forestry (DWAF), 1998. Quality of Domestic Water
Supplies. Assessment Guide (second edition) volume 1: DWAF, Department of
Health, and Water Research Commission, Pretoria, South Africa.

53
Department of Water Affairs and Forestry (DWAF), 1996a. South African Water Quality
Guidelines (second edition) volume 7: Aquatic Ecosystems, DWAF, Pretoria, South
Africa.
Department of Water Affairs and Forestry (DWAF), 1996b. South African Water Quality
Guidelines (second edition) volume 1: Domestic Use, DWAF, Pretoria, South Africa.
Department of Water Affairs and Forestry (DWAF), 1996c. South African Water Quality
Guidelines (second edition), volume 2: Recreational Use, DWAF, Pretoria, South
Africa.
Department of Water Affairs and Forestry, 1999. Development of a Water Quality
Management Plan for the Klip River Catchment Phase1 Situation Analysis. Draft
Final Report, Pretoria, South Africa.
Diesch, S.L. 1970. Disease transmission of waterborne organism of animal origins. Pp 265-
285 in T.L. Willrich, and G.E. Smith, editors. Agricultural Practices and Water
Quality. Iowa State University Press, Ames, USA.
Dodds, W.K. and Wech, E.B. 2000. Establishing nutrient criteria in streams. Journal of
Northern American Benthological Society 19(10):186-196.
Doering P.H. 1996. Temporal Variability of the Water Quality in the St. Lucie Estuary, South
Florida. Water Resource 32: 1293-1306.
Drewett, N and Abel P.D. 1983. Pathology of lindane poisoning and hypoxia in brown trout.
Salmo truttah. Journal of Fish Biology 23: 373.
Dudula, M.Z. 2008. A Situation Analysis of the Water Quality in the Hartbeespoort Dam
Catchment: Nutrients and other Pollutants’ Assessment on Rivers Entering the Dam.
MSc Research Report, University of the Witwatersrand, Johannesburg, South Africa.
Ellis, D.V. 2005. Biodiversity reduction in contaminated sediments in the sea: contamination
or sedimentation mobility? Marine Pollution 50: 244-246.
Health Canada. 2006. Guidelines for Canadian Drinking Water Quality: Guideline Technical
Document — Escherichia coli. Water Quality and Health Bureau, Healthy
Environments and Consumer Safety Branch, Health Canada, Ottawa, Ontario,
Canada.
Hellawell, J.M. 1986. Biological Indicators of Freshwater Pollution and Environmental
Management. Elsevier Applied Science, London, UK.
Hem, J.D. 1985. Study and Interpretation of the Chemical Characteristics of Natural Water.
Third edition. Department of the Interior US Geological Survey, Water Supply Paper
2254, Virginia, USA.
Horne, A.J. and Goldman, C.R. 1995. Limnology. McGraw Hill, New York, USA.

54
Hranova, R. 2006. Diffuse pollution – principles, definitions and regulatory aspects. Pp 1-24
in R. Hranova, editor. Diffuse Pollution of Water Resources, Principles and Case
Studies in the Southern African Region, Taylor and Francis Group, Philadelphia,
USA.
Hranova, R., Nkabule, S. and Mwandira, S. 2006. Diffuse pollution of urban rivers – case
studies in Malawi and Swaziland. Pp 223-244 in R. Hranova editor. Diffuse Pollution
of Water Resources, Principles and Case Studies in the Southern African Region,
Taylor and Francis Group, Philadelphia, USA.
Huizenga J.M. and Harmse J.T. 2005. Geological and Anthropogenic Influences on the Water
Chemistry of the Jukskei River, Gauteng, South Africa. South African Journal of
Geology 108 (3): 439-447.
In-Stream Water Quality Guidelines for the Klip River Catchment. 2003.
(www.reservoir.co.za). Accessed 6 June 2009.
Keller, P. 1960. Bacteriological aspects of pollution in the Jukskei-Crocodile river system in
the Transvaal, South Africa. Hydrobiologia 14(3-4): 205-254.
Koning, N. and Roos, J.C. 1999. The continued influence of organic pollution on the water
quality of the turbid Modder River. Water South Africa 25 (3): 285-292.
Lamb J.C. 1985. Water Quality and its Control. John Wiley and Sons, New York, USA.
Ling, F and Siberbush, M. 2002. Response of maize to foliar versus soil application of N-P-K
fertilizers. Journal of Plant Nutrition 25(11): 2333-2342.
Lloyd R. 1992. Pollution and freshwater fish. Fishing News Books, Oxford, USA.
Maas J., Verheij R.A., Groenewegen P.P., de Vries S. and Spreeuwenberg P. 2006. Green
Space, Urbanity and Health: How Strong is the Relation? Journal of Epidemiological
and Community Health 60: 587-592.
Makungo, M.T. 2006. Community perceptions of environmental and living conditions in the
Alexandra informal settlements, Johannesburg, South Africa. MA dissertation, Rand
Afrikaans University, Johannesburg, South Africa.
Malmqvist, B. and Rundle, S. 2002. Threats to the running water ecosystems of the world.
Environmental Conservation 29(2): 134-153.
Maxwell, S.E. and Delaney, H.D. 2003. Designing Experiments and Analyzing Data: A
Model Comparison Perspective. Lawrence Erlbaum and Associates, New Jersey,
USA.
McAlister, M. and Ormsbee, L. 2005. Kentucky River watershed watch five – year data
analysis: 1999-2003, prepared for the Kentucky River watershed watch, Kentucky
River Authority, Kentucky, USA.

55
Morris, P. 2000. Alexandra Township – A history, lesson for urban renewal and some
challenges for planners. Paper presented at SA Planning History Study Group,
Planning for Reconstruction and Transformation Conference, University of Natal,
Durban, South Africa.
Moss, B.R. 1980. Ecology of Fresh Waters. Blackwell Scientific Publishers. Oxford, UK.
Mvungi, A., Hranova, R.K. and Love, D. 2003. Impact of home industries on water quality in a tributary of the Marimba River, Harare: implications for urban water management. Physics and Chemistry of the Earth 28(20-27): 1131-1137.
Nelson, S.M. and Roline, R.A. 1996. Recovery of stream macro-invertebrate community from mine drainage disturbance. Hydrobiologia 339: 73-84.
Ogbeibu, A.E. and Victor, R. 1989. The effects of bridge construction on the bank-root macrobenthic invertebrates of a southern Nigerian stream. Environmental Pollution 56: 85-100.
Palmer C.G., Berold R.S. and Muller W.J. 2004. Environmental Water Quality in Water
Resources Management. WRC Report No. TT 217/04, Water Research Commission,
Pretoria, South Africa.
Petts, G.E. 1984. Long-term consequences of upstream impoundment. Environmental
Conservation 7(4): 325-332.
Population Reference Bureau and African Population and Health Research Center. 2008.
African Population Data Sheet.
(http://www.prb.org/pdf08/africadatasheet2008.pdf). Accessed 2 May 2009.
Selman M. 2007. Eutrophication: An Overview of Status, Trends, Policies, and Strategies,
Water Resources Institute Report, Paris, France.
Skelton, P.H. 2001. Freshwater Fishes of Southern Africa. Struik Publishers, Cape Town,
South Africa.
Skoroszewski, R., 1999: Specialist report water quality. Consulting services for the
establishment and monitoring of the instream flow requirements for river courses
downstream of the Lesotho Highlands Water Project dams. Report no. DHDA 648-F-
15. (http://www.southernwaters.co.za/lhda/648-f-15.PDF). Accessed 13 November
2009.
Statistics South Africa. 2007. Community Survey. (www.statsa.gov.za). Accessed 2 June
2009.
Tchobanoglous G. and Schroeder E.D. 1985. Water Quality. Addison-Wesley,
Massachusetts, USA.
United Nations Common Database. 2005. United Nations Population Division Estimates.
( http://globalis.gvu.unu.edu/indicator_detail.cfm?IndicatorID=30&Country=ZA).
Accessed 6 June 2009.
56
Van Niekerk, H. 2000. On the Identification and Prioritization of Areas in South Africa with
a Potentially High Health Risk Due to Faecal Polluted Surface Water. A NMMP First
Report, WRC, Pretoria, South Africa.
Van Veelen, M., 2002: The Development of Principles and Procedures for the Establishment
of Water Quality Objectives and their Application on the Jukskei River System,
Gauteng. PhD thesis, University of Johannesburg, Johannesburg, South Africa.
Vega M., Pardo E., Barrado E., and Deban L. 1998. Assessment of Seasonal and Polluting
Effects on the Quality of River Water by Explanatory Data Analysis. Water Research
32: 3581-3592.
Virkutyte, J. and Sillanpaa, M. 2006. Chemical evaluation of potable water in Eastern
Qinghai Province, China: Human health aspects. Environment International 32(1):
80-86.
Vogel, C. 1996. Sustainable Urban Environments: The Case of Alexandra. Journal of
Geography 39: 51-58.
Water Research Commission. 1998. Quality of Domestic Water Supplies. Assessment Guide
volume 1. DWAF, Pretoria, South Africa.
Weather Bureau. 1997. Climate of South Africa, WB 42 Climate Statistics, 1961-1990.
Pretoria, South Africa.
Wilkes University Center for Environmental Quality Environmental Engineering and Earth
Sciences. 1999. Nitrogen – ammonia in water.
(http://www.water-research.net/Watershed/ammonia.htm). Accessed 6 June 2009.
Wilson, M., 2002: Participatory gender-oriented information and learning needs assessment
of the youth of Alexandra. Background Report for UNESCO developing open
learning communities for gender equity with the support of ICTs.
World Bank. 2001. Local Economic Development: Quick Reference. Urban Development
Division, The World Bank, Washington D.C, USA.
World Health Organization. 1993. Guidelines for Drinking Water Quality, second edition,
volume1. Recommendations, WHO, Geneva, Switzerland.
World Health Organization. 2008. Guidelines for Drinking Water Quality, Incorporating First
and Second Addenda ,third edition, volume 1. Recommendations, WHO, Geneva,
Switzerland.
i Information from personal communication with Mr M Bromley, Course Manager, Royal Johannesburg and
Kensington Golf Club, Johannesburg, 12 November 2009.


![Alexandra Basin Redevelopment Project · 2015-07-31 · Alexandra Basin Redevelopment Project Environmental Impact Statement IBE0807/EIS01 v [Final] Figure 5.4.8 Representative imagery](https://img.pdfslide.us/doc/110x75/5f185ff76cdf493d1416de2b/alexandra-basin-redevelopment-2015-07-31-alexandra-basin-redevelopment-project.jpg)