Embed Size (px)
Citation preview

Impact of a SoDo Arena on Port of Seattle Operations PREPARED FOR:
PREPARED BY:
6544 NE 61ST STREET, SEATTLE, WA 98115 PH: (206) 523-3939 FX: (206) 523-4949
AUGUST 7, 2012

Impact of a SoDo Arena on Port of Seattle Operations
August 7, 2012
Table of Contents 1. OVERVIEW ......................................................................................................................................... 1
1.1. What are the Port’s primary operational concerns about a new arena in SoDo? .................... 2 1.2. What are the flaws of the arena’s traffic study? ...................................................................... 7
2. PORT TERMINAL OPERATIONS .......................................................................................................... 8 2.1. Where are the Port’s container terminals? ............................................................................... 8 2.2. What is the Port’s historic and current annual container throughput? .................................. 10 2.3. How does the current throughput compare to past forecasts? ............................................. 11 2.4. How does the throughput fluctuate by month? ..................................................................... 13 2.5. How much of the cargo is imported versus exported? ........................................................... 13 2.6. What are the origins and destinations of Port cargo and how does it get there? .................. 14 2.7. How many trucks trips per day would Port growth generate? ............................................... 15 2.8. Where are the trucks going? ................................................................................................... 16 2.9. When do trucks travel and how do stadium events affect truck activity? ............................. 17 2.10. How would extended gate hours affect hourly truck volumes? ............................................. 19
3. TRANSPORTATION ISSUES ............................................................................................................... 23 3.1. Where are the local bottlenecks? ........................................................................................... 23 3.2. How do existing events affect Interstates 5 and 90? .............................................................. 24 3.3. Why is the Holgate Street RR crossing a concern to the Port? ............................................... 25
4. ANALYSIS THAT THE ARENA NEEDS TO PERFORM .......................................................................... 27 4.1. What did the other stadium EIS documents evaluate? .......................................................... 27 4.2. What are the flaws of the arena’s traffic study? ..................................................................... 29 4.3. What should be evaluated in an EIS for potential arena? ....................................................... 30
Tables Table 1. Port of Seattle Container Terminals ........................................................................................ 8 Table 2. Truck Trips per Day Generated by Port of Seattle .................................................................. 16 Table 3. Peak Hour Truck Trips Generated by Port of Seattle at 3.5 Million TEUs/Year ...................... 22 Table 4. Transportation and Parking Analyses in other EISs ............................................................... 28 Table 5. Transportation Analysis Needs for New Arena EIS ................................................................. 32
Figures Figure 1. Location of Port Container Terminals...................................................................................... 9 Figure 2. Historic Container Volumes at the Port of Seattle ................................................................ 10 Figure 3. Actual Throughput Compared to Forecasted Growth in 2015 .............................................. 11 Figure 4. Actual Throughput Compared to Long-Term Forecast of 3.5 Million TEUs .......................... 12 Figure 5. Throughput by Month (Five Year Average from 2007 through 2011) .................................. 13 Figure 6. Land-side Origin and Destination of Port Cargo .................................................................... 15 Figure 7. Expected Growth in Daily Truck Trips.................................................................................... 16 Figure 8. Port Truck Trips on Major Intermodal and Freeway Connector Routes ............................. 18 Figure 9. Effect of Mariners Games on Terminal 46 Gate Moves ........................................................ 19 Figure 10. Trucks per Hour Entering Terminal 18 – 2005 ..................................................................... 20 Figure 11. Effect of Night Gates on Hourly Traffic Volumes – Average Day........................................ 21 Figure 12. Westbound Traffic on I-90 at Milepost 2.78 Without and With a Mariners Game ............ 24

Impact of a SoDo Arena on Port of Seattle Operations
- 1 - August 7, 2012
1. OVERVIEW The proposed new arena in the SoDo neighborhood will adversely affect operations of the Port of Seattle’s marine cargo terminals, some of which are located directly west of the site identified for the new arena. Standard practice and the State Environmental Policy Act (SEPA) require the proponent of any large new development with the potential to create significant adverse impacts to determine, dis-close, and as needed, mitigate those impacts. To date, insufficient analysis has been performed by the arena proponent, the City of Seattle, or King County to determine the specific magnitude of impacts of the new arena. The Port of Seattle has expressed concerns about the arena project based on current and past experi-ence operating terminals in proximity of Safeco Field and CenturyLink Field. As with any development proposal, including the proposed SoDo arena, the burden of evaluating and mitigating project-related impacts falls on the applicant and not on those, such as the Port, that would be impacted. The Port of Seattle was not consulted regarding the arena, its location, or its potential impacts until negotiations with the City and County were in advanced stages. Once the arena proposal was made public, the Port provided the most recent analyses it has performed for terminals in the site vicinity in order to provide context and background for its concerns. The Port has prepared these types of analysis when it sought permits for a project or as part of long-range planning. The Port’s most recent analyses were performed in 2006 when it converted Terminal 30 from cruise operations back to container operations. The Port also performed transportation analyses in that year to support its long-term growth forecasts. Since then, Port data have been compiled to support WSDOT’s efforts to plan and design the Alaskan Way Viaduct (AWV) Replacement Project as well as the SR-519 project. The truck traffic estimates developed for the Port’s SEPA studies and other planning support efforts are still valid, and as detailed in this report, the long-term growth targets for Port operations are achievable. The traffic operations docu-mented in WSDOT’s various studies for the AWV Replacement Project and SR-519 are also still valid and reflect the conditions that will exist in the future when those projects and many others are completed. The Port’s concerns are not only based on these technical analyses, but knowledge of the Port’s day-to-day operations, and many decades of experience working to maintain traffic operations in the vicinity of these terminals. The applicant proposing the arena has completed only a preliminary analysis. The Seattle Arena Multi-modal Transportation Access and Parking Study1 is very simplistic compared to the EIS analyses that were performed for the Kingdome, Safeco Field, CenturyLink Field, and Key Arena. The arena study ad-mits that it is not a comprehensive analysis and that, “An expanded transportation and parking impact analysis would be required as part of a more detailed project review to comply with the State Environ-mental Policy Act (SEPA).” The primary focus of the arena study was estimating the number of event days, concurrent event days, and potential trips, and providing information on potential alternative modes of transportation. The study provided no actual analysis of traffic operational impacts, safety impacts, transit impacts, or freight impacts, nor did the study recommend any mitigation measures. The study also made several assumptions and drew flawed conclusions that are not adequate for the public or decision makers to understand the potential impacts of the proposal. The Port trusts that the City, County and arena proponents will perform an EIS, as required by SEPA and as outlined in the Memorandum of Understanding for the proposal,2 to document the impacts of the 1 Parametrix, Inc., May 23, 2012. 2 Memorandum of Understanding Seattle Sports and Entertainment Facility, Pg 2.
Impact of a SoDo Arena on Port of Seattle Operations
- 2 - August 7, 2012
proposed arena. This EIS will help determine the type and extent of impacts and mitigation that will be implemented if the arena is approved for the SoDo site. To assist in this effort, the Port commissioned this study to provide the following:
• A detailed list of the Port of Seattle’s concerns about the arena and how it will affect Port opera-tions. This information is intended to provide additional context for developing potential mitiga-tion measures that would address these concerns.
• Updated Port statistics to reflect operations in the past five years, as well as future growth fore-casts so that the arena EIS can account for existing and future Port traffic.
• A discussion of how Port operations will change over time due to growth and changing logistic needs; and
• A list of the types of analyses that should be performed as part of the arena’s EIS so that the im-pacts and potential mitigation benefits can be adequately assessed.
1.1. What are the Port’s primary operational concerns about a new arena in SoDo?
The Port of Seattle’s primary concerns about a new arena in SoDo relate to how additional traffic and changes in land use could affect Port operations. The primary transportation concerns, described further below, are that:
A. Additional events at a new arena will make it harder to reach the Port, increase cargo shipping costs, and affect the Port’s ability to retain and attract customers;
B. New incompatible land uses will affect the Port’s ability to operate; C. The large number of new events reduce the Port’s effective operating hours; D. Port traffic will occur in the evenings and conflict with new arena event traffic; E. Proposed street vacations will exacerbate congestion along the Port’s main freeway access
route; F. Additional pedestrian and vehicular activity at nearby railroad crossings increases the risk for
train-related collisions and rail and road system delays; G. Concurrent events at two or more venues greatly exacerbate congestion to, from, and within
SoDo; H. Alternative sites have not been considered; and I. The proposed arena has not detailed its mitigation needs or identified funding for mitigation
A. Additional events at a new arena will make it harder for trucks to reach the Port, increase cargo shipping costs, and affect the Port’s ability to retain and attract customers
International shipping customers choose their gateway based on several economic factors, especially those related to the cost, reliability and speed of shipping. The Port already faces severe competition that could be exacerbated by widening the Panama Canal, which will allow ships direct access to East and Gulf Coast ports, and expansion of facilities in British Columbia, Canada, which has rail connections to Chicago and other Midwest cities. A new arena will add at least 70 to 100 weekday events per year to SoDo, of which 6 to 22 could be concurrent with events at existing stadiums. Traffic generated by these events slows freight movements and increases costs. If shipping costs increase and reliability declines, shippers could choose to move elsewhere. Loss of these shipping customers would result in a loss of Port-related jobs, as well as increase costs for local and statewide businesses required to truck longer distances to reach another port.

Impact of a SoDo Arena on Port of Seattle Operations
- 3 - August 7, 2012
B. Incompatible land uses will affect the Port’s ability to operate
The new arena proponents have stated their desire to create an entertainment district around the new arena. “Hansen said his vision for the area is to develop an entertainment center similar to L.A. Live, a collection of restaurants, bars, clubs, hotels and other venues surrounding Staples Center in downtown Los Angeles.”3 Further gentrification of the industrial area will escalate land prices to levels that indus-trial users cannot afford. The Port relies on support activities in the industrial area, including the rail yards, warehouses, distribution centers, fulfillment processors, container and chassis maintenance, inspection and other support services. Having these support services in close proximity to the Port ter-minals reduces travel time and distance, highway congestion, wear-and-tear on roads, and emissions. Their continued viability relies on the availability of competitively-priced industrial property.
C. Events reduce the Port’s effective operating hours
While the Port acknowledges that the anticipated start times of events at the planned arena are likely to be 7:00 or 7:30 P.M., several characteristics of the proposed location and anticipated types of events contribute to concerns about event-related congestion developing much earlier. Due to the constraints on parking capacity, its many dispersed locations and variation in price, event attendees are likely to ar-rive much earlier to find convenient parking based on experience with current sports events. In addition, the proponent’s desire for other entertainment uses nearby, combined with the restaurants and bars that were developed after Safeco Field and CenturyLink Field were completed, increase the likelihood that event attendees will drive to the SoDo area earlier. In fact, one of the economic benefits touted by proponents is this type of activity (“additional revenue for local restaurants, bars and clubs” 4)—benefits that were unfortunately lost near Key Arena after the Sonics were relocated. Finally, in order to remain a financially viable building, the arena is expected to host a wide range of events in addition to profes-sional basketball and hockey, such as “other sporting events, family shows, concerts, graduations, and civic and other events.”5 Proponents have stated that it will be “the premier concert venue in the Pacific Northwest.“ 6 Based on the experience at the other event venues in SoDo, the non-recurring events such as concerts and special shows draw spectators to the vicinity much earlier and require traffic control and access revisions during or prior to the afternoon peak period for traffic. As a result, the Port is concerned that the proposed arena will further exacerbate the late afternoon congestion that already constrains trucking efficiency in the SoDo area. Trucking firms that serve the Port terminals have stated that they closely monitor the event schedules in SoDo. Often, dispatchers will not send trucks to Terminal 46 after 2:30 P.M. when there is an evening Mariners game.7 Firms that truck products to the Port from Eastern Washington also report not sending any trucks west for an afternoon run on a day with an evening Mariners game. Those firms may avoid travel altogether when there is a day game or a large event such as a Monday Night Football game. This means that they then will need to move more cargo before and after the time affected by the event, increasing volumes during those times. Some firms, though, are unable to avoid delivering export con-tainers during the times of event-induced congestion because they are responsible for refrigerated cargo that must be delivered within tight deadlines. Their trucks will be on the road longer, with a higher level of unpredictability that makes it difficult to determine how many trucks need to be dedicated to 3 Seattle PI online, “Hansen paints clearer picture of Sodo arena plan,” June 20, 2012 . 4 http://www.sonicsarena.com/info/sonics-arena-economic 5 Memorandum of Understanding Seattle Sports and Entertainment Facility, Pg 1. 6 http://www.sonicsarena.com/info/summary-sonics-arena 7 MacMillan Piper, July 2012.

Impact of a SoDo Arena on Port of Seattle Operations
- 4 - August 7, 2012
providing service. In all instances, there already is an existing economic impact on the trucking firms and their customers, as the efficiency of their operations is reduced by the existing sports stadia. Most of the truck drivers that haul Port cargo are independent owner-operators who are paid by the trip. If they are not dispatched to pick up a load in the afternoon, they could lose 25% to 30% of their daily travel time, and in effect up to 30% of their day’s income. A significant increase in the number of event days, and the number of dual events, would exacerbate this impact. Truckers are avoiding the area today because events do create congestion in the afternoons. Truck vol-umes at the Terminal 46 gate are lower in the afternoon on days with night Mariners games, even with the reduced attendance in recent years. In the future, a new arena would increase the number of days affected by events, and will result in days with concurrent events with total attendance similar to a Monday Night Football game. Further information about how events affect Port traffic is presented in Section 2.9.
D. Port traffic will occur in the evenings and conflict with new arena event traffic
The Port’s strategic Century Agenda targets growth in its container operations in order to increase local and regional jobs. Its goal is to increase container throughput from about 2.0 million TEUs8 in 2011 to 3.5 million TEUs. Achieving that cargo volume would increase daily truck trips from about 7,200 in 2010 to over 11,000 when throughput reaches 3.5 million TEUs (Table 2). Because the Port’s land base and access to suitable shipping berths are constrained, accommodating this growth will require both new technologies for handling cargo and expanded operating hours. As detailed in the Port Operations sec-tion below, it is estimated that about 20% of the Port’s daily cargo would be moved between 6:00 P.M. and 11:00 P.M. with extended gate operations. Night-time terminal operations have the regional benefit of spreading truck travel from peak periods to lesser demand times and utilizing the regional transporta-tion network at times when there is typically excess capacity. The peak arrival and departure times for event traffic will conflict with Port truck movements between some terminals and the regional network (especially Interstate 5 and Interstate 90). The need for night time operations has been noted in past studies. In fact, in the Port of Seattle’s com-ment letter on the original EIS for Safeco Field, the Port wrote, “While today terminal gate hours are not regularly extended beyond the traditional 8:00 am to 5:00 pm period, projected increases in containers at Terminal 25, 30, 37 and 46 will make it increasingly attractive for terminal operators to extend the gate hours into the evening hours.”9
8 TEU = twenty-foot equivalent unit. A 40-foot container is 2.0 TEUs. 9 Letter from Port of Seattle (Keith Christian, General Manager of Container Line of Business) to Washington
State Major League Baseball Stadium Public Facilities District, June 28, 1996. Published in the Final EIS.

Impact of a SoDo Arena on Port of Seattle Operations
- 5 - August 7, 2012
E. Street vacations will exacerbate congestion along the Port’s main freeway access routes
A new arena requires the vacation of Occidental Avenue S to provide a site wide enough to accommo-date the footprint of the arena. Plans may also include vacation of S Massachusetts Street. Both of these streets now carry some local traffic that, if vacated, would be diverted through the 1st Avenue S/S Atlantic Street/ Edgar Martinez Drive intersection. This intersection is the area’s primary bottleneck, and is along the primary travel route between Terminals 25, 30 and 46 and Interstates 5 and 90. The last comprehensive analysis for traffic operations in the SoDo area was performed as part of the Alaskan Way Viaduct Replacement Project Supplemental EIS.10 That analysis accounted for all of the new infrastructure investments that have or are being made in the area including: the new I-90 ramps to SR-519, the grade-separated roadway at Royal Brougham Way, the Holgate-to-King Street project with “Little h” that separates Atlantic Street traffic from the railroad tail track, and improvements to Spokane Street. It also included the new SR-99 Bored Tunnel and new ramps in the SoDo area. Even with all of those projects, the analysis showed that the intersection at 1st Avenue S/S Atlantic Street will continue to experience extreme congestion on a non-event day. The arena’s proposed street vacation(s) will exacerbate this condition even on days when no events are scheduled.
F. Additional pedestrian and vehicular activity at nearby railroad crossings increases the risk for train-related collisions as well as rail and road system delays
The new arena site fronts on S Holgate Street, a roadway that is crossed by 17 railroad tracks between 1st and 4th Avenues and supports active train operations by BNSF, Amtrak and Sound Transit. The pro-posed arena will substantially increase the number of pedestrians and vehicles that cross these tracks to reach parking areas and transit east of the tracks. The proposed relocation of Occidental Avenue S adja-cent to the tracks will also increase vehicular conflicts at or near the tracks especially after events when event attendees exit the Safeco Field Garage and/or new parking facilities created for the arena. Train operations on these tracks include 80 to 100 mainline crossings per day, plus switching in the passenger train maintenance yards that serve Amtrak and Sounder. The number of tracks plus a slight bend in the track alignment makes it difficult for a pedestrian to discern which tracks may be in use by an ap-proaching train. Past experience with the tracks that crossed Royal Brougham Way on the north side of Safeco Field, which were many fewer in number, found that pedestrians often ignored gates when they were down and collisions did occur.11 It was one of the reasons why Royal Brougham Way is now grade separated from the tracks for both pedestrian and vehicular movements. In addition to the potentially tragic individual results of a train collision with a car or pedestrian, collisions also have substantial im-pacts to the rail system and cause extensive delay to passenger and freight rail. Amtrak, WSDOT and SDOT have previously evaluated whether S Holgate Street should be closed at the railroad tracks. Increased pedestrian and vehicular crossing associated with the proposed arena will in-crease pressure to close S Holgate Street, even temporarily before and after events. This would increase congestion at other crossings and intersections throughout the SoDo area. Therefore, it is imperative that the safety issues at the railroad crossings be addressed (see also Section 4.3).
10 SR 99 Alaskan Way Viaduct Replacement Project Final EIS, Transportation Discipline Report; WSDOT, FHWA,
SDOT, Parsons Brinckerhoff; July 2011. Table 5-27. 11 “Train accident was fourth near ballpark since 2000,” Seattle Times article, October 2, 2007.

Impact of a SoDo Arena on Port of Seattle Operations
- 6 - August 7, 2012
G. Concurrent events greatly exacerbate congestion to, from, and within SoDo
The Seattle City Council imposed substantial restrictions related to “concurrent time-specific events” on both Safeco Field and CenturyLink Field.12 These dictate that events at the two stadiums with a cumula-tive weekday attendance of 58,500 must be separated by a four-hour period (time between the end of the first event and start of the second). With the cooperation of the Seattle Police Department, the teams operating Safeco Field and CenturyLink Field have experimented with limited overlapping events, and with separation of less than four hours. All parties have concluded that overlapping events are highly problematic, due to traffic and parking issues, and that a minimum three-hour separation is what is practical for major events. A critical question to be answered is whether it would be possible to main-tain these restrictions with a third venue in the area, and what the impacts, and related mitigation, would be if the restrictions were lifted. There are three key issues that affect Port access during major or concurrent events. The first is extreme congestion before an event that can create very long backups on Interstate 5 and Interstate 90 ap-proaching the SoDo area. This affects not only access to the Port of Seattle, but through freight access on those key regional routes. Another issue is local congestion, which is compounded by an inadequate supply of parking and the dispersed locations of that parking, causing attendees to circle the street sys-tem to find an available space at a price they are willing to pay. Finally, at the end of the event, traffic management plans that go into effect can completely close some major arterials as traffic is flushed from event parking garages. With increased use of night gates at the Port, post-game traffic control plans could restrict or prohibit truck access to and from the Port terminals.
H. Alternative sites have not been considered
All of the other major sports venues in Seattle—Safeco Field, the original Kingdome (which was replaced by CenturyLink Field), and even Key Arena—were subject to an alternative site analysis. Such an analysis allows a comparison for event-related impacts and mitigation needs, which will differ by location. The proposed arena in SoDo is likely to require additional parking, pedestrian improvements (including track crossing upgrades, sidewalk upgrades, and pedestrian illumination upgrades), public benefit improve-ments associated with street vacations, additional police-officer control during concurrent events, street system improvements, and traffic management improvements. The magnitude of mitigation needs and their associated costs (at either proponent or public expense) may be less at an alternative site. The al-ternative site analysis should be completed to determine how the site location affects the magnitude and cost of mitigation.
12 Property Use and Development Agreement for the Ballpark, June 29, 1999.

Impact of a SoDo Arena on Port of Seattle Operations
- 7 - August 7, 2012
I. Arena has not detailed its mitigation needs or identified funding for mitigation
A key part of the environmental review process is defining the required mitigation for new impacts. This was a part of the documentation and permitting processes for all Port of Seattle terminals, as well as for Safeco Field, CenturyLink Field, and Key Arena. As described above, the proposed arena in SoDo is likely to require, at a minimum, the following to mitigate its transportation impacts:
• Additional parking to meet the demand associated with concurrent events; • Pedestrian improvements including track crossing safety upgrades, sidewalk upgrades, and
pedestrian illumination upgrades along walking routes to transit and parking areas; • Public benefit improvements associated with street vacations; • Police-officer traffic control during arena events, plus additional police officers during concur-
rent events; • Street system improvements to maintain traffic operations along major access corridors and
intersections, and at the access points to new parking facilities; • Traffic management improvements, including elements such as variable message signs, parking
guidance systems, and other technology, to direct attendees to appropriate access routes and to maintain through-vehicle access in SoDo (including Port trucks) before and after events; and
• Ongoing trip reduction measures (as part of a Transportation Management Plan) to reduce vehi-cle trips and parking demand.
The detailed analysis typically performed as part of the arena’s EIS would determine these mitigation needs. However, unless an appropriate level of funding is allocated for mitigation, it is possible that the mitigation costs could be shifted to the public, or worse, deferred or abandoned. Therefore, an accepta-ble mitigation plan with funding must be developed for the arena.
1.2. What are the flaws of the arena’s traffic study?
As outlined on page one of the Seattle Arena Multimodal Transportation Access and Parking Study,13 that analysis was not a comprehensive technical analysis and it states that:
“An expanded transportation and parking impact analysis would be required as part of a more detailed project review to comply with the State Environmental Policy Act (SEPA). This phase of work will assess the degree to which the existing and planned transportation and parking infrastructure in the area would accommodate the new sports arena.”
The study was very simplistic compared to the EIS analyses that were performed for the Kingdome, Safeco Field, CenturyLink Field, and Key Arena. Its primary focus was estimating the number of event days, concurrent event days, and potential trips, and providing information on potential alternative modes of transportation. The study provided no actual analysis of traffic operational impacts, safety impacts, transit impacts, or freight impacts, nor did the study recommend any mitigation measures. The study also made several assumptions and drew conclusions that are flawed. These are outlined in Section 4. An EIS must be performed for the new arena. Detailed analyses that should be included in this EIS are described in Section 4. 13 Parametrix, Inc., May 23, 2012.

Impact of a SoDo Arena on Port of Seattle Operations
- 8 - August 7, 2012
2. PORT TERMINAL OPERATIONS
2.1. Where are the Port’s container terminals?
The Port of Seattle has four major container terminals located just south of downtown Seattle. These are described in Table 1 and their locations are shown on Figure 1. The Port is also served by two major rail intermodal yards: the BNSF Railway’s Seattle International Gateway (SIG Yard) and the Union Pacific’s Argo Yard. The intermodal yards are where containers are loaded onto or unloaded from a train. SIG is divided into two facilities, the North SIG Yard, which is accessed off S Massachusetts Street and Colorado Avenue, and Main SIG, which is accessed from S. Hanford Street east of East Marginal Way.
Table 1. Port of Seattle Container Terminals
Terminal Location / major access route? Acreage
# of Ship Berths (Apron Length) On-Dock Rail
T-5 West Seattle Spokane Street
172 3 (2,900 feet) Yes (Capacity for 54 five-platform railcars)
T-18 Harbor Island Spokane Street
196 4 (4,440 feet) Yes (Capacity for 54 five-platform railcars)
T-25/T-30 East Harbor East Marginal Way
70 2 (2,700 feet) No a
T-46 East Harbor Alaskan Way at Atlantic Street
88 2 (2,300 feet) No a
a. Terminal size prohibits the use of on-dock rail. Operations are efficient due to availability of near-dock rail facilities. All of these marine terminals offer access to berths for deep-draft vessels. The Port also serves container movements for shallow-draft vessels at T-115 up the Duwamish River. T-25 and T-30 are currently oper-ated as a single terminal with a combined gate, but could support separate terminal operations if mar-ket conditions change.

Impact of a SoDo Arena on Port of Seattle Operations
- 9 - August 7, 2012
Figure 1. Location of Port Container Terminals
Source: Port of Seattle.

Impact of a SoDo Arena on Port of Seattle Operations
- 10 - August 7, 2012
2.2. What is the Port’s historic and current annual container throughput?
Cargo volume through the Port’s container terminals is measured in TEUs (“twenty-foot equivalent units”) with a 40-foot container being equivalent to two TEUs. Container throughput at the Port has grown stead-ily over the years as shown in Figure 2. The Port had record throughput year in 2010, when 2.14 million TEUs were handled. The recessions of 2001 and 2008/2009 show clearly on the chart, along with recoveries.
Figure 2. Historic Container Volumes at the Port of Seattle
Source: Volumes prior to 2002 provided by Port of Seattle in June 2003. Data after 2002 obtained from the Port of Seattle’s website http://www.portseattle.org/About/Publications/Statistics/Seaport/Pages/10-Year-History.aspx, accessed July 23, 2012.

Impact of a SoDo Arena on Port of Seattle Operations
- 11 - August 7, 2012
2.3. How does the current throughput compare to past forecasts?
In 2003, the Port of Seattle completed the Container Terminal Access Study, 2003 Update14 which fore-cast throughput to the year 2015. It was expected that the Port of Seattle’s container volume would in-crease to about 2.24 million TEUs by the year 2015. Figure 3 summarizes the actual throughput and the 2015 forecast. In the past decade, throughput at the Port peaked in 2010 at about 2.14 million TEUs. This shows that the growth forecasts from 2003 were reasonable and still achievable.
Figure 3. Actual Throughput Compared to Forecasted Growth in 2015
Source: Actual throughput values provided by the Port of Seattle. Forecast 2015 growth from the Container Terminal Access Study 2003 Update, Heffron Transportation, Inc., October 27, 2003.
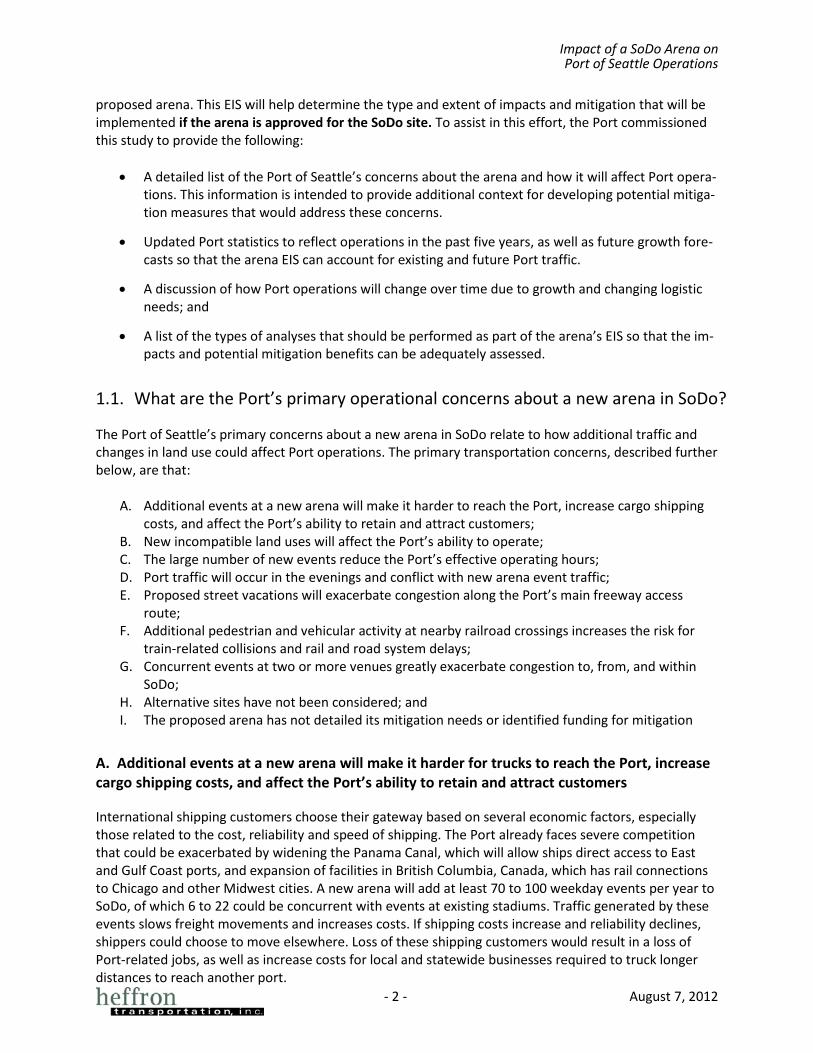
The Port’s Century Agenda targets growth in its container operations in order to increase local and regional jobs. Its goal is to increase container throughput from about 2.0 million TEUs15 in 2011 to 3.5 million TEUs. Figure 4 shows this long-term growth forecast. If growth were to continue at the same rate as the past decade—at 3.5% per year—then the Port could reach its 3.5 million TEU goal in about 22 years. If growth were to slow to a rate of 2% per year, the goal would be reached in about the year 2050. Therefore, this goal is achievable given the historic growth at the Port.
14 Heffron Transportation, Inc., October 27, 2003. 15 TEU = twenty-foot equivalent unit. A 40-foot container is 2.0 TEUs.
Impact of a SoDo Arena on Port of Seattle Operations
- 12 - August 7, 2012
Figure 4. Actual Throughput Compared to Long-Term Forecast of 3.5 Million TEUs
Source: Actual throughput values for 2002 through 2011 provided by the Port of Seattle.

Impact of a SoDo Arena on Port of Seattle Operations
- 13 - August 7, 2012
2.4. How does the throughput fluctuate by month?
Monthly port throughput varies according to consumer demand for imports, retailer buying activity, par-ticularly in advance of the holiday season, and the seasonality of agricultural exports. Throughput vol-umes for the past five years (2007 through 2011) were compiled to show the seasonal fluctuations, which are illustrated in Figure 5. The peak for the year typically occurs in August when import volumes are about 12% higher than the average month’s imports, and exports are 13% higher than the average month’s exports.
Figure 5. Throughput by Month (Five Year Average from 2007 through 2011)
Source: Port of Seattle.
2.5. How much of the cargo is imported versus exported?
Figure 5 showed the split between imports and exports. On an annual basis, the percentage of imports average 54%, and was relatively consistent over the last five years. The import volume ranged from a low of 52.4% in 2007 to a high of 54.8% in 2009.

Impact of a SoDo Arena on Port of Seattle Operations
- 14 - August 7, 2012
2.6. What are the origins and destinations of Port cargo and how does it get there?
Due to our population and employment size relative to the size of the USA, there is a limited market for goods that are consumed or produced in the Pacific Northwest. Therefore, the majority of import cargo handled at Port of Seattle terminals is discretionary cargo – cargo destined for inland markets. Ap-proximately 60% to 70% of the import cargo that crosses port terminals is headed via rail to markets in the U.S. Midwest. As container volumes through the Port of Seattle increase, more of it (both in terms of volume and as a percentage of total) would be transported to larger inland markets in other parts of the country via intermodal rail. While local consumption will increase, it will comprise a smaller portion of the overall growth in demand throughout the entire country. One logistics trend that is increasing rapidly is “cross-docking,” in which cargo is repackaged from marine containers, which are typically 40-feet long, to a domestic container, which are typically 53-feet long. The contents of 1.5 marine containers can be repackaged into one domestic container, making it more efficient to transport by truck or rail. Repackaging usually occurs close to the marine ports, and then the larger containers are either trucked back to a railyard for inland transport to the US Midwest or beyond, or are trucked to a destination in the Pacific Northwest. Large distribution centers that perform cross-dock operations are located in the Duwamish, and are expanding in areas south of Seattle. It is expected that a much higher percentage of truck trips will be made to areas south of Seattle in the future as cross-docking and local distribution increases. Detailed analysis related to the distribution pattern for containers was performed as part of the Port’s Container Sustainable Growth Plan Transportation Analysis.16 Figure 6 presents the origin and destina-tion percentages for the following major destinations:
• Handled by On-Dock Rail Yard • Drayed to/from Near-Dock Rail Yard • Trucked to/from Regional Distribution/Warehouse Facilities • Trucked to/from Regional Businesses/Manufacturing • Trucked Beyond Puget Sound Region
16 Heffron Transportation, Inc., Draft Memorandum, May 17, 2006.

Impact of a SoDo Arena on Port of Seattle Operations
- 15 - August 7, 2012
Figure 6. Land-side Origin and Destination of Port Cargo
Source: Source: Heffron Transportation, Inc. using data from Port of Seattle, May 2006.
2.7. How many trucks trips per day would Port growth generate?
Containers that do not arrive or depart from the terminal directly via on-dock rail are moved by truck. Truck volumes include two primary components: containers that are trucked to and from businesses in the Pacific Northwest (local and regional truck movements), and those trucked to and from near-dock rail yards. The containers moved by truck were converted to truck trips assuming that each container being trucked to or from an off-dock intermodal yard generates two truck trips (one entering and one leaving the termi-nal). This rate was used because when a terminal is working a ship, the focus is to get the cargo out of the terminal and to the rail yard. The trucks leave the terminal with a container and return “light” with either an empty chassis or a bobtail (truck tractor only). Few if any trucks would make a “double turn” and return to the terminal with a container. Containers that are being trucked to or from local or regional businesses were assumed to generate 2.2 truck trips each. This factor includes gate moves that require no transaction or the repositioning of containers (e.g., an empty container at a terminal being sent out for a customer to load with cargo). The average weekday traffic volumes are summarized in Table 2.

Impact of a SoDo Arena on Port of Seattle Operations
- 16 - August 7, 2012
Table 2. Truck Trips per Day Generated by Port of Seattle
One-Way Truck Trips per Day a
Trip Origin/Destination
Year 2010 2.1 million TEU/Year
Forecast with 3.5 million
TEUs / Year Net Change from 2010
To/from Near-Dock Rail Yards 3,270 6,510 3,240
To/ from Local or Regional Businesses 3,960 4,930 970
Total 7,230 11,440 4,210 Source: Heffron Transportation, Inc., Volumes for 2010 are based on current TEU throughput and intermodal information; forecasts for 3.5 million TEU condition were presented in Container Sustainable Growth Plan Transportation Analysis, Heffron Transportation, Inc., Draft Memorandum, May 17, 2006. a. A trip entering the terminal is one trip; a trip leaving the terminal is another trip.
2.8. Where are the trucks going?
Truck travel patterns will change over time and as Port volumes increase. For example, the industrial base and distribution functions in areas such as Kent, Sumner and Lacey are growing faster than those within Seattle. Therefore, as Port volumes increase, substantial growth in truck trips is likely along I-5 south of Seattle to reach these distribution centers. The increase in intermodal cargo will also substantially increase the number of dray trips between the marine terminals and the nearby rail terminals at SIG and Argo. Figure 7 shows the expected growth in truck trips to various destinations and along major corridors. Containers that are handled directly by on-dock rail yards at Terminal 5 and 18 would not generate truck trips and are excluded from the chart.
Figure 7. Expected Growth in Daily Truck Trips
Source: Source: Heffron Transportation, Inc. using data from Port of Seattle, May 2006.

Impact of a SoDo Arena on Port of Seattle Operations
- 17 - August 7, 2012
The future truck trips for the 3.5 million TEU condition are shown on Figure 8. This reflects the preferred travel routes along arterials that link to the regional highway system, and also reflects the average-day conditions. As shown, it is expected that an average of 680 trucks per day would use SR-519 (S Atlantic Street and Edgar Martinez Drive).
2.9. When do trucks travel and how do stadium events affect truck activity?
Terminal gates are currently open from 8:00 A.M. to 5:00 P.M., and can open for early morning, night, and weekend shifts when needed to “turn the ship” (unloading and reloading the ship in a certain amount of time so it can maintain its schedule). When a ship arrives in port, the import cargo is of-floaded, and the intermodal cargo (which is typically the highest value cargo), is the first priority to be trucked out of the terminal to the rail yards. Export loads bound for a ship must arrive before the vessel cut-off (the deadline when containers must be at the terminal in order to be loaded on the ship). For the agricultural and other exporters trying to deliver a large number of export containers by the vessel cut-off, congestion delays mean the difference between one or two turns per day, and they face the real possibility of missed sales if they cannot deliver their containers to the terminal on time. Those shipping products that require refrigeration (containers called “reefers”) are typically loaded as late as possible to improve the product’s freshness when it arrives overseas or in Alaska or Hawaii. If delays cause those shippers to miss the terminal cut off, the products could be wasted. To assess if and how events in SoDo affect truck activity at the port, gate movement data were obtained for T-46 for three weeks in June 2012 when there were days with and without events at Safeco Field. The Seattle Mariners had three midweek night games (vs. San Diego with first pitch just after 7:00 P.M.) at Safeco Field on Tuesday, June 12 through Thursday, June 14 that had an average attendance of about 14,800 people. These were compared to the following Tuesday through Thursday (June 19 through 21) when there were no Mariners games (road games at Arizona and travel day). Additionally, data were collected for Wednesday, June 27 when the Mariners had a day game that started at 12:40 P.M. (attend-ance was 18,158). During each of these three-day periods, T-46 had three ship calls for which outbound cargo had to arrive by a cut-off day within that period. During the first week (coinciding with the night M’s games), the number of containers expected on those ships was 2,145; during the second week (with no M’s games) the expected container volume was 2,280, and during the third week (with the day M’s game) the expected container volume was 2,925. The average number of gate moves by hour is charted on Figure 9. The chart shows that on days with a Mariners night game, the total number of gate moves was 9% lower than the following week even though the number of containers loaded onto the ship was 6% lower. More trucks arrived at the gate earlier in the morning, but about 20% fewer arrived after 3:00 P.M. on the days with a Mariners game compared to the days with no M’s games. The decrease in volume associated with an M’s day game were even more severe, particularly given that the ship load was about 28% higher compared to the week without an M’s game.

90
5
SEAHAWKSTADIUM
EXHIBITHALL
SAFECOFIELD
S DEARBORN ST
S ATLANTIC ST
AL
AS
KA
NW
AY
S
S ROYALBROUGHAM
S HOLGATE ST
S LANDER ST AIR
PO
RT
WA
YS
S FOREST ST
AL
AS
KA
NW
AY
VIA
DU
CT
S HANFORD ST
S HORTON ST
S SPOKANE ST
BEACONAVE
6TH
AV
ES
MARG
INALW
AY
2ND
AV
E
SW
HA
RB
OR
AV
ES
W
SW SPOKANE ST
SW
AV
AL
ON
WA
Y
WM
AR
GIN
AL
WAY
SW
16T
HA
VE
SW
SW FLORIDA ST
TERMINAL18
TERMINAL5
TERMINAL30
TERMINAL25
TERMINAL46
PIER 48
WEST SEATTLE BRIDGE
COLUM
BIANW
AYINDUSTRIALW
AY
AIR
PO
RT
WA
YS
DENVER
AVES
DIAGONAL AVE S
(UP)ARGO
(BNSF)SIG YARD
S LUCILE ST
S MICHIGAN ST
SC
OR
SO
NA
VE
CA
RLT
ON
AV
ES
S BAILEY ST
AIRPORT
WAY
S
EMARGINAL
WAY
S
BOEINGFIELD
S NEVADA ST
S IDAHO STTERMINAL
107(TRUCK PARKING)
TERMINAL115
SOUTH
GATENORTH
GATE
SR99
4TH
AV
EN
UE
S
1ST
AV
EN
UE
S
DU
WA
MI
SH
WA
TE
RW
AY
E L L I O T T
B A Y
CHELAN AVE
DE
LRID
GE
EA
ST
MA
RG
INA
LW
AY
SWKLICKITAT
AVE
SR509
S HUDSON ST
N
FIGURE 8
PORT TRUCK TRIPS ON MAJOR INTERMODAL &FREEWAY CONNECTOR ROUTES
AVERAGE DAILY TRIPSFUTURE CONDITION WITH 3.5 MILLION TEUs
280
1880
190
790
5401190
180
1860
6920
55802930
3340
1290820
2030
1650
960
2110
990
120
1810
680
40
1810

Impact of a SoDo Arena on Port of Seattle Operations
- 19 - August 7, 2012
These data confirm the anecdotal information provided by trucking firms that serve the Port terminals. They have stated that they closely monitor the event schedules in SoDo. Often, dispatchers will not send trucks to Terminal 46 after 2:30 P.M. when there is an evening Mariners game.17
Figure 9. Effect of Mariners Games on Terminal 46 Gate Moves
Source: Gate move data provided by Total Terminals, Inc., Compiled by Heffron Transportation, Inc.
2.10. How would extended gate hours affect hourly truck volumes?
The typical truck gate at the Port of Seattle operates from 8:00 A.M. through 5:00 P.M. on weekdays. The larger terminals also operate occasional early morning, night or weekend gates when needed. As throughput at the Port of Seattle grows, night gates will be required to accommodate that growth. Night or weekend gates could also be requested by large shipping customers such as big box retailers with 24/7 warehouse operations since overall travel times between the port and their facilities would be less at these times. Detailed analysis about the effect of night gates was performed as part of the Port’s Con-tainer Sustainable Growth Plan Transportation Analysis. It first collected actual volumes for an existing daytime gate operation, and then determined how traffic might shift if night gates are available. Daytime operating conditions were derived from data collected in 2005 at Terminal 18 as part of a City-requested study of the Terminal 18 South Gate. The results were presented in a memorandum entitled: Terminal 18 South Gate, Monitoring of Truck Volumes and Queues.18 As part of this study, SSA provided Turn Time Summary Reports for each day between Monday, October 10 and Friday, October 28, 2005. The data were compiled to determine the total entering volumes by hour of the day, which are shown on Figure 10. The hourly summary is provided for the average of the three-week period as well as for the
17 MacMillan Piper, July 2012. 18 Draft Memorandum, Heffron Transportation, Inc., December 14, 2005.

Impact of a SoDo Arena on Port of Seattle Operations
- 20 - August 7, 2012
peak day. This shows that terminal truck traffic peaks in the morning between 8:00 and 9:00 A.M. and again in the afternoon between 1:00 and 2:00 P.M. The amount of time a truck spends inside the termi-nal ranges from 10 to 20 minutes. Therefore, trucks generally exit the terminal in the same hour that they enter it. The graph below shows that the temporal distribution of truck trips through the gate is similar on an average day and a peak day.
Figure 10. Trucks per Hour Entering Terminal 18 – 2005
Source: Terminal 18 Turn Time Summary Report, provided by SSA. Average of three-week period from October 10
through 28, 2005. The peak volumes are from October 26, 2005. If nighttime gates are operated, they would primarily serve intermodal dray trips being made between the container terminal and the near-dock intermodal terminals at SIG and Argo. Some local and regional traffic could also use the gate at night. The percentage of traffic that could occur during each hour of the day was derived assuming the following:
• 50% of the intermodal traffic would be moved during the night shift, and 50% would be moved during the day shift.
• 10% of local and regional traffic would be moved during the night shift, and 90% would be moved during the day shift.
• The night shift at the Port’s terminals occurs from 6:00 P.M. to 3:00 A.M. It is assumed that the gates would be closed during the hoot shift from 3:00 A.M. to 8:00 A.M.
Figure 11 shows how the percentage of port-generated trucks that pass through the terminal gates each hour would change with night-shift gate operations. There are three critical time periods of interest for
8.7%
4.8%
14.1%
12.2%
5.1%
12.7% 13.0%
0.0%
10.0%
11.6%
13.1%
8.8%
11.2%
0.0%
10.1%
13.1%
8.9%
12.4%
9.3%
3.0%
3.9%
13.6%
0%
2%
4%
6%
8%
10%
12%
14%
16%
7:00
AM
8:00
AM
9:00
AM
10:0
0 AM
11:0
0 AM
12:0
0 PM
1:00
PM
2:00
PM
3:00
PM
4:00
PM
5:00
PM
Average DayPeak Day
Perc
ent I
nbou
nd T
rips

Impact of a SoDo Arena on Port of Seattle Operations
- 21 - August 7, 2012
traffic operations. During the morning commuter peak hour (8:00 to 9:00 A.M.) port truck volumes could decrease from 13% to 8% of the total daily gate volume if night gates are implemented. During the midday terminal peak hour (1:00 to 2:00 P.M.), truck volumes could decrease from 14% to 9% of the daily port traffic, and during the afternoon commuter peak hour (4:00 to 5:00 P.M.), truck volumes could decrease from about 5% to less than 3% of the daily port traffic. It is also noted that about 4% of the trips could occur during the hour when event attendees are leaving the arena at about 10:00 P.M. Night-time terminal operations have the regional benefit of spreading truck travel from peak periods to lesser demand times and utilizing the regional transportation network at times when there is typically excess capacity.
Figure 11. Effect of Night Gates on Hourly Traffic Volumes – Average Day
Source: Heffron Transportation, Inc., May 2006. Daytime gate values from Terminal 18 data (See Figure 10.) Percent-
ages with nighttime gate assume that 50% of intermodal traffic would move during the night shift and 10% of other traffic would move during the night shift. The night shift is from 6:00 P.M. to 3:00 A.M.
The above information was used to derive hourly truck volumes for the Port of Seattle’s container ter-minals. These are presented in Table 3 for several conditions. As with prior analyses both by the Port and other entities, it is recommended that the arena EIS utilize the “peak season” volumes listed be-low to evaluate traffic mitigation needs.
0%
2%
4%
6%
8%
10%
12%
14%
16%
18%
20%
12:0
0 AM
1:00
AM
2:00
AM
3:00
AM
4:00
AM
5:00
AM
6:00
AM
7:00
AM
8:00
AM
9:00
AM
10:0
0 AM
11:0
0 AM
12:0
0 PM
1:00
PM
2:00
PM
3:00
PM
4:00
PM
5:00
PM
6:00
PM
7:00
PM
8:00
PM
9:00
PM
10:0
0 PM
11:0
0 PM
Day Gate OnlyWith Night Shift Gates
Morning Commuter Peak Hour Trips Reduced from 13% to 8% of Daily Traffic
Terminal Peak Hour Trips Reduced from 14% to 9% of Daily Traffic
Afternoon Commuter Peak Hour Trips Reduced from 5% to less than 3% of Daily Traffic
Perc
ent o
f Dai
ly T
ruck
Trip
s

Impact of a SoDo Arena on Port of Seattle Operations
- 22 - August 7, 2012
Table 3. Peak Hour Truck Trips Generated by Port of Seattle at 3.5 Million TEUs/Year
Average Day Day in the Peak Season (August)a Trip Origin/Destination Day Gates Only With Night Gates Day Gates Only With Night Gates
Commuter AM Peak Hour (7 – 8 AM)
To/from Near-Dock Rail Yards 850 420 950 470
To/ from Local or Regional Businesses 650 580 730 650
Total 1,500 1,000 1,680 1,120
Midday Terminal Peak Hour (1 – 2 PM)
To/from Near-Dock Rail Yards 920 460 1,030 520
To/ from Local or Regional Businesses 700 610 780 680
Total 1,620 1,070 1,810 1,200
Commuter PM Peak Hour (4 – 5 PM)
To/from Near-Dock Rail Yards 330 160 370 180
To/ from Local or Regional Businesses 250 130 280 150
Total 580 290 650 320
Evening Peak Hour (7 – 8 PM and 10-11 PM)
To/from Near-Dock Rail Yards 0 540 0 600
To/ from Local or Regional Businesses 0 200 0 220
Total 0 740 0 820
Total Daily Traffic (24 hours)
To/from Near-Dock Rail Yards 6,510 6,510 7,300 7,300
To/ from Local or Regional Businesses 4,930 4,930 5,500 5,500
Total 11,440 11,440 12,800 12,800 Source: Heffron Transportation, Inc., May 2006. a. Assumes that peak season volume is 12% higher than average.

Impact of a SoDo Arena on Port of Seattle Operations
- 23 - August 7, 2012
3. TRANSPORTATION ISSUES 3.1. Where are the local bottlenecks?
The last comprehensive analysis for traffic operations in the SoDo area was performed as part of the Alaskan Way Viaduct Replacement Project Supplemental EIS.19 That analysis accounted for all of the new infrastructure investments that have or are being made in the area: the new I-90 ramps to SR-519, the grade-separated roadway at Royal Brougham Way, the Holgate-to-King Street project with “Little h” that separates Atlantic Street traffic from the railroad tail track, and improvements to Spokane Street. It also included the new SR-99 Bored Tunnel and new ramps in the SoDo area. Even with all of those projects, the analysis showed that the intersection at 1st Avenue S/S Atlantic Street would continue to experience severe congestion on non-event days reflected by the level of service (LOS) F rating.20 Several intersections along the Fourth Avenue S corridor would also operate at LOS F conditions including those at S Holgate Street and S Royal Brougham Way. The analysis did not account for the diversion impact of tolling on SR-520, which is evident today. Nor did the analysis account for the effects of tolling SR-99, which is expected to add traffic to arterials through SoDo as well as to the streets around the South Portal of the Bored Tunnel. Although no specific event analysis was prepared for the bored tunnel portion of the SR-99 Replacement Program, the report did state that, “sporting and other major events at Safeco Field and Qwest Field would likely continue to draw large crowds and result in high concentrations of traffic movements into and out of the stadium area before and after events. Regardless of the regional connections in place, vehicular and pedestrian-related congestion associated with such events would be managed in a manner similar to current practices in terms of detours, traffic control, and turning movement restrictions.”21 Thus, even though the new stadium district overlay was in place, none of the agencies involved contem-plated traffic associated with a third sports venue. Of particular concern to the Port of Seattle are the event impacts to Terminals 25/30 and 46, which are located along East Marginal Way (EMW). For these terminals, the most direct route for truck traffic to and from the north on Interstate 5 (I-5) or the east on Interstate 90 is to use SR-519 (Edgar Martinez Drive and S Atlantic Street). A new overpass of the SIG Yard tail track is being constructed on that route as part of the AWV Replacement Program. There are no other direct routes to East Marginal Way that avoid crossing the railroad tracks. Exiting I-5 to Forest Street, which only serves southbound traffic, requires crossing both the BNSF Mainline tracks and SIG Yard tracks, and trucks that use the Spokane Street Viaduct would have to U-turn on Harbor Island to access East Marginal Way. The additional event-related congestion along SR-519 would add delay to truck movements by clogging the primary access route or causing trucks to divert to much less direct routes.
19 SR 99 Alaskan Way Viaduct Replacement Project Final EIS, Transportation Discipline Report; WSDOT, FHWA,
SDOT, Parsons Brinckerhoff; July 2011. Table 5-27. 20 Level of service is a qualitative measure used to characterize traffic operating conditions. Six letter designations,
“A” through “F,” are used to define level of service. LOS A is the best and represents good traffic operations with little or no delay to motorists. LOS F is the worst and indicates poor traffic operations with long delays.
21 Page 5-144

Impact of a SoDo Arena on Port of Seattle Operations
‐ 24 ‐ August 7, 2012
3.2. How do existing events affect Interstates 5 and 90?
The King County Council’s Expert Review Panel report on Transportation Issues recommended that the SEPA analysis for a new arena include analysis to determine how a new arena would affect the regional transportation corridors, especially Interstates 5 and 90. The experts’ high‐level analysis22 showed that an evening event does increase travel times during the evening commute times between 3:00 and 7:00 P.M. Some additional data were collected at a permanent traffic counter on I‐90 at milepost 2.78, which is just west of the split to I‐5 and includes traffic destined to both S Atlantic Street and 4th Avenue S. Figure 12 shows the westbound I‐90 traffic entering the SoDo area for a Friday in June without a Mariners game and a Friday with a Mariners game. Friday was chosen because the attendance at Safeco Field was 21,000, which would generate similar trips as the arena estimated for its events. The chart shows that event traffic coming into the SoDo area starts to build in the early afternoon with increases of 20% to 30% before 5:00 P.M.
Figure 12. Westbound Traffic on I‐90 at Milepost 2.78 Without and With a Mariners Game
Source: Data obtained from WSDOT Traffic Count Database. Attendance at the June 8, 2012 Mariners Game was 21,255.
22 Charlie Howard and Doug MacDonald, Undated. Released 7/11, presented to County Council 7/12.

Impact of a SoDo Arena on Port of Seattle Operations
- 25 - August 7, 2012
3.3. Why is the Holgate Street RR crossing a concern to the Port?
The new arena site fronts on S Holgate Street, a roadway that is crossed by 17 railroad tracks between 1st and 4th Avenues. It is one of only six east-west streets that connect 1st and 4th Avenues in the SoDo neighborhood (the others are Royal Brougham Way, Edgar Martinez Drive, S Lander Street, S Horton Street, and S Spokane Street). In 2003, it was recommended for closure by the WSDOT Rail Office to eliminate railroad conflicts.23 A 2010 study24 prepared for Seattle Department of Transportation (SDOT) determined that a closure would have detrimental traffic operations effects on other streets in SoDo and recommended keeping the street open to vehicular and pedestrian movements. The report’s con-clusions stated,
Unlike many commercial areas of the City, the SoDo area does not have a traditional street grid network. In particular, the number of east-west arterials in this area is limited. A re-cent decision to construct a grade-separated structure over the railroad tracks on Royal Brougham Way S will further constrain the east-west traffic movements. In 2008, S Hol-gate Street carried about 12,000 vehicles per day. The closure of S Holgate Street would not shift this amount of traffic to just one street such as S Atlantic Street, but the impact of the street closure would be felt throughout the area.
Train operations on these tracks include a mix of switching maneuvers to, within, and from the Amtrak yards as well as higher-speed passenger and freight trains on the BNSF Railway’s mainline tracks. It is expected that the new arena would substantially increase pedestrian and vehicular traffic across these tracks, and most of those movements would occur in the evening before the event or at night after the event—times that for most of the basketball season are after sunset. The crossings are now controlled by several gate systems, and many vehicles and pedestrians often get trapped between gates on the tracks. There is also a slight angle to the road crossing where the mainline tracks cross S Holgate Street and it is difficult for a pedestrian to discern which tracks may be in use by an approaching train. SDOT’s 2010 Holgate Street study recommended many safety improvements in this section. These include:
• Consolidate crossing gates to prevent vehicles from queuing up at one gate and extending back into the next gate.
• Install quad-gates to prevent a vehicle from going around the gate.
• Complete gaps in the sidewalk system.
• Add crossing gates for pedestrians to each quad-gate to prevent pedestrians from crossing the tracks when a train is approaching.
• Provide raised medians with a pedestrian refuge. The raised medians would provide a space for them to wait for adequate breaks between vehicles on S Holgate Street, and additionally, create conditions where they only need to cross half of the street at a time.
• Add U-turn routes so that vehicles waiting for a train could choose an alternative route.
• Provide electronic message signs for drivers on area arterials to show when the train gates are down and provide an indication of how long the gates may be closed.
23 WSDOT, S Holgate Street Railway Crossing Closure Traffic Study, 2003. 24 Fehr & Peers for SDOT, South Holgate Street Railroad Crossing Study, Phase II, Final Report; January 2010.
Impact of a SoDo Arena on Port of Seattle Operations
- 26 - August 7, 2012
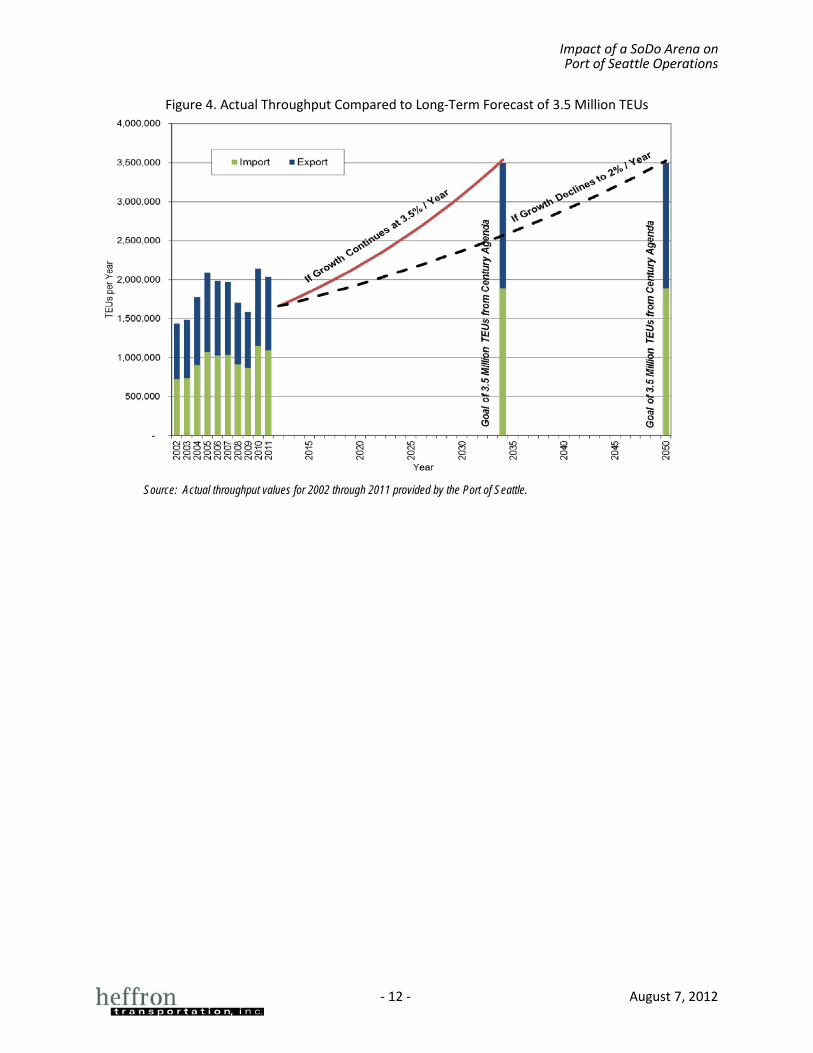
The proposed arena may also need additional safety enhancements to deal with the surge of both pedestrian and vehicular traffic following an event. The proposed arena’s EIS should include evaluating the size of the areas needed for pedestrians to wait for a passing train. It should also evaluate how train blockages would affect ingress and egress for events. Of particular concern would be the proposed road on the east side of the arena that is intended to replace the function of Occidental Avenue S in providing access to and from the Safeco garage. The new road would intersect S Holgate Street adjacent to Amtrak’s Coach Yard with its multiple service tracks and the BNSF mainline through SoDo (see photo above), and the surge of traffic egressing the Safeco Field garage would be impacted by train crossings. Even with all of these additional safety features, past experience with the tracks that crossed Royal Brougham Way on the north side of Safeco Field, which were many fewer in number, found that pedes-trians often ignored gates when they were down and collisions did occur.25 It was one of the reasons why Royal Brougham Way is now grade-separated from the tracks for both pedestrian and vehicular movements. However, past studies have indicated that it is would not be feasible (or at least would be cost-prohibitive) to separate vehicular traffic from the railroad tracks at S Holgate Street.26 Increased pedestrian and vehicular crossing associated with the proposed arena will increase pressure to close S Holgate Street, especially before and after events. This would increase congestion at other crossings and intersections throughout the SoDo area. Therefore, the arena EIS should determine whether the railroad crossings of both the mainline and service tracks at S Holgate Street can be managed in a way that is both safe and provides needed east-west capacity for vehicles and pedestrians.
25 “Train accident was fourth near ballpark since 2000,” Seattle Times article, October 2, 2007. 26 City of Seattle, Access Duwamish, June 2000.
Source: Amtrak

Impact of a SoDo Arena on Port of Seattle Operations
- 27 - August 7, 2012
4. ANALYSIS THAT THE ARENA NEEDS TO PERFORM 4.1. What did the other stadium EIS documents evaluate?
Extensive transportation and parking analyses were performed as part of the EIS documents for the Kingdome, Safeco Field, CenturyLink Field and Key Arena. The types of analyses performed are summa-rized in Table 4.

Impact of a SoDo Arena on Port of Seattle Operations
- 28 - August 7, 2012
Table 4. Transportation and Parking Analyses in other EISs
Type of Analysis Safe
co
Fiel
d a
Cent
ury
Li
nk F
ield
b
Key
Aren
a c
Documentation of Existing Conditions (Affected Environment) Existing street systems √ √ √ Existing traffic volumes √ √ √ Comparison of event and non-event day traffic volumes √ Existing intersection operations (level of service) √ √ √ Existing arterial level of service or travel route analysis √ √ Event traffic control review √ Site access and circulation √ √ √ Traffic safety review √ √ √ Pedestrian and bicycle facility inventory √ √ √ Freight movement (train, railyards, trucks, loading) √ √ √ Parking supply inventory and demand counts √ √ √ Transit service, ferry service and passenger rail √ √ √ Neighborhood issues √ Consumer show operations √
Impact Analysis Construction traffic and parking impacts √ √ Comparative event activity levels √ Determination of design day event √ Trip generation for multiple operating conditions √ √ √ Intersection operations with multiple operating conditions √ √ √ Arterial or travel route operations with multiple operating conditions √ √ Circulation and access to parking facilities √ √ √ Traffic safety analysis √ √ √ Pedestrian and bicycle travel √ √ √ Freight impacts √ √ √ Parking impacts √ √ √ Transit service, ferry service and passenger rail √ √ √
Number of sites evaluated 4 2 n/a
Number of intersections evaluated 31 54 15
Number of arterial corridors or travel routes evaluated 5 6 -- Sources: a. Draft Environmental Impact Statement, Washington State Major League Baseball Stadium Project, Issued by Washington State Major
League Baseball Stadium Public Facilities District, May 29, 1996. b. Football / Soccer Stadium and Exhibition Center DEIS, Appendix M-1 (Transportation), The Transpo Group, January 15, 1998. c. Coliseum Renovation, Draft and Final Supplemental Environmental Impact Statement, December 1992. n/a Not applicable since the EIS was only for the renovation of the coliseum.

Impact of a SoDo Arena on Port of Seattle Operations
- 29 - August 7, 2012
4.2. What are the flaws of the arena’s traffic study?
As outlined on page one of the Seattle Arena Multimodal Transportation Access and Parking Study,27 that analysis was not a comprehensive technical analysis and it states that:
“An expanded transportation and parking impact analysis would be required as part of a more detailed project review to comply with the State Environmental Policy Act (SEPA). This phase of work will assess the degree to which the existing and planned transportation and parking infrastructure in the area would accommodate the new sports arena.”
The Arena Study was very simplistic compared to the EIS analyses that were performed for the Kingdome, Safeco Field, CenturyLink Field, and Key Arena. Its primary focus was estimating the number of event days, concurrent event days, and potential trips. The study provided no actual analysis of traffic operational impacts, safety impacts, transit impacts, parking impacts or freight impacts, nor did the study recommend any mitigation measures. The Arena Study made several assumptions and drew conclusions that are flawed, including:
• The Arena Study concluded that POS terminal hours do not coincide with evening events. This is not true as the Port’s tenants do operate night gates on occasion, and will do so more often in the future as container volumes increase. Port trucks and event attendees travel times were detailed in Sections 2.9 and 2.10 above.
• The study implies that since “the majority of event traffic would be on or east of 1st Avenue S. and the majority of POS operations are moving freight between container terminal and rail yards, west of 1st Avenue S, POS operations are effectively separated from event traffic.” This is not true—freight traffic does use many streets east of 1st Avenue S and event traffic does use streets west of 1st Avenue S. More detail is provided below.
• The study assumes that Friday is a weekend, but it is a regular workday for the Port terminals and other businesses in SoDo, and the impacts that occur on a Friday must be considered as a weekday impact.
• The Arena Study’s parking analysis states that there is enough parking to accommodate even the dual-event scenario. However, the number of spaces stated in the study reflects the total supply and not what is actually available for event attendees, nor its dispersed nature or the impacts of varied pricing. There are many businesses in SoDo, including the Port terminals, for which employees need nighttime parking for early or late shifts. Event traffic management plans often remove on-street parking which further exacerbates the parking impact. The study must consider the true parking impact of dual events.
• The referenced transit capacity will not all be available at the opening projected to occur in 2016, a point made subtly in the study. Similarly, the East Link’s most southerly station would be the International District, not the Stadium station, noted to be a 2/3 mile distance. While the study asserts a number of transit seats available after games, how that number is derived is not clear, given the lack of evening bus and transit operations and the fact that those buses already carry non-event passengers. Finally, the study has no analysis about the types of improvements needed along the walking route to these distant transit stations, or whether event patrons could feasibly be shuttled to the transit stations given the surge after an event.
27 Parametrix, Inc., May 23, 2012.

Impact of a SoDo Arena on Port of Seattle Operations
- 30 - August 7, 2012
The Arena Study’s assumption that POS operations are all west of 1st Avenue S may be true for most import containers for which 60% to 70% are “intermodal”—destined to travel via rail to the Midwest. These containers are trucked to the nearby rail yards. However, over half of all export cargo—most of which arrives from Washington State and the Pacific Northwest—is trucked to the terminal. This means that roughly 30% of import containers and 50% of export containers are trucked east of 1st Avenue S. Some is traveling to or from freight stations throughout the Duwamish (such as MacMillan-Piper, NW Container, Pacer and PCC Logistics) and some is destined to the highway system, directly accessed via Edgar Martinez Drive, Spokane Street or south on East Marginal Way. Further, existing event traffic does not stay on or east of 1st Avenue S, but frequently uses East Marginal Way, Hanford, Spokane, Atlantic and other Duwamish routes adding congestion on freight routes.
4.3. What should be evaluated in an EIS for potential arena?
Detailed analysis must be performed as part of an Environmental Impact Statement (EIS) to address the policy, safety, and operational concerns. This study should evaluate viable alternative sites so that the true impacts of the arena on Port operations can be assessed. For the SoDo site, the King County Council’s Expert Review Panel issued a report on transportation issues.28 That report also recommended additional analysis to fill the “chief gaps in the information so far developed.” Those gaps were listed as:
1. What will be the effect of the arena proposal on regional transportation corridors, especially I-5 and I-90?
2. What will be the effect of arena-related traffic on freight mobility in the SoDo and Duwamish area—and the significant economic and job interest tied to them—both apart from the Port of Seattle and including the Port?
3. What additional traffic generating features (other land uses) are currently being planned as part of the arena development?
4. What are the likely effects of the proposal on air quality in the SoDo area? The EIS analysis should also address the Port of Seattle’s additional concerns. These include:
5. How will additional events and concurrent events (including professional basketball, profes-sional hockey, other sporting events, family shows, concerts, graduations, and civic and other events) affect congestion, travel time and travel time reliability on the Port’s primary access routes?
6. How will the vacation of Occidental Avenue S and S Massachusetts Street affect congestion and travel time on the Port’s primary access routes, on both event and non-event days?
7. How will changes in land use affect operations in the industrial area, including operations related to noise, light, and air quality?
28 Charlie Howard and Doug MacDonald, Undated. Released 7/11, presented to County Council 7/12

Impact of a SoDo Arena on Port of Seattle Operations
- 31 - August 7, 2012
8. What is the impact of train blockages on Holgate on the ability of the arena to load/unload both patrons on foot and those using the proposed garage? How will the resulting congestion impact the area?
9. How will additional arena event-related pedestrian crossings of area railroad tracks be accommodated and what are the potential impacts to pedestrian safety and rail operations?
10. What mitigation is needed to maintain acceptable operating conditions along the Port’s primary access routes and to address safety concerns at the railroad crossings?
Table 5 outlines some of the key transportation analysis measures to address the information gaps. Because travel time is an important factor in all freight operations, the effect of an action are often measured in terms of net change in annual vehicle-hours of delay. This has been used to evaluate the cost-benefit of many infrastructure projects in SoDo, particularly the grade-separation projects such as SR-519 and Royal Brougham Way. This measure would address the cumulative effect of additional event days. It is listed as an analysis measure for several key elements. Potential mitigation measures to consider are also listed.

Impact of a SoDo Arena on Port of Seattle Operations
August 7, 2012
Table 5. Transportation Analysis Needs for New Arena EIS
Concern Performance measures to evaluate Potential Mitigation if Performance is not acceptable
A. Effect on regional highways (I-5 and I-90)
• Net change in peak period and early afternoon travel time related to single event and concurrent event day.
• Net change in annual vehicle hours of delay for base and banner year conditions. • Variability in delay created by event traffic (a measure of system reliability)
• Restrictions on concurrent events such as staggered starts or weekends only.
• Improved signage to alternative routes
B. Effect on primary access routes to Port terminals
• Level of service analysis for key intersections in SoDo for the commuter peak hour, pre-event arrival peak, and post-event egress peak. The following should be evaluated: -- 1st Ave S/S Atlantic St -- 1st Ave S/S Royal Brougham Wy -- 1st Ave S/S Mass. St -- 1st Ave S/S Holgate St -- 1st Ave S/S Lander St -- 1st Ave S/S Spokane St -- 4th Ave S/SR-519 Ramps -- 4th Ave S/I-90 Off-ramp --4th Ave S/S Holgate Street --S Atlantic St/SR-99 East Frontage Rd --S Atlantic St/Colorado Ave/Little “h” cluster
• Effect that rerouting event traffic to the Spokane Street Viaduct would have on access to Terminals 5 and 18 as well as to the SIG Yard.
• Net change in delay related to single-event and concurrent-event day. • Net change in annual vehicle hours of delay for base and banner year conditions. • Variability in delay created by event traffic (a measure of system reliability)
• Restrictions on concurrent events such as staggered starts or weekends only.
• Locate new parking to reduce traffic along the Port’s primary routes (e.g., garage located east of tracks).
• Event traffic management plans that provide priority for truck traffic.
• Infrastructure improvements • Parking management measures and technologies
that better allow attendees to find and pay for parking before events
• Pedestrian access and control management measures that improve safety and traffic flow through key intersections
C. Effect of street vacations • Peak period and early afternoon level of service analysis for key intersections listed above to determine Net change in delay without and with the street vacations.
• Net change in annual vehicle hours of delay for base and banner year conditions. • Variability in delay created by street vacation(s) and event traffic (a measure of
system reliability)
• Same as above
D. Safety of RR Crossings • Net change in pedestrians and vehicles crossing tracks at S Holgate Street. • Frequency and duration of train blockages at the at-grade crossings • Historic rail-vehicle and rail-pedestrian collisions in SoDo (all crossings) • Safety analysis of RR crossing • Pedestrian storage needs when waiting for a train • Effect of additional queues, delays or safety issues on the potential to close S
Holgate Street during events or permanently
• Safety enhancements including improved side-walks, gates, lights, pedestrian landings and other features.
• Active police management before and after events • Alternative east-west vehicle crossing • Grade-separated pedestrian crossing