Embed Size (px)
Citation preview
RESEARCH ARTICLE
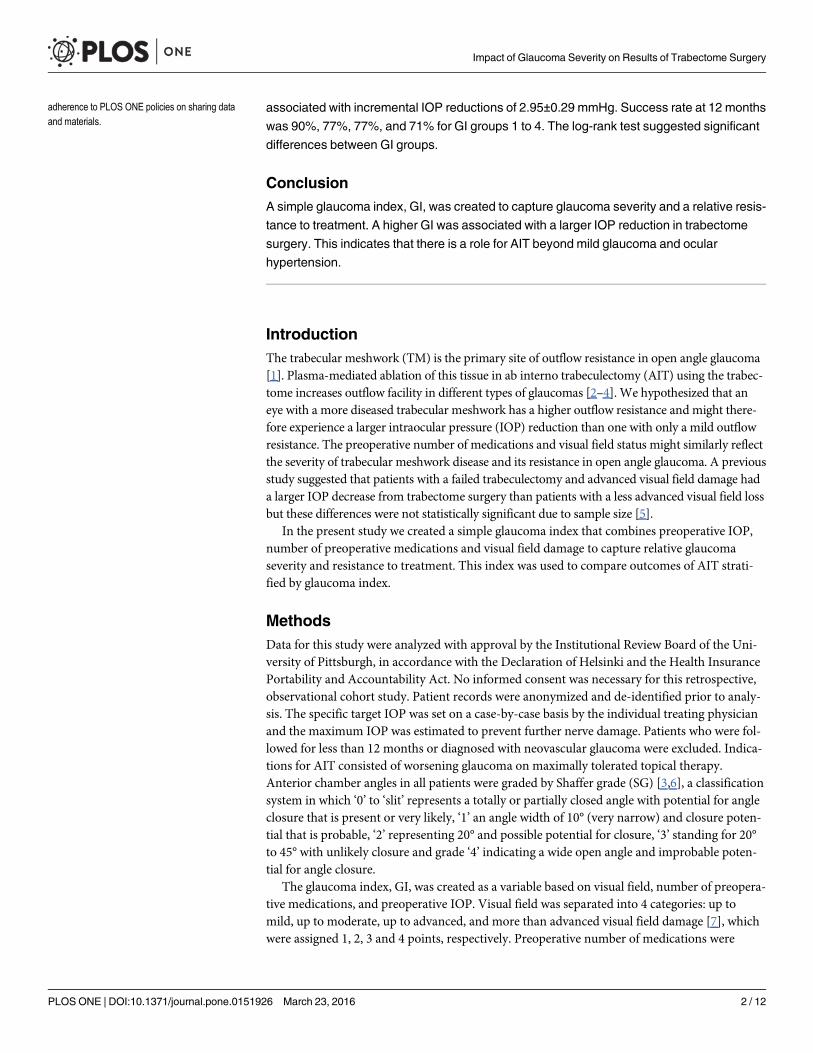
Impact of a Glaucoma Severity Index onResults of Trabectome Surgery: LargerPressure Reduction in More Severe GlaucomaRalitsa T. Loewen, Pritha Roy, Hardik A. Parikh, Yalong Dang, Joel S. Schuman, NilsA. Loewen*
Department of Ophthalmology, School of Medicine, University of Pittsburgh, Pittsburgh, Pennsylvania, UnitedStates of America
Abstract
Purpose
To stratify outcomes of trabectome-mediated ab interno trabeculectomy (AIT) by glaucoma
severity using a simple and clinically useful glaucoma index. Based on prior data of trabec-
tome after failed trabeculectomy, we hypothesized that more severe glaucoma might have
a relatively more reduced facility compared to mild glaucoma and respond with a larger IOP
reduction to trabecular meshwork ablation.
Methods
Patients with primary open angle glaucoma who had undergone AIT without any other
same session surgery and without any second eye surgery during the following 12 months
were analyzed. Eyes of patients that had less than 12 months follow up or were diagnosed
with neovascular glaucoma were excluded. A glaucoma index (GI) was created to capture
glaucoma severity based on visual field, number of preoperative medications, and preoper-
ative IOP. Visual field (VF) was separated into 3 categories: mild, moderate, and advanced
(assigned 1, 2, and 3 points, respectively). Preoperative number of medications (meds) was
divided into 4 categories:�1, 2, 3 or�4, and assigned with a value of 1 to 4. Baseline IOP
(IOP) was divided into 3 categories: <20 mmHg, 20–29 mmHg, and greater than 30 mmHg
and assigned with 1 to 3 points. GI was defined as IOP × meds × VF and separated into 4
groups: <6 (Group 1), 6–12 (Group 2), >12–18 (Group 3) and >18 (Group 4). Linear regres-
sion was used to determine if there was an association between GI group and IOP reduction
after one year or age, gender, race, diagnosis, cup to disc (C/D) ratio, and Shaffer grade.
Results
Out of 1340 patients, 843 were included in the analysis. The GI group distribution was GI1 =
164, GI2 = 202, GI3 = 260, and GI4 = 216. Mean IOP reduction after one year was 4.0±5.4,
6.4±5.8, 9.0±7.6, 12.0±8.0 mmHg for GI groups 1 to 4, respectively. Linear regression
showed that IOP reduction was associated with GI group after adjusting for age, gender,
race, diagnosis, cup to disc ratio, and Shaffer grade. Each GI group increase of 1 was
PLOSONE | DOI:10.1371/journal.pone.0151926 March 23, 2016 1 / 12
OPEN ACCESS
Citation: Loewen RT, Roy P, Parikh HA, Dang Y,Schuman JS, Loewen NA (2016) Impact of aGlaucoma Severity Index on Results of TrabectomeSurgery: Larger Pressure Reduction in More SevereGlaucoma. PLoS ONE 11(3): e0151926. doi:10.1371/journal.pone.0151926
Editor: Ted S Acott, Casey Eye Institute, UNITEDSTATES
Received: October 30, 2015
Accepted: March 7, 2016
Published: March 23, 2016
Copyright: © 2016 Loewen et al. This is an openaccess article distributed under the terms of theCreative Commons Attribution License, which permitsunrestricted use, distribution, and reproduction in anymedium, provided the original author and source arecredited.
Data Availability Statement: All relevant data arewithin the paper and its Supporting Information files.
Funding: This work was funded by a Research toPrevent Blindness Departmental Grant and anIndividual Grant from the Department ofOphthalmology, University of Pittsburgh. The sponsoror funding organization had no role in the design orconduct of this research.
Competing Interests: NAL has received honorariafor wetlabs and lectures as a MIGS trainer fromNeomedix Inc. This does not alter the authors'
associated with incremental IOP reductions of 2.95±0.29 mmHg. Success rate at 12 months
was 90%, 77%, 77%, and 71% for GI groups 1 to 4. The log-rank test suggested significant
differences between GI groups.
Conclusion
A simple glaucoma index, GI, was created to capture glaucoma severity and a relative resis-
tance to treatment. A higher GI was associated with a larger IOP reduction in trabectome
surgery. This indicates that there is a role for AIT beyond mild glaucoma and ocular
hypertension.
IntroductionThe trabecular meshwork (TM) is the primary site of outflow resistance in open angle glaucoma[1]. Plasma-mediated ablation of this tissue in ab interno trabeculectomy (AIT) using the trabec-tome increases outflow facility in different types of glaucomas [2–4]. We hypothesized that aneye with a more diseased trabecular meshwork has a higher outflow resistance and might there-fore experience a larger intraocular pressure (IOP) reduction than one with only a mild outflowresistance. The preoperative number of medications and visual field status might similarly reflectthe severity of trabecular meshwork disease and its resistance in open angle glaucoma. A previousstudy suggested that patients with a failed trabeculectomy and advanced visual field damage hada larger IOP decrease from trabectome surgery than patients with a less advanced visual field lossbut these differences were not statistically significant due to sample size [5].
In the present study we created a simple glaucoma index that combines preoperative IOP,number of preoperative medications and visual field damage to capture relative glaucomaseverity and resistance to treatment. This index was used to compare outcomes of AIT strati-fied by glaucoma index.
MethodsData for this study were analyzed with approval by the Institutional Review Board of the Uni-versity of Pittsburgh, in accordance with the Declaration of Helsinki and the Health InsurancePortability and Accountability Act. No informed consent was necessary for this retrospective,observational cohort study. Patient records were anonymized and de-identified prior to analy-sis. The specific target IOP was set on a case-by-case basis by the individual treating physicianand the maximum IOP was estimated to prevent further nerve damage. Patients who were fol-lowed for less than 12 months or diagnosed with neovascular glaucoma were excluded. Indica-tions for AIT consisted of worsening glaucoma on maximally tolerated topical therapy.Anterior chamber angles in all patients were graded by Shaffer grade (SG) [3,6], a classificationsystem in which ‘0’ to ‘slit’ represents a totally or partially closed angle with potential for angleclosure that is present or very likely, ‘1’ an angle width of 10° (very narrow) and closure poten-tial that is probable, ‘2’ representing 20° and possible potential for closure, ‘3’ standing for 20°to 45° with unlikely closure and grade ‘4’ indicating a wide open angle and improbable poten-tial for angle closure.
The glaucoma index, GI, was created as a variable based on visual field, number of preopera-tive medications, and preoperative IOP. Visual field was separated into 4 categories: up tomild, up to moderate, up to advanced, and more than advanced visual field damage [7], whichwere assigned 1, 2, 3 and 4 points, respectively. Preoperative number of medications were
Impact of Glaucoma Severity on Results of Trabectome Surgery
PLOS ONE | DOI:10.1371/journal.pone.0151926 March 23, 2016 2 / 12
adherence to PLOS ONE policies on sharing dataand materials.
divided into 4 categories: 0–1, 2, 3 or 4+, and assigned with a value of 1 to 4, respectively. Base-line IOP was divided into 3 categories: <20 mmHg, 20–29 mmHg, 30–39 mmHg, and greaterthan 40 mmHg and assigned with 1 to 4 points, respectively. These categories were chosenbased on IOP distribution and designed not to underrate low pressure glaucoma. GI was thendefined as preoperative IOP × preoperative number of medications × VF. GI was separatedinto 4 groups:<6 (Group 1), 6–12 (Group 2),>12–18 (Group 3) and>18 (Group 4). A powercalculation indicated that 82 patients would allow to detect a GI group IOP difference or 3mmHg for a medium-sized effect of 0.3 with a power of 80%. Linear regression was used todetermine if there was an association between GI group and IOP reduction after one year. Anidentical analysis was performed only for patients with primary open angle glaucoma.
Baseline characteristics were compared by the Kruskal-Wallis and chi square tests for con-tinuous and categorical variables between GI groups, respectively. Univariate linear regressionwas performed first and those variables that were found to be statistically significant wereincluded into multivariate regression. The term “success rate” was used here instead of the sta-tistics term “survival” and defined as IOP�21 mmHg, at least 20% IOP reduction from baselinein any two consecutive visits after three months, and no secondary glaucoma or lens surgery.Log-rank test was used to compare success distributions of GI groups. Continuous data wasreported as mean ± standard deviation.
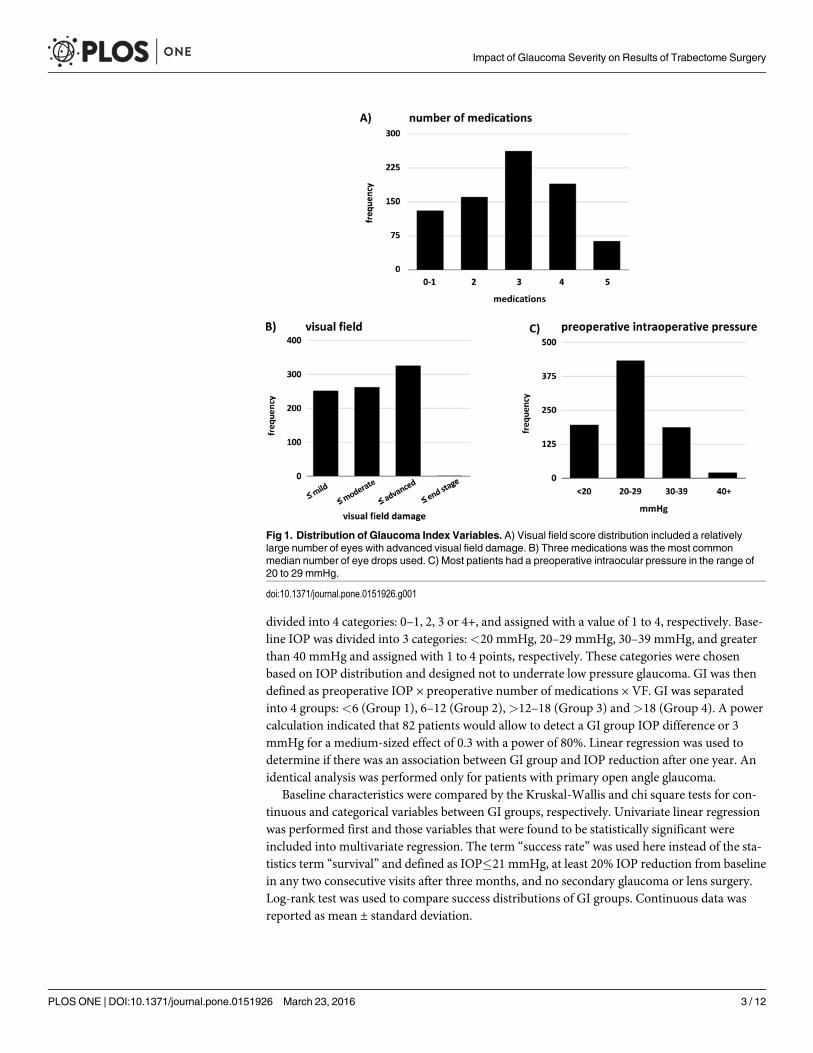
Fig 1. Distribution of Glaucoma Index Variables. A) Visual field score distribution included a relativelylarge number of eyes with advanced visual field damage. B) Three medications was the most commonmedian number of eye drops used. C) Most patients had a preoperative intraocular pressure in the range of20 to 29 mmHg.
doi:10.1371/journal.pone.0151926.g001
Impact of Glaucoma Severity on Results of Trabectome Surgery
PLOS ONE | DOI:10.1371/journal.pone.0151926 March 23, 2016 3 / 12
ResultsA total of 842 eyes were analyzed. The average age of all patients was 66.4±15.8 years. Variablesused to compute GI were 1) preoperative IOP, 2) preoperative number of medications and 3)visual field status. The average preoperative IOP for all patients was 25.1±6.7 mmHg, the aver-age medication count was 2.9±1.0 and the most common visual field was advanced. The base-line IOP categories were chosen as described above because of the distribution (Fig 1).
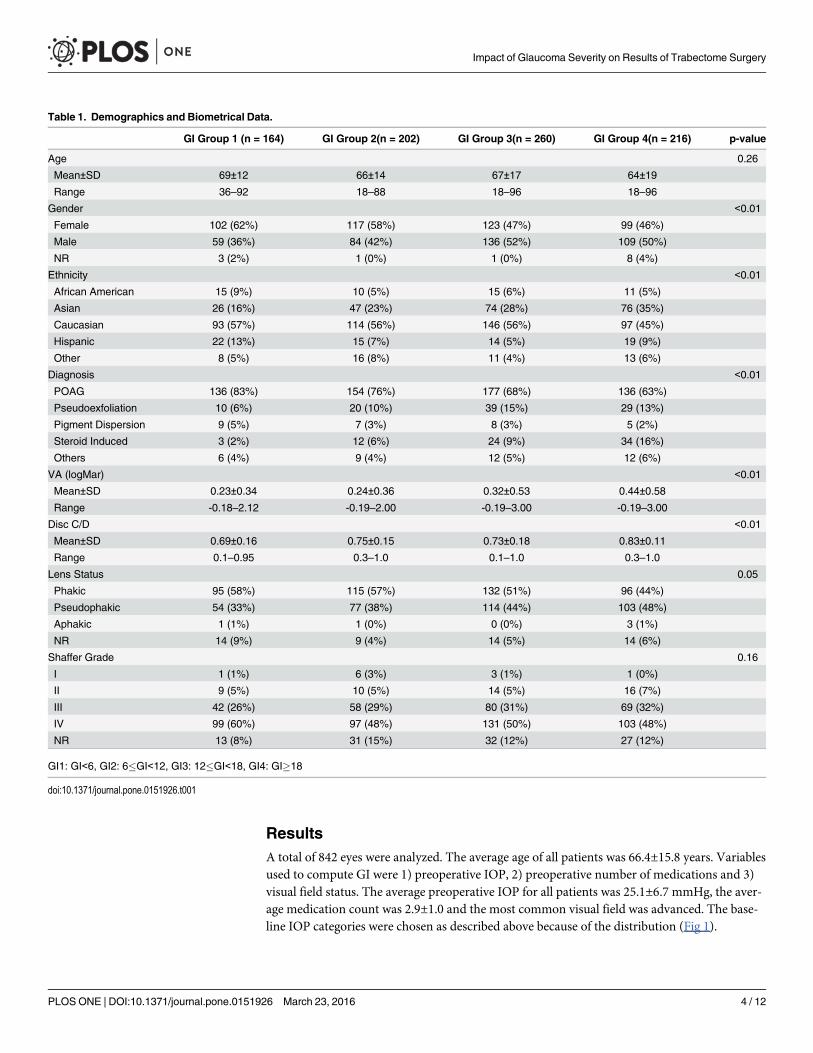
Table 1. Demographics and Biometrical Data.
GI Group 1 (n = 164) GI Group 2(n = 202) GI Group 3(n = 260) GI Group 4(n = 216) p-value
Age 0.26
Mean±SD 69±12 66±14 67±17 64±19
Range 36–92 18–88 18–96 18–96
Gender <0.01
Female 102 (62%) 117 (58%) 123 (47%) 99 (46%)
Male 59 (36%) 84 (42%) 136 (52%) 109 (50%)
NR 3 (2%) 1 (0%) 1 (0%) 8 (4%)
Ethnicity <0.01
African American 15 (9%) 10 (5%) 15 (6%) 11 (5%)
Asian 26 (16%) 47 (23%) 74 (28%) 76 (35%)
Caucasian 93 (57%) 114 (56%) 146 (56%) 97 (45%)
Hispanic 22 (13%) 15 (7%) 14 (5%) 19 (9%)
Other 8 (5%) 16 (8%) 11 (4%) 13 (6%)
Diagnosis <0.01
POAG 136 (83%) 154 (76%) 177 (68%) 136 (63%)
Pseudoexfoliation 10 (6%) 20 (10%) 39 (15%) 29 (13%)
Pigment Dispersion 9 (5%) 7 (3%) 8 (3%) 5 (2%)
Steroid Induced 3 (2%) 12 (6%) 24 (9%) 34 (16%)
Others 6 (4%) 9 (4%) 12 (5%) 12 (6%)
VA (logMar) <0.01
Mean±SD 0.23±0.34 0.24±0.36 0.32±0.53 0.44±0.58
Range -0.18–2.12 -0.19–2.00 -0.19–3.00 -0.19–3.00
Disc C/D <0.01
Mean±SD 0.69±0.16 0.75±0.15 0.73±0.18 0.83±0.11
Range 0.1–0.95 0.3–1.0 0.1–1.0 0.3–1.0
Lens Status 0.05
Phakic 95 (58%) 115 (57%) 132 (51%) 96 (44%)
Pseudophakic 54 (33%) 77 (38%) 114 (44%) 103 (48%)
Aphakic 1 (1%) 1 (0%) 0 (0%) 3 (1%)
NR 14 (9%) 9 (4%) 14 (5%) 14 (6%)
Shaffer Grade 0.16
I 1 (1%) 6 (3%) 3 (1%) 1 (0%)
II 9 (5%) 10 (5%) 14 (5%) 16 (7%)
III 42 (26%) 58 (29%) 80 (31%) 69 (32%)
IV 99 (60%) 97 (48%) 131 (50%) 103 (48%)
NR 13 (8%) 31 (15%) 32 (12%) 27 (12%)
GI1: GI<6, GI2: 6�GI<12, GI3: 12�GI<18, GI4: GI�18
doi:10.1371/journal.pone.0151926.t001
Impact of Glaucoma Severity on Results of Trabectome Surgery
PLOS ONE | DOI:10.1371/journal.pone.0151926 March 23, 2016 4 / 12
Only 22 eyes had an IOP above 40 mmHg and had to be excluded because of an insufficientpower to contribute to a separate group. There was no significant age difference among GIgroups (Table 1).
GI1 had a significantly lower portion of male patients while the other groups were moregender balanced. Most patients were Caucasians followed by Asians and then by Hispanics and
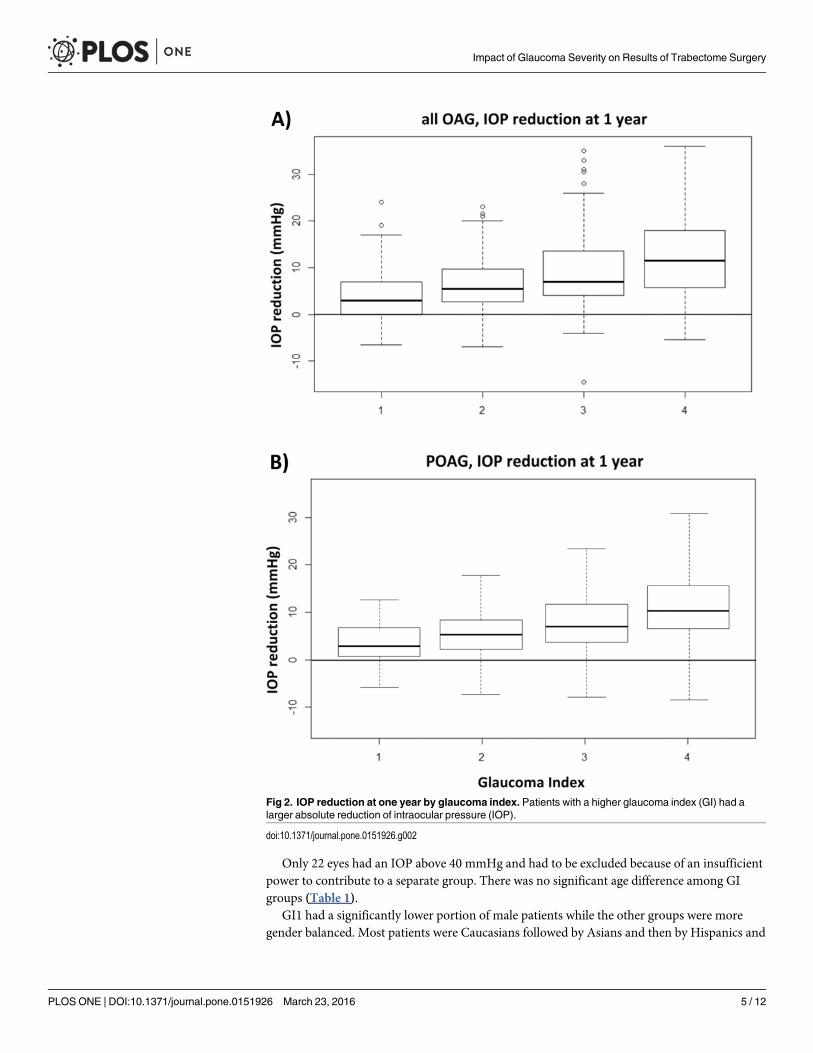
Fig 2. IOP reduction at one year by glaucoma index. Patients with a higher glaucoma index (GI) had alarger absolute reduction of intraocular pressure (IOP).
doi:10.1371/journal.pone.0151926.g002
Impact of Glaucoma Severity on Results of Trabectome Surgery
PLOS ONE | DOI:10.1371/journal.pone.0151926 March 23, 2016 5 / 12
African Americans at comparable percentages. Seventy-one percent had the diagnosis of pri-mary open angle glaucoma which was more common in GI1. Steroid induced glaucomaincreased in frequency from GI1 to GI4 eightfold. Visual acuity decreased from GI1 to GI4 toapproximately half of that of GI1. The cup to disc (C/D) ratio increased significantly by glau-coma severity index from 0.69 to 0.83. There were more pseudophakic eyes in GI4 comparedto the other groups and most of the phakic eyes were found in GI1 (p = 0.05). There were nosignificant differences in distribution of degree of angle opening among GI groups and approx-imately 80% of eyes had a Shaffer grade above 2 indicating a wide open angle.
Mean IOP reduction at one year was 4.0±5.4, 6.4±5.8, 9.0±7.6, 12.0±8.0 mmHg for GIgroups 1 to 4, respectively (Fig 2), with significant intergroup differences (p<0.05). There wasa larger range of IOP reduction in higher groups.
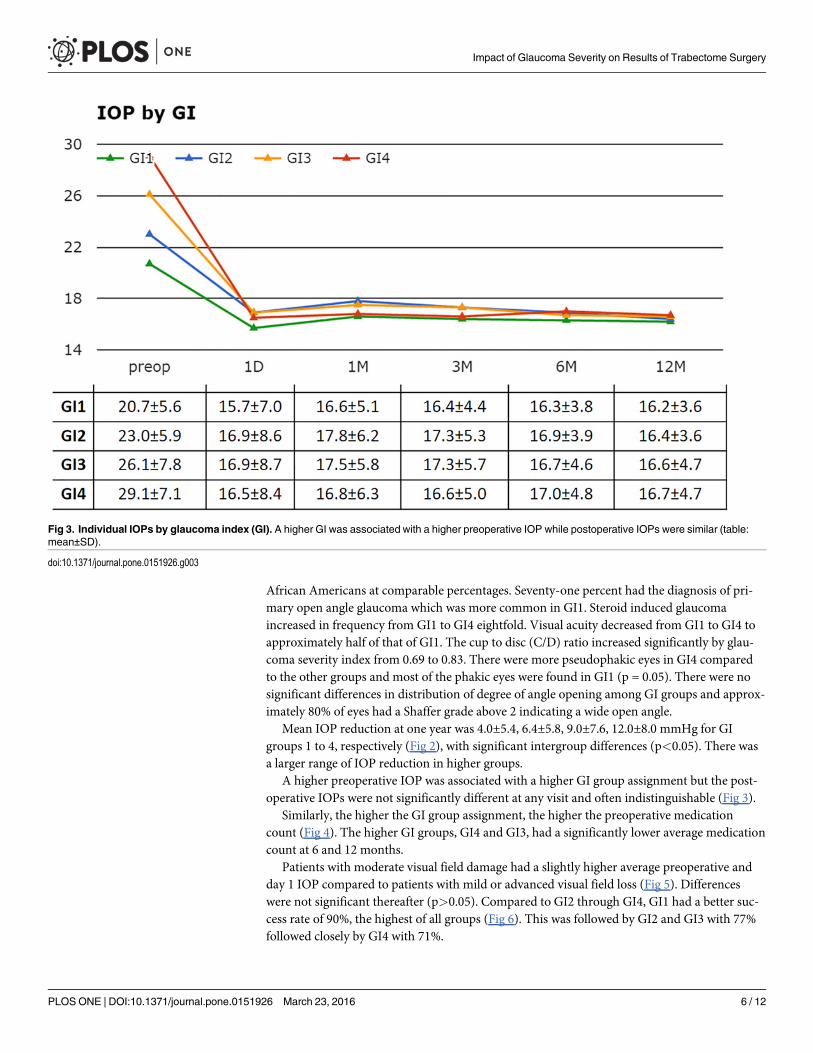
A higher preoperative IOP was associated with a higher GI group assignment but the post-operative IOPs were not significantly different at any visit and often indistinguishable (Fig 3).
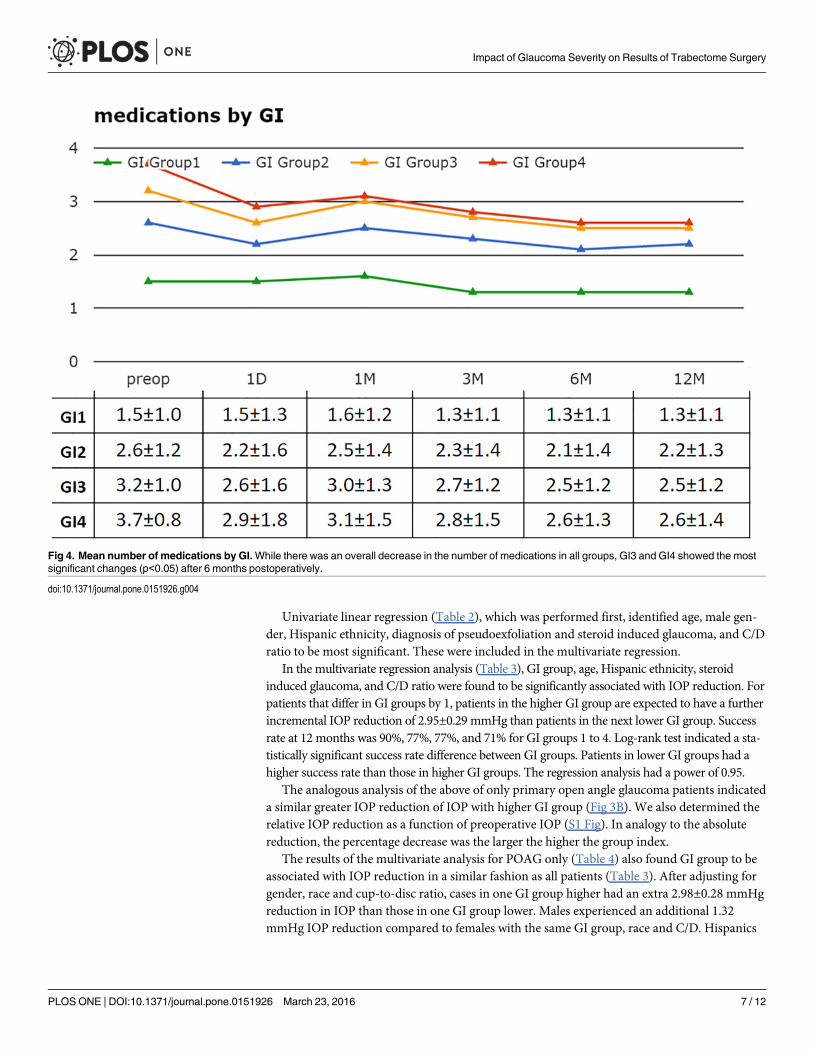
Similarly, the higher the GI group assignment, the higher the preoperative medicationcount (Fig 4). The higher GI groups, GI4 and GI3, had a significantly lower average medicationcount at 6 and 12 months.
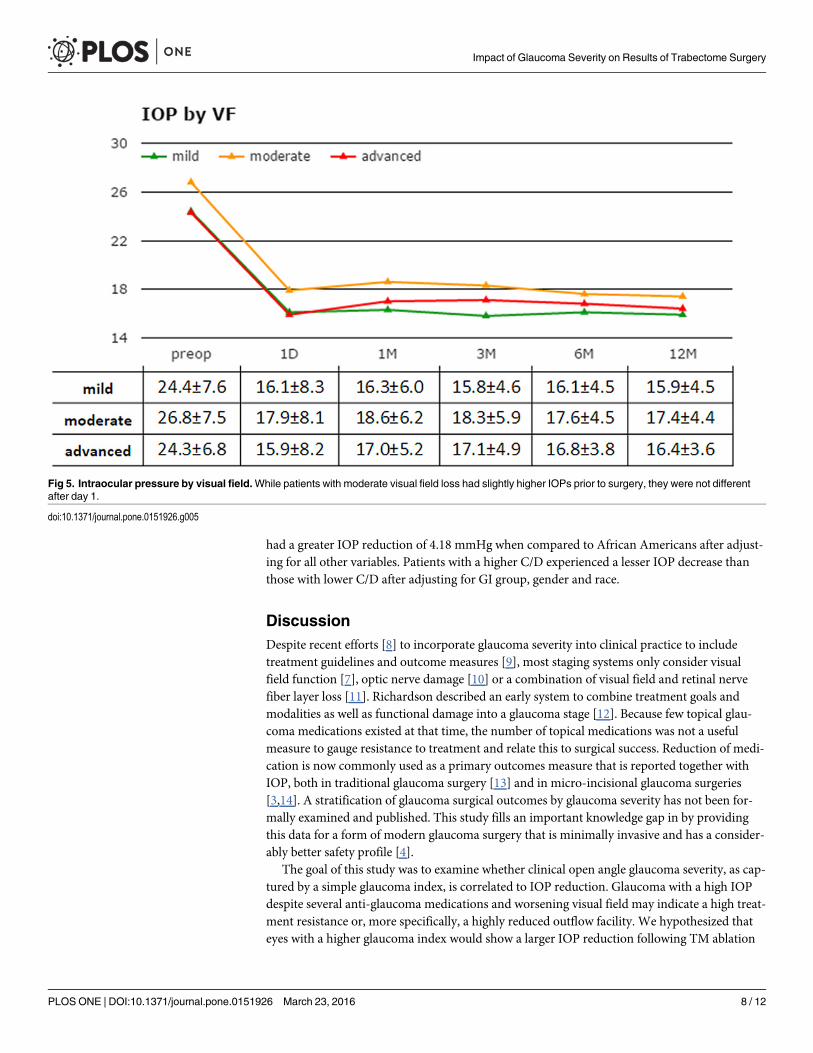
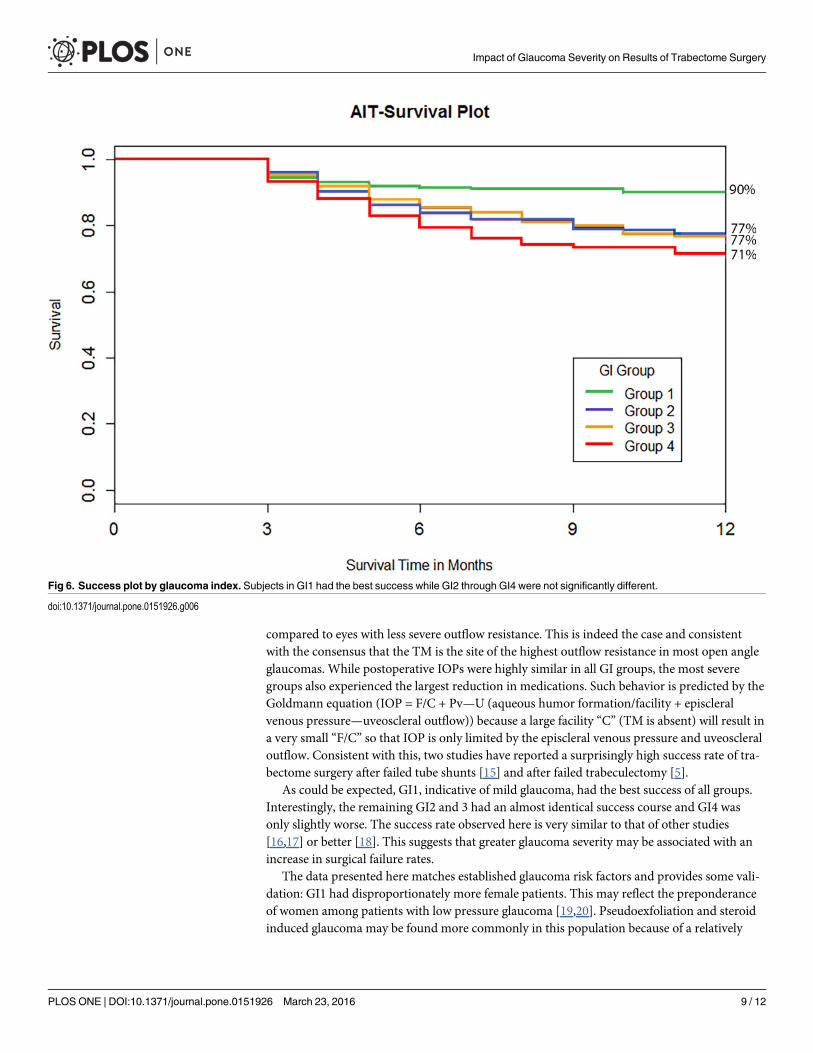
Patients with moderate visual field damage had a slightly higher average preoperative andday 1 IOP compared to patients with mild or advanced visual field loss (Fig 5). Differenceswere not significant thereafter (p>0.05). Compared to GI2 through GI4, GI1 had a better suc-cess rate of 90%, the highest of all groups (Fig 6). This was followed by GI2 and GI3 with 77%followed closely by GI4 with 71%.
Fig 3. Individual IOPs by glaucoma index (GI). A higher GI was associated with a higher preoperative IOP while postoperative IOPs were similar (table:mean±SD).
doi:10.1371/journal.pone.0151926.g003
Impact of Glaucoma Severity on Results of Trabectome Surgery
PLOS ONE | DOI:10.1371/journal.pone.0151926 March 23, 2016 6 / 12
Univariate linear regression (Table 2), which was performed first, identified age, male gen-der, Hispanic ethnicity, diagnosis of pseudoexfoliation and steroid induced glaucoma, and C/Dratio to be most significant. These were included in the multivariate regression.
In the multivariate regression analysis (Table 3), GI group, age, Hispanic ethnicity, steroidinduced glaucoma, and C/D ratio were found to be significantly associated with IOP reduction. Forpatients that differ in GI groups by 1, patients in the higher GI group are expected to have a furtherincremental IOP reduction of 2.95±0.29 mmHg than patients in the next lower GI group. Successrate at 12 months was 90%, 77%, 77%, and 71% for GI groups 1 to 4. Log-rank test indicated a sta-tistically significant success rate difference between GI groups. Patients in lower GI groups had ahigher success rate than those in higher GI groups. The regression analysis had a power of 0.95.
The analogous analysis of the above of only primary open angle glaucoma patients indicateda similar greater IOP reduction of IOP with higher GI group (Fig 3B). We also determined therelative IOP reduction as a function of preoperative IOP (S1 Fig). In analogy to the absolutereduction, the percentage decrease was the larger the higher the group index.
The results of the multivariate analysis for POAG only (Table 4) also found GI group to beassociated with IOP reduction in a similar fashion as all patients (Table 3). After adjusting forgender, race and cup-to-disc ratio, cases in one GI group higher had an extra 2.98±0.28 mmHgreduction in IOP than those in one GI group lower. Males experienced an additional 1.32mmHg IOP reduction compared to females with the same GI group, race and C/D. Hispanics
Fig 4. Mean number of medications by GI.While there was an overall decrease in the number of medications in all groups, GI3 and GI4 showed the mostsignificant changes (p<0.05) after 6 months postoperatively.
doi:10.1371/journal.pone.0151926.g004
Impact of Glaucoma Severity on Results of Trabectome Surgery
PLOS ONE | DOI:10.1371/journal.pone.0151926 March 23, 2016 7 / 12
had a greater IOP reduction of 4.18 mmHg when compared to African Americans after adjust-ing for all other variables. Patients with a higher C/D experienced a lesser IOP decrease thanthose with lower C/D after adjusting for GI group, gender and race.
DiscussionDespite recent efforts [8] to incorporate glaucoma severity into clinical practice to includetreatment guidelines and outcome measures [9], most staging systems only consider visualfield function [7], optic nerve damage [10] or a combination of visual field and retinal nervefiber layer loss [11]. Richardson described an early system to combine treatment goals andmodalities as well as functional damage into a glaucoma stage [12]. Because few topical glau-coma medications existed at that time, the number of topical medications was not a usefulmeasure to gauge resistance to treatment and relate this to surgical success. Reduction of medi-cation is now commonly used as a primary outcomes measure that is reported together withIOP, both in traditional glaucoma surgery [13] and in micro-incisional glaucoma surgeries[3,14]. A stratification of glaucoma surgical outcomes by glaucoma severity has not been for-mally examined and published. This study fills an important knowledge gap in by providingthis data for a form of modern glaucoma surgery that is minimally invasive and has a consider-ably better safety profile [4].
The goal of this study was to examine whether clinical open angle glaucoma severity, as cap-tured by a simple glaucoma index, is correlated to IOP reduction. Glaucoma with a high IOPdespite several anti-glaucoma medications and worsening visual field may indicate a high treat-ment resistance or, more specifically, a highly reduced outflow facility. We hypothesized thateyes with a higher glaucoma index would show a larger IOP reduction following TM ablation
Fig 5. Intraocular pressure by visual field.While patients with moderate visual field loss had slightly higher IOPs prior to surgery, they were not differentafter day 1.
doi:10.1371/journal.pone.0151926.g005
Impact of Glaucoma Severity on Results of Trabectome Surgery
PLOS ONE | DOI:10.1371/journal.pone.0151926 March 23, 2016 8 / 12
compared to eyes with less severe outflow resistance. This is indeed the case and consistentwith the consensus that the TM is the site of the highest outflow resistance in most open angleglaucomas. While postoperative IOPs were highly similar in all GI groups, the most severegroups also experienced the largest reduction in medications. Such behavior is predicted by theGoldmann equation (IOP = F/C + Pv—U (aqueous humor formation/facility + episcleralvenous pressure—uveoscleral outflow)) because a large facility “C” (TM is absent) will result ina very small “F/C” so that IOP is only limited by the episcleral venous pressure and uveoscleraloutflow. Consistent with this, two studies have reported a surprisingly high success rate of tra-bectome surgery after failed tube shunts [15] and after failed trabeculectomy [5].
As could be expected, GI1, indicative of mild glaucoma, had the best success of all groups.Interestingly, the remaining GI2 and 3 had an almost identical success course and GI4 wasonly slightly worse. The success rate observed here is very similar to that of other studies[16,17] or better [18]. This suggests that greater glaucoma severity may be associated with anincrease in surgical failure rates.
The data presented here matches established glaucoma risk factors and provides some vali-dation: GI1 had disproportionately more female patients. This may reflect the preponderanceof women among patients with low pressure glaucoma [19,20]. Pseudoexfoliation and steroidinduced glaucoma may be found more commonly in this population because of a relatively
Fig 6. Success plot by glaucoma index. Subjects in GI1 had the best success while GI2 through GI4 were not significantly different.
doi:10.1371/journal.pone.0151926.g006
Impact of Glaucoma Severity on Results of Trabectome Surgery
PLOS ONE | DOI:10.1371/journal.pone.0151926 March 23, 2016 9 / 12

Table 2. Univariate Regression.
Coefficient Standard Error p-value
Age -0.07 0.02 <0.01
Male 1.55 0.58 <0.01
Ethnicity
Asian 0.89 1.29 0.49
Caucasian 1.25 1.28 0.33
Hispanic 4.44 1.62 <0.01
Other 0.37 1.66 0.82
Diagnosis
Other 2.45 1.44 0.09
Pseudoexfoliation Glaucoma 2.75 0.94 <0.01
Pigmentary Dispersion 1.61 1.82 0.37
Steroid Induced 5.77 1.17 <0.01
C/D Ratio -5.94 2.07 <0.01
Shaffer Grade -1.87 1.16 0.17
Lens
Aphakic -2.42 3.81 0.53
Pseudophakic -1.42 0.76 0.08
doi:10.1371/journal.pone.0151926.t002
Table 3. Multivariate Regression for All Open Angle Glaucomas.
Coefficient Standard Error p-value
GI group 3.02 0.30 <0.01
Age -0.05 0.02 0.01
Male 0.52 0.55 0.35
Ethnicity
Asian -1.20 1.17 0.31
Caucasian 1.21 1.19 0.31
Hispanic 4.33 1.49 < 0.01
Other 0.06 1.46 0.97
Diagnosis
Other 1.84 1.37 0.18
Pigmentary Dispersion 0.40 1.73 0.82
Pseudoexfoliative Glaucoma 1.78 0.92 0.06
Steroid Induced 3.37 1.32 0.02
C/D Ratio -9.79 2.06 <0.01
doi:10.1371/journal.pone.0151926.t003
Table 4. Multivariate Regression for Primary Open Angle Glaucoma.
Coefficients Standard Error p-value
GI group 2.98 0.26 <0.01
Male 1.32 0.60 0.03
Race
Asian -0.88 1.12 0.43
Caucasian 0.64 1.06 0.54
Hispanic 4.18 1.45 <0.01
Other -1.20 1.62 0.46
C/D -11.74 1.99 <0.01
doi:10.1371/journal.pone.0151926.t004
Impact of Glaucoma Severity on Results of Trabectome Surgery
PLOS ONE | DOI:10.1371/journal.pone.0151926 March 23, 2016 10 / 12
more severe course either by damage or IOP, moving these forms of secondary open angleglaucoma into the higher GI groups. Patients with pseudoexfoliation typically have a largerIOP reduction after trabectome surgery [2] which may have contributed to the observed groupbehavior of a better pressure decrease in those groups in our study. GI4 had a significantlyworse visual acuity than other groups which may be a result of commonly coinciding cataracts[21] that are still present in some of these patients but also with loss of visual acuity from glau-coma damage in advanced visual field loss. The later appears to be reflected in the significantlylarger C/D ratio in GI4, the results of more advanced structural damage. Both regression analy-ses are reflective of the demographic and biometric observations and also point to Hispanicethnicity as a group that is at an increased risk [22].
Limitations of this study are the use of categorical rather than continuous data for baselineIOP and a simplified stratification of glaucoma severity. We did this to avoid progressiveunderrating of glaucoma severity in the low pressure glaucoma range when raw data was used.The relatively large number of patients analyzed here and equal group sizes allowed to applymeaningful and valid statistical methods. Another shortcoming is that this study is retrospec-tive in nature and may include bias for procedure selection. This is partially countered by rela-tively even patient numbers in all groups.
A recent study indicated that there is a tipping point during the course of glaucoma suggest-ing that more severe glaucoma may require more aggressive pressure lowering [23]. In thiscontext, while this study can guide glaucoma surgeons to avoid risks inherent in traditionalglaucoma surgeries, it is important to keep in mind that lowering intraocular pressure is a life-long commitment to manage an often relentless and progressive disease. A minimally invasivesurgery may only be the initial step.
Supporting InformationS1 Fig. IOP reduction at 1 year as percentage of preoperative IOP. A) In all open angle glau-coma patients, a higher glaucoma index group assignment indicating more severe glaucomawas found to be associated with a larger IOP reduction (percentage +/- 95% confidence inter-val). B) Primary open angle glaucoma had highly similar IOP percentage reduction at 1 year(percentage +/- 95% confidence interval).(PDF)
Author ContributionsConceived and designed the experiments: RTL NAL JSS. Performed the experiments: RTL PRNAL. Analyzed the data: RTL HP YD NAL JSS. Contributed reagents/materials/analysis tools:NAL JSS. Wrote the paper: RTL PR HP YD JSS NAL.
References1. Ethier CR, KammRD, Palaszewski BA, Johnson MC, Richardson TM. Calculations of flow resistance
in the juxtacanalicular meshwork. Invest Ophthalmol Vis Sci. 1986; 27: 1741–1750. PMID: 3793404
2. Ting JLM, Damji KF, Stiles MC, Trabectome Study Group. Ab interno trabeculectomy: outcomes inexfoliation versus primary open-angle glaucoma. J Cataract Refract Surg. Elsevier; 2012; 38: 315–323.doi: 10.1016/j.jcrs.2011.08.043 PMID: 22322166
3. Bussel II, Kaplowitz K, Schuman JS, Loewen NA, Trabectome Study Group. Outcomes of ab internotrabeculectomy with the trabectome by degree of angle opening. Br J Ophthalmol. 2015; 99: 914–919.doi: 10.1136/bjophthalmol-2014-305577 PMID: 25336577
4. Kaplowitz K, Schuman JS, Loewen NA. Techniques and outcomes of minimally invasive trabecularablation and bypass surgery. Br J Ophthalmol. 2014; 98: 579–585. doi: 10.1136/bjophthalmol-2013-304256 PMID: 24338085
Impact of Glaucoma Severity on Results of Trabectome Surgery
PLOS ONE | DOI:10.1371/journal.pone.0151926 March 23, 2016 11 / 12

5. Bussel II, Kaplowitz K, Schuman JS, Loewen NA, Group TS, Others. Outcomes of ab interno trabecu-lectomy with the trabectome after failed trabeculectomy. Br J Ophthalmol. BMJ Publishing Group Ltd.;2014; 99: 258–262. doi: 10.1136/bjophthalmol-2013-304717 PMID: 25170064
6. Stamper RL. CHAPTER 7 –Clinical interpretation of gonioscopic findings. In: Stamper RL, LiebermanMF, Drake M V, editors. Becker-Shaffer’s Diagnosis and Therapy of the Glaucomas ( Eighth Edition).Mosby; 2009. pp. 78–90.
7. NgM, Sample PA, Pascual JP, Zangwill LM, Girkin CA, Liebmann JM, et al. Comparison of visual fieldseverity classification systems for glaucoma. J Glaucoma. 2012; 21: 551–561. doi: 10.1097/IJG.0b013e31821dac66 PMID: 21878817
8. Buck CJ. ICD-10-CM, 2015: Physician Professional Edition. Elsevier Health Sciences; 2015.
9. Ronald L. Fellman RL, Mattox CG, Ross KM, Vicchrilli S. Know the New Glaucoma Staging Codes. EyeNet Magazine. 10/2011; Available: http://www.aao.org/eyenet/article/know-new-glaucoma-staging-codes?october-2011
10. Spaeth GL, Lopes JF, Junk AK, Grigorian AP, Henderer J. Systems for staging the amount of opticnerve damage in glaucoma: a critical review and newmaterial. Surv Ophthalmol. 2006; 51: 293–315.PMID: 16818081
11. Medeiros FA, Zangwill LM, Bowd C, Mansouri K, Weinreb RN. The structure and function relationshipin glaucoma: implications for detection of progression and measurement of rates of change. InvestOphthalmol Vis Sci. 2012; 53: 6939–6946. doi: 10.1167/iovs.12-10345 PMID: 22893677
12. Heilmann K, Richardson KT. Glaucoma: Conceptions of a Disease: Pathogenesis, Diagnosis, Therapy.W. B. Saunders; 1978.
13. Gedde SJ, Schiffman JC, Feuer WJ, Herndon LW, Brandt JD, Budenz DL. Treatment Outcomes in theTube Versus Trabeculectomy (TVT) Study After Five Years of Follow-up. Am J Ophthalmol. Elsevier;2012; 153: 789–803.e2. doi: 10.1016/j.ajo.2011.10.026 PMID: 22245458
14. Samuelson TW, Katz LJ, Wells JM, Duh Y-J, Giamporcaro JE, US iStent Study Group. Randomizedevaluation of the trabecular micro-bypass stent with phacoemulsification in patients with glaucoma andcataract. Ophthalmology. Elsevier; 2011; 118: 459–467. doi: 10.1016/j.ophtha.2010.07.007 PMID:20828829
15. Mosaed S, Chak G, Haider A, Lin KY, Minckler DS. Results of Trabectome Surgery Following FailedGlaucoma Tube Shunt Implantation: Cohort Study. Medicine. 2015; 94: e1045. doi: 10.1097/MD.0000000000001045 PMID: 26222842
16. Kaplowitz K, Bussel II, Honkanen R, Schuman JS, Loewen NA. Review and meta-analysis of ab-interno trabeculectomy outcomes. Br J Ophthalmol. 2016; doi: 10.1136/bjophthalmol-2015-307131
17. Parikh HA, Bussel II, Schuman JS, Brown EN, Loewen NA. Coarsened Exact Matching of Phaco-Tra-bectome to Trabectome in Phakic Patients: Lack of Additional Pressure Reduction from Phacoemulsifi-cation. PLoS One. 2016; 11: e0149384. doi: 10.1371/journal.pone.0149384 PMID: 26895293
18. Jea SY, Francis BA, Vakili G, Filippopoulos T, Rhee DJ. Ab interno trabeculectomy versus trabeculect-omy for open-angle glaucoma. Ophthalmology. 2012; 119: 36–42. doi: 10.1016/j.ophtha.2011.06.046PMID: 21982416
19. Krupin T, Liebmann JM, Greenfield DS, Rosenberg LF, Ritch R, Yang JW, et al. The Low-pressureGlaucoma Treatment Study (LoGTS) study design and baseline characteristics of enrolled patients.Ophthalmology. 2005; 112: 376–385. PMID: 15745762
20. Drance S, Anderson DR, Schulzer M, Collaborative Normal-Tension Glaucoma Study Group. Risk fac-tors for progression of visual field abnormalities in normal-tension glaucoma. Am J Ophthalmol. Else-vier; 2001; 131: 699–708. PMID: 11384564
21. Chandrasekaran S, Cumming RG, Rochtchina E, Mitchell P. Associations between elevated intraocularpressure and glaucoma, use of glaucomamedications, and 5-year incident cataract: the Blue Moun-tains Eye Study. Ophthalmology. 2006; 113: 417–424. PMID: 16458969
22. Vajaranant TS, Wu S, Torres M, Varma R. The changing face of primary open-angle glaucoma in theUnited States: demographic and geographic changes from 2011 to 2050. Am J Ophthalmol. 2012; 154:303–314.e3. doi: 10.1016/j.ajo.2012.02.024 PMID: 22541661
23. Wollstein G, Kagemann L, Bilonick RA, Ishikawa H, Folio LS, Gabriele ML, et al. Retinal nerve fibrelayer and visual function loss in glaucoma: the tipping point. Br J Ophthalmol. 2012; 96: 47–52. doi: 10.1136/bjo.2010.196907 PMID: 21478200
Impact of Glaucoma Severity on Results of Trabectome Surgery
PLOS ONE | DOI:10.1371/journal.pone.0151926 March 23, 2016 12 / 12