Embed Size (px)
Citation preview
Impact Evaluation Report - Draft Commercial HVAC Sector – Program Year 2019 EM&V Group A
CALIFORNIA PUBLIC UTILITIES COMMISSION March 12, 2021
DNV GL - ENERGY
SAFER, SMARTER, GREENER

DNV GL Energy Insights USA, Inc. Page i
Information Details
Sector Lead Amit Kanungo
Project Manager Cameron Tuttle, P.E.
Telephone Number +1.510.891.0446
Mailing Address 155 Grand Avenue, Suite 600, Oakland, CA 94612
Email Address [email protected]
Report Location http://www.calmac.org
LEGAL NOTICE
This report was prepared as an account of work sponsored by the California Public Utilities Commission. It does not necessarily represent the views of the Commission or any of its employees except to the extent, if any, that it has formally been approved by the Commission at a public meeting. For information regarding any such action, communicate directly with the Commission at 505 Van Ness Avenue, San Francisco, California 94102. Neither the Commission nor the State of California, nor any officer, employee, or any of its contractors or subcontractors makes any warranty, express or implied, or assumes any legal liability whatsoever for the contents of this document.
DNV GL Energy Insights USA, Inc. Page i
Table of contents
1 EXECUTIVE SUMMARY ..................................................................................................... 3 1.1. Study background and approach 4 1.2. Evaluated savings results 5 1.2.1 PTAC controls technology group 6 1.2.2 Rooftop/split systems technology group 7 1.3. Study recommendations 8
2 INTRODUCTION .............................................................................................................. 9 2.1. Project goals and objectives 9 2.2. Evaluated measure groups 9 2.2.1 PTAC controls 10 2.2.2 Rooftop/split systems 10 2.3. Overview of approach 11 2.3.1 PTAC controls 11 2.3.2 Rooftop/split systems 12 2.4. Organization of report 13
3 METHODOLOGY ............................................................................................................ 14 3.1. Sample design 14 3.2. Commercial HVAC measure group sample design 16 3.3. Data collection 17 3.3.1 PTAC controls 18 3.3.2 Rooftop/split systems 19 3.4. Gross methodology 19 3.4.1 PTAC controls 20 3.4.2 Rooftop/split systems 22 3.5. Net methodology 23 3.5.1 PTAC controls 23 3.5.2 Rooftop/split systems 25 3.6. Data sources 25
4 DETAILED RESULTS ...................................................................................................... 27 4.1. PTAC controls 27 4.1.1 Gross impact findings 27 4.1.2 Net impact findings 32 4.2. Rooftop/split 33 4.2.1 Gross impact findings 34 4.2.2 Net impact findings 37
5 CONCLUSIONS, FINDINGS, & RECOMMENDATIONS .......................................................... 39 5.1. Conclusions 39 5.2. Overarching findings 40 5.2.1 PTAC controls 40 5.2.2 Rooftop/split systems 43
6 APPENDICES ................................................................................................................ 45
DNV GL Energy Insights USA, Inc. Page ii
6.1. Appendix A: Impact Evaluation Standard Reporting (IESR) required reporting−First year and lifecycle savings 45
6.2. Appendix B: IESR−Measure groups or passed through measures with early retirement 58 6.3. Appendix C: IESR−Recommendations resulting from the evaluation research 63 6.4. Appendix D: Data collection and sampling memo 64 6.5. Appendix E: PTAC controls data collection forms 65 6.5.1 PG&E program participant DCF 65 6.5.2 SDG&E program participant DCF 69 6.5.3 PTAC controls net survey DCF 73 6.6. Appendix F: Gross impact findings tables for rooftop/split systems 77
List of figures Figure 1-1. Energy savings evaluation process: getting from gross to net ........................................... 4 Figure 1-2. Summary of evaluated technologies .............................................................................. 4 Figure 1-3. Key data collection sources and activities by technology group .......................................... 5 Figure 3-1. PTAC controls measure group analysis process flow ....................................................... 20 Figure 4-1. Comparison of reported and evaluated electric energy savings ........................................ 28
List of tables Table 1-1. Statewide net electric and gas savings results by technology ............................................. 6 Table 1-2. Statewide first-year savings summary by fuel for PTAC controls ......................................... 7 Table 1-3. Statewide first-year savings summary by fuel for rooftop and split system .......................... 7 Table 2-1. Overall organizational structure of the report ................................................................. 13 Table 3-1. PTAC controls measure group target and achieved sample by program ............................. 16 Table 3-2. PTAC controls gross sample by PA ................................................................................ 17 Table 3-3. PTAC controls net sample by PA ................................................................................... 17 Table 3-4. Rooftop/split system gross sample by PA ....................................................................... 17 Table 3-5. Timing free-ridership scoring........................................................................................ 24 Table 3-6. Summary of data sources and applicable measure groups ............................................... 26 Table 4-1. First year gross and net savings summary - PTAC controls ............................................... 27 Table 4-2. PTAC controls first-year gross savings summary ............................................................. 27 Table 4-3. PTAC controls population, gross realization rate, and relative precisions ............................ 28 Table 4-4. Key drivers behind PTAC controls gross energy realization rate ........................................ 30 Table 4-5. First year net savings summary - PTAC controls ............................................................. 32 Table 4-6. PTAC controls population, net sample, realization rate, and relative precision ..................... 33 Table 4-7. Rooftop/Split Systems first-year gross and net savings summary ..................................... 33 Table 4-8. Rooftop or split system first-year gross savings summary ................................................ 34 Table 4-9. Rooftop or split system population, GRR, and relative precisions ...................................... 35 Table 4-10. Rooftop or split system first-year net savings summary ................................................. 37 Table 6-1. Rooftop or split system kWh discrepancy impacts by step, PG&E ...................................... 77 Table 6-2. Rooftop or split system kWh discrepancy impacts by step, SCE ........................................ 78 Table 6-3. Rooftop or split system kWh discrepancy impacts by step, SDG&E .................................... 80
DNV GL Energy Insights USA, Inc. Page 3
1 EXECUTIVE SUMMARY This report presents the electric and natural gas energy savings evaluation of commercial heating, ventilation, and air conditioning (HVAC) equipment in ratepayer-funded energy-efficiency programs in program year (PY) 2019. DNV GL estimated energy and peak demand savings for two selected HVAC technology groups, package terminal air conditioner (PTAC) controls and rooftop/split systems, across programs. The programs are offered by the following program administrators (PAs): San Diego Gas and Electric Company (SDG&E), Southern California Edison (SCE), and Pacific Gas and Electric Company (PG&E). We conducted this evaluation as part of the California Public Utilities Commission (CPUC) Energy Division (ED) Evaluation, Measurement & Verification contract.
The primary goals of this PY2019 evaluation are to:
Assess savings for electric demand in kilowatts (kW), electric consumption in kilowatt-hours (kWh), and gas consumption in therms with a focus on quantifying peak demand impacts of the selected HVAC technologies.
Determine the savings that occur as a result of the program with respect to end users, decision makers, and distributors.
Provide insights into how evaluated HVAC technologies are producing energy savings cost-effectively and what improvements can be made to move towards strategic statewide energy-efficiency goals.
Central to this evaluation was collecting data from participating end user customers and decision makers (those who make the decision to implement an energy efficiency project) to adjust key technical parameters that affect the calculation of energy and demand savings.
The first major step was estimating the gross savings for each of the two evaluated technologies. Gross savings are the changes in energy and power demand that resulted from energy efficiency program activities, regardless of what factors may have motivated the program participants to take actions. We compared the evaluated gross savings with the gross savings reported by PAs to develop ratios of the evaluated savings estimated to the PA-reported savings values, which are referred to as gross realization rates (GRRs).
We also estimated the amount of savings that resulted from the program. This estimate is developed by first estimating the amount of “free-ridership,” which represents the savings that would have occurred without
DNV GL Energy Insights USA, Inc. Page 4
the incentive being provided (e.g., because the customer indicates s/he would have purchased the equipment at full cost if the incentive had not been offered). From this, net-to-gross ratios (NTGRs) can be estimated for each of the evaluated technologies by subtracting the free-ridership savings from the gross savings and dividing by gross savings. An evaluated NTGR of 100% would indicate that the energy and gas savings were completely due to the influence of the incentive offered by the program. A score less than 100% means that other factors were responsible for the energy savings.
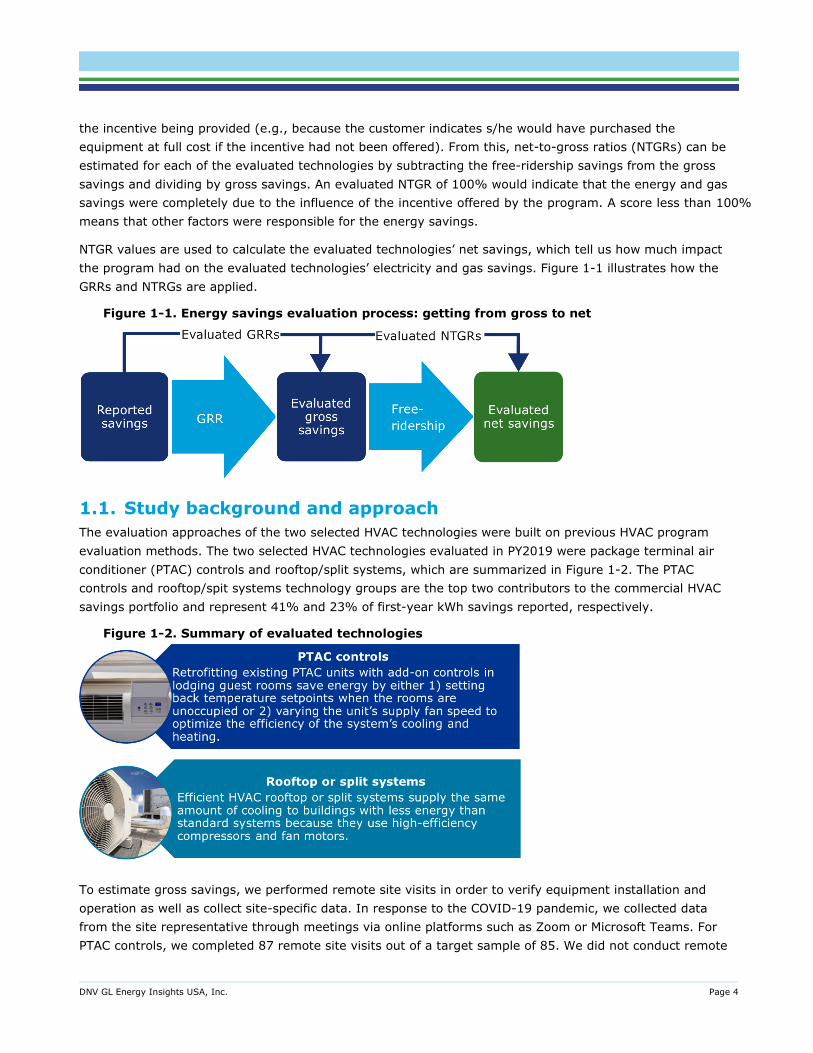
NTGR values are used to calculate the evaluated technologies’ net savings, which tell us how much impact the program had on the evaluated technologies’ electricity and gas savings. Figure 1-1 illustrates how the GRRs and NTRGs are applied.
Figure 1-1. Energy savings evaluation process: getting from gross to net
1.1. Study background and approach The evaluation approaches of the two selected HVAC technologies were built on previous HVAC program evaluation methods. The two selected HVAC technologies evaluated in PY2019 were package terminal air conditioner (PTAC) controls and rooftop/split systems, which are summarized in Figure 1-2. The PTAC controls and rooftop/spit systems technology groups are the top two contributors to the commercial HVAC savings portfolio and represent 41% and 23% of first-year kWh savings reported, respectively.
Figure 1-2. Summary of evaluated technologies
To estimate gross savings, we performed remote site visits in order to verify equipment installation and operation as well as collect site-specific data. In response to the COVID-19 pandemic, we collected data from the site representative through meetings via online platforms such as Zoom or Microsoft Teams. For PTAC controls, we completed 87 remote site visits out of a target sample of 85. We did not conduct remote
DNV GL Energy Insights USA, Inc. Page 5
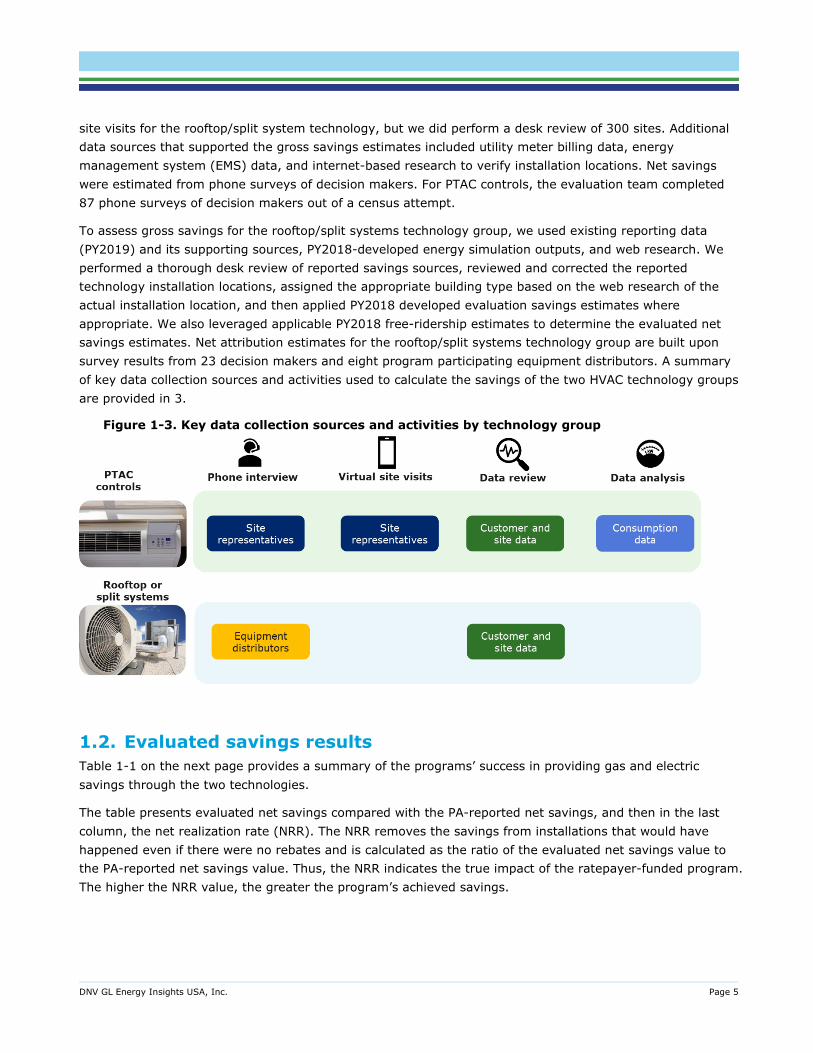
site visits for the rooftop/split system technology, but we did perform a desk review of 300 sites. Additional data sources that supported the gross savings estimates included utility meter billing data, energy management system (EMS) data, and internet-based research to verify installation locations. Net savings were estimated from phone surveys of decision makers. For PTAC controls, the evaluation team completed 87 phone surveys of decision makers out of a census attempt.
To assess gross savings for the rooftop/split systems technology group, we used existing reporting data (PY2019) and its supporting sources, PY2018-developed energy simulation outputs, and web research. We performed a thorough desk review of reported savings sources, reviewed and corrected the reported technology installation locations, assigned the appropriate building type based on the web research of the actual installation location, and then applied PY2018 developed evaluation savings estimates where appropriate. We also leveraged applicable PY2018 free-ridership estimates to determine the evaluated net savings estimates. Net attribution estimates for the rooftop/split systems technology group are built upon survey results from 23 decision makers and eight program participating equipment distributors. A summary of key data collection sources and activities used to calculate the savings of the two HVAC technology groups are provided in 3.
Figure 1-3. Key data collection sources and activities by technology group
1.2. Evaluated savings results Table 1-1 on the next page provides a summary of the programs’ success in providing gas and electric savings through the two technologies.
The table presents evaluated net savings compared with the PA-reported net savings, and then in the last column, the net realization rate (NRR). The NRR removes the savings from installations that would have happened even if there were no rebates and is calculated as the ratio of the evaluated net savings value to the PA-reported net savings value. Thus, the NRR indicates the true impact of the ratepayer-funded program. The higher the NRR value, the greater the program’s achieved savings.

DNV GL Energy Insights USA, Inc. Page 6
Table 1-1. Statewide net electric and gas savings results by technology Technology
(Measure) Group Evaluated Net Savings
Reported Net Savings
Net Realization Rate (NRR)
Electric Consumption (kWh)
PTAC controls 2,450,185 11,654,377 21%
Rooftop/split systems 2,408,401 8,298,476 29%
Peak Electric Demand (kW)
PTAC controls 462 4,084 11%
Rooftop/split systems 1,886 4,211 45%
Gas Consumption (therms)
PTAC controls Not applicable Not applicable Not applicable
Rooftop/split systems -596 -41,223 1%
The next sections present more detailed results of the gross and net savings evaluation by HVAC technology group, followed by a summary of key findings.
1.2.1 PTAC controls technology group This technology group uses controls on the PTAC and package terminal heat pump (PTHP) units found mainly in hotel and motel guest rooms. Two PAs filed savings claims with this technology group: PG&E and SDG&E. PG&E’s measure reduces operation when installed controls sense the room is unoccupied whereas the SDG&E measure, the Adaptive Climate Controller (ACC), varies the speed of the PTAC/PTHP fan based on climate demands without respect to guest unit occupancy.
Table 1-2 presents the PY2019 statewide reported savings summary for PTAC controls. Overall, 15% of reported electric consumption (kWh) savings and 8% of the reported peak demand (kW) savings from the program are realized for the PTAC controls technology group. This is significantly lower than the previous study results of PY2017. Based on phone interviews and remote site-visits, we determined 36% of the controls installed by the programs were on newer PTACs that are required by the California building energy code to already have occupancy-based controls with the newly installed PTAC units. Looking at the market today and based on the manufacturing dates of these newly installed PTAC units, it is presumed that the PTAC units have controls built-in. Therefore, adding another control at the thermostat or via hotel room key controller to control the PTAC units is redundant and does not provide additional savings as compared to the existing conditions of the PTAC units. This means there are no savings for the PA to claim for these newly installed PTAC units. Additionally, on-site data obtained for the evaluation shows the technology saves 25% less energy compared to the claimed operation. A full summary of the factors contributing to the 15% evaluated gross kWh savings realization rate is found in section 4.1.1.
DNV GL Energy Insights USA, Inc. Page 7
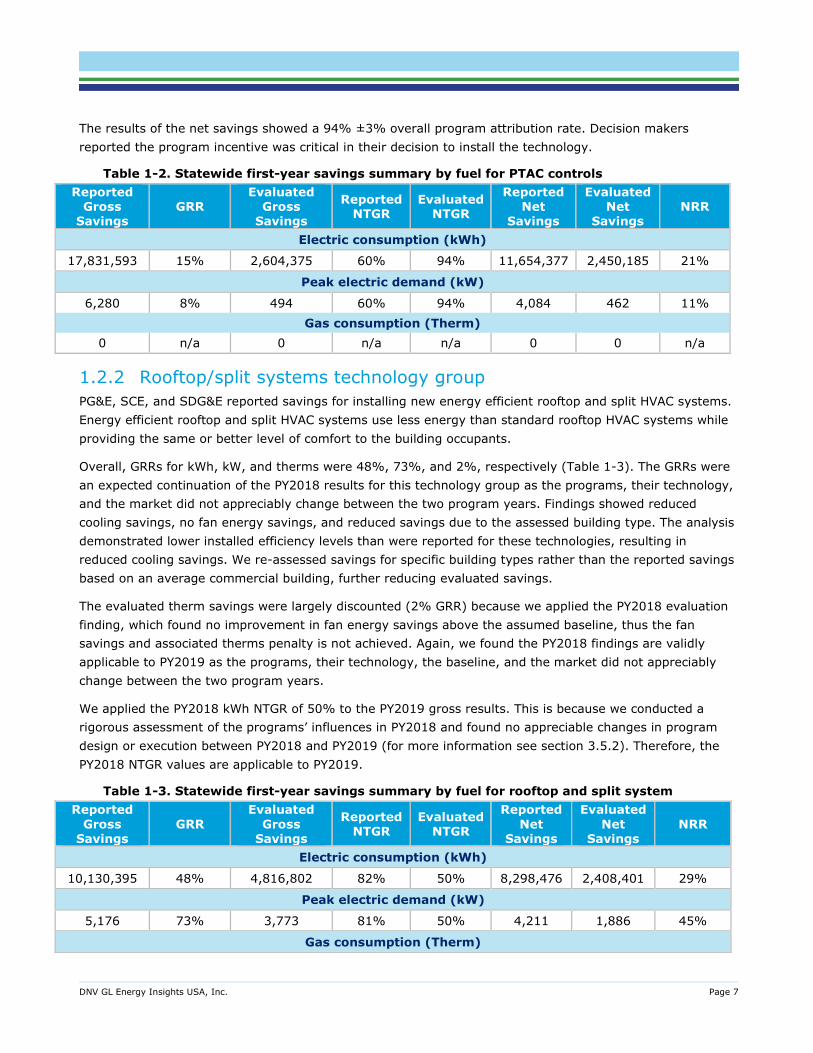
The results of the net savings showed a 94% ±3% overall program attribution rate. Decision makers reported the program incentive was critical in their decision to install the technology.
Table 1-2. Statewide first-year savings summary by fuel for PTAC controls Reported
Gross Savings
GRR Evaluated
Gross Savings
Reported NTGR
Evaluated NTGR
Reported Net
Savings
Evaluated Net
Savings NRR
Electric consumption (kWh)
17,831,593 15% 2,604,375 60% 94% 11,654,377 2,450,185 21%
Peak electric demand (kW)
6,280 8% 494 60% 94% 4,084 462 11% Gas consumption (Therm)
0 n/a 0 n/a n/a 0 0 n/a
1.2.2 Rooftop/split systems technology group PG&E, SCE, and SDG&E reported savings for installing new energy efficient rooftop and split HVAC systems. Energy efficient rooftop and split HVAC systems use less energy than standard rooftop HVAC systems while providing the same or better level of comfort to the building occupants.
Overall, GRRs for kWh, kW, and therms were 48%, 73%, and 2%, respectively (Table 1-3). The GRRs were an expected continuation of the PY2018 results for this technology group as the programs, their technology, and the market did not appreciably change between the two program years. Findings showed reduced cooling savings, no fan energy savings, and reduced savings due to the assessed building type. The analysis demonstrated lower installed efficiency levels than were reported for these technologies, resulting in reduced cooling savings. We re-assessed savings for specific building types rather than the reported savings based on an average commercial building, further reducing evaluated savings.
The evaluated therm savings were largely discounted (2% GRR) because we applied the PY2018 evaluation finding, which found no improvement in fan energy savings above the assumed baseline, thus the fan savings and associated therms penalty is not achieved. Again, we found the PY2018 findings are validly applicable to PY2019 as the programs, their technology, the baseline, and the market did not appreciably change between the two program years.
We applied the PY2018 kWh NTGR of 50% to the PY2019 gross results. This is because we conducted a rigorous assessment of the programs’ influences in PY2018 and found no appreciable changes in program design or execution between PY2018 and PY2019 (for more information see section 3.5.2). Therefore, the PY2018 NTGR values are applicable to PY2019.
Table 1-3. Statewide first-year savings summary by fuel for rooftop and split system Reported
Gross Savings
GRR Evaluated
Gross Savings
Reported NTGR
Evaluated NTGR
Reported Net
Savings
Evaluated Net
Savings NRR
Electric consumption (kWh)
10,130,395 48% 4,816,802 82% 50% 8,298,476 2,408,401 29%
Peak electric demand (kW)
5,176 73% 3,773 81% 50% 4,211 1,886 45%
Gas consumption (Therm)
DNV GL Energy Insights USA, Inc. Page 8
-50,372 2% -1,193 82% 50% -41,223 -596 1%
1.3. Study recommendations This section provides a summary of recommendations from this study findings. A detailed discussion of findings, recommendations, and implications are provided in Chapter 5 of the report.
DNV GL recommends that PAs develop savings for PTAC controls and other similar HVAC controls technology groups using appropriate baselines and correct building types and vintages to reasonably capture the savings attributable to the technology improvements. Based on phone interviews and remote site visits, we determined 36% of the controls installed were on newer PTAC systems that are required by the California building energy code to come with occupancy-based controls, and consequently, there are no savings for a PA to claim. We also found nine of the 87 evaluated projects were inappropriately labeled as “hotel” when they were senior living centers, which have a completely different occupancy profile than hotel. We also observed building vintages in the workpaper assumed a greater percentage of pre-1978 building vintage and less post-2005 vintage compared with the actual building vintage in the sample, which overestimated the actual savings. These three factors combined had a significant impact on the savings for PTAC controls measure group.
For PTAC controls and other similar HVAC controls technology groups, DNV GL suggests PAs consider collecting and archiving the technology-related performance data to ensure that the technologies are operating as intended. The collection of performance data will also assist appropriate evaluation of the HVAC controls technologies.
For a new technology, like the Adaptive Climate Controller under the PTAC controls technology group, PAs should vet the technology by studying test results, reviewing third party measurements, and research other evaluation studies that demonstrate the efficacy of the technology before introducing the technology to the program. Marketing materials from the technology equipment manufacturer do not provide the same level of credibility as data-driven analyses and reports by independent third parties.
DNV GL recommends PAs develop savings for the rooftop/split system technology group with appropriate baselines and high-efficiency characteristics including the HVAC system efficiencies, fan power, and applicable controls that better reflect the savings achieved as a result of the installed conditions and actual performance.
For HVAC controls technologies similar to the PTAC controls technology group, PAs should incorporate the direct-install design components of the PTAC controls technology group that led to high NTGR values, which equate to high program savings attribution.
DNV GL Energy Insights USA, Inc. Page 9
2 INTRODUCTION The report presents DNV GL’s energy savings estimates (impact evaluation) of commercial heating, ventilating, and air conditioning (HVAC) technology groups (measures) that are part of the California Public Utilities Commission (CPUC) HVAC Research Roadmap. These programs are evaluated under CPUC’s Group A evaluation contract group. The primary results of this evaluation are estimated energy savings (in kWh, kW, and therms) achieved by two selected HVAC measures—package terminal air conditioner (PTAC) controls and rooftop/split systems—in program year 2019 (PY2019). The programs are offered by the following California program administrators (PAs): San Diego Gas and Electric Company (SDG&E), Southern California Edison (SCE), and Pacific Gas and Electric Company (PG&E).
2.1. Project goals and objectives The primary objective of this evaluation is to assess the gross and net kWh, kW, and therm savings achieved from the statewide list of HVAC Efficiency Savings and Performance Incentive (ESPI) uncertain measure groups. The focus is on the two selected measure groups across the HVAC portfolio from the 2019 programs offered by SDG&E, SCE, and PG&E. The evaluated measures are described in greater detail in the next section.
The priorities of this evaluation effort and researchable issues this evaluation seeks to examine are described as follows:
1. Determine reasons for differences between evaluated (ex post) and reported (ex ante) savings, and as necessary, assess how to improve the ratio of evaluated savings to predicted savings (realization rates). Identify issues with respect to reported impact methods, inputs, procedures and make recommendations to improve savings estimates and realization rates of the evaluated measure groups.
2. Provide results and data that will assist with updating reported workpapers and the California Database for Energy Efficiency Resources (DEER) values.
3. Estimate the proportion of program-supported technology groups that would have been installed absent program support (free-ridership), determine the factors that characterize free-ridership, and as necessary, provide recommendations on how free-ridership could be reduced.
4. Provide timely feedback to the CPUC, PAs, and other stakeholders on the evaluation research study to facilitate timely program improvements and support future program design efforts and reported impact estimates.
The impact evaluation team (“the team”) is made up of DNV GL, Energy Resource Solutions (ERS), and GC Green Inc. The team achieved these objectives by reviewing program data, conducting virtual site visits and phone surveys, and collecting operating parameters for the measures to support the evaluated gross savings estimates. The team estimated net savings based on survey responses from HVAC market actors and end-use customers.
2.2. Evaluated measure groups For PY2019 we evaluated both gross and net saving impacts for one ESPI measure groups and gross impacts only for one non-ESPI measure group. The measure groups selected for this evaluation effort were chosen based on several considerations, primary among them:
ESPI status in PY2019 and, to a lesser extent, in subsequent years
DNV GL Energy Insights USA, Inc. Page 10
The measure group’s ranked contribution to first year and lifetime savings
Year-over-year trends in savings contributions
Previous evaluation activity and findings
The measure groups being evaluated for the 2021 Bus Stop are:
PTAC controls. The PTAC controls measure group was included in the 2019 ESPI uncertain list and contributed over 19% of the total HVAC portfolio first year electric energy savings. These ESPI measures involve retrofit add-on controls to PTAC units in lodging guest rooms. The controls either modify setpoints of the guest room PTAC unit when the room is unoccupied or adjust the supply fan speed to optimize the PTAC unit’s cooling delivery.
Rooftop/split systems. These non-ESPI measures, higher-efficiency package rooftop (RTUs) or split HVAC systems, are delivered primarily through upstream, distributor-focused programs and are generally a one-to-one replacement of existing HVAC units. This measure group was selected for gross savings evaluation due to its large contribution to the HVAC portfolio, recent ESPI status, and previous evaluation findings.
Details on these evaluated HVAC measure groups and the programs that provide them are described next.
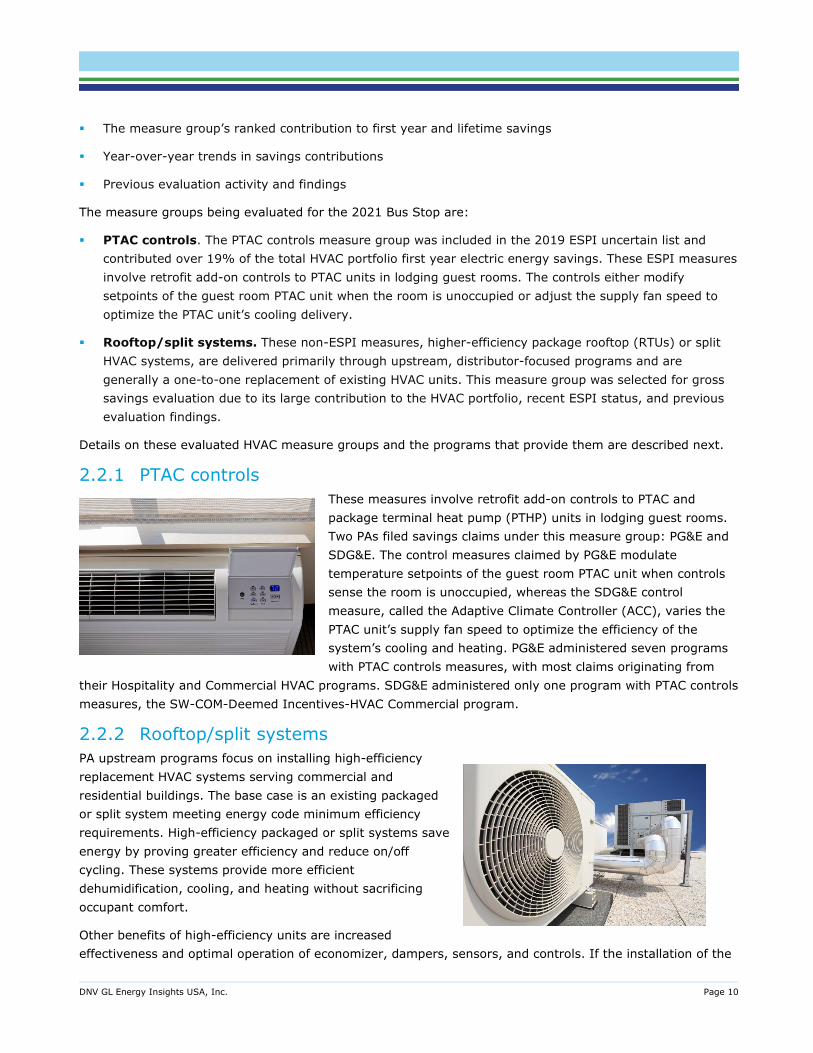
2.2.1 PTAC controls These measures involve retrofit add-on controls to PTAC and package terminal heat pump (PTHP) units in lodging guest rooms. Two PAs filed savings claims under this measure group: PG&E and SDG&E. The control measures claimed by PG&E modulate temperature setpoints of the guest room PTAC unit when controls sense the room is unoccupied, whereas the SDG&E control measure, called the Adaptive Climate Controller (ACC), varies the PTAC unit’s supply fan speed to optimize the efficiency of the system’s cooling and heating. PG&E administered seven programs with PTAC controls measures, with most claims originating from
their Hospitality and Commercial HVAC programs. SDG&E administered only one program with PTAC controls measures, the SW-COM-Deemed Incentives-HVAC Commercial program.
2.2.2 Rooftop/split systems PA upstream programs focus on installing high-efficiency replacement HVAC systems serving commercial and residential buildings. The base case is an existing packaged or split system meeting energy code minimum efficiency requirements. High-efficiency packaged or split systems save energy by proving greater efficiency and reduce on/off cycling. These systems provide more efficient dehumidification, cooling, and heating without sacrificing occupant comfort.
Other benefits of high-efficiency units are increased effectiveness and optimal operation of economizer, dampers, sensors, and controls. If the installation of the

DNV GL Energy Insights USA, Inc. Page 11
rooftop or split system achieves optimal system efficiency, power input to the unit will be reduced and the unit will achieve the operating temperature setpoint more quickly than a standard efficiency unit would require.
2.3. Overview of approach This section of the report provides high level descriptions of the evaluation approaches used to evaluate gross savings or net attribution estimates for the selected measure groups.
2.3.1 PTAC controls For the program year 2019 PTAC controls evaluation, the evaluation team applied an enhanced rigor approach to evaluate the gross savings and a standard rigor approach to evaluate the net attribution of savings. This section describes the aspects of determining gross and net savings estimates that are specific to this measure group.
Due to the COVID-19 pandemic, conducting on-site data collection for this evaluation was not prudent. Therefore, our data collection activities consisted of remote verification of measure installation and key parameters to estimate gross savings and interviews with end-user decision makers to quantify program attribution.
We conducted in-depth phone/web-based interviews with the participant site contacts to verify the installation, collect building characteristics and equipment specific information from the affected PTAC/PTHP units, assess the baseline operation, and obtain details about pre- and post- installation occupancy rates, equipment run times and temperature set-point schedules of the guest rooms. The PAs provided the utility meter consumption information for the program populations to inform us of the pre-retrofit energy consumption. We also obtained data logged by on-site guest room energy management systems (GREMS) from the vendor for an available subset of PG&E sites in the sample.
We utilized the collected data to adjust critical measure-specific operational input parameters in baseline eQUEST DEER prototype models. The appropriate DEER prototype model based on building type, building vintage, and climate zone were selected for each project for this exercise. Baseline models were constructed that represent how the guest room energy systems were operated in the pre-installation scenario, including HVAC, lighting, and appliances. We also used the pre-installation monthly and AMI consumption data obtained for the facility to verify seasonality and daily occupancy/usage patterns of guest rooms estimated by the baseline eQUEST models.
With an appropriate baseline model developed for each project, we developed a similar site-specific as-built model in eQUEST by modifying independent variables.
Some of the independent variables we modified in the site-specific models included:
Post-installation set-points and schedules
Reported occupancy rates
Fan motor operation
Operational data found in vendor provided GREMS logs
These two models form the basis of evaluating the savings for this measure. For each sampled project, the adjusted baseline and as-built models were simulated to produce ex-post unit energy savings (UES)

DNV GL Energy Insights USA, Inc. Page 12
estimates which were then multiplied by the number of units installed (for PG&E projects) or capacity of PTAC/PTHP units affected by the measure (in tons, for SDG&E projects) to estimate the ex-post energy savings at the project level.
Net attribution estimations were based on responses from survey of the participant decision makers. The surveys asked decision makers when (timing) and how many (quantity) PTAC controls they would have purchased in absence of the program. The timing and quantity dimensions each received a free-ridership score. Then total free-ridership was calculated as the product of the timing and quantity free-ridership scores. Attribution was calculated as one minus the total free-ridership. Program and PA level NTGRs were then calculated by summing the product of attribution and tracked savings at the site-level and dividing by the sum of the site-level tracked savings:
𝑁𝑁𝑁𝑁𝑁𝑁𝑁𝑁 = ∑𝐴𝐴𝐴𝐴𝐴𝐴𝐴𝐴𝐴𝐴𝐴𝐴𝐴𝐴𝐴𝐴𝐴𝐴𝐴𝐴𝐴𝐴 ∗ 𝑁𝑁𝐴𝐴𝑇𝑇𝑇𝑇𝑇𝑇𝑇𝑇𝑇𝑇 𝑠𝑠𝑇𝑇𝑠𝑠𝐴𝐴𝐴𝐴𝑠𝑠𝑠𝑠
∑𝑁𝑁𝐴𝐴𝑇𝑇𝑇𝑇𝑇𝑇𝑇𝑇𝑇𝑇 𝑠𝑠𝑇𝑇𝑠𝑠𝐴𝐴𝐴𝐴𝑠𝑠𝑠𝑠
2.3.2 Rooftop/split systems For the gross savings evaluation of rooftop or split system measure group, we conducted a detailed desk review of claimed unit energy savings (UES) to identify specific discrepancies that led to the previous year’s (PY2018) low gross realization rate. In order to categorize and develop causes for discrepancies, we utilized the PY2018 evaluation data and collected building type information for the PY2019 sample through PA data requests and web searches.
Desk review tasks included workpaper reviews, DEER measure definition review, and review and comparison of DEER eQUEST simulations to DEER measure definitions. The desk review also searched for tracking data discrepancies like misapplication of DEER or workpaper UES savings values.
Gross savings for PY2019 were estimated using building types collected through web searches and PY2018 ex-post gross measure saving results. Installation rates measured in PY2018 (83%) were not carried over for the PY2019 gross savings estimate. Instead, a 100% installation rate was assumed for PY2019. There were some limitations to how PY2018 savings were applied to PY2019 claims. The eQUEST models that were adjusted for the PY2018 ex-post savings did not include all building types, climate zones, and unit type combinations that were sampled for PY2019. For example, the PY2018 ex-post savings did not model the “less than 45 kBtuh” measure size because they were not present in the achieved PY2018 sample. As a result, some PY2019 claims did not have “ex-post” modeled savings results applied. Instead, other modifications were made to adjust the claimed savings. These modifications include:
Using verified building type to reference a deemed DEER savings value different from the claimed DEER savings value (e.g., DEER estimates different savings values for the generic “Commercial” and the specific “Assembly” building types)
Using verified climate zone to update the deemed DEER savings value (e.g., DEER estimates different savings values for the generic CZ = “IOU” and the specific CZ = "CZ13” climate zones)
For PY2019, the evaluation team did not conduct data collection on net attribution of the program’s influence on decision makers in addition to what was collected and analyzed in PY2018. The evaluated kWh net to gross ratio (NTGR) from PY2018 was applied to the PY2019 evaluated savings to arrive at net savings for
DNV GL Energy Insights USA, Inc. Page 13
PY2019. The evaluation team believes the PY2018-evaluated kWh NTGR was the best estimate of the programs’ influence. This conclusion was validated by interviews with PA program managers during workplan development that revealed that the 2019 programs for rooftop/split system measure group have not changed substantially from 2018 programs in terms of program design, delivery, marketing, and outreach. The PY2018 NTGRs were based on causal pathway surveys. DNV GL surveyed distributors to assess how the program changed their stocking, upselling, and pricing practices. We also surveyed end users to assess how the distributors’ stocking, upselling, and pricing affected their decisions. The NTGR calculation then combined the pathways to estimate how much the program affected end-user decisions indirectly through the changes in distributors’ behaviors.
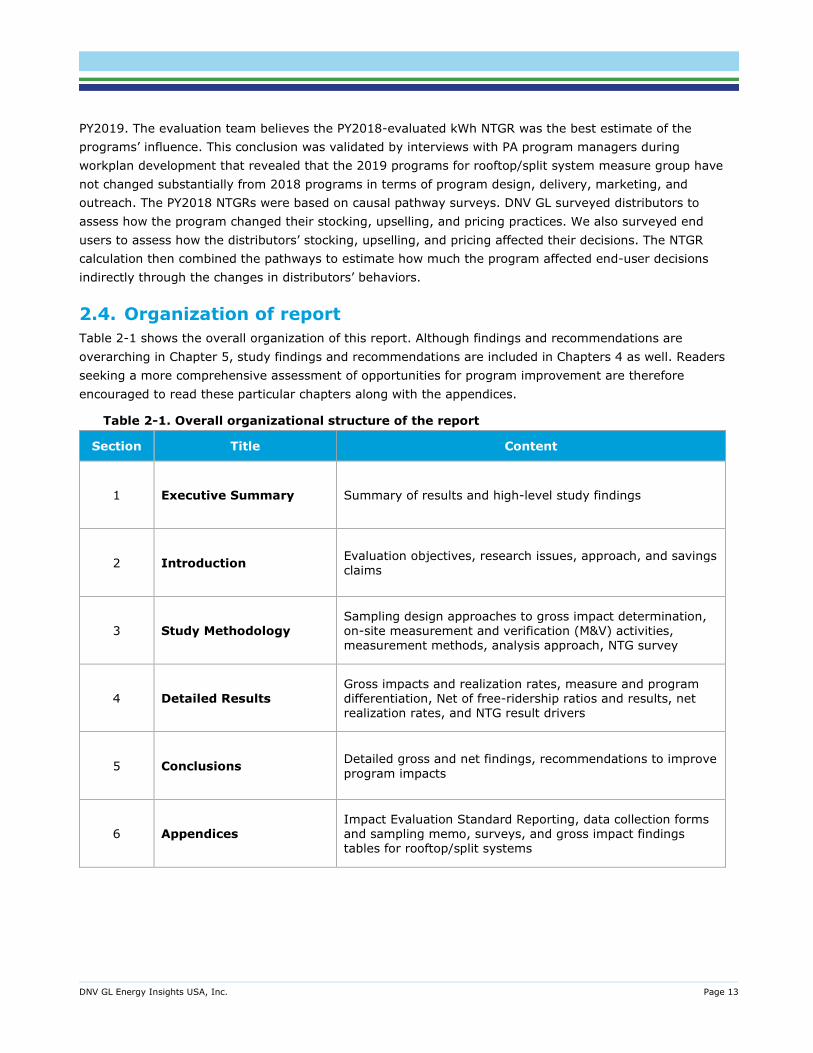
2.4. Organization of report Table 2-1 shows the overall organization of this report. Although findings and recommendations are overarching in Chapter 5, study findings and recommendations are included in Chapters 4 as well. Readers seeking a more comprehensive assessment of opportunities for program improvement are therefore encouraged to read these particular chapters along with the appendices.
Table 2-1. Overall organizational structure of the report
Section Title Content
1 Executive Summary Summary of results and high-level study findings
2 Introduction Evaluation objectives, research issues, approach, and savings claims
3 Study Methodology Sampling design approaches to gross impact determination, on-site measurement and verification (M&V) activities, measurement methods, analysis approach, NTG survey
4 Detailed Results Gross impacts and realization rates, measure and program differentiation, Net of free-ridership ratios and results, net realization rates, and NTG result drivers
5 Conclusions Detailed gross and net findings, recommendations to improve program impacts
6 Appendices Impact Evaluation Standard Reporting, data collection forms and sampling memo, surveys, and gross impact findings tables for rooftop/split systems
DNV GL Energy Insights USA, Inc. Page 14
3 METHODOLOGY The primary evaluation task was to verify the installation of the two selected incentivized HVAC measure groups across California. Gross impacts of kW, kWh, and therm savings were determined by collecting targeted input parameters via file reviews and phone interviews and analysis of acquired data. The analytic approach focused on the accuracy and precision of selected simulation inputs, which vary less than energy savings across building types and climate zone (CZ). The savings resulting from the revised assumptions were projected to all building type and CZ combinations for all the claimed measures using building energy simulations.
To estimate net savings, we developed net-to-gross-ratios (NTGRs) for each measure group and then applied them to the gross savings estimate calculated by the evaluation team. We derived the NTGR by estimating the influence various program activities had on distributor behavior, and how downstream end-users may have been influenced by the upstream program as well. For the downstream programs, program influence was determined from end-use customer interviews. By quantifying this influence, we were able to estimate what percent of the gross savings was attributable to this upstream program and what portion was free-ridership.
This section discusses the evaluation team’s methods of conducting the M&V for the primary tasks of this study including sample design, gross impact, net impact, data collection techniques, and data sources and constraints associated with the evaluation methodology.
3.1. Sample design The sampling methodology employs a stratified ratio estimation model that first places participants into segments of interest (by evaluated measure group and PA) and then into strata by size, measured in kWh and therm savings. The methodology then estimates appropriate sample sizes based on an assumed error ratio.
First, we defined sampling frames for each of the two HVAC measure groups that were evaluated for PY2019. The sampling frame for each measure group is the list of records under that measure group from which the sampling units are selected. Once sampling frames were defined, we stratified the population on the claimed energy savings (kWh or therms). Then we determined the target precisions and designed the sample to achieve ±10% relative precision for each measure group at the 90% confidence level using an assumed error ratio (ER) of 0.8 based on previous experience with similar studies.1 Once sample sizes were calculated, we randomly chose sample points from the population in each stratum.
Once data for the sample had been collected and ex-post savings for each site have been calculated, the measure group savings realization rate was calculated as:
1 The error ratio is the ratio-based equivalent of a coefficient of variation (CV). The CV measures the variability (standard deviation or root-mean-
square difference) of individual evaluated values around their mean value, as a fraction of that mean value. Similarly, the error ratio measures the variability (root-mean-square difference) of individual evaluated values from the ratio line Evaluated = Ratio multiplied by Reported, as a fraction of the mean evaluated value.
DNV GL Energy Insights USA, Inc. Page 15
∑
∑
=
== n
iii
n
iii
xw
ywb
1
1
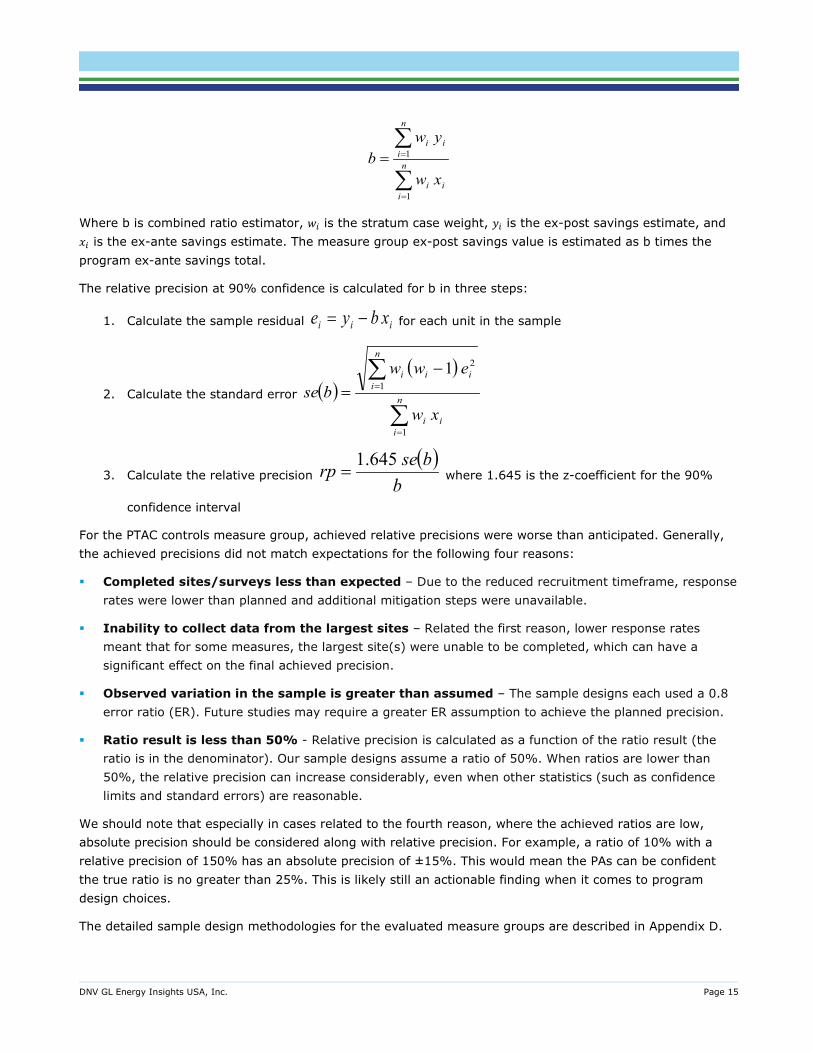
Where b is combined ratio estimator, 𝑤𝑤𝑖𝑖 is the stratum case weight, 𝑦𝑦𝑖𝑖 is the ex-post savings estimate, and 𝑥𝑥𝑖𝑖 is the ex-ante savings estimate. The measure group ex-post savings value is estimated as b times the program ex-ante savings total.
The relative precision at 90% confidence is calculated for b in three steps:
1. Calculate the sample residual iii xbye −= for each unit in the sample
2. Calculate the standard error ( )( )
∑
∑
=
=
−= n
iii
n
iiii
xw
ewwbse
1
1
21
3. Calculate the relative precision ( )
bbserp 645.1
= where 1.645 is the z-coefficient for the 90%
confidence interval
For the PTAC controls measure group, achieved relative precisions were worse than anticipated. Generally, the achieved precisions did not match expectations for the following four reasons:
Completed sites/surveys less than expected – Due to the reduced recruitment timeframe, response rates were lower than planned and additional mitigation steps were unavailable.
Inability to collect data from the largest sites – Related the first reason, lower response rates meant that for some measures, the largest site(s) were unable to be completed, which can have a significant effect on the final achieved precision.
Observed variation in the sample is greater than assumed – The sample designs each used a 0.8 error ratio (ER). Future studies may require a greater ER assumption to achieve the planned precision.
Ratio result is less than 50% - Relative precision is calculated as a function of the ratio result (the ratio is in the denominator). Our sample designs assume a ratio of 50%. When ratios are lower than 50%, the relative precision can increase considerably, even when other statistics (such as confidence limits and standard errors) are reasonable.
We should note that especially in cases related to the fourth reason, where the achieved ratios are low, absolute precision should be considered along with relative precision. For example, a ratio of 10% with a relative precision of 150% has an absolute precision of ±15%. This would mean the PAs can be confident the true ratio is no greater than 25%. This is likely still an actionable finding when it comes to program design choices.
The detailed sample design methodologies for the evaluated measure groups are described in Appendix D.
DNV GL Energy Insights USA, Inc. Page 16
3.2. Commercial HVAC measure group sample design DNV GL designed the sample to achieve ±10% relative precision at the 90% confidence level for each measure group. The gross sampling methodology for PTAC controls and rooftop/split systems measure groups employed a stratified ratio estimation model that places participants into strata by kWh savings. The methodology then estimated appropriate sample sizes based on an assumed error ratio. The assumed error ratio used was 0.8 based on our previous experience with similar impact studies.
The determination of the net program attribution for the commercial HVAC PTAC controls measure group used a census approach targeting the utility customers who are the decision makers being influenced by the programs.
In order to achieve ±10% relative precision at 90% confidence level, a total of 85 site-level sample points were targeted for the PTAC controls measure group gross sample, and 300 site sample points were targeted for the rooftop/split systems measure group gross sample. A census sample was attempted for the PTAC controls measure group net assessment. No net assessment of for the rooftop/split stems measure group was conducted for PY2019.
For the PTAC controls measure group, gross and net data collection began in August of 2020 for both the SDG&E and PG&E programs. While the total number of completed site assessments exceeded the target total, we were unable to achieve the target counts in every stratum due to isolated instances of customer refusal or non-response. In an effort to fulfill the targets by stratum, we attempted to contact every customer in each program with the exception of the lowest-saving projects in the PG&E Hospitality program. Details of the programs for which savings were claimed in this measure group are shown in Table 3-1.
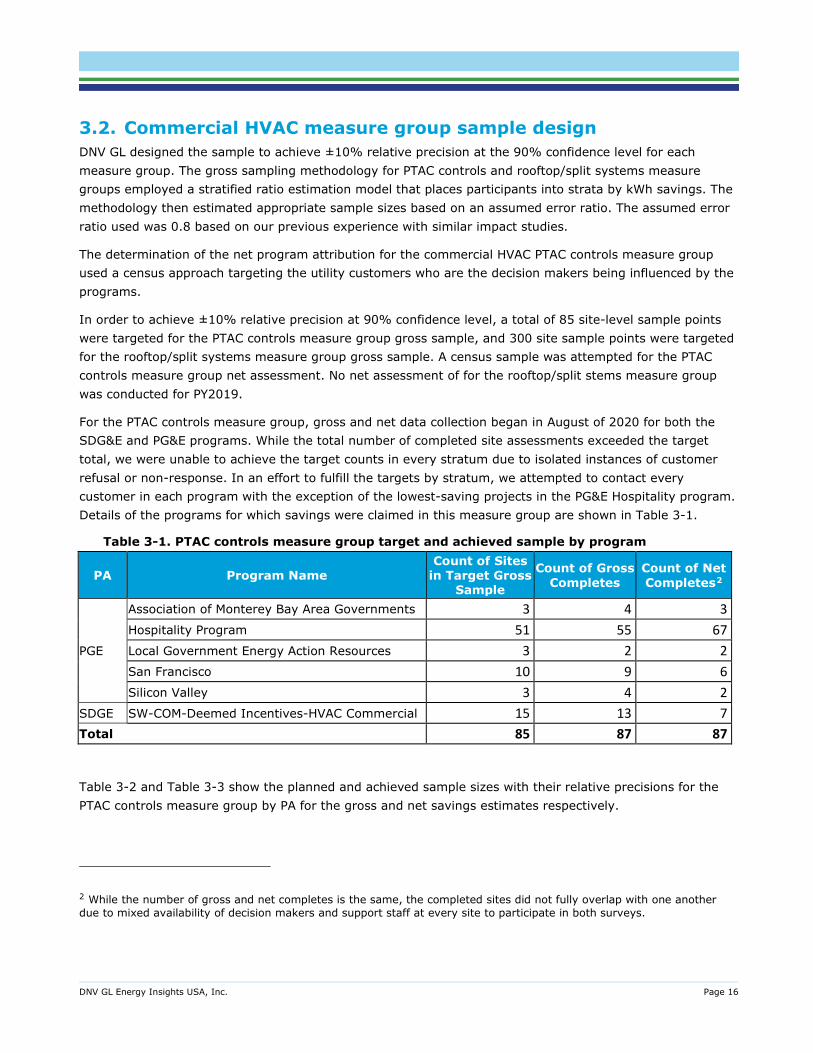
Table 3-1. PTAC controls measure group target and achieved sample by program
PA Program Name Count of Sites
in Target Gross Sample
Count of Gross Completes
Count of Net Completes2
PGE
Association of Monterey Bay Area Governments 3 4 3 Hospitality Program 51 55 67 Local Government Energy Action Resources 3 2 2 San Francisco 10 9 6 Silicon Valley 3 4 2
SDGE SW-COM-Deemed Incentives-HVAC Commercial 15 13 7 Total 85 87 87
Table 3-2 and Table 3-3 show the planned and achieved sample sizes with their relative precisions for the PTAC controls measure group by PA for the gross and net savings estimates respectively.
2 While the number of gross and net completes is the same, the completed sites did not fully overlap with one another due to mixed availability of decision makers and support staff at every site to participate in both surveys.

DNV GL Energy Insights USA, Inc. Page 17
Table 3-2. PTAC controls gross sample by PA
PA Population Size
Planned Sample Size3
Planned Relative Precision at
90% Confidence4
Completed Sample Size
Achieved Relative Precision at 90%
Confidence
PGE 162 70 11.3% 74 15.4% SDGE 30 15 19.0% 13 2.5% Total 1,738 85 10.6% 87 14.6%
Table 3-3. PTAC controls net sample by PA
PA Population Size
Planned Sample
Size
Planned Relative Precision at
90% Confidence Completed
Sample Size Achieved Relative Precision at 90%
Confidence PGE 162 - - 80 3.1% SDGE 30 - - 7 0.2% Total 1,738 - - 87 2.9%
For the rooftop/split systems measure group, all planned sample points were achieved as planned because no direct participant surveys or data collection requiring study participant recruitment was conducted. Instead, a detailed desk review was performed using available tracking data and supplemented with equipment installation addresses collected after an additional PA data request. We were able to complete all 300 sample points by using the PY2018 ex-post eQUEST modeling results combined with other discrepancy analysis methods described in 3.4.2. The achieved relative precision is better than the target due to overall less variation between the evaluated savings and PA-reported savings for the 300 sample sites.
Table 3-4 shows the planned and achieved sample sizes with their relative precisions for the rooftop/split systems measure group by PA for the gross savings estimate.
Table 3-4. Rooftop/split system gross sample by PA
PA Population Size
Planned Sample
Size
Planned Relative Precision at
90% Confidence Completed
Sample Size Achieved Relative Precision at 90%
Confidence PGE 1,140 120 11.1% 120 13.2% SCE 786 120 9.8% 120 9.7% SDGE 153 60 9.4% 60 12.3% Total 2,079 300 9.6% 300 7.7%
3.3. Data collection This section addresses the data collection plans for the two measure groups selected for evaluation for the HVAC sector.
3 No sample size was planned as census was attempted for quantifying net impacts. 4 No planned precision as no sample design was planned for net assessment.
DNV GL Energy Insights USA, Inc. Page 18
3.3.1 PTAC controls This section addresses the data collection plans for the PTAC / PTHP controls measure groups selected for evaluation for the HVAC sector. We contacted end-users via PA-provided contact information to interview staff with knowledge of the project (for gross data collection) along with decision makers who chose to finance the projects with support from utility rebates (for net). The next sections provide details of gross and net data collection activities for the PTAC controls measure group.
3.3.1.1 Gross Data Collection For each of the 87 completes in Table 3-1, we performed comprehensive gross data collection and “virtual M&V” through a combination of videoconferences, telephone calls, emails, and photograph exchanges. Virtual M&V allowed remote verification of measure installation and data collection on the impacted equipment and facility, despite the ongoing COVID-19 pandemic.
An assigned engineer conducted a virtual audit with knowledgeable facility staff by first confirming key project tracking details through a battery of questions. Appendix E contains the gross data collection instruments (PG&E and SDG&E) for the PTAC controls measure group. We then performed a remote inspection of the installed controls and affected PTACs or PTHPs within a selection of guest rooms. When possible, evaluation engineers remotely inspected systems via live video feed (e.g., FaceTime, Zoom), but if facility staff were unable to accommodate video, we conducted a phone call during which facility staff answered questions about the controls and impacted equipment while physically inspecting the affected equipment. For all methods of virtual M&V conducted, we requested photographs of the impacted PTAC and PTHP unit nameplate for verification and incorporation in the model.
Following the inspection, we asked the facility representative a battery of questions to collect information about both the installed and pre-existing guest room HVAC controls along with details about the facility and its general operation. The survey battery included the topics listed below and can be found in full in Appendix E.
Make and model of installed controls,
Make and model number of all impacted PTAC, PTHP, or Split A/C units,
Pre-existing control types, setpoints, and usage patterns,
Post-project control schemes including typical occupied and unoccupied setpoints, and override patterns
Pre- and post-project occupancy along with any notable changes to the facility’s operations or energy consumption, including seasonality
Facility details including building square footage, number of floors, and total number of guest rooms,
Common area information including HVAC and lighting inventories along with other energy-intensive end-uses (e.g., elevators, swimming pools, fitness centers, etc.)
The virtual M&V process also included our request and collection of cloud-based, temperature and occupancy trend data directly from the controls manufacturer affiliated with PG&E’s programs. This pre- and post-project trend data covered as many pre-pandemic months in 2019 and 2020 as were available among 50 participating facilities. While site-specific data was not available for all 87 sample points, we processed and parsed the available data by key segments (e.g., hotel/motel, assisted living) to be as representative of
DNV GL Energy Insights USA, Inc. Page 19
PY2019 participants as possible. This trended data provided evaluation-grade performance data as robust as would have been obtained if field M&V were possible.
Additionally, we requested and received monthly billing and AMI data from the PAs for all sampled facilities. This facility-level data allowed us to compare modeled and actual building-level energy consumption and hourly usage patterns, as further detailed in section 3.4.1.1.
3.3.1.2 Net Data Collection For net savings assessment, our team interviewed end-user decision-makers using PA-provided contact information. In several cases, the most knowledgeable facility contact for gross interview was not the project decision-maker; rather, the assigned engineers obtained the contact information for the project decision-maker. We pursued these decision-makers to ensure the most appropriate net-to-gross survey responses possible.
The net attribution interview included questions to determine the decision makers’ awareness of the program; their motivation for pursuing equipment upgrades; and the influence of PA programs, rebates, and trade allies in the selection of equipment and the timing of installation. Overall, we attempted to contact all 192 sites in the population and completed 87 end-user interviews. Appendix E includes a copy of the PTAC controls net data collection instrument.
3.3.2 Rooftop/split systems For the rooftop/split systems measure group, DNV GL requested additional tracking data for the 1,152 PGE21015 program claims within the evaluation sample of 300 sites containing 2,188 claims.5 The data request filled the installation address gap—there were many claims where customer information (customer name, customer address, customer email, customer phone number, etc.) was not accurate. In most cases distributor and contractor information were provided instead of customer contact information and location. For example, 791 claims within the sampled 1,152 PGE21015 claims had the same customer contact information – a participating HVAC distributor.
This additional data request provided correct equipment installation site addresses. We performed web searches to determine the building types of the installation addresses. The discovered building types were used to assign DEER-specific building types to the 1,563 claims that reported a “Com” building type.6 The installation addresses were also used to assign a specific climate zone for the 118 sampled claims that reported an “IOU” climate zone.
3.4. Gross methodology This section presents the methods by which we developed our gross savings estimates. Our gross impact assessment involved standard M&V approaches to extent appropriate and practical, including desk reviews, phone data collection, virtual-site inspections, analysis and building simulation for representative sample for two (2) selected measure groups in HVAC sector. The gross impact analysis: (a) developed evaluated estimates of the energy and demand savings for each site in the sample, and (b) applied those findings back against the full measure group population to obtain population estimates of the measure group impacts. The
5 We also attempted to request additional data for the SCE-13-SW-002F program; however, installation addresses were not available for the claims. 6 Not all claims with an installation site address could be assigned a DEER-specific building type. Of the 1,563 claims with a reported “Com” building
type, 78 claims retained the “Com” building type. For most of these claims, a DEER-specific building type was not assigned because we could not confidently determine which building type to apply. For those cases, the “Com” building type was considered to be appropriate to use.
DNV GL Energy Insights USA, Inc. Page 20
evaluation team utilized PA and implementer-collected information, including project-implementer’s submitted project files/documentation, supplemented by data collected for this evaluation.
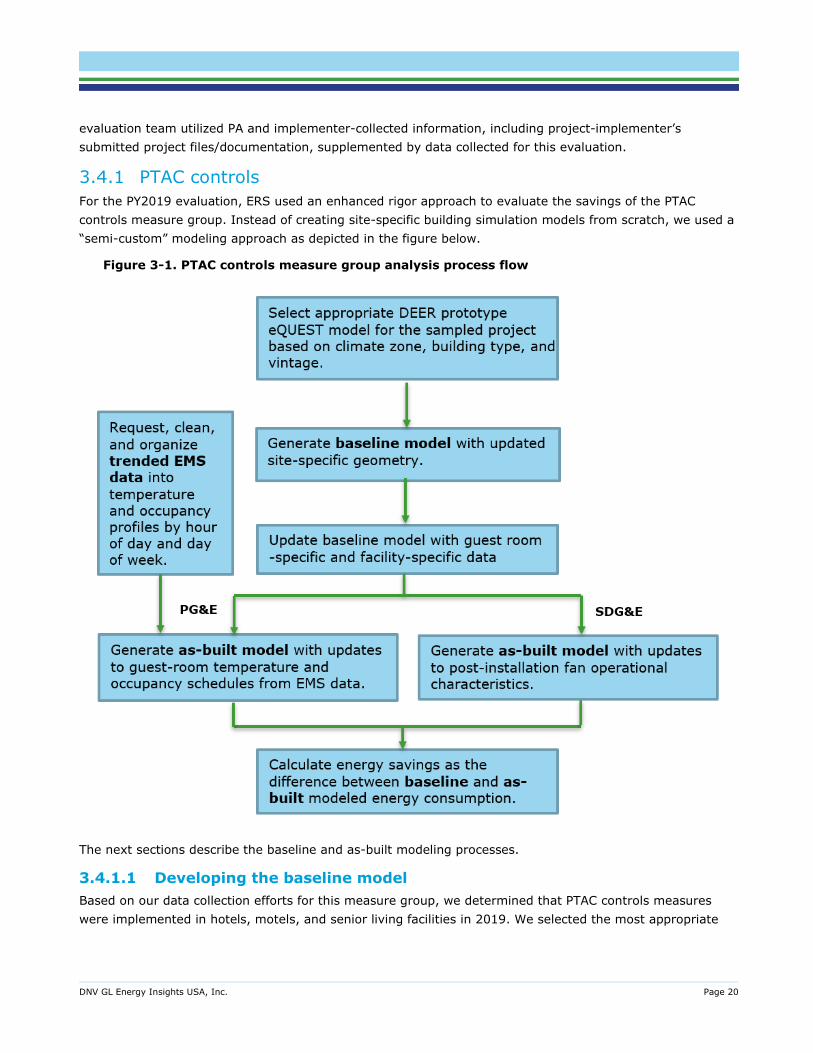
3.4.1 PTAC controls For the PY2019 evaluation, ERS used an enhanced rigor approach to evaluate the savings of the PTAC controls measure group. Instead of creating site-specific building simulation models from scratch, we used a “semi-custom” modeling approach as depicted in the figure below.
Figure 3-1. PTAC controls measure group analysis process flow
The next sections describe the baseline and as-built modeling processes.
3.4.1.1 Developing the baseline model Based on our data collection efforts for this measure group, we determined that PTAC controls measures were implemented in hotels, motels, and senior living facilities in 2019. We selected the most appropriate
DNV GL Energy Insights USA, Inc. Page 21
DEER prototype building model7 for each of those classifications; in the case of senior living facilities, we determined the nursing home prototype to be most appropriate.
Evaluation engineers next updated the DEER prototype model’s library files to reflect real-world data collected during virtual M&V. We revised building geometries to reflect actual facility area (in square feet) and percentage area contributions from each space type (e.g., guest rooms vs. common areas). Then, we generated the appropriate baseline model for each sampled project based on building type, building vintage, and climate zone using simulation generator software called MASControl3.8 In the created baseline eQUEST9 model, we adjusted critical input parameters that represent how the guest room’s energy-consuming systems operated in the pre-installation scenario, including HVAC, lighting, and plug loads. We also updated the baseline model’s guest room cooling setpoints and schedules, heating setpoints and schedules, and occupancy schedules as determined from trend data provided directly by the controls manufacturer (see below subsection).
As a final step in baseline model development, we compared the baseline model to the weather-normalized, pre-installation monthly electric billing data as provided by the PAs. This comparison with billed electric consumption data generally instilled confidence in baseline model accuracy and, in some cases, led us to refine inputs to reflect real-world operating conditions more appropriately (e.g., common area plug loads and senior living patient room equipment power densities).
3.4.1.2 Manufacturer EMS data processing We requested hourly data for cooling temperature setpoints, heating temperature setpoints, and occupancy rates from the controls manufacturer for all 162 projects incented by the PG&E programs offering the PTAC controls measure in PY2019. The controls manufacturer provided cloud-based data trends for 50 PY2019 projects spanning 35 of the 74 achieved sample of PG&E projects. Each project’s data included hourly average readings of temperature setpoints, and the occupancy status for individual guest rooms, and covered approximately 10 months in the post-installation period on average.
We reviewed the data trends in depth to parse out any erroneous values prior to utilizing them in the analysis. We cleaned, processed, and filtered the dataset to include only periods that were not affected by COVID-19 (prior to March 2020). Next, we aggregated the data at the project level to estimate daily profiles for cooling temperature setpoints, heating temperature setpoints, and occupancy rates for both rented and non-rented rooms. For sampled projects for which data was not provided by the controls manufacturer, we aggregated and averaged the data from similar projects with available data to estimate daily profiles for use in the analysis. Since the trended data represented only the post-installation period, we assumed the pre-installation cooling and heating setpoints to be equal to the average post-installation setpoints during occupied periods.
7 The CPUC and California Energy Commission (CEC) developed DEER prototype building models to allow comprehensive assessment of building
energy performance for 23 building types assumed to be representative of California’s non-residential building stock. The prototype building models encompass six vintage tiers and 16 California climate zones. The DEER prototype models are in eQUEST format, as defined in the footnote below. The PTAC controls measure workpapers for both PG&E and SDG&E reference ex-ante unit energy savings as estimated from DEER prototype models.
8 MASControl is CPUC’s model-based measure analysis software, created to generate DEER prototypical buildings and to estimate impacts from pre-developed DEER measures. The software application allows the use of existing prototypes to address non-DEER measures.
9 eQUEST is building energy simulation software that estimates building energy performance as a function of numerous, interdependent internal and external factors, such as material selection, mechanical and electrical systems, solar orientation, climate, and occupant usage.
DNV GL Energy Insights USA, Inc. Page 22
3.4.1.3 Developing the as-built model – PG&E measure group Once an appropriate baseline model was developed for each sampled project, we developed a similar site-specific, post-installation (i.e., “as-built”) model using the ‘parametric runs’ feature in eQUEST. This was done by modifying independent variables such as post-installation guest room cooling, and heating set point schedules, and occupancy schedules based on the trend data described previously.
3.4.1.4 Developing the as-built model – SDG&E measure group Using the ‘parametric runs’ feature of eQUEST, we updated the post-installation PTAC/PTHP supply fan operational characteristics based on the control module’s operation as described by the manufacturer. We modified the model to reflect ‘continuous’ fan operation instead of ‘intermittent’ in the baseline model, resulting in fan savings intended from the measure.10
3.4.1.5 Evaluated savings calculation The baseline and as-built models form the basis of the evaluated savings for the PTAC controls measure. For each project in the sample, we ran the models through the eQUEST simulation to produce annual energy consumption totals and peak demand estimates11 for baseline and as-built conditions. The differences in energy consumption and peak demand between the two models defines the modeled evaluated savings. We next calculated the evaluated unit energy savings (UES) as the quotient of modeled evaluated savings and the number of modeled guest rooms. Finally, to account for any discrepancies in installation rate (e.g., equipment removal or override), we multiplied the number of eligible guest rooms with the evaluated UES values to determine the final evaluated energy and peak demand savings.
The analysis results and reasons for differences between reported and evaluated energy savings for this measure group are detailed in Section 4.1.
3.4.2 Rooftop/split systems The PY2019 evaluation focus for the rooftop/split systems measure group centered on determining reasons for discrepancy between ex-ante savings, for which this measure group predominantly uses unmodified DEER measures, and the PY2018 savings methodology. In effect, the PY2019 and PY2018 savings methodologies are equivalent.
To assess gross savings for the rooftop/split systems technology group, we used existing reporting data (PY2019) and its supporting sources, PY2018-developed energy simulation outputs, and web research. We performed a thorough desk review of reported savings sources, reviewed and corrected the reported technology installation locations, assigned the appropriate building type based on the web research of the actual installation location, and then applied PY2018 developed evaluation savings estimates where appropriate. As the rooftop/split measure group technology, the baseline, and the market did not appreciably change from PY2018 to PY2019, the evaluation team expects the PY2018 evaluated gross UES values are the best estimates of gross impacts available to apply to PY2019.
10 Evaluators received limited information on the SDG&E PTAC controls technology. We worked directly with the controls manufacturer to request all
available information on supporting pilot M&V, lab tests, or other independent, evaluation-style assessments of technology performance. The manufacturer ultimately provided a single redacted study that involved M&V on five controls installations on PTACs within multifamily dwelling units. The M&V study demonstrated that the controls directly impacted the fan motor speed and energy consumption but had only minimal impact on the PTAC compressor. Based on this available literature and our understanding of the technology, we modeled the SDG&E controls measure to impact the simulated fan mode and speed.
11 We used the peak period definitions by climate zone per their corresponding DEER peak hours using the DEER2014 weather data (Title 24 2013).
DNV GL Energy Insights USA, Inc. Page 23
For PY2018, the gross savings methodology estimated savings by using site-collected data to adjust critical model input parameters for the ex-ante savings models. The adjusted models were then run for every climate zone, building type, vintage, and unit type combination used across all upstream programs. These model runs were used to produce ex-post savings estimates for each climate zone, building type, and unit type combination. The ex-post gross savings were obtained by recalculating the savings for all the program populations using the revised estimates. In order to obtain combined vintage average values, the DEER weights were applied to individual vintage estimates.
The discrepancy methodology approach was broken in to five steps, with each step quantifying its portion of the difference between ex-ante and ex-post savings. All five discrepancy steps summed together equals the difference between ex-ante and ex-post savings. The discrepancy steps are as follows, starting from the tracking (ex-ante) savings:
1. Apply workpaper savings using tracking building type and climate zone:
This discrepancy targets the impact of claims that reported using an implementation ID and measure code (from a workpaper or workpaper savings table) but the reported UES is different from the measure code UES.
2. Apply DEER database (READI) UES using tracking building type and climate zone:
This discrepancy step measures impacts from claims whose referenced workpaper measure code UES do not agree with the corresponding DEER UES. We used the program claims’ workpapers DEER version and measure references to cross check with the savings values reported in the DEER database (via the READI program).12 There were program claims whose workpapers referenced DEER measure savings; however, the claimed savings did not match the DEER savings when cross checked.
3. Apply DEER UES with new building type:
Using the new customer installation addresses obtained during data collection, we assigned DEER-specific building types to program claims that used the weighted “Com” building type.
4. Apply DEER UES with new building type and climate zone:
Like step three, the installation addresses allowed us to assign a specific climate zone to program claims that used the weighted “IOU” climate zone.
5. Apply PY2018 ex-post modeled results with new building type and climate zone.
The PY2018 savings methodology was used to assign ex-post savings to program claims, where applicable.
3.5. Net methodology This section provides an overview of the net savings methodology used to calculate the net to gross ratios (NTGRs) for two evaluated commercial HVAC measure groups.
3.5.1 PTAC controls Information that informed our determination of net program attribution came from enhanced participant self-report surveys. We designed phone surveys to:
12 Using the READI program available from http://deeresources.com/

DNV GL Energy Insights USA, Inc. Page 24
1. Carefully screen respondents in a way that ensured they understood the program and measures we were calling about.
2. Gather data on free-ridership to allow us to calculate NTGRs. The surveys included two free-ridership questions, one on quantity and one on timing. We did not include a question for intermediate efficiency because we determined these measures have only two levels of efficiency: standard or program-level.
3. Gather open-ended data to confirm the free-ridership scoring.
4. Gather additional information about program awareness and contractor communication.
3.5.1.1 Timing Free-ridership Timing free-ridership was assessed with question NTG_T1. Question wording, answers, and scoring are shown in Table 3-5.
Table 3-5. Timing free-ridership scoring NTG_T1. If you had not received these energy management systems through the program in 2019, when would you have purchased them in the absence of the program?
Timing Free-ridership score
At the same time or sooner FRt = 1 1 to 24 months later FRt = 0.67 25 to 48 months later FRt = 0.33 More than 48 months later FRt = 0 Never FRt = 0 Don't know FRt = average of non-DK or R responses
The survey additionally asked respondents an open-ended question to confirm why they selected their answer to question NTG_T1. These questions were reviewed and found to be consistent with the answers given on NTG_T1. There was one case where DNV GL adjusted the NTG_T1 based on the open-ended question. The participant answered “don’t know” to NTG_T1 and said “Within a year if they were aware of the technology” to the open-ended question. DNV GL scored this participant as 1 to 24 months later for NTG_T1.
3.5.1.2 Quantity free-ridership Quantity free-ridership was assessed with question NTG_Q1:
NTG_Q1. If you had not received these energy management systems through the program, how many would you have purchased and installed, at an equipment cost of approximately $250-300/ unit?
The free-ridership score was calculated as:
FRq = Answer to NTG_Q1 ÷ Total number of measures installed
The survey additionally asked respondents an open-ended question to confirm why they selected their answer to question NTG_Q1. These questions were reviewed and found to be consistent with the answers given on NTG_Q1.
3.5.1.3 Total attribution The first step to calculate total attribution was to calculate combined free-ridership. We combine the individual free-ridership components before converting to attribution to maintain fairness. Multiplying
DNV GL Energy Insights USA, Inc. Page 25
fractions together always results in a lower product than the inputs, and a 0 free-ridership on any dimension translates to a total free-ridership of 0.
FRtotal = FRt * FRq
Total attribution was then calculated as 1-FRtotal. We calculated total attribution for all respondents. To calculate total NTGR, we averaged the attribution scores across the respondents, weighted by the number of PTAC units claimed for each participant.
3.5.2 Rooftop/split systems For PY2019, the evaluation team did not conduct net-to-gross surveys to determine the net savings for the rooftop/split system measure group. Instead the evaluated net to gross ratios (NTGR) from PY2018 were applied to the PY2019 evaluated savings to arrive at net savings for PY2019 because the program design and delivery for the rooftop/split measure group did not changed from PY2018 to PY2019, and because the technology, baseline, and market did not appreciably change between the two program years. This conclusion was validated by the PA program managers while interviewing them during the development of workplan of the study. Therefore, the evaluation team expects the PY2018 evaluated NTGRs are the best estimate of program’s influence in the state they existed in during PY2018 and PY2019.
To establish program attribution for PY2018, we considered the pathways distributors take when selling a high efficiency HVAC unit, and the related pathways buyers take when purchasing one. Our goal was to develop an approach that considered these pathways in the context of the HVAC1 program design and real-world complexity. We created the term “causal pathway” to represent how the program may indirectly influence the final purchase decisions of buyers. We then used this approach to integrate NTG survey responses between buyers and the distributors into an overall NTG score.
Our methodology assumed that there were three main causal pathways of influence which impacted the HVAC equipment distributor, installation contractors, and end users. We derived these assumptions from the program logic model provided from the IOUs and conversations with program implementers. Distributors and buyers are both important when evaluating program attribution of this nature, and both were taken into consideration to formulate an overarching attribution score.
For PY2018, DNV GL surveyed distributors to assess how the program changed their stocking, upselling, and pricing practices. DNV GL also surveyed the end-users to assess how the distributors’ stocking, upselling, and pricing affected their decisions. The NTGR calculation then combined the pathways to estimate how much the program affected end-user decisions indirectly through the changes to the distributors’ behaviors.
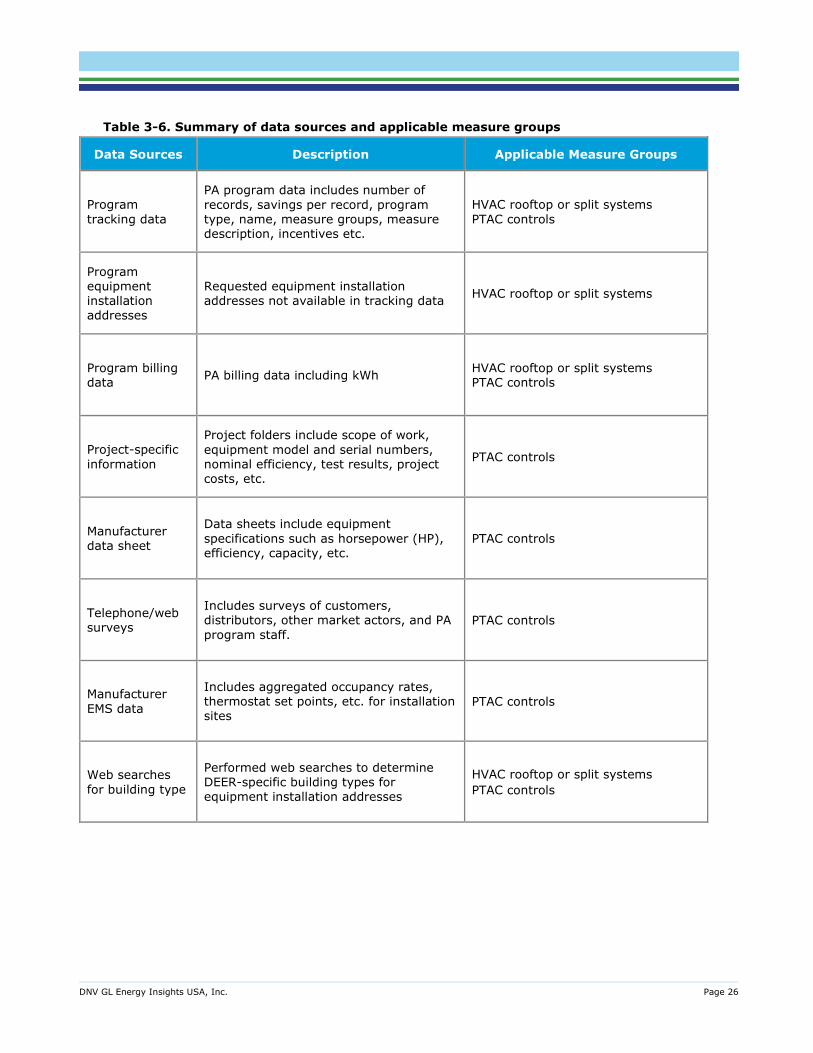
3.6. Data sources We based our savings estimates on data from several sources, summarized in Table 3-6. Appendix D provides the details of these data sources including contents and types of data and how we use them in the evaluation.
DNV GL Energy Insights USA, Inc. Page 26
Table 3-6. Summary of data sources and applicable measure groups
Data Sources Description Applicable Measure Groups
Program tracking data
PA program data includes number of records, savings per record, program type, name, measure groups, measure description, incentives etc.
HVAC rooftop or split systems PTAC controls
Program equipment installation addresses
Requested equipment installation addresses not available in tracking data HVAC rooftop or split systems
Program billing data PA billing data including kWh HVAC rooftop or split systems
PTAC controls
Project-specific information
Project folders include scope of work, equipment model and serial numbers, nominal efficiency, test results, project costs, etc.
PTAC controls
Manufacturer data sheet
Data sheets include equipment specifications such as horsepower (HP), efficiency, capacity, etc.
PTAC controls
Telephone/web surveys
Includes surveys of customers, distributors, other market actors, and PA program staff.
PTAC controls
Manufacturer EMS data
Includes aggregated occupancy rates, thermostat set points, etc. for installation sites
PTAC controls
Web searches for building type
Performed web searches to determine DEER-specific building types for equipment installation addresses
HVAC rooftop or split systems PTAC controls
DNV GL Energy Insights USA, Inc. Page 27
4 DETAILED RESULTS This section presents the results of the gross and net evaluations of the measure groups. Gross impact realization rates (GRRs) and first-year evaluated gross and net savings are presented in this section by PA for electric energy (kWh), electric demand (kW), and gas energy (therms). Appendix B contains the Impact Evaluation Standard Reporting (IESR) high-level savings and standard per-unit savings. Appendix C contains the tabularized report recommendations. The evaluation used the PA-reported EUL measure values to calculate lifetime savings from first year savings.
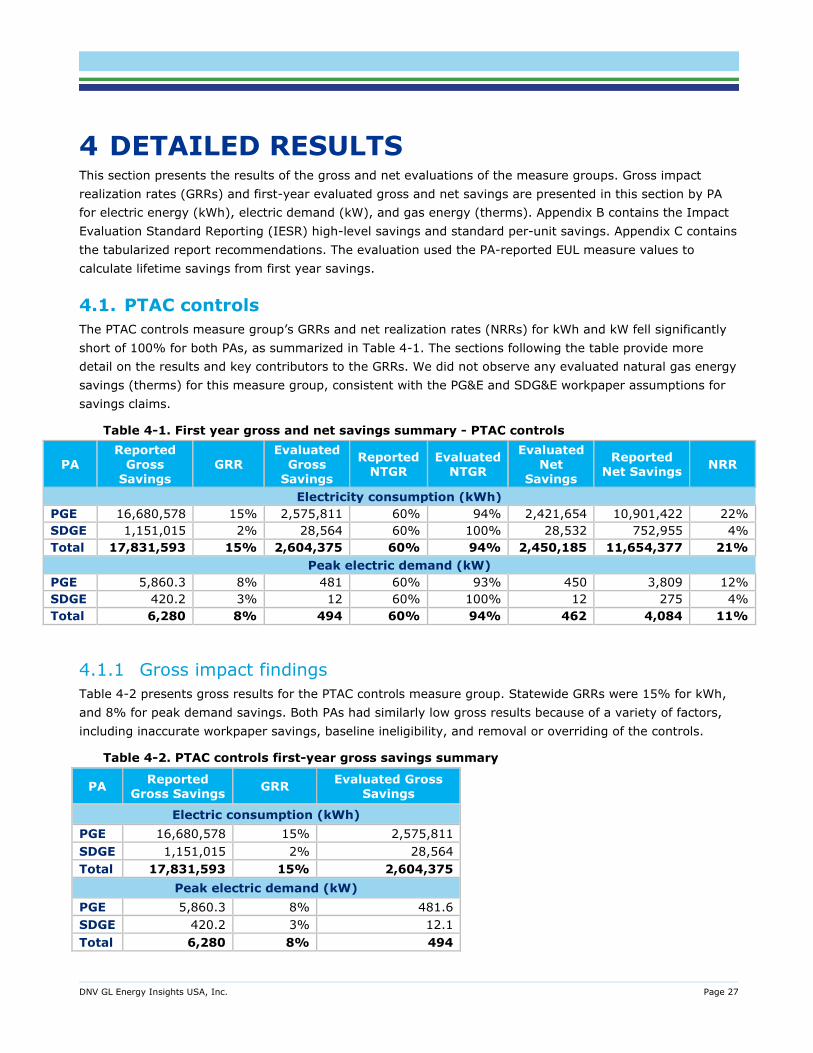
4.1. PTAC controls The PTAC controls measure group’s GRRs and net realization rates (NRRs) for kWh and kW fell significantly short of 100% for both PAs, as summarized in Table 4-1. The sections following the table provide more detail on the results and key contributors to the GRRs. We did not observe any evaluated natural gas energy savings (therms) for this measure group, consistent with the PG&E and SDG&E workpaper assumptions for savings claims.
Table 4-1. First year gross and net savings summary - PTAC controls
PA Reported
Gross Savings
GRR Evaluated
Gross Savings
Reported NTGR
Evaluated NTGR
Evaluated Net
Savings
Reported Net Savings
NRR
Electricity consumption (kWh) PGE 16,680,578 15% 2,575,811 60% 94% 2,421,654 10,901,422 22% SDGE 1,151,015 2% 28,564 60% 100% 28,532 752,955 4% Total 17,831,593 15% 2,604,375 60% 94% 2,450,185 11,654,377 21%
Peak electric demand (kW) PGE 5,860.3 8% 481 60% 93% 450 3,809 12% SDGE 420.2 3% 12 60% 100% 12 275 4% Total 6,280 8% 494 60% 94% 462 4,084 11%
4.1.1 Gross impact findings Table 4-2 presents gross results for the PTAC controls measure group. Statewide GRRs were 15% for kWh, and 8% for peak demand savings. Both PAs had similarly low gross results because of a variety of factors, including inaccurate workpaper savings, baseline ineligibility, and removal or overriding of the controls.
Table 4-2. PTAC controls first-year gross savings summary
PA Reported Gross Savings GRR Evaluated Gross
Savings
Electric consumption (kWh) PGE 16,680,578 15% 2,575,811 SDGE 1,151,015 2% 28,564 Total 17,831,593 15% 2,604,375
Peak electric demand (kW) PGE 5,860.3 8% 481.6 SDGE 420.2 3% 12.1 Total 6,280 8% 494
DNV GL Energy Insights USA, Inc. Page 28
Table 4-3 shows the population sizes, sample sizes, gross realization rates and relative precisions for the PTAC controls measure group. A greater-than-anticipated error ratio, which quantifies the variation in results among all sampled projects, resulted in achieved relative precisions that were slightly poorer than the ±10% relative precision (at the 90% confidence interval) that was targeted in the evaluation sample design.
Table 4-3. PTAC controls population, gross realization rate, and relative precisions
PA Population Size
Completed Sample
Size
kWh Gross Realization
Rate
kWh Achieved Relative Precision
kW Gross Realization
Rate
kW Achieved Relative
Precision†
PGE 162 74 15% 16% 8% 15%
SDGE 30 13 2% 14% 3% 19%
Total 192 87 15% 16% 8% 15%
The achieved relative precisions fell short of the target 10% at the 90% confidence interval. Gross relative precision is inversely proportional to GRR, and the low GRRs were therefore a notable contributor to the poorer-than-expected RPs.
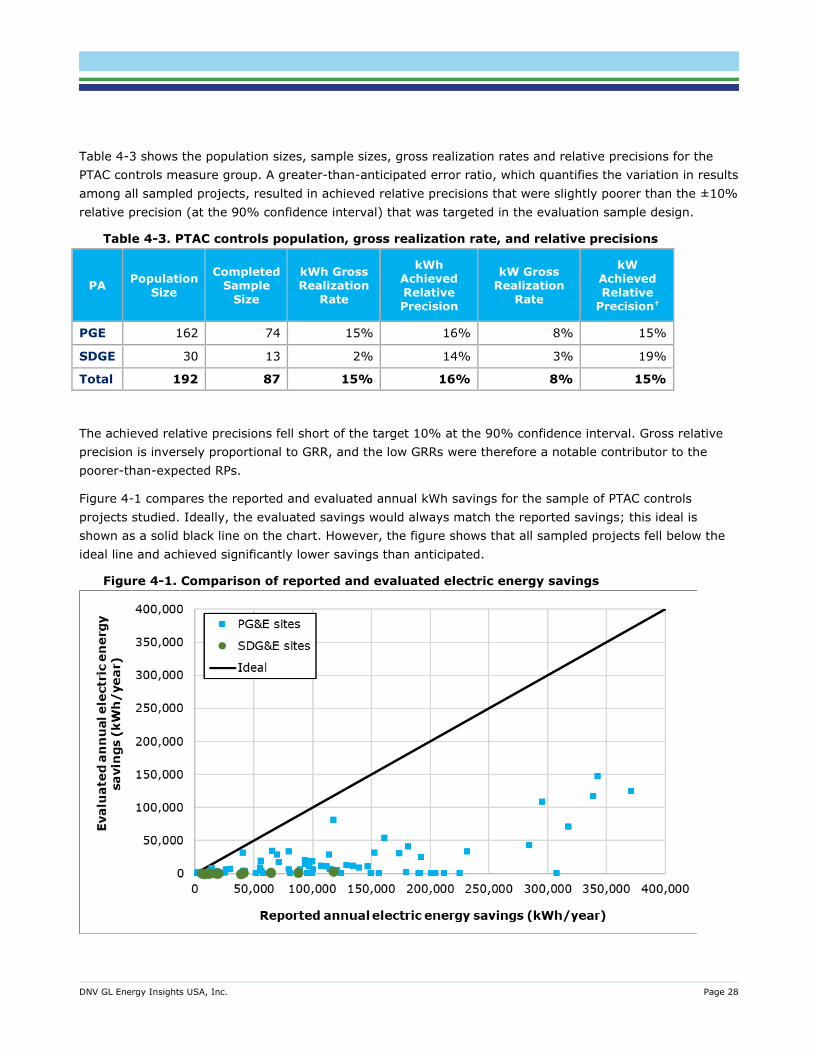
Figure 4-1 compares the reported and evaluated annual kWh savings for the sample of PTAC controls projects studied. Ideally, the evaluated savings would always match the reported savings; this ideal is shown as a solid black line on the chart. However, the figure shows that all sampled projects fell below the ideal line and achieved significantly lower savings than anticipated.
Figure 4-1. Comparison of reported and evaluated electric energy savings
DNV GL Energy Insights USA, Inc. Page 29
Figure 4-2 compares the reported and evaluated peak demand savings for the sample of PTAC controls projects studied. Ideally, the evaluated savings would always match the reported savings; this ideal is shown as a solid black line on the chart. Figure 4-2 shows that all sampled projects fell below the ideal line and achieved significantly lower peak demand savings than anticipated. To calculate the reported peak demand savings per unit, the PG&E workpaper multiplied the assumed base case duty cycle at peak load conditions, assumed runtime reduction, and assumed operating power, whereas the SDG&E workpaper multiplied the annual energy savings by a constant conversion factor of 0.0003848. To estimate the evaluated peak demand savings, we applied the difference between simulated baseline and as-built models during the peak hours from DEER2014 peak period definitions. The DEER2014 peak periods are defined by climate zone per their corresponding DEER peak hours using the DEER2014 weather data (Title 24 2013).
Figure 4-2. Comparison of reported and evaluated peak demand savings
The significant difference between reported and evaluated peak demand savings stem from two primary factors. First, there are discrepancies between assumed calculation parameters in the workpapers and actual site-specific PTAC/PTHP operational characteristics. Second, there are discrepancies in peak demand savings calculation methodologies between workpaper and evaluation (one-line calculation vs. simulated results).
4.1.1.1 Savings Discrepancy Analysis As part of the site-specific, “semi-custom” modeling approach detailed in Section 3.4.1, we quantified the key contributors to kWh GRR among ten discrepancy categories. These site-specific analyses allowed evaluators to quantify the overall discrepancies that led to a 15% kWh GRR and an 8% peak kW GRR for the PTAC controls measure group. The frequency and GRR magnitudes (both positive and negative) of each discrepancy category are illustrated in Table 4-4.
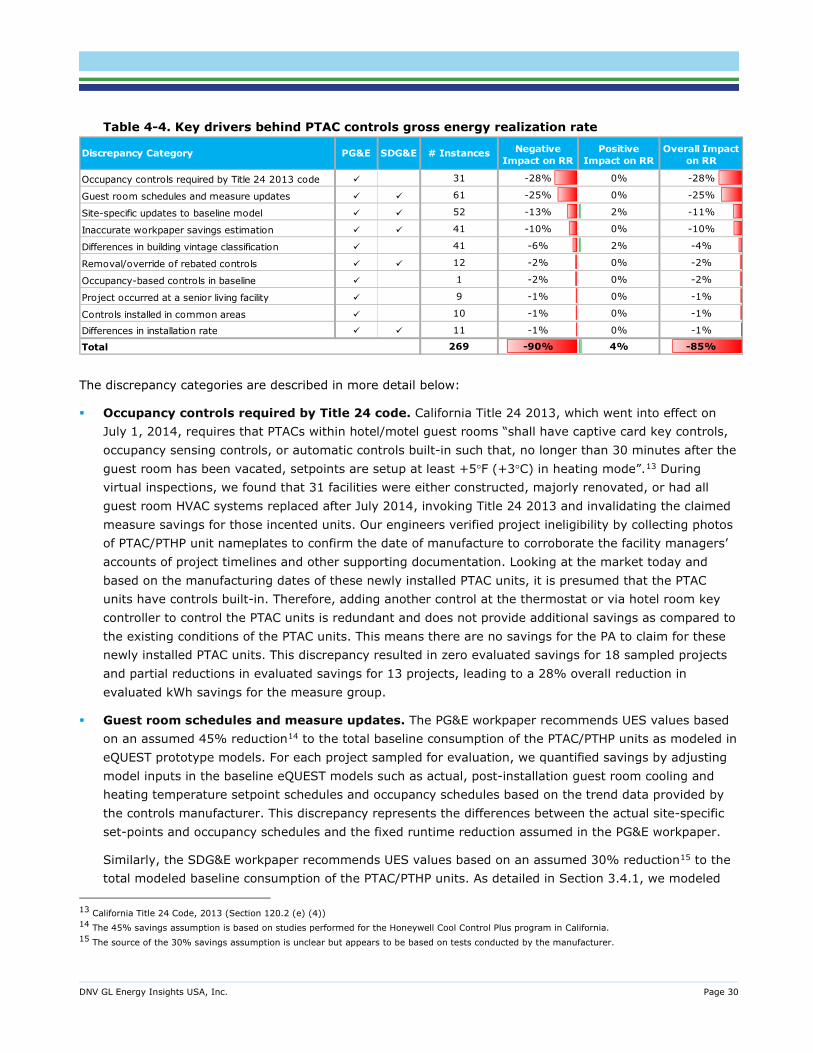
DNV GL Energy Insights USA, Inc. Page 30
Table 4-4. Key drivers behind PTAC controls gross energy realization rate
The discrepancy categories are described in more detail below:
Occupancy controls required by Title 24 code. California Title 24 2013, which went into effect on July 1, 2014, requires that PTACs within hotel/motel guest rooms “shall have captive card key controls, occupancy sensing controls, or automatic controls built-in such that, no longer than 30 minutes after the guest room has been vacated, setpoints are setup at least +5°F (+3°C) in heating mode”.13 During virtual inspections, we found that 31 facilities were either constructed, majorly renovated, or had all guest room HVAC systems replaced after July 2014, invoking Title 24 2013 and invalidating the claimed measure savings for those incented units. Our engineers verified project ineligibility by collecting photos of PTAC/PTHP unit nameplates to confirm the date of manufacture to corroborate the facility managers’ accounts of project timelines and other supporting documentation. Looking at the market today and based on the manufacturing dates of these newly installed PTAC units, it is presumed that the PTAC units have controls built-in. Therefore, adding another control at the thermostat or via hotel room key controller to control the PTAC units is redundant and does not provide additional savings as compared to the existing conditions of the PTAC units. This means there are no savings for the PA to claim for these newly installed PTAC units. This discrepancy resulted in zero evaluated savings for 18 sampled projects and partial reductions in evaluated savings for 13 projects, leading to a 28% overall reduction in evaluated kWh savings for the measure group.
Guest room schedules and measure updates. The PG&E workpaper recommends UES values based on an assumed 45% reduction14 to the total baseline consumption of the PTAC/PTHP units as modeled in eQUEST prototype models. For each project sampled for evaluation, we quantified savings by adjusting model inputs in the baseline eQUEST models such as actual, post-installation guest room cooling and heating temperature setpoint schedules and occupancy schedules based on the trend data provided by the controls manufacturer. This discrepancy represents the differences between the actual site-specific set-points and occupancy schedules and the fixed runtime reduction assumed in the PG&E workpaper.
Similarly, the SDG&E workpaper recommends UES values based on an assumed 30% reduction15 to the total modeled baseline consumption of the PTAC/PTHP units. As detailed in Section 3.4.1, we modeled
13 California Title 24 Code, 2013 (Section 120.2 (e) (4)) 14 The 45% savings assumption is based on studies performed for the Honeywell Cool Control Plus program in California. 15 The source of the 30% savings assumption is unclear but appears to be based on tests conducted by the manufacturer.
Occupancy controls required by Title 24 2013 code 31 -28% 0% -28%
Guest room schedules and measure updates 61 -25% 0% -25%
Site-specific updates to baseline model 52 -13% 2% -11%
Inaccurate workpaper savings estimation 41 -10% 0% -10%
Differences in building vintage classification 41 -6% 2% -4%
Removal/override of rebated controls 12 -2% 0% -2%
Occupancy-based controls in baseline 1 -2% 0% -2%
Project occurred at a senior living facility 9 -1% 0% -1%
Controls installed in common areas 10 -1% 0% -1%
Differences in installation rate 11 -1% 0% -1%
269 -90% 4% -85%
Overall Impact on RR
Total
Discrepancy Category PG&E SDG&E # Instances Negative Impact on RR
Positive Impact on RR
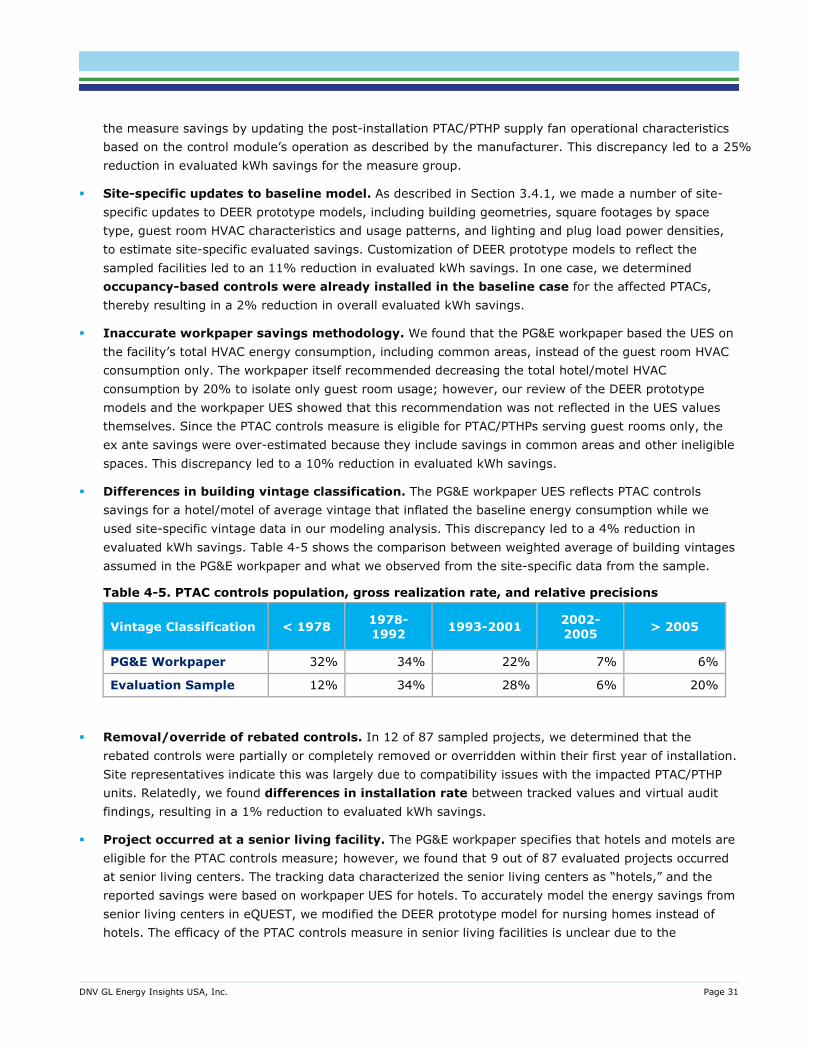
DNV GL Energy Insights USA, Inc. Page 31
the measure savings by updating the post-installation PTAC/PTHP supply fan operational characteristics based on the control module’s operation as described by the manufacturer. This discrepancy led to a 25% reduction in evaluated kWh savings for the measure group.
Site-specific updates to baseline model. As described in Section 3.4.1, we made a number of site-specific updates to DEER prototype models, including building geometries, square footages by space type, guest room HVAC characteristics and usage patterns, and lighting and plug load power densities, to estimate site-specific evaluated savings. Customization of DEER prototype models to reflect the sampled facilities led to an 11% reduction in evaluated kWh savings. In one case, we determined occupancy-based controls were already installed in the baseline case for the affected PTACs, thereby resulting in a 2% reduction in overall evaluated kWh savings.
Inaccurate workpaper savings methodology. We found that the PG&E workpaper based the UES on the facility’s total HVAC energy consumption, including common areas, instead of the guest room HVAC consumption only. The workpaper itself recommended decreasing the total hotel/motel HVAC consumption by 20% to isolate only guest room usage; however, our review of the DEER prototype models and the workpaper UES showed that this recommendation was not reflected in the UES values themselves. Since the PTAC controls measure is eligible for PTAC/PTHPs serving guest rooms only, the ex ante savings were over-estimated because they include savings in common areas and other ineligible spaces. This discrepancy led to a 10% reduction in evaluated kWh savings.
Differences in building vintage classification. The PG&E workpaper UES reflects PTAC controls savings for a hotel/motel of average vintage that inflated the baseline energy consumption while we used site-specific vintage data in our modeling analysis. This discrepancy led to a 4% reduction in evaluated kWh savings. Table 4-5 shows the comparison between weighted average of building vintages assumed in the PG&E workpaper and what we observed from the site-specific data from the sample.
Table 4-5. PTAC controls population, gross realization rate, and relative precisions
Vintage Classification < 1978 1978-1992 1993-2001 2002-
2005 > 2005
PG&E Workpaper 32% 34% 22% 7% 6%
Evaluation Sample 12% 34% 28% 6% 20%
Removal/override of rebated controls. In 12 of 87 sampled projects, we determined that the rebated controls were partially or completely removed or overridden within their first year of installation. Site representatives indicate this was largely due to compatibility issues with the impacted PTAC/PTHP units. Relatedly, we found differences in installation rate between tracked values and virtual audit findings, resulting in a 1% reduction to evaluated kWh savings.
Project occurred at a senior living facility. The PG&E workpaper specifies that hotels and motels are eligible for the PTAC controls measure; however, we found that 9 out of 87 evaluated projects occurred at senior living centers. The tracking data characterized the senior living centers as “hotels,” and the reported savings were based on workpaper UES for hotels. To accurately model the energy savings from senior living centers in eQUEST, we modified the DEER prototype model for nursing homes instead of hotels. The efficacy of the PTAC controls measure in senior living facilities is unclear due to the
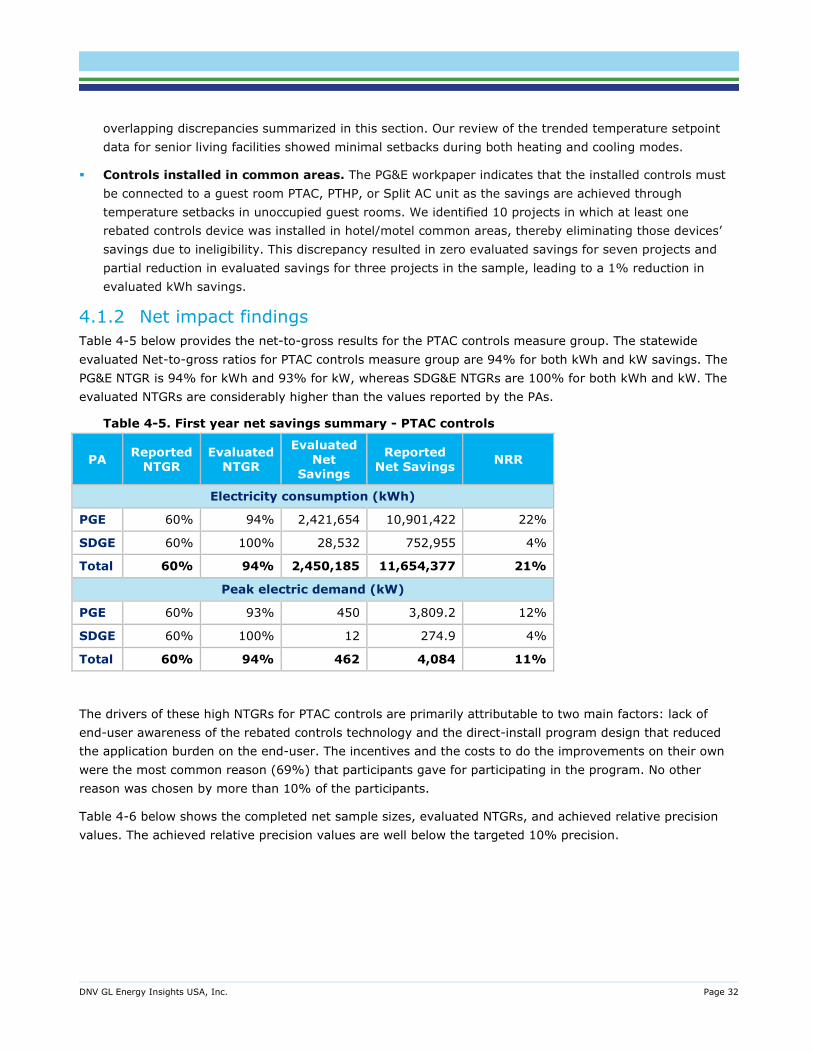
DNV GL Energy Insights USA, Inc. Page 32
overlapping discrepancies summarized in this section. Our review of the trended temperature setpoint data for senior living facilities showed minimal setbacks during both heating and cooling modes.
Controls installed in common areas. The PG&E workpaper indicates that the installed controls must be connected to a guest room PTAC, PTHP, or Split AC unit as the savings are achieved through temperature setbacks in unoccupied guest rooms. We identified 10 projects in which at least one rebated controls device was installed in hotel/motel common areas, thereby eliminating those devices’ savings due to ineligibility. This discrepancy resulted in zero evaluated savings for seven projects and partial reduction in evaluated savings for three projects in the sample, leading to a 1% reduction in evaluated kWh savings.
4.1.2 Net impact findings Table 4-5 below provides the net-to-gross results for the PTAC controls measure group. The statewide evaluated Net-to-gross ratios for PTAC controls measure group are 94% for both kWh and kW savings. The PG&E NTGR is 94% for kWh and 93% for kW, whereas SDG&E NTGRs are 100% for both kWh and kW. The evaluated NTGRs are considerably higher than the values reported by the PAs.
Table 4-5. First year net savings summary - PTAC controls
PA Reported NTGR
Evaluated NTGR
Evaluated Net
Savings
Reported Net Savings
NRR
Electricity consumption (kWh)
PGE 60% 94% 2,421,654 10,901,422 22%
SDGE 60% 100% 28,532 752,955 4%
Total 60% 94% 2,450,185 11,654,377 21%
Peak electric demand (kW)
PGE 60% 93% 450 3,809.2 12%
SDGE 60% 100% 12 274.9 4%
Total 60% 94% 462 4,084 11%
The drivers of these high NTGRs for PTAC controls are primarily attributable to two main factors: lack of end-user awareness of the rebated controls technology and the direct-install program design that reduced the application burden on the end-user. The incentives and the costs to do the improvements on their own were the most common reason (69%) that participants gave for participating in the program. No other reason was chosen by more than 10% of the participants.
Table 4-6 below shows the completed net sample sizes, evaluated NTGRs, and achieved relative precision values. The achieved relative precision values are well below the targeted 10% precision.
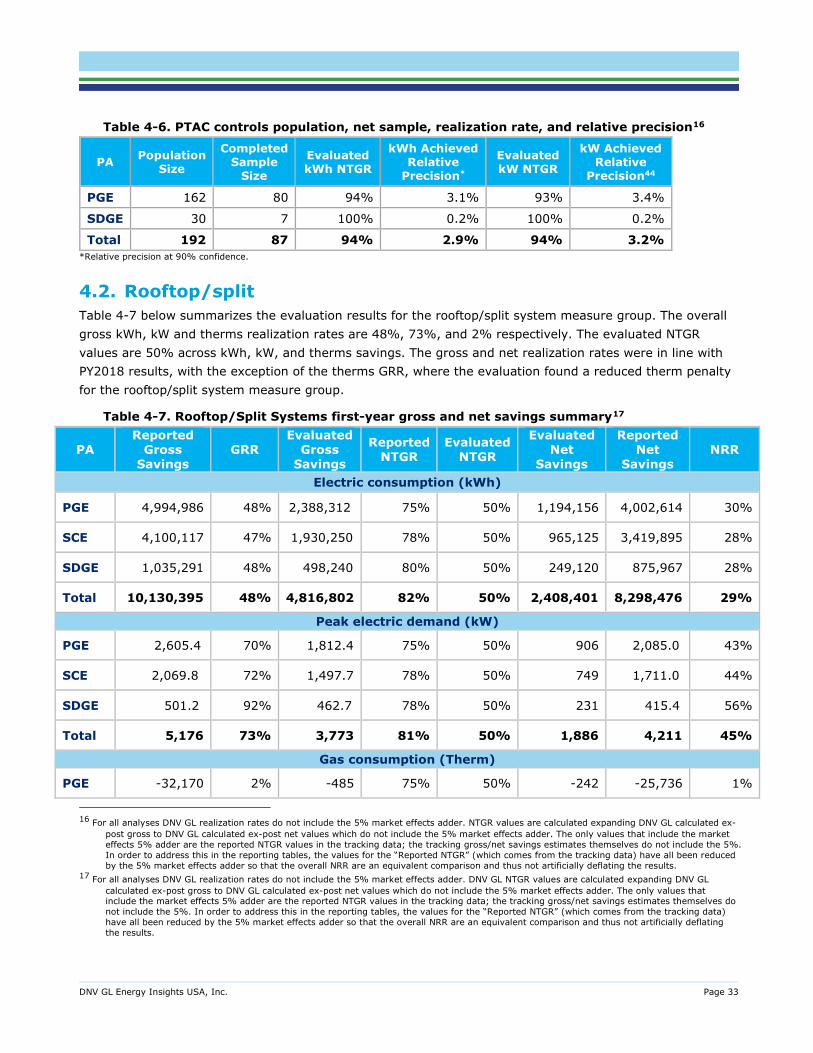
DNV GL Energy Insights USA, Inc. Page 33
Table 4-6. PTAC controls population, net sample, realization rate, and relative precision16
PA Population Size
Completed Sample
Size
Evaluated kWh NTGR
kWh Achieved Relative
Precision*
Evaluated kW NTGR
kW Achieved Relative
Precision44
PGE 162 80 94% 3.1% 93% 3.4%
SDGE 30 7 100% 0.2% 100% 0.2%
Total 192 87 94% 2.9% 94% 3.2% *Relative precision at 90% confidence.
4.2. Rooftop/split Table 4-7 below summarizes the evaluation results for the rooftop/split system measure group. The overall gross kWh, kW and therms realization rates are 48%, 73%, and 2% respectively. The evaluated NTGR values are 50% across kWh, kW, and therms savings. The gross and net realization rates were in line with PY2018 results, with the exception of the therms GRR, where the evaluation found a reduced therm penalty for the rooftop/split system measure group.
Table 4-7. Rooftop/Split Systems first-year gross and net savings summary17
PA Reported
Gross Savings
GRR Evaluated
Gross Savings
Reported NTGR
Evaluated NTGR
Evaluated Net
Savings
Reported Net
Savings
NRR
Electric consumption (kWh)
PGE 4,994,986 48% 2,388,312 75% 50% 1,194,156 4,002,614 30%
SCE 4,100,117 47% 1,930,250 78% 50% 965,125 3,419,895 28%
SDGE 1,035,291 48% 498,240 80% 50% 249,120 875,967 28%
Total 10,130,395 48% 4,816,802 82% 50% 2,408,401 8,298,476 29%
Peak electric demand (kW)
PGE 2,605.4 70% 1,812.4 75% 50% 906 2,085.0 43%
SCE 2,069.8 72% 1,497.7 78% 50% 749 1,711.0 44%
SDGE 501.2 92% 462.7 78% 50% 231 415.4 56%
Total 5,176 73% 3,773 81% 50% 1,886 4,211 45%
Gas consumption (Therm)
PGE -32,170 2% -485 75% 50% -242 -25,736 1%
16 For all analyses DNV GL realization rates do not include the 5% market effects adder. NTGR values are calculated expanding DNV GL calculated ex-
post gross to DNV GL calculated ex-post net values which do not include the 5% market effects adder. The only values that include the market effects 5% adder are the reported NTGR values in the tracking data; the tracking gross/net savings estimates themselves do not include the 5%. In order to address this in the reporting tables, the values for the “Reported NTGR” (which comes from the tracking data) have all been reduced by the 5% market effects adder so that the overall NRR are an equivalent comparison and thus not artificially deflating the results.
17 For all analyses DNV GL realization rates do not include the 5% market effects adder. DNV GL NTGR values are calculated expanding DNV GL calculated ex-post gross to DNV GL calculated ex-post net values which do not include the 5% market effects adder. The only values that include the market effects 5% adder are the reported NTGR values in the tracking data; the tracking gross/net savings estimates themselves do not include the 5%. In order to address this in the reporting tables, the values for the “Reported NTGR” (which comes from the tracking data) have all been reduced by the 5% market effects adder so that the overall NRR are an equivalent comparison and thus not artificially deflating the results.
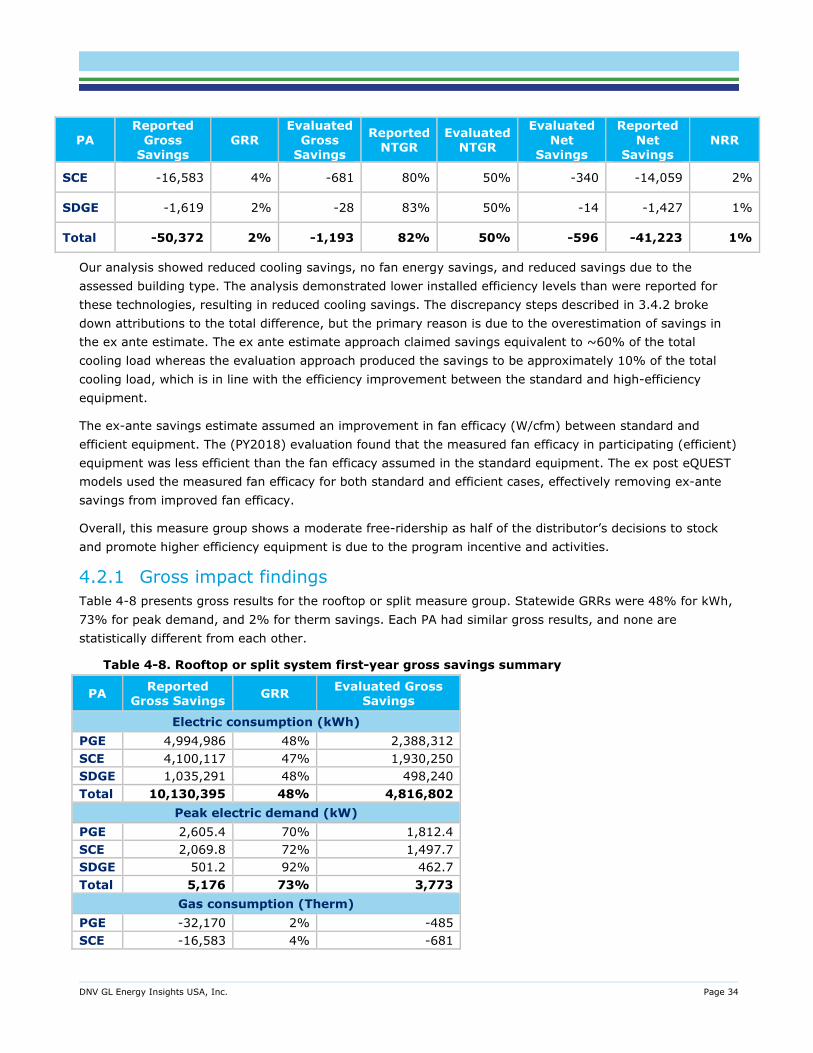
DNV GL Energy Insights USA, Inc. Page 34
PA Reported
Gross Savings
GRR Evaluated
Gross Savings
Reported NTGR
Evaluated NTGR
Evaluated Net
Savings
Reported Net
Savings
NRR
SCE -16,583 4% -681 80% 50% -340 -14,059 2%
SDGE -1,619 2% -28 83% 50% -14 -1,427 1%
Total -50,372 2% -1,193 82% 50% -596 -41,223 1%
Our analysis showed reduced cooling savings, no fan energy savings, and reduced savings due to the assessed building type. The analysis demonstrated lower installed efficiency levels than were reported for these technologies, resulting in reduced cooling savings. The discrepancy steps described in 3.4.2 broke down attributions to the total difference, but the primary reason is due to the overestimation of savings in the ex ante estimate. The ex ante estimate approach claimed savings equivalent to ~60% of the total cooling load whereas the evaluation approach produced the savings to be approximately 10% of the total cooling load, which is in line with the efficiency improvement between the standard and high-efficiency equipment.
The ex-ante savings estimate assumed an improvement in fan efficacy (W/cfm) between standard and efficient equipment. The (PY2018) evaluation found that the measured fan efficacy in participating (efficient) equipment was less efficient than the fan efficacy assumed in the standard equipment. The ex post eQUEST models used the measured fan efficacy for both standard and efficient cases, effectively removing ex-ante savings from improved fan efficacy.
Overall, this measure group shows a moderate free-ridership as half of the distributor’s decisions to stock and promote higher efficiency equipment is due to the program incentive and activities.
4.2.1 Gross impact findings Table 4-8 presents gross results for the rooftop or split measure group. Statewide GRRs were 48% for kWh, 73% for peak demand, and 2% for therm savings. Each PA had similar gross results, and none are statistically different from each other.
Table 4-8. Rooftop or split system first-year gross savings summary
PA Reported Gross Savings GRR Evaluated Gross
Savings
Electric consumption (kWh) PGE 4,994,986 48% 2,388,312 SCE 4,100,117 47% 1,930,250 SDGE 1,035,291 48% 498,240 Total 10,130,395 48% 4,816,802
Peak electric demand (kW) PGE 2,605.4 70% 1,812.4 SCE 2,069.8 72% 1,497.7 SDGE 501.2 92% 462.7 Total 5,176 73% 3,773
Gas consumption (Therm) PGE -32,170 2% -485 SCE -16,583 4% -681
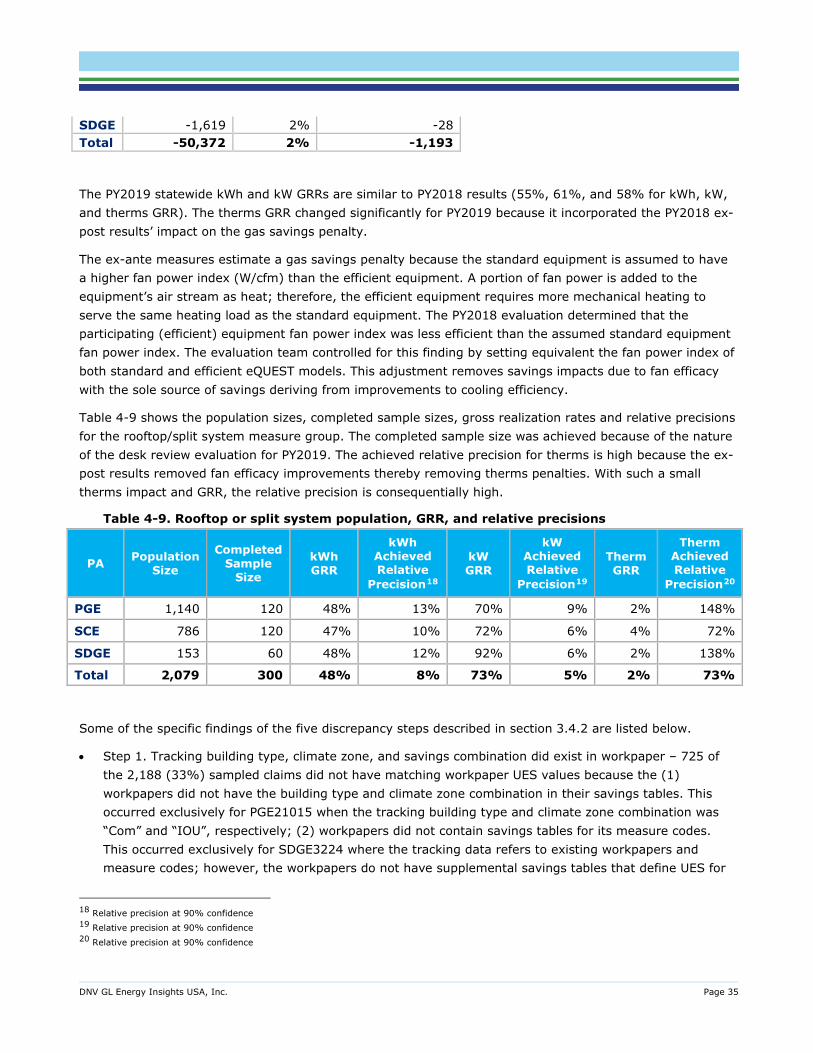
DNV GL Energy Insights USA, Inc. Page 35
SDGE -1,619 2% -28 Total -50,372 2% -1,193
The PY2019 statewide kWh and kW GRRs are similar to PY2018 results (55%, 61%, and 58% for kWh, kW, and therms GRR). The therms GRR changed significantly for PY2019 because it incorporated the PY2018 ex-post results’ impact on the gas savings penalty.
The ex-ante measures estimate a gas savings penalty because the standard equipment is assumed to have a higher fan power index (W/cfm) than the efficient equipment. A portion of fan power is added to the equipment’s air stream as heat; therefore, the efficient equipment requires more mechanical heating to serve the same heating load as the standard equipment. The PY2018 evaluation determined that the participating (efficient) equipment fan power index was less efficient than the assumed standard equipment fan power index. The evaluation team controlled for this finding by setting equivalent the fan power index of both standard and efficient eQUEST models. This adjustment removes savings impacts due to fan efficacy with the sole source of savings deriving from improvements to cooling efficiency.
Table 4-9 shows the population sizes, completed sample sizes, gross realization rates and relative precisions for the rooftop/split system measure group. The completed sample size was achieved because of the nature of the desk review evaluation for PY2019. The achieved relative precision for therms is high because the ex-post results removed fan efficacy improvements thereby removing therms penalties. With such a small therms impact and GRR, the relative precision is consequentially high.
Table 4-9. Rooftop or split system population, GRR, and relative precisions
PA Population Size
Completed Sample
Size
kWh GRR
kWh Achieved Relative
Precision18
kW GRR
kW Achieved Relative
Precision19
Therm GRR
Therm Achieved Relative
Precision20
PGE 1,140 120 48% 13% 70% 9% 2% 148%
SCE 786 120 47% 10% 72% 6% 4% 72%
SDGE 153 60 48% 12% 92% 6% 2% 138%
Total 2,079 300 48% 8% 73% 5% 2% 73%
Some of the specific findings of the five discrepancy steps described in section 3.4.2 are listed below.
• Step 1. Tracking building type, climate zone, and savings combination did exist in workpaper – 725 of the 2,188 (33%) sampled claims did not have matching workpaper UES values because the (1) workpapers did not have the building type and climate zone combination in their savings tables. This occurred exclusively for PGE21015 when the tracking building type and climate zone combination was “Com” and “IOU”, respectively; (2) workpapers did not contain savings tables for its measure codes. This occurred exclusively for SDGE3224 where the tracking data refers to existing workpapers and measure codes; however, the workpapers do not have supplemental savings tables that define UES for
18 Relative precision at 90% confidence 19 Relative precision at 90% confidence 20 Relative precision at 90% confidence
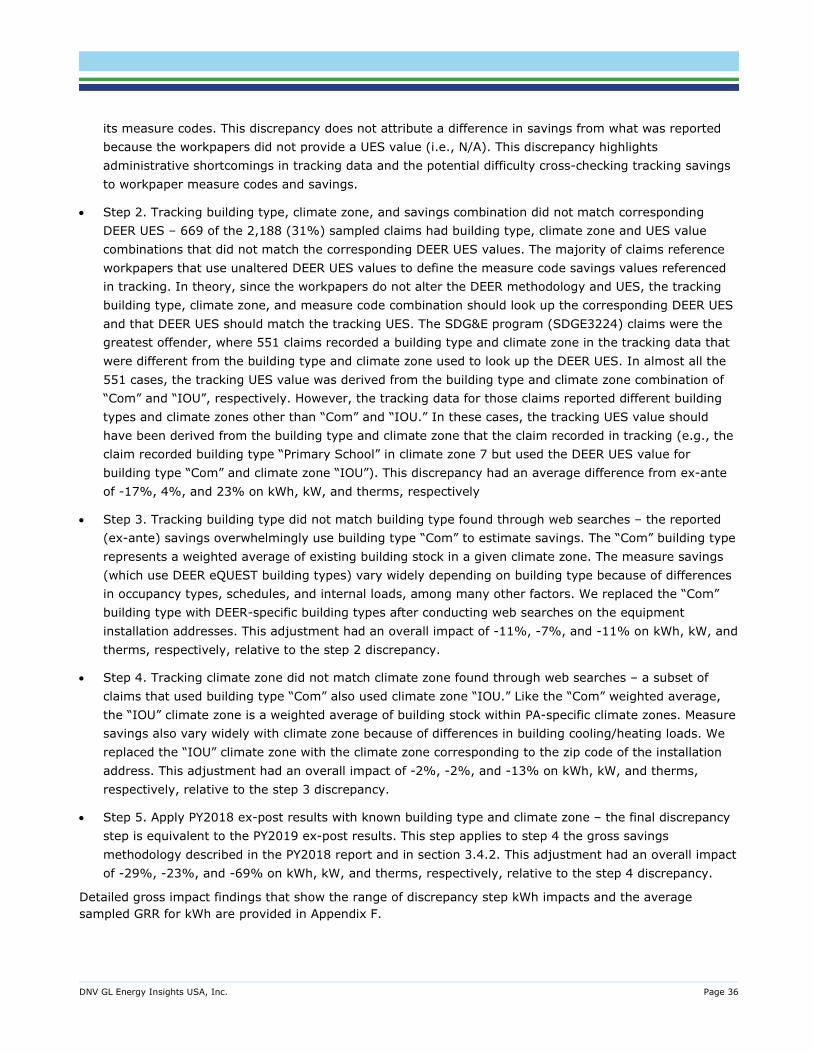
DNV GL Energy Insights USA, Inc. Page 36
its measure codes. This discrepancy does not attribute a difference in savings from what was reported because the workpapers did not provide a UES value (i.e., N/A). This discrepancy highlights administrative shortcomings in tracking data and the potential difficulty cross-checking tracking savings to workpaper measure codes and savings.
• Step 2. Tracking building type, climate zone, and savings combination did not match corresponding DEER UES – 669 of the 2,188 (31%) sampled claims had building type, climate zone and UES value combinations that did not match the corresponding DEER UES values. The majority of claims reference workpapers that use unaltered DEER UES values to define the measure code savings values referenced in tracking. In theory, since the workpapers do not alter the DEER methodology and UES, the tracking building type, climate zone, and measure code combination should look up the corresponding DEER UES and that DEER UES should match the tracking UES. The SDG&E program (SDGE3224) claims were the greatest offender, where 551 claims recorded a building type and climate zone in the tracking data that were different from the building type and climate zone used to look up the DEER UES. In almost all the 551 cases, the tracking UES value was derived from the building type and climate zone combination of “Com” and “IOU”, respectively. However, the tracking data for those claims reported different building types and climate zones other than “Com” and “IOU.” In these cases, the tracking UES value should have been derived from the building type and climate zone that the claim recorded in tracking (e.g., the claim recorded building type “Primary School” in climate zone 7 but used the DEER UES value for building type “Com” and climate zone “IOU”). This discrepancy had an average difference from ex-ante of -17%, 4%, and 23% on kWh, kW, and therms, respectively
• Step 3. Tracking building type did not match building type found through web searches – the reported (ex-ante) savings overwhelmingly use building type “Com” to estimate savings. The “Com” building type represents a weighted average of existing building stock in a given climate zone. The measure savings (which use DEER eQUEST building types) vary widely depending on building type because of differences in occupancy types, schedules, and internal loads, among many other factors. We replaced the “Com” building type with DEER-specific building types after conducting web searches on the equipment installation addresses. This adjustment had an overall impact of -11%, -7%, and -11% on kWh, kW, and therms, respectively, relative to the step 2 discrepancy.
• Step 4. Tracking climate zone did not match climate zone found through web searches – a subset of claims that used building type “Com” also used climate zone “IOU.” Like the “Com” weighted average, the “IOU” climate zone is a weighted average of building stock within PA-specific climate zones. Measure savings also vary widely with climate zone because of differences in building cooling/heating loads. We replaced the “IOU” climate zone with the climate zone corresponding to the zip code of the installation address. This adjustment had an overall impact of -2%, -2%, and -13% on kWh, kW, and therms, respectively, relative to the step 3 discrepancy.
• Step 5. Apply PY2018 ex-post results with known building type and climate zone – the final discrepancy step is equivalent to the PY2019 ex-post results. This step applies to step 4 the gross savings methodology described in the PY2018 report and in section 3.4.2. This adjustment had an overall impact of -29%, -23%, and -69% on kWh, kW, and therms, respectively, relative to the step 4 discrepancy.
Detailed gross impact findings that show the range of discrepancy step kWh impacts and the average sampled GRR for kWh are provided in Appendix F.
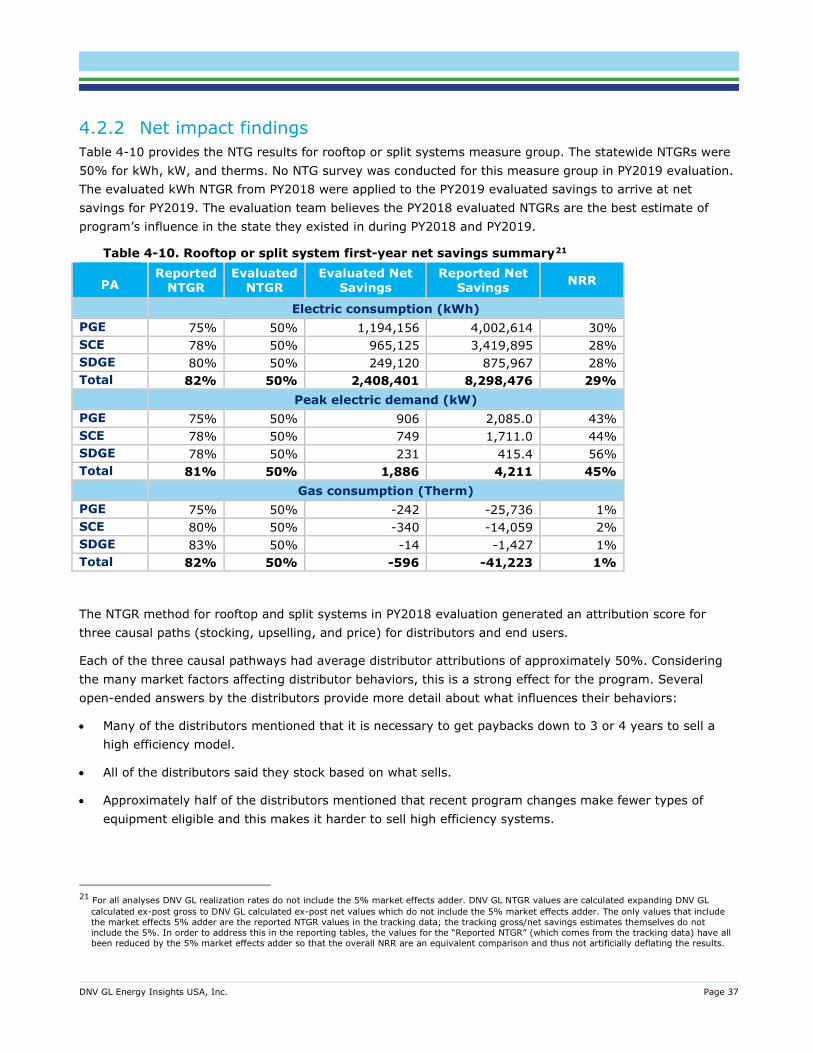
DNV GL Energy Insights USA, Inc. Page 37
4.2.2 Net impact findings Table 4-10 provides the NTG results for rooftop or split systems measure group. The statewide NTGRs were 50% for kWh, kW, and therms. No NTG survey was conducted for this measure group in PY2019 evaluation. The evaluated kWh NTGR from PY2018 were applied to the PY2019 evaluated savings to arrive at net savings for PY2019. The evaluation team believes the PY2018 evaluated NTGRs are the best estimate of program’s influence in the state they existed in during PY2018 and PY2019.
Table 4-10. Rooftop or split system first-year net savings summary21
PA Reported
NTGR
Evaluated NTGR
Evaluated Net Savings
Reported Net Savings
NRR
Electric consumption (kWh) PGE 75% 50% 1,194,156 4,002,614 30% SCE 78% 50% 965,125 3,419,895 28% SDGE 80% 50% 249,120 875,967 28% Total 82% 50% 2,408,401 8,298,476 29%
Peak electric demand (kW) PGE 75% 50% 906 2,085.0 43% SCE 78% 50% 749 1,711.0 44% SDGE 78% 50% 231 415.4 56% Total 81% 50% 1,886 4,211 45%
Gas consumption (Therm) PGE 75% 50% -242 -25,736 1% SCE 80% 50% -340 -14,059 2% SDGE 83% 50% -14 -1,427 1% Total 82% 50% -596 -41,223 1%
The NTGR method for rooftop and split systems in PY2018 evaluation generated an attribution score for three causal paths (stocking, upselling, and price) for distributors and end users.
Each of the three causal pathways had average distributor attributions of approximately 50%. Considering the many market factors affecting distributor behaviors, this is a strong effect for the program. Several open-ended answers by the distributors provide more detail about what influences their behaviors:
• Many of the distributors mentioned that it is necessary to get paybacks down to 3 or 4 years to sell a high efficiency model.
• All of the distributors said they stock based on what sells.
• Approximately half of the distributors mentioned that recent program changes make fewer types of equipment eligible and this makes it harder to sell high efficiency systems.
21 For all analyses DNV GL realization rates do not include the 5% market effects adder. DNV GL NTGR values are calculated expanding DNV GL
calculated ex-post gross to DNV GL calculated ex-post net values which do not include the 5% market effects adder. The only values that include the market effects 5% adder are the reported NTGR values in the tracking data; the tracking gross/net savings estimates themselves do not include the 5%. In order to address this in the reporting tables, the values for the “Reported NTGR” (which comes from the tracking data) have all been reduced by the 5% market effects adder so that the overall NRR are an equivalent comparison and thus not artificially deflating the results.

DNV GL Energy Insights USA, Inc. Page 38
• Most also mentioned that the program sometimes runs out of funds before the end of the year, and that makes it hard to do business because they might promise a reduced price to a customer that they then can’t follow through on if the program funding is gone.
Attributions for the causal pathways for end-users varied more than for distributors. The end-user scores indicate that distributor upselling is the most important factor when it comes to the sale of high efficiency equipment.
DNV GL Energy Insights USA, Inc. Page 39
5 CONCLUSIONS, FINDINGS, & RECOMMENDATIONS
In this section we provide overall program conclusions followed by each measure’s key findings, illustrated with the key symbol, and recommendations, shown by the gear symbol.
Recommendations include supporting context for energy service providers. A list of these recommendations is listed and described in Appendix C per the CPUC ED Impact Evaluation Standard Reporting (IESR) Guidelines.
5.1. Conclusions The implementation and evaluation of HVAC measures have evolved over the last decade. The changes to programs, measures, and the evaluation of impacts present challenges in assessing and tracking performance. Overall, PY 2019 gross evaluation activities showed savings lower than, expectations for both the selected measure groups with evaluated gross savings of 15% for the PTAC controls measure group and 48% for the Rooftop/Split measure group of expectations. The study results showed a mixed NTGRs for the selected measure groups with 94% NTGR for the PTAC controls measure group which is higher than the reported for this measure group whereas the rooftop/split measure group received a NTGR of 50% which is

DNV GL Energy Insights USA, Inc. Page 40
lower than the reported. The findings and recommendations include those discovered during the evaluation process such as PA data quality, as well as those targeted for program or savings estimation improvement.
5.2. Overarching findings PA tracking data contained incorrect contact information. We came across many cases where the contacts listed in the tracking and implementation data were unknown at the telephone numbers provided. In other cases, the telephone number had been disconnected. These types of issues are in some cases unavoidable. However, there were a large number of cases where no end user contact information was available, and as a result end-user data collection was not possible. Therefore, the evaluation was unable to spend additional resources trying to reach the right contact at each site when the PA provided contact proved incorrect.
PAs should continue to work to ensure that the contact information in the tracking data includes the correct and complete name, phone number, and e-mail address of the end-user’s primary contact. We would also ask that implementers take measures to ensure that project data includes contact information for both the equipment buyer (for evaluating purchasing decisions) and the equipment operator (for obtaining installation characteristics such as schedules, setpoints, installed quantities, and so on).
We believe accurate contact information will improve the response rates in at least two ways:
• Evaluators will be able to establish their bona fides early through introductory letters or emails, giving later attempts to reach site contacts a better chance of success than cold calls.
• Evaluators will be more likely to reach the best respondent at each site on their first attempt.
5.2.1 PTAC controls Findings and recommendations are grouped below as those applicable to both PG&E and SDG&E programs, those applicable to PG&E only, and those applicable to SDG&E.
PTAC controls realized 15% and 8% of statewide reported electric energy (kWh) and peak demand (kW) savings, respectively, in 2019. SDG&E programs realized 2% and 3% of reported electric energy and peak demand savings, respectively.
DNV GL recommends that PAs develop savings for PTAC controls and other similar HVAC controls technology groups with appropriate baseline, proper building types and vintage to reasonably capture the savings attributed to the technology improvements in these technology groups. For PTAC controls and other similar HVAC controls technology groups, DNV GL suggests PAs consider collecting and archiving the technology related performance data to ensure that the technologies are operating as intended. The collection of performance data will also assist appropriate evaluation of the HVAC controls technologies
Achieved GRRs are lower than 100% due in part to a reduction in installation rate from controls removal or override, as determined through our virtual audits. The SDG&E program in particular exhibited a 22% reduction in claimed kWh savings due to 5 of 13 sampled projects that had at least one instance of measure removal or override as a result of guest complaints. We determined that the PG&E and SDG&E programs, which are administered by third parties, did not incorporate independent QA/QC or field verification on a subset of tracked claims.
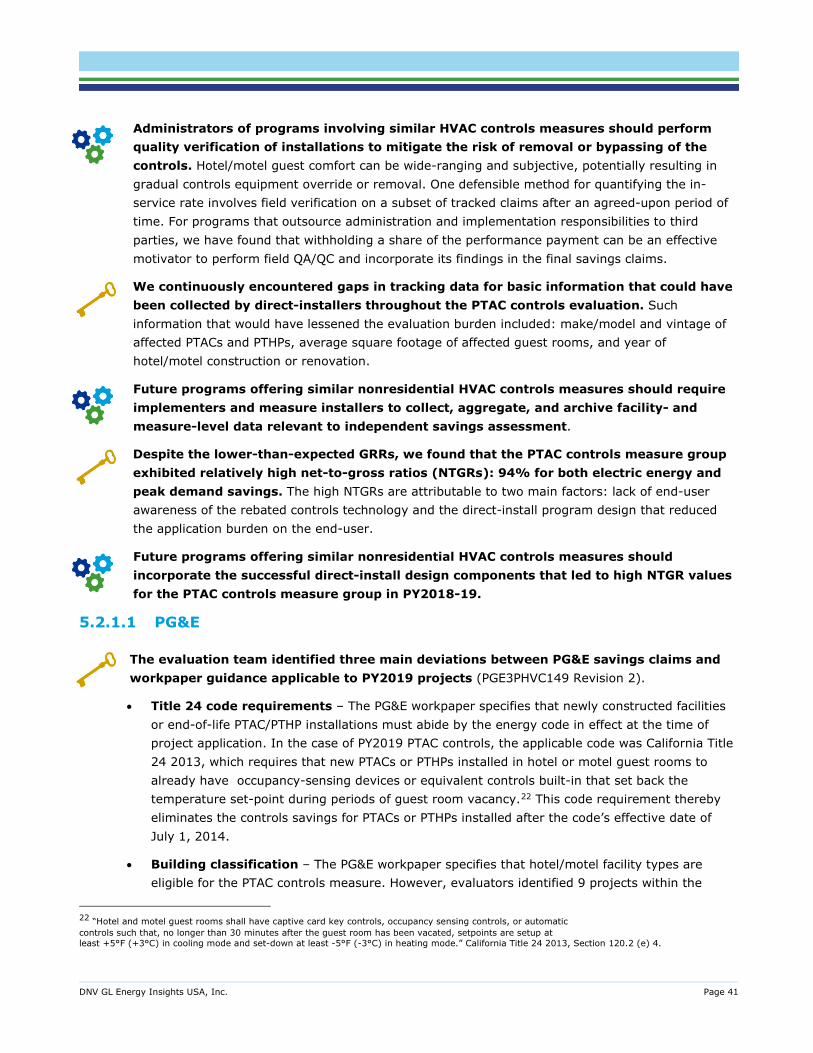
DNV GL Energy Insights USA, Inc. Page 41
Administrators of programs involving similar HVAC controls measures should perform quality verification of installations to mitigate the risk of removal or bypassing of the controls. Hotel/motel guest comfort can be wide-ranging and subjective, potentially resulting in gradual controls equipment override or removal. One defensible method for quantifying the in-service rate involves field verification on a subset of tracked claims after an agreed-upon period of time. For programs that outsource administration and implementation responsibilities to third parties, we have found that withholding a share of the performance payment can be an effective motivator to perform field QA/QC and incorporate its findings in the final savings claims.
We continuously encountered gaps in tracking data for basic information that could have been collected by direct-installers throughout the PTAC controls evaluation. Such information that would have lessened the evaluation burden included: make/model and vintage of affected PTACs and PTHPs, average square footage of affected guest rooms, and year of hotel/motel construction or renovation.
Future programs offering similar nonresidential HVAC controls measures should require implementers and measure installers to collect, aggregate, and archive facility- and measure-level data relevant to independent savings assessment.
Despite the lower-than-expected GRRs, we found that the PTAC controls measure group exhibited relatively high net-to-gross ratios (NTGRs): 94% for both electric energy and peak demand savings. The high NTGRs are attributable to two main factors: lack of end-user awareness of the rebated controls technology and the direct-install program design that reduced the application burden on the end-user.
Future programs offering similar nonresidential HVAC controls measures should incorporate the successful direct-install design components that led to high NTGR values for the PTAC controls measure group in PY2018-19.
5.2.1.1 PG&E
The evaluation team identified three main deviations between PG&E savings claims and workpaper guidance applicable to PY2019 projects (PGE3PHVC149 Revision 2).
• Title 24 code requirements – The PG&E workpaper specifies that newly constructed facilities or end-of-life PTAC/PTHP installations must abide by the energy code in effect at the time of project application. In the case of PY2019 PTAC controls, the applicable code was California Title 24 2013, which requires that new PTACs or PTHPs installed in hotel or motel guest rooms to already have occupancy-sensing devices or equivalent controls built-in that set back the temperature set-point during periods of guest room vacancy.22 This code requirement thereby eliminates the controls savings for PTACs or PTHPs installed after the code’s effective date of July 1, 2014.
• Building classification – The PG&E workpaper specifies that hotel/motel facility types are eligible for the PTAC controls measure. However, evaluators identified 9 projects within the
22 “Hotel and motel guest rooms shall have captive card key controls, occupancy sensing controls, or automatic controls such that, no longer than 30 minutes after the guest room has been vacated, setpoints are setup at least +5°F (+3°C) in cooling mode and set-down at least -5°F (-3°C) in heating mode.” California Title 24 2013, Section 120.2 (e) 4.
DNV GL Energy Insights USA, Inc. Page 42
sample of 74 PG&E projects that occurred at senior care facilities distinctly different from hotels or motels. Evaluators nonetheless quantified the savings for such installations (using the nursing home prototype DEER model as explained in Section 4.1), as they may present a viable market opportunity for other IOU programs moving forward.
• Installations in common areas – The PG&E workpaper specifies that PTAC controls measures are eligible only for PTAC, PTHP, or Split AC systems serving hotel/motel guest rooms. We found that 10 of the 74 sampled PG&E projects included at least one PTAC controls measure instance on HVAC systems serving hotel/motel common areas only. We therefore did not quantify the savings for such ineligible measure installations.
PAs should ensure that ex ante savings claims comply with the applicable workpaper(s). While the PTAC controls hotel/motel guest room measure has since been discontinued by PG&E, we have identified some best practices should a similar nonresidential HVAC controls measure be introduced in the future. Such measures should ensure that ex ante savings claims comply with the applicable workpaper(s), specifically in three areas: 1) code requirements for controls on newly installed HVAC systems, 2) eligibility by facility type for measures targeting specific nonresidential facility types, and 3) eligibility by space type for measures available to only discrete spaces within those facility types.
The PG&E workpaper overestimated the unit energy savings for the PTAC controls measure by treating the total, modeled, facility-wide HVAC electric energy consumption as the basis for savings. Since the PTAC controls measure only impacts the HVAC consumption in guest rooms—hotel/motel common areas are unaffected— the workpaper’s inaccuracy led to the overestimation savings claims for PG&E programs in 2019.
Workpapers for similar HVAC controls measures should treat the modeled or measured HVAC energy consumption only for affected spaces as the basis for controls savings.
5.2.1.2 SDG&E The ACC controls only marginally reduced the PTACs’ fan energy consumption and did not produce savings at the magnitude claimed by the SDG&E workpaper. To inform the development of evaluated savings models, we requested from the adaptive climate controls (ACC) manufacturer any information supporting the SDG&E workpaper’s savings claim of 30% reduction in PTAC/PTHP energy consumption (WPSDGENRHC1051). Such supporting information could include bench tests, pilot measurement and verification, or evaluation studies of the technology in other jurisdictions. Ultimately, the manufacturer produced only a single redacted study that involved pilot M&V on control boxes installed in five dwelling unit PTACs within a multifamily building. The study showed that the ACC controls only marginally reduced the PTACs’ fan energy consumption and did not produce savings at the magnitude claimed by the SDG&E workpaper.
PAs should vet measures that include proprietary and/or innovative technologies through M&V or pilot test results. When designing programs that involve proprietary and/or innovative technologies, SDG&E and other California IOUs should vet such measures by requesting and reviewing third-party M&V data, pilot or bench test results, or other evaluation studies that demonstrate the efficacy of the proposed technology. Marketing materials from the manufacturer
DNV GL Energy Insights USA, Inc. Page 43
do not provide the same level of credibility as data-driven analyses and reports by independent third parties.
5.2.2 Rooftop/split systems The ex-post savings were lower than the ex-ante estimate. The overall GRRs are 48% for kWh, 73% for peak kW and 2% for the therm. This difference is primarily due to the overestimation of savings in the ex-ante estimate, particularly due to the fan power index (W/cfm) assumption. But significant difference also materialized from the misapplication of building type, where the majority of sampled claims were assigned the weighted “Com” building type to estimate UES. The ex-ante estimate approach claimed savings equivalent to 60% of the total cooling load whereas the evaluation approach produced the savings to be approximately 10% of the total cooling load, which is in line with the efficiency improvement between the standard and high efficiency equipment.
The evaluation team recommends that the PAs model this measure group with appropriate baseline and proposed conditions including the HVAC system efficiencies, fan power index and applicable economizer controls. In that way, the simulation results will reasonably capture the savings attributed only to the efficiency improvement between the Title-24 standard and high efficiency equipment along with other efficiency upgrades. We also recommend that appropriate building type and climate zone selections are made to assign UES whenever possible. The simulation results will more accurately capture the building and weather loads represented by the DEER-specific building type and CA climate zone weather.
The midstream, distributor-facing design of the rooftop unit/split system measure group results in inconsistent or incomplete tracking data for all PAs. Rooftop or split systems measure rebates are paid to distributors, who in turn work with contractors to install high-efficiency systems among commercial customers. While the PY2019 evaluation did not contact customers for this measure group, we did identify many cases in the sampled tracking data where the customer contact information was the HVAC distributor or contractor. For approximately 74% of projects in the PY2018 population, the evaluation team did not have sufficient customer contact data to verify equipment installation or quantify evaluated savings. For the 26% of projects with sufficient customer contact data, recruitment for evaluation was challenging, as the customers were often unaware that they had participated in an efficiency program. The measure’s midstream design and subsequent data gaps caused the evaluators to fall short of the target evaluation sample count of 85 projects. Data gaps were most prominent for programs administered by PG&E and SCE.
For any measures delivered midstream through distributor rebates, such as the rooftop and split system measure group, PAs must require participating distributors and partnering contractors to collaboratively collect and submit basic information for each customer that ultimately receives the rebated equipment. Such information should include: facility name; facility classification; facility address; facility account number(s); name(s), phone number(s), and email address(es) of customer representative(s) familiar with the project; distributor name, phone number, and email address; and contractor name, phone number, and email address. Information for customer representatives should include equipment operators (e.g., facility maintenance) for gross data collection as well as project decision-makers (e.g., CFO) for net
DNV GL Energy Insights USA, Inc. Page 44
data collection. This basic information is critical for the utilities, the CPUC, and its contractors to verify installations and maintain the integrity of ratepayer incentive dollars.
The rooftop/split system measure group consisted of more than 100 unique measure descriptions for PY2019. For many of these, the PAs are claiming the same (DEER) measure but the measure descriptions are not consistent across the PAs. This makes the task of grouping the same measures across the PAs more difficult and introduces unnecessary complication and uncertainty.
The evaluation team recommends that PAs adopt a uniform technology description naming convention for technology groups to homogenize and therefore consolidate the descriptions under each technology group in order to move towards a statewide focused portfolio and to improve the evaluability of these technology groups across the PAs.

DNV GL Energy Insights USA, Inc. Page 45
6 APPENDICES 6.1. Appendix A: Impact Evaluation Standard Reporting (IESR)
required reporting−First year and lifecycle savings
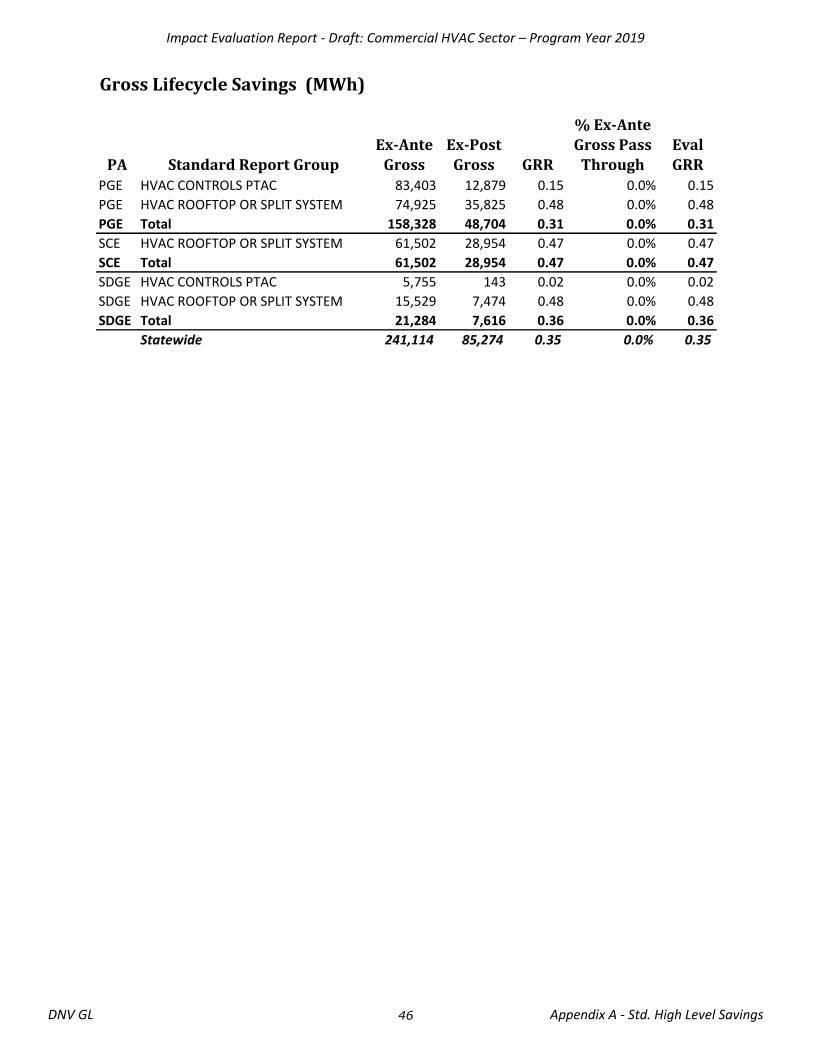
Impact Evaluation Report - Draft: Commercial HVAC Sector – Program Year 2019
Gross Lifecycle Savings (MWh)
PA Standard Report GroupEx-Ante
GrossEx-Post Gross GRR
% Ex-Ante Gross Pass
ThroughEval GRR
PGE HVAC CONTROLS PTAC 83,403 12,879 0.15 0.0% 0.15
PGE HVAC ROOFTOP OR SPLIT SYSTEM 74,925 35,825 0.48 0.0% 0.48
PGE Total 158,328 48,704 0.31 0.0% 0.31
SCE HVAC ROOFTOP OR SPLIT SYSTEM 61,502 28,954 0.47 0.0% 0.47
SCE Total 61,502 28,954 0.47 0.0% 0.47
SDGE HVAC CONTROLS PTAC 5,755 143 0.02 0.0% 0.02
SDGE HVAC ROOFTOP OR SPLIT SYSTEM 15,529 7,474 0.48 0.0% 0.48
SDGE Total 21,284 7,616 0.36 0.0% 0.36
Statewide 241,114 85,274 0.35 0.0% 0.35
DNV GL Appendix A - Std. High Level Savings46
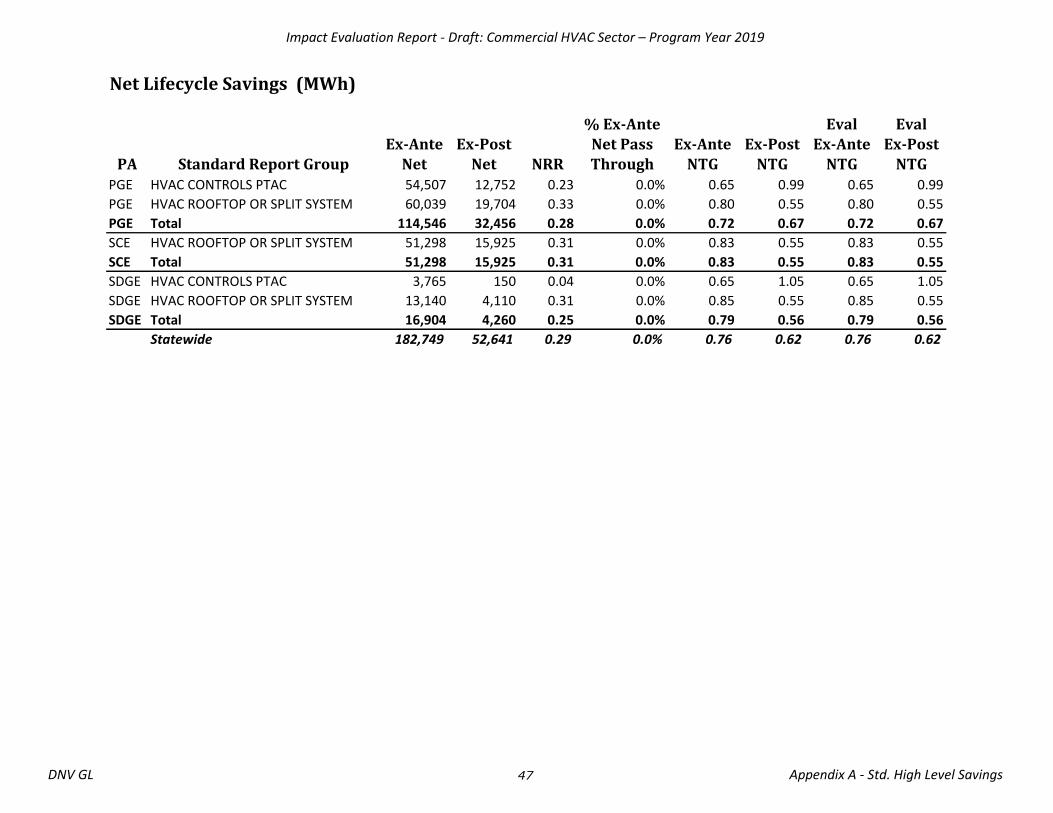
Impact Evaluation Report - Draft: Commercial HVAC Sector – Program Year 2019
Net Lifecycle Savings (MWh)
PA Standard Report GroupEx-Ante
NetEx-Post
Net NRR
% Ex-Ante
Net Pass Through
Ex-Ante NTG
Ex-Post NTG
Eval
Ex-Ante NTG
Eval
Ex-Post NTG
PGE HVAC CONTROLS PTAC 54,507 12,752 0.23 0.0% 0.65 0.99 0.65 0.99
PGE HVAC ROOFTOP OR SPLIT SYSTEM 60,039 19,704 0.33 0.0% 0.80 0.55 0.80 0.55
PGE Total 114,546 32,456 0.28 0.0% 0.72 0.67 0.72 0.67
SCE HVAC ROOFTOP OR SPLIT SYSTEM 51,298 15,925 0.31 0.0% 0.83 0.55 0.83 0.55
SCE Total 51,298 15,925 0.31 0.0% 0.83 0.55 0.83 0.55
SDGE HVAC CONTROLS PTAC 3,765 150 0.04 0.0% 0.65 1.05 0.65 1.05
SDGE HVAC ROOFTOP OR SPLIT SYSTEM 13,140 4,110 0.31 0.0% 0.85 0.55 0.85 0.55
SDGE Total 16,904 4,260 0.25 0.0% 0.79 0.56 0.79 0.56
Statewide 182,749 52,641 0.29 0.0% 0.76 0.62 0.76 0.62
DNV GL Appendix A - Std. High Level Savings47
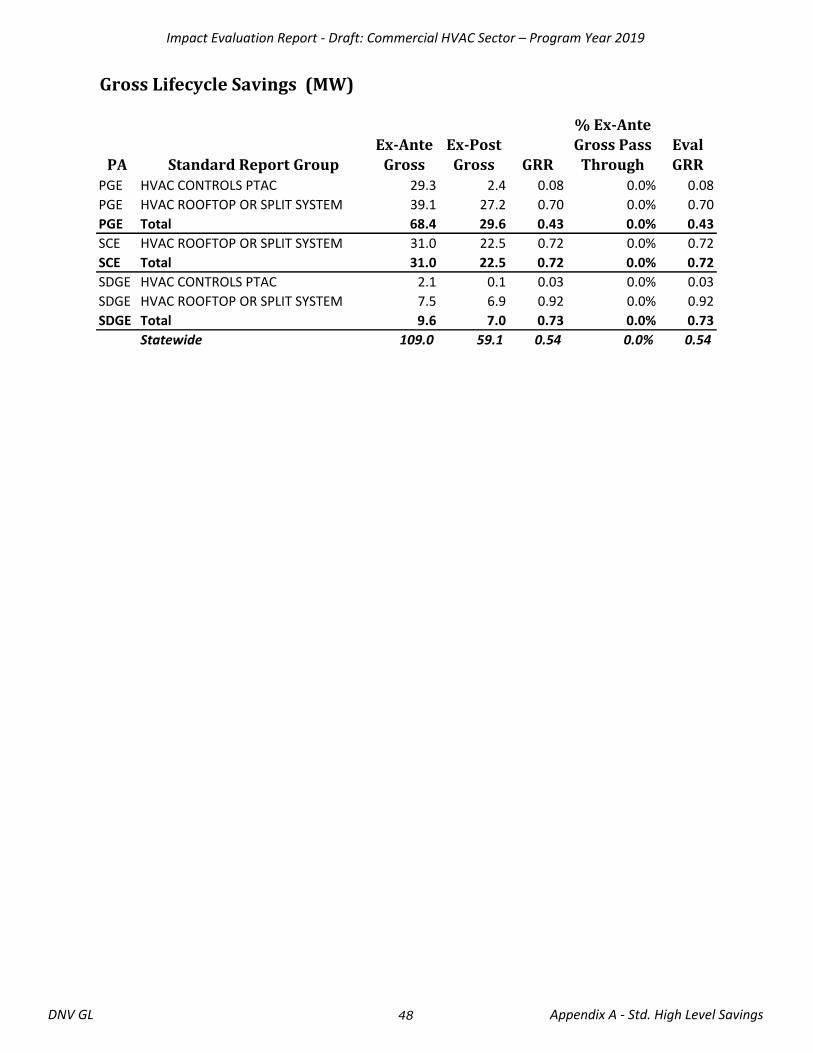
Impact Evaluation Report - Draft: Commercial HVAC Sector – Program Year 2019
Gross Lifecycle Savings (MW)
PA Standard Report GroupEx-Ante
GrossEx-Post Gross GRR
% Ex-Ante Gross Pass
ThroughEval GRR
PGE HVAC CONTROLS PTAC 29.3 2.4 0.08 0.0% 0.08
PGE HVAC ROOFTOP OR SPLIT SYSTEM 39.1 27.2 0.70 0.0% 0.70
PGE Total 68.4 29.6 0.43 0.0% 0.43
SCE HVAC ROOFTOP OR SPLIT SYSTEM 31.0 22.5 0.72 0.0% 0.72
SCE Total 31.0 22.5 0.72 0.0% 0.72
SDGE HVAC CONTROLS PTAC 2.1 0.1 0.03 0.0% 0.03
SDGE HVAC ROOFTOP OR SPLIT SYSTEM 7.5 6.9 0.92 0.0% 0.92
SDGE Total 9.6 7.0 0.73 0.0% 0.73
Statewide 109.0 59.1 0.54 0.0% 0.54
DNV GL Appendix A - Std. High Level Savings48

Impact Evaluation Report - Draft: Commercial HVAC Sector – Program Year 2019
Net Lifecycle Savings (MW)
PA Standard Report GroupEx-Ante
NetEx-Post
Net NRR
% Ex-Ante
Net Pass Through
Ex-Ante NTG
Ex-Post NTG
Eval
Ex-Ante NTG
Eval
Ex-Post NTG
PGE HVAC CONTROLS PTAC 19.0 2.4 0.12 0.0% 0.65 0.98 0.65 0.98
PGE HVAC ROOFTOP OR SPLIT SYSTEM 31.3 15.0 0.48 0.0% 0.80 0.55 0.80 0.55
PGE Total 50.3 17.3 0.34 0.0% 0.74 0.59 0.74 0.59
SCE HVAC ROOFTOP OR SPLIT SYSTEM 25.7 12.4 0.48 0.0% 0.83 0.55 0.83 0.55
SCE Total 25.7 12.4 0.48 0.0% 0.83 0.55 0.83 0.55
SDGE HVAC CONTROLS PTAC 1.4 0.1 0.05 0.0% 0.65 1.05 0.65 1.05
SDGE HVAC ROOFTOP OR SPLIT SYSTEM 6.2 3.8 0.61 0.0% 0.83 0.55 0.83 0.55
SDGE Total 7.6 3.9 0.51 0.0% 0.79 0.55 0.79 0.55
Statewide 83.6 33.6 0.40 0.0% 0.77 0.57 0.77 0.57
DNV GL Appendix A - Std. High Level Savings49
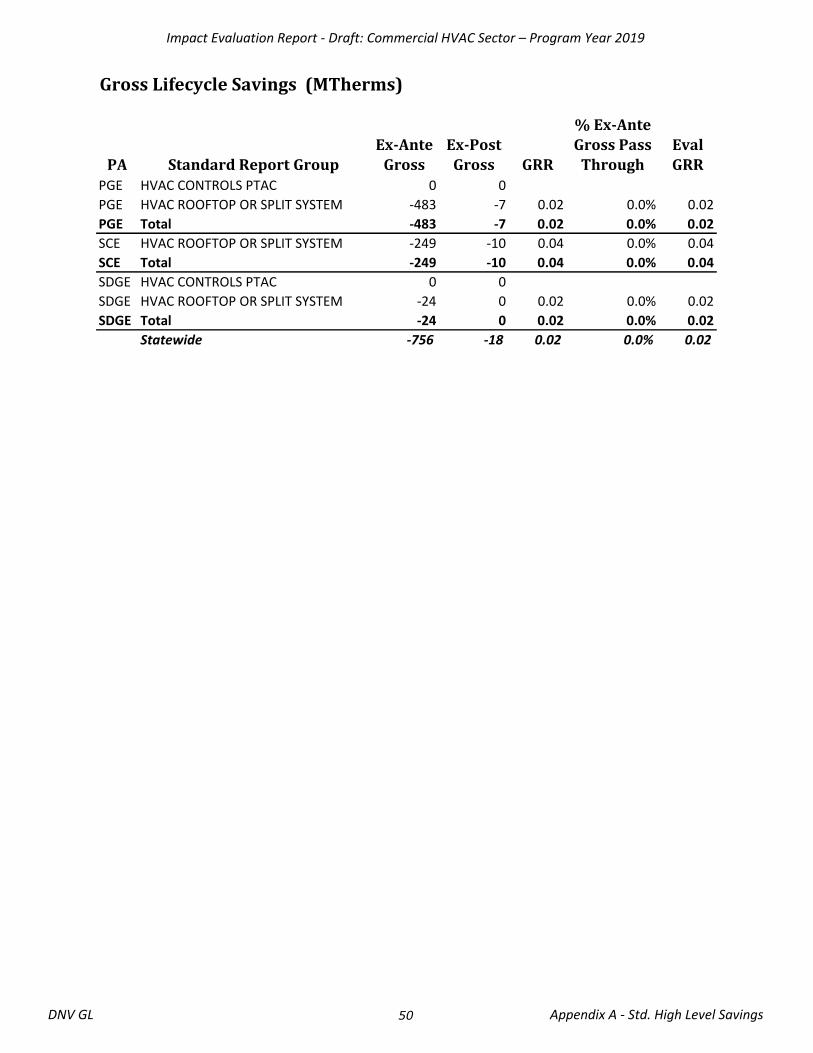
Impact Evaluation Report - Draft: Commercial HVAC Sector – Program Year 2019
Gross Lifecycle Savings (MTherms)
PA Standard Report GroupEx-Ante
GrossEx-Post Gross GRR
% Ex-Ante Gross Pass
ThroughEval GRR
PGE HVAC CONTROLS PTAC 0 0
PGE HVAC ROOFTOP OR SPLIT SYSTEM -483 -7 0.02 0.0% 0.02
PGE Total -483 -7 0.02 0.0% 0.02
SCE HVAC ROOFTOP OR SPLIT SYSTEM -249 -10 0.04 0.0% 0.04
SCE Total -249 -10 0.04 0.0% 0.04
SDGE HVAC CONTROLS PTAC 0 0
SDGE HVAC ROOFTOP OR SPLIT SYSTEM -24 0 0.02 0.0% 0.02
SDGE Total -24 0 0.02 0.0% 0.02
Statewide -756 -18 0.02 0.0% 0.02
DNV GL Appendix A - Std. High Level Savings50
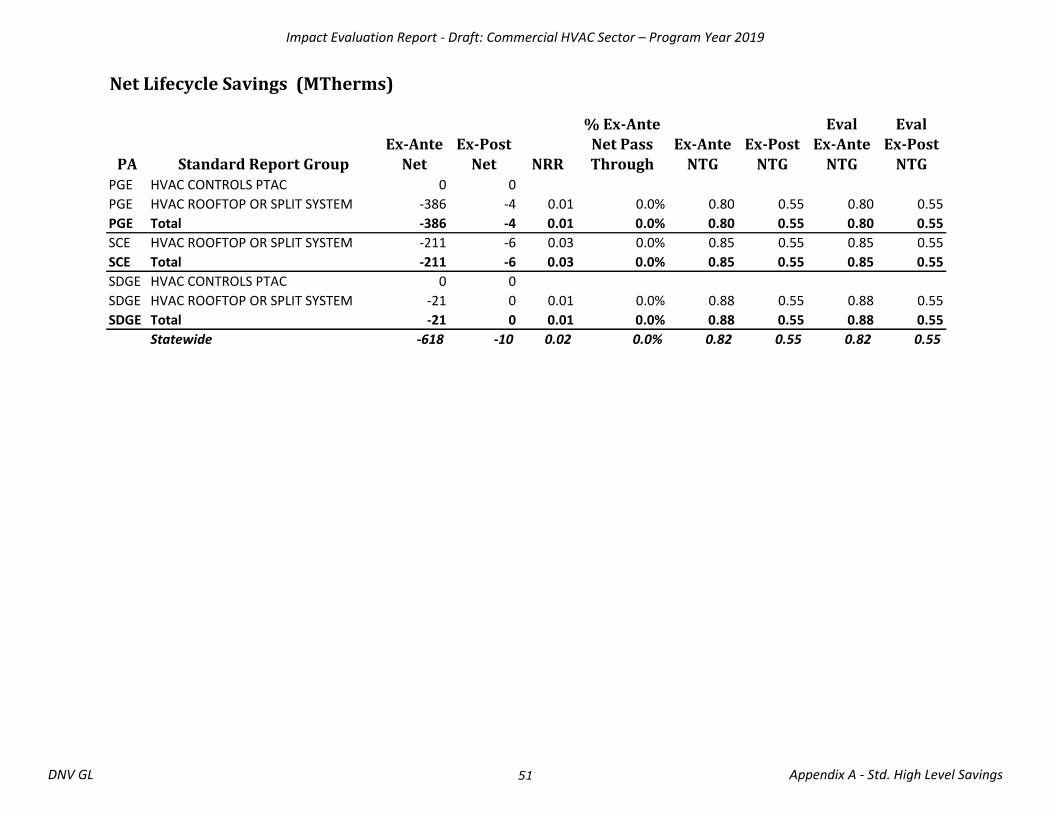
Impact Evaluation Report - Draft: Commercial HVAC Sector – Program Year 2019
Net Lifecycle Savings (MTherms)
PA Standard Report GroupEx-Ante
NetEx-Post
Net NRR
% Ex-Ante
Net Pass Through
Ex-Ante NTG
Ex-Post NTG
Eval
Ex-Ante NTG
Eval
Ex-Post NTG
PGE HVAC CONTROLS PTAC 0 0
PGE HVAC ROOFTOP OR SPLIT SYSTEM -386 -4 0.01 0.0% 0.80 0.55 0.80 0.55
PGE Total -386 -4 0.01 0.0% 0.80 0.55 0.80 0.55
SCE HVAC ROOFTOP OR SPLIT SYSTEM -211 -6 0.03 0.0% 0.85 0.55 0.85 0.55
SCE Total -211 -6 0.03 0.0% 0.85 0.55 0.85 0.55
SDGE HVAC CONTROLS PTAC 0 0
SDGE HVAC ROOFTOP OR SPLIT SYSTEM -21 0 0.01 0.0% 0.88 0.55 0.88 0.55
SDGE Total -21 0 0.01 0.0% 0.88 0.55 0.88 0.55
Statewide -618 -10 0.02 0.0% 0.82 0.55 0.82 0.55
DNV GL Appendix A - Std. High Level Savings51

Impact Evaluation Report - Draft: Commercial HVAC Sector – Program Year 2019
Gross First Year Savings (MWh)
PA Standard Report GroupEx-Ante
GrossEx-Post Gross GRR
% Ex-Ante Gross Pass
ThroughEval GRR
PGE HVAC CONTROLS PTAC 16,681 2,576 0.15 0.0% 0.15
PGE HVAC ROOFTOP OR SPLIT SYSTEM 4,995 2,388 0.48 0.0% 0.48
PGE Total 21,676 4,964 0.23 0.0% 0.23
SCE HVAC ROOFTOP OR SPLIT SYSTEM 4,100 1,930 0.47 0.0% 0.47
SCE Total 4,100 1,930 0.47 0.0% 0.47
SDGE HVAC CONTROLS PTAC 1,151 29 0.02 0.0% 0.02
SDGE HVAC ROOFTOP OR SPLIT SYSTEM 1,035 498 0.48 0.0% 0.48
SDGE Total 2,186 527 0.24 0.0% 0.24
Statewide 27,962 7,421 0.27 0.0% 0.27
DNV GL Appendix A - Std. High Level Savings52
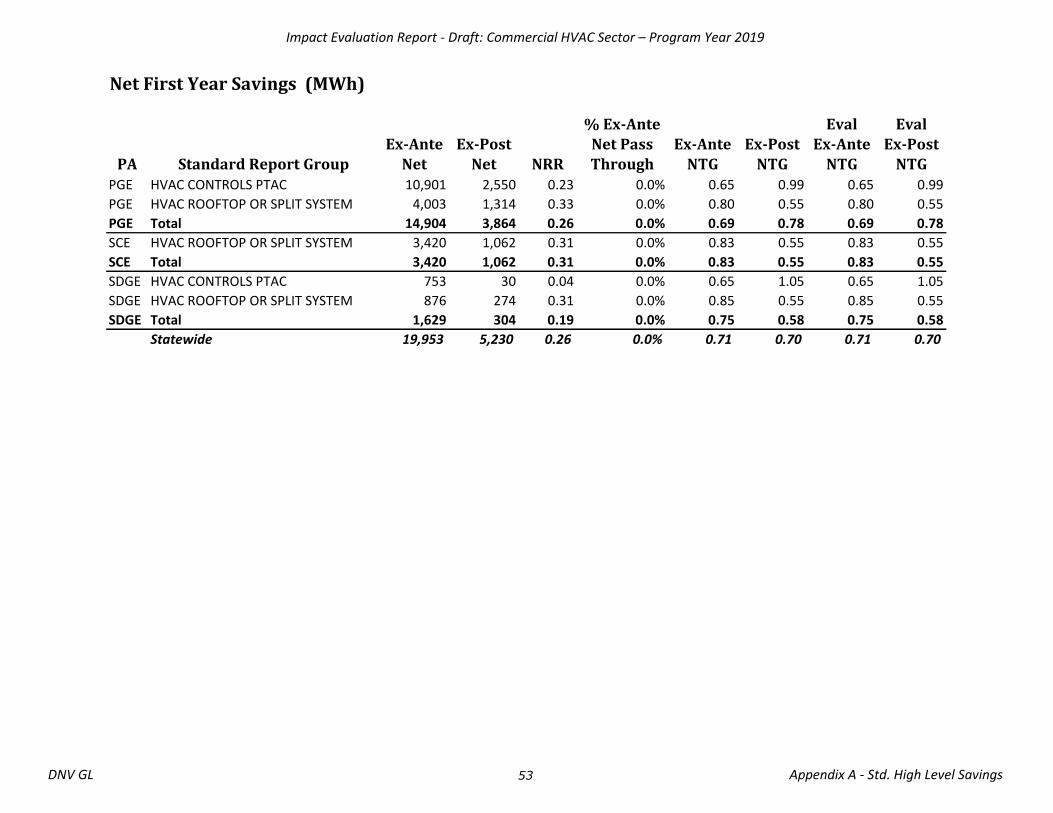
Impact Evaluation Report - Draft: Commercial HVAC Sector – Program Year 2019
Net First Year Savings (MWh)
PA Standard Report GroupEx-Ante
NetEx-Post
Net NRR
% Ex-Ante
Net Pass Through
Ex-Ante NTG
Ex-Post NTG
Eval
Ex-Ante NTG
Eval
Ex-Post NTG
PGE HVAC CONTROLS PTAC 10,901 2,550 0.23 0.0% 0.65 0.99 0.65 0.99
PGE HVAC ROOFTOP OR SPLIT SYSTEM 4,003 1,314 0.33 0.0% 0.80 0.55 0.80 0.55
PGE Total 14,904 3,864 0.26 0.0% 0.69 0.78 0.69 0.78
SCE HVAC ROOFTOP OR SPLIT SYSTEM 3,420 1,062 0.31 0.0% 0.83 0.55 0.83 0.55
SCE Total 3,420 1,062 0.31 0.0% 0.83 0.55 0.83 0.55
SDGE HVAC CONTROLS PTAC 753 30 0.04 0.0% 0.65 1.05 0.65 1.05
SDGE HVAC ROOFTOP OR SPLIT SYSTEM 876 274 0.31 0.0% 0.85 0.55 0.85 0.55
SDGE Total 1,629 304 0.19 0.0% 0.75 0.58 0.75 0.58
Statewide 19,953 5,230 0.26 0.0% 0.71 0.70 0.71 0.70
DNV GL Appendix A - Std. High Level Savings53
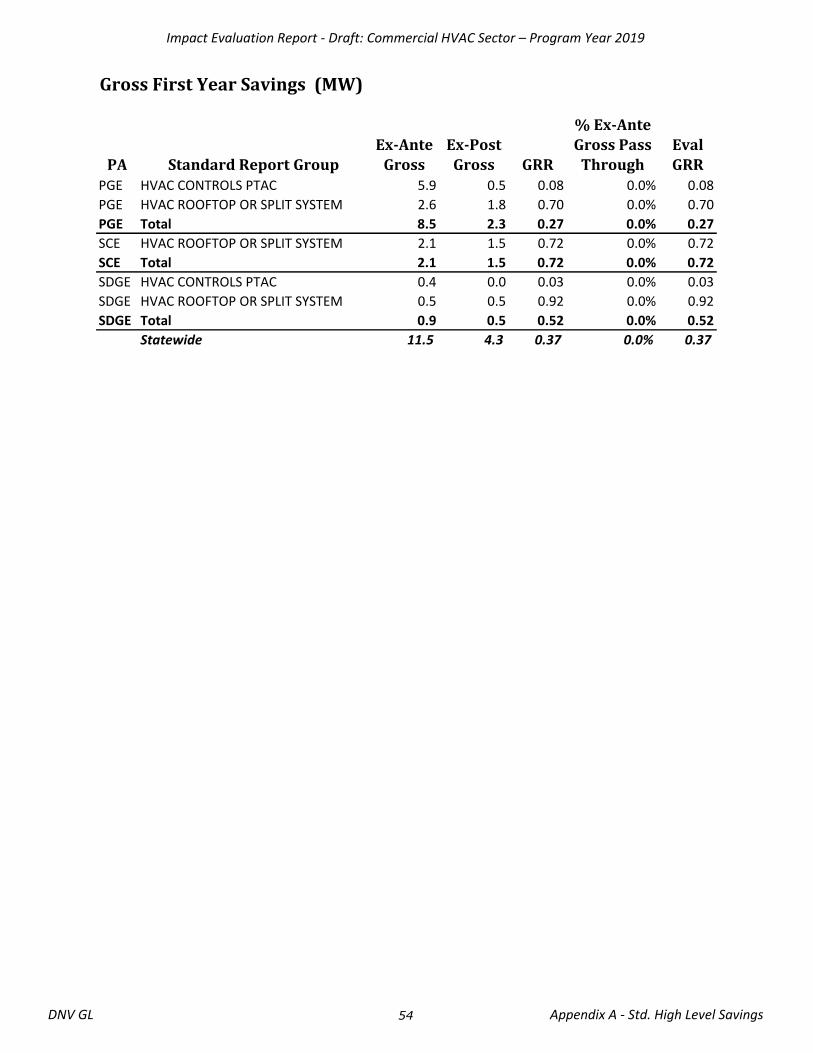
Impact Evaluation Report - Draft: Commercial HVAC Sector – Program Year 2019
Gross First Year Savings (MW)
PA Standard Report GroupEx-Ante
GrossEx-Post Gross GRR
% Ex-Ante Gross Pass
ThroughEval GRR
PGE HVAC CONTROLS PTAC 5.9 0.5 0.08 0.0% 0.08
PGE HVAC ROOFTOP OR SPLIT SYSTEM 2.6 1.8 0.70 0.0% 0.70
PGE Total 8.5 2.3 0.27 0.0% 0.27
SCE HVAC ROOFTOP OR SPLIT SYSTEM 2.1 1.5 0.72 0.0% 0.72
SCE Total 2.1 1.5 0.72 0.0% 0.72
SDGE HVAC CONTROLS PTAC 0.4 0.0 0.03 0.0% 0.03
SDGE HVAC ROOFTOP OR SPLIT SYSTEM 0.5 0.5 0.92 0.0% 0.92
SDGE Total 0.9 0.5 0.52 0.0% 0.52
Statewide 11.5 4.3 0.37 0.0% 0.37
DNV GL Appendix A - Std. High Level Savings54
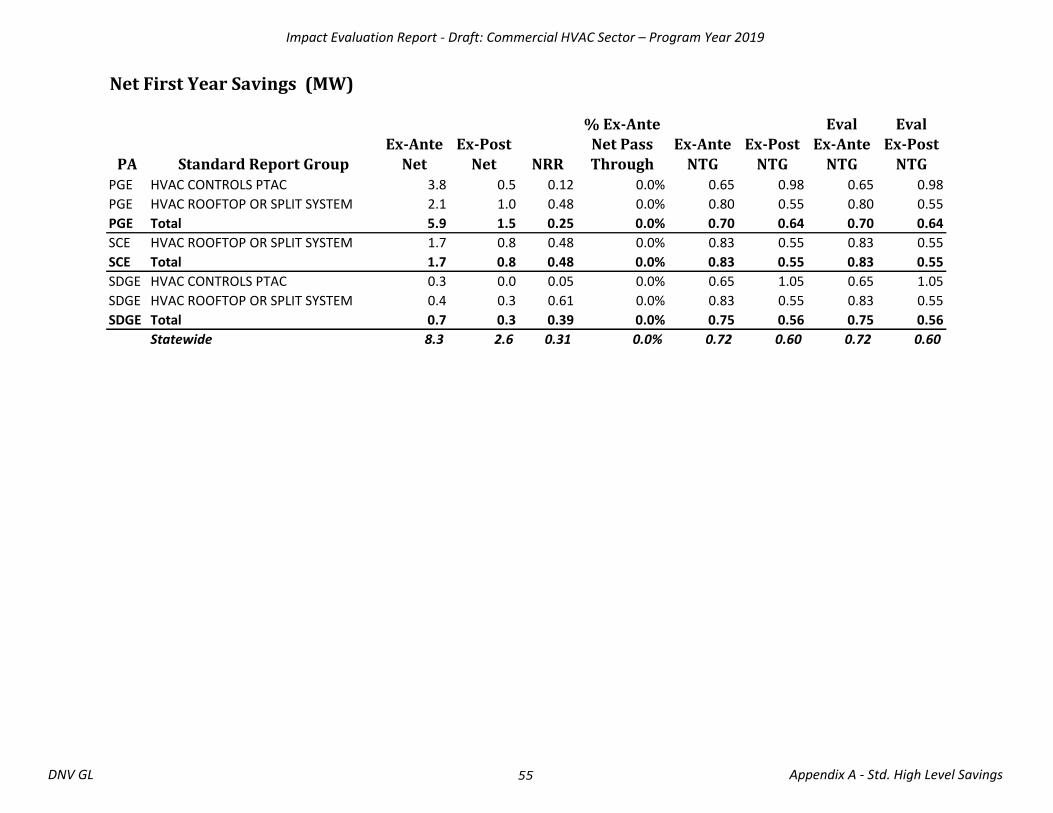
Impact Evaluation Report - Draft: Commercial HVAC Sector – Program Year 2019
Net First Year Savings (MW)
PA Standard Report GroupEx-Ante
NetEx-Post
Net NRR
% Ex-Ante
Net Pass Through
Ex-Ante NTG
Ex-Post NTG
Eval
Ex-Ante NTG
Eval
Ex-Post NTG
PGE HVAC CONTROLS PTAC 3.8 0.5 0.12 0.0% 0.65 0.98 0.65 0.98
PGE HVAC ROOFTOP OR SPLIT SYSTEM 2.1 1.0 0.48 0.0% 0.80 0.55 0.80 0.55
PGE Total 5.9 1.5 0.25 0.0% 0.70 0.64 0.70 0.64
SCE HVAC ROOFTOP OR SPLIT SYSTEM 1.7 0.8 0.48 0.0% 0.83 0.55 0.83 0.55
SCE Total 1.7 0.8 0.48 0.0% 0.83 0.55 0.83 0.55
SDGE HVAC CONTROLS PTAC 0.3 0.0 0.05 0.0% 0.65 1.05 0.65 1.05
SDGE HVAC ROOFTOP OR SPLIT SYSTEM 0.4 0.3 0.61 0.0% 0.83 0.55 0.83 0.55
SDGE Total 0.7 0.3 0.39 0.0% 0.75 0.56 0.75 0.56
Statewide 8.3 2.6 0.31 0.0% 0.72 0.60 0.72 0.60
DNV GL Appendix A - Std. High Level Savings55
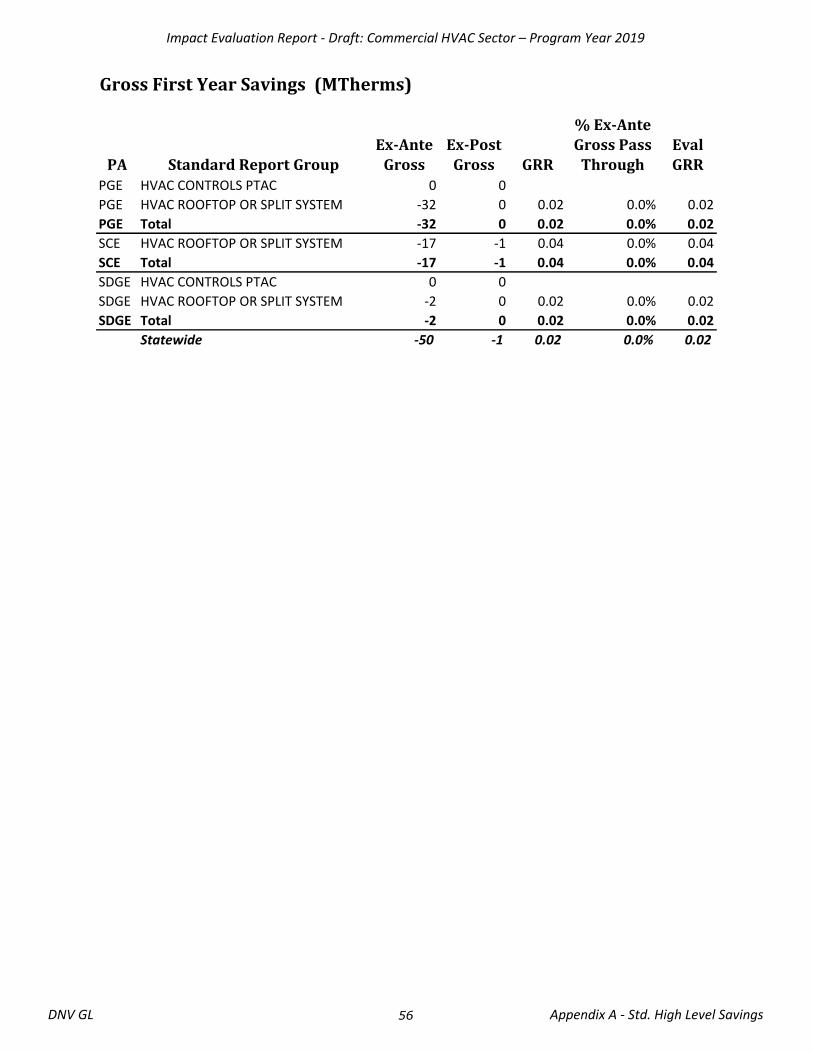
Impact Evaluation Report - Draft: Commercial HVAC Sector – Program Year 2019
Gross First Year Savings (MTherms)
PA Standard Report GroupEx-Ante
GrossEx-Post Gross GRR
% Ex-Ante Gross Pass
ThroughEval GRR
PGE HVAC CONTROLS PTAC 0 0
PGE HVAC ROOFTOP OR SPLIT SYSTEM -32 0 0.02 0.0% 0.02
PGE Total -32 0 0.02 0.0% 0.02
SCE HVAC ROOFTOP OR SPLIT SYSTEM -17 -1 0.04 0.0% 0.04
SCE Total -17 -1 0.04 0.0% 0.04
SDGE HVAC CONTROLS PTAC 0 0
SDGE HVAC ROOFTOP OR SPLIT SYSTEM -2 0 0.02 0.0% 0.02
SDGE Total -2 0 0.02 0.0% 0.02
Statewide -50 -1 0.02 0.0% 0.02
DNV GL Appendix A - Std. High Level Savings56
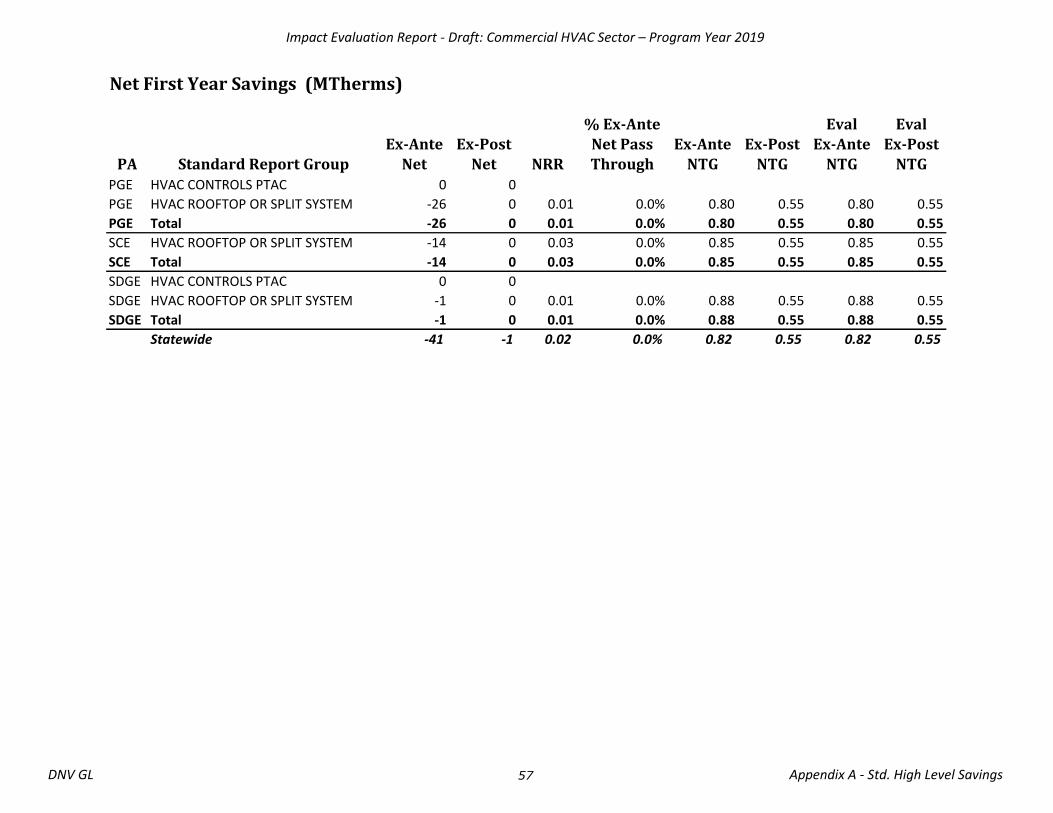
Impact Evaluation Report - Draft: Commercial HVAC Sector – Program Year 2019
Net First Year Savings (MTherms)
PA Standard Report GroupEx-Ante
NetEx-Post
Net NRR
% Ex-Ante
Net Pass Through
Ex-Ante NTG
Ex-Post NTG
Eval
Ex-Ante NTG
Eval
Ex-Post NTG
PGE HVAC CONTROLS PTAC 0 0
PGE HVAC ROOFTOP OR SPLIT SYSTEM -26 0 0.01 0.0% 0.80 0.55 0.80 0.55
PGE Total -26 0 0.01 0.0% 0.80 0.55 0.80 0.55
SCE HVAC ROOFTOP OR SPLIT SYSTEM -14 0 0.03 0.0% 0.85 0.55 0.85 0.55
SCE Total -14 0 0.03 0.0% 0.85 0.55 0.85 0.55
SDGE HVAC CONTROLS PTAC 0 0
SDGE HVAC ROOFTOP OR SPLIT SYSTEM -1 0 0.01 0.0% 0.88 0.55 0.88 0.55
SDGE Total -1 0 0.01 0.0% 0.88 0.55 0.88 0.55
Statewide -41 -1 0.02 0.0% 0.82 0.55 0.82 0.55
DNV GL Appendix A - Std. High Level Savings57

DNV GL Energy Insights USA, Inc. Page 58
6.2. Appendix B: IESR−Measure groups or passed through measures with early retirement
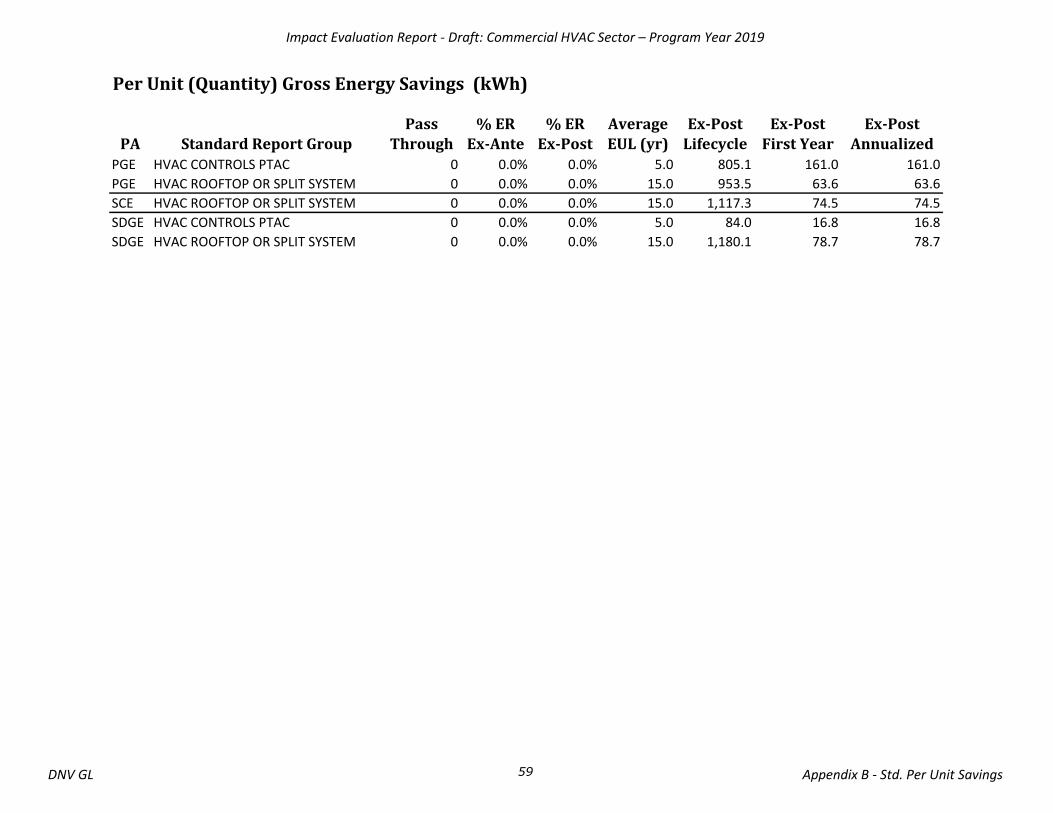
Impact Evaluation Report - Draft: Commercial HVAC Sector – Program Year 2019
Per Unit (Quantity) Gross Energy Savings (kWh)
PA Standard Report Group
Pass
Through
% ER
Ex-Ante
% ER
Ex-Post
Average
EUL (yr)
Ex-Post
Lifecycle
Ex-Post
First Year
Ex-Post
AnnualizedPGE HVAC CONTROLS PTAC 0 0.0% 0.0% 5.0 805.1 161.0 161.0
PGE HVAC ROOFTOP OR SPLIT SYSTEM 0 0.0% 0.0% 15.0 953.5 63.6 63.6
SCE HVAC ROOFTOP OR SPLIT SYSTEM 0 0.0% 0.0% 15.0 1,117.3 74.5 74.5
SDGE HVAC CONTROLS PTAC 0 0.0% 0.0% 5.0 84.0 16.8 16.8
SDGE HVAC ROOFTOP OR SPLIT SYSTEM 0 0.0% 0.0% 15.0 1,180.1 78.7 78.7
DNV GL Appendix B - Std. Per Unit Savings59

Impact Evaluation Report - Draft: Commercial HVAC Sector – Program Year 2019
Per Unit (Quantity) Gross Energy Savings (Therms)
PA Standard Report Group
Pass
Through
% ER
Ex-Ante
% ER
Ex-Post
Average
EUL (yr)
Ex-Post
Lifecycle
Ex-Post
First Year
Ex-Post
AnnualizedPGE HVAC CONTROLS PTAC 0 0.0% 0.0% 5.0 0.0 0.0 0.0
PGE HVAC ROOFTOP OR SPLIT SYSTEM 0 0.0% 0.0% 15.0 -0.2 0.0 0.0
SCE HVAC ROOFTOP OR SPLIT SYSTEM 0 0.0% 0.0% 15.0 -0.4 0.0 0.0
SDGE HVAC CONTROLS PTAC 0 0.0% 0.0% 5.0 0.0 0.0 0.0
SDGE HVAC ROOFTOP OR SPLIT SYSTEM 0 0.0% 0.0% 15.0 -0.1 0.0 0.0
DNV GL Appendix B - Std. Per Unit Savings60
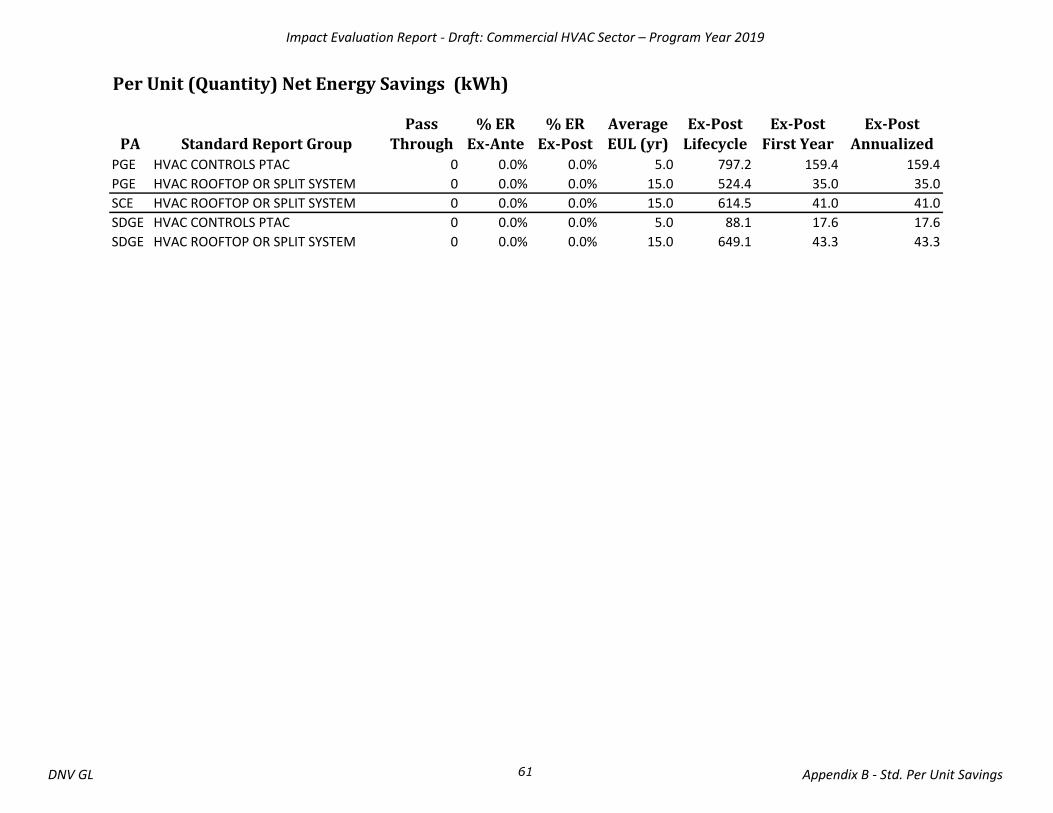
Impact Evaluation Report - Draft: Commercial HVAC Sector – Program Year 2019
Per Unit (Quantity) Net Energy Savings (kWh)
PA Standard Report Group
Pass
Through
% ER
Ex-Ante
% ER
Ex-Post
Average
EUL (yr)
Ex-Post
Lifecycle
Ex-Post
First Year
Ex-Post
AnnualizedPGE HVAC CONTROLS PTAC 0 0.0% 0.0% 5.0 797.2 159.4 159.4
PGE HVAC ROOFTOP OR SPLIT SYSTEM 0 0.0% 0.0% 15.0 524.4 35.0 35.0
SCE HVAC ROOFTOP OR SPLIT SYSTEM 0 0.0% 0.0% 15.0 614.5 41.0 41.0
SDGE HVAC CONTROLS PTAC 0 0.0% 0.0% 5.0 88.1 17.6 17.6
SDGE HVAC ROOFTOP OR SPLIT SYSTEM 0 0.0% 0.0% 15.0 649.1 43.3 43.3
DNV GL Appendix B - Std. Per Unit Savings61
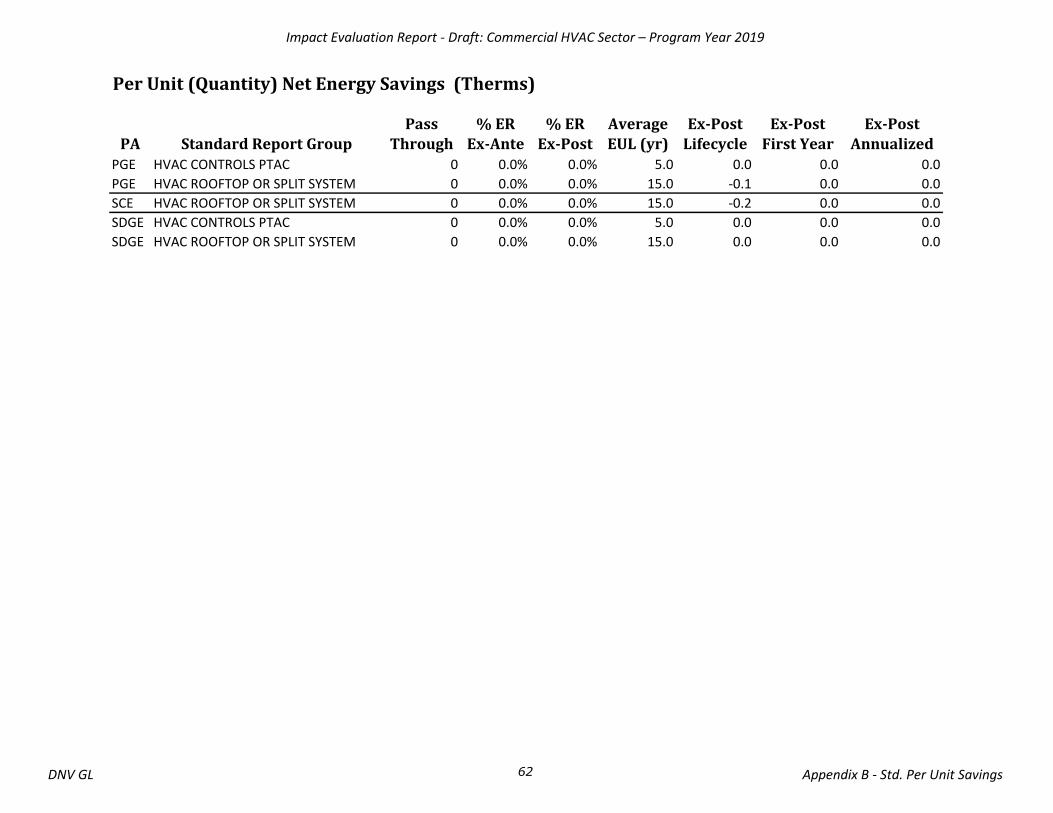
Impact Evaluation Report - Draft: Commercial HVAC Sector – Program Year 2019
Per Unit (Quantity) Net Energy Savings (Therms)
PA Standard Report Group
Pass
Through
% ER
Ex-Ante
% ER
Ex-Post
Average
EUL (yr)
Ex-Post
Lifecycle
Ex-Post
First Year
Ex-Post
AnnualizedPGE HVAC CONTROLS PTAC 0 0.0% 0.0% 5.0 0.0 0.0 0.0
PGE HVAC ROOFTOP OR SPLIT SYSTEM 0 0.0% 0.0% 15.0 -0.1 0.0 0.0
SCE HVAC ROOFTOP OR SPLIT SYSTEM 0 0.0% 0.0% 15.0 -0.2 0.0 0.0
SDGE HVAC CONTROLS PTAC 0 0.0% 0.0% 5.0 0.0 0.0 0.0
SDGE HVAC ROOFTOP OR SPLIT SYSTEM 0 0.0% 0.0% 15.0 0.0 0.0 0.0
DNV GL Appendix B - Std. Per Unit Savings62
DNV GL Energy Insights USA, Inc. Page 63
6.3. Appendix C: IESR−Recommendations resulting from the evaluation research
Study ID Study Type Study Title CPUC Study Manager
Group A X Sector
Impact Evaluation
Rec # Program or Database Summary of Findings Additional Supporting
Information Best
Practice/Recommendations Recipient Affected
Workpaper or DEER
This should take the form of a table or prepopulated Excel spreadsheet that would facilitate the Response to Recommendation (RTR) process. The target for each recommendation should be specified along with a brief description of the study findings upon which the recommendation is based and, if needed, where more detailed information that supports the recommendation can be found. This appendix would make the RTR process more transparent and help draw attention to recommendations that are aimed at coordinated/collaborative processes across multiple parties, such as Ex Ante Review or organization of program tracking data. Recommendations aimed at specific workpaper or DEER updates should be included and specified accordingly.

DNV GL Energy Insights USA, Inc. Page 64
6.4. Appendix D: Data collection and sampling memo
Click here to open appendix.

DNV GL Energy Insights USA, Inc. Page 65
6.5. Appendix E: PTAC controls data collection forms
6.5.1 PG&E program participant DCF
PTAC/PTHP/Split AC Controls Phone Interview Data Collection Worksheet - PG&E Site ID
Surveyor
Date Hello, my name is _____________________ and I’m calling from ERS on behalf of PG&E.
My company has been contracted by the California Public Utilities Commission to analyze the energy savings associated with projects funded by PG&E’s PTAC/PTHP/Split AC control programs. The [Project Name] project for [Owner/Facility Name] is one of the projects that has been selected for this evaluation and we would greatly appreciate your participation in this important study.
Our records indicate that your organization installed controls on PTAC/PTHP/Split AC units in the guest room through the program on [Install Date]. Does this sound familiar?
[If no] Is there someone I can talk to who might be more familiar with this particular project? [Record contact information and retry.]
[If yes, record name and title of respondent and proceed]
Our original plan for the evaluation was to conduct a site visit to the facility to confirm measure installation and install data logging equipment to estimate PTAC/PTHP/Split AC operational hours reduction due to the measure installation. However, to avoid any risks associated with exposure to the COVID-19 virus, we are conducting virtual assessments in place of site visits to gather data for our evaluation analysis. I would like to ask you a few questions about the project, the building characteristics, and the measure's operation prior to the COVID-19 pandemic to gather data for the evaluation. It would take approximately 30 minutes for this assessment. Would now be a good time for you to talk? [If not, obtain the time that would work best for site contact]
[If yes] Ok great. First, I'd like to get a few basic details about the project.
Question/Parameter Response
According to our records, the project occurred at [Site Address], Is this correct?
for Climate Zone
Our records also indicate that controls were installed on [Quantity] guest room PTAC/PTHP/Split AC units in the facility. Is this correct?
Record quantity for each type of unit
(PTAC/PTHP/Split AC)
We see from our records that the controls were installed in [Month/Year]. Is this correct?
Month/Year
About when was the hotel constructed or majorly renovated? e.g., 2003, 1998 etc.
Would you classify the building as a hotel or motel? Hotel/Motel
What is the overall building area (in ft2)?
Number of floors in the building?
Were there any changes to hotel operations in 2019 compared to prior years?
Is there any seasonality associated with hotel occupancy rates or other operations that could have an impact on the energy bills?
[If yes, probe further to obtain seasonality]
Can you recall any energy or non-energy related events that occurred at the hotel in the past 2 years which could have an impact
Yes/No
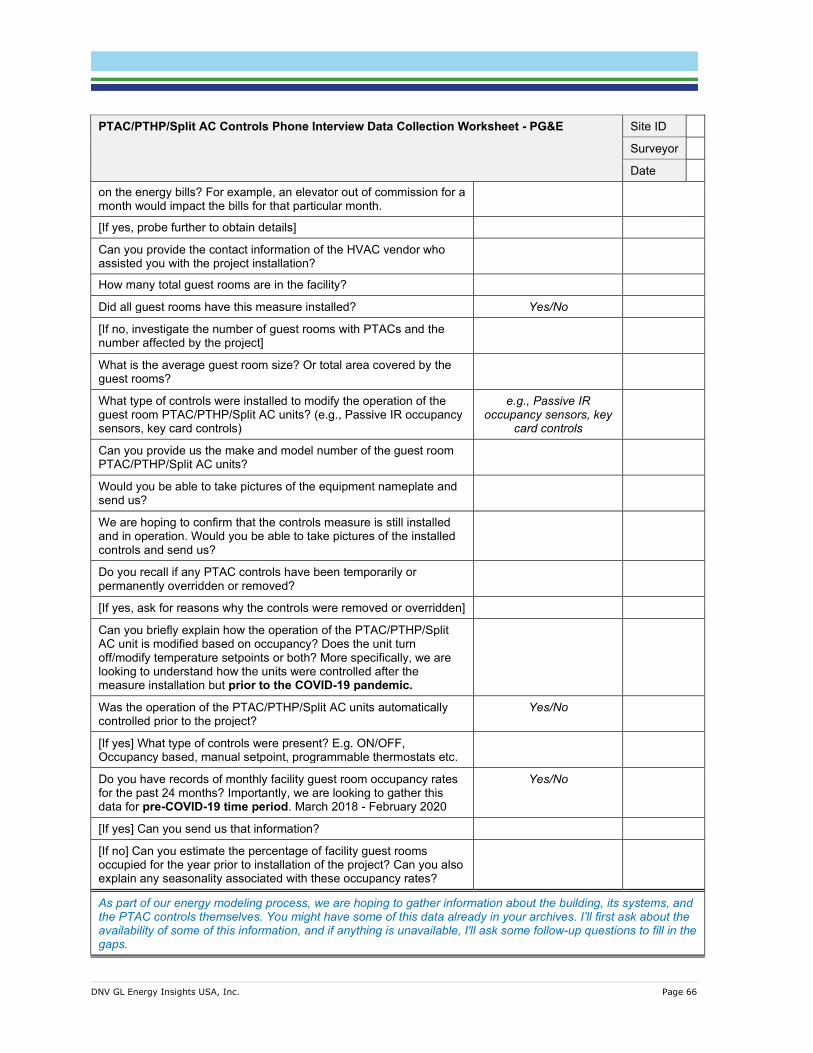
DNV GL Energy Insights USA, Inc. Page 66
PTAC/PTHP/Split AC Controls Phone Interview Data Collection Worksheet - PG&E Site ID
Surveyor
Date
on the energy bills? For example, an elevator out of commission for a month would impact the bills for that particular month.
[If yes, probe further to obtain details]
Can you provide the contact information of the HVAC vendor who assisted you with the project installation?
How many total guest rooms are in the facility?
Did all guest rooms have this measure installed? Yes/No
[If no, investigate the number of guest rooms with PTACs and the number affected by the project]
What is the average guest room size? Or total area covered by the guest rooms?
What type of controls were installed to modify the operation of the guest room PTAC/PTHP/Split AC units? (e.g., Passive IR occupancy sensors, key card controls)
e.g., Passive IR occupancy sensors, key
card controls
Can you provide us the make and model number of the guest room PTAC/PTHP/Split AC units?
Would you be able to take pictures of the equipment nameplate and send us?
We are hoping to confirm that the controls measure is still installed and in operation. Would you be able to take pictures of the installed controls and send us?
Do you recall if any PTAC controls have been temporarily or permanently overridden or removed?
[If yes, ask for reasons why the controls were removed or overridden]
Can you briefly explain how the operation of the PTAC/PTHP/Split AC unit is modified based on occupancy? Does the unit turn off/modify temperature setpoints or both? More specifically, we are looking to understand how the units were controlled after the measure installation but prior to the COVID-19 pandemic.
Was the operation of the PTAC/PTHP/Split AC units automatically controlled prior to the project?
Yes/No
[If yes] What type of controls were present? E.g. ON/OFF, Occupancy based, manual setpoint, programmable thermostats etc.
Do you have records of monthly facility guest room occupancy rates for the past 24 months? Importantly, we are looking to gather this data for pre-COVID-19 time period. March 2018 - February 2020
Yes/No
[If yes] Can you send us that information?
[If no] Can you estimate the percentage of facility guest rooms occupied for the year prior to installation of the project? Can you also explain any seasonality associated with these occupancy rates?
As part of our energy modeling process, we are hoping to gather information about the building, its systems, and the PTAC controls themselves. You might have some of this data already in your archives. I’ll first ask about the availability of some of this information, and if anything is unavailable, I'll ask some follow-up questions to fill in the gaps.
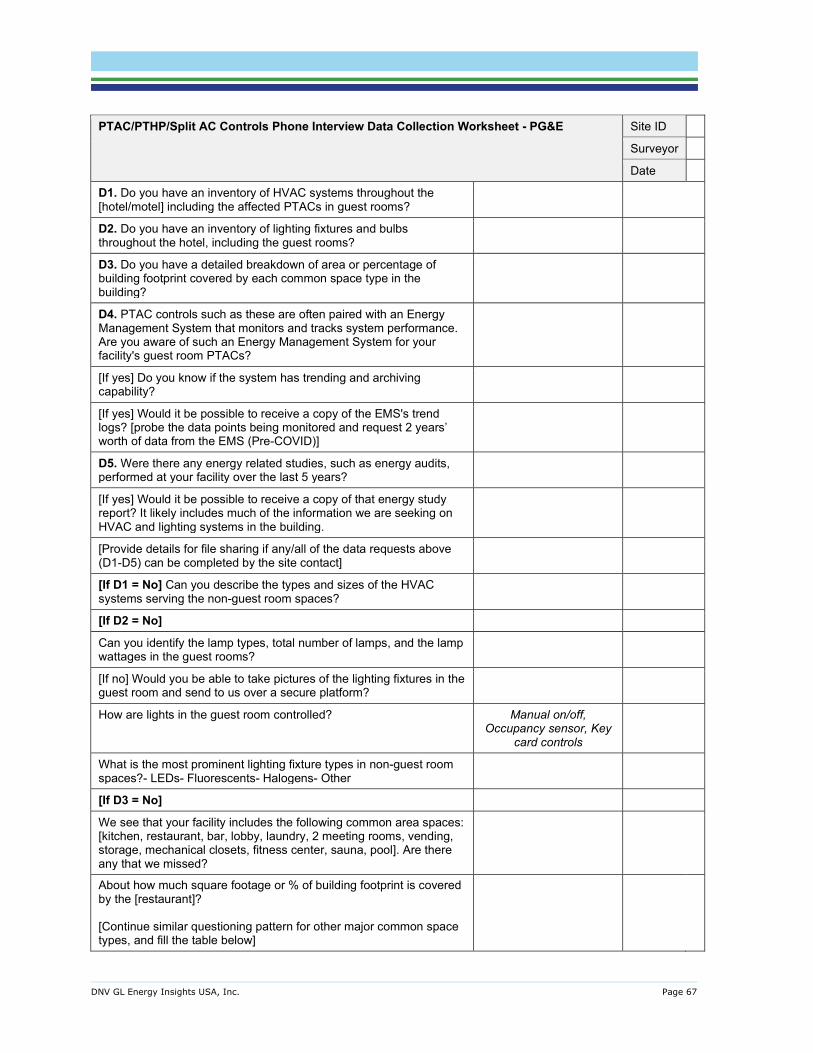
DNV GL Energy Insights USA, Inc. Page 67
PTAC/PTHP/Split AC Controls Phone Interview Data Collection Worksheet - PG&E Site ID
Surveyor
Date
D1. Do you have an inventory of HVAC systems throughout the [hotel/motel] including the affected PTACs in guest rooms?
D2. Do you have an inventory of lighting fixtures and bulbs throughout the hotel, including the guest rooms?
D3. Do you have a detailed breakdown of area or percentage of building footprint covered by each common space type in the building?
D4. PTAC controls such as these are often paired with an Energy Management System that monitors and tracks system performance. Are you aware of such an Energy Management System for your facility's guest room PTACs?
[If yes] Do you know if the system has trending and archiving capability?
[If yes] Would it be possible to receive a copy of the EMS's trend logs? [probe the data points being monitored and request 2 years’ worth of data from the EMS (Pre-COVID)]
D5. Were there any energy related studies, such as energy audits, performed at your facility over the last 5 years?
[If yes] Would it be possible to receive a copy of that energy study report? It likely includes much of the information we are seeking on HVAC and lighting systems in the building.
[Provide details for file sharing if any/all of the data requests above (D1-D5) can be completed by the site contact]
[If D1 = No] Can you describe the types and sizes of the HVAC systems serving the non-guest room spaces?
[If D2 = No]
Can you identify the lamp types, total number of lamps, and the lamp wattages in the guest rooms?
[If no] Would you be able to take pictures of the lighting fixtures in the guest room and send to us over a secure platform?
How are lights in the guest room controlled? Manual on/off, Occupancy sensor, Key
card controls
What is the most prominent lighting fixture types in non-guest room spaces?- LEDs- Fluorescents- Halogens- Other
[If D3 = No]
We see that your facility includes the following common area spaces: [kitchen, restaurant, bar, lobby, laundry, 2 meeting rooms, vending, storage, mechanical closets, fitness center, sauna, pool]. Are there any that we missed?
About how much square footage or % of building footprint is covered by the [restaurant]? [Continue similar questioning pattern for other major common space types, and fill the table below]
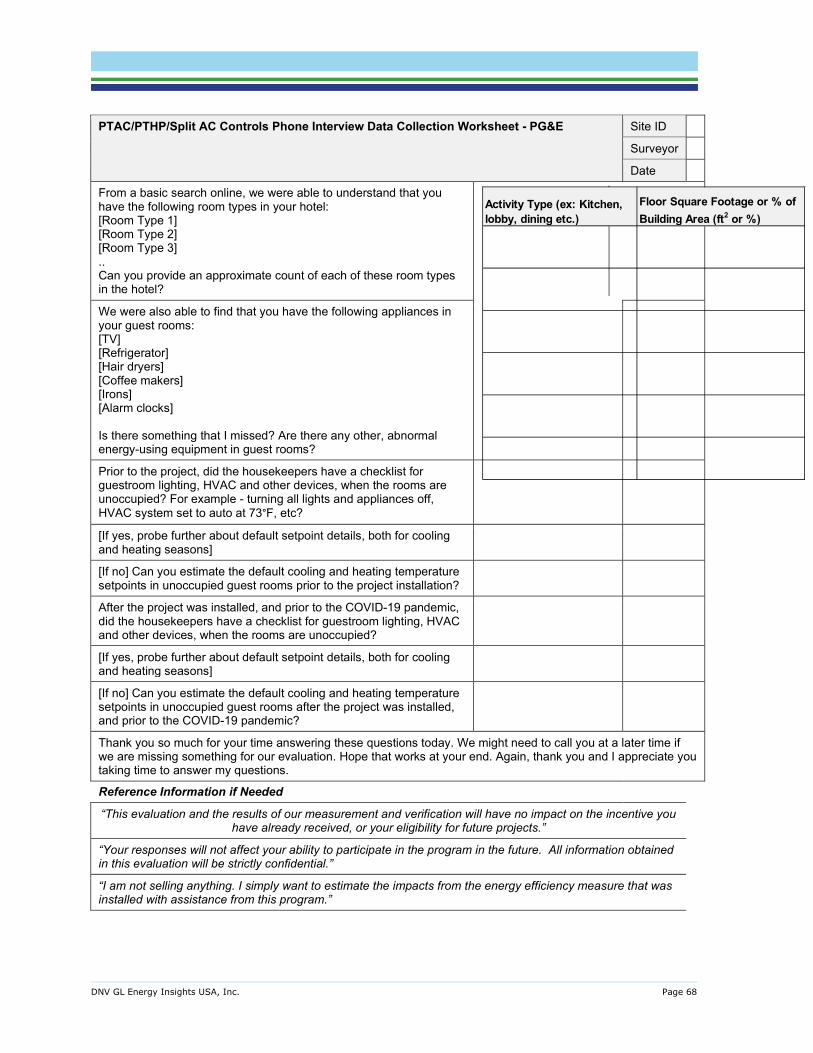
DNV GL Energy Insights USA, Inc. Page 68
PTAC/PTHP/Split AC Controls Phone Interview Data Collection Worksheet - PG&E Site ID
Surveyor
Date
From a basic search online, we were able to understand that you have the following room types in your hotel: [Room Type 1] [Room Type 2] [Room Type 3] .. Can you provide an approximate count of each of these room types in the hotel?
We were also able to find that you have the following appliances in your guest rooms: [TV] [Refrigerator] [Hair dryers] [Coffee makers] [Irons] [Alarm clocks] Is there something that I missed? Are there any other, abnormal energy-using equipment in guest rooms?
Prior to the project, did the housekeepers have a checklist for guestroom lighting, HVAC and other devices, when the rooms are unoccupied? For example - turning all lights and appliances off, HVAC system set to auto at 73°F, etc?
[If yes, probe further about default setpoint details, both for cooling and heating seasons]
[If no] Can you estimate the default cooling and heating temperature setpoints in unoccupied guest rooms prior to the project installation?
After the project was installed, and prior to the COVID-19 pandemic, did the housekeepers have a checklist for guestroom lighting, HVAC and other devices, when the rooms are unoccupied?
[If yes, probe further about default setpoint details, both for cooling and heating seasons]
[If no] Can you estimate the default cooling and heating temperature setpoints in unoccupied guest rooms after the project was installed, and prior to the COVID-19 pandemic?
Thank you so much for your time answering these questions today. We might need to call you at a later time if we are missing something for our evaluation. Hope that works at your end. Again, thank you and I appreciate you taking time to answer my questions.
Reference Information if Needed
“This evaluation and the results of our measurement and verification will have no impact on the incentive you have already received, or your eligibility for future projects.”
“Your responses will not affect your ability to participate in the program in the future. All information obtained in this evaluation will be strictly confidential.”
“I am not selling anything. I simply want to estimate the impacts from the energy efficiency measure that was installed with assistance from this program.”
Activity Type (ex: Kitchen, lobby, dining etc.)
Floor Square Footage or % of Building Area (ft2 or %)
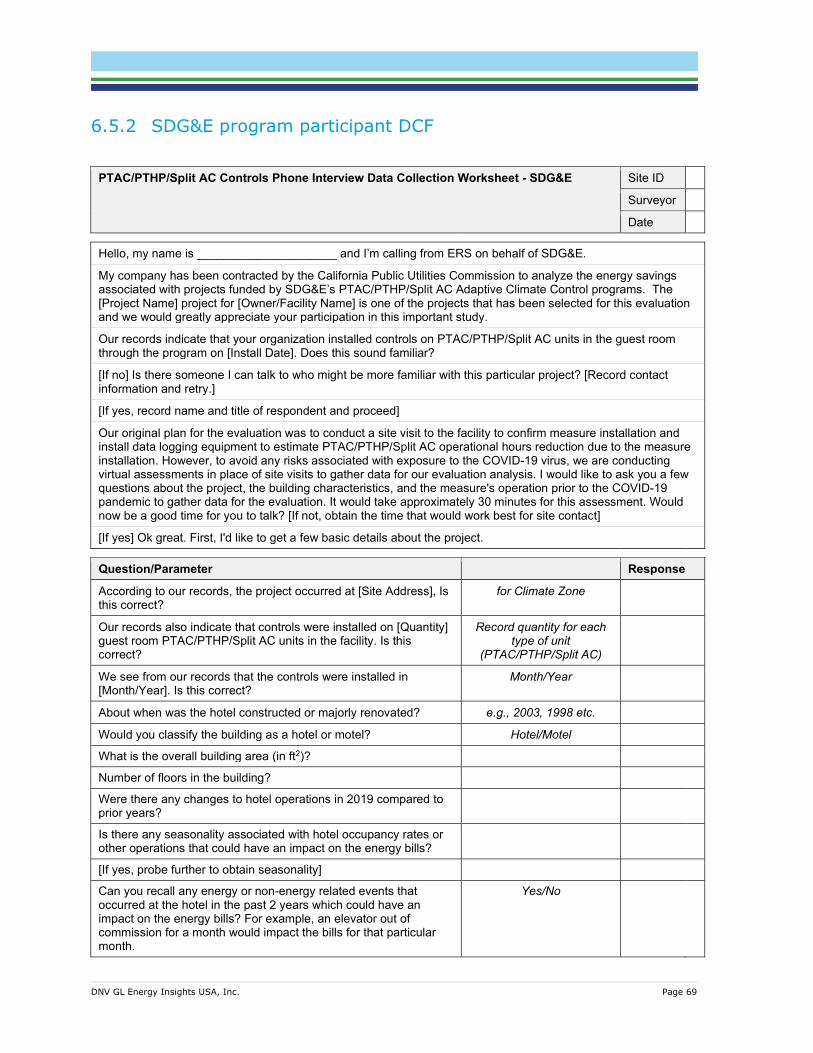
DNV GL Energy Insights USA, Inc. Page 69
6.5.2 SDG&E program participant DCF
PTAC/PTHP/Split AC Controls Phone Interview Data Collection Worksheet - SDG&E Site ID
Surveyor
Date Hello, my name is _____________________ and I’m calling from ERS on behalf of SDG&E.
My company has been contracted by the California Public Utilities Commission to analyze the energy savings associated with projects funded by SDG&E’s PTAC/PTHP/Split AC Adaptive Climate Control programs. The [Project Name] project for [Owner/Facility Name] is one of the projects that has been selected for this evaluation and we would greatly appreciate your participation in this important study.
Our records indicate that your organization installed controls on PTAC/PTHP/Split AC units in the guest room through the program on [Install Date]. Does this sound familiar?
[If no] Is there someone I can talk to who might be more familiar with this particular project? [Record contact information and retry.]
[If yes, record name and title of respondent and proceed]
Our original plan for the evaluation was to conduct a site visit to the facility to confirm measure installation and install data logging equipment to estimate PTAC/PTHP/Split AC operational hours reduction due to the measure installation. However, to avoid any risks associated with exposure to the COVID-19 virus, we are conducting virtual assessments in place of site visits to gather data for our evaluation analysis. I would like to ask you a few questions about the project, the building characteristics, and the measure's operation prior to the COVID-19 pandemic to gather data for the evaluation. It would take approximately 30 minutes for this assessment. Would now be a good time for you to talk? [If not, obtain the time that would work best for site contact]
[If yes] Ok great. First, I'd like to get a few basic details about the project.
Question/Parameter Response
According to our records, the project occurred at [Site Address], Is this correct?
for Climate Zone
Our records also indicate that controls were installed on [Quantity] guest room PTAC/PTHP/Split AC units in the facility. Is this correct?
Record quantity for each type of unit
(PTAC/PTHP/Split AC)
We see from our records that the controls were installed in [Month/Year]. Is this correct?
Month/Year
About when was the hotel constructed or majorly renovated? e.g., 2003, 1998 etc.
Would you classify the building as a hotel or motel? Hotel/Motel
What is the overall building area (in ft2)?
Number of floors in the building?
Were there any changes to hotel operations in 2019 compared to prior years?
Is there any seasonality associated with hotel occupancy rates or other operations that could have an impact on the energy bills?
[If yes, probe further to obtain seasonality]
Can you recall any energy or non-energy related events that occurred at the hotel in the past 2 years which could have an impact on the energy bills? For example, an elevator out of commission for a month would impact the bills for that particular month.
Yes/No
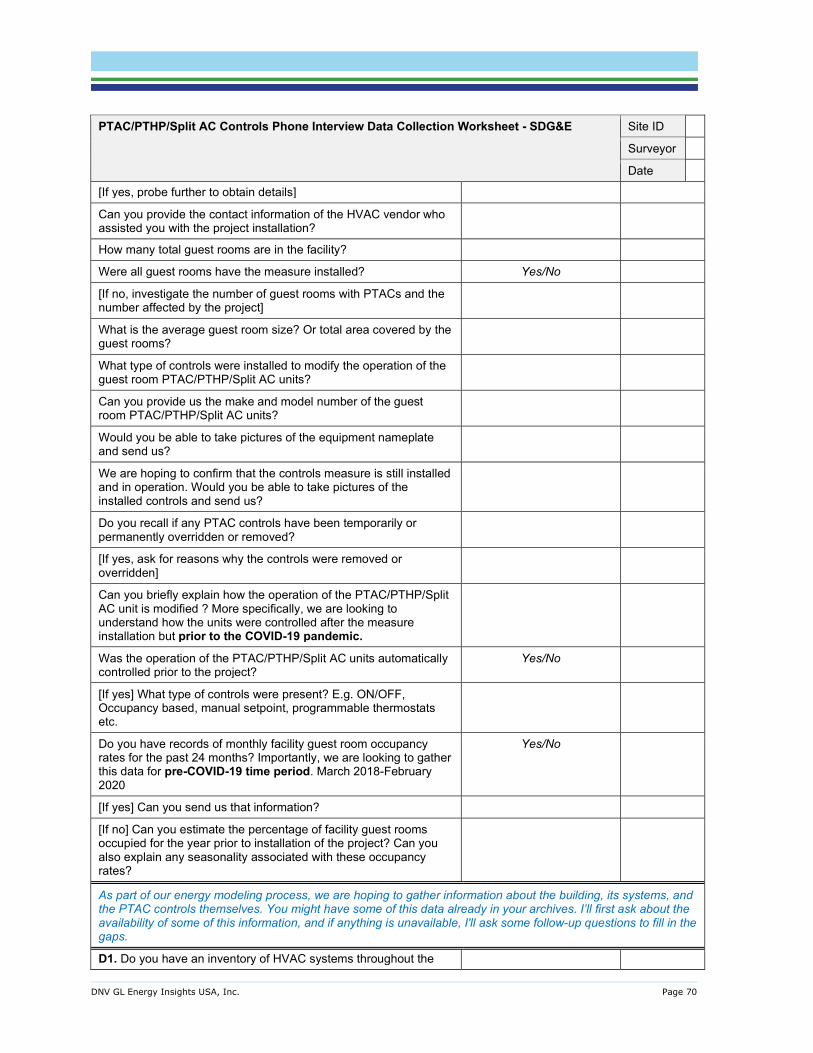
DNV GL Energy Insights USA, Inc. Page 70
PTAC/PTHP/Split AC Controls Phone Interview Data Collection Worksheet - SDG&E Site ID
Surveyor
Date
[If yes, probe further to obtain details]
Can you provide the contact information of the HVAC vendor who assisted you with the project installation?
How many total guest rooms are in the facility?
Were all guest rooms have the measure installed? Yes/No
[If no, investigate the number of guest rooms with PTACs and the number affected by the project]
What is the average guest room size? Or total area covered by the guest rooms?
What type of controls were installed to modify the operation of the guest room PTAC/PTHP/Split AC units?
Can you provide us the make and model number of the guest room PTAC/PTHP/Split AC units?
Would you be able to take pictures of the equipment nameplate and send us?
We are hoping to confirm that the controls measure is still installed and in operation. Would you be able to take pictures of the installed controls and send us?
Do you recall if any PTAC controls have been temporarily or permanently overridden or removed?
[If yes, ask for reasons why the controls were removed or overridden]
Can you briefly explain how the operation of the PTAC/PTHP/Split AC unit is modified ? More specifically, we are looking to understand how the units were controlled after the measure installation but prior to the COVID-19 pandemic.
Was the operation of the PTAC/PTHP/Split AC units automatically controlled prior to the project?
Yes/No
[If yes] What type of controls were present? E.g. ON/OFF, Occupancy based, manual setpoint, programmable thermostats etc.
Do you have records of monthly facility guest room occupancy rates for the past 24 months? Importantly, we are looking to gather this data for pre-COVID-19 time period. March 2018-February 2020
Yes/No
[If yes] Can you send us that information?
[If no] Can you estimate the percentage of facility guest rooms occupied for the year prior to installation of the project? Can you also explain any seasonality associated with these occupancy rates?
As part of our energy modeling process, we are hoping to gather information about the building, its systems, and the PTAC controls themselves. You might have some of this data already in your archives. I’ll first ask about the availability of some of this information, and if anything is unavailable, I'll ask some follow-up questions to fill in the gaps.
D1. Do you have an inventory of HVAC systems throughout the
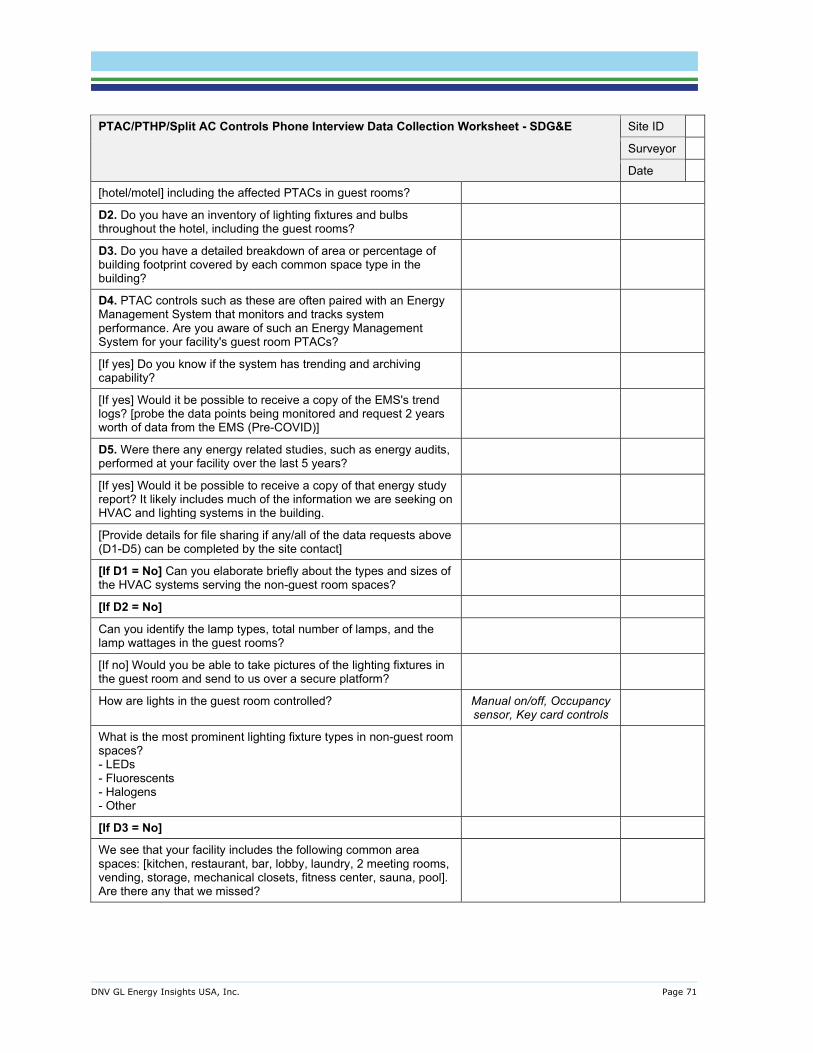
DNV GL Energy Insights USA, Inc. Page 71
PTAC/PTHP/Split AC Controls Phone Interview Data Collection Worksheet - SDG&E Site ID
Surveyor
Date
[hotel/motel] including the affected PTACs in guest rooms?
D2. Do you have an inventory of lighting fixtures and bulbs throughout the hotel, including the guest rooms?
D3. Do you have a detailed breakdown of area or percentage of building footprint covered by each common space type in the building?
D4. PTAC controls such as these are often paired with an Energy Management System that monitors and tracks system performance. Are you aware of such an Energy Management System for your facility's guest room PTACs?
[If yes] Do you know if the system has trending and archiving capability?
[If yes] Would it be possible to receive a copy of the EMS's trend logs? [probe the data points being monitored and request 2 years worth of data from the EMS (Pre-COVID)]
D5. Were there any energy related studies, such as energy audits, performed at your facility over the last 5 years?
[If yes] Would it be possible to receive a copy of that energy study report? It likely includes much of the information we are seeking on HVAC and lighting systems in the building.
[Provide details for file sharing if any/all of the data requests above (D1-D5) can be completed by the site contact]
[If D1 = No] Can you elaborate briefly about the types and sizes of the HVAC systems serving the non-guest room spaces?
[If D2 = No]
Can you identify the lamp types, total number of lamps, and the lamp wattages in the guest rooms?
[If no] Would you be able to take pictures of the lighting fixtures in the guest room and send to us over a secure platform?
How are lights in the guest room controlled? Manual on/off, Occupancy sensor, Key card controls
What is the most prominent lighting fixture types in non-guest room spaces? - LEDs - Fluorescents - Halogens - Other
[If D3 = No]
We see that your facility includes the following common area spaces: [kitchen, restaurant, bar, lobby, laundry, 2 meeting rooms, vending, storage, mechanical closets, fitness center, sauna, pool]. Are there any that we missed?
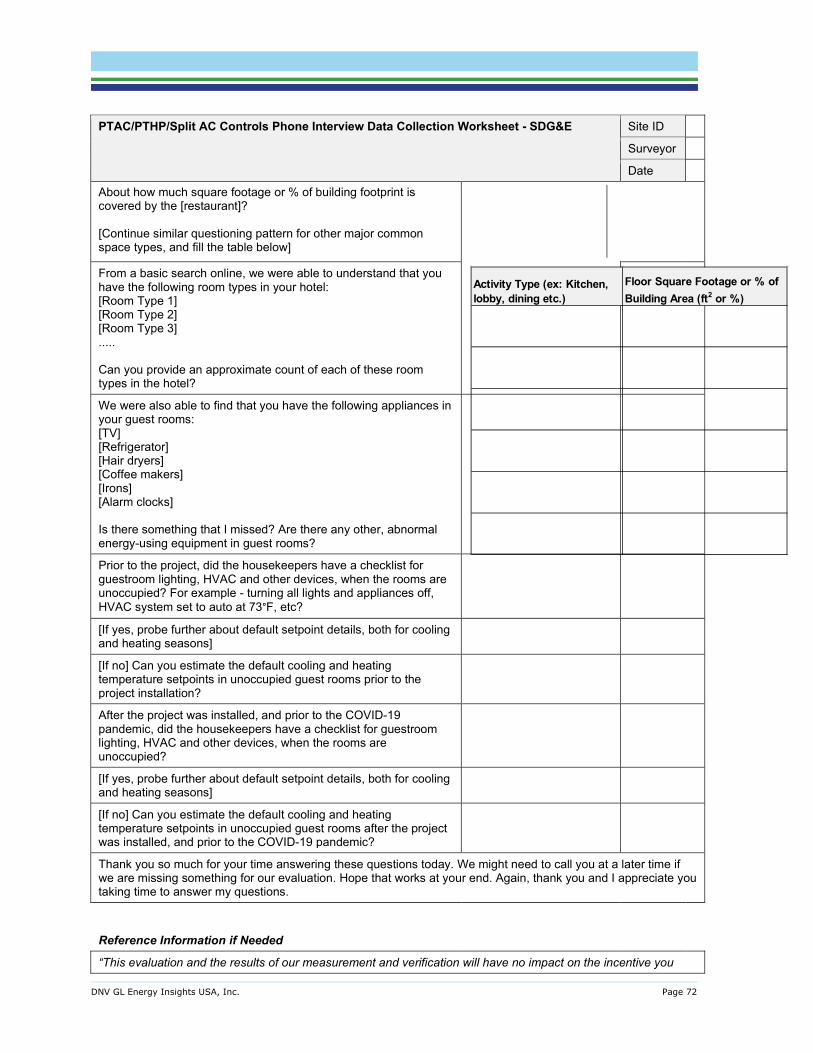
DNV GL Energy Insights USA, Inc. Page 72
PTAC/PTHP/Split AC Controls Phone Interview Data Collection Worksheet - SDG&E Site ID
Surveyor
Date
About how much square footage or % of building footprint is covered by the [restaurant]? [Continue similar questioning pattern for other major common space types, and fill the table below]
From a basic search online, we were able to understand that you have the following room types in your hotel: [Room Type 1] [Room Type 2] [Room Type 3] ..... Can you provide an approximate count of each of these room types in the hotel?
We were also able to find that you have the following appliances in your guest rooms: [TV] [Refrigerator] [Hair dryers] [Coffee makers] [Irons] [Alarm clocks] Is there something that I missed? Are there any other, abnormal energy-using equipment in guest rooms?
Prior to the project, did the housekeepers have a checklist for guestroom lighting, HVAC and other devices, when the rooms are unoccupied? For example - turning all lights and appliances off, HVAC system set to auto at 73°F, etc?
[If yes, probe further about default setpoint details, both for cooling and heating seasons]
[If no] Can you estimate the default cooling and heating temperature setpoints in unoccupied guest rooms prior to the project installation?
After the project was installed, and prior to the COVID-19 pandemic, did the housekeepers have a checklist for guestroom lighting, HVAC and other devices, when the rooms are unoccupied?
[If yes, probe further about default setpoint details, both for cooling and heating seasons]
[If no] Can you estimate the default cooling and heating temperature setpoints in unoccupied guest rooms after the project was installed, and prior to the COVID-19 pandemic?
Thank you so much for your time answering these questions today. We might need to call you at a later time if we are missing something for our evaluation. Hope that works at your end. Again, thank you and I appreciate you taking time to answer my questions.
Reference Information if Needed
“This evaluation and the results of our measurement and verification will have no impact on the incentive you
Activity Type (ex: Kitchen, lobby, dining etc.)
Floor Square Footage or % of Building Area (ft2 or %)
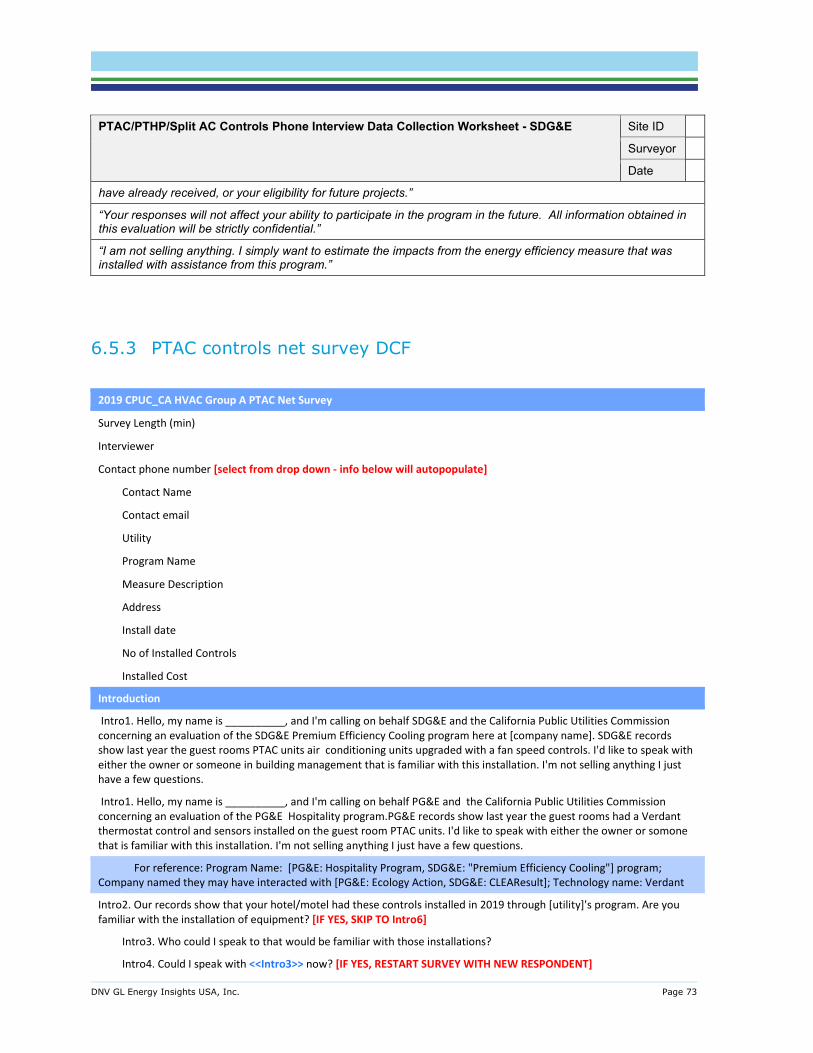
DNV GL Energy Insights USA, Inc. Page 73
PTAC/PTHP/Split AC Controls Phone Interview Data Collection Worksheet - SDG&E Site ID
Surveyor
Date
have already received, or your eligibility for future projects.”
“Your responses will not affect your ability to participate in the program in the future. All information obtained in this evaluation will be strictly confidential.”
“I am not selling anything. I simply want to estimate the impacts from the energy efficiency measure that was installed with assistance from this program.”
6.5.3 PTAC controls net survey DCF
2019 CPUC_CA HVAC Group A PTAC Net Survey
Survey Length (min)
Interviewer
Contact phone number [select from drop down - info below will autopopulate]
Contact Name
Contact email
Utility
Program Name
Measure Description
Address
Install date
No of Installed Controls
Installed Cost
Introduction
Intro1. Hello, my name is __________, and I'm calling on behalf SDG&E and the California Public Utilities Commission concerning an evaluation of the SDG&E Premium Efficiency Cooling program here at [company name]. SDG&E records show last year the guest rooms PTAC units air conditioning units upgraded with a fan speed controls. I'd like to speak with either the owner or someone in building management that is familiar with this installation. I'm not selling anything I just have a few questions.
Intro1. Hello, my name is __________, and I'm calling on behalf PG&E and the California Public Utilities Commission concerning an evaluation of the PG&E Hospitality program.PG&E records show last year the guest rooms had a Verdant thermostat control and sensors installed on the guest room PTAC units. I'd like to speak with either the owner or somone that is familiar with this installation. I'm not selling anything I just have a few questions.
For reference: Program Name: [PG&E: Hospitality Program, SDG&E: "Premium Efficiency Cooling"] program; Company named they may have interacted with [PG&E: Ecology Action, SDG&E: CLEAResult]; Technology name: Verdant
Intro2. Our records show that your hotel/motel had these controls installed in 2019 through [utility]'s program. Are you familiar with the installation of equipment? [IF YES, SKIP TO Intro6]
Intro3. Who could I speak to that would be familiar with those installations?
Intro4. Could I speak with <<Intro3>> now? [IF YES, RESTART SURVEY WITH NEW RESPONDENT]
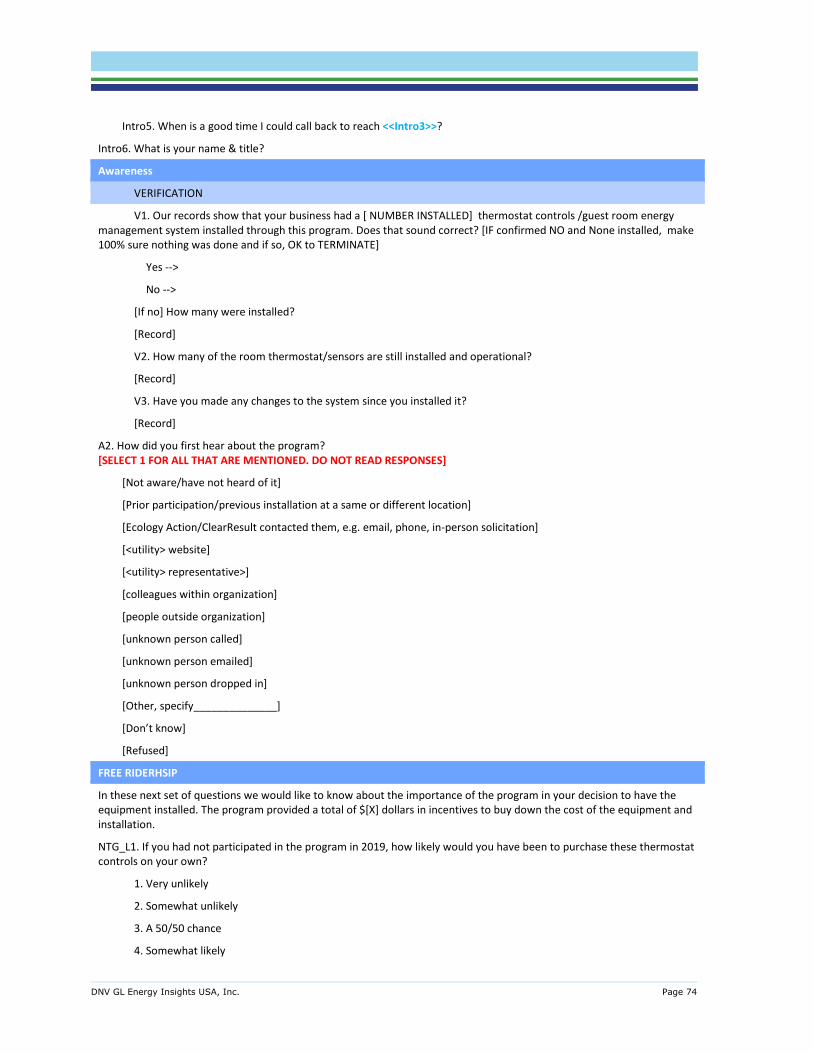
DNV GL Energy Insights USA, Inc. Page 74
Intro5. When is a good time I could call back to reach <<Intro3>>?
Intro6. What is your name & title?
Awareness
VERIFICATION
V1. Our records show that your business had a [ NUMBER INSTALLED] thermostat controls /guest room energy management system installed through this program. Does that sound correct? [IF confirmed NO and None installed, make 100% sure nothing was done and if so, OK to TERMINATE]
Yes -->
No -->
[If no] How many were installed?
[Record]
V2. How many of the room thermostat/sensors are still installed and operational?
[Record]
V3. Have you made any changes to the system since you installed it?
[Record]
A2. How did you first hear about the program? [SELECT 1 FOR ALL THAT ARE MENTIONED. DO NOT READ RESPONSES]
[Not aware/have not heard of it]
[Prior participation/previous installation at a same or different location]
[Ecology Action/ClearResult contacted them, e.g. email, phone, in-person solicitation]
[<utility> website]
[<utility> representative>]
[colleagues within organization]
[people outside organization]
[unknown person called]
[unknown person emailed]
[unknown person dropped in]
[Other, specify______________]
[Don’t know]
[Refused]
FREE RIDERHSIP
In these next set of questions we would like to know about the importance of the program in your decision to have the equipment installed. The program provided a total of $[X] dollars in incentives to buy down the cost of the equipment and installation.
NTG_L1. If you had not participated in the program in 2019, how likely would you have been to purchase these thermostat controls on your own?
1. Very unlikely
2. Somewhat unlikely
3. A 50/50 chance
4. Somewhat likely
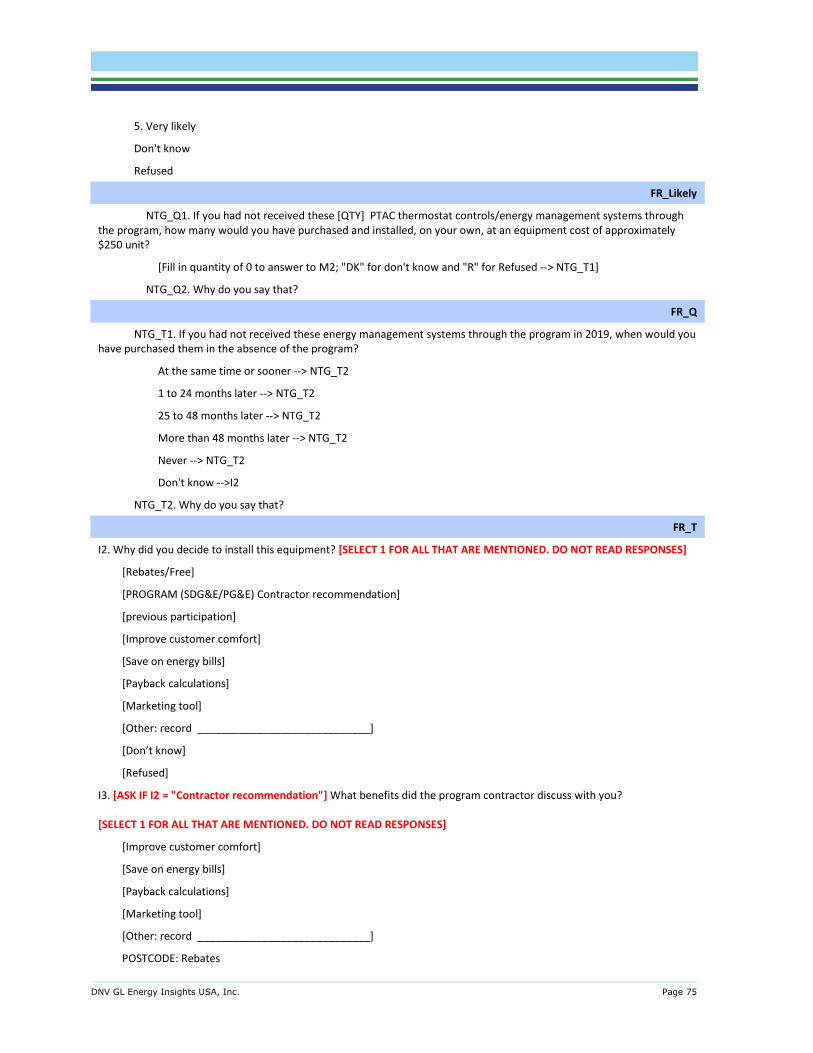
DNV GL Energy Insights USA, Inc. Page 75
5. Very likely
Don't know
Refused
FR_Likely
NTG_Q1. If you had not received these [QTY] PTAC thermostat controls/energy management systems through the program, how many would you have purchased and installed, on your own, at an equipment cost of approximately $250 unit?
[Fill in quantity of 0 to answer to M2; "DK" for don't know and "R" for Refused --> NTG_T1]
NTG_Q2. Why do you say that?
FR_Q
NTG_T1. If you had not received these energy management systems through the program in 2019, when would you have purchased them in the absence of the program?
At the same time or sooner --> NTG_T2
1 to 24 months later --> NTG_T2
25 to 48 months later --> NTG_T2
More than 48 months later --> NTG_T2
Never --> NTG_T2
Don't know -->I2
NTG_T2. Why do you say that?
FR_T
I2. Why did you decide to install this equipment? [SELECT 1 FOR ALL THAT ARE MENTIONED. DO NOT READ RESPONSES]
[Rebates/Free]
[PROGRAM (SDG&E/PG&E) Contractor recommendation]
[previous participation]
[Improve customer comfort]
[Save on energy bills]
[Payback calculations]
[Marketing tool]
[Other: record _____________________________]
[Don’t know]
[Refused]
I3. [ASK IF I2 = "Contractor recommendation"] What benefits did the program contractor discuss with you? [SELECT 1 FOR ALL THAT ARE MENTIONED. DO NOT READ RESPONSES]
[Improve customer comfort]
[Save on energy bills]
[Payback calculations]
[Marketing tool]
[Other: record _____________________________]
POSTCODE: Rebates

DNV GL Energy Insights USA, Inc. Page 76
[Don’t know]
[Refused]
[If i3= payback calculations] I4. What ROI requirement were you looking for
Months:
I4. Are you satisfied with the equipment installed?
Yes/No
If no, why not?
I5. Thank you for your feedback. Do you have any other feedback regarding your experience with this program that you would like to share before we close?
[Record]
Thanks & Terminate
Those are all the questions we have for you today. Thank you for your participation in our survey.
Unweighted FR_Total
Unweighted Attribution
Weighted Attribution
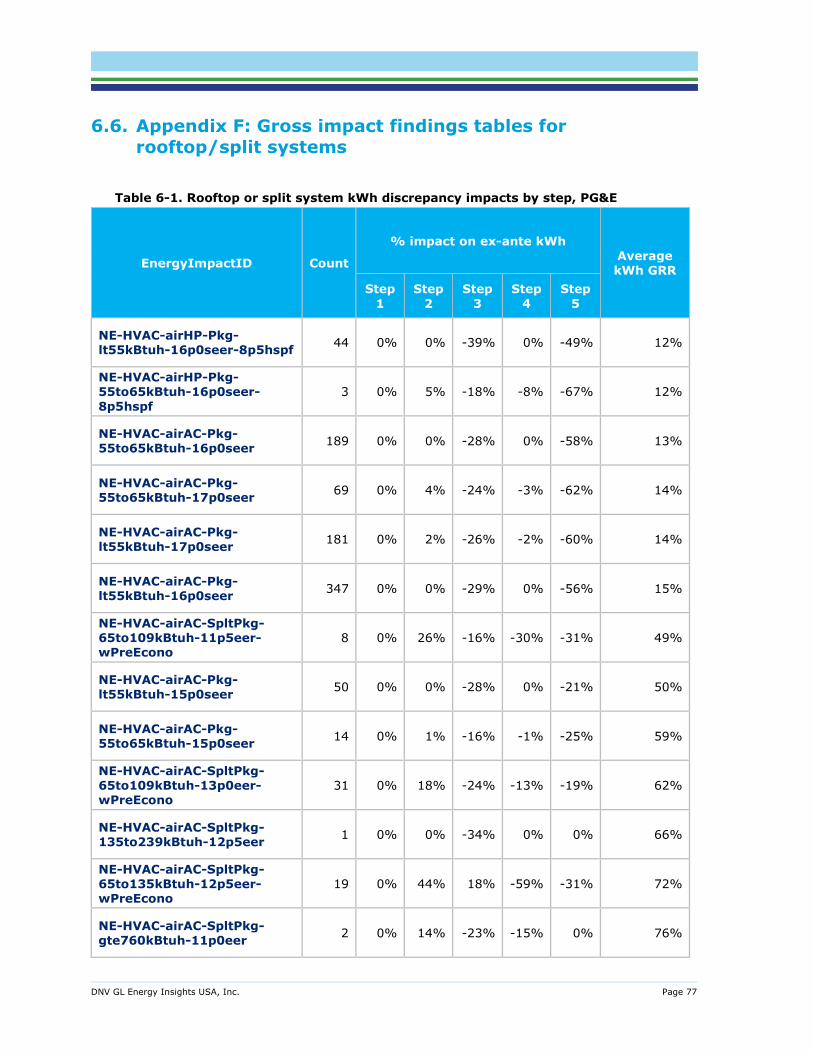
DNV GL Energy Insights USA, Inc. Page 77
6.6. Appendix F: Gross impact findings tables for rooftop/split systems
Table 6-1. Rooftop or split system kWh discrepancy impacts by step, PG&E
EnergyImpactID Count
% impact on ex-ante kWh Average kWh GRR
Step 1
Step 2
Step 3
Step 4
Step 5
NE-HVAC-airHP-Pkg-lt55kBtuh-16p0seer-8p5hspf 44 0% 0% -39% 0% -49% 12%
NE-HVAC-airHP-Pkg-55to65kBtuh-16p0seer-8p5hspf
3 0% 5% -18% -8% -67% 12%
NE-HVAC-airAC-Pkg-55to65kBtuh-16p0seer 189 0% 0% -28% 0% -58% 13%
NE-HVAC-airAC-Pkg-55to65kBtuh-17p0seer 69 0% 4% -24% -3% -62% 14%
NE-HVAC-airAC-Pkg-lt55kBtuh-17p0seer 181 0% 2% -26% -2% -60% 14%
NE-HVAC-airAC-Pkg-lt55kBtuh-16p0seer 347 0% 0% -29% 0% -56% 15%
NE-HVAC-airAC-SpltPkg-65to109kBtuh-11p5eer-wPreEcono
8 0% 26% -16% -30% -31% 49%
NE-HVAC-airAC-Pkg-lt55kBtuh-15p0seer 50 0% 0% -28% 0% -21% 50%
NE-HVAC-airAC-Pkg-55to65kBtuh-15p0seer 14 0% 1% -16% -1% -25% 59%
NE-HVAC-airAC-SpltPkg-65to109kBtuh-13p0eer-wPreEcono
31 0% 18% -24% -13% -19% 62%
NE-HVAC-airAC-SpltPkg-135to239kBtuh-12p5eer 1 0% 0% -34% 0% 0% 66%
NE-HVAC-airAC-SpltPkg-65to135kBtuh-12p5eer-wPreEcono
19 0% 44% 18% -59% -31% 72%
NE-HVAC-airAC-SpltPkg-gte760kBtuh-11p0eer 2 0% 14% -23% -15% 0% 76%

DNV GL Energy Insights USA, Inc. Page 78
EnergyImpactID Count
% impact on ex-ante kWh Average kWh GRR
Step 1
Step 2
Step 3
Step 4
Step 5
NE-HVAC-airHP-Pkg-lt55kBtuh-15p0seer-8p2hspf 14 0% 2% -39% -2% 17% 78%
NE-HVAC-airAC-Pkg-55to65kBtuh-18p0seer 4 N/A 24% -21% -25% 0% 79%
NE-HVAC-airAC-SpltPkg-135to239kBtuh-11p5eer 4 0% 0% -21% 0% 0% 79%
NE-HVAC-airAC-SpltPkg-gte760kBtuh-10p2eer 51 0% 4% -11% -5% 0% 89%
PGE210112 measures 18 0% N/A N/A N/A N/A 100%
NE-HVAC-airAC-Pkg-lt55kBtuh-18p0seer 1 0% 0% 18% 0% -18% 100%
NE-HVAC-airAC-SpltPkg-135to239kBtuh-12p0eer 30 0% 5% 10% -4% 0% 111%
NE-HVAC-airAC-SpltPkg-65to109kBtuh-12p0eer-wPreEcono
69 0% 6% 8% -9% 8% 114%
NE-HVAC-airAC-SpltPkg-240to759kBtuh-10p8eer 18 0% 12% 29% -8% 0% 133%
NE-HVAC-airHP-Pkg-55to65kBtuh-15p0seer-8p2hspf
3 0% 0% 31% 0% 46% 177%
Total (straight average) 1,170 0% 3% -22% -3% -
43% 35%
Table 6-2. Rooftop or split system kWh discrepancy impacts by step, SCE
EnergyImpactID Count
% impact on ex-ante kWh
Average kWh GRR
Step 1
Step 2
Step 3
Step 4
Step 5
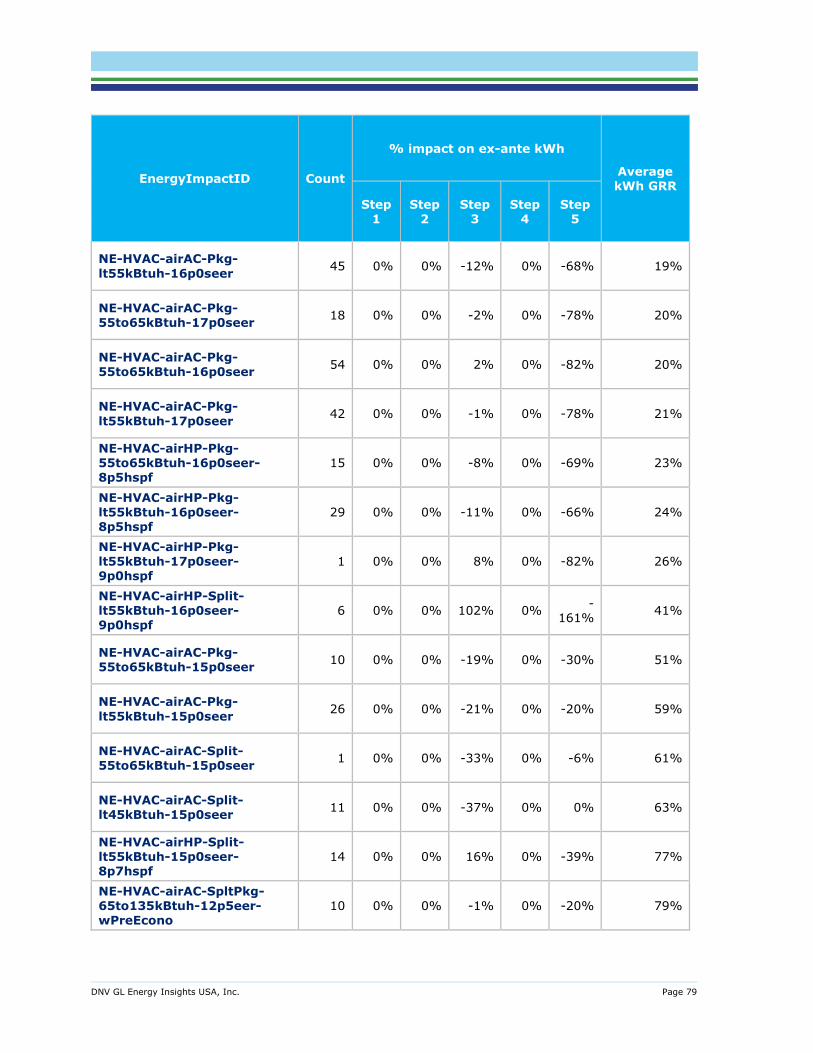
DNV GL Energy Insights USA, Inc. Page 79
EnergyImpactID Count
% impact on ex-ante kWh
Average kWh GRR
Step 1
Step 2
Step 3
Step 4
Step 5
NE-HVAC-airAC-Pkg-lt55kBtuh-16p0seer 45 0% 0% -12% 0% -68% 19%
NE-HVAC-airAC-Pkg-55to65kBtuh-17p0seer 18 0% 0% -2% 0% -78% 20%
NE-HVAC-airAC-Pkg-55to65kBtuh-16p0seer 54 0% 0% 2% 0% -82% 20%
NE-HVAC-airAC-Pkg-lt55kBtuh-17p0seer 42 0% 0% -1% 0% -78% 21%
NE-HVAC-airHP-Pkg-55to65kBtuh-16p0seer-8p5hspf
15 0% 0% -8% 0% -69% 23%
NE-HVAC-airHP-Pkg-lt55kBtuh-16p0seer-8p5hspf
29 0% 0% -11% 0% -66% 24%
NE-HVAC-airHP-Pkg-lt55kBtuh-17p0seer-9p0hspf
1 0% 0% 8% 0% -82% 26%
NE-HVAC-airHP-Split-lt55kBtuh-16p0seer-9p0hspf
6 0% 0% 102% 0% -161% 41%
NE-HVAC-airAC-Pkg-55to65kBtuh-15p0seer 10 0% 0% -19% 0% -30% 51%
NE-HVAC-airAC-Pkg-lt55kBtuh-15p0seer 26 0% 0% -21% 0% -20% 59%
NE-HVAC-airAC-Split-55to65kBtuh-15p0seer 1 0% 0% -33% 0% -6% 61%
NE-HVAC-airAC-Split-lt45kBtuh-15p0seer 11 0% 0% -37% 0% 0% 63%
NE-HVAC-airHP-Split-lt55kBtuh-15p0seer-8p7hspf
14 0% 0% 16% 0% -39% 77%
NE-HVAC-airAC-SpltPkg-65to135kBtuh-12p5eer-wPreEcono
10 0% 0% -1% 0% -20% 79%
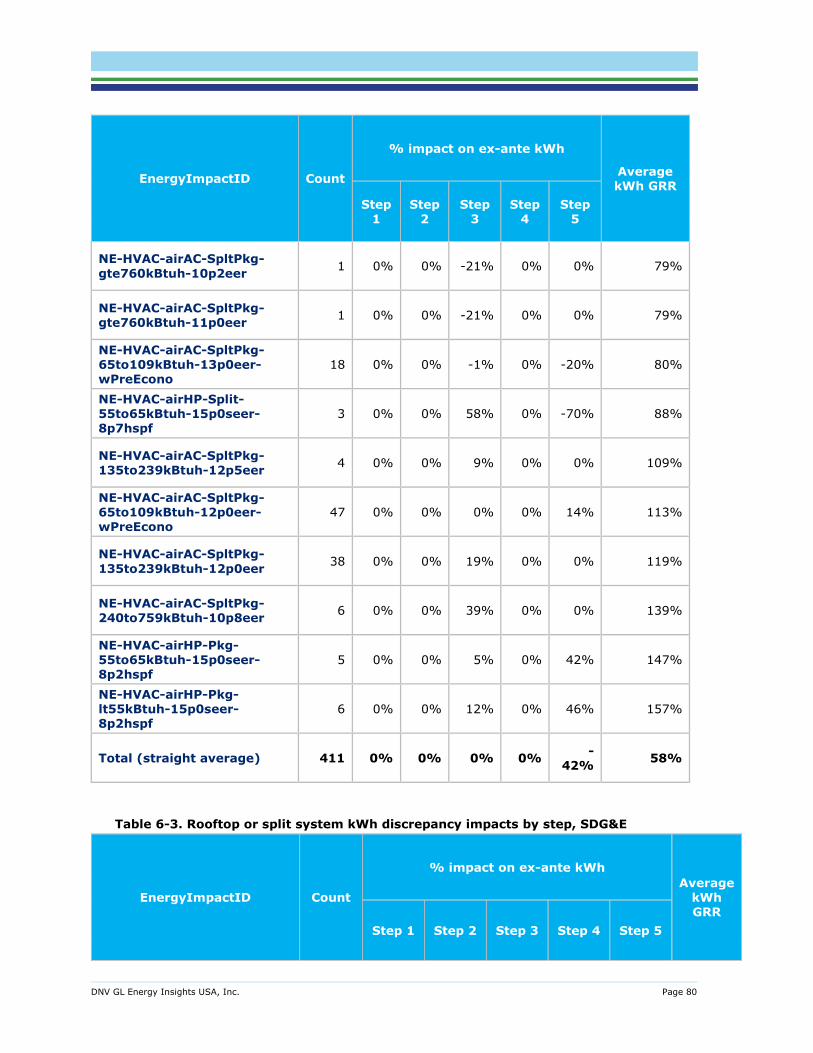
DNV GL Energy Insights USA, Inc. Page 80
EnergyImpactID Count
% impact on ex-ante kWh
Average kWh GRR
Step 1
Step 2
Step 3
Step 4
Step 5
NE-HVAC-airAC-SpltPkg-gte760kBtuh-10p2eer 1 0% 0% -21% 0% 0% 79%
NE-HVAC-airAC-SpltPkg-gte760kBtuh-11p0eer 1 0% 0% -21% 0% 0% 79%
NE-HVAC-airAC-SpltPkg-65to109kBtuh-13p0eer-wPreEcono
18 0% 0% -1% 0% -20% 80%
NE-HVAC-airHP-Split-55to65kBtuh-15p0seer-8p7hspf
3 0% 0% 58% 0% -70% 88%
NE-HVAC-airAC-SpltPkg-135to239kBtuh-12p5eer 4 0% 0% 9% 0% 0% 109%
NE-HVAC-airAC-SpltPkg-65to109kBtuh-12p0eer-wPreEcono
47 0% 0% 0% 0% 14% 113%
NE-HVAC-airAC-SpltPkg-135to239kBtuh-12p0eer 38 0% 0% 19% 0% 0% 119%
NE-HVAC-airAC-SpltPkg-240to759kBtuh-10p8eer 6 0% 0% 39% 0% 0% 139%
NE-HVAC-airHP-Pkg-55to65kBtuh-15p0seer-8p2hspf
5 0% 0% 5% 0% 42% 147%
NE-HVAC-airHP-Pkg-lt55kBtuh-15p0seer-8p2hspf
6 0% 0% 12% 0% 46% 157%
Total (straight average) 411 0% 0% 0% 0% -42% 58%
Table 6-3. Rooftop or split system kWh discrepancy impacts by step, SDG&E
EnergyImpactID Count
% impact on ex-ante kWh Average
kWh GRR
Step 1 Step 2 Step 3 Step 4 Step 5
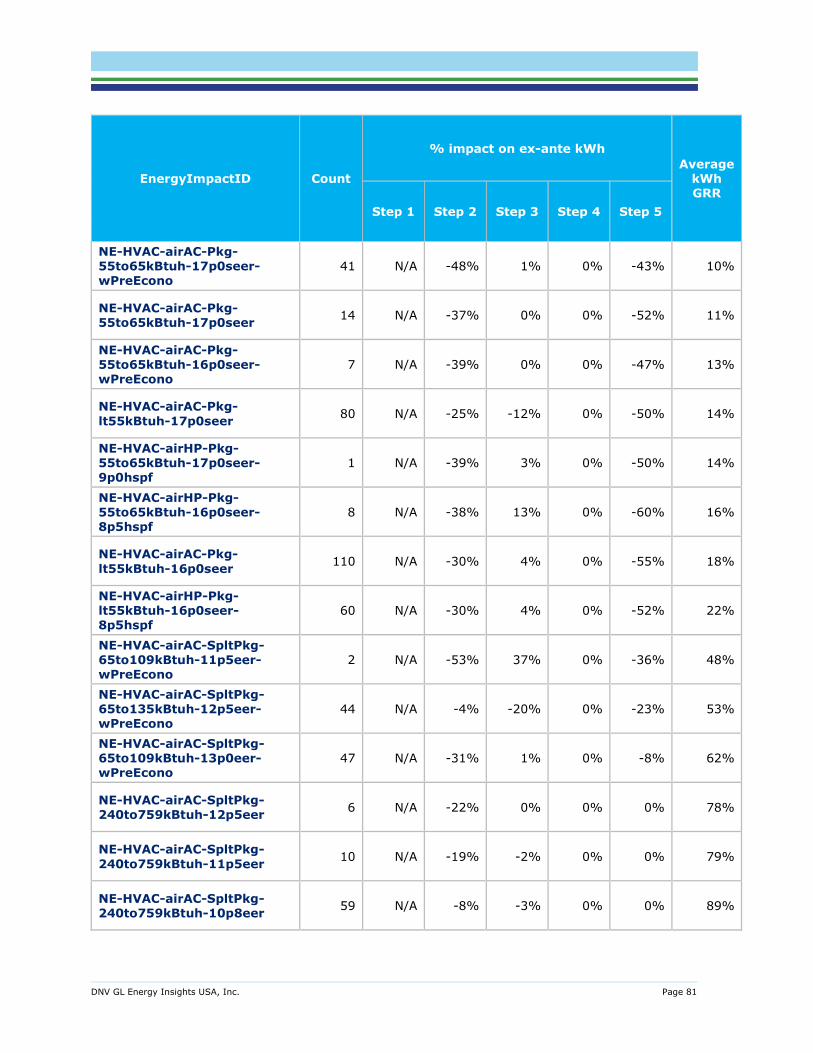
DNV GL Energy Insights USA, Inc. Page 81
EnergyImpactID Count
% impact on ex-ante kWh Average
kWh GRR
Step 1 Step 2 Step 3 Step 4 Step 5
NE-HVAC-airAC-Pkg-55to65kBtuh-17p0seer-wPreEcono
41 N/A -48% 1% 0% -43% 10%
NE-HVAC-airAC-Pkg-55to65kBtuh-17p0seer 14 N/A -37% 0% 0% -52% 11%
NE-HVAC-airAC-Pkg-55to65kBtuh-16p0seer-wPreEcono
7 N/A -39% 0% 0% -47% 13%
NE-HVAC-airAC-Pkg-lt55kBtuh-17p0seer 80 N/A -25% -12% 0% -50% 14%
NE-HVAC-airHP-Pkg-55to65kBtuh-17p0seer-9p0hspf
1 N/A -39% 3% 0% -50% 14%
NE-HVAC-airHP-Pkg-55to65kBtuh-16p0seer-8p5hspf
8 N/A -38% 13% 0% -60% 16%
NE-HVAC-airAC-Pkg-lt55kBtuh-16p0seer 110 N/A -30% 4% 0% -55% 18%
NE-HVAC-airHP-Pkg-lt55kBtuh-16p0seer-8p5hspf
60 N/A -30% 4% 0% -52% 22%
NE-HVAC-airAC-SpltPkg-65to109kBtuh-11p5eer-wPreEcono
2 N/A -53% 37% 0% -36% 48%
NE-HVAC-airAC-SpltPkg-65to135kBtuh-12p5eer-wPreEcono
44 N/A -4% -20% 0% -23% 53%
NE-HVAC-airAC-SpltPkg-65to109kBtuh-13p0eer-wPreEcono
47 N/A -31% 1% 0% -8% 62%
NE-HVAC-airAC-SpltPkg-240to759kBtuh-12p5eer 6 N/A -22% 0% 0% 0% 78%
NE-HVAC-airAC-SpltPkg-240to759kBtuh-11p5eer 10 N/A -19% -2% 0% 0% 79%
NE-HVAC-airAC-SpltPkg-240to759kBtuh-10p8eer 59 N/A -8% -3% 0% 0% 89%
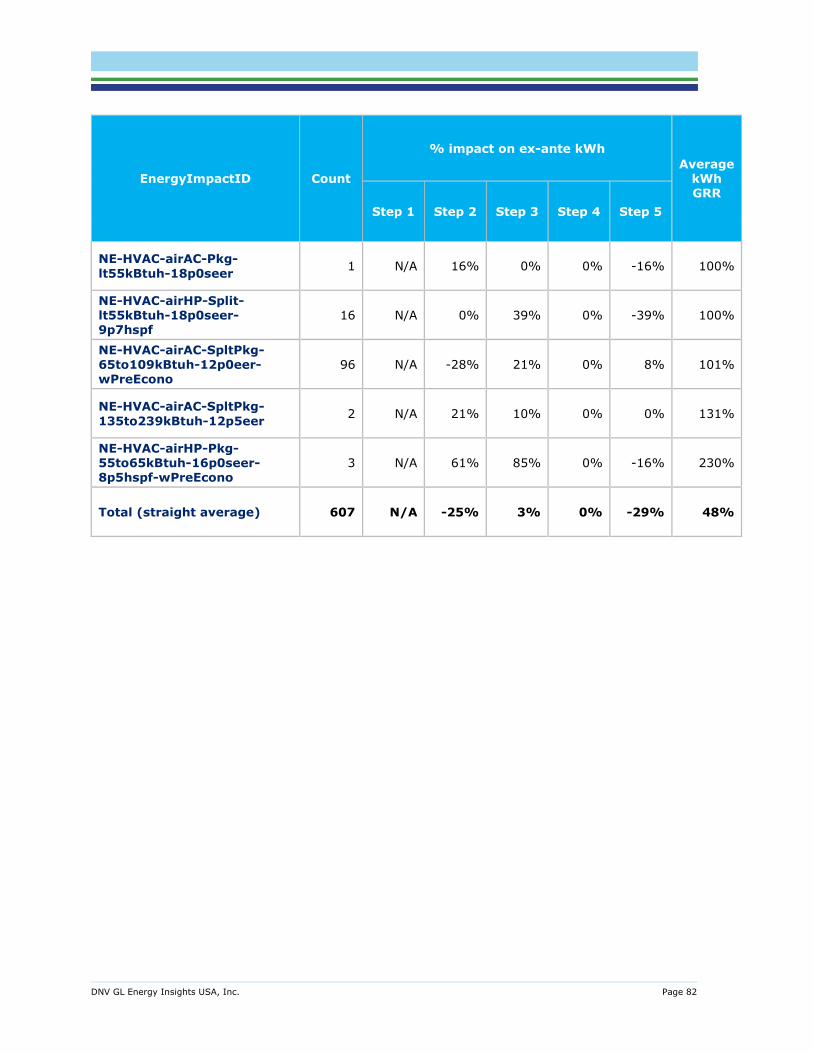
DNV GL Energy Insights USA, Inc. Page 82
EnergyImpactID Count
% impact on ex-ante kWh Average
kWh GRR
Step 1 Step 2 Step 3 Step 4 Step 5
NE-HVAC-airAC-Pkg-lt55kBtuh-18p0seer 1 N/A 16% 0% 0% -16% 100%
NE-HVAC-airHP-Split-lt55kBtuh-18p0seer-9p7hspf
16 N/A 0% 39% 0% -39% 100%
NE-HVAC-airAC-SpltPkg-65to109kBtuh-12p0eer-wPreEcono
96 N/A -28% 21% 0% 8% 101%
NE-HVAC-airAC-SpltPkg-135to239kBtuh-12p5eer 2 N/A 21% 10% 0% 0% 131%
NE-HVAC-airHP-Pkg-55to65kBtuh-16p0seer-8p5hspf-wPreEcono
3 N/A 61% 85% 0% -16% 230%
Total (straight average) 607 N/A -25% 3% 0% -29% 48%

Workplan for Program Year 2019
HVAC Roadmap
CALIFORNIA PUBLIC UTILITIES COMMISSION
EM&V Group A
July 9, 2020
DNV GL - ENERGY
SAFER, SMARTER, GREENER

California Public Utilities Commission HVAC Roadmap Workplan
Page i
Table of Contents
1 OVERVIEW ................................................................................................................... 1
Programs and measures ..................................................................................... 1
2 COMMON WORKPLAN DELIVERABLES .............................................................................. 7
HVAC deliverable 1: Workplan and updates ........................................................... 7
HVAC deliverable 2: Progress reports and updates ................................................. 7
HVAC deliverable 3: Kickoff meetings ................................................................... 7
HVAC deliverable 4: Monthly progress meeting ...................................................... 7
HVAC deliverable 5: Quarterly stakeholder workshops & webinars ........................... 7
HVAC deliverable 6: Annual EM&V Master Plan update—gaps & emerging
issues report ..................................................................................................... 8
3 HVAC-SPECIFIC WORKPLAN DELIVERABLES ..................................................................... 9
HVAC sector deliverable 7. Data collection and sampling approach ........................... 9
HVAC sector deliverable 8: Program analysis & recommendations ........................... 16
HVAC sector deliverable 9: Gross savings estimates .............................................. 16
HVAC sector deliverable 10: Net savings estimates ............................................... 21
HVAC sector deliverable 11: Impact evaluation reports .......................................... 22
4 WORKPLAN SCHEDULE ................................................................................................. 25
5 APPENDIX A - SAMPLE DESIGN AND SELECTION ............................................................. 26
6 APPENDIX B - DATA COLLECTION FRAMEWORK DEVELOPMENT ......................................... 29
7 APPENDIX C - GROSS METHODS .................................................................................... 32
Approach ......................................................................................................... 32
Gross savings methods ...................................................................................... 32
Determining the most appropriate baseline .......................................................... 36
Developing specific gross savings methods and approaches ................................... 37
Scope .............................................................................................................. 37
8 APPENDIX D - TWO-STAGE BILLING ANALYSIS METHODOLOGY ......................................... 39
Stage 1. Individual premise analysis .................................................................. 39
Stage 2. Cross-sectional analysis ....................................................................... 41
Decomposition of whole-home savings ................................................................ 42
9 APPENDIX E - NET-TO-GROSS METHODS ........................................................................ 45
Approach ......................................................................................................... 45
Scope .............................................................................................................. 48
Tasks .............................................................................................................. 49
10 APPENDIX F - WORKPLAN COMMENTS ............................................................................ 55
Table of Exhibits
Figure 1. Example of application to California upstream HVAC program ......................................... 48

California Public Utilities Commission HVAC Roadmap Workplan
Page ii
Table 1. PY2019 evaluated measure groups ................................................................................ 1
Table 2. PY2019 first-year gross savings claims for HVAC ESPI and Non-ESPI measure groups .......... 3
Table 3. Savings of selected commercial HVAC measure groups programs ...................................... 4
Table 4. Savings of selected residential HVAC measure groups programs ........................................ 5
Table 5. Data collection and sampling tasks ................................................................................ 9
Table 6. Estimated population and sample sizes for the PTAC Controls measure groups ................... 11
Table 7. List of residential HVAC measure groups with census approach......................................... 11
Table 8. Summary of data sources and applicable measure groups................................................ 14
Table 9. Residential HVAC measure evaluation groups and periods in PY2019 evaluation ................. 19
Table 10. Summary of the residential HVAC measure savings analysis plan .................................... 20
Table 11. Residential HVAC measure groups NTG evaluation activities ........................................... 22
Table 12. Summary of milestones and deliverables for the PY2019 HVAC workplan ......................... 25
Table 13. Typical frames and stratification variables for different populations sampled ..................... 26
Table 14. Standard survey modules to be developed ................................................................... 30
Table 15. Installation verification (deemed) gross savings strengths, limitations, and applications .... 32
Table 16. Basic rigor gross savings methodologies, strengths, limitations, and applications .............. 33
Table 17. Enhanced rigor gross savings methodologies, strengths, limitations, and applications ........ 34
Table 18. Methods applicable to established baselines ................................................................. 37
Table 19. Primary NTGR methods, limitations, and potential improvements .................................... 46
Table 20. Timing, efficiency, and quantity by measure ................................................................. 49
Table 21. HVAC Roadmap NTG evaluation activities by measure group .......................................... 50
Table 22. Question themes across 3 causal pathways for distributors and buyers ............................ 53
Table 23. Workplan comments .................................................................................................. 55

California Public Utilities Commission HVAC Roadmap Workplan
Page 1
1 OVERVIEW
This workplan describes the heating, ventilation, and air conditioning (HVAC) measure groups that
DNV GL will evaluate for Program Year 2019 (PY2019) and the methods we will use.
Our evaluation activities include:
1. Evaluating the gross and net peak demand (kW), electrical energy (kWh), and gas energy (therm)
savings for selected measure groups through energy consumption analysis of interval data,
targeted input parameter data collection, revision of California Database for Energy Efficiency
Resources (DEER) prototype measure analysis, and in-depth interviews with distributors,
contractors/ installers, and end users.
2. Determining reasons for deviations from expected savings due to different-than-expected measure
potential or implementation effectiveness.
3. Using these results, and the primary data collected to support these efforts, to assist with
updating ex-ante workpapers and the DEER values.
Table 1 lists each measure group, its 2019 Efficiency Savings and Performance Incentive (ESPI) status,
and whether it will receive gross, net, or both treatments.
Table 1. PY2019 evaluated measure groups
Measure Group Sector 2019 ESPI Gross
Savings Evaluation
Net Savings
Evaluation
HVAC PTAC Controls Commercial Yes Yes Yes
HVAC Rooftop/Split System Commercial No Yes No
HVAC Motor Replacement Residential Yes Yes Yes
HVAC Duct Sealing Residential Yes Yes Yes
HVAC Refrigerant Charge Adjustment (RCA)
Residential Yes Yes Yes
HVAC Maintenance Residential Yes Yes Yes
HVAC Controls Time Delay Relay Residential No Yes Yes
HVAC Coil Cleaning Residential No Yes Yes
HVAC Furnace Residential No Yes Yes
Programs and measures
DNV GL consulted the most up-to-date program year (PY2019) tracking data available on California
Energy Data and Reporting System (CEDARS) and the 2019 ESPI uncertain measure list to identify the
research priorities for HVAC sector.
This section describes the programs and measures covered by this evaluation.

California Public Utilities Commission HVAC Roadmap Workplan
Page 2
1.1.1 Savings by measure group
For PY2019 we will evaluate both gross and net saving impacts for five ESPI measure groups and
three non-ESPI measure groups. We will also evaluate only gross savings impacts from one non-ESPI
measure group. The measure groups selected for this evaluation effort were chosen based on several
considerations, primary among them:
▪ ESPI status in PY2019 and, to a lesser extent, in subsequent years
▪ The measure group’s ranked contribution to first year and lifetime savings
▪ Year-over-year trends in savings contributions
▪ Previous evaluation activity and findings
The ESPI measure groups being evaluated for the 2021 Bus Stop, by sector, are:
Commercial sector ESPI
PTAC Controls. These measures involve retrofit add-on controls to package terminal air conditioner
(PTAC) units in lodging guest rooms. The controls turn off or modify setpoints of the guest room PTAC
unit when the room is unoccupied.
Residential sector ESPI
▪ Motor Replacement. These measures involve the replacement of existing permanent split
capacitor (PSC) supply (i.e., furnace, indoor, or air handler unit) fan motors with high-efficiency
brushless fan motors in residential applications that use central air-cooled direct expansion cooling
and/or furnace HVAC equipment.
▪ Duct Sealing. These measures involve testing and sealing residential ductworks to reduce
leakage to specified levels.
▪ Maintenance. This measure group used to be a bundle of individual Quality Maintenance
measures such as coil cleaning and RCA; in recent years it has been streamlined to include only
the initial ACCA 4 assessment and maintenance contracts. The measures that used to be included
are now separate measures with their own savings claims. Many of these separate measures are
part of this evaluation.
▪ Refrigerant Charge Adjustment (RCA). This measure group involves optimizing an HVAC
system’s performance by adding or removing refrigerant from residential HVAC systems to meet
manufacturer recommendations.
The non-ESPI measure groups selected for gross and net savings impacts are as follows.
Commercial sector Non-ESPI
Rooftop or Split Systems. These measures, higher efficiency package rooftop (RTUs) or split HVAC
systems, are delivered primarily through upstream, distributor-focused programs and are generally a
one-to-one replacement of existing HVAC units. This measure group was selected for gross savings
evaluation due to its large contribution to the HVAC portfolio, recent ESPI status, and previous
evaluation findings.

California Public Utilities Commission HVAC Roadmap Workplan
Page 3
Residential sector Non-ESPI
▪ Time Delay Relay Controls. These measures are retrofit add-on devices that delay the
evaporator fan cycle off time to take advantage of the residual liquid refrigerant remaining in the
evaporator after the compressor cycles off, thus increasing the cooling efficiency of the HVAC
system. This measure group was selected for gross and net savings evaluation because it is
commonly claimed by residential-focused HVAC programs with ESPI measure groups.
▪ Coil Cleaning. HVAC system coils, both evaporators (indoor) and condensers (outdoor),
accumulate debris on their surfaces, which reduces their convective heat transfer performance
through fouling. These measures involve HVAC technicians cleaning the coils to remove this
fouling, restoring the performance of the coils. This measure group was also selected for gross and
net savings evaluation due to it commonly being claimed by residential-focused HVAC programs
with ESPI measure groups.
▪ Furnace. These measures, higher efficiency residential furnaces, are delivered primarily through
upstream programs and are aimed at one-to-one replacements of existing furnaces. This measure
group was selected for gross and net savings evaluation because of its significant contribution to
gas energy savings for the HVAC portfolio.
Table 2 shows the HVAC ESPI and non-ESPI measure groups selected for evaluation in PY2019 and
the consolidated remaining measure groups. The table also shows the kW, kWh, and therm savings
claimed in PY2019 based on the available CEDARS data.
Table 2. PY2019 first-year gross savings claims for HVAC ESPI and Non-ESPI measure
groups
ESPI Uncertain
Measure List
Measure Groups kW % kW kWh %
kWh Therms
%
Therms
ESPI
HVAC PTAC Controls 6,280 21% 17,831,593 27% 0 0%
HVAC Motor Replacement 5,872 19% 7,475,795 11% -36,834 -3%
HVAC Refrigerant Charge Adjustment (RCA)
2,386 8% 2,381,667 4% 727 0%
HVAC Duct Sealing 2,964 10% 2,230,496 3% 166,435 14%
HVAC Maintenance 0 0% 0 0% 0 0%
Non-ESPI
HVAC Rooftop/ Split Systems 5,614 19% 10,866,530 17% -51,830 -4%
HVAC Controls Time Delay Relay
3,699 12% 7,455,723 11% 0 0%
HVAC Coil Cleaning 611 2% 615,112 1% -58 0%
HVAC Furnace 0 0% 0 0% 355,146 31%
HVAC measure groups not evaluated
2,793 9% 16,340,202 25% 723,645 63%
Total Deemed HVAC 30,220 100% 65,197,119 100% 1,157,232 100%

California Public Utilities Commission HVAC Roadmap Workplan
Page 4
Note: Savings claims for PY2019 by measure group and program group will be included when final claims data become available in July 2020.
Measures prioritized for evaluation are of significant importance either because they are on the ESPI list (shaded in blue in Table 1) or
because they are significant contributors to HVAC energy efficiency portfolio claims.
1.1.2 Savings by program
Table 3 lists the programs offering the commercial HVAC measure groups being evaluated along with
the measures’ first year and lifecycle savings.
Table 3. Savings of selected commercial HVAC measure groups programs
Program ID, Name Measure Group
First Year Gross kW
First Year Gross kWh
Lifecycle Net kWh
First Year
Gross Therm
Lifecycle
Net Therm
PGE210112, School Energy
Efficiency
HVAC
Rooftop/ Split
Systems
7 66,249 894,362 0 0
PGE210143, Hospitality Program
HVAC PTAC Controls
4,947 14,473,895 47,231,453 0 0
PGE21015, Commercial HVAC
HVAC
Rooftop/ Split Systems
3,116 5,942,247 71,306,964 -32,320 -387,845
PGE2110051, Local Government Energy Action Resources (LGEAR)
HVAC PTAC Controls
99 217,216 809,890 0 0
PGE211007, Association of Monterey Bay Area
Governments
(AMBAG)
HVAC PTAC
Controls 116 293,185 952,851 0 0
PGE211023, Silicon Valley
HVAC PTAC Controls
66 212,107 689,348 0 0
PGE211024, San Francisco
HVAC PTAC Controls
633 1,484,175 4,823,569 0 0
SCE-13-SW-002F, Nonresidential HVAC Program
HVAC
Rooftop/ Split Systems
1,882 3,723,445 46,663,527 -14,733 -188,077
SDGE3224,
SW-COM-Deemed Incentives-HVAC Commercial
HVAC PTAC
Controls 420 1,151,015 3,740,799 0 0
HVAC
Rooftop/ Split Systems
509 1,042,634 13,204,557 -1,619 -21,382
Totals 11,794 28,606,168 190,317,319 -48,673 -597,304

California Public Utilities Commission HVAC Roadmap Workplan
Page 5
Table 4 lists the programs offering the residential HVAC measure groups being evaluated along with
the measures’ first year and lifecycle savings.
Table 4. Savings of selected residential HVAC measure groups programs
Program ID, Name
Measure Group First Year Gross kW
First Year Gross kWh
Lifecycle Net kWh
First Year Gross Therm
Lifecycle Net Therm
BAYREN08,
Single Family
HVAC Duct Sealing 46 35,773 178,151 15,129 75,344
HVAC Furnace 0 0 0 118,946 1,186,589
PGE210011,
Residential Energy Fitness program
HVAC Controls Time Delay Relay
979 1,391,827 4,215,739 0 0
HVAC Motor
Replacement 1,146 1,293,193 2,353,087 -18,858 -34,194
HVAC RCA 523 451,108 1,124,753 -67 -167
HVAC Coil Cleaning 198 174,324 316,657 -24 -44
HVAC Duct Sealing 2 1,370 3,411 260 648
HVAC Maintenance 0 0 0 0 0
PGE21006,
Residential HVAC
HVAC Controls Time
Delay Relay 920 1,575,185 4,725,903 0 0
HVAC RCA 590 641,915 1,598,368 -60 -150
HVAC Motor
Replacement 186 205,740 370,645 -3,217 -5,797
HVAC Coil Cleaning 139 148,999 268,213 -15 -27
PGE21008,
Enhance Time
Delay Relay
HVAC Motor
Replacement 354 635,982 1,196,748 -4,702 -8,847
HVAC RCA 39 72,374 180,879 -17 -43
HVAC Coil Cleaning 24 45,293 82,343 -10 -19
HVAC Controls Time
Delay Relay 2 2,708 8,347 0 0
PGE21009,
Direct Install for Manufactured
and Mobile Homes
HVAC Motor
Replacement 1,336 1,397,449 3,080,241 -10,057 -20,743
HVAC Controls Time Delay Relay
331 417,868 1,538,128 0 0
HVAC Duct Sealing 305 279,230 707,270 24,106 60,666
HVAC RCA 269 265,622 699,545 1 3
HVAC Coil Cleaning 12 11,135 27,239 0 0
HVAC Maintenance 0 0 0 0 0
SCE-13-SW-
001G, Residential Direct Install
Program
HVAC Motor
Replacement 2,214 3,167,562 10,019,829 0 0
HVAC Controls Time
Delay Relay 1,057 2,934,386 9,659,657 0 0
HVAC Duct Sealing 405 314,897 788,806 25,940 65,157
SCE-13-TP-
001, Comprehensive Manufactured Homes
HVAC Controls Time
Delay Relay 410 1,133,751 4,076,630 0 0
HVAC Motor Replacement
637 775,869 2,630,605 0 0
HVAC Duct Sealing 634 441,368 1,136,128 19,346 50,026

California Public Utilities Commission HVAC Roadmap Workplan
Page 6
Program ID, Name
Measure Group First Year Gross kW
First Year Gross kWh
Lifecycle Net kWh
First Year Gross Therm
Lifecycle Net Therm
SCG3702,
RES-Residential Energy Efficiency
Program
HVAC Furnace 0 0 0 23,972 287,662
SCG3706,
RES-
Residential HVAC Upstream
HVAC Furnace 0 0 0 210,823 2,529,880
SCG3765,
RES-
Manufactured
Mobile Home
HVAC Duct Sealing 1,159 841,954 4,192,933 56,300 280,375
SCG3820,
RES-Direct
Install Program
HVAC Duct Sealing 413 315,903 4,719,597 25,353 378,781
SDGE3207,
SW-CALS-MFEER
HVAC RCA 406 320,538 2,660,462 -57 -473
HVAC Coil Cleaning 64 49,781 123,956 -6 -16
SDGE3211,
Local-CALS-
Middle Income Direct Install (MIDI)
HVAC RCA 16 10,588 87,880 -4 -37
HVAC Coil Cleaning 3 1,914 4,766 -1 -2
SDGE3212,
SW-CALS-Residential HVAC-QI/QM
HVAC Maintenance 0 0 0 0 0
SDGE3279,
3P-Res-
Comprehensive Manufactured-Mobile Home
HVAC RCA 470 457,254 3,795,210 -5 -38
HVAC Coil Cleaning 81 74,931 186,579 -1 -3
SDGE3302,
SW-CALS - Residential HVAC Upstream
HVAC Furnace 0 0 0 1,405 16,859
Totals 15,369 19,887,791 66,758,702 484,481 4,861,390
1.1.3 Workplan organization
This workplan is organized into four sections covering the following content:
▪ Section 1 (this section) provides an overview of the workplan.
▪ Section 2 describes the deliverables that are common to all four roadmaps.
▪ Section 3 describes the HVAC-specific evaluation approach.
▪ Section 4 describes the HVAC sector workplan schedule.

California Public Utilities Commission HVAC Roadmap Workplan
Page 7
2 COMMON WORKPLAN DELIVERABLES
HVAC deliverable 1: Workplan and updates
The primary measure groups selected for this evaluation are from the statewide list of ESPI uncertain
measures. This evaluation will build on the methods from the 2010-2012, 2013-2015, and 2017-2018
program year HVAC evaluations. We will meet the 2021 EM&V Bus Stop for program year 2019 by
estimating gross savings by a combination of approaches as appropriate for each measure group.
These include billing and advanced metering infrastructure (AMI) data analysis, remote data
collection/ verification, simulation modeling, and others.
We plan to reconsider the net-to-gross ratio (NTGR) estimation methods for the March 2021 EM&V
Bus Stop. Key considerations are making methodologies more consistent across the various measure
groups, responding to stakeholder comments related to the PY2017 and PY2018 methods, and
diagnostics of the methods used in the PY2017 and PY2018 evaluations where applicable.
We will work with Commission staff to modify the methodology for estimating the NTGR and produce a
memo to Commission staff detailing the approach. DNV GL’s team will execute the methodology after
receiving Commission staff approval. DNV GL’s team expects to continue to use customer and
contractor survey responses as a core source of data for the NTGR estimates.
HVAC deliverable 2: Progress reports and updates
DNV GL’s team will provide monthly progress reports and updates that focus on milestone tracking
and all deliverables within this workplan.
HVAC deliverable 3: Kickoff meetings
DNV GL participated in a kickoff meeting involving key members of our team and Commission staff
during the week of May 8, 2020. The primary objectives of this meeting were to discuss and refine the
draft workplan, to reorient our team to the Commission’s administrative and technical expectations, to
affirm communications protocols, to review objectives and methods, to discuss task and subtask
prioritization, and to address other items.
HVAC deliverable 4: Monthly progress meeting
Key members of DNV GL’s team expect to participate in meetings with Commission staff and other
EM&V contractors on an ad-hoc basis or regular schedule. We also expect to participate in
administrative check-in discussions with Commission staff every two weeks (or per schedules
determined by the Energy Division Project Manager [EDPM]) to report on contract status, budget, and
other relevant matters. We will work closely with our EDPM to identify mutually agreeable dates and
times for these meetings.
HVAC deliverable 5: Quarterly stakeholder workshops &
webinars
Key members of DNV GL’s team will:
▪ Conduct stakeholder workshops or webinars for deliverable milestones and collaborate via monthly
project coordination group (PCG) meetings
▪ Address and document responses to stakeholder comments

California Public Utilities Commission HVAC Roadmap Workplan
Page 8
▪ Develop summaries and presentations for technical documents and other briefing materials in
layman’s terms per Commission staff instructions
▪ Manage all communications and summarize work products for decision-makers and key
stakeholders per Commission staff requests
▪ Summarize data and information from the completed stakeholder engagement activities
DNV GL’s team has committed at least two key team members to participate in all key stakeholder
engagement activities.
HVAC deliverable 6: Annual EM&V Master Plan update—
gaps & emerging issues report
Deliverable 2.6 involves preparation of a Gaps and Emerging Issues Report and providing support to
Commission staff for updating the Annual EM&V Master Plan.
▪ Gaps and Emerging Issues Report. This report has been replaced by a series of memos connected
to Deliverable 8 that will identify and describe major changes, challenges, and emerging issues in
the industry and gaps in the current year’s EM&V activities and methods pertaining to the four
Group A sectors. The purpose is to simplify Commission staff decision-making processes regarding
future EM&V research by clearly identifying outstanding research questions and issues/challenges
that Commission staff may wish to address in the EM&V Master Plan.
▪ The first document will be a memo that covers an analysis of the ABALs. The DNV GL team will
provide a draft to the CPUC by January 23, 2020.
▪ The second document will be a report that consolidates the PY18 impact evaluations. The DNV GL
team will plan to provide a draft of this document by early June (barring any unforeseen
challenges).
▪ The third document will be another memo on a yet-to-be-determined topic with a due date by the
end of 2020.
▪ EM&V Master Plan Update. This subtask also involves assisting Commission staff with the plan
update, as needed

California Public Utilities Commission HVAC Roadmap Workplan
Page 9
3 HVAC-SPECIFIC WORKPLAN DELIVERABLES
This section describes the HVAC sector-specific deliverables (Deliverables 7 and 9-11) for this
evaluation.
HVAC sector deliverable 7. Data collection and sampling
approach
We will design the data collection and sampling work under Deliverable 7 to meet the needs of
Deliverable 1 (Research and Evaluation Workplans), Deliverable 8 (Program Analysis and
Recommendations), Deliverable 9 (Gross Savings Estimates) and Deliverable 10 (Net Savings
Estimates). As part of Deliverable 7, we will develop streamlined data collection strategies to serve the
needs of multiple deliverables at the required rigor levels.
Table 5. summarizes the subtasks to complete Deliverable 7. A more thorough discussion of each
subtask follows the table.
Table 5. Data collection and sampling tasks
Task Description Coordination with Other
Deliverables Key Activities
1 Planning/ Workplan Coordination
1, 8, 9, 10 Determine required data collection activities, sample design parameters, inter-dependencies, and level of coordination.
2 Data Management
and Quality Control 8, 9, 10
▪ Data requests to Program Administrators (PAs).
▪ Secure data access management.
▪ Data transfer to/from Data Management
Contractor.
▪ Conduct cross-deliverable, cross-sector data
collection.
3 Sample Design and Selection
8, 9, 10
▪ Prepare gross and net sample frame(s) according
to study objectives.
▪ Select samples to meet precision requirements.
4 Instrument Design Frameworks
8, 9, 10 Prepare guidance documents and templates.
5 Develop Data Collection
Instruments
8, 9, 10 ▪ Prepare standard modules.
▪ Vet sector/program-specific modules.
6 Training 8, 9, 10
▪ Train DNV GL staff on information protection and
confidentiality procedures, customer contacts,
instrument administration, and data management.
▪ The DNV GL PM and the EDPM will discuss the
scope of field staff training. DNV GL staff will
conduct the training and invite Commission staff.
7 Statistical Estimation
8, 9, 10 ▪ Generate sampling weights.
▪ Calculate sample-based estimates and precision.

California Public Utilities Commission HVAC Roadmap Workplan
Page 10
3.1.1 Subtask 1. Planning and coordination
The HVAC Data Collection and Analysis team will work together with the leads for Deliverables 1, 8, 9,
and 10 to identify what types of data collection are needed from which respondents and existing
sources. We will review our data collection objectives, identify opportunities to consolidate data
collection within and across subsectors, and identify competing objectives and needs. This step
includes:
▪ Review of approved sector metrics
▪ Review of tracking data and the uncertain measure list to determine savings contributions,
uncertainty contributions, and new programs and measures
▪ Determination of study priorities and rigor levels
▪ Review of the types of information needed by each deliverable
▪ Review of the data collection methods needed by each deliverable
3.1.2 Subtask 2. Data management and quality control
As part of this task, the first step in each cycle will be to retrieve the program tracking data and
request consumption data for participants. For planning, we will obtain monthly and annual
consumption data. For consumption data analysis, we will use daily and hourly data. We will also
verify the parameters that contribute to uncertainty against the current uncertain measures list. Any
additional data requirements identified in Subtask 1 will be submitted and integrated into the database
during Subtask
3.1.3 Subtask 3. Sample design and selection
From the nine selected measure groups, only the commercial PTAC/PTHP measure groups will use a
stratified ratio estimation approach for sample design. The remaining measure groups will use a
census approach where the entire program population will be evaluated.
We will sample from program year 2019 claims to meet the March 2021 EM&V Bus Stop. Beginning
with program year 2019 we do have the opportunity for quarterly or semi-annual sampling. We will
work with Commission staff to determine which measures and interventions will implement rolling
samples.
PTAC Controls measures
For the PTAC Controls measure group, DNV GL’s team will design the sample to achieve +/-10%
relative precision for each evaluated measure group at the 90% confidence level. We will stratify the
program population by PAs’ programs and sampling of the participant population will be at the
measure, unit, or site level, depending on the granularity of the data. For this measure groups we will
use an error ratio of 0.6 based on our previous experience with similar studies.
Table 6 shows the PY2019 populations and anticipated sampling sizes for the 2021 Bus Stop. These
figures are preliminary, as we await delivery of the finalized tracking and the opportunity to develop a
stratified sample frame. The finalized populations, claims, and sample sizes will be published in the
sampling and data collection memo.

California Public Utilities Commission HVAC Roadmap Workplan
Page 11
Table 6. Estimated population and sample sizes for the PTAC Controls measure groups
Measure Group PA PY2019
Participant Population
Anticipated Participant Sample Sizes for 2021
Bus Stop
HVAC PTAC Controls PG&E 180 60
SDG&E 20 10
Totals 200 70
Rooftop-Split measures
Rooftop-Split measure group was evaluated as part of the PY-2018 evaluation. In PY-2019 the
evaluation team will perform a discrepancy analysis between ex-post and ex-ante savings on this
measure group and true-up the unit energy savings (UES) values for this measure groups that doesn’t
require sampling.
The remaining HVAC measure groups (residential sector measure groups) will be evaluated using a
billing analysis approach where all sites in the program population will be evaluated. Table 7 shows
the HVAC measure groups that will use census approach for PY2019.
Table 7. List of residential HVAC measure groups with census approach
Measure Group
HVAC Motor Replacement
HVAC Duct Sealing
HVAC Refrigerant Charge Adjustment (RCA)
HVAC Maintenance
HVAC Controls Time Delay Relay
HVAC Coil Cleaning
HVAC Furnace
The detailed methodology of the sample design and section are described in Section 5 Appendix A of
the workplan.
3.1.4 Subtask 4. Data collection framework development
As part of this task the evaluation team will develop a data collection framework to improve
consistency, facilitate comparison of results across data collection efforts, reduce the time for survey
development, minimize review time, and facilitate quality assurance and quality control. The
framework will include:
▪ Guidance and templates for instrument development
▪ Standard question modules for common survey batteries
▪ Recommendations on quality assurance/quality control (QA/QC) procedures
▪ Guidance on data collection management
▪ Guidance on sample management

California Public Utilities Commission HVAC Roadmap Workplan
Page 12
The details guidance of developing data collection framework is described in Section 6 Appendix B of
the workplan.
3.1.5 Subtask 5. Data collection instruments
Where appropriate, we will base data collection on our existing Commission-approved data collection
instruments. We will work with Commission staff and other stakeholders to assess, revise, and
approve these data collection instruments prior to collecting any data.
3.1.5.1 Commercial measure groups
Packaged Terminal Air Conditioner/Heat Pump (PTAC/PTHP) Controls
For the program year 2019 evaluation of PTAC/PTHP Controls measures, we will conduct interviews
with end users (primarily over the phone, supplemented with web-based interviews if required) of
participating facilities using utility-provided contact and equipment information. The phone interview
will include questions to verify measure installation and persistence and to establish the equipment’s
baseline control scheme. The information collected will be used to update installation rates and refine
gross savings estimates for PTAC/PTHP Controls measures.
The phone interview with contacts at participating end user facilities will be the primary mechanism for
data collection to assess gross savings. At the time of this writing, the evaluators assume that on-site
visits will not be feasible for PY2019 data collection, due to the ongoing COVID-19 pandemic. A
sample data collection plan for PTAC control measures will include:
▪ Installation Characteristics: The most critical characteristics evaluators will inquire about
include the facility type, building vintage, and installed unit quantity per site. A list of additional
items to be recorded will be included in the sampling and data collection memo.
▪ Equipment Nameplate: Evaluators will confirm the characteristics of the installed PTAC
controllers as well as the PTAC units being controlled. Evaluators will request the contact to
provide photographs of the equipment and nameplates and/or submit documentation to
objectively verify installation and characteristics.
▪ Operating Characteristics: Evaluators will ask the facility contact about typical room operation
and set-point schedules. Trended operating data will be requested to be shared directly from the
site or through the installation vendor. The evaluator will obtain the heating and cooling
temperature set-point schedules for weekdays, weekends and holidays as well as temperature set-
points for occupied and non-occupied periods. The evaluator will ask for a list of holidays observed
at the facility (if applicable) as well as typical occupancy patterns and any notable changes in
operation from before and after the project took place.
▪ Additional data: These include any documentation confirming measure installation or providing
additional insight into how the units are controlled before and after the project took place.
Rooftop/Split Systems
No onsite data collection is proposed for Rooftop/Split System measure group. The evaluation team
will address the discrepancy between the ex-ante and ex-post savings estimate via simulation and
eventually propose to true up the UES of this measure group based on the simulation results. The
evaluation team will use the best available models considering both DEER updates, the eTRM, and

California Public Utilities Commission HVAC Roadmap Workplan
Page 13
other data sources (including existing EM&V data), to develop robust independent savings impact
estimates.
3.1.5.2 Residential HVAC measure groups
Coil Cleaning, Time Delay Relay Controls, Furnaces, Maintenance, Fan Motor Replacement, &
Duct Sealing
For program year 2019 we will use energy consumption analysis for estimating gross energy savings
for these measure groups. Gross savings estimates will be based on metered consumption data and
will not require data collection forms. See Section 3.3 for a discussion of our methodology for
producing gross savings estimates.
We will complete the gross savings estimates deliverable by January 2021 and incorporate the results
into the evaluation report. We will submit the draft gross savings deliverable to Commission staff prior
to finalization. Subsequent program periods will follow the same schedule for gross savings for the
measures discussed here.
3.1.5.3 Net attribution data collection
We will perform gross and net evaluations for measure groups listed previously in Table 1 in green.
To support our net savings estimates we propose to interview customers, contractors, and HVAC
distributors. Some of the specific efforts under this plan are:
▪ Reviewing secondary sources for market share information pertaining to the upstream program
▪ Conducting market actor interviews (participating distributors, contractors, customers, and end
users) focused on market structure for all units and participant distributor interviews to assess
program influence
▪ Reviewing the program PIP and conduct interviews with program managers to discuss program
theory on influencing alternate equipment types where applicable
▪ Conducting end-user interviews to assess free ridership for the downstream programs
DNV GL’s team has demonstrated effective stakeholder management in previous evaluation cycles by
including a review process for all data collection instruments—not only with the EDPM, but also with
PA program evaluation staff and other stakeholders. This process is particularly beneficial for
evaluations of newer programs or programs where there have been significant changes that
necessitate input from PA staff to refine and improve instruments. We will post data collection
instruments to Basecamp or other CPUC collaboration site.
3.1.5.4 Data sources
Data sources and applicable measure groups are summarized in Table 8 below.
This table shows some of the data sources and data collection activities across the measure groups for
this sector. Data will be used to provide a robust, accurate, and defensible ex-post estimate of
measure impacts. Remote data collection efforts will focus on verifying the simulation model inputs
and short-term monitoring of critical equipment. We provide additional detail below the table.

California Public Utilities Commission HVAC Roadmap Workplan
Page 14
Table 8. Summary of data sources and applicable measure groups
Data Sources Description Applicable Measure
Group(s)
Program
Tracking Data
IOU Program data includes number of records,
savings per record, program type, name, measure groups, measure description, incentives etc.
• PTAC Controls
• Rooftop & Split System • Fan Motor Replacement • Duct Sealing • RCA
• Maintenance • Time Delay Relay • Coil Cleaning • Furnace
Program Monthly Billing Data
PA billing data including kWh and therms
• PTAC Controls • Fan Motor Replacement • Duct Sealing
• RCA • Maintenance • Time Delay Relay • Coil Cleaning • Furnace
Program Advanced Metering Infrastructure
(AMI) Data
Detailed, time-based energy consumption information
• PTAC Controls • Fan Motor Replacement • Duct Sealing
• RCA • Maintenance • Time Delay Relay • Coil Cleaning • Furnace
Project Specific
Information
Project folders include scope of work, energy audit reports, equipment model and serial
numbers, nominal efficiency, test results, project costs, etc.
• PTAC Controls
• Rooftop & Split System
Manufacturer
Data Sheet
Data sheets Include equipment specifications
such as horsepower (HP), efficiency, capacity, etc.
• PTAC Controls
• Rooftop & Split System
Telephone/Web
Surveys
Includes surveys of customers, distributors,
other market actors, and PA program staff.
• PTAC Controls • Fan Motor Replacement • Duct Sealing
• RCA • Maintenance • Time Delay Relay • Coil Cleaning • Furnace
On-site Surveys
Includes verifying measure installation, gathering measure performance parameters
such as efficiency, schedules, setpoints,
building characteristics etc.
• N/A
End-use
metering
Includes performing spot measurements,
short-term metering with data loggers, performance measurements
• N/A
The following list defines the data sources identified above in Table 8:

California Public Utilities Commission HVAC Roadmap Workplan
Page 15
▪ Program tracking data. Each of the Program Administrators (PAs) will provide and upload
program tracking data onto a centralized server. We will then analyze, clean, re-categorize, and
reformat these datasets, if necessary. For programs and measures, the impact evaluation team
will review PA monthly reports and actual program tracking data to reconcile actual versus
reported claims, thereby validating PA tracking data uploads.
▪ Project-specific information. The PAs maintain a paper and/or electronic files for each
application or project in their energy efficiency programs. These can contain various pieces of
information such as email correspondence written by the utility’s customer representatives
documenting various aspects of a given project such as the measure effective useful life (EUL),
incremental cost, measure payback with and without the rebate. As part of the file review process,
we will thoroughly review these documents to assess their reasonableness.
▪ Data sheets from equipment manufacturers. As part of the gross data collection, we will
request technical specifications of the evaluated equipment from manufacturers and equipment
vendors. These data sheets typically include performance parameters of the equipment such as
horsepower, efficiency, capacity, energy efficiency ratio (EER).
▪ Telephone/web surveys of participating customers and distributors. Both gross and net
deliverables will require telephone/web surveys. We will perform surveys with customers,
distributors, other market actors, and PAs.
▪ On-site surveys. Because of the COVID-19 pandemic, DNV GL is not planning any on-site visits
during this evaluation period.
▪ End-use metering. Because of the COVID-19 pandemic, DNV GL is not planning end-use
metering during this evaluation period.
3.1.6 Subtask 6. Training
DNV GL will conduct several kinds of training.
▪ For data collection staff for each study, we will conduct training on customer contact procedures to
ensure professionalism in all interactions. We will review the purpose of each study and provide
training on each question. For data collection to be completed by staff who might not be familiar
with energy efficiency topics, the training includes high level explanations of these topics, and we
provide “cheat sheets” for those interviewers to reference during calls. For example, in the past,
we have found that subcontracted computer-aided telephone survey operators do not necessarily
understand the differences between an LED lamp, CFL, and incandescent lamp. Our cheat sheets
provide pictures of these different types of lamp to help the operators describe the differences to
respondents who might also be confused. We will correct any inconsistencies or confusing points
identified during the training.
▪ For DNV GL team staff who are designing data collection instruments or using the results, we will
train on:
− Data formats required
− Quality control processes
− Data security procedures
− High-level sampling, weighting, and estimation methods

California Public Utilities Commission HVAC Roadmap Workplan
Page 16
3.1.7 Subtask 7. Weighting and estimation
After data collection is completed, DNV GL’s team will develop revised sampling weights to be used to
expand the sample results to the population. The sampling weights will reflect the sample stratification
and population counts and completed sample counts. The sampling weights may also incorporate
sample and population characteristics not used for explicit stratification. This approach allows us to
adjust more accurately for nonresponse, without requiring a deeply stratified sample.
As described above, response rates to all types of customer collection have been declining, and even
with the best practice methods there is the potential for the responding sample to be systematically
different from the overall population of interest. DNV GL’s sample expansion procedures incorporate
advanced non-response adjustment methods into our weighting and calibration. These methods allow
us to make maximal use of available population characteristics to produce tailored case expansion
weights for each respondent, resulting in substantial bias reduction for the final population estimates.
We will calculate the sample case weight as the product of three factors:
▪ The inverse of the probability of selection into the targeted sample
▪ The nonresponse adjustment, accounting for the selected units that did not respond
▪ Post-stratification adjustment, calibrating the full sample to known population totals not included
in stratification.
This approach is far more effective at mitigating nonresponse bias than relying only on the selection
probability (factor 1), or on a combination of selection probability and post-stratification to control
totals (factor 3).
Analysis under other deliverables will use the collected data to determine values such as gross and net
savings for each sampled unit. Using the sample expansion weights and the design, work under
Deliverable 7 will develop estimates of the targeted population parameters, along with 90%
confidence intervals. For example, if verified gross savings is determined for each sampled customer
under Deliverable 9, and net savings for each customer under Deliverable 10, the overall realization
rate, NTGR, and confidence intervals for these will then be determined under Deliverable 7.
HVAC sector deliverable 8: Program analysis &
recommendations
DNV GL’s team will conduct analyses across programs to produce recommendations regarding
potential program improvements related to costs, innovation, participation, and/or operational
efficiencies. To generate these results, we will conduct original program-tailored analyses and leverage
ongoing impact evaluation efforts. Specifically, we will review budgets and program implementation
plans, coordinate with existing impact data collection efforts or field targeted surveys, and possibly
analyze customer application and project approval processes or business plan metrics. Subsequent
communications will provide further detail regarding the inputs to and outcomes from this process.
These efforts will culminate in a May 2021 memorandum that addresses the Deliverable 8 objectives
HVAC sector deliverable 9: Gross savings estimates
The gross savings deliverable will be completed by January 2021 for the evaluation period and
incorporated into the final evaluation report and other deliverables. The draft gross savings deliverable

California Public Utilities Commission HVAC Roadmap Workplan
Page 17
will be submitted to Commission staff for review prior to finalization. Subsequent program periods will
follow the same schedule for gross savings for the programs discussed here.
Below we review the subtasks associated with the gross savings estimates task for the HVAC sector.
3.3.1 Non-residential HVAC gross savings estimates
DNV GL’s HVAC team will calculate gross savings as energy savings and peak demand reduction by
using a combination of basic and enhanced rigors for the selected program year 2019 measure groups.
From the two selected measure groups, PTAC controls measure groups will use enhanced rigor to
estimate gross savings whereas the rooftop/split measure group will be evaluated utilizing basic rigor.
3.3.1.1 PTAC Controls Measure Group
The PTAC Controls measure group was included in the 2019 ESPI uncertain list and contributed over
19% of the total HVAC portfolio first year electric energy savings. For the program year 2019
evaluation, the evaluation team will use an enhanced rigor approach to evaluate the savings of this
measure group. The following section describes the aspects of determining gross savings estimates
that are specific to this measure group.
Unique analysis methods
Due to the COVID-19 pandemic, on-site data collection may not be feasible or allowed. Therefore, our
data collection activities will consist of remote verification of measure installation and key parameters,
as well as interviews to quantify basic program attribution.
We will conduct in-depth phone/web-based interviews with the site contact to verify the installation,
collect equipment specific nameplate information (e.g., make, model numbers, capacity, and
cooling/heating efficiencies) from the affected PTAC/PTHP units, assess the baseline operation, and
obtain details about pre- and post- installation occupancy rates, equipment run times and temperature
set-point schedules of the guest rooms. We will also request data logged by on-site guest room
energy management systems (GREMS) from the vendor and facility contact, if necessary.
The PG&E and SDG&E workpapers specify retrofit add-on (REA) as the event type. This will be the
default presumed basis for each measure. The workpapers document that for this REA event type, the
pre-existing HVAC units have no controls installed to modify the operation of the unit (compressor
runtime or fan speed) based on space occupancy or temperature set-points. The evaluation team will
verify that the site-specific pre-existing conditions are consistent with this approach before use.
Developing the baseline model: We will utilize the collected data to adjust critical measure-specific
operational input parameters in the baseline eQUEST DEER prototype models. The appropriate DEER
prototype model based on building type, building vintage, and climate zone will be selected for each
project for this exercise. A baseline model will be constructed that represents how the guest room
energy systems were operated in the pre-installation scenario, including HVAC, lighting, and
appliances. We will also use pre-installation monthly and AMI billing data obtained for the facility to
verify seasonality and daily occupancy/usage patterns of guest rooms estimated by the baseline
eQUEST models.
Developing the as-built model: Once an appropriate baseline model is developed for each project, we
will develop a similar site-specific as-built model in eQUEST by modifying independent variables such
as post-installation equipment set-point schedules and occupancy rates gathered from data collection
and requested EMS logs. Finally, we will use the post-installation (and pre-COVID-19 pandemic)

California Public Utilities Commission HVAC Roadmap Workplan
Page 18
monthly and AMI billing data obtained for the facility to verify seasonality and daily occupancy/usage
patterns of guest rooms estimated by the as-built eQUEST models.
These two models will form the basis of evaluating the savings for this measure. For each project in
the sample, the adjusted baseline and as-built models will be simulated to produce ex-post unit
energy savings (UES) estimates to be multiplied with the number of units installed (for PG&E projects)
or capacity of PTAC/PTHP units affected by the measure (in tons, for SDG&E projects) to estimate the
ex-post energy savings at the project level.
We will complete the gross savings deliverable by January 2021 and incorporate results into the final
evaluation report and other deliverables to meet the March 2021 bus stop. We will submit the draft
gross savings deliverable to Commission staff for their review prior to finalization.
3.3.1.2 Rooftop and Split Systems
For PY2019 we will use basic rigor to evaluate the savings of the Rooftop/Split System measure group.
We will thoroughly investigate the derivation of UES and origin of tracking data estimates to ensure
savings for these measures is accurately assessed. We will look at savings that was reported and
claimed as well as approved ex-ante values and our best estimates for ex-post savings estimates. We
will use on-site data previously collected under the PY2018 evaluation, and further supporting data
such as from the workpaper archive, DEER updates, and the eTRM to develop ex-post UES values by
adjusting critical DEER eQUEST model input parameters. The adjusted models will be simulated to
produce ex-post savings estimates for each climate zone building type and unit type combination.
3.3.2 Residential HVAC gross savings estimates
3.3.2.1 Coil Cleaning, Time Delay Relay Controls, Furnaces, Maintenance, Fan
Motor Replacement, & Duct Sealing
For PY2019, we will use energy consumption analysis and simulation modeling to estimate savings of
the residential HVAC measure groups. Our analysis will use 12 months of pre- and post-installation
kWh and therms data for the analysis. These energy use data will be weather normalized so that pre-
and post-installation normalized annual consumption (NAC) is analyzed to estimate savings for these
measures. We will use eQUEST simulation modeling of the DEER residential prototypes to generate
measure savings estimates that will inform the disaggregation of meter-level savings to measure
group savings.
The NAC basic rigor method as described in the 2006 California Energy Efficiency Evaluation Protocols
(California Protocols) does not specify the use of a comparison group for aggregate program analysis.
We will use the recommended normalized metered energy consumption (NMEC) methods with a
comparison group to control for underlying trends when conducting consumption analysis. As a result,
our consumption analysis approaches will be high rigor.
3.3.2.1.1 Applicable protocol
Applicable protocols, for the proposed HVAC residential measures evaluation, are described in the UMP
Chapter 8 Whole-Building Retrofit with Consumption Data Analysis Evaluation Protocol.1 The protocols
1 Agnew, K.; Goldberg, M. (2017). Chapter 8: Whole-Building Retrofit with Consumption Data Analysis Evaluation
Protocol, The Uniform Methods Project: Methods for Determining Energy Efficiency Savings for Specific Measures. Golden, CO; National Renewable Energy Laboratory. NREL/SR-7A40-68564. http://www.nrel.gov/docs/fy17osti/68564.pdf

California Public Utilities Commission HVAC Roadmap Workplan
Page 19
provide guidance on quasi-experimental designs including two-stage methods and pooled fixed-effects
modeling approaches. Furthermore, the site-level modeling part of the proposed approach will be
consistent with CalTrack methods that have been prescribed for pay-for-performance programs. These
approaches are also consistent with California Protocol Enhanced rigor.
3.3.2.1.2 Impact methodologies
As shown earlier in Table 4, HVAC measures for residential use were offered by 16 different residential
energy efficiency programs across five PAs in PY2018 and PY2019. These programs delivered the
measures they offered using different delivery channels (e.g., rebates/incentives, direct install, and
upstream distributor incentives). However, the non-smart thermostat HVAC residential measures,
such as fan motor replacements and coil cleaning, were primarily delivered through direct install and
upstream distributor incentives.
The disruptions to residential routines precipitated by the outbreak of COVID-19 are going to result in
a structural break in energy use in 2020, which is the post period for households that installed
residential HVAC measures in PY2019. The primary focus of DNV GL’s PY2019 evaluation will thus be
on estimating HVAC measure savings among homes that installed these measures in PY2018 through
direct install programs.
The PY2019 evaluation (which will be based on installations of 2018 HVAC measures) will provide a
complete picture of residential HVAC measure savings per household available in different housing
types and program delivery channels. In this case, first year post periods cover 2018 and 2019.
Energy use from this period is unaffected by COVID-19 disruptions. DNV GL will extend the analysis of
residential HVAC measure savings by examining changes in a second-year post period, which covers
2020. DNV GL’s PY2019 evaluation will thus involve two different post periods.
Table 9 summarizes the groups and time periods DNV GL’s PY2019 residential HVAC measures
evaluation will involve.
Table 9. Residential HVAC measure evaluation groups and periods in PY2019 evaluation
Participant group
Installation period
Comparison Group Post period I Post period II
Multifamily
Direct Install 2018
Future (PY2019) participants, matched comparison group
2019 2020
Manufactured
Direct Install 2018
Future (PY2019) participants, matched comparison group
2019 2020
All Residential
Direct Install 2018
Future (PY2019)
participants, matched comparison group
2019 2020
Upstream Furnace
2018 Future (PY2019)
participants, matched comparison group
2019 2020
We will conduct a consumption data analysis to provide gross savings per unit separately for single
family, multifamily, and manufactured homes, and by climate zone to the extent available in the data.
We will combine PA data in the same climate zone in order to produce a single and consistent savings
per household estimate for the climate zone. We will extrapolate from these results to any climate

California Public Utilities Commission HVAC Roadmap Workplan
Page 20
zone not robustly estimated directly in the consumption analysis, using methods similar to those that
have been applied in the ex-ante process.
We will thoroughly review and assess tracking data to choose the homes that will be included in the
residential HVAC measures evaluation.
A summary of our savings analysis plan is presented in Table 10, below.
Table 10. Summary of the residential HVAC measure savings analysis plan
Workplan Component Included in the Analysis Output
Consumption data analysis using data from
direct install programs
Customers participating in PY2018 direct install programs
that deliver multiple measures
Gross savings per household for direct install participants by climate
zone, in 2018/2019 and 2020 post periods
Gross savings extrapolation
Gross impacts for all PY2019 participants are estimated by applying results from PY2018 participants (extrapolating unit gross results from 2018
participants to the 2019 participants) to avoid interference from COVID-19 disruptions
Gross savings per residential HVAC measure by climate zone, in 2018/2019 and 2020 post periods
Surveys with customers ▪ Samples of customers from
each PY2019 program offering residential HVAC measures
▪ Samples of matched non-participants used as
comparators
▪ Verified installations PY2019
▪ NTGR by program PY2019
▪ Prevalence of residential HVAC
measures among the comparison groups
▪ Changes in household that impact energy use for all customers included in the billing analysis
3.3.2.1.3 Comparison groups
DNV GL is conducting billing analysis using data from PY2018 participants on the assumption that
gross savings per household is the same for both PY2018 and PY2019 participants within the same
dwelling type, climate zone and program delivery. As indicated earlier, this decision is motivated by
the disruptions in energy use precipitated by COVID-19 in 2020 (the post period for PY2019
participants) that is expected to make pre- to post-period energy use comparisons and analysis of
program measure savings inappropriate.
The billing analysis is based on a quasi-experimental design that uses energy consumption data from
PY2018 participants and matched comparison non-participants. We plan to use two different
comparison groups. First, DNV GL will use future (PY2019) participants as comparison groups as they
are expected to be similar to current participants along dimensions that drive such households to self-
select into participating in programs offering residential HVAC measures. Even in the case of direct
install programs, where the decision to participate may be made by property managers rather than
occupants, current and future participants are likely to be the same along other unobservable
characteristics that affect the use of these measures.

California Public Utilities Commission HVAC Roadmap Workplan
Page 21
DNV GL will also construct matched comparison groups from general population customers for the
two-stage consumption data analysis. This effort will involve matching algorithms that use
consumption data within strata defined by characteristics such as fuel type and geography. The
matching will also take trends in energy use into consideration.
3.3.2.1.4 eQUEST modeling to inform disaggregation of household-level savings
We will develop estimates of residential measure impacts installed at the same time by the programs
using DEER prototypes in eQUEST. These estimates will inform statistically adjusted engineering (SAE)
models, which will be used to disaggregate savings per household to the measure level, as described
in Section 8.3 in Appendix D. The residential DEER prototype models will be adjusted using the best
data available from workpapers, past evaluation studies and previous evaluation findings. We will
develop impact estimates, by building type and climate zone, for the 6 residential HVAC measures
under evaluation in PY2019 and we may also model additional commonly installed measures if we
observe their frequency and impacts are non-trivial. Applying eQUEST simulation results will provide
more realistic inputs to SAE models, which enables these models to separate the effects of different
measures more accurately.
3.3.2.1.5 Load shapes
DNV GL will also estimate hourly load and savings shapes for residential HVAC measures. Such
estimates will provide an understanding of when demand savings (in kW) occur from the program.
Savings load shape will identify the average hourly and 8,760 hourly load savings and, thus, the
periods during which program savings occur.
DNV GL will use customer-level regressions and difference-in-difference models to estimate savings
load shapes for the program. Details on the approach are provided in Section 7 Appendix C.
The findings have the potential to inform program improvement and the extent to which program
energy savings can be used as a resource. Since the data requirement will be substantial, DNV GL will
conduct the study using data for a sample of households from each program offering residential HVAC
measures. These samples will be a subset of the sites used in the consumption data analysis and will
be selected to be representative of all usage quartiles and climate regions.
3.3.2.1.6 Effective Useful Life (EUL)/Remaining Useful Life (RUL)
The residential HVAC evaluation will use the ex-ante claimed EUL/RUL values for the evaluated
measures. We will coordinate with the cross-cutting ex-ante and EUL deliverable teams to determine
whether EUL/RUL update studies will be conducted in 2020.
We will complete the gross savings deliverable by January 2021 in the first evaluation period and will
incorporate results into the final evaluation report and other deliverables. We will submit the draft
gross savings deliverable to Commission staff prior to finalization.
HVAC sector deliverable 10: Net savings estimates
The net savings estimates for the PY2019 HVAC measure groups will be completed by January 2021.
The draft net savings results will be delivered to the Commission staff prior to finalization.
Commercial PTAC Controls measure group: the PTAC controls measure group will receive standard
rigor treatment. This measure group delivered to the commercial customers via PA’s direct install
delivery mechanism and discussion with the program staff of this measure group revealed the primary

California Public Utilities Commission HVAC Roadmap Workplan
Page 22
influencer to be the end-user. Therefore, our team will conduct end-user surveys to assess program
effects on key decision makers based on the program design.
Residential HVAC Measure Groups: Across the five PAs, residential HVAC measure groups offered to
the end-users either via direct install or through downstream programs. Hence, for these measure
groups, we will conduct a combination of market actor (with installation contractors) and end-user
surveys. We will combine the NTG estimates for these different market streams to assess the program
effect on the market actors, the market actor effects on the end-users, and the product of those two
causal pathways. Table 11 shows the residential HVAC measure groups selected for NTG evaluation
along with their evaluation activities.
Table 11. Residential HVAC measure groups NTG evaluation activities
Measure Group Activities
HVAC Motor Replacement
Web-based surveys with end-users and phone-based surveys with property managers, where applicable
HVAC Duct Sealing
HVAC Refrigerant Charge Adjustment (RCA)
HVAC Maintenance
HVAC Controls Time Delay Relay
HVAC Coil Cleaning
HVAC Furnace Phone-based interviews with participating equipment distributors
The details of our net-to-gross methodology are in Section 9 Appendix E of the workplan.
HVAC sector deliverable 11: Impact evaluation reports
In this section, we detail our approach to completing the impact evaluation reports. The primary
objective of this deliverable is to provide high quality, clearly written impact evaluation reports, which
include findings for the uncertain measures list each year for the HVAC sector by the deadlines the
Commission sets forth. Note that HVAC sector will produce two stand-alone impact reports: One
report will cover commercial PTAC Controls and the Rooftop/Split System measure groups and the
other report will comprise all HVAC measure groups installed in residential structures.
To achieve the primary objective, we will:
▪ Conduct a staged review process with key reporting deliverables spread out weeks apart to allow
for feedback and revisions from Commission staff, key stakeholders, and the public
▪ Start reporting as early as possible in the evaluation cycle to stay on schedule and maintain high
quality in all reporting deliverables
▪ Craft clearly written methodologies sections for each report, including sample design, data
collection, analysis, and any other methodologies required for each study
▪ Report study results that thoroughly address each of the research questions set forth in the final
research plans
▪ Write concise and clearly written executive summaries so that study results are accessible to non-
technical audiences and are available for public consumption

California Public Utilities Commission HVAC Roadmap Workplan
Page 23
▪ Produce informative graphics to allow readers to quickly and easily interpret results and key
findings
To successfully complete the impact evaluation reports, we propose a set of reporting deliverables that
allow for review and feedback from Commission staff, stakeholders, and the public. The key reporting
deliverables include the following:
▪ Draft and final outlines for the impact evaluation reports
▪ Draft impact evaluation reports due to Commission staff
▪ Draft impact evaluation reports due to stakeholders and the public
▪ Stakeholder presentations/workshops
▪ Final impact evaluation reports
The outlines, draft reports, stakeholder presentations, and final reports impact evaluation reports are
due at distinct stages in the reporting process to allow for adequate time for Commission and
stakeholder feedback and revisions. We provide further details on the reporting deliverables timeline
in the Schedule and Deliverables section.
3.5.1 Report layout and content
Each impact evaluation report will include, at minimum, the following sections:
▪ Executive summary
▪ Study approach and methodology
▪ Data sources: document data sources used in report
▪ Study results
▪ Conclusions and recommendations
▪ Appendices
The reports will thoroughly address each of the objectives defined in the final research plan for each
study. The overall report will follow overarching style guidelines in the CPUC’s most recent
Correspondence and Reference Guide.
Executive summaries will be accessible to non-technical audiences. Language in the executive
summary will be clear, concise, and easily understandable and will be approximately 10% of the
length of the report it describes. DNV GL’s internal reviewers will include staff not involved with the
study who will provide guidance and editing support on the readability of the executive summary and
other sections of the report. We will also ensure that each executive summary follows Guide to Writing
an Effective Executive Summary, Navy and Marine Corps Public Health Center (updated June 2017).
Key stylistic elements we will apply in the executive summaries include:
▪ Using clear language and minimizing the use of technical words or industry jargon
▪ Keeping sentences short and to the point
▪ Avoiding overly complex sentences with multiple ideas

California Public Utilities Commission HVAC Roadmap Workplan
Page 24
▪ Avoiding or minimizing the use of acronyms and clearly defining any acronyms used
▪ Keeping the executive summary to 10 pages or less
For methodology sections, we will describe our study approach as simply as possible and ensure that
the description of our methodology is transparent and that our methodology can be replicated by
others. We will document the data sources used for each impact evaluation either in the main body of
the report or as a separate section in the appendices. The main body of each report will also include a
study results section that fully addresses the objectives laid out in the final research plan and end with
conclusions and recommendations. Appendices will include any data collection instruments used for
each impact evaluation and other key information relevant to the evaluation.
Appendices will conform to the guidelines in CPUC’s Energy Division and Program Administrator
Energy Efficiency Evaluation, Measurement and Verification Plan 2018-2020 (Version 9). These
sections will come from Deliverable 8, 9, and 10 respectively and will be compiled into an overall
database for reporting purposes.
3.5.2 Report editing
Devoting adequate time and resources to report editing is critical for producing high-quality final
reports. We will provide the key elements in our editing:
▪ Readability, accessibility, flow, and logic
▪ Grammar and style
▪ Technical and peer review
▪ Graphic design
Readability is essential for the reports to be accessible to non-technical audiences. The executive
summary will be clear, concise, and easily readable for non-technical audiences. A DNV GL
professional copyeditor will review and edit each draft and final report to ensure that Commission staff
and stakeholders can focus their reviews on the content of the reports rather than on grammatical
errors. The copyeditors at DNV GL have at least a decade of experience copyediting prior reports
delivered to the CPUC as well as reports delivered to other large clients. All draft reports will include
peer review from independent technical experts. All reports will also include graphic designs to allow
for data visualization and easier consumption of information.
3.5.3 Report format
DNV GL will electronically transmit an Adobe PDF to the Commission that can be uploaded by
Commission staff to the CPUC website for distribution to the public. This PDF will include the final
graphic design and layout of the evaluation report. The PDF of the report will be in a print-ready
format so that the Commission can submit the file for mass printing.

California Public Utilities Commission HVAC Roadmap Workplan
Page 25
4 WORKPLAN SCHEDULE
Table 12 summarizes the milestones and deliverables for the HVAC sector workplan including all
subsectors.
Table 12. Summary of milestones and deliverables for the PY2019 HVAC workplan
Month/
Year MILESTONE/ DELIVERABLE
2020 2021
January ▪ Data Requests: monthly billing & AMI data
▪ Gross and Net Analysis
▪ Program Assessment
February ▪ PY2019 Draft Impact Evaluation Report
March ▪ PY2019 Final Impact Evaluation Report
April ▪ PY2019 Final Impact Evaluation Report CALMAC Posting
May ▪ PY2019 Evaluation Measure Selection ▪ Program Interviews
June ▪ Data Requests: program documentation (implementation plans, manuals, etc.)
▪ ESPI Savings
▪ Update Workplan
▪ Sample design
▪ Data collection instrument development
July ▪ Sample design
▪ Data collection instrument development
▪ Data Requests: claim documentation (tracking data, project-specific
information)
▪ NTG web-surveys
▪ Remote data collection
August ▪ NTG web & phone Surveys
▪ Remote data collection
September ▪ Data Requests: monthly billing & AMI data
▪ NTG web & phone Surveys
▪ Remote data collection
October ▪ NTG web & phone Surveys
▪ Remote data collection
▪ Gross and Net Analysis
November ▪ NTG web & phone Surveys
▪ Gross and Net Analysis
December ▪ Gross and Net Analysis
▪ Program Assessment

California Public Utilities Commission HVAC Roadmap Workplan
Page 26
5 APPENDIX A - SAMPLE DESIGN AND SELECTION
The sampling process has two overarching steps:
1. Define the population(s) frame. The target population for an evaluation study refers to the group
of entities (usually customers, projects, or measures) about which the study is designed to draw
inferences. This comes from a population database (or databases) listing each unit in the
population and providing relevant information for each unit. The population database can often be
extracted from program tracking systems, utility billing systems, or secondary data sources.
Secondary information may be appended to the population database and leveraged for sample
design or enhanced analysis. The project team will look for innovative opportunities to design,
coordinate and collect information serving multiple objectives to improve the overall efficiency of
the sampling and data collection effort.
2. Define and analyze the sampling frame. The sampling frame is the list from which the sampled
units will be selected. This may be the same as the population frame or may be a subset of the
population frame. Table 13 indicates the primary sampling frames we will use.
Table 13. Typical frames and stratification variables for different populations sampled
Population/
Respondent Type Frame Stratification Variables
Participating customers Program tracking
data
IOU, climate zone (CZ), participation date, measure
types, savings magnitude, CARE participation, dwelling unit type, neighborhood socio-demographics, consumption characteristics
Nonparticipating customers
Billing data records
IOU, CZ, participation date, CARE participation,
dwelling unit type, neighborhood socio-demographics, consumption characteristics
Participating retailers
or contractors
Program tracking
data IOU, savings magnitude, number of employees
Nonparticipating retail stores
California retail store databases
IOU, channel
Nonparticipating
contractors Info USA IOU, business type, number of employees
Manufacturers Contact lists from prior studies
Typically not stratified
Participating customers Program tracking
data
IOU, CZ, participation date, measure types, savings
magnitude, CARE participation, dwelling unit type, neighborhood socio-demographics, consumption characteristics

California Public Utilities Commission HVAC Roadmap Workplan
Page 27
The following are the six main steps used to select the final sample:
1. Determine the values to be estimated. For impact evaluation, the key values to estimate are
usually a realization rate and an NTGR. For population characteristics, the key value of interest is
often the average response or the distribution of responses to the survey questions. For program
assessments, the values of interest are often categorical variables (e.g., satisfaction level) that for
the purposes of sampling can be represented as a Bernoulli distribution.
2. Determine the appropriate target precision. Target precision requirements for key variables are
defined by the Protocols and rigor levels assigned. There can be different target precision levels
for different variables, subgroups, or measures. For instance, we might target 90/10 (that is a 10%
relative error with 90% confidence) for the statewide realization rate estimates, but only require
90/15 for each of the individual PA estimates. Likewise, while we might require 90/10 for net
savings, a looser standard may apply for program analysis characteristics.
3. Stratify the population. Stratification offers three main benefits: obtaining results for subgroups of
the population (for instance, we expect to stratify by the three PAs, by sector, and by program),
ensuring that certain subgroups are sufficiently represented in the sample (e.g., strata with large
savings but low participation such as CHP), and increasing the precision of estimates by reducing
the variance in the sample. The last reason usually involves stratifying on a measure of size or
other quantity that is correlated with the quantity we want to estimate. For impact estimation, the
verified savings are correlated with the reported savings. Thus, if we stratify the population based
on reported savings, we can get a more precise total verified savings, realization rate, and NTGR.
Table 13 indicates the key stratification variables we generally plan to use for each type of sample.
While many variables are available for stratification, it is not necessarily important to stratify
explicitly for all of these. Stratifying by too many dimensions can lead to fielding difficulties and
can increase rather than decrease variance. DNV GL’s team uses a combination of statistical
techniques to ensure that the sample is systematically distributed across dimensions of interest,
without applying explicit sampling quotas for all these dimensions.
4. Estimate variances. To design efficient samples and calculate sample sizes, the variance of the
estimate must be available, estimated, or assumed. For estimating population proportions, the
variance is dependent only on the value of the proportion itself. This value is maximized for a
proportion of one half (50%). However, to estimate a quantity or a ratio such as a realization rate,
the required sample size depends on the variance of the quantity being estimated, which can also
be expressed as an error ratio. DNV GL can apply our past California evaluation results to provide
very robust assumptions for error ratios for all the anticipated data collection.
5. Calculate sample sizes. Sample sizes will be calculated based on the variance or error ratio and
depend on the target precision. The error ratio is the ratio-based equivalent of a coefficient of
variation (CV). The CV measures the variability (standard deviation or root-mean-square
difference) of individual evaluated values around their mean value, as a fraction of that mean
value. Similarly, the error ratio measures the variability (root-mean-square difference) of
individual evaluated values from the ratio line, i.e., [Evaluated = (Ratio* Reported)], as a fraction
of the mean evaluated value. Thus, to estimate the precision that can be achieved by the planned
sample sizes, or conversely the sample sizes necessary to achieve a given precision level, it is
necessary to know (or estimate) the error ratio for the sample components.

California Public Utilities Commission HVAC Roadmap Workplan
Page 28
In practice, we cannot determine error ratios until after we collect the data and evaluate savings.
We therefore will base the sample design and projected precision on error ratios estimated from
experience with similar work. A study looking to measure annual or peak consumption would have
a higher estimated error ratio based on past metering studies, somewhere between 0.7 and 1.0
depending on buildings and climates covered. A simple verification study may use an error ratio of
0.5.
We have access to the error ratios of the evaluated results in past studies that we will use to
inform the assumptions made during sampling for any specific program.
Sampling for cases where the primary variable will be a proportion is simpler. In these cases, the
precision depends only on the value of the evaluated proportion. Target sample sizes can be
calculated by assuming the “worst case” example, i.e., a proportion resulting in an estimate of
50%. As a simple example, to estimate a proportion (for instance, the percentage of self-reported
free riders, which we assume to be 50% for the sake of the sample plan) for a large population
with a 5% error, at 90% confidence, the sample size should be 271. If this is the target precision
for each of the three PAs, the sample size for each of the PAs would need to be 271, for a total of
813. If the actual observed proportion is either smaller or greater than 50%, then the achieved
precision will be better or lower than the planned precision.
Most of our samples will be designed to serve multiple objectives. For many purposes, it will be
sufficient to design the samples to meet a single design objective, such as designing for precision
of a proportion, and related objectives will also be satisfied. In other cases, we will need to design
explicitly for multiple objectives. The multiple objectives may be a precision target at more than
one level of aggregation (e.g., 90/10 statewide, 90/20 at the PA level) or precision targets on
more than one variable. DNV GL’s team has existing sampling tools that allow us to jointly
optimize on multiple criteria.
6. Select the sample. We will randomly choose primary sample points from the population in each
stratum, based on the sample sizes calculated in the previous step. We will select a sample large
enough to achieve the targeted number of completed cases, after the response rates are
considered. We also select backup sample at this point in case additional sample points are
needed to reach the target completes.

California Public Utilities Commission HVAC Roadmap Workplan
Page 29
6 APPENDIX B - DATA COLLECTION FRAMEWORK
DEVELOPMENT
DNV GL will develop data collection framework using the following guidance.
Guidance for survey development
Elements of the survey development guidance will include the following:
▪ Survey design template requiring the designer to:
− Specify all survey objectives
− Specify data elements to be collected to meet the survey objectives
− Specify analysis that will meet the objective using the collected data elements
− Flag new data collection/analysis approaches that will require extra
▪ Data format requirements per the Data Management Contractor
▪ Templates for recording in-depth interview (IDI) responses systematically in a spreadsheet
▪ Principles for effective instrument design, including elements such as:
− Framing
− Avoid double barreled questions
− Avoid leading questions
▪ Steps to complete the survey development, including:
− Draft instrument using established modules where applicable
− Identify purpose for each question included: framing, analysis, or consistency check
− Confirm all objectives have been met or identify tradeoffs made
− Confirm DMC format requirements are met
▪ Pre-test procedures
Standard question modules
DNV GL’s team will prepare standard questionnaire modules to be used across surveys collecting the
same types of information. Standard modules will include:
▪ Introductory scripts and contact screening
▪ Demographics/firmographics, designed to align with the California RASS or CEUS, with U.S.
Census questions, and/or with the U.S. DOE’s Residential and Commercial Energy Consumption
Surveys
▪ Standard coding for response categories such as not applicable, don’t know, refused, or skipped
▪ Standardized Likert scales and guidance on how to write the question to avoid priming
respondents to answer toward one end or the other
Additional standard modules will be developed by the analysis Deliverables teams and vetted for
conformance to good survey practices and consistency with the general guidance. Table 14
summarizes the standard modules to be developed.

California Public Utilities Commission HVAC Roadmap Workplan
Page 30
Table 14. Standard survey modules to be developed
Deliverable Title
Standard Modules Developed
Participants Market Actors
7 Data Collection
and Sampling
Introductory scripts
Contact screening
Demographics/firmographics
Introductory scripts
Contact screening
8
Program Analysis
and
Recommendations
Program awareness
Program experience
Motivations/barriers
Program awareness
Program experience
Motivations/barriers
9 Gross Savings Installation verification
Δ Sales levels
Δ Sales practices
Δ High efficiency
recommendations
10 Net Savings
Participant Self-Report
Attribution and Scoring
Algorithm
Program attribution of Δs in
gross savings and algorithm for
combining with participant self-
report
Quality control
Quality control procedures specified in the guidance will include survey design checks and checks
during data collection. Survey design checks include:
▪ Checking data collection elements against the stated objectives: Is every objective satisfied and
does every included element serve a stated objective?
▪ Reviewing questions for conformance to good question design standards.
▪ Pre-testing to confirm programmed wording and skip patterns match approved instrument
For CATI phone surveys, we will conduct a “soft launch” of phone surveys by making calls for one or
two days against a very small initial sample with a goal of completing 10 to 20 calls. Our data
collection specialists will listen to the calls to check on operator delivery of the instrument, respondent
confusion and resistance, and skip patterns. Web surveys will follow a similar soft launch approach
and a data collection specialist inspects the initial responses for skip patterns and signs of confusion.
For IDIs completed over the phone, we will have a check-in meeting with all callers and the project
manager to discuss similar matters that may have come up during the first day or two of calling. If
necessary, we will adjust the data collection instruments based on what we hear in these initial calls.
We will conduct daily monitoring of survey and IDI progress while they are in the field:
▪ Are surveys completed consistently?
▪ Are response frequencies in line with expectations?
▪ Have respondents raised any issues that need to be immediately conveyed to the PAs (e.g., a
safety issue)?
Checks while fielding on-site data collection will include:

California Public Utilities Commission HVAC Roadmap Workplan
Page 31
▪ Weekly checking individual on-site cases filed for completeness and consistency
▪ Continuous feedback among the field staff to share best practices and issues
▪ Review the utility bills compared to expected consumption from the observed equipment
▪ Spot checks of accuracy via phone follow up
Guidance on data collection management
No matter what media is used – email, phone calls, web surveys, or traditional mail – all methods of
contacting customers for surveys introduce some degree of sampling bias. Responses are limited to
customers who are willing to respond to that method of contact. In our experience, maintaining
response rates sufficient to provide statistically robust results is becoming more difficult. We
continuously work to refine our toolbox of data collection modes and approaches to maintain response
rates. Some strategies we use include postal mail advance letters and postcards with Commission
logos, offering incentives for participation, making multiple calls or invitations across several weeks
and at different times of day, identifying refusals and non-answers and make phone calls using very
experienced callers to attempt to convert the refusals.
Guidance on data cleaning
The framework will also provide guidance on data cleaning procedures. These procedures will include:
▪ Checking for missed skip logic
▪ Verifying post-coding of open-ended questions
▪ Checking for impossible values and outliers on numeric answers
▪ Checking specific values that were assigned when interviewers bracketed
▪ Dealing with responses of “don’t know” and refusals to answer
▪ Consistency checks
For consumption data analysis and for hourly AMI data, DNV GL has established protocols and
software for data cleaning prior to analysis. We will use these tools for our analysis.

California Public Utilities Commission HVAC Roadmap Workplan
Page 32
7 APPENDIX C - GROSS METHODS
Approach
This deliverable will provide estimates of the gross load savings impacts (kWh, kW, and therms) at the
measure and program level, consistent with the California Energy Efficiency Protocols. Key elements of
the work include establishing baselines including dual baselines, determining count adjustments and
hours of operation, and providing inputs to ex-ante parameter updates.
The work will deploy the samples and data collection methods developed under Deliverable 7. Our
general approach to gross savings estimation follows the California and DOE UMP protocols.
Gross savings methods
In this section, we review the gross savings methodologies, the options and implications regarding
baselines, and the overall strategy for selecting the appropriate methodology. In the subsequent
section, we present the step-by-step approach for calculating gross savings.
Reviewing the available methods
The California Energy Efficiency Evaluation Protocol lays out minimum required methods at basic and
enhanced rigor.
The tables below summarize the strengths and limitations of verification-only approaches and of
evaluation approaches at different rigor levels.
Table 15 summarizes features of the approach based on verifying installation and passing through
deemed savings.2
Table 16 and Table 17 present strengths and limitations for methods that meet basic and enhanced
rigor standards.
Table 15. Installation verification (deemed) gross savings strengths, limitations, and
applications
Method (Rigor)
Strengths Limitations Proposed
Improvements
Installation
Verification (Deemed)
▪ Low cost
▪ Broad scale
assessment of less-
complex measures
▪ Fast: assurance
toward meeting the
March 2019 Bus
Stop
▪ Only updates
installation rates
▪ Relies on customer
reports
▪ Online and email
methods to further
improve costs and
increase sample size
▪ Collection of
additional data to
inform ex ante
assumptions
2 As stated in the Protocols, “Field-verified measure installation counts applied to deemed savings estimates do not
meet the requirements of this (IPMVP Option A, Basic Rigor) Protocol.”

California Public Utilities Commission HVAC Roadmap Workplan
Page 33
Table 16. Basic rigor gross savings methodologies, strengths, limitations, and applications
Method (Rigor)
Strengths Limitations Proposed
Improvements
Simple Engineering Model Option A (Basic)
▪ Moderate cost
▪ Broad scale
assessment of less-
complex measures
▪ Direct feedback loop
between EM&V and
ex-ante estimates
▪ Fast: assurance
toward meeting the
March 2019 Bus
Stop
▪ Rely on assumptions
such as baseline
characteristics, usage
patterns
▪ Measured parameter
data collection and
re-simulation of
DEER or other
models goes beyond
options available in
2006 protocols
▪ Coordinating with
NTGR methods and
activities, develop
baseline in terms of
alternative
technology adopted
if not the program
measure
▪ Utilize runtime data
from advanced
control measures,
including setting up
periods with and
without the control
system enabled.

California Public Utilities Commission HVAC Roadmap Workplan
Page 34
Method (Rigor)
Strengths Limitations Proposed
Improvements
Normalized Annual Consumption Option C (Basic)
▪ Low cost
▪ Large sample size
▪ Fast
▪ Only applicable when
savings are significant
portion of usage
(signal-to-noise)
▪ While allowed under
California protocols,
requires appropriate
comparison group for
best practice under DOE
UMP, or explicit non-
routine event
identification and
adjustment as IPMVP
Option C
▪ Typically provides
savings relative to
existing conditions,
adjustments required
for savings relative to
replace on failure
baseline
▪ Analysis of daily-
level consumption
rather than monthly
bills provides more
robust options
▪ Potential for hourly-
level options,
explored in 2013 by
DNV GL leading to
2014 and 2015
papers, hourly
measure load shapes
then produced in Res
QM analysis (March
2017 Bus Stop).
▪ Successful methods
to adjust savings to
appropriate baseline
such as the method
in DOE UMP for
Furnaces led by Ken
Agnew.
▪ “M&V Plus” methods
(See next table)
Table 17. Enhanced rigor gross savings methodologies, strengths, limitations, and
applications
Method (Rigor)
Strengths Limitations Proposed
Improvements
Calibrated Simulation Modeling Option D (Enhanced)
▪ Site-specific or
prototype based
▪ Captures savings
from complex,
multiple, and/or
interacting
components under
specific
circumstances of
the installation
▪ High cost
▪ Results often highly
sensitive to small
changes in modeling
assumptions
▪ Detailed data
requirements
▪ Hybrid approaches to
calibrate prototype
simulations;
developing samples
for site data
collection and end
use metering to
develop and input
modification and
calibration of models
to program
population NAC

California Public Utilities Commission HVAC Roadmap Workplan
Page 35
Method (Rigor)
Strengths Limitations Proposed
Improvements
Retrofit
Isolation Option B (Enhanced)
▪ High level of
accuracy for site-
level savings
estimates
▪ Detailed information
on discrepancies
between tracking
system and actual
installations
▪ Provides high-value
inputs to estimates
of deemed savings
estimates & load
shapes
▪ High cost
▪ High customer and
program burden to
coordinate pre- and
post-install
measurement
▪ Must be deployed in
waves; timing inflexible
▪ Only appropriate for
isolatable measures
▪ baseline equipment
characteristics not
observable in post-only
data collection.
▪ Successful
coordination for
HVAC coil cleaning
measures using new
measurement suites
in 2016-2017
▪ Utilize data from
advanced control
measures, including
setting up periods
with and without the
control system
enabled.
Fully Specified
Consumption
Regression for individual premises (Enhanced)
▪ Captures complex,
comprehensive, and
operations/mainten
ance measures
▪ Usually leverages
existing data
streams and does
not require
extensive
measurement,
metering, or on-site
visits
▪ Susceptible to bias and
inaccuracy due to non-
routine events, or
independent variables
not captured in the
regression
▪ Only applicable when
savings are significant
portion of usage
(signal-to-noise)
▪ Difficult to assign
savings results to
specific measures
▪ Directly applicable only
relevant if baseline is
existing conditions
▪ “MV Plus” tools to
screen & adjust for
non-routine events,
identify best
normalization model,
and determine need
for supplemental
information.
▪ Successful methods
to adjust savings to
appropriate baseline
such as the method
in DOE UMP for
Furnaces led by Ken
Agnew

California Public Utilities Commission HVAC Roadmap Workplan
Page 36
Method (Rigor)
Strengths Limitations Proposed
Improvements
Fully Specified Consumption
Regression across premises
(Enhanced)
▪ Moderate, Low cost
▪ Large sample size
▪ May allow isolation
of effects for
different measure
groups and
subgroups
▪ May be applicable
when savings are
not a significant
portion of usage
(signal-to-noise)
▪ UMP Method using
comparison groups
well vetted
▪ Susceptible to bias and
inaccuracy due to
sample attrition or
activities that are not
specified in the
regression
▪ Requires appropriate
comparison group or
data streams of
additional model
variables that may have
unknown uncertainty
▪ Typically provides
savings relative to
existing conditions,
adjustments required
for savings relative to
replace on failure
baseline
▪ “MV Plus” tools to
screen & adjust for
non-routine events,
separate premises
into those where
regression methods
are meaningfully
applied and those
requiring additional
information
▪ Successful methods
to adjust savings to
appropriate baseline
such as the method
in DOE UMP for
Furnaces led by Ken
Agnew
True Program Experimental
Design (Enhanced)
▪ Low cost for
evaluation once set
up
▪ Fast: assurance
toward meeting the
March 2019 Bus
Stop
▪ True experimental
design relies on RCT
during program
implementation
▪ Not applicable to most
full-scale delivery
methods
▪ Does not provide
measure-specific detail
▪ Apply recently
developed methods
that have produced
evaluation of all
California HER
programs with
strong PA buy-in of
results
▪ Supplemental
analysis to translate
non-consumption
parameter changes
based on RCT into
savings estimates.
▪ Oversight process to
assure new RCT
designs are correctly
randomized and
randomization is
followed.
Determining the most appropriate baseline

California Public Utilities Commission HVAC Roadmap Workplan
Page 37
In addition to rigor, the baseline is a key consideration of the gross savings analysis, as it establishes
the floor against which we calculate efficiency savings. In the cases where the CPUC has issued
guidance on assigning specific measures in the Ruling R.13-11-005, the DNV GL team will apply the
prescribed baseline. In cases where the Ruling leaves the baseline up to discretion, the DNV GL team
will advise the use of most appropriate baseline for each evaluated program and or measure. DNV
GL’s team will then vet these decisions through CPUC staff and stakeholders. Table 18 provides an
overview of the methods that can calculate gross savings relative to each baseline.
Table 18. Methods applicable to established baselines
Baseline
Basic Enhanced
Simple
Engineering Model
Option A
Normalized Annual
Consumption
Building Simulation Option D
Retrofit Isolation Option B
Fully Specified
Consumption Regression
True Program Experimental
Design
Existing
condition baseline
X X X X X
Code baseline X X EBA*
Dual
baseline X X EBA X
* EBA: Engineering Baseline Adjustment methods to adjust to code or ISP efficiency
Note that in Table 18 we refer to Engineering Baseline Adjustment methods (EBA). These methods
adjust regression-based savings at relative to existing conditions to savings relative to code, based on
the difference between existing efficiency and code baselines.
Developing specific gross savings methods and
approaches
Under this workplan, we will determine the programs and measures for which we will evaluate gross
savings, the respective evaluation rigor for each (basic or enhanced) and specific gross savings
estimation methods. These plans will be developed in coordination with Deliverables 7, 8, 9, and 10.
Our team planned the PY2019 program impact evaluations to complete all gross savings scope by
December 2020 and will deliver a draft report to the CPUC by March 1, 2021. Our workplans will utilize
CPUC-vetted methodologies, data collection tools, and analyses wherever applicable. Our team will
also continue to vet and pilot new methods, including opportunities that will leverage our experience
with NMEC models, calibrating option D models to AMI data, as well as dig deeper into the increasing
presence of third-party programs. The following section presents the steps that the DNV GL team will
take to complete the gross savings deliverables. Note that billing analyses and true experimental
design methodologies may or may not require that we collect field data to calculate gross savings.
Scope

California Public Utilities Commission HVAC Roadmap Workplan
Page 38
This section outlines the scope of the process and methodologies that we propose to use in this
evaluation. The following subsections describe our approach to completing Deliverable 9.
7.5.1 Subtask 1. Develop samples for data collection
DNV GL’s team will develop survey sample designs under Deliverable 7 based on the planned gross
savings methodology. The approaches for data collection and sampling will be coordinated with
deliverables 1, 8, and 10, and 13.
7.5.2 Subtask 2. Develop survey instruments for data collection
Development of gross savings data collection instruments will follow the framework described in
Deliverable 7.
7.5.3 Subtask 3. Test the approach
See the Deliverable 7 section for our general approach to testing the data collection methodologies.
Specific to the gross savings deliverable, the DNV GL team will leverage existing analytic code to
ensure to check early data returns and verify that data is accurate and complete.
7.5.4 Subtask 4. Collect data
Following each data collection’s pre-test period, projects will run their field efforts in full. They will
communicate with Commission staff and stakeholder groups regarding progress toward sample targets,
and ongoing questions as they arise from the field.
DNV GL will collect primary data through multiple phone, online, and on-site field work efforts as
described in Deliverable 7. Each evaluation team will use these data as needed to calculate the ex-
post gross savings.

California Public Utilities Commission HVAC Roadmap Workplan
Page 39
8 APPENDIX D - TWO-STAGE BILLING ANALYSIS
METHODOLOGY
DNV GL will estimate energy savings from residential HVAC measures using a two-stage approach
detailed below. This approach is from the UMP which served as the primary basis for the CalTRACK
methodology. DNV GL will use daily data for the analysis, which is also consistent with the CalTRACK
consumption data analysis approach. Detailed step-by-step methods to perform the two-stage
approach are described below:
Stage 1. Individual premise analysis
For each premise in the analysis, whether in the participant or comparison group,
▪ Fit a premise-specific degree-day regression model (as described in Step 1, below) separately for
the pre and post periods.
▪ For each period, pre and post, use the coefficients of the fitted model with CZ2018 degree-days to
calculate normalized annual consumption (NAC) for that period (as described in Step 2, below).
▪ Calculate the difference between the premise’s pre- and post-period NAC (as described in Step 3,
below).
The site-level modeling approach was originally developed for the Princeton Scorekeeping Method
(PRISM™) software.3 The theory regarding the underlying structure is discussed at length in materials
for and articles about the software.4
Step 1. Fit the basic stage 1 model
The degree-day regression for each premise and year (pre or post) is modeled as:
𝐸𝑚 = 𝜇 + 𝛽𝐻𝐻𝑚 + 𝛽𝐶 𝐶𝑚 + 𝜀𝑚
where:
𝐸𝑚 = Daily consumption per day m or average consumption per day during interval m;
𝐻𝑚
= Specifically, 𝐻𝑚(𝜏𝐻), average daily heating degree-days at the base temperature
(𝜏𝐻) during meter read interval 𝑚, based on daily or daily average temperatures over
those dates;
𝐶𝑚
= Specifically, 𝐶𝑚(𝜏𝐶), average daily cooling degree-days at the base temperature (𝜏𝐶)
during meter read interval 𝑚, based on daily or daily average temperatures over those
dates;
𝜇 = Average daily baseload consumption estimated by the regression;
𝛽𝐻 , 𝛽𝐶 = Heating and cooling coefficients estimated by the regression;
3 PRISM (Advance Version 1.0) Users’ Guide. Fels, M.F., and k Kissock, M.A. Marean and C. Reynolds. Center for
Energy and Environment Studies, Princeton New Jersey. January 1995.
4 Energy and Buildings: Special Issue devoted to Measuring Energy Savings: The Scorekeeping Approach.
Margaret F. Fels, ed. Volume 9 Numbers 1&2, February/May 1986.

California Public Utilities Commission HVAC Roadmap Workplan
Page 40
𝜀𝑚 = Regression residual.
Step 2. Select individual models fixed versus variable degree-day base
In the simplest form of this model, the degree-day base temperatures (𝜏𝐻) and (𝜏𝐶) are each pre-
specified for the regression. For each site and time period, only one model is estimated, using these
fixed, pre-specified degree-day bases.
The fixed base approach can provide reliable results if the savings estimation uses NAC only, and the
decomposition of usage into heating, cooling, and base components is not of interest. When data used
in the Stage 1 model span all seasons NAC is relatively stable across a range of degree-day bases.
However, the decomposition of consumption into heating, cooling, or base load coefficients is highly
sensitive to the degree-day base.
The alternative is a variable degree-day approach. The variable degree-day approach entails the
following: (1) estimating each site-level regression and time period for a range of heating and cooling
degree-day base combinations, including dropping heating and/or cooling components; and (2)
choosing an optimal model (with the best fit, as measured by the coefficient of determination 𝑅2) from
among all of these models.
The variable degree-day approach fits a model that reflects the specific energy consumption dynamics
of each site. In the variable degree-day approach, for each site and time, the degree-day regression
model is estimated separately for all unique combinations of heating and cooling degree-day bases, 𝛽𝐻
and 𝛽𝐶 , across an appropriate range. This approach includes a specification in which one or both
weather parameters are removed.
Degree-days and fuels
For the modeling of natural gas consumption, it is unnecessary to include a cooling degree-day term.
For the modeling of electricity, a model with heating and cooling terms should be tested, even if the
premise is believed not to have electric heat or air conditioning. Thus, the range of degree-day bases
must be estimated for each of these options:
▪ Electricity Consumption Model
− Heating-Cooling model (HC)
− Cooling Only (CO)
− Heating Only (HO)
− No degree-day terms (mean value)
▪ Gas Consumption Models
− Heating Only (HO)
− No degree-day terms (mean value)

California Public Utilities Commission HVAC Roadmap Workplan
Page 41
Degree-days and set-points
If degree-days can vary, the estimated heating degree-day base 𝜏𝐻 will approximate the highest
average daily outdoor temperature at which the heating system is needed for the day. The estimated
cooling degree-day base 𝜏𝐶 will approximate the lowest average daily outdoor temperature at which
the house cooling system is needed for the day. These base temperatures reflect both average
thermostat set-points and building dynamics such as insulation, internal and solar heat gains, etc. The
average thermostat set-points may include variable behavior related to turning on the air conditioning
or secondary heat sources. If heating or cooling are not present or are of a magnitude that is
indistinguishable amidst the natural variation, then the model without a heating or cooling component
may be the most appropriate model, using the 𝑅2 model selection rule.
For each premise, time, and model specification (HC, HO or CO), the final degree-day bases (values of
𝜏𝐻 and 𝜏𝐶) that give the highest 𝑅2, along with the coefficients 𝜇, 𝛽𝐻 , 𝛽𝐶 estimated at those bases will be
selected. Models with negative parameter estimates should be removed from consideration, although
they rarely survive the optimal model selection process.
Step 3. Calculate NAC using stage 1 models
To calculate NAC for the pre- and post-installation periods for each premise and timeframe, combine
the estimated coefficients 𝜇, 𝛽𝐻 , and 𝛽𝐶 with the annual normal-year or typical meteorological year (TMY)
degree-days 𝐻0 and 𝐶0 that have been calculated at the site-specific degree-day base(s), 𝜏𝐻 and 𝜏𝐶.
Thus, for each pre and post period at each individual site, use the coefficients for that site and period
to calculate NAC.
𝑁𝐴𝐶 = 𝜇 ∗ 365 + 𝛽𝐻 ∗ 𝐻0 + 𝛽𝐶 ∗ 𝐶0
This example puts all premises and periods on an annual and normalized basis. The same approach
can be used to put all premises on a monthly basis and/or on an actual weather basis. Using this
approach to produce consumption on a monthly and actual weather basis is an alternative approach to
calendarization that may be preferable to the simple pro-ration of billing intervals under some
circumstances.
Step 4. Calculate the change in NAC
For each site, the difference between pre- and post-program NAC values (Δ𝑁𝐴𝐶) represents the
change in consumption under normal weather conditions.
Stage 2. Cross-sectional analysis
Difference-in-difference whole house savings model
The first-stage analysis estimates the weather-normalized change in usage for each premise. The
second stage combines these to estimate the aggregate program effect by using a cross-sectional
analysis of the change in consumption relative to premise characteristics based on a difference-in-
difference model.
The difference-in-difference model is given by:
Δ𝑁𝐴𝐶𝑖 = 𝛼 + 𝛽𝑇𝑖 + 𝜀𝑖

California Public Utilities Commission HVAC Roadmap Workplan
Page 42
In this model, 𝑖 subscripts a household and 𝑇 is a treatment indicator that is 1 for residential HVAC
measure households and 0 for comparison homes. The effect of the program is captured by the
coefficient estimate of the term associated with the treatment indicator, 𝛽.
Decomposition of whole-home savings
Engineering models that simulate savings for measures and measure bundles offered by the direct
install programs will form the basis of the decomposition of whole home savings. The engineering
models will be based on DEER residential prototypes adjusted as appropriate from recent evaluation
results. These models will provide estimates of the percent reduction in cooling and heating load from
their respective baselines, for individual measures and for measure bundles offered by direct install
programs. Separate percent savings will be produced by climate zone and housing type.
The estimated reductions will be for measures offered both on a first in (standalone) basis and as part
of a bundle on a last in (incremental/marginal) basis. The following lists the types of relative measure
savings (in percent terms) the engineering simulation models provide that will be used to
disaggregate whole-home estimated savings:
▪ First in (standalone) measure savings.
▪ Bundle savings for the bundles claimed in the PY2019 DI programs, accounting for the majority of
savings (about 80%) across the included programs.
▪ Marginal savings for each measure in a bundle re-scaling the last-in marginal savings so the total
matches the bundle savings.
▪ Marginal savings for each measure in a bundle re-scaling the first-in marginal savings so the total
matches the bundle savings.
Results from engineering simulations are used as inputs in statistically adjusted engineering (SAE)
models to decompose whole-home savings (obtained customer-level DID regression model) to
measure-level savings. Engineering simulation results provide more realistic inputs to SAE models,
which enables these models to separate the effects of different measures more accurately. The
common SAE model is specified as:
Δ𝑁𝐴𝐶𝑖 = 𝛼 + ∑ 𝜌𝐻𝑚𝑆𝐻𝑚𝑖
𝑚
+ ∑ 𝜌𝐶𝑚𝑆𝐶𝑚𝑖
𝑚
+ 𝜀𝑖
where 𝑆𝐻𝑚𝑖 and 𝑆𝐶𝑚𝑖 are engineering or ex-ante estimates of annual heating and cooling savings for
measure 𝑚 and customer 𝑖, and 𝜌𝐻𝑚 and 𝜌𝐶𝑚 are coefficients of the model that measure heating and
cooling saving realization rates.
In this study, the engineering-based savings estimates are developed as fractions of pre-program
annual cooling and heating load, because it’s not practical to develop simulation models for every
customer individually. To produce the energy savings quantities, 𝑆𝐻𝑚 and 𝑆𝐶𝑚, for each customer, it’s
necessary to multiply the simulation-based savings fractions of each measure and load type by the
pre-installation heating and cooling usage estimated from the customer-level DID regression model.
However, if we make that basic substitution in the common SAE model, we would have pre-program
normalized annual heating and cooling included on both sides of the equation—on the left as part of
𝑝𝑟𝑒𝑁𝐴𝐶 and on the right as scalars factors in 𝑆𝐻𝑚 and 𝑆𝐶𝑚. This relationship creates an endogeneity

California Public Utilities Commission HVAC Roadmap Workplan
Page 43
problem, that is, a built-in correlation between the regressors and predictors.5 Endogeneity leads to
biased estimates of the coefficients. We estimate a log SAE model, described below, to circumvent this
endogeneity.
The log SAE model DNV GL intends to use is based on the savings percentages from the simulation
models described above to decompose whole-home, heating and cooling savings into measure savings.
This model differs from common SAE models in two ways:
1. Because the engineering estimates are on a percentage basis, rather than having customer-
specific estimates in energy units, the regression is of the change in log NAC against the
engineering estimates of percent savings.
2. Because the percent savings from the engineering models are most meaningful as percentages of
heating and cooling rather than whole-home load, the dependent variable uses heating or cooling
load with separate log regression models estimated for each. The model for each is given by:
log(𝑃𝑜𝑠𝑡𝑁𝐴𝐶𝑙𝑖) − log(𝑃𝑟𝑒𝑁𝐴𝐶𝑙𝑖) = 𝑙𝑙 − ∑ 𝜌𝑚𝑙𝑓𝑚𝑙𝑖 + 𝜀𝑖𝑚
where:
log (Post𝑁𝐴𝐶𝑙𝑖) = Log of post period NAC for customer 𝑖 and load type 𝑙 (𝑙 = heating or cooling
load)
log (Pre𝑁𝐴𝐶𝑙𝑖) = Log of pre period NAC for customer 𝑖 and load type 𝑙 (𝑙 = heating or cooling
load)
𝑙𝑙 = Non-program related change
𝑓𝑚𝑙𝑖 = The simulation-based savings fractions or percentages for load type 𝑙 (heating
and cooling) of measure 𝑚, for the climate zone and building type and
measure bundle type of customer 𝑖 ; not this term is 0 for non-participant
households used as matches
𝜌𝑚𝑙
= the heating or cooling realization rate for measure
𝜀𝑖 = Regression residual
Total savings for measure 𝑚 and load type 𝑙 is given by:
𝑆𝑚𝑙 = 𝑒𝑥𝑝(𝜌𝑚𝑙
∑ 𝑓𝑚𝑙𝑖
+ 𝑠𝑒2/2) ∗ 𝑃𝑟𝑒𝑁𝐴𝐶𝑙𝑖𝑖
where the summation is over all customers with the measure.6 Unit savings per measure then is this
estimated total saving divided by the number of customers with the measure. This approach will be
applied to direct install programs offering smart thermostats as well as other measures.
5 To see the endogeneity more clearly, we expand the basic SAE model as: 𝑝𝑜𝑠𝑡𝑁𝐴𝐶𝑖 − 𝑝𝑟𝑒𝑁𝐴𝐶𝑖 = 𝑝𝑜𝑠𝑡𝑁𝐴𝐶𝑖 − (𝑝𝑟𝑒𝑁𝐴𝐶𝐵𝑎𝑠𝑒𝑖 + 𝑝𝑟𝑒𝑁𝐴𝐶𝐻𝑖 + 𝑝𝑟𝑒𝑁𝐴𝐶𝐶𝑖)
= 𝜆 + ∑ 𝜌𝐻𝑚𝑓𝐻𝑚𝑝𝑟𝑒𝑁𝐴𝐶𝐻𝑖𝑚
+ ∑ 𝜌𝐶𝑚𝑓𝐶𝑚𝑝𝑟𝑒𝑁𝐴𝐶𝐶𝑖𝑚
+ 𝜀𝑖
Here 𝑁𝐴𝐶𝐵𝐴𝑆𝐸 is normalized annual baseload; 𝑁𝐴𝐶𝐻 is normalized annual heating load; 𝑁𝐴𝐶𝐶 is normalized annual
cooling load; and 𝑓𝐻𝑚 and 𝑓𝐶𝑚 are simulation-based savings fractions for heating and cooling for measure m. Here
we see the components 𝑁𝐴𝐶𝐻 and 𝑁𝐴𝐶𝐶 on both sides of the equation.
6 Since the model used to estimate load savings is in log terms, it requires exponentiation to go from log scale back
to the original (energy) units. This back transformation requires the use of a bias correction factor 𝑠𝑒2 2⁄ , where 𝑠𝑒 is the standard error of the regression.

California Public Utilities Commission HVAC Roadmap Workplan
Page 44
Some of the details remaining to be resolved include:
▪ If we have engineering estimates of fractional savings 𝑓𝑚𝑙 based both on a first-in assumption and
on a last-in assumption, we will review how different these are after re-scaling. We may use only
one, only the other, or a blend.
▪ It’s difficult to estimate separate realization rates for different measures or measure groups,
particularly if some of the estimated savings are small. We may group some measures together in
the SAE model to produce a common realization rate that will be applied to the engineering
estimates from each.

California Public Utilities Commission HVAC Roadmap Workplan
Page 45
9 APPENDIX E - NET-TO-GROSS METHODS
Approach
DNV GL’s team’s general approach to NTGR estimation follows the California and UMP protocols. Our
general NTGR estimate principles include the following:
▪ Maintain a flexible approach – Different programs require different methods. We choose the
methods best suited to the program design (e.g., include upstream market actor interviews when
vendor influence important), needed rigor, available data sources, and the population of potential
respondents. This approach requires us to:
− Review program design and logic to understand how the program is intended to alter customer
choices
− Understand the market including program market effects, natural market evolution, and
external influences such as regulations
− Understand who can provide what data
− Integrate with Deliverables 1, 7, and 9
▪ Draw on an array of methods that includes market and customer perspectives and experimental
design.
− Leverage and build on the data collection instruments that we’ve developed for California in
previous evaluation cycle
− Continue to develop and validate the other net savings approaches to provide an expanded
toolbox when self-report methods are not as applicable (e.g., in upstream designs).
▪ Transparency and defensibility in methods – There is no single “right” way to estimate NTGRs for a
particular context. DNV GL’s team strives to make our methods transparent and provide clear
rationale for our choices. This includes:
− Identifying the methods’ limits and risks up front
− Testing and validating methods
− Building quality control and “sanity” checks into analyses
▪ Utilize multiple methods and build a “preponderance of evidence” – We triangulate the results
from multiple methods when enhanced rigor is required. This includes combining supply-side and
demand-side perspectives when possible.
▪ Provide segmented results (at least by measure within program). This level of detail allows NTG
research to inform program design and evolution, and also supports development of measure-level
ex-ante NTGR.
Self-report surveys have been a major component of previous NTG methods for California HVAC
programs. Our plan for the PY2019 evaluation is to reuse data collection instruments we have used in
past evaluations. We will review and make minor modifications to these instruments as well as add
additional questions to be used to test our proposed new approaches. The net savings calculations will

California Public Utilities Commission HVAC Roadmap Workplan
Page 46
follow the original methods from the prior evaluation. In early 2020, we will analyze the results of the
test questions to inform decisions about the changes to make for instruments that will be fielded in
2020 and 2021. Instrument (re)design in 2020 began in May, and training and fielding began in July.
Table 19 lists the primary methods we propose to implement for the HVAC programs along with
limitations and how we propose improving on the methods. By themselves, each of the methods listed
is a standard rigor method, except for (non-enhanced) participant self-report surveys, which is basic
rigor.
Table 19. Primary NTGR methods, limitations, and potential improvements
Candidate Method
(Rigor)
Limitations Proposed Improvements
Participant Self-report (basic)
▪ Long, complex surveys
▪ Low response rates
▪ Not as useful for upstream
or behavioral programs
▪ Use specific rather than general prompts of
alternative efficiency levels
▪ Adjust partial free-ridership wording to ask
their most likely alternative and the influence
of the program on moving from that to actual
situation
▪ Test alternative scoring algorithms that make
different assumptions about intermediate
efficiency levels
Enhanced
Participant Self-report (standard)
▪ Same as participant self-
report
▪ Expense
▪ Same as participant self-report
▪ Conduct cognitive interviews to assess
consumer and vendor ability to provide
standard practice baselines
Market
Actor Surveys (standard)
▪ Response bias (including
gaming the system)
▪ Reluctance to provide
“proprietary information” like
detailed sales
▪ Leverage RASS to determine absolute size of
market
▪ Specify explicit scoring algorithm
Participant self-reports and enhanced self-reports ask about program awareness and the
decision-making process to get participants thinking about that time, then ask how much the program
affected the timing, efficiency, and quantity of the installed measure(s). Another way we develop self-
report surveys to develop net savings estimates is through discrete choice methods, where customers
express their product characteristic preferences, including price. By combining the program’s effect on
prices and customers’ price preferences, these methods can calculate the likely market outcomes if
rebates did not exist. For programs designed to influence contractor sales practices, these surveys
also include questions on contractor influence. Key limitations of these methods include long, complex
surveys with questions that participants may find difficult to understand, increasing difficulty obtaining

California Public Utilities Commission HVAC Roadmap Workplan
Page 47
viable response rates, and limited applicability to upstream program designs. DNV GL’s team will
improve on these methods:
▪ Expand upon our work on the 2016 HUP impact evaluation survey by designing modular
questionnaire batteries to utilize a consistent theoretical and computational approach to self-report
methods across surveys and program while customizing batteries to specific programs and
measures. In particular, these instruments will allow us to ask about timing, quantity, and
efficiency levels only when they are relevant.
▪ Based on our recent Massachusetts work about how well participants interpret prompts about
efficiency levels, use precise language (e.g., 12-13 SEER, 14-15 SEER, 16+ SEER) rather than
general language (e.g., code, intermediate efficiency, high efficiency) when asking about
intermediate efficiency levels.
▪ Expand on our Massachusetts work of adapting NTG methods when industry standard practice
(ISP) baselines are relevant. In particular, we will conduct additional tests on how different self-
report approaches interact with gross savings that are based on market-level and participant-level
ISP baselines.
Market actor surveys ask upstream (manufacturers, distributors, architects and design firms) and
midstream market actors (retailers and installation contractors) how the program affects the
availability, pricing, and sales approaches of high efficiency products on the market. A specific variety
of market actor survey is the shelf survey, which produces data about how retail stores stock and
organize the products on their shelves and how those practices affect the market. Our standard
approaches include:
▪ Blending in the results from questionnaires targeting downstream market actors when program
designs affect both
▪ Providing explicit scoring flowcharts for market actor surveys detailing how we will combine scores
when we have both market actor and participant surveys (e.g., Upstream HVAC, see Figure 1 for
example) and asking market actors to provide information in terms of percentage changes
▪ Leverage the RASS data to determine objective sales volumes.
Key challenges this method faces include reluctance to provide “proprietary” information such as
objective sales volume, as well as the potential for “gaming the system” by answering survey
questions in a way that inflates program attribution. Improvements include:
▪ Refine survey wording based on critical review and QA activities applied to previous iterations
deployed in California (e.g., Upstream HVAC) and other jurisdictions to make sure that
respondents can answer questions as intended

California Public Utilities Commission HVAC Roadmap Workplan
Page 48
Figure 1. Example of application to California upstream HVAC program
Scope
The steps for net savings methods based on primary data collection from customers and market actors
to be used for the HVAC programs include the following:
▪ Sample selection - see Deliverable 7 for approaches.
▪ Instrument Design and Testing – We will follow the data collection framework as described in
Deliverable 7 for general procedures. DNV GL’s team’s proposed enhancements to survey methods
specifically for net savings analysis are described in more detail below.
▪ Survey fielding and data collection will follow the general procedures described in Deliverable 7.
▪ Data cleaning steps specific to net savings sequences are described below.
▪ Calculate net savings ratios as described below.
▪ Summarize results, describe implications, and make recommendations

California Public Utilities Commission HVAC Roadmap Workplan
Page 49
Tasks
9.3.1 Task 1: Survey development
Overview: DNV GL will ask downstream rebate recipients how the program affected the timing,
efficiency, and quantity of the installed measures. These surveys will also include a battery to capture
spillover. For programs designed to include mid-/upstream market actors, we will also conduct
surveys with those market actors to explore how the program affected their sales practices.
Detailed Description: DNV GL’s team’s standard approach to self-report surveys is to use questions
that explore how rebates and program services affected the timing, efficiency, and quantity of
installed measures:
▪ In the absence of the services offered by the program, would you have installed the measure at
the same time, earlier, or later?
▪ In the absence of the services offered by the program, would you have installed equipment of the
same efficiency, lesser efficiency, or greater efficiency?
▪ In the absence of the services offered by the program, would you have installed the same quantity
of (or size) equipment, lesser, or more?
Existing instruments that DNV GL’s team has deployed in California modified these standard
sequences to collect the data applicable to each measure. These program attribution dimensions are
not always applicable for all measures. For example, some measures, such as air sealing, do not have
variable levels of efficiency – a customer either does them or doesn’t. DNV GL developed the existing
2016 HUP impact evaluation survey and the 2013-2014 VSD pool pump evaluations using these sorts
of customizations. We will expand upon this work to create modular, measure-specific batteries that
can be used across any program that incentivizes that measure. Table 20 provides an initial
assignment of timing, efficiency, and quantity sequences to each measure group within the HVAC
roadmap.
Table 20. Timing, efficiency, and quantity by measure
Roadmap Measure Group Timing Efficiency Quantity
HVAC PTAC Controls ● ●
HVAC Coil Cleaning ● ●
HVAC Time Delay Relay Controls ● ●
HVAC Duct Sealing ● ●
HVAC Fan Motor Replacement ● ●
HVAC Maintenance ● ●
HVAC Furnace ● ● ●

California Public Utilities Commission HVAC Roadmap Workplan
Page 50
We have recently completed work in Massachusetts exploring specific wording options for alternative
efficiency levels. We have found that respondents can make more sense out of specific efficiency
levels, rather than more generalized wording. In particular, participants provided more believable
responses to questions that asked them which specific alternative efficiency levels they would have
installed if not the program-sponsored efficiency level. For example, for lighting, the program-specific
efficiency level was LED, and the alternatives were high-performance T8, T5, standard T8, and HID
(as opposed to general wording of “the efficiency you installed”, “standard or code minimum”, “or
something in between”). Boiler wording specified efficiency levels of 80-84% efficiency, 85-90%, and
90-95% (program efficiency levels were 95% or better). Using specific wording such as this aligns well
with measure-specific question batteries. However, determining the specific efficiency levels for every
measure can be costly. Thus, DNV GL recommends using the measure-specific efficiency levels for
measures requiring high rigor and retain the general wording for standard rigor measures.
In past years, when participant surveys indicated that participating trade allies had an effect on their
equipment decisions, we conducted follow-up interviews with those trade allies to determine the
extent to which the program affected their recommendations. We will continue to conduct mid-
/upstream market actor interviews for programs that are designed to reach these actors. Those
programs include the quality maintenance program and the upstream program. The quality
maintenance questions focus on how often the contractor offers program eligible maintenance now,
compared to how often they offered them prior to participating in the program. The upstream market
actor surveys focus on changes to the actors’ stocking, upselling, and pricing practices due to the
program.
9.3.1.1 NTG methods by measure group
In summary, we intend to conduct the following NTG evaluation activities by measure group.
▪ The PTAC controls measure group will receive standard rigor treatment consisting of enhanced
phone surveys with end-user decision makers
▪ The direct install residential HVAC measure groups (Coil Cleaning, Time Delay Relay Controls, Duct
Sealing, Fan Motor Replacement, & Maintenance) will receive basic rigor treatment. These
measure groups will receive end-user surveys to assess program effects on the key decision
makers based on program designs.
▪ The Furnace measure group will receive a standard rigor NTG evaluation. For this measure group,
we will conduct market actor interviews with the program participating equipment distributors.
Table 21. HVAC Roadmap NTG evaluation activities by measure group
Measure Group Rigor Level Activities
HVAC PTAC Controls Standard Enhanced Participant Self-report phone surveys
HVAC Coil Cleaning Basic Participant Self-report web and phone surveys
HVAC Time Delay Relay Controls Basic Participant Self-report web and phone surveys
HVAC Duct Sealing Basic Participant Self-report web and phone surveys

California Public Utilities Commission HVAC Roadmap Workplan
Page 51
Measure Group Rigor Level Activities
HVAC Fan Motor Replacement Basic Participant Self-report web and phone surveys
HVAC Maintenance Basic Participant Self-report web and phone surveys
HVAC Furnace Standard Enhanced Participant Self-report phone surveys
9.3.2 Task 2. Test the approach
Our basic QA/QC procedures include reviewing completed instruments to confirm skip logic, readability,
reliability, internal validity, external validity, clarity, length, and flow. DNV GL’s team will provide draft
data collection instruments to Commission staff (and, as directed, to stakeholders) for review and
incorporate all feedback into a final version. We will not proceed with data collection until Commission
staff approve the final instruments. We also conduct “soft launches” as described in Deliverable 7.
During analysis, we will conduct sensitivity analyses. At a minimum, these include identification of
statistical outliers that have extreme influence on the final results. Where there is indication that
participants may have difficulty answering partial free ridership questions (such as that they would
have installed measures of “intermediate” efficiency levels) we will test the effects of different scoring
algorithms, such as how much difference it makes to final free ridership scores if efficiency levels are
considered completely binary rather than allowing for partial free ridership.
9.3.3 Task 3. Survey fielding and data collection
The data collection will be conducted following procedures described under Deliverable 7, including
guidelines that will be developed under that deliverable for fieldwork management.
9.3.4 Task 4. Data cleaning
In a survey, there are two types of questions that can generate verbatim responses: open ended
questions and those that include an “other” response to catch responses that are not included in a
pre-coded set of responses. Questions that include pre-codes and an “other” response will go through
two rounds or stages of coding. The first round is for what is called ‘back-coding’. Back-coding is to
see if the verbatim responses were not true “other” responses, but miscoded answers. For example, if
there is a pre-code for “Electronics Store” and the other response for a respondent is “Best Buy” that
needs to be back-coded into the “Electronics Store” category. Once the back-coding has been done,
then the post-coding can occur. Post-coding is the process of looking at provided responses (for either
open-ended or “other” responses), clustering the responses to create new response categories, and
assigning a code to these.
We provide additional detail on our approach for a standard participant self-report survey. In our
method, each of the components of attribution: Timing, Efficiency, and Quantity, has a question
sequence that follows the same pattern:
Xa. What would you have done without the program?
Xa_O. Why do you say that?
Xb. <If Xa=program effect> How different would the project have been?

California Public Utilities Commission HVAC Roadmap Workplan
Page 52
Quality control for each component of attribution consists of comparing the final component attribution
score (t, e, q) to the open-ended response for the “Xa_O. Why do you say that?” question.
Interviewers are trained to probe if the response to the open-ended question is inconsistent with the
scored response to Xa.
During the analysis phase, the analyst will put measures into 3 bins: full attribution, partial attribution
and full free rider for each component. The analyst works a bin at a time to compare each verbatim
open-ended response to the score for the attribution component. Assessing verbatim responses by bin
reduces analyst error and speeds the review. If an open-ended response appears inconsistent with the
score received, the case is elevated to subject matter expert (SME) review.
The attribution score calculated via the timing, efficiency, and quantity questions is also check against
the following for consistency. Inconsistent scores are referred to SME review.
▪ The answer to a closed-ended overall attribution question
▪ The answer to an open-ended summary of the program’s influence question
▪ Answers to questions about timing of program awareness relative to the project timing
Analysts are instructed to have a low bar (“when in doubt flag for review”). SME review consists of
reviewing the entire survey, including all responses to all measures when the survey covers multiple
measures. If the SME determines that the flagged score (whether of a component or overall) is not
clearly contradicted by the overall story told by the respondent throughout the interview, the SME
makes no change. If the flagged score is clearly contradicted (approximately 1% of cases in DNV GL’s
experience), the SME decides among 3 options:
▪ Drop the measure from the sample (for very muddled responses, much more common with
computer-aided telephone interviews [CATI] than IDI)
▪ Replace the inconsistent response with a “Don’t Know” (effectively using the average if there
should be some attribution for the component, but unclear how much)
▪ Adjust the flagged score to more accurately reflect the intent of the respondent (employed in
cases where there is overwhelming evidence of intent, for instance the open-ended response says
clearly what the score should be)
9.3.5 Task 5. Score surveys
When we use surveys or IDIs as the basis for determining NTGR, developing the scoring or analysis
method algorithm is done as part of the survey design. This process will lay out how we will score
each response to each question, and how those scores will be combined to generate the free ridership
score (or another metric).
Following is a description of the scoring algorithm for a timing-quantity-efficiency self-report approach,
including a diagram or flowchart when it will make the explanation easier to understand.
Our basic self-report scoring algorithm follows: Each free ridership dimension (timing, efficiency,
quantity) receives a score between 0 (no free ridership) and 1 (complete free ridership). We combine
these scores by multiplying, then subtracting the product from 1 to compute program attribution.

California Public Utilities Commission HVAC Roadmap Workplan
Page 53
FRtotal = FRtiming * FRefficiency * FRquantity
Attribution = (1-FRtotal)
The use of multiplication at the free ridership level means that if free ridership is zero for any of the
dimensions applicable to the measure, the total free ridership will also be zero and the program will
receive full credit for the measure. On the other hand, a respondent must be a full free rider along all
applicable dimensions to result in a total free ridership of one. The description of the free ridership
methodology above applies to the HVAC deemed savings measures in this category. In the previous
evaluation cycle, the CPUC EM&V Research Roadmap had requested that the evaluation team develop
more unique and customized NTG approaches for the upstream HVAC programs. We plan to continue
using these customized NTG approaches for the evaluation of PY2019 with some of the improvements
in methodology described above.
Scoring method for the Upstream HVAC programs
This subsection describes the scoring method used in the previous Upstream HVAC program surveys.
To establish program attribution, we considered the pathways distributors take when selling a high
efficiency HVAC unit, and the related pathways buyers take when purchasing one. Our goal was to
develop an approach that considered these pathways in the context of the HVAC1 program design and
real-world complexity. We created the term “causal pathway” to identify how the program may cause
behavior change along these paths. We then used this approach to integrate NTG survey responses
between buyers and the distributors into an overall NTG score.
Our methodology assumed that there were three main causal pathways of influence that impacted
both the HVAC equipment distributor and buyer. We derived these assumptions from the program
logic model provided from the PAs. Distributors and buyers are both important when evaluating
program attribution of this nature, and both were taken into consideration to formulate an overarching
attribution score. Table 22 shows the researchable questions which represent the 3 causal pathways
across distributors and buyers.
Table 22. Question themes across 3 causal pathways for distributors and buyers
Causal Pathways Distributor Questions Buyer Questions
Stock 1. What was the program influence on distributor stock?
1. How did the mix of equipment in stock influence the buyer?
Promotion/Upsell 2. What was the program influence on encouraging the distributor to promote or upsell the units?
2. What was the influence that distributor upselling had on the buyer’s decision?
Price of Units 3. Did the distributor pass on some or all of the incentive to buyers?
3. What was the influence the price had on the buyer’s decision?
To better understand program attribution, our survey instruments also had questions which focused
on the following topics:

California Public Utilities Commission HVAC Roadmap Workplan
Page 54
▪ The distributors’ perspectives on sales and how sales may have differed in the absence of the
program.
▪ The buyers’ perspectives on the factors that led them to select the specific efficiency level for
the HVAC unit purchased.
We used the responses to these questions as consistency checks to the three main causal paths
described above.
Each of the three causal pathways was contingent on the distributor changing their behavior in
response to the program, and this change in behavior influencing the behavior of their buyers. We
surveyed distributors involved in the program and a sample of buyers from those distributors. We
believed that if the program failed to show attribution through the distributors or buyers, then the
influence of this program had failed to affect the equipment sale on this casual path. This did not
mean that the program had no influence on the sale, only that any influence it had was not through
this path. If another causal path did show program influence, then we determined the sale to be at
least partially program-attributable.
We evaluated each causal path at the level of the individual buyer and their associated distributor for
attribution. We then subtracted from 1 to get a free-ridership score on that pathway. To calculate the
total program attribution score, we multiplied these 3 free-ridership scores together. We explore this
calculation further below, but the overall approach captures multiple paths of attribution, as well as
partial attribution when it exists.
9.3.6 Task 6. Calculate net savings estimates
When using methods based on participant self-report surveys, we compute an attribution score for
each survey respondent, multiply their gross savings by that attribution to calculate net savings, then
use sample expansion as described in Deliverable 7 to produce population level net savings.
Population level NTGRs are computed by dividing population net savings by population gross savings.
Consumption regression analysis methods are described under Deliverable 9. These methods directly
provide net saving under RCT design, in some conditions under RED design, and under quasi-
experimental methods for some behavioral program. Quasi-experimental analysis with the survey-
based adjustment described above are an alternative for producing net savings.
9.3.7 Task 7. Make recommendations for program improvements
Our approach to NTG takes the program design, logic, and mechanisms into consideration, and at its
core, NTG is about assessing the programs’ effect on the market. Thus, it is an inherent quantification
of the interaction of the programs and the market. Not only is it useful for assessing how well certain
elements work, it also provides insights into what is likely and unlikely to work given current and
future market conditions. As such, an output of our NTG analyses will be to make recommendations to
the programs about program design, where to set incentive levels, how to set ex-ante NTGRs, and
which products to incentivize.

California Public Utilities Commission HVAC Roadmap Workplan
Page 55
10 APPENDIX F - WORKPLAN COMMENTS
Table 23. Workplan comments
Subject Comment
From Page or Section
QUESTION or COMMENT Response
SDG&E Page 12 Has the evaluator considered virtual
inspections to collect gross impact inputs?
Yes, we plan to include virtual inspections in our gross data collection efforts. We will attempt to work with the site contacts to capture
photographs of installed systems and document
the operations during the remote data collection process.
SDG&E Page 13
The work plan states that "Remote data collection efforts will focus on verifying the
simulation model inputs and short-term monitoring of critical equipment." Please clarify how the evaluators will monitor critical equipment (i.e. how is this being done,
what equipment will be monitored, and how long will the equipment be monitored for?)
Based on discussions with PAs, it is our
understanding that many of PTAC Controls measure installations include an Energy Management System with trending capability. We plan on requesting up to a year's worth of data (equipment run times, actual occupancy rates and temperature setpoints) from the EMS systems installed as part of the project. It is
likely that such EMS data would have been our
primary equipment performance data source even if site visits were occurring. We will isolate the use of this data to periods prior to 3/1/2020, to avoid COVID-19 influences on the operation and performance.

California Public Utilities Commission HVAC Roadmap Workplan
Page 56
SDG&E Page 18
According to the work plan, the evaluators "will use pre-installation monthly and AMI billing data obtained for the facility to verify
seasonality and daily occupancy/usage patterns of guest rooms estimated by the baseline eQUEST models."
Can you clarify how monthly and AMI billing data be used to verify usage patterns of guest rooms?
It is our understanding that the overall energy
consumption of hotels/motels are greatly affected by guest room occupancy rates, as the guest rooms constitute approximately 80% of the total area (in most cases). The monthly billing data will inform seasonality associated with the facility and also corroborate the
reasonableness of our eQUEST models' outputs. Through a detailed remote data collection effort, we will attempt to obtain the loads (lighting,
HVAC and plug loads) and operating schedules associated with various space types other than the guest rooms. This data combined with the
AMI billing data will be used to inform daily usage patterns of the guest rooms and also assist in a quality control check of eQUEST model hourly outputs.
SDG&E Page 18
For customers that weren't able to provide all
the necessary model inputs needed for the gross impact analysis, what defaults will the evaluators use?
Is the evaluation going to conduct any
sensitivity analysis to compare results when defaults were used vs when actual customer-inputs were provided?
We will default to the evaluator’s best engineering judgement, including the default
DEER model prototype inputs in this event. We
do not plan to conduct any sensitivity analysis.
SDG&E Page 18
Will you be checking the monthly consumption
and AMI data for consistency? For example, for a given customer, check to see if their monthly usage differs from monthly usage calculated using AMI hourly data to see if the two data sources show consistent information
regardless of granularity of the data.
This will be one of the quality control checks in our analysis process, given we have access to both data sources.

California Public Utilities Commission HVAC Roadmap Workplan
Page 57
SDG&E Page 21 Are you going to test out different matching formulas to see which one creates the best balance (e.g. Euclidean or Mahalanobis)?
DNV GL will test different matching approaches
but based on considerable experience in designing quasi-experimental studies we plan to use distance-based matching (particularly, Mahalanobis) to evaluate PY2019 residential HVAC measures. Mahalanobis matches are Euclidean distance matches adjusted for
covariance in the data and properly weight Euclidean distance among matching variables for the degree of correlation that exists among them.
SDG&E Page 21 Are you going to compare demand load shapes between participants vs non-
participants?
DNV GL will use data from participants and matched comparison households to compare
demand load shapes between the two groups.
SDG&E Page 51
The overall program FR combines FR from three dimensions: timing, efficiency, and quantity. This method only considers the counterfactual (what the participant would have done in the absence of the program).
Other NTG methodologies have used a combined approach that assesses FR from two
perspectives: program influence (i.e. how important was the program and program services in their decision to install the smart thermostat or high efficiency water heater)
and the counterfactual. A potential drawback on relying solely on the counterfactual questions is that customers may have a difficult time answering these questions. They may not know what they would have done in a hypothetical alternative situation, particularly if the program influences customer behavior in
multiple ways (incentive, contractor, marketing). Has the evaluator considered applying the latter approach?
Yes, we have considered using program influence questions, but we do not use them for
two reasons. First, they fail to capture whether
the program has critical importance rather than just a lot of importance. Second, the typical response patterns of the program influence batteries cause the NTGR to approach 50% (i.e. involves a computation that can understate program influence). Instead, we include a single likelihood question as a means of checking the
internal consistency of customer responses to the NTG battery TEQ questions.

California Public Utilities Commission HVAC Roadmap Workplan
Page 58
Simulations Energy
Solutions 3.1.5.1, 3.3.1.2
3.1.5.1 states: "The evaluation team will
leverage PY 2018 evaluation data to address the discrepancy between the ex-ante and ex-post savings estimate via simulation and eventually propose to true up the UES of this measure group based on the simulation results". 3.3.1.2 states: " We will use on-site
data previously collected under the PY2018 evaluation, and further supporting data such as from the workpaper archive, to develop ex-post UES values by adjusting critical DEER
eQUEST model input parameters. The adjusted models will be simulated to produce ex-post savings estimates for each climate
zone building type and unit type combination". Does the evaluation team intend to use these same models to estimate ex-post gross savings for PY 2019? If so, we repeat our concern that using the same models for ex-post and ex-ante estimates seems counter intuitive to the concept of independent
evaluation. We believe the evaluators must perform due diligence into where models and
parameters are not appropriate for program realities. In comments on the 2015 HVAC1 and 2013-2014 HVAC 1 impact evaluations, PG&E, as well as other parties, offered several
examples of challenges presented by this approach. We ask the evaluation team to develop independent models against which to check ex-ante estimates. We would like to participate in future meetings with the PAs, ED, DNVGL to review proposed "revisions to measure input parameters" and updating
other relevant model parameters that impact the measure savings estimate."
The evaluation team will use the best available models considering DEER updates, eTRM, and
other data sources (including existing EM&V data), to develop robust independent savings impact estimates.

California Public Utilities Commission HVAC Roadmap Workplan
Page 59
Leveraging PY
2018 evaluation
data to address
discrepancy between the ex-ante and
ex-post savings
estimates.
Energy
Solutions
3.1.5.1,
3.3.1.2
In reference to Workplan quotes stated above.
In their 2018 evaluation (pg. 5), DNVGL reported an overestimation of DEER ex-ante savings by 45%. They indicated that ex-ante savings were 60% of the total cooling load (which would be high). For baseline energy consumption, MASControl compressor only
consumption is 534 kWh/ton which compares with DNVGL reported 576 kWh/ton. MASControl cooling and supply fan energy is actually 1,008 kWh/ton. DEER2017 READI
reports tier 1 savings of 91.7 kWh/ton and not 350 kWh/ton as reported by DNVGL. Therefore, we believe that DNVGL was using
baseline consumption and measure case savings which excluded fan energy while DEER includes fan energy. For your ex-ante energy savings, will your baseline assumptions include fan energy? We are concerned with using ex-ante baseline energy consumption and energy savings (without fan energy) will
not accuracy represent 2019 gross ex-ante and gross ex-post savings.
For PY2019 we will use basic rigor to evaluate
the savings of the Rooftop/Split System measure group. We will thoroughly investigate the derivation of UES and origin of tracking data estimates to ensure savings for these measures is accurately assessed. We will look at saving claims that were reported and as well as approved ex-ante UES values and our best
estimates for ex-post UES savings estimates. We will use on-site data previously collected under the PY2018 evaluation, and further supporting data such as from the workpaper archive, DEER updates, recent RASS, and the eTRM to develop ex-post UES values by adjusting critical DEER eQUEST model input parameters. The adjusted
models will be simulated to produce ex-post savings estimates for each climate zone building type and unit type combination.

California Public Utilities Commission HVAC Roadmap Workplan
Page 60
90%
confidence intervals
Energy Solutions
3.1.7 Sub Task 7
Please provide the formulas and data used to calculate achieved confidence interval (CI) and relative precision (RP) in the final report.
Can the report include additional discussion that describes how the results are derived and how CI and RP should be interpreted and used, or not used, given that achieved RPs often did not meet planned RP, especially in cases when RP is > 100%? Remember that impact evaluation results are used for many
things like determining goal attainment, calculating measure/program/portfolio cost
effectiveness, calculating ESPI, revising ex-ante DEER/workpaper values, and sometimes to inform decision making to expand or discontinue measures and programs.
Although samples are designed to achieve +-
10% relative precision at the 90% confidence interval, results outside of those targets are often still meaningful. For example, in the case of the 2018 net boiler evaluation, SoCal Gas (SCG) had an evaluated Net to Gross Ratio (NTGR) of 19% with a relative precision of +-
28% for the therm fuel type. In this case although the relative precision is outside of the target +-10% the results still clearly indicate that the program is not performing as intended
and we are 90% certain that the program’s true NTGR is less than 25%. For the kWh fuel type for the same measure, the SCG NTGR was 8%
with a relative precision of +-109%. In this case the relative precision is much higher than the target, but the results can be interpreted as at 90% confidence the kWh NTGR was less than 20% again indicating that the program is not performing as intended. In the case where a high relative precision is the result of a small
sample size, such as was the case for SDGE rooftop/split system net analysis (n=3), the
overall statewide result could be used if appropriate. The overall statewide result may be appropriate for many purposes, particularly if there is no major difference in the delivery
mechanism between IOUs. For the 2016 analysis rooftop/split measure group analysis, the error bands are so wide for each IOU as well as for the statewide result that the correct number could be anywhere between 0 and a value greater than the ex-ante estimate. Nonetheless, the result for each of the IOUs was about half
the ex-ante value. This consistency, despite the wide error bands for each IOU estimate, suggests that the true NTGR is roughly in line with the evaluated values.

California Public Utilities Commission HVAC Roadmap Workplan
Page 61
How gross ex-ante and
gross ex-post savings are calculated.
Energy Solutions
3.1.5.4
Data Sources, 7.2 Gross Savings Methods
Section 3.1.5.4 states: "Remote data
collection efforts will focus on verifying the simulation models inputs and short-term monitoring of critical equipment." Can you explain "remote data collection efforts and short-term monitoring"? Does this
apply to rooftop/split systems? We thought no remote monitoring will be conducted in 2019 due to COVID. Our main question is to understand gross savings methodology, how
gross savings (ex-ante and ex-post) will be calculated, and which assumptions/inputs will be used/adjusted/modified. It's unclear from
the text in tables 15 & 16.
No on-site data collection of PY2019 rooftop/
split system measure group participants will be conducted for this effort. A close examination of the ex-ante workpaper UES values and investigation of supporting models will be conducted instead. Finally, the PY 2019 UES values will be revised as a result of this
investigation if required.
Energy
Solutions Overarching
We strongly recommend that DNVGL conduct
meetings with the PA Program Managers, EM&V Strategic Analyst, and Implementers to discuss and assist with enhancing the effectiveness of this evaluation's Plan. These
meetings will prove to be invaluable by contributing experience and knowledge with
methodologies, engineering skills, and field experiences. We kindly request that DNV GL incorporate these meting as part of this impact evaluation Workplan. Energy Solutions can facilitate these meetings.
The evaluation team appreciates Energy Solutions engagement in the evaluation
development process. The evaluation team will consider the commenter's recommendation to conduct a meeting with them and the PAs to assist in the research and discovery period of executing this workplan. In fact, as a result of
the feedback we have received previously the evaluation met with the PAs to discuss program
design, delivery, and data collection processes during the workplan development process. The evaluation staff encouraged the PAs to include their program's implementers in these meetings.
SCE
Overall Comment (based on
page 8 of the 2018
Final Report)
For the 2018 Impact the evaluators noted that
ex-post savings for Water Cooled Chillers had unexpectedly high GRRs due to: "...evaluation savings approach modeled different DEER building types, with various chiller annual operating hours, to calculate savings for
different sample claims whereas the reported analysis used a single average “commercial” building type to estimate savings across all their claims." SCE appreciates the team’s determination to use the beast inputs for calculating savings and welcomes other instances for the 2019 evaluation.
The evaluation team appreciates the feedback provided in this comment and will continue
striving to improve the accuracy of the ex-post savings estimates.

California Public Utilities Commission HVAC Roadmap Workplan
Page 62
SCE
Overall Comment
(based on page 8 of the 2018
Final Report)
In the 2018 Impact the evaluators stated that
"Generally, we found the water-cooled chiller NTGRs were higher than reported. The overall NTGR was 81% for kWh, meaning the program had a strong effect on high-efficiency chiller sales. The program’s effect on sales is due mostly to the distributors’ decisions to
pass on most of the rebates they receive from the program to their buyers to lower the incremental costs of the high efficiency options. The distributors said that the ability
to lower the incremental cost of high-efficiency equipment was key to making sales and their sales volume of high-efficiency
models would be lower without the program. The program is also designed to increase distributors’ recommendations of high-efficiency equipment, but survey responses indicate the program has minimal effect on this behavior."
This shows how important having the correct decision maker is for net influence. We
encourage early outreach to SCE if any recruitment or sample problems arise.
The evaluation team sincerely appreciates SCE's
support in recruitment and sampling.
SCE Page 12 of Workplan
"The phone interview with contacts at
participating end user facilities will be the primary mechanism for data collection to assess gross savings. At the time of this writing, the evaluators assume that on-site visits will not be feasible for PY2019 data
collection, due to the ongoing COVID-19 pandemic."
While I am sure the team has thought through the challenges, it would be nice to have an idea of when passing through ex-ante savings
will be more reliable than calculations without onsite visits as they yield very important information.
Even though there are no site visits, we plan to have an extensive remote data collection effort which includes obtaining trend data from EMS systems. Based on discussions with PAs, it is our
understanding that the many of the PTAC Controls measure installations include an EMS system with trending capability. We have
received sample datasets from a selection of prior participants and believe that this trend data is comprehensive and adequate for
enhanced rigor evaluation.

California Public Utilities Commission HVAC Roadmap Workplan
Page 63
SCE Page 14 of Workplan
"On site surveys Includes verifying measure
installation, gathering measure performance parameters such as efficiency, schedules, setpoints, building characteristics etc." Since we may not be able to perform onsites per COVID-19, it seems we will have to pass
through ex-ante assumptions where the participants cannot recall these details reliably over the telephone or via the internet on a web survey. I believe some PAs are doing
virtual inspections using software tools - the evaluation team may wish to consider these in addition to standard phone and interview
techniques.
Thank you for this suggestion. We are treating
the site-specific surveys as virtual inspections, given the amount of data to be collected and visually confirmed. If such data cannot be credibly collected, we will default to our best
engineering judgment, which may include the default the DEER model prototype inputs. Since the DEER model forms the basis of ex-ante savings, in absence of evaluation data, our team
will leverage the program implementers' data to inform the ex-post DEER model.
SCE Page 18 of
Workplan
"A baseline model will be constructed that represents how the guest room energy
systems were operated in the pre-installation scenario, including HVAC, lighting, and appliances. We will also use pre-installation monthly and AMI billing data obtained for the facility to verify seasonality and daily
occupancy/usage patterns of guest rooms estimated by the baseline eQUEST models."
SCE suggests the research team consider focusing on segments with arguably less COVID impacts and extrapolating those results when feasible.
Thank you for the suggestion. The PTAC Controls
measure is a dominant ESPI measure group for PY2019 HVAC savings and needs to be evaluated as part of the PY2019 evaluation. The proposed evaluation approach attempts to minimize the adverse impact of the COVID-19 pandemic and
assess savings impacts from these measures based on pre-pandemic conditions, thus treating
the COVID outbreak impacts on this industry as a large non-routine event. In lieu of COVID impacts we plan to avoid performing any billing analysis for periods after March 1, 2020.

California Public Utilities Commission HVAC Roadmap Workplan
Page 64
SCE Page 18 of
Workplan
"Once an appropriate baseline model is
developed for each project, we will develop a similar site-specific as-built model in eQUEST by modifying independent variables such as post-installation equipment set-point schedules and occupancy rates gathered from data collection and requested EMS logs.
Finally, we will use the post-installation (and pre-COVID-19 pandemic) monthly and AMI billing data obtained for the facility to verify seasonality and daily occupancy/usage
patterns of guest rooms estimated by the as-built eQUEST models."
SCE appreciates how the research team is squarely addressing the challenge of predicted low run times and other HVAC operational measures due to the rapid contraction of the business sector. Savings due to operational changes will be large. Traditionally the evaluation framework did not allow for
business cycle adjustments to savings (boom vs bust impacts) but the team is commended
for taking a direct look at this unprecedented event. SCE anticipates that data collection for an as built model may be difficult in some cases and suggests that the team consider a
decision rule for passing through ex-ante savings estimates as opposed to trying to construct very difficult counterfactuals.
Overall, we are treating the PY2019 evaluation
as if programs and consumption will return to pre-COVID conditions throughout the lifetime of these measures. Lifecycle savings should largely
remain unchanged because the equipment lifetimes will be either used more intensely through this non-routine event and some
savings realized earlier or used less intensely and the lifetime extended with some savings accruing later, depending on the change is use resulting from the disruption. This is materially not different than performing weather normalization of savings. We likely will not be able to predict the long-term effects of this large
non-routine event during the period of this evaluation.

California Public Utilities Commission HVAC Roadmap Workplan
Page 65
SCE Page 1 of
Workplan
“Evaluating the gross and net peak demand
(kW), electrical energy (kWh), and gas energy (therm) savings for selected measure groups through energy consumption analysis of interval data, targeted input parameter data collection, revision of California Database for Energy Efficiency Resources (DEER) prototype
measure analysis, and in-depth interviews with distributors, contractors/ installers, and end users.”
Comment: Please make sure that (contingent to data being statistically significant) this effort is coordinate and evaluated against
recent saturation studies to inform updates to DEER prototypes.
We will leverage the RASS and CEUS data as it
becomes available and will review how those findings impact HVAC baselines, e.g. HVAC efficiency by vintage and saturation.
SCE Page 11 of Workplan
“The remaining HVAC measure groups
(residential sector measure groups) will be evaluated using a billing analysis approach where all sites in the program population will be evaluated. Table 7 shows the HVAC measure groups that will use census approach
for PY2019.”
Comment: Please ensure that adopted billing analysis methodology includes public recommendations provided on latest residential studies, e.g., Impact Evaluation of Smart Thermostats highlighting potential shortcomings with self-selection bias.
DNV GL billing analysis will include all the best methodologies for addressing self-selection and
other possible challenges. The opt-in process for the direct install channel is not expected to have
the same self-selection issues encountered by the downstream rebate channel evaluation. In addition, DNV GL is improving on methodologies to better address self-selection when it is present.

California Public Utilities Commission HVAC Roadmap Workplan
Page 66
SCE Page 18 of Workplan
“Developing the as-built model: Once an
appropriate baseline model is developed for each project, we will develop a similar site-specific as-built model in eQUEST by modifying independent variables such as post-installation equipment set-point schedules and occupancy rates gathered from data collection
and requested EMS logs. Finally, we will use the post-installation (and pre-COVID-19 pandemic) monthly and AMI billing data obtained for the facility to verify seasonality
and daily occupancy/usage patterns of guest rooms estimated by the as-built eQUEST models.”
Comment: Evaluation approach including some level of validation/calibration using AMI billing analysis seems reasonable; however, this may not be fully representative to the whole population of incentivized projects. Additionally, it would valuable to understand
variations on measure savings estimates using the defaulted DEER prototype vs modified
DEER prototype to have some onsite as what level of improvement and/or accuracy is gain with proposed methodology. The magnitude of this error is likely consistent with the error
between the workpaper savings and “calibrated” savings estimates.
The evaluation sampling strategies will attempt
to mitigate these concerns. To clarify-- we are not using AMI data availability as a sampling criterion; rather, we will attempt to analyze the AMI data whenever available for the sampled projects.

California Public Utilities Commission HVAC Roadmap Workplan
Page 67
SCE Page 18 of
Workplan
“For PY2019 we will use basic rigor to
evaluate the savings of the Rooftop/Split System measure group. We will use on-site data previously collected under the PY2018 evaluation, and further supporting data such as from the workpaper archive, to develop ex-post UES values by adjusting critical DEER
eQUEST model input parameters. The adjusted models will be simulated to produce ex-post savings estimates for each climate zone building type and unit type combination”
Comment: Please make sure building types evaluated under the study are consistent with
that supported by Program claims and includes “COM” as reported by some Upstream programs based on previous CPUC consultant direction.
Per our previous HVAC impact evaluation
recommendations these programs should be able to identify the building type, which significantly impacts the measure savings. The COM population weighted average does not
reflect well the building type mix in any given program year.
SCE Page 19 of Workplan
“The primary focus of DNV GL’s PY2019
evaluation will thus be on estimating HVAC measure savings among homes that installed these measures in program year 2018 through
direct install programs.”
Comment: The study should additionally evaluate measure savings potentials for smart thermostat EE offerings under the Direct Install program, evaluated in latest residential impact evaluation studies for SFM Downstream programs but excluded for DI programs.
The smart thermostat EE offerings under the Direct Install program will be evaluated under the Group A Residential Sector Roadmap impact evaluation.

California Public Utilities Commission HVAC Roadmap Workplan
Page 68
SCE Page 21 of
Workplan
"The billing analysis is based on a quasi-
experimental design that uses energy consumption data from PY2018 participants and matched comparison non-participants. We plan to use two different comparison groups. First, DNV GL will use future (PY2019) participants as comparison groups as they are
expected to be similar to current participants along dimensions that drive such households to self-select into participating in programs offering residential HVAC measures. Even in
the case of direct install programs, where the decision to participate may be made by property managers rather than occupants,
current and future participants are likely to be the same along other unobservable characteristics that affect the use of these measures.” Comment: Please ensure that adopted billing analysis methodology includes public
recommendations provided on latest residential studies, e.g., Impact Evaluation of
Smart Thermostats highlighting potential shortcomings with self-selection bias.
DNV GL billing analysis will include all the best
methodologies for addressing self-selection and other possible challenges. The opt-in process for
the direct install channel is not expected to have the same self-selection issues encountered by the downstream rebate channel evaluation. In
addition, DNV GL is improving on methodologies to better address self-selection when it is present.

California Public Utilities Commission HVAC Roadmap Workplan
Page 69
SCE Page 21 of
Workplan
“3.3.2.1.5 Load shapes
DNV GL will also estimate hourly load and savings shapes for residential HVAC measures. Such estimates will provide an understanding of when demand savings (in kW) occur from the program. Savings load
shape will identify the average hourly and 8,760 hourly load savings and, thus, the periods during which program savings occur.”
Comment: May want to consider leveraging pre-COVID data for establishing load profiles for “typical” conditions. Estimated load
profiles (contingent these are statistically significant) should be used for updating and/or informing corresponding DEER prototype load profiles. Sub-metering shall be considered for potentially desegregating these at a more granular level, e.g., the end-use level including but not limited to HVAC and
DHW load profiles.
DNV GL intends to conduct the impact
evaluation as well as establish load profiles based on energy use data from PY2018 participants. DNV GL made this choice to prevent confounding the effect of the measures
installed with the significant structural break in energy consumption precipitated by COVID-19. DNV GL agrees that estimated load profiles that
are statistically robust can be used to update corresponding DEER prototype load profiles.
Collaboration PG&E -
PG&E would like to thank DNV GL for all of its efforts to improve collaboration throughout
the development of this workplan, including meeting with staff to learn more about the programs and available data.
The evaluation team appreciates PG&E's
comment and their engagement in improving the HVAC sector evaluation process.
Table Format PG&E 8
This table is a little difficult to read because
there are no lines delineating new rows in the first column. Can you please add lines to column 1?
We have added borders to the first column to
improve the legibility of the table.
Rooftop-Split Measures
PG&E 11
The workplan says that "the evaluation team
will perform a discrepancy analysis between
ex-post and ex-ante savings on this measure group and true-up the unit energy savings (UES) values for this measure groups that
doesn’t require sampling." It's unclear exactly what is being looked at here. Are all projects being reviewed?
All commercial applications measures falling
under the rooftop/ split system measure group
are within scope to be assessed for gross impacts. The analysis will focus specifically on the ex-ante UES estimates, claimed savings and
any new ex-post UES values that warrant being developed and applied to the applicable PY2019 claims if necessary.

California Public Utilities Commission HVAC Roadmap Workplan
Page 70
Rooftop/Split
Systems PG&E 12
The workplan states: "The evaluation team
will leverage PY 2018 evaluation data to address the discrepancy between the ex-ante and ex-post savings estimate via simulation and eventually propose to true up the UES of this measure group based on the simulation
results." Again, it's confusing what is being evaluated in this group. Are only 2018 savings being
looked at? If so, how will the results be folded into PY2019 evaluation results? Can DNV GL please provide more context on why this work
is being conducted, what exactly is being done, and what the purpose of the work is? We also strongly recommend that DNV GL meet with the program implementer (Energy Solutions) and our Workpaper team to make sure that nothing is overlooked in this analysis.
The rooftop/split system measure group will be
evaluated for gross impact only and the PY 2019 UES values of this measure group will be updated as a result of this evaluation effort. No additional field data will be collected for this measure group in PY 2019 evaluation, however PY 2018 evaluation data will be utilized to re-run
the eQUEST proto-type models at different combinations such as CZs, vintages, building types etc. to estimate new UES values for these combinations. Then, finally the new UES values
will be applied to PY 2019 ex-ante claims. This additional analysis was proposed by the evaluation team to address the large
discrepancies found between ex-ante and ex-post estimate for this measure group in PY 2018 evaluation. Yes, the evaluation team will co-ordinate with the PA workpaper leads to request appropriate eQUEST Prototype models for the rooftop/split
system measure group.
Rooftop and Split Systems
PG&E 18
The workplan states: "For PY2019 we will use basic rigor to evaluate the savings of the
Rooftop/Split System measure group. We will use on-site data previously collected under the PY2018 evaluation, and further supporting data such as from the workpaper archive, to develop ex-post UES values by adjusting critical DEER eQUEST model input parameters."
Does this mean that UES values will be derived from PY2018 data but applied to
PY2019 claims? If so, why is PY2019 data not being utilized for this work?
Any new ex-post UES values will be applied to the PY2019 tracking claims and those claims compared against the PY2019 ex-ante savings claims. Development of any new ex-post UES
values will be derived use the best available models considering DEER updates, eTRM, and other data sources (including existing EM&V data), to develop robust independent savings impact estimates. No additional field data will be collected for the rooftop/split system measure
group in PY2019.

California Public Utilities Commission HVAC Roadmap Workplan
Page 71
Commercial PTAC Controls
measure group
PG&E 22
The workplan refers to end-user surveys. Can
you please clarify what is meant by end-user? In the case of hospitality, end-user could refer to the building owner, the business owner or manager, or the customer/tenant.
For the gross impact surveys the end-user would
refer to whichever person is most knowledgably about the operation of the PTAC equipment and occupancy of the hotel/motel. For the net surveys it would be whoever made the decision to purchase the EE equipment. The end-user may or may not be the same individual.
Nonresidential report
PG&E 22
The workplan states that the Nonresidential
report will cover the commercial PTAC controls measure group but does not mention the
rooftop/split systems measure group. Will this be included in a separate report?
There will be no separate report for the rooftop/split system measure group. Nonresidential report will cover the evaluation of both the commercial PTAC controls measure
group and rooftop/split system measure group. The workplan has been amended to reflect this.
Year discrepancy
PG&E multiple
Appendix E has a handful of instances where it
refers to the wrong year, for example, the top of PDF page 50. Can you please review to ensure that the correct year is being referenced?
Corrections have been made in Appendix E to reflect applicability to PY2019
SCG
Page 13,
Section 3.1.5.3
The first sentence of this subsection indicates
that net evaluations for measure groups listed in Table 1 are highlighted in green. Though the measure group heating, ventilation, and
air conditioning (“HVAC”) Furnace is not highlighted in green in Table 1, the column
“Net Savings Evaluations” indicates the HVAC Furnace measure group will be evaluated. Is this correct?
The HVAC Furnace measure group is under
evaluation for both gross and net impact for the
PY2019 evaluation. Table 1 has been corrected to reflect this status.
SCG Page 13, Section 3.1.5.4
There is reference error in the first sentence
of this section. This error has been addressed.
SCG Page 14,
Table 8
Program Monthly Billing Data description
column is missing therms. We have added "and therms."

California Public Utilities Commission HVAC Roadmap Workplan
Page 72
SCG Page 19, Section
3.3.2.1
Page 19 states that the consumption analysis
approaches will be high rigor. However, page 52 Table 21 provides that net-to-gross (“NTG”) evaluation activities will be “basic” and “standard.” Also, the workplan webinar established “basic” for all evaluation activities. Is the consumption analysis rigor level distinct from the NTG evaluation activity rigor level?
Yes, they are distinct. The content on page 19
referring to the consumption analysis rigor levels is for the gross savings estimate components of the residential HVAC evaluation while Table 21 on page 52 in referring to the net-to-gross attribution component of the residential HVAC impact evaluation. All residential HVAC measure
groups are receiving basic net-to-gross attribution rigor, except for the furnace measure group, which is receiving a standard level treatment. This is a correction to the content in
the workplan webinar with errantly listed the furnace as basic as well.
SCG Page 52, Table 21
The HVAC Furnace measure rigor level here is standard, whereas the workplan webinar deck states basic. Are these rigor levels intended to be aligned?
The HVAC Furnace measure group will be receiving standard rigor treatment for net attribution assessment. The webinar errantly identified this treatment rigor as basic.
SCG Appendix A
Please explain what Coefficient of Variation
(“CV”) will be acceptable when the post evaluation team models the baseline and reporting period usages. What values of the normalized mean bias error and CV of the root mean squared error will be acceptable for the model that the post evaluation team prepares?
The types of measures of goodness-of-fit mentioned in the question are relevant when the baseline against which performance is measured
is based on the prediction of post-period energy use based on pre-period models and post-period
circumstances; such baselines are compared to actual post-period energy use data to evaluate the impact of measures of interest. These metrics are not relevant for the approach DNV
GL intends to use to evaluate the PY2019 residential HVAC measures. DNV GL will use a two-stage energy consumption data analysis, where weather normalized energy use data from matched comparison groups in the post period will be used to form the baseline against which the PY2019 residential HVAC measures are
evaluated.

California Public Utilities Commission HVAC Roadmap Workplan
Page 73
SCG Appendix B
Please explain the length of time of the post evaluation data collection for the reporting period for each measure in which SoCalGas is involved.
As indicated in response to the comment above,
DNV GL plans to use a two-stage consumption data analysis that involves weather normalization and a quasi-experimental study design. The analysis requires a minimum of 12 months of pre-installation and 12 months of post-installation data. In this framework, the
reporting period is essentially the 12 months of post-installation period, which varies by measure and customer. Since DNV GL intends to use PY2018 participant data for the evaluation to
avoid having a post period that coincides with the effect of COVID-19 induced energy consumption changes (as indicated in the
workplan), the post period will cover the period February 2018 until December 2019, depending on the measure and customer installation date.
SCG Appendix C
Please explain the International Performance
Measurement and Verification Protocol option and rigor level to be used by the post evaluation team for each Residential measure in which SoCalGas is interested, such as HVAC
upstream for furnaces, Duct sealing Manufactured Mobil Home and Direct Install
HVAC Duct Sealing.
The Protocols allow for multiple methods of calculating impacts, not all of which are explicitly based on the IPMVP. Our approach is a hybrid
of the NAC method with additional variables in the NAC analysis derived from engineering
simulations. On this basis we view it as an Enhanced Rigor method.