Embed Size (px)
Citation preview
Impact EvaluatIon ofutZ cErtIfIEd coffEE program
In colombIa November, 2014

contributors: Carlos García ([email protected]), Julián García ([email protected]), Gustavo Ochoa (gochoa@
crece.org.co), Juan C. Mora ([email protected]), Juan F. Castellanos ([email protected]).
reviewers: Tessa Laan (UTZ Certified); Henk Gilhuis (UTZ Certified);
Francisco Bustamante (Independent Consultant).
Sessions with coffee growers were managed by the CRECE team in collaboration with Tessa Laan and Vera Espíndola Rafael.
design: Mariana Álvarez Matijašević.
photography: Patricia Rincón Mautner – David Mauricio Bonilla Abreo. © Copyright FNC 2014. Except for photos on pages
17 and 31, which are reproduced with permission of UTZ Certified.
Interviewed: Iván Alvarez (Specialty Coffees Coordinator at Huila Departmental Committee of Coffee Growers),
Francisco Bustamante (Former UTZ Coordinator in Colombia), Pedro F. González (Specialty Coffees Coordinator at Caldas
Departmental Committee of Coffee Growers), Yaneth Peña (Specialty Coffees implementation Director at Coffee Growers
Cooperative Coocentral), Carlos Rodríguez (Specialty Coffee Coordinator at Huila Coffee Growers Cooperative Cadefihuila),
coffee growers and institutional representatives that attended focus groups:
caldas department: Luis Guillermo Cortéz Jaramillo, José D’Lolo Gómez: Luis Armando Arboleda, Jairo Gómez Chica.
Patricia Mejía, Pedro Felipe González, Roberto Mejía, Comité de Cafeteros: Ricardo Velázquez Gómez, Angélica María
Escobar, Jorge Humberto Páez, Silvio Valdés Sánchez, Fundación Solidaridad: Carlos Isaza, Expocafé: Angela María Peláez,
Hacienda Venecia: Juan Pablo Echeverri, María Hoyos de Gómez, Alberto Jaramillo Botero, Roberto Gómez, Carlos Escobar,
María Teresa Delgado. Huila department: Fredy Betancourt, José Arismendi Cuaji, Juan Cuaji Velasco, Alexander Olaya
Cardozo, Ismael Perdomo Astudillo, Luis Alfredo Rojas Fierro, Yoel Trujillo Cedeño, Esther Pastrana, Orlando Figueroa, Didier
Francisco Avila Castrillón. Elirio Osorio Nuñez, Nilson Yunda Bermúdez, Yolanda Guevara, Oliverio Pajoy, Marialena Dago,
Marco Figueroa, Dina María Nipi, Iván Alvarez. Coocentral: Mauricio Rivera, Yaneth Peña, Amalia Muñoz.
Suggested citation: García, C.; García, J.; Ochoa, G.; Mora, J. C. and Castellanos, J. F. 2014.
Impact Evaluation of UTZ Certified Coffee Program in Colombia. (2008-2012).
CRECE. Manizales, Colombia.
about crEcE: The Centre for Regional Entrepreneurial and Coffee Studies is a nonprofit organization based in Colombia,
with 28 years of experience in socio-economic research and consulting. Our work has been oriented to support decision-
making processes for development by designing, collecting, processing and analyzing good quality information. The main
research topics in regional development are Coffee and Agricultural economics, Social and Institutional development
and Education studies. During the last decade, the Centre has been dedicated to the M&E of development programs and
measuring sustainability initiatives on agricultural and coffee sector. Executive Director: Marcela Urueña Gómez
This evaluation was carried out by CRECE and was commissioned and financed by UTZ Certified.
crEdItS

tablE of contEntS7999
1112161818191922242526272832333536
1. Executive Summary2. Introduction
2.1. About this Report
2.2. Co�ee Production in Colombia
2.3. The UTZ Theory of Change
2.4. The UTZ Program Implementation in the Colombian Context
3. Methodology4. Findings
4.1. Socioeconomic Characteristics of UTZ Certi�ed Farmers
4.2. Performance of UTZ Certi�ed Farmers
4.2.1. Farm Management
4.2.2. Working Conditions
4.2.3. Environmental Practices
4.3. UTZ Contribution to Long Term Sustainability
4.3.1. Social Sustainability
4.3.2. Environmental Sustainability
4.3.3. Economic Sustainability
4.4. Multi-Certi�cation
5. ConclusionsReferencesAppendices

fIgurES IndEx1011141919192020212121232424242525262727292929303030313243
Figure 1. Size Distribution of Co�ee Farms in Colombia (% of Total Farms)
Figure 2. Colombia´s Harvest (Million Bags of 60 Kg) and Farm Gate Prices (Cop/kg) 2005 – 2013
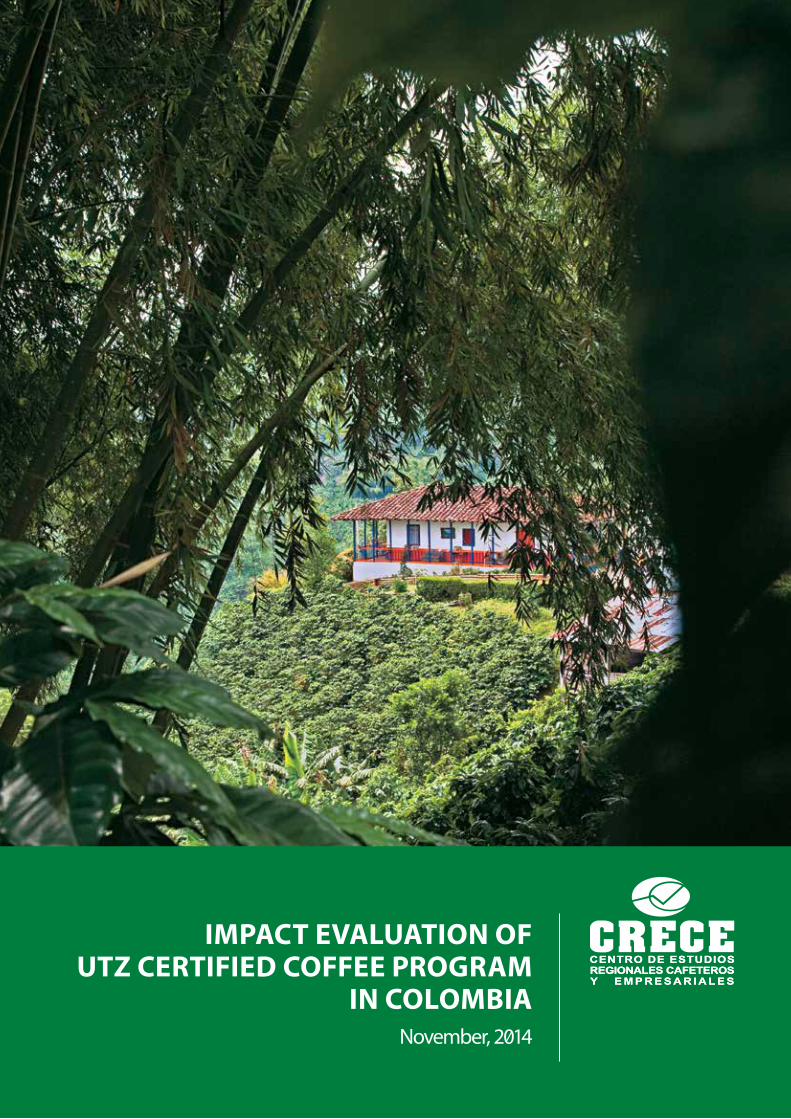
Figure 3. The Utz Theory of Change
Figure 4. Percentage of Farms by Size
Figure 5. Farm Area Dedicated to Di�erent Types of Land Use (average)
Figure 6. Change in Co�ee Specialization over Time (Co�ee Area as % of Total Farm Area)
Figure 7. Percentage of Producers Keeping Records
Figure 8. Percentage of Farms with Resistant Varieties to Rust Infection
Figure 9. Percentage of Farms with Leaf Rust Infection
Figure 10. Average Density of Trees (Trees/Ha.)
Figure 11. Kilos of Fertilizers Applied
Figure 12. Hours of Training
Figure 13. Percentage of Paid Labor
Figure 14. Producers Adopting Water Conservation Practices
Figure 15. Water Consumption in Wet Milling. Year 4 (Liters/kg of Parchment Co�ee)
Figure 16. Water Filtration System Used in Milling Process. 2011
Figure 17. Disposal of Domestic Wastewater, Year 4
Figure 18. Farmers’ Perceptions on Quality of Life Issues, Year 4
Figure 19. Social Sustainability Index
Figure 20. Environmental Sustainability Index
Figure 21. Economic Sustainability Index
Figure 22. Yield (Kilos of Green Co�ee per Ha.)
Figure 23. Production Cost per Kilo (USD / Green Kilo)
Figure 24. Revenue per Kilo (USD / Green Kilo)
Figure 25. Net Income per Kilo (USD / Green Kilo)
Figure 26. Percentage Di�erence in Price and Yield between Target and Control
Figure 27. Main Motivations to Obtain the UTZ Certi�cation
Figure 28. Percentage of Co�ee Sold as Certi�ed and Conventional
Figure 29. Nearest Neighbor Matching (10 neighbors)

tablES IndEx
abbrEvIatIonSand acronymS
CBBCOP
COSACRECE
DD or DIDDDDFNC
GAPGBEHa.
M&EPO
PSMSENA
SICA
TOCUSD
Co�ee Berry Borer
Colombian Pesos
Committee On Sustainability Assessment
Centre for Regional Entrepreneurial and Co�ee Studies
Double Di�erence or Di�erence in Di�erences
Triple Di�erence in Di�erences
Federación Nacional de Cafeteros de Colombia
(Colombian Co�ee Growers Federation)
Good Agricultural Practices
Green Bean Equivalent
Hectares
Monitoring and Evaluation
Producers Organization
Propensity Score Matching
SENA Servicio Nacional de Aprendizaje
(Colombian National Learning Service)
Sistema de Información Cafetera
(The Co�ee Information System)
Theory of Change
US Dollars
182236434445
Table 1. Characteristics of the Producers
Table 2. Implementation of Good Social Practices
Table 3. UTZ Certi�ed Program Indicators 2014
Table 4. Matching Methods Implemented
Table 5. Parameters Used to Calculate Water Consumption
Table 6. Summary of Results From the Survey and Single Di�erences by Year

The main aim of this study is to understand the outcomes of UTZ certification in Colombia in relation to the objectives of the program as described in the UTZ Evaluation framework, the Theory of Change and the key UTZ program indicators. It focuses on the performance of UTZ Certified coffee farmers during the harvest seasons of 2008, 2009 and 2011 and assesses the impact of the UTZ program on the social, environmental and economic performance of producers.
Study Scope
The study assessed the following questions:
y What are the outcomes and impacts of UTZ intervention at farm level?
y What are the socioeconomic characteristics of UTZ farmers?
y What factors influenced the implementation of the UTZ program?
y What indicators related to the UTZ program show the most relevant or significant changes?
y Which of the program requirements are most effective at influencing farmer performance?
y What sustainability benefits were generated by the program in the period studied?
y Which of the expected changes have not yet been achieved?
This report is based upon a set of indicators that was selected from a broader set of COSA indicators, based on the UTZ Theory of Change. The data set was built from three longitudinal surveys covering a sample of 857 coffee farmers in the central and south-west departments of Caldas and Huila respectively. The sample includes 278 UTZ producers who were certified in 2008 and a control group of 579 non-certified producers who only sell to the conventional market. The data sets come from a broader research study that has been developed in Colombia since 2008 in collaboration with COSA to compare changes in socioeconomic and environmental performance for seven sustainability initiatives and their respective control groups of conventional coffee growers.
Context
The study took place in the context of decreasing harvests between 2008 and 2012 and historically high prices, including a substantial price differential for Colombian Milds (coffee grown
1. ExEcutIvE Summaryfrom the Colombian Coffea Arabica tree) compared with its main substitutes on the market. Coffee authorities, with the support of national government and several donors, took policy actions to help producers increase output to the levels seen at the beginning of the century. These policies influenced both certified and control group farmers.
Evidence from field interviews and other sources suggests that the UTZ farmers in this sample tend to be larger and more advanced in terms of training, yield and adoption of good agricultural practices than average Colombian coffee farmers. This is because these types of farmers were more likely to be encouraged by the extension service of the Colombian Coffee Growers Federation (FNC, by its spanish acronym) or their cooperatives to participate in the certification program.
Methodology
To construct statistical comparison groups and to estimate the impact of the program on social, environmental and economic conditions, Propensity Score Matching (PSM) was implemented in combination with Difference in Difference approach (DID). This allowed for control of selection bias and the influence of independent factors. The quantitative information was complemented by a set of interviews with key stakeholders which provided an insight into the process of implementing the UTZ program.
Key Findings
Adopting the criteria for UTZ Certification led to positive outcomes for farmers. They scored significantly better on key socioeconomic and environmental indicators than conventional producers and in the aggregate indexes used to measure the overall impact on the social, environmental and economic dimensions of sustainability. The study also looked at changes in producers’ perceptions of their socioeconomic situation, with UTZ certified producers found to be more positive and optimistic in comparison to the control group. However these differences could not be wholly attributed to participation in the UTZ program.
Social Indicators
For the social indicators studied there were mixed results across the three surveys. Statistical analysis shows that UTZ producers outperformed the control group on indicators such
CRECE - 7

as better access to services, availability of first aid kits and use of protective clothing for agrochemical spraying. However, for other types of indicators such as access to medical services, the share of workers with formal labor agreements and access to clean water the study did not find statistically significant differences between certified and non-certified producers. For some indicators, such as the number of workers receiving safety training the performance on UTZ farms, although initially significantly higher, declined over time and was significantly lower than on the control farms by the fourth year.
UTZ certified producers were significantly more positive and optimistic about their quality of life than conventional producers. Their responses showed an upward trend in aspects such as perceived improvement in household quality of life, family health and community relationships.
Environmental Indicators
The analysis of environmental indicators showed statistically significant differences, with UTZ certified farmers outperforming the control group across most indicators. UTZ certified farmers consumed significantly less water in the wet milling process and a higher number of UTZ producers have adopted methods to treat wastewater discharges compared with the producers of the control group. At the farm, despite the upward trend in the number of UTZ certified producers adopting water conservation practices; the differences to control group were not statistically significant.
The studies showed that UTZ certified farmers are adopting Good Agricultural Practices (GAP), more than the control group and making use of available technology for on-farm production and post-production processes. This includes a significantly higher number of trees per hectare on UTZ farms; significantly lower average age of coffee trees, higher levels of fertilization, and a higher share of producers applying fertilizers based on technical recommendation. UTZ producers also have significantly lower levels of coffee Berry Borer infestation and leaf rust infection. Certified farmers were shown to have received more training in GAP (number of hours per year) than the control group, although the number of training hours is going down over time, and were more likely to keep records compared with control producers.
Economic Indicators
UTZ producers´ net income per kilogram was found to be significantly higher compared to the control group while the cost per kilogram for UTZ producers was lower compared to the control group, mainly due to higher yields. Higher gross margins per unit produced are explained mainly by higher productivity rather than higher farm gate prices. Across all three surveys UTZ producers consistently reached a statistically significant higher yield.
Overall, despite the positive outcomes identified in the research, the improvement in working conditions was lower than expected. In particular, a lower number of farmers than expected achieved UTZ requirements in areas such as safety training for workers, training in handling agrochemicals and use of written contracts for permanent workers.
The study identified that an increased share of the harvest is now sold as certified, either as UTZ or other standards, as there is a trend to get several certifications at the same time. This could be a result of the fact that only a proportion of the coffee produced can be sold as UTZ Certified. Although this strategy of multi-certification represents an opportunity for farmers to diversify their market, it could also potentially reduce the incentive for them to stay in the UTZ program. In terms of resilience to shocks, the decreased production of cash crops other than coffee by target farmers could potentially increase the households’ economic dependency on coffee. At the same time, in favor of households’ resilience, the beginning of a trend towards increased production of food staples by certified coffee farmers was observed, which could help to improve food security for farming households.
This document is structured into five sections. The first and second sections include the executive summary and introduction. The third section describes the methodology, including the sampling strategy, surveys and evaluation approach. The fourth section describes and discusses the results of the impact evaluation. Finally, the fifth section states the main conclusions.
8 - Monitoring and Evaluation of UTZ Certified Sustainability Coffee Program in Colombia

2. IntroductIon2.1. About this Report
The main aim of this study is to understand the outcomes of UTZ certification in Colombia in reference to the objectives of the program as described in the Evaluation Framework, the Theory of Change and the key program indicators. It is focused on the performance of UTZ Certified coffee farmers during the harvest seasons of 2008, 2009 and 2011 and assesses the impact of the implementation of the program on the social, environmental and economic performance of the producers. The research questions looked at in the study were:
y What are the outcomes and impacts of UTZ intervention at farm level?
y What are the socioeconomic characteristics of UTZ farmers?
y What factors influenced the implementation of the UTZ program?
y What indicators related to the UTZ program show the most relevant or significant changes?
y Which of the program requirements are most effective at influencing farmer performance?
y What sustainability benefits were generated by the program in the period studied?
y Which of the expected changes have not yet been achieved?
Despite steps taken to ensure good data quality and comparability, there are a number of factors that could influence the study results. During program implementation, the Colombian Coffee Growers Federation (FNC by its spanish acronym) and local cooperatives invited the larger and better-trained farmers to participate. This was taken into account when selecting the control group. So although farm sizes within the sample are larger than the average Colombian farm, they are comparable between the target and control groups (see figure 4).
Participants in the UTZ program are self-selected and join voluntarily which means there could potentially be unobservable differences between the target and control groups. To address potential selection bias, Propensity Score Matching was used to ensure that target group farmers are matched with their ‘closest neighbor’ (the control farmer that is most similar). The farmers were matched based on their yield per hectare (see appendix 2).
Producers in the target and control groups (described in section 4.1) are similar in statistical terms in relation to their experience in coffee production, type of land ownership, residence of the farmer owner at the farm, family labor and children’s attendance at school. However, some significant observable differences in socioeconomic characteristics persist between the two groups despite the use of Propensity Score Matching. These differences favor target farmers in a number of aspects, including belonging to a Producers’ Organization (an UTZ entry condition), average age of the farmers and level of education. Target farmers also have more family members on average and more of their income is provided by their coffee crop.
Propensity Score Matching combined with Difference in Differences procedures were used to estimate the program impact. Graphs include a projection line which shows the trajectory the target group would have had if it had maintained its initial difference to the control group. When a graph shows the target group has gone over the projection line this indicates a program impact over time. If the performance of the target group is under the line it indicates there has been no effect or a negative effect. Therefore, the difference between the target percentage and the projection represents the net effect of the program: the situation compared to if they had not joined UTZ.
Many coffee farmers in Colombia have participated in support programs before becoming UTZ Certified or have adopted other certifications alongside UTZ. This makes it challenging to assess the impact of UTZ certification in isolation and means changes in performance may be affected by other interventions.
2.2. Coffee Production in Colombia
In Colombia, coffee is cultivated in an area of around 900,000 hectares and the coffee-growing zone is spread over 3,600,000 hectares across the country. There are 18 coffee-growing states (departments) with over 560 coffee-growing municipalities (half of the country’s total) and over 2,000,000 people’s livelihoods depend on coffee production. Revenue from coffee has been a major influence in fostering regional development and the creation of economic and social infrastructure (Reina, Silva et al. 2007). Around 88% of the coffee area is planted with improved varieties cultivated using technically advanced production systems. The remaining 12% is planted with unimproved varieties cultivated using traditional practices.
CRECE - 9

Depending on the region, coffee is harvested throughout the year, with the main harvest between October and December and a secondary harvest – the mitaca – between April and May. In some regions the principal crop is harvested between April and May and the secondary crop between October and December, thus allowing a more even flow of fresh coffee. After harvesting, the coffee is prepared by the wet processing method.
Small farms (five or less hectares) predominate in Colombia, representing 79% of coffee farms in the country. Small coffee producers own just 26.9% of land, while they own 50.7% of the area planted in coffee (see Figure 1). In most small farms family members are the primary source of labor.
There is a clear dependence on coffee earnings, with around 70% of these households’ income derived from coffee (García and Ramírez 2002, García, Ochoa et al. 2013a). The remaining propor-tion of income comes from other agricultural activities, wage labor at bigger farms and rural non-farm incomes.
Colombia’s average annual coffee production during the last ten years was around 11 million bags of 60 kg. However, between 2008 and 2012 a number of factors severely affected the harvest and drove coffee production to its lowest levels since the 1970s. In comparison to 2007, the rate of production declined each year with a 9% drop in 2008 and a 39% drop in 2012, meaning the number of bags produced fell from 12.6 million bags in 2007 to 8 million bags in 2012 (FNC 2011a, FNC 2011b). The main causes of this decrease were: the severe climatic conditions created by the El Niño and La Niña weather phenomena, including a long period of strong rainfall that affected coffee flowering and coffee formation; extremely high fertilizer prices in 2007 and 2008 that discouraged growers from applying fertilizers; the recurrence of Coffee Berry Borer (CBB) infestation; and a severe outbreak of coffee rust. The volume of production was also affected by the continuation of the coffee tree renewal program, which took 70,000 hectares out of production and is aimed at pushing Colombia´s output to some 17 million bags by the 2014–2015 season.
This sharp reduction in the Colombian crop caused historically high coffee prices during 2010 and 2011, the highest since 1997, and created a widening of the differences between the indica-tor prices of Colombian Milds and other milds – the main sub-stitutes for Colombian Milds in the coffee market. Local market producers saw farm gate prices reach historic highs of around
COP 5,886 per kg of green coffee in 2011 while the share of the price premium taken by specialty coffees decreased. This rise in coffee prices that began in 2002 came to an end in mid-2011. Since May 2011 coffee prices have been in continuous decline, reaching a five-year low in December 2013 (see Figure 2).
Colombian coffee authorities, with the support of national government, implemented a number of policy measures at the end of 2009 aimed at increasing output and regaining previous average production levels of 11 and 12 million 60 kg bags (FNC 2011a, FNC 2011b, FNC 2012, FNC 2013). The measures included: (a) providing producers with free supplies for performing renovation such as chemical fertilizers, fungicides, seeds from resistant varieties, bags and seedlings; (b) extending access to credit for small farmers to enable them to buy inputs during periods of adverse weather, as well as offering opportunities for refinancing previous debts; (c) a price subsidy program that allows producers to register a portion of their expected coffee production, protecting them at harvest time against a fall in coffee parchment prices below COP 5,200 per kilo; (d) implementing flexible quality standards for Coffee Berry Borer levels over 5% for standard and 3% for specialty coffees; and (e) hedging against falling coffee prices using coffee futures.
Source: FNC - SICA 2012
Size Distribution of Co�ee Farmsin Colombia (% of Total Farms)Figure 1
49.8% ≥1 & 5 ha
29.4% <1 ha
9.6%≥10 ha
11.2%≥5 & 10 ha
10 - Monitoring and Evaluation of UTZ Certified Sustainability Coffee Program in Colombia

These policy actions were supported by unprecedented levels of in-kind aid, training and technical assistance (Castro, Ochoa et al. 2009, ACDI/VOCA 2009, Yamashita 2010, García 2014) funded by public–private partnerships between FNC and NGOs, multilateral donors, local governments and aid agencies. Some of these resources were designed by donors to increase the participation of coffee producers in certification and verification programs. Significant amounts were invested in improving producers’ capabilities, farm infrastructure for coffee production and coffee tree renovation.
2.3. The UTZ Theory of Change
During the last few years UTZ Certified has developed their “Theory of Change”, a framework that enables them to monitor and evaluate the expected outcomes of the UTZ program and any unintended positive or negative impacts. The framework also enables those stakeholders who are part of the coffee value chain to get a better understanding of the desired outcomes and impacts of compliance with UTZ standards, and to recognize which activities, actions and resources are needed
CRECE - 11
14
12
10
8
6
4
2
0
7.000
6.000
5.000
4.000
3.000
2.000
1.000
02005
11.1
2,7583,971
5,886
Farm gate priceCOP/kg
Colombia’s production(millions bags)
2,692
12.6
10.9
2006 2007 2008 2009 2010 2011 2012 2013
Figure 2 Colombia´s Harvest (Million Bags of 60 Kg) and Farm Gate Prices (COP/kg) 2005 - 2013
COP/
kg
Mill
ions
of b
ags
of 6
0kg
Colombia’s production (millions bags)Farm gate price (COP/kg)
Source: FNC statisticsAverage exchange rate (COP/USD)for the period was 2,032.09.Source: www.super�nanciera.gov.co

to achieve those outcomes and impacts (Crosse, Newsom et al. 2012, Newsom, Kennedy et al. 2012).
The ultimate goal for all participants in the UTZ program is “making sustainable farming the norm” (UTZ Certified 2014b: 10): “UTZ certification requires farmers to use better farming methods, to improve working conditions, to take better care of the environment and next generations. In this way the UTZ program contributes to farmers growing better crops, and generating a better income, which increases their resilience to shocks while safeguarding the earth’s natural resources for the future”. The UTZ Monitoring and Evaluation program identified three areas of impact: i) long-term viability of the sector (profit); ii) improved livelihoods for farmers, workers and their families (people); and iii) safeguarding the natural resources of the planet (planet).
Within these broad areas of impact, UTZ has grouped the expected outcomes into long-term impacts and short and medium-term outcomes. The long-term impacts in each one of the three categories (people, planet, profit) are the result of a series of medium-term outcomes which are measured through different single and combined indicators. These are designed to track and assess impacts on living conditions, producers’ livelihoods and labor conditions, producer profitability, business opportunities, community relations and environmental conditions. The simplified version of the UTZ Theory of Change presented in the figure below represents the expected progression from activities to impacts across the social, environmental and economic indicators.
The indicators are grouped in three levels. Level 1 indicators mainly measure the immediate results of activities and the investment of resources necessary to achieve changes in knowledge, skills and attitudes. The monitoring of level 1 indicators provides an insight into the practices and characteristics of certificate holders, supply and demand developments and the reach and inclusiveness of the program. It allows for monitoring trends and signaling issues.
The level 2 indicators focus on the short- and medium-term results of behavioral changes among coffee growers as a result of the UTZ program. The main purpose of level 2 indicators is to implement focused studies in different contexts to answer key questions about what is working, how and why for the purpose of learning and improvement.
Level 3 indicators assess how the UTZ program contributes to each one of the three areas of impact and associated sustainability goals at farm level. These indicators are designed to provide an insight into the contribution of UTZ in the defined impact areas, and are therefore used for in-depth impact studies (quantitative and qualitative) that compare certified and uncertified coffee growers (UTZ Certified 2014a, UTZ Certified 2014b). The present study is focused on level 3 indicators.
At farm level, the requirements of the program can be grouped into the categories of Better Farming Methods, Better Working Conditions, Better Care for Nature and Better Care for Next Generations. As demonstrated in the Theory of Change, it is expected that these requirements will result in Better Crops in UTZ farms, Better Income for Farmers, Better Environment and Better Quality of Life.
2.4. Implementation of the UTZ Program in Colombia
The implementation of the UTZ program (formerly known as Utz Kapeh) started in Colombia in 2002 with the support of many different stakeholders. It was promoted as a private initiative by Expocafé, the coffee growers’ cooperatives’ exporting company. The code of conduct was initially implemented at one farm in the Caldas department. In 2004 another exporter – Máximo – expressed interest in developing its own supply of UTZ Certified coffee in the same region. Local exporters such as FNC and Lucero Café S.A. promoted certification at farm level in new regions such as Huila and Cundinamarca, and the central regions of Antioquia, Risaralda, Quindío and Valle.
12 - Monitoring and Evaluation of UTZ Certified Sustainability Coffee Program in Colombia
In 2006 the Coocentral Cooperative started the process of certifying 60 farms in the Huila department. At the same time, the Fast Movers Project began to work with coffee producer groups in Antioquia, Caldas, Risaralda and Valle. This process was carried out with Solidaridad, the strategic partner to UTZ in the implementation of field activities for certification. Since then, there has been steady growth in the implementation of the UTZ Certified code of conduct in Colombia. The volume of sales of UTZ certified coffee grew from 42 metric tons in 2003 to 9,218 metric tons in 2012, with a peak of 12,352 metric tons in 2008 (UTZ Certified 2008, de Groot 2013, UTZ Certified 2014b).
A number of different organizations supported UTZ coffee producers to meet the competitive requirements of the code of conduct. These included donors such as the cooperatives of coffee growers, departmental committees of coffee growers, FNC, SENA (the National Learning Service), development agencies (Solidaridad, USAID and its operators in Colombia ACDI/VOCA), national and local governments, producers’ associations and export companies.
The support of these organizations, including the provision of training, equipment, technical assistance and funding to cover certification costs, enabled producers to undergo the certification process. Donors have also subsidized the cost of certification, including one-off and recurring costs of compliance, the cost of independent inspections and certification, the cost of acquiring technical know-how, managerial skills and knowledge about the certification process and its requirements, and expenses associated with recertification. In addition, donors have given help in-kind to support improvements to production systems and investment in production facilities and infrastructure. In many cases, donors have subsidized the cost of technical assistance.
A training strategy was implemented in 2006 by the UTZ program and Solidaridad. Both organizations provided financial resources and content for an e-learning initiative designed to build capacity for certification. More than 400 officials
in the FNC’s extension service took the courses, which also included printed material, between 2007 and 2009. Topics covered included guidance on Good Agricultural Practices and the implementation of the UTZ Certified requirements and internal control systems. Since 2009, the process of training both trainers and coffee growers has been supported mainly by buyers (cooperatives and exporters), local governments and multilateral organizations.
From interviews with representatives from cooperatives and departmental committees we know that producers who were more advanced in terms of training and GAP adoption were the ones initially invited to achieve certification. When the program was first implemented in the Caldas department, stakeholders prioritized big farms for their potential to provide a consistent supply of coffee, and because they had already implemented good management practices. During implementation in the Huila department, where farmers are mostly smallholders, some smaller farms were explicitly selected by the Cooperatives that implemented the program. However, medium-sized and large farms were involved as well to guarantee a consistent supply of coffee.
In the group of farmers studied in this research, contextual factors are likely to have influenced the outcomes and impact of implementing the UTZ standard. In particular, more advanced producers, including those who had already undergone training on GAP, were more likely to participate in the UTZ program. In addition, producers in both the control and target group receive ongoing support from FNC and other organizations working in Colombia. Therefore, we cannot attribute all medium- and long-term changes identified in this research to certification.
CRECE - 13

Figure 3 The UTZ Theory of Change

3. mEtHodologyThe data sets for this study come from a broader piece of research1 which has been developed in Colombia since 2008 in collaboration with COSA2. The broader research has been conducted as a monitoring and evaluation (M&E) study in annual phases, gathering information directly from a sample of 3,372 small and medium-sized coffee farmers in five coffee-growing departments. Additional information is obtained from focus groups with farmers and interviews with sustainability supply chain actors. Its main purpose is to monitor and assess the results of certification and verification programs. The sample covers producers in four certification schemes (Fair Trade, Organic, Rainforest Alliance and UTZ Certified), three verification programs (Nespresso AAA, 4C and Starbuck’s C.A.F.E. Practices) and their respective control groups made up of conventional coffee farmers.
Sample
The target population for the original sample was made up of coffee growers who in 2008 were about to start participating in one of the seven sustainability initiatives in five Colombian regions, according to FNC’s records. The regions in the sample (Caldas, Cauca, Huila, Nariño and Santander departments) represent more than 60% of certified farmers in the country. A list of more than 20,000 coffee farms from the FNC’s Coffee Information System served as the sampling frame. All these farms were candidates to be involved in certification programs according to the records of FNC’s Departmental Coffee Growers Committees. Producers in the comparison groups were randomly selected from official FNC records in neighboring municipalities. These farmers were not willing to participate in certification initiatives but are comparable as they are eligible to receive technical assistance from the organization.
The database of UTZ program farmers is a subsample of the CRECE-COSA study, focused on the Caldas and Huila departments. In 2008 the sample was composed of 278 target (farmers that were about to be UTZ Certified) and 579 conventional coffee growers that were not applying for certification. The same farmers were surveyed in 2009 and
1 · The study is funded by the Colombian Coffee Growers Federation, Nestlé - Nespresso S.A, USAID - ACDI / VOCA and CRECE.2 · The Committee on Sustainability Assessment (COSA) is a neutral global consortium whose mission is to accelerate sustainability in agriculture via partnerships and assessment tools that advance the understanding of social, economic, and environmental impacts. COSA advises and works together with important institutions and world-leading companies to accelerate the use of sound metrics and the eff ective management of sustainability efforts.
2011. As some producers made the decision not to renew their UTZ certification, in 2011 the sample size was smaller, with 220 UTZ coffee growers. This 2011 sample is distributed across 32 municipalities in three of the main specialty coffee growing regions in the country: Caldas (30 farmers), Huila (127) and Santander (63) departments.
During field visits to interview representatives of the organizations who helped implement the UTZ program, it was found that no specific interventions (such as training on the UTZ code) were used in the Santander region. The Santander producers were also participating in other sustainability initiatives and the quantitative information showed that no producers in this region sold coffee as UTZ certified during the period of analysis. For these reasons the Santander observations were removed from the analysis. The number of useful and comparable observations was also reduced after the implementation of Propensity Score Matching (PSM), as is noted below. The overall effect of these changes was that the UTZ Certified sample was reduced from 278 to 220 in 2009 and to 125 in 2011 (see Appendix 2).
Survey
The questionnaire is structured into four modules, each with a number of sections and tables: (i) Module A covers characteris-tics of the farmer and the farm; (ii) Module B covers the econom-ic dimension, including information on production costs, farm assets, market access, credit access, premiums, and income from coffee, among others; (iii) Module C covers the social dimension, including household composition, household assets, education, training, medical attention and worker conditions; (iv) Module D covers the environmental dimension, including environmental practices related to water and soil conservation, the handling of agrochemicals and fertilizers, the reuse of waste and the prac-tice of using shade trees. Module D also enables direct observa-tions of some environmental practices, such as those associated with soil conservation, and to measure coffee plants and shade trees to estimate carbon sequestration.
16 - Monitoring and Evaluation of UTZ Certified Sustainability Coffee Program in Colombia
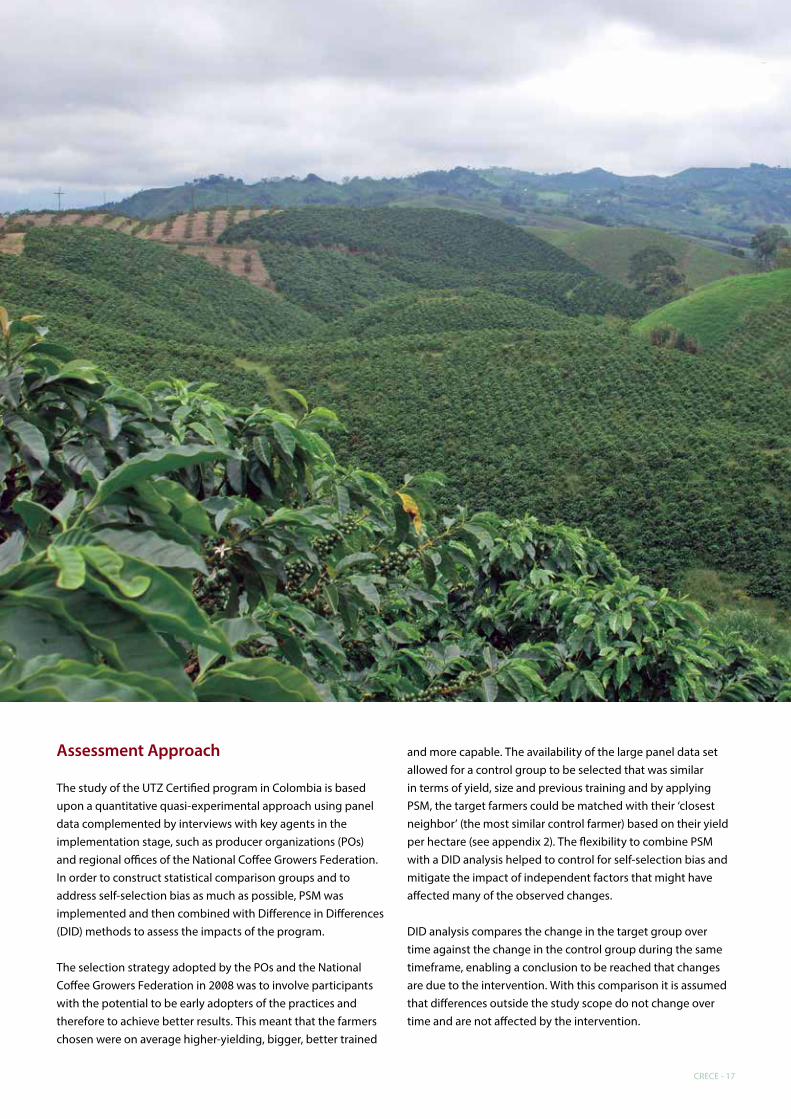
Assessment Approach
The study of the UTZ Certified program in Colombia is based upon a quantitative quasi-experimental approach using panel data complemented by interviews with key agents in the implementation stage, such as producer organizations (POs) and regional offices of the National Coffee Growers Federation. In order to construct statistical comparison groups and to address self-selection bias as much as possible, PSM was implemented and then combined with Difference in Differences (DID) methods to assess the impacts of the program.
The selection strategy adopted by the POs and the National Coffee Growers Federation in 2008 was to involve participants with the potential to be early adopters of the practices and therefore to achieve better results. This meant that the farmers chosen were on average higher-yielding, bigger, better trained
and more capable. The availability of the large panel data set allowed for a control group to be selected that was similar in terms of yield, size and previous training and by applying PSM, the target farmers could be matched with their ‘closest neighbor’ (the most similar control farmer) based on their yield per hectare (see appendix 2). The flexibility to combine PSM with a DID analysis helped to control for self-selection bias and mitigate the impact of independent factors that might have affected many of the observed changes.
DID analysis compares the change in the target group over time against the change in the control group during the same timeframe, enabling a conclusion to be reached that changes are due to the intervention. With this comparison it is assumed that differences outside the study scope do not change over time and are not affected by the intervention.
CRECE - 17

4. fIndIngSThe results are presented in line with the UTZ program’s Theory of Change. After describing the characteristics of the producers at the start of the study based on PSM analysis, the performance of farmers in line with UTZ requirements is discussed and the possible contributions of the program to improving crops, income, the environment and quality of life are estimated.
4.1. Socioeconomic Characteristics of the UTZ Certified Farmers
UTZ Certified producers in the sample are on average middle-aged, with many years’ experience in coffee production, but have a relatively low level of education and use their families to work on their farm.
Most of the households’ earnings come from the coffee crop. The producers are not commonly employed in rural non-farm activities or other types of agricultural labor. Target producers are significantly more dependent on coffee earnings than the control group of producers: on average 85% of the UTZ farmers income comes from coffee versus 71% of the control farmers. By the third observation, 86.4% of their income came from coffee, compared to 61.1% for the control producers, showing that while UTZ
producers maintained their dependency rate on coffee income compared with the baseline (from 84.5% to 86.4%), the control group reduced its dependency (from 70.7% to 61.1%).
Medium-size and large farms predominate in the UTZ program in Caldas and Huila sample, unlike the average in the country, which is made up of mainly small and medium-sized farms (see section 2.4). In the sample, 49.1% of UTZ Certified farmers own farms of more than five hectares (which is similar to the control group) compared with 20.7% in the Colombian coffee sector overall. Farms of less than one hectare in Colombia represent 29.4%, while for UTZ farms this is just 6.4% (see Figure 4).
Target farms in the sample have 6.4 hectares on average (5.7 ha. for the control group) with coffee plots of 4.1 hectares (2.8 ha. for the control group). The share of the farm dedicated to coffee is 64.1% for target farmers and 50% for control farmers. This means target farmers are more specialized in the production of coffee than control farmers and therefore have lower levels of cash crop diversification. A slightly higher share of target farms is shrubland and forest (18% compared to 14% for control farmers), and a lower share is dedicated to pasture or other crops such as sugar cane, cocoa, bananas and plantain.
Table 1 Characteristics of the Producers
Producer’s age (years)
Producer’s experience (years)
Producer belongs to group (%)
Land owners (%)
Producers living at the farm (%)
Years of education of the producer (years)
Illiteracy (%)
Number of family members
Family members working on the farm
Children (between 6 and 16 years) attending school (%)
Male producers (%)
Co�ee’s share in income (%)
48
28
80%
95%
35%
4.9
6%
4.9
56%
69%
87%
85%
51
30
9%
96%
59%
4.5
18%
3.8
60%
61%
80%
71%
Indicators
**
***
**
***
***
*
***
SigControlTarget
* Signi�cant at 10%, ** Signi�cant at 5% and *** Signi�cant at 1%.
18 - Monitoring and Evaluation of UTZ Certified Sustainability Coffee Program in Colombia

Percentage of Farms by Size
6,4% 44,5% 34,5% 14,5%
6,5% 50,8% 25,0% 17,7%
Figure 4
Target
Control
≥1 & <5 ha<1 ha
≥10 ha≥5 & 10 ha
Farm Area Dedicated to Di�erentTypes of Land Use (Average)
64% 19% 11% 6%
50% 14% 27% 9%
Figure 5
Target
Control
Shrubland and forestCo�ee area
Other cropsPasture area
The higher and increasing specialization rate (the ratio between coffee-growing area and farm size) could suggest that UTZ coffee growers have become more dependent on coffee earnings. However, the trend for both groups over time suggests that the specialization in coffee production is not a result of participation in the program.
The projection line in the graph shows the trajectory that the target group would have had if it had maintained the initial difference from the control group. The difference between the performance of the target group and the projection represents the net effect of the program. Any increase above this line sug-gests a positive program effect over time and if performance is below the line it indicates there has been no effect or a negative effect. Although there is a difference between the target rate of specialization and the projection line, this is too small to be statistically relevant. This means the growing specialization in coffee cannot be attributed to the program.
4.2. Performance of UTZ Certified Farmers
At farm level, the requirements from the program are summed up in the categories Better Farming Methods, Better Working Condi-tions, Better Care for Nature and Better Care for Next Generations.
4.2.1. Farm Management
In achieving better farming methods, the program looks for the implementation of a number of practices in transparent group management, professional farm management, and the implementation of GAP.
Transparency of Group Management
Most of the producers participating in UTZ certification (target producers) belong to a producers organization (PO), which is a condition of certification in Colombia. Over 95% of target producers (compared to 80% at the baseline) reported being associated with a PO compared with 10% of non-participants. A CRECE-COSA study of seven certification and verification programs in the Colombian coffee sector found that around 70% of participant producers reported belonging to a PO compared to around 20% of non-participants.
All farmers responding to the survey stated that the leaders and members of POs were elected by vote. The number of farmers perceiving POs to be transparent on how prices are fixed increased over time. At the baseline 25% of farmers in the target group thought that the way prices were fixed was transparent. This figure had increased to 60% by the second year and reached 92% by the fourth year. Among control farmers the percentage remained static at 30%.
Change in Co�ee Specialization over Time(Co�ee Area as % of Total Farm Area)Figure 6
* Signi�cant at 10%, ** Signi�cant at 5% and *** Signi�cant at 1%.
ControlTarget Projection
Year 1 Year 2 Year 3
59.9% 64.0%
61.4%52.5%
63.9%
47.8%
64.2%
49.8%
CRECE - 19

Professional Farm Management
The indicator on record keeping was used as a proxy for measuring the adoption of professional farm management practices. As can be observed in Figure 7, this has increased over time, reflecting the adoption of certification standards. However, by the fourth year levels had fallen among some farmers. This could be linked to the reduction in training hours that is discussed in the section on working conditions.
The practice of keeping records was already high at the base-line, because some of the target producers were participating in other institutional initiatives (run by FNC and others) before the UTZ program. But the practice was given a significant boost by the UTZ program and record keeping among by farmers had risen significantly by the second year, increasing from 40.9% to 62.7%, although it then declined by the fourth year to 50%. De-spite this, the percentage of farmers keeping records increased from 40% to 50%, maintaining the initial difference vis-à-vis the control group by the fourth survey. On the control group side, the farmers also reported an increase in rate of record keeping (rising from 6.2% to 14.6%), probably as a result of their partici-pation in FNC programs on farm management.
last observation (using PSM+DDD), with record keeping efforts among the target farmers dropping off.
Good Agricultural Practices
Adoption of Good Agricultural Practices (GAP) has resulted in a better use of the technology available. This includes rust-resistant varieties of trees, higher tree densities per hectare, a lower average age of the coffee trees and higher levels of fertilization. Additionally, UTZ Certified producers have received more training in GAP (taking the number of hours per year) in order to provide them with the skills and capacities needed to increase their competitiveness.
Coffee trees have been renovated, with rust-resistant varieties being planted at an increasing rate. The percentage of farms with rust-resistant varieties increased from 35.8% to 51.6% over the four years3. Despite this considerable increase, improvements in the control group grew at a higher rate, almost matching the target group in the fourth year, because of the tree renewal program set up by the FNC and supported by the national government. To maintain the initial difference, the target group would have had to reach at least 60% (see projection in Figure 8) with rust-resistant varieties, so no effect can be attributed to the program on the adoption of rust-resistant varieties. This finding is consistent with the fact that the adoption of resistant varieties is a general recommendation for the coffee sector in the country, and so is increasingly adopted by target and control farmers without any distinction between the two groups.
3 · Most of the coffee producers who have renewed their old trees with resistant varieties have received subsidies and chemical fertilizers. As part of the renewal program, the FNC, with the support of the national government, has provided chemical fertilizers; in addition, more than 180,000 coffee producers have received fungicides and rust-resistant trees free of charge (FNC 2012, 2013).
So the double difference (Propensity Score Matching (PSM) plus Double Difference (DD)) showed a positive significant effect of the program by the second year, with an increase of 22.9% in record keeping among the target farmers (57.6% more than the control group), However, the effect had disappeared by the
Percentage of Producers Keeping RecordsFigure 7
Year 1 Year 2 Year 4
39.8%*** 49.3%
40.9%
6.2%
62.7%
5.1%
50%
14.6%
* Signi�cant at 10%, ** Signi�cant at 5% and *** Signi�cant at 1%.
ControlTarget Projection
Percentage of Farms with ResistantVarieties to Rust InfectionFigure 8
Year 1 Year 2 Year 4
37.8%
60.7%***
35.8% 36.6%51.6% 47.7%
22.8% 24.8%
* Signi�cant at 10%, ** Signi�cant at 5% and *** Signi�cant at 1%.
ControlTarget Projection
20 - Monitoring and Evaluation of UTZ Certified Sustainability Coffee Program in Colombia
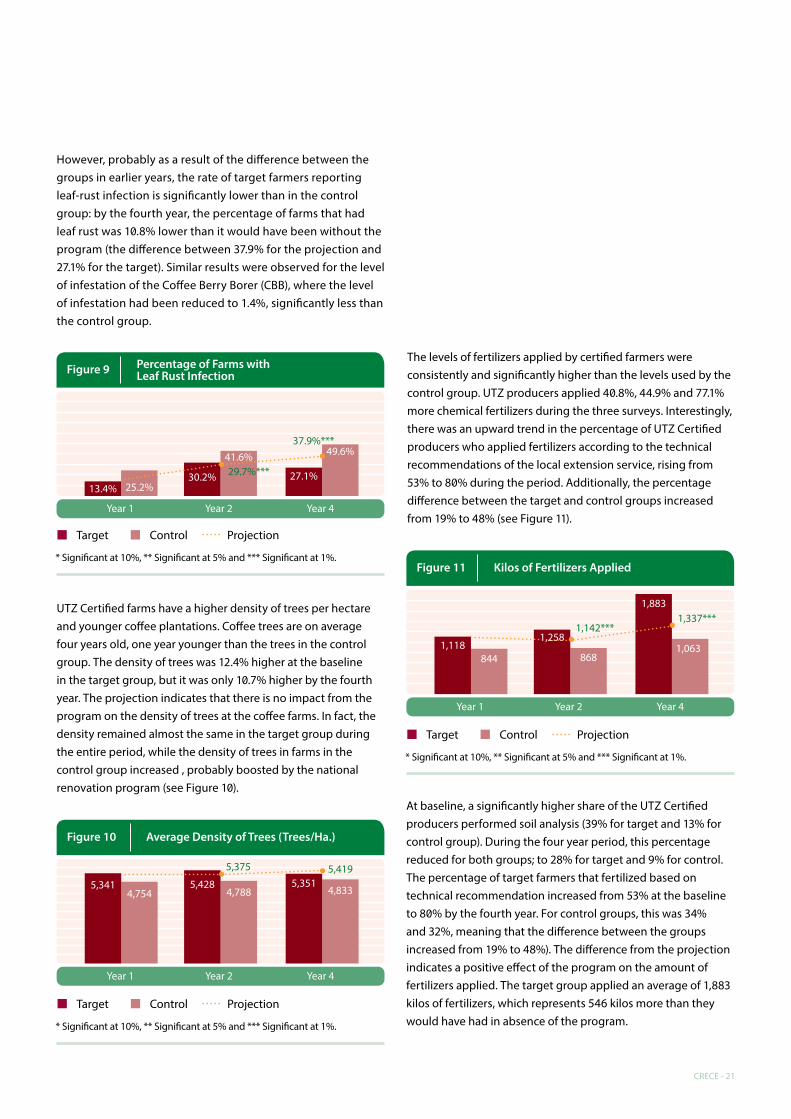
However, probably as a result of the difference between the groups in earlier years, the rate of target farmers reporting leaf-rust infection is significantly lower than in the control group: by the fourth year, the percentage of farms that had leaf rust was 10.8% lower than it would have been without the program (the difference between 37.9% for the projection and 27.1% for the target). Similar results were observed for the level of infestation of the Coffee Berry Borer (CBB), where the level of infestation had been reduced to 1.4%, significantly less than the control group.
At baseline, a significantly higher share of the UTZ Certified producers performed soil analysis (39% for target and 13% for control group). During the four year period, this percentage reduced for both groups; to 28% for target and 9% for control. The percentage of target farmers that fertilized based on technical recommendation increased from 53% at the baseline to 80% by the fourth year. For control groups, this was 34% and 32%, meaning that the difference between the groups increased from 19% to 48%). The difference from the projection indicates a positive effect of the program on the amount of fertilizers applied. The target group applied an average of 1,883 kilos of fertilizers, which represents 546 kilos more than they would have had in absence of the program.
UTZ Certified farms have a higher density of trees per hectare and younger coffee plantations. Coffee trees are on average four years old, one year younger than the trees in the control group. The density of trees was 12.4% higher at the baseline in the target group, but it was only 10.7% higher by the fourth year. The projection indicates that there is no impact from the program on the density of trees at the coffee farms. In fact, the density remained almost the same in the target group during the entire period, while the density of trees in farms in the control group increased , probably boosted by the national renovation program (see Figure 10).
Percentage of Farms withLeaf Rust InfectionFigure 9
Year 1 Year 2 Year 4
29.7%***
37.9%***
13.4%30.2% 27.1%
49.6%
25.2%
41.6%
* Signi�cant at 10%, ** Signi�cant at 5% and *** Signi�cant at 1%.
ControlTarget Projection
Average Density of Trees (Trees/Ha.)Figure 10
Year 1 Year 2 Year 4
5,375 5,4195,341 5,428 5,351
4,8334,754 4,788
* Signi�cant at 10%, ** Signi�cant at 5% and *** Signi�cant at 1%.
ControlTarget Projection
Kilos of Fertilizers AppliedFigure 11
Year 1 Year 2 Year 4
1,142***1,337***
1,1181,258
1,883
1,063844 868
* Signi�cant at 10%, ** Signi�cant at 5% and *** Signi�cant at 1%.
ControlTarget Projection
The levels of fertilizers applied by certified farmers were consistently and significantly higher than the levels used by the control group. UTZ producers applied 40.8%, 44.9% and 77.1% more chemical fertilizers during the three surveys. Interestingly, there was an upward trend in the percentage of UTZ Certified producers who applied fertilizers according to the technical recommendations of the local extension service, rising from 53% to 80% during the period. Additionally, the percentage difference between the target and control groups increased from 19% to 48% (see Figure 11).
CRECE - 21

4.2.2. Working Conditions
The UTZ requirements on working conditions cover safe working conditions at the farm, the training of producers and workers in good practices and the recognition of workers’ rights. As can be seen in Table 2, performance on working conditions is mixed and the trends cannot be clearly identified, particularly as some elements, such as access to safe water or medical services, are promoted by public policy and are not specific to the coffee sector.
Table 2 Implementation of Good Social Practices
Producers hires workers
Producer o�ers free training
Training in work safety
Training in agrochemical handling
Formal labour contract
First aid kit
Easy access to medical services
Access to clean water
Cooks in a clean place
Gray waters are discharged through pipe
The farm has agrochemical equipment
79.5%
3.6%
-
4.3%
2.5%
11.0%
74.6%
95.5%
98.7%
84.1%
-
***
*
***
**
96.4%
5.7%
-
9.6%
2.8%
28.2%
71.8%
96.2%
97.6%
94.0%
-
95.5%
4.8%
23.8%
33.3%
2.9%
61.0%
69.5%
97.1%
100%
100%
72.5%
73.9%
2.3%
3.3%
10.4%
3.0%
14.1%
65.4%
97.8%
98.5%
90.8%
43.6%
***
***
***
***
**
***
95.5%
2.9%
2.7%
2.7%
5.7%
60.0%
60.0%
99.1%
95.1%
81.5%
81.4%
66.9%
12.6%
12.6%
12.9%
2.1%
16.9%
62.1%
99.2%
81.0%
88.8%
34.8%
Indicators
***
***
***
***
***
***
*
***
SigControlYear 1 Year 2 Year 3
Target SigControlTarget SigControlTarget
* Signi�cant at 10%, ** Signi�cant at 5% and *** Signi�cant at 1%.
Safe Working Conditions
Safety in working conditions was evaluated through several indicators: access to medical attention and a first aid kit in the event of an accident; levels of hygiene at the farm (i.e. access to safe drinking water and cleanliness of cooking facilities); and safety on the job.
Significant differences were found in the availability of first aid kits and protective clothing for agrochemical spraying in farms in the target group, although fewer differences were observed for the other indicators. Training in job safety was carried out by just 23.8% of the farms during the second year and had decreased to 2.7% by the fourth. There were no significant differences between the groups in the indicators which were present at most of the farms (access to medical services, access to safe water, cooking in clean places and availability of sewage systems). The high coverage among both groups is the result of earlier coffee policies supported by official institutions in the coffee sector.
Training
The UTZ Certified program promotes the training of trainers and facilitates farmer training, working in collaboration with NGOs and the private sector. Farmers are trained and are then expected to provide training in turn to their workers, especially in matters of health and safety. When implementation was first launched, the UTZ program included a training strategy but this did not continue over the four years. As a result, significant differences were found in the number of hours of training on Good Agricultural Practices (GAP) per year between the first year and the following years. The difference between the target and control group dropped from 76% at baseline to 27% by the fourth year. The gap between the actual figure and the projection line is considerable. This raises questions about how to ensure that good practices are promoted over time if training is not provided on an ongoing basis.
22 - Monitoring and Evaluation of UTZ Certified Sustainability Coffee Program in Colombia

Although more than 95% of the target group (more than 66% of the control group) employ workers at their farms, no more than five percent provide free training to their workers (see Table 2). Despite this, a significantly higher proportion of the employees at UTZ Certified farms received training in job safety and agrochemical handling in years one and two, rising from 9.6% to 33.3% of workers receiving this training. However the difference had been reversed by the fourth year with just 2.7% of workers receiving training compared with an increase in the control group from 4.3% to 12.6%. A similar trend was observed in training on job safety, although the growing availability of first aid kits reported among target producers is clearly positive.
This decline in the rate of training is not only observed in the UTZ program. In fact, it has been seen as a trend in all the sustainability initiatives studied by CRECE. Training is generally provided by organizations at the start of the certification process but not as a long-term strategy. Even when farmers themselves have the resources to train their own workers many do not do so. For example, farmers with larger holdings of more than 10 hectares are better placed to provide free training but only around 40% do so.
Workers’ Rights
Written labor agreements with permanent workers are one of the requirements of the UTZ program. Nearly 95% of the farmers employ workers and around 30% have permanent employees. But no more than 5% of them provide written contracts. Labor agreements between the UTZ Certified farmers and their workers are usually verbal, and in this respect there are no significant differences to the control group. This
is probably because most farmers in both groups take on temporary workers and because formal written contracts are not in common use in the coffee sector or the agricultural sector more generally. The costs associated with the provision of written contracts (covering health and social security) act as a disincentive.
Traditionally, family members work on the farm and are not always paid for their labor. In difficult times, a household will cease employing outside workers and use unpaid family labor instead. The share of unpaid labor for UTZ Certified producers increased from 30% at the baseline to 55% by the fourth year. Although the survey does not formally investigate the increase in family labor, field interviews indicate that this was a pragmatic response among the farmers to the low coffee prices, higher cost of inputs (mainly fertilizers), higher labor costs and the downward trend in coffee production (see figure 13 on next page).
Hours of TrainingFigure 12
Year 1 Year 2 Year 4
115.5*** 105.5***110
4527
1318 24
* Signi�cant at 10%, ** Signi�cant at 5% and *** Signi�cant at 1%.
ControlTarget Projection
CRECE - 23

4 · Tub tanks have rounded angles and corners in which pulping and transportation of mucilage coffee is performed without using water, requiring nearly five liters of water for milling one kilogram of dry parchment coffee.5 · A pulping machine is used to remove the cherries from the grain. The mucilage is removed by using fermentation tanks and washing tanks.6 · A technology developed by the FNC´s National Coffee Research Center - Cenicafe (by its spanish acronym) to avoid the loss of grain through the milling process and significantly reduce water consumption.
Producers Adopting WaterConservation Practices Figure 14
Year 1 Year 2 Year 4
63.5%***
90.9%
60.5%76.5%
87.7% 90.4%
60.0% 63.0%
* Signi�cant at 10%, ** Signi�cant at 5% and *** Signi�cant at 1%.
ControlTarget Projection
Water Consumption in Wet Milling,Year 4 (Liters/kg of Parchment Co�ee)Figure 15
Target Control
7.9***8.9
* Signi�cant at 10%, ** Signi�cant at 5% and *** Signi�cant at 1%.
Indeed, both groups reduced their share of hired labor during the period of study, showing a negative effect – with figures below the projection line – for the target group, which is potentially an unintended effect of the program.
4.2.3. Environmental Practices
The program’s environmental requirements cover the protection of natural habitats, efficiency in water use, reduced waste and pollution, and the efficient use of energy.
Protection of Natural Habitat
Among 74% of target farmers (65% of the controls) who have water sources at the farm, the proportion of those who have adopted at least one practice to protect water sources increased considerably (+27.2%) during the period of study. As control farmers showed a similar rate of progress (+30%), both groups reached around 90%. As a result, the change reflected a non-significant net effect of the program. It is likely that the influence of environmental programs carried out by FNC is influencing the response of the control group (see figure 14).
All the UTZ Certified farmers who have water sources at their farms had adopted buffer strips as the most common method of water conservation. No related studies are known, but it has been observed that coffee farmers traditionally leave buffer strips around their fields and this is seen in the high levels of control farmers using these strips. A much lower proportion of
Percentage of Paid LaborFigure 13
Year 1 Year 2 Year 4
62.4%***55.1%***69.9%
57.0%45.1%
37.8%
52.5%45.1%
* Signi�cant at 10%, ** Signi�cant at 5% and *** Signi�cant at 1%.
ControlTarget Projection
the target group (2% at the baseline and 7% by the fourth year) has adopted protection of water sources with living fences. Reforestation was carried out only by a small percentage of farmers (16% at the baseline and 3% by the fourth year).
Water Use
Among the technologies available to mill the coffee at the farm, the UTZ farmers mainly use tub-tanks4 (41%) or the conven-tional method of milling5 (38%), while a low proportion use me-chanical mucilage removers (10%), known as Becolsub6. The use of water-saving technologies, some promoted by the program, has led UTZ farmers to consume on average 11% less water during the wet milling process, 7.9 liters/kg of dry parchment, compared to 8.9 by the control group.
24 - Monitoring and Evaluation of UTZ Certified Sustainability Coffee Program in Colombia

Treatment of Wastewater from the Milling Process
A significantly higher proportion of UTZ Certified farmers have adopted methods to treat wastewater (65.1%) after the milling process, compared to the control group (6.0%). The skimmer or decanter system7 is the most frequently employed (48.2%), followed by the Modular System of Anaerobic Treatment SMTA8 (23.2%) and the infiltration field9 (21.4%). This difference might have been influenced by the support of the cooperatives in providing systems for the treatment of wastewater (see figure 16).
Farmers who do not have any water treatment system (34.9%) discharge wastewater directly to the soil or watercourses.
7 · The skimmer system captures and separates solid material from liquids.8 · SMTA technology was designed by Cenicafé to remove organic charges. Other less common methods are oxidation ponds, decanting tanks, biologic filters and the system of mixing residual waters with coffee pulp.9 · Filters made of stone and cooling coils. 10 · These data are available only for 2011.
Disposal of Domestic Wastewater
Most UTZ Certified producers use septic tanks (78.8%) to discharge sewage, as compared to the control group (50.6%). A relatively low proportion of farmers (18%) discharge domestic water to trenches or patios, and only 2.2% discharge domestic water near a body of water or into watercourses. Differences in the use of septic tanks probably arise from programs implemented by the cooperatives (see figure 17).
4.3. UTZ Contribution to Long-Term Sustainability
According to the UTZ Theory of Change, the better practices of farmers, as they meet the requirements of the UTZ program, will result in better crops, better income levels, better environmental conditions and a better standard of life. Due to
Disposal of Domestic Wastewater, Year 4
78.7% 18% 2.2%
50.6% 32.8% 14.3%
Figure 17
Target
Control
Patio, trenchSeptic tank
SewerageRiver, stream, lagoon
Water Filtration System Used inMilling Process. 201110Figure 16
Target Control
65.1%***
6%
* Signi�cant at 10%, ** Signi�cant at 5% and *** Signi�cant at 1%.
48.2% Decanter 23.2%
S.M.T.A
21.4%In�ltration
camp
7.1%Other
the multidimensional nature of each one of these categories, aggregated indexes11 were created to measure the effect of the certification on sustainability. Impact estimations are based on PSM + DD and DDD techniques for each indicator.
CRECE - 25
11 · In order to integrate the indicators representing discrete and continuous variables, the method of Principal Component Analysis (PCA) for categories was used (converting all into categories) to calculate indexes for each one of the social, environmental and economic dimensions. Each index is composed of a list of categorical or converted numerical to categorical variables having a positive scale increasing for positive results, for instance, the variable productivity enters with five categories in the index, going from lower to higher levels. The indexes score from zero, which represents the lowest conditions, to a maximum of one hundred.12 · The method employed to calculate Social, Environmental, Economic and Sustainability indexes is presented in detail in Castellanos, J., García, C.,and Ochoa, G. (2013); and Garcia, C., Ochoa, G., Garcia, J., Castellanos, J, Mora J, (2014).
4.3.1. Social Sustainability
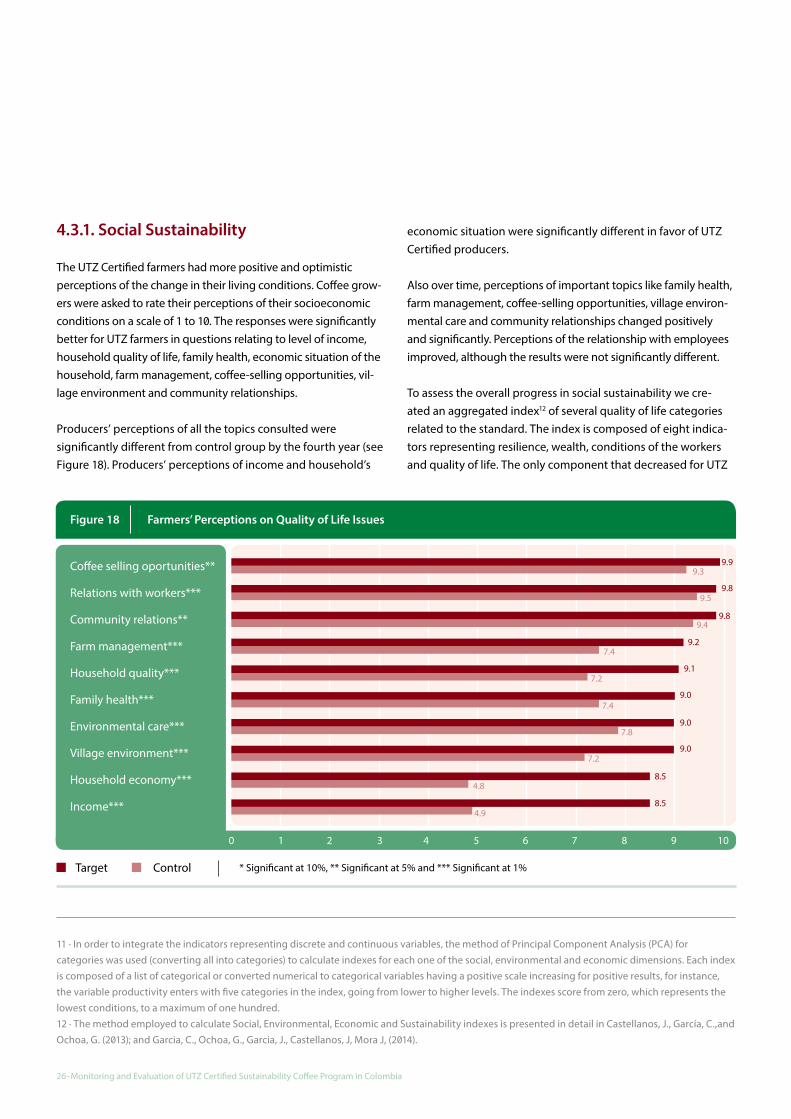
The UTZ Certified farmers had more positive and optimistic perceptions of the change in their living conditions. Coffee grow-ers were asked to rate their perceptions of their socioeconomic conditions on a scale of 1 to 10. The responses were significantly better for UTZ farmers in questions relating to level of income, household quality of life, family health, economic situation of the household, farm management, coffee-selling opportunities, vil-lage environment and community relationships.
Producers’ perceptions of all the topics consulted were significantly different from control group by the fourth year (see Figure 18). Producers’ perceptions of income and household’s
economic situation were significantly different in favor of UTZ Certified producers.
Also over time, perceptions of important topics like family health, farm management, coffee-selling opportunities, village environ-mental care and community relationships changed positively and significantly. Perceptions of the relationship with employees improved, although the results were not significantly different.
To assess the overall progress in social sustainability we cre-ated an aggregated index12 of several quality of life categories related to the standard. The index is composed of eight indica-tors representing resilience, wealth, conditions of the workers and quality of life. The only component that decreased for UTZ
Figure 18 Farmers’ Perceptions on Quality of Life Issues
Co�ee selling oportunities**
Relations with workers***
Community relations**
Farm management***
Household quality***
Family health***
Environmental care***
Village environment***
Household economy***
Income***
0 1 2 3 4 5 6 7 8 9 10
9.9
9.8
9.8
9.3
9.5
9.4
9.27.4
7.2
7.4
7.8
7.2
4.8
4.9
9.1
9.0
9.0
9.0
8.5
8.5
* Signi�cant at 10%, ** Signi�cant at 5% and *** Signi�cant at 1%Target Control
26 - Monitoring and Evaluation of UTZ Certified Sustainability Coffee Program in Colombia

4.3.2. Environmental Sustainability
The environmental index comprises seven categories representing recycling, soil conservation practices (seven grouped sub-indicators), good practices for agrochemical handling, perceptions of environment care and training on environmental topics.
farmers is revenue from sales of other farm crops which is asso-ciated with resilience as it affects the capacity of the household to respond to adverse economic conditions affecting the coffee crop (see the economic sustainability section).
The social sustainability index shows improvement in the overall social conditions of UTZ farmers, progressing from an initial level of 58 points (out of 100 possible points) to 68.8 points at the end of the fourth year of participating in the program. The trend for the control group remains almost stable during the same period, rising from 49.3 to 52.7 points. As Figure 19 shows, the level of the index exceeded the projection for the second and the fourth year meaning the program had a positive impact on social conditions, +7.5 points higher than would have been achieved in the absence of the program.
Environmental conditions show an upward trend, with a strong increase for the target producers (+30.8 points) and relatively stable behavior for the controls (+4.2 points) between the baseline year and the fourth year. All the component indicators of the index progressed during the period of study, particularly in the implementation of soil conservation practices13.
13 · Soil cover, contour planting, areas of protection, tanks to collect landfill wastewater, pulping with low water use, channels or draining trenches, contour farming and living fences.
Social Sustainability IndexFigure 19
Year 1 Year 2 Year 4
55.0*** 61.3***
58.0 62.568.8
52.749.3 46.4
Farm crop production for family consumption
Revenue from sales of other farm crops
Possession of household assets
Number of protective gear items used by workers
Living conditions of the workers
Occupational safety and health
Perception of the household’s quality of life
Perception of relationships with the employees
Social Index Components and Direction of the Change.Year 1 - Year 4
Note: household assets are television sets, fridge, stove,washing machine, computer, internet access and cell phone
* Signi�cant at 10%, ** Signi�cant at 5% and *** Signi�cant at 1%.
ControlTarget Projection
Environmental Sustainability IndexFigure 20
Year 1 Year 2 Year 4
51.8***47.2***
43.062.5
73.8
45.541.350.4
The farm has recycling program
Soil conservation practices
Positive agrochemical practices
Farm’s environment care perception
Village’s environment care perception
The farm has an Environment Map / Plan
Trained in environment topics
Environmental Index Components and Directionof the Change. Year 1 - Year 4
* Signi�cant at 10%, ** Signi�cant at 5% and *** Signi�cant at 1%.
ControlTarget Projection
CRECE - 27
The implementation of environmental practices led to a positive impact on environmental sustainability. The aggregated index, which stands at 73.8 points in the fourth year, increased by +26.6 points, making a significant difference to the situation that would have prevailed in the absence of the program.
4.3.3. Economic Sustainability
To assess economic sustainability, an economic aggregated index was created, containing 19 indicators. Productivity and profitability were considered in detail as they are explicit in the program’s Theory of Change.
Overall Economic Conditions
The economic sustainability index is composed of categories representing the market (search for new customers, training in marketing and market-related topics, knowledge of pricing), the infestation of the coffee crop by pests and diseases (Coffee Berry Borer and leaf rust), quality of the coffee produced, use of fertilizers, net income, yield and farmers’ perception of economic issues.
The economic conditions represented by the index show the better performance achieved by the target group in indicators such as income and those associated with productivity. Economic conditions are consistently improving over time. The index rose from 53 points at the baseline to 66.4 by the fourth year for the target group while it slightly decreased for the control group, remaining at around 40 points.
The positive trend of the index was driven by the improvement in indicators (arrows pointing up in Figure 21) such as control of crop pests and diseases, practices of fertilization and more
farmers progressing to higher levels of net income as well as an increasing perception of better income, better economic situation, better knowledge of market prices and more business opportunities (see figure 21).
Indicators not contributing to the positive trend were the proportion of farmers performing soil analysis, training in management and traceability, lack of knowledge of coffee prices, the slight increase in the proportion of farmers that sell low-quality coffee and the decrease in the proportion of farms in categories of high yield14. As the next section shows, the trend in yields for the target group was less affected than the control group by the adverse conditions at the time (these are explained in section 2.2).
The trend of the index was above the projection line, indicating that the program had a positive impact on the overall economic sustainability conditions, achieving +9.6 points by the second year and +14.8 points for the last year. Accordingly, economic conditions for the target group are better than they would have been in the absence of the program.
Productivity
Against a background of recent reversals in the coffee sector in Colombia (see section 2.2), productivity decreased during the period of the study, as can be seen from the control group trend in Figure 22. However, the target group’s productivity dropped by only 1% while the control group’s productivity decreased 52%. This dynamic has increased the gap between the groups
14 · The yield indicator is represented in the index by a scale of four categories. The result measures the proportion of farms changing to higher categories.
28 - Monitoring and Evaluation of UTZ Certified Sustainability Coffee Program in Colombia

15 · The price is the relation between total income from coffee sales (gross coffee income) and the volume produced. The calculations take into account the different prices that could be obtained if the coffee sold: (i) as UTZ Certified; (ii) to other certifications; (iii) as conventional; or iv) as low-grade beans.
from +77% in the first year to +219% in the fourth year. As this report has shown, the higher yield achieved by the UTZ Certi-fied farmers is associated with the adoption of GAP. The coffee renovation program has benefited both groups in a similar way, with nearly 20% of the trees replaced every year (see figure 22).
The initial difference in yield between the target and control groups was 523 kilos of green coffee (77%). In the absence of the program, it might be expected that this difference would remain the same in the fourth year. Despite the downward trend in yield for both groups, the target group had increased the difference 1.3 times by the fourth year, showing that the program has had a positive significant effect. Indeed, the target farmers produced 1,153 kilos of green coffee per hectare, which represents 273 kilos more than the projected level (880) if the baseline difference had been maintained.
Economic Sustainability IndexFigure 21
Year 1 Year 2 Year 4
54.6***51.6***
53.8 64.266.4
40.842.9 43.7
Training in marketing topicsTraining in management and traceabilityTolerable CBB infestation (<3%)Tolerable rust infection (<10%)Quality of co�ee (<3% low quality beans)Performing soil analysisFertilization under technical recommendationApplying organic fertilizersKeeping records of fertilizer's applicationIncreasing net incomeIncreasing yieldManaged to �nd new customersKnowledge of market pricesPerception of economic environment
Economic Index Components and Direction of theChange. Year 1 - Year 4
* Signi�cant at 10%, ** Signi�cant at 5% and *** Signi�cant at 1%.
ControlTarget Projection
Yield (Kilos of Green Co�ee per Ha.)Figure 22
Year 1 Year 2 Year 4
1,112***880***
1,2021,419
1,153
361
679586
* Signi�cant at 10%, ** Signi�cant at 5% and *** Signi�cant at 1%.
ControlTarget Projection
Profitability
Profitability is assessed by the difference between price15 per unit and production cost per unit (USD per green kilo). Production costs include hired labor, coffee-picking, milling, the renewal of old trees, management, control of pests, diseases and weeds, and input costs (chemical fertilization as well as pest, disease and weed control). Certification cost is not included as it is usually paid by others such as NGOs, development agencies, government, buyers or producers organizations. Almost all the farmers participating in UTZ certification did not have to pay for the cost of certification.
Production Cost per Kilo (USD / Green Kilo)Figure 23
Year 1 Year 2 Year 4
1.54
2.04
1.531.46
1.722.10
1.60 1.60
* Signi�cant at 10%, ** Signi�cant at 5% and *** Signi�cant at 1%.
ControlTarget Projection
CRECE - 29

The target group has lower production costs per kilogram than the control group, which is mainly an effect of higher yields. Because the difference in yield between the target and control groups increased over time, the equivalent cash cost of producing one kilo of UTZ coffee (USD 1.72) became much lower than the control group (USD 2.10) by the fourth year.
Production cost per hectare is higher for UTZ farmers reflecting the higher use of inputs, mainly fertilizers and labor for picking the crop, per unit of land. Costs of picking, as a proportion of total costs, are almost double those of the control group. The cost per hectare (USD 2.749) was 66.1% higher for UTZ at the baseline and this increased to 145.4% by the fourth year (USD 3.219).
Average gross revenue (price per kilogram) has been influenced positively and significantly by the program through the premium received by participants. Indeed, there is an average positive net effect of the program of USD 0.13 per kilo (the difference between the target group’s figure and the projection).
Higher net income by the farmers in the target group is explained more by higher productivity than by coffee price. While the difference in farm-gate prices (including price premium for certification), was +7.6% by the fourth year, the difference in productivity rose to + 219.4%.
16 · Net income per kilo (NIk) is calculated as the difference between the revenue per kilo (REVk) and the production cost per kilo (PCk). Revenue is the value of coffee sales during the year divided by the volume of production (q) in parchment converted to GBE. The production cost is the amount spent on coffee activities during the year divided by the volume of production in parchment converted to GBE. This can be expressed as:
Revenue per Kilo (USD / Green Kilo)Figure 24
Year 1 Year 2 Year 4
2.06***2.73***
1.742.22
2.86 2.66
1.661.99
* Signi�cant at 10%, ** Signi�cant at 5% and *** Signi�cant at 1%.
ControlTarget Projection
As a result of lower production costs per unit, together with higher prices, UTZ farmers had an increasingly higher net income16 per kilo produced, as compared to the control group. By the fourth year, a significant positive impact is observed on the average profit per kilo of green coffee: the target producers obtained +USD 0.45 more than projected. They earned USD 1.14 per kg instead of USD 0.69), which would be the expected situation in absence of the program (see Figure 25).
Percentage Di�erence in Price andYield between Target and Control Figure 26
Di�erence in farm gate priceDi�erence in yield
Year 1 Year 2 Year 4
219.4%
7.6%
142.2%
11.9%
77.0%
4.8%
This argument contradicts the idea that price premium is the main driver of the certification effect. However field interviews show that price premiums were the main incentive for organizations (extension services, cooperatives and private buyers) to promote sustainability initiatives and farmer perspectives also show that receiving higher prices for their coffee (45%) and improving their access to the market, were the main motivations for farmers in achieving certification.
Net Income per Kilo (USD / Green Kilo)Figure 25
Year 1 Year 2 Year 4
0.53***0.69***
0.22
0.77
1.14
0.56
0.070.39
* Signi�cant at 10%, ** Signi�cant at 5% and *** Signi�cant at 1%.
ControlTarget Projection
30 - Monitoring and Evaluation of UTZ Certified Sustainability Coffee Program in Colombia

However, while price premium impacts on revenue, a productivity increase can impact on profitability.
In spite of the importance of the price premium to farmers, other motivations, such as farm management, improving environmental conditions and the quality of the coffee, are gaining recognition among them. Interestingly, for example, while there was an upward trend in motivation as regards improving the management of the farm – from 21% to 31% – there was a downward trend in the motivation for receiving higher price premiums – from 46% to 43%.
Main Motivations to Obtainthe UTZ Certi�cation
45.5% 21.2% 24.2%
3.0
%6.
1%
43.4% 34.9% 17.0%
43.0% 30.8% 10.3%
Figure 27
Year 1
Year 2
Year 4
Better farm management
Better price oraccess to market
Better qualityof co�ee
Improve environment
Other
7.5
%
8.4
%
3.8
%
Resilience
Greater dependency on income from the coffee crop has been observed, due to the reduction in cash crops other than coffee. A slight trend has also been observed for farmers to branch out into the production of food staples, which could help to improve food security in households. The proportion of farmers growing food staples at their farms rose from 88.2% to 91.8% (96% in the control group). Simultaneously, the proportion of farmers in the target group growing cash crops other than coffee dropped from 26.5% to 15.5%. By contrast, a significantly higher share of the control farms (61.8%) reported having planted products to sell at local markets and gain some extra earnings (plantain, maize, beans, tomatoes, yucca).
This situation, which has also been reported in other studies (Alvarez and Von Hagen, 2011), could be analyzed from two different perspectives. On the one hand, it can be read in a positive way: farmers involved in certification and verification schemes are optimistic about the higher prices and improved market access for their coffee, which leads them to reduce the area formerly used for other cash crops. On the other hand, there is a downside: these efforts to increase coffee specialization and avoid diversifying into other cash crops could increase the dependency of the producers on their coffee earnings. By concentrating their activities on a single source of income, they could be more vulnerable to fluctuation in the market and adverse weather and less resilient to external shocks.
CRECE - 31

Percentage of Co�ee Sold as Certi�edand Conventional
1.7%13.8% 84.5%
35.7% 3.6% 60.7%
32.7% 15.4% 51.9%
Figure 28
Year 1
Year 2
Year 4
Other certi�cationsSold as UTZ Sold as conventional
However, the producers in the target group have higher demand for and access to credit. The percentage of farmers with credit increased from 65.5% in the baseline to 69.1% at the time of the third survey (from 28% to 46.6% for the controls). Although the survey did not ask for the reasons, it is likely that UTZ Certified producers with a higher variable production cost per unit of area needed to ask for more credit. The percentage of farmers who requested loans and received credit was slightly higher among UTZ Certified producers than the controls.
4.4. Multi-Certification
Even though the entire coffee production is certified in the target group, the amount of coffee sold as certified represents less than half the amount harvested. The share of coffee sold as certified (under any of the schemes) by the farmers in the target group rose from 15.5% during the first year to nearly 50% during the fourth. In the first year, 13.8% was sold as UTZ Certified; in the fourth year, the figure was 32.7%.
The increasing share of coffee sold under other certifications indicates a trend towards the adoption of multiple certifications by farmers. The sales of certified coffee in other schemes increased from 1.7% to 15.4% between the first and the fourth year. Field interviews with coffee growers revealed that multiple certification is down to at least four factors. First, farmers seek to close the gap between the amount of sustainable coffee produced as certified and the amount actually sold as certified, in order to achieve the price premium. Second, they look to reduce the risk of relying on a single scheme, assure a higher income through price premiums and gain access to new markets, improving economic and social viability. Third, they want to build economies of scale and improve efficiency at farm level. Fourth, as they do not have to pay directly for certification and audit cost and have been receiving significant aid in-kind to improve their milling and drying infrastructure, multiple certification is attractive.
32 - Monitoring and Evaluation of UTZ Certified Sustainability Coffee Program in Colombia

5. concluSIonSInfluencing Factors in the Implementation of the Program
Collaboration with donors and local agencies was fundamental to ensure that farmers and producer organizations were receptive to the program. The involvement of producers with previous training in Good Agricultural Practices provided by coffee sector programs and other initiatives, together with the selection of larger than average farms, allowed the program to start on the front foot, with the participating farmers already experienced in some practices, By contrast, the adverse conditions (weather, pest infestation, disease and falling national production) that characterized national coffee production acted as a constraint to progress, both for the target group and the control group.
The Attribution Problemand Methods Employed
Evaluating the impact of the UTZ program was more challenging because of the FNC and cooperatives involved target producers with previous training and knowledge in the adoption of GAP. This strategy was discovered by the study after the baseline survey. To address the selection bias, as well as controlling for independent factors, the evaluation was conducted using a combination of PSM and Difference in Differences (DID) analysis. By comparing changes over time between the target and control groups the differences during the period of the survey can be attributed to the intervention. With this comparison it is assumed that differences outside the study scope do not change over time and are not affected by the intervention. However, it should be recognized that despite this approach, the results might still be influenced by unobservable differences.
Implementation of Program Requirements by the Participating Farmers
Better farming practices have been implemented over time by UTZ producers, allowing an improvement in overall conditions on the farms. The increasing adoption of rust-resistant varieties has led to a reduction in the incidence of rust infection. Productivity (i.e. yield) remained almost stable but with high
levels during the period of observation, despite a declining national average. The increase in the levels of fertilization, which was significantly different from control group, resulted in an advantage for productivity. Among the recommended practices for better care of nature, practices related to water conservation were adopted, in particular the protection of water sources by means of strips or buffer zones. Moreover, the use of water-saving technologies by the producers in the milling process led to more efficient water use.
Sustainability Contributions Generatedby the Program During the Timeframeof Observation
The UTZ program is contributing to improvements in the social, environmental and economic sustainability of the producers, as can be seen from the scores of the aggregated sustainability indexes. The livelihood of the producers is perceived as increasingly positive and the social dimension of sustainability is being improved by the cultivation of crops for family consumption and the growing possession of consumer durables and other household assets. Progress in care for the environment is the most outstanding achievement. The environmental sustainability index has improved significantly as a result of the adoption of soil conservation practices, recycling and better agrochemical handling. With the achievement of good agricultural practices, the profitability of the UTZ producers – one of the expected impacts – was positively affected by the program. The producers managed to maintain their high levels of yield during a period when general conditions were not favorable to production.
Expected Changes Still to be Achieved
Among the changes expected from the program, some intended improvements relating to working conditions have not yet materialized. Training for workers in job safety, training in agrochemical handling and the provision of written contracts of employment for permanent workers are found in only a small proportion of the farms. Some of the other UTZ requirements have been adopted by a considerable number of the producers, but are not yet followed by all. For example, not all the farms have easy access to safe water or
CRECE - 33
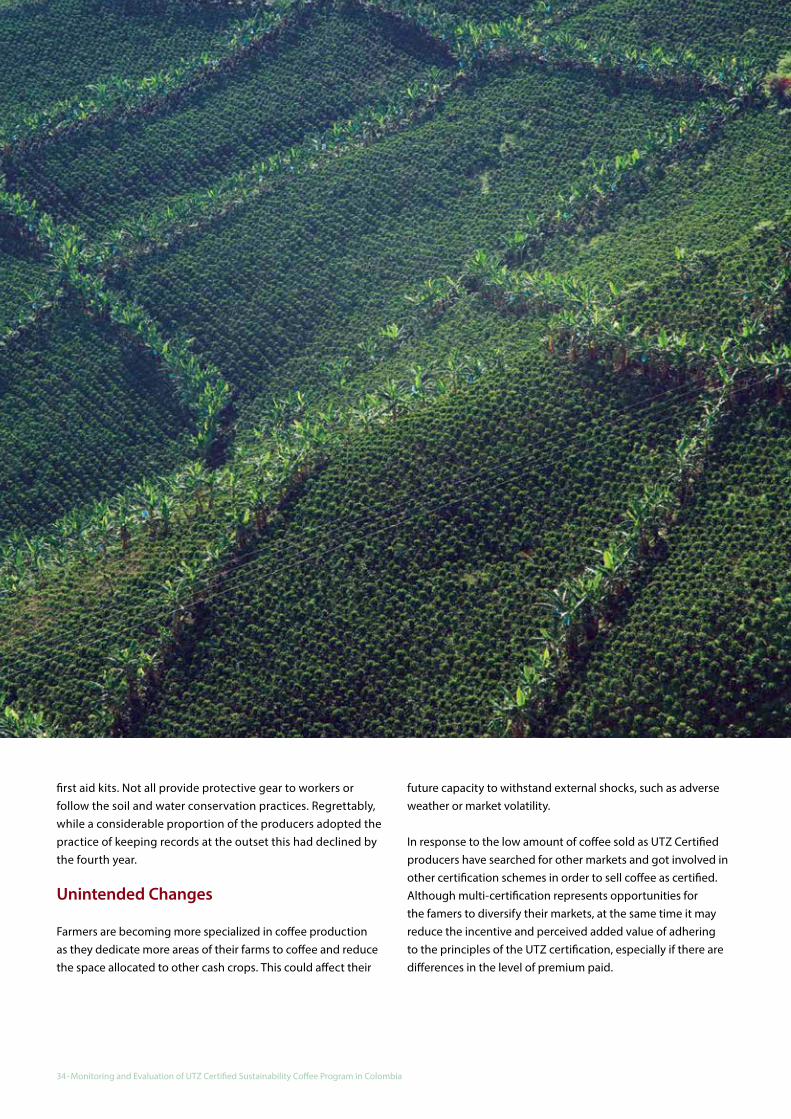
first aid kits. Not all provide protective gear to workers or follow the soil and water conservation practices. Regrettably, while a considerable proportion of the producers adopted the practice of keeping records at the outset this had declined by the fourth year.
Unintended Changes
Farmers are becoming more specialized in coffee production as they dedicate more areas of their farms to coffee and reduce the space allocated to other cash crops. This could affect their
future capacity to withstand external shocks, such as adverse weather or market volatility.
In response to the low amount of coffee sold as UTZ Certified producers have searched for other markets and got involved in other certification schemes in order to sell coffee as certified. Although multi-certification represents opportunities for the famers to diversify their markets, at the same time it may reduce the incentive and perceived added value of adhering to the principles of the UTZ certification, especially if there are differences in the level of premium paid.
34 - Monitoring and Evaluation of UTZ Certified Sustainability Coffee Program in Colombia

y ACDI/VOCA (2009). “Leveraging Resources from Public-Private Partnerships to Increase Smallholders´ Incomes” Retrieved December 15, 2009.
y Alvarez, G. and O. Von Hagen (2011). The Impact of Private Standards on Producers in Developing Countries. Literature Review series on the impacts of private standards - Part II . International Trade Centre.
y Castellanos, J., García, C., y Ochoa, G. (2013) Metodología para la medición multidimensional de la sostenibilidad en fincas cafeteras. Regiones. Vol 8, No 1. Manizales - Colombia, Centro de Estudios Regionales Cafeteros y Empresariales: 55.
y Castro, E., S., G. Ochoa, A. and L. Velásquez (2009). Línea de base del proyecto de asistencia técnica especializada para la integración de 25,000 caficultores a la cadena global de valor de cafés especiales de alta calidad. Manizales - Colombia, Centro de Estudios Regionales Cafeteros y Empresariales: 37.
y Crosse, W., N. Newsom and E. Kennedy (2012). Recommendations for Improving Research on Certification Impacts. Towards Sustainability: the roles and limitations of certification. Steering, Committee, of et al. London, RESOLVE: A-169 - A-180.
y De Groot, H. (2013). Seminario UTZ. Bogotá Colombia. ExpoEspeciales. Corferias, UTZ: 27.
y FNC (2011a) Comportamiento de la Industria Cafetera 2010. 50
y FNC (2011b). Caficultura Climáticamente Inteligente. LXXVI Congreso Nacional de Cafeteros. Bogotá - Colombia, Federación Nacional de Cafeteros de Colombia: 28.
y FNC (2012) Comportamiento de la Industria Cafetera 2011. 50
y FNC (2013) Comportamiento de la Industria Cafetera 2012. 50
y García-Cardona, J. (2014). Value-added initiatives: Distributional impacts on the global value chain for Colombia’s coffee. Institute of Development Studies. Brighton, University of Sussex. DPhil forthcoming.
y García C., Ochoa G., Celis M., J. García, et al. (2013a). COSA Project - Phase III: Second Follow up. Impact evaluation about the economic outcomes of the adoption of sustainable practices in the coffee production in Colombia (Draft). CRECE. Manizales - Caldas, Centro de Estudios Regionales Cafeteros y Empresariales: 75.
y García, J. and J. Ramirez (2002). “Sostenibilidad Económica de las pequeñas explotaciones cafeteras.” Ensayos sobre Economía Cafetera 15(18): 22.
y Garcia, C., Ochoa, G., Garcia, J., Castellanos, J, Mora J, (2014). Use of Polychoric Indexes to Measure the Impact of Seven Sustainability Programs on Coffee Growers’ Livelihood in Colombia. CRECE. Manizales - Caldas, Centro de Estudios Regionales Cafeteros y Empresariales.
y Newsom, N., E. Kennedy, J. Miller, V. Bahn, et al. (2012). Testing a BMP-Based approach for assessing gap in certification impacts research. Toward Sustainability: the roles and limitations of certification. Steering, Committee, of et al. London, RESOLVE: A-146 - A-168.
y Reina, M., G. Silva, L. Samper, F. and M. Fernández (2007). Juan Valdez: La Estrategia Detrás de la Marca. Bogota, Ediciones B.
y UTZ Certified (2008). Supply and demand update: Production & market trends. [email protected], UTZ CERTIFIED.
y UTZ Certified (2014a). UTZ Certified Impact Report: Combining results from 24 external impact studies and data from UTZ Certified: 55.
y UTZ Certified (2014b). Monitoring and Evaluation System: Public M&E System Report. U. Certified: 25.
y Yamashita, K. (2010). Instalación Seminario Internacional sobre Café Sostenible. Seminario Internacional sobre Café Sostenible. J. García (Ed.) a. Bogotá - Colombia, USAID. 1: 112.
rEfErEncES
CRECE - 35

appEndIcESappendix 1
Outcomes Monitoring Focus areas for further research (level 2/3)
Indicators (all Certi�cate Holders)
Sustainability of the sector: (Volumes/Market share)
1. Secure and growing supply of UTZ Certi�ed products
Total Certi�ed Production Volume*
Y
Total # of Certi�cate Holders by type*
Y
# of countries where UTZ products are produced*
Y
# of products* Y
Reasons for not renewing Certi�cation
# CoC Certi�cate holders entering & leaving the program in last year*
Producer member satisfaction of participation in the program*
Duration of participa-tion in the program (since 1st year of certi�cation)*
Y
Y
1. Certi�ed supply meets market require-ments (volume, quality, origin)
Supply-demand ratio Y
% of UTZ certi�ed volume sold per origin
Y
Impact Area
8.1 Long term goals (sector) 8.6 Expected outcomes(industry/sector) Indicators (level 1) Y/N Focus areas for Level
2/3 studies
This indicator list is under development. For some of the indicators, data collection and data analysis has just started. Reporting will depend on the value and quality of data. The new indicators will be collected from Q2 2014 onwards. This list will be updated in 2015.
UTZ Certi�ed Program indicators 2014
Level 2+ 3 Indicators are an indication of priority topics; the actual studies cover many more indicators, depending on evaluation questions and methodology.
Share of actual volume sold as UTZ certi�ed per certi�cate holder*
Industry member satisfaction of participation in the program
2. Secure and growing demand for UTZ Certi�ed products
Total Certi�ed Sales Volume
Y
# of active supply chain members
Y
# of countries where UTZ products are sold*
Y
Table 3
36 - Monitoring and Evaluation of UTZ Certified Sustainability Coffee Program in Colombia

Outcomes Monitoring Focus areas for further research (level 2/3)
Indicators (all Certi�cate Holders)
Industry invests in and rewards sustainable production
Sustainability of the sector: Reach /inclusive-ness
3. Sustainable practices are recognized and rewarded by the market
Level of premium Evolvement and distribution of premium along chain
Y
Y
YY
Increased e�ciency , trust and collaboration in the supply chain (case studies)
Investments made (start-up and ongoing costs) to get to the level of certi�cation
Other investments in supply chains and producer groups (projects beyond certi�cation)
Assessment of costs and bene�ts along the chain (TBD)
# SKU's with UTZ claim/logo (TBD)
4. Increased e�ciency, trust and collaboration in supply chain
5. Increased invest-ments in supply chain
6. The costs of sustainable production are internalized and shared
7. UTZ is recognized as a brand endorser
# of brands actively communicating about UTZ (TBD)
Y
Y
Total # certi�ed group members*
8. Sustainable farming is inclusive
Total # certi�ed entities (farmers)*
Total certi�ed crop area*
YTotal certi�ed farm area *
Impact Area
8.1 Long term goals (sector)8.6 Expected outcomes(industry/sector) Indicators (level 1) Y/N Focus areas for Level
2/3 studies
new
new
newGeographic location of certi�ed production area*
Evolvement and distribution of premium along chain
CRECE - 37
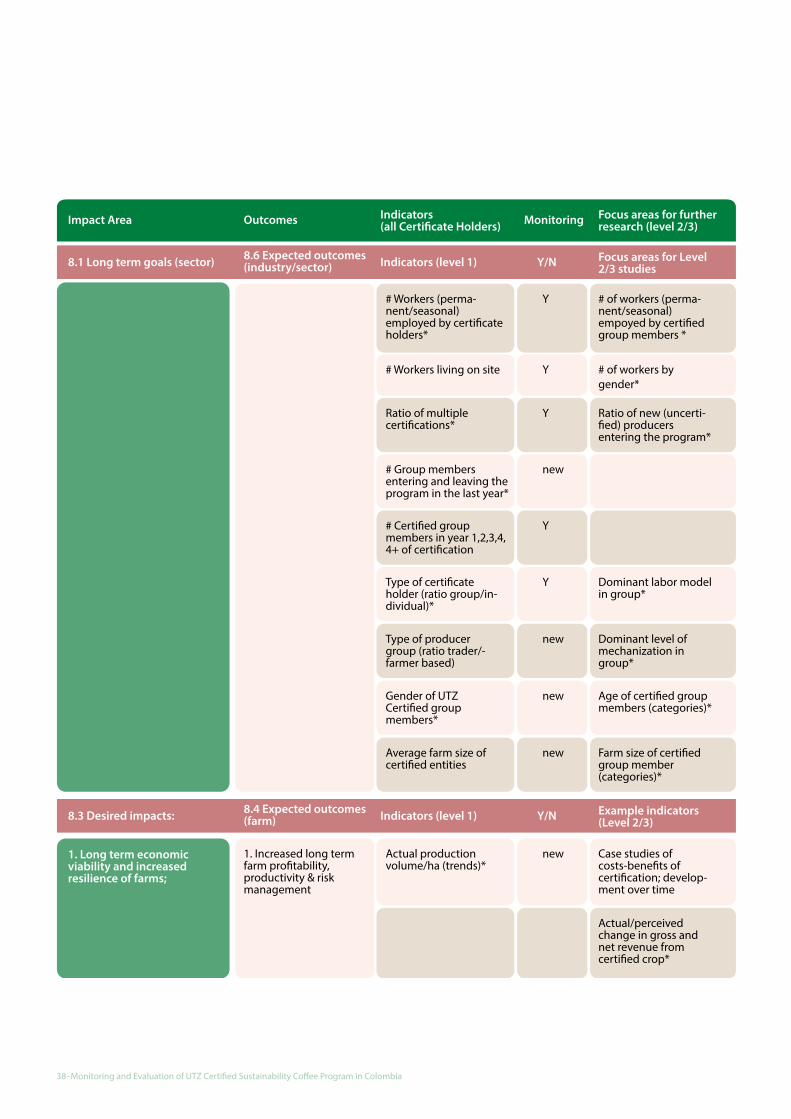
Outcomes Monitoring Focus areas for further research (level 2/3)
Indicators (all Certi�cate Holders)
Y# Workers (perma-nent/seasonal) employed by certi�cate holders*
# of workers (perma-nent/seasonal) empoyed by certi�ed group members *
Y# Workers living on site # of workers by gender*
YRatio of multiple certi�cations*
Ratio of new (uncerti-�ed) producers entering the program*
new# Group members entering and leaving the program in the last year*
# Certi�ed group members in year 1,2,3,4, 4+ of certi�cation
new1. Long term economic viability and increased resilience of farms;
Actual production volume/ha (trends)*
1. Increased long term farm pro�tability, productivity & risk management
Case studies of costs-bene�ts of certi�cation; develop-ment over time
Impact Area
8.1 Long term goals (sector) 8.6 Expected outcomes(industry/sector) Indicators (level 1) Y/N Focus areas for Level
2/3 studies
8.3 Desired impacts: 8.4 Expected outcomes (farm) Indicators (level 1) Y/N Example indicators
(Level 2/3)
Y
YType of certi�cate holder (ratio group/in-dividual)*
Dominant labor model in group*
newType of producer group (ratio trader/-farmer based)
Dominant level of mechanization in group*
newGender of UTZ Certi�ed group members*
Age of certi�ed group members (categories)*
newAverage farm size of certi�ed entities
Farm size of certi�ed group member (categories)*
Actual/perceived change in gross and net revenue from certi�ed crop*
38 - Monitoring and Evaluation of UTZ Certified Sustainability Coffee Program in Colombia

# and type of other cash crops grown on the farms
2. Quality meets market demand
Outcomes Monitoring Focus areas for further research (level 2/3)
Indicators (all Certi�cate Holders)
Perception that farming is a viable option for their children*
Investments in farm/productive assets*
% of total revenue coming from certi�ed crop*
Impact Area
8.3 Desired impacts 8.4 Expected outcomes (farm) Indicators (level 1) Y/N Example indicators
(Level 2/3)
new
TBD
3. Optimal farm e�ciency
% change of total inputs (labor, fertilizer, pesticides) used per kg of product; compared to recommended use
Record keeping and use of records for decision making
Perceived vulnerability to shocks
Actual Production Volume (reported)*
4. Optimal yield Change in productivity related practices (key parameters)
Access to inputs (Availabili-ty, A�ordability, Knowl-edge); Technological environment
Change in actual production on group member level (compared to benchmark or control group)*
new
new% change in actual production (kg/ha)
CRECE - 39
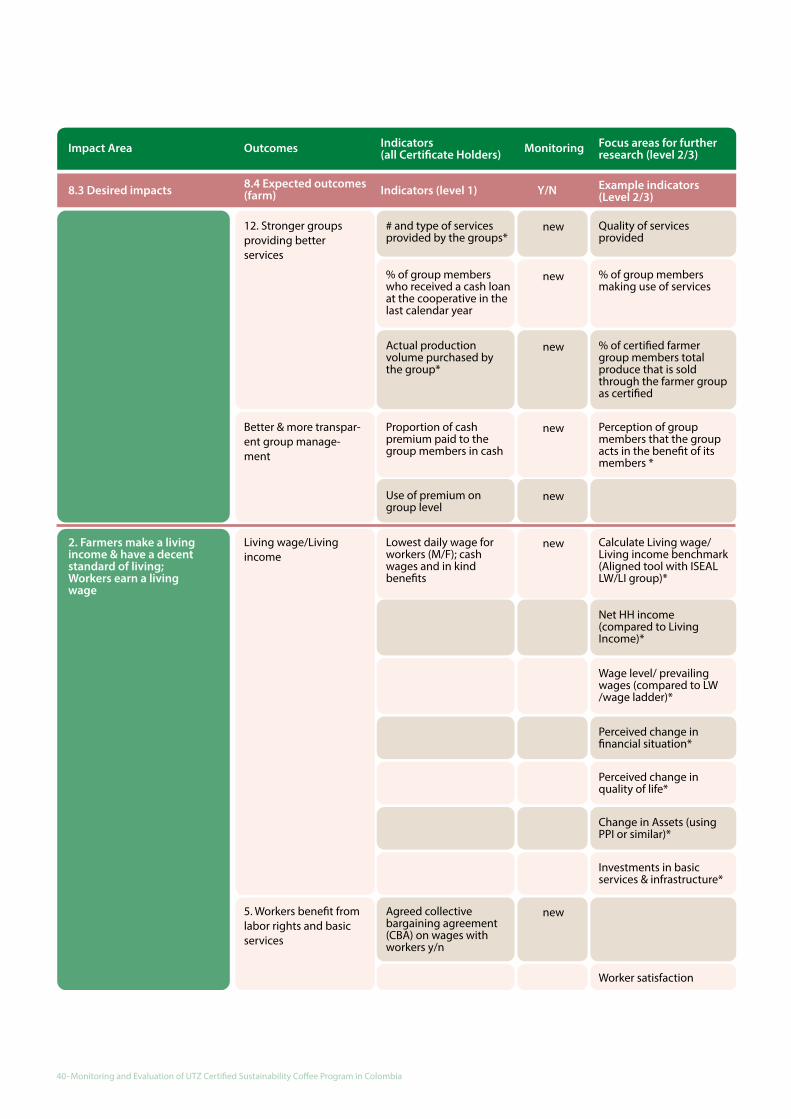
Outcomes Monitoring Focus areas for further research (level 2/3)
2. Farmers make a living income & have a decent standard of living; Workers earn a living wage
Indicators (all Certi�cate Holders)Impact Area
12. Stronger groups providing better services
Better & more transpar-ent group manage-ment
Living wage/Living income
5. Workers bene�t from labor rights and basic services
new Quality of services provided
# and type of services provided by the groups*
% of group members making use of services
% of group members who received a cash loan at the cooperative in the last calendar year
new
% of certi�ed farmer group members total produce that is sold through the farmer group as certi�ed
Actual production volume purchased by the group*
new
Perception of group members that the group acts in the bene�t of its members *
Proportion of cash premium paid to the group members in cash
new
Calculate Living wage/ Living income benchmark (Aligned tool with ISEAL LW/LI group)*
Lowest daily wage for workers (M/F); cash wages and in kind bene�ts
Net HH income (compared to Living Income)*
Wage level/ prevailing wages (compared to LW /wage ladder)*
Perceived change in �nancial situation*
Perceived change in quality of life*
Change in Assets (using PPI or similar)*
Investments in basic services & infrastructure*
new
# and type of CBAs (TBD)
Agreed collective bargaining agreement (CBA) on wages with workers y/n
new
Worker satisfaction
Use of premium on group level
new
8.3 Desired impacts 8.4 Expected outcomes (farm) Indicators (level 1) Y/N Example indicators
(Level 2/3)
40 - Monitoring and Evaluation of UTZ Certified Sustainability Coffee Program in Colombia

Outcomes Monitoring Focus areas for further research (level 2/3)
4. Better health
5. Children go to school
6. Natural resources are safeguarded
7. Reduced GHG emissions
Indicators (all Certi�cate Holders)Impact Area
6. Healthy and safe living & working conditions
Y # of serious work related incidents (or illness) over the last year
Quality of housing
7. No child labor (ref ILO)
8. Optimal soil quality/ healthy soil
8. Optimal water quality
9. Reduced waste & pollution
Y Child labor occurrence and rehabilitation cases
Measures taken to stimulate the educa-tion of children and prevent child labor
new School attendance for children of certi�ed farmers of school going age (versus school attendance for children of non-certi�ed farmers)- by gender
% of households that do not have access to a primary school*
Y Amount of fertilizer applied; type of fertilizer applied. Number of applications
# & type soil erosion prevention practices being used
Soil health*use of inorganic fertilizer y/n
use of organic fertilizer y/n
Y
Water quality*
Type of water quality protection measures
Liters of water used per kg of produce
Type of waste water treatment system (co�ee)
Y
Reuse/ recycling of organic/biodegradable waste (e.g. co�ee pulp) for fertilizer
Y
10. E�cient use of water
10. E�cient use of energy
Type of irrigation system
new
Water footprint (TBD)Type of wet processing system (co�ee)
new
Carbon footprint (TBD)
use of composting techniques y/n
Y
Y
8.3 Desired impacts 8.4 Expected outcomes (farm) Indicators (level 1) Y/N Example indicators
(Level 2/3)
CRECE - 41
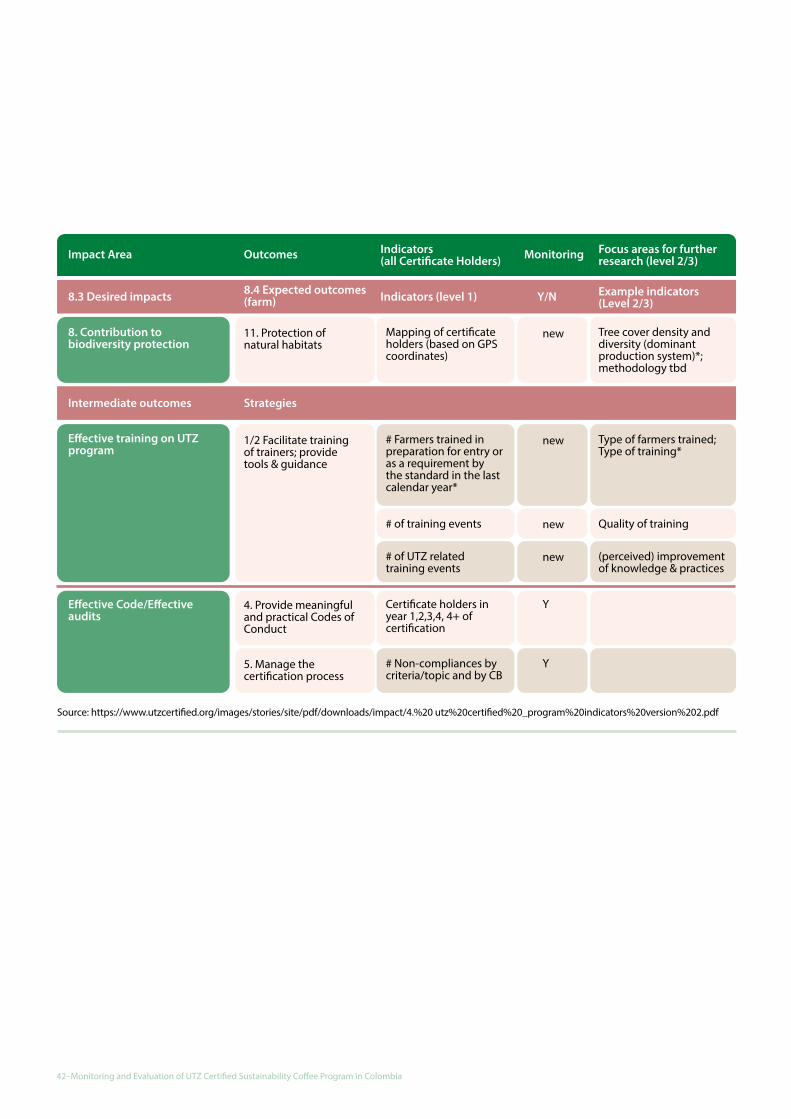
Outcomes Monitoring Focus areas for further research (level 2/3)
8. Contribution to biodiversity protection
Indicators (all Certi�cate Holders)
E�ective training on UTZ program
E�ective Code/E�ective audits
Impact Area
Intermediate outcomes Strategies
11. Protection of natural habitats
new Tree cover density and diversity (dominant production system)*; methodology tbd
Mapping of certi�cate holders (based on GPS coordinates)
1/2 Facilitate training of trainers; provide tools & guidance
4. Provide meaningful and practical Codes of Conduct
new Type of farmers trained; Type of training*
# Farmers trained in preparation for entry or as a requirement by the standard in the last calendar year*
new Quality of training# of training events
new (perceived) improvement of knowledge & practices
# of UTZ related training events
YCerti�cate holders in year 1,2,3,4, 4+ of certi�cation
5. Manage the certi�cation process
Y# Non-compliances by criteria/topic and by CB
Source: https://www.utzcerti�ed.org/images/stories/site/pdf/downloads/impact/4.%20 utz%20certi�ed%20_program%20indicators%20version%202.pdf
8.3 Desired impacts 8.4 Expected outcomes (farm) Indicators (level 1) Y/N Example indicators
(Level 2/3)
42 - Monitoring and Evaluation of UTZ Certified Sustainability Coffee Program in Colombia

appendix 2: propensity Score matching
Nearest neighbor
N (1)
N (5)
N (10)
Maximum distance
Radius (0.005)
Local lineal
Kernel
Trimming
375.0
332.8
360.6
317.1
298.3
333.5
373.5
355.4
336.9
317.1
329.0
376.1
117.2
90.5
84.9
90.6
.
81.1
***
***
***
***
***
***
Min - Max TrimmingMin - Max TrimmingMin - Max
112.7
85.8
80.4
90.6
.
78.4
18
18
18
57
18
21
36
36
36
57
36
36
Common Support sd Dropped out SigMethod of matching
* Signi�cant at 10%, ** Signi�cant at 5% and *** Signi�cant at 1%.
Table 4 Matching Methods Implemented
The table presents the different matching methods implemented to assure counting with comparable observations as much as possible from the source of controls. The matching variable was yield in kilos of green coffee per hectare. A total of seven models were implemented using nearest neighbor, maximum distance, local lineal and kernel. Bootstraping routines were also run for the models. All resulted in a confidence level of at least 99%. The ten nearest neighbor model with 25% trimming was selected considering the lowest standard deviation (sd) and coefficient.
As can be seen from the figure below, some target producers who have high propensity scores was dropped to assure counting with suitable matches for the target group.
Figure 29
Treated: O� support UntreatedTreated: On support
Nearest Neighbor Matching (10 neighbors)
Propensity score
0 .2 .4 .6 .8 1
CRECE - 43

appendix 3: technical parametersused for water consumption
The research had the valuable advisory in Water consumption calculations from Carlos E. Oliveros, Juan Rodrigo Sanz, researchers at National Coffee Research Centre (Cenicafé)16.
Classi�ed in dry funnel, wet funnel or no funnel
If the farmer uses water in the pulping processes
If the farmer transports the pulped co�eeusing water to the tank of fermentation
If the farmer uses water for transportingthe milled co�ee to the pit
If the mucilage elimination by natural fermentationis performed in fermentation tanks
If the mucilage elimination by natural fermentationis performed in the classi�cation channel
If the elimination of mucilage is performed using a demucilating machine
If the elimination of mucilage is performed using a demucilating machine
Wet co�ee is transported to the dryer using water
Type of funnel
Uses water for the co�ee
Transports the mucilage to the fermentation tank using water
Transports the pulp to the pit using water
Eliminates the mucilage in the fermentation tank
Eliminates the mucilage in the classi�cation channel
Removes co�ee mechanically using demucilating machine17 and calibrates it
Removes co�ee mechanically using demucilatingmachine and does not calibrates it or
Transports the wet co�ee to the dryer by using water
ObservationParameters
Source: CRECE - Cenicafé
Table 5 Parameters Used to Calculate Water Consumption
16 · Cenicafé is the National Center of Coffee Research of the Colombian Coffee Growers Federation. 17 · Demucilating machine is referred to equipment that removes the mucilage that is located between the coffee grain and the coffee cherry.
44 - Monitoring and Evaluation of UTZ Certified Sustainability Coffee Program in Colombia

appendix 4: Summary of results
Indicators Year1Indicators
Year2 Year4
sigControl
48
28
80%
95%
35%
4.9
6%
4.9
56%
69%
87%
85%
80%
88%
26%
66%
98%
99%
16%
91%
13%
10%
0%
51
30
9%
96%
59%
4.5
18%
3.8
60%
61%
80%
71%
9%
96%
58%
28%
100%
94%
24%
85%
4%
21%
8%
**
***
***
**
***
***
*
***
***
***
***
***
**
*
***
**
***
50
31
96%
98%
39%
5.1
5%
4.6
60%
70%
87%
86%
96%
92%
16%
69%
47%
96%
50%
17%
4%
2%
2%
4%
53
36
14%
96%
58%
4.5
17%
3.5
66%
68%
79%
61%
14%
96%
62%
47%
34%
88%
69%
24%
22%
6%
3%
23%
*
***
***
***
**
***
***
*
*
***
***
***
***
**
***
***
***
*
***
UTZ sigControlUTZ sigControlUTZ
49
32
86%
100%
45%
4.9
6%
4.8
75%
68%
89%
86%
86%
92%
21%
52%
47%
99%
80%
7%
51%
6%
5%
0%
52
33
11%
96%
65%
4.4
18%
3.7
70%
62%
79%
69%
11%
98%
75%
40%
26%
98%
76%
28%
42%
5%
8%
16%
**
***
***
**
***
***
**
***
***
***
***
**
***
***
***
Characteristics of the producer
Producer's age (years)
Producer's experience (years)
Producer belongs to a group (%)
Land owners (%)
Producers living at the farm (%)
Illiteracy (%)
Number of family members
Male producers (%)
Farm resilience
% of farms with food crops
% of farms with cash crops
% of producers that have credits
Costs increases
Serious illnesses
Co�ee prices drops
Robbery, violence or insecurity
Changes in the goverment politics
Leaf rust or other factors
Years of education of the producer (years)
Family members working on the farm (%)
% of producers that needed to ask for loansRate of credit approval(resquested / received)% of producers who reported eventualities at the household
Children (between 6 and 16 years) attending school (%)
Co�ee´s share in household income (%)% of producers who belong to a group
Table 6 Summary of results from the survey and single statistical di�erences by year
CRECE - 45
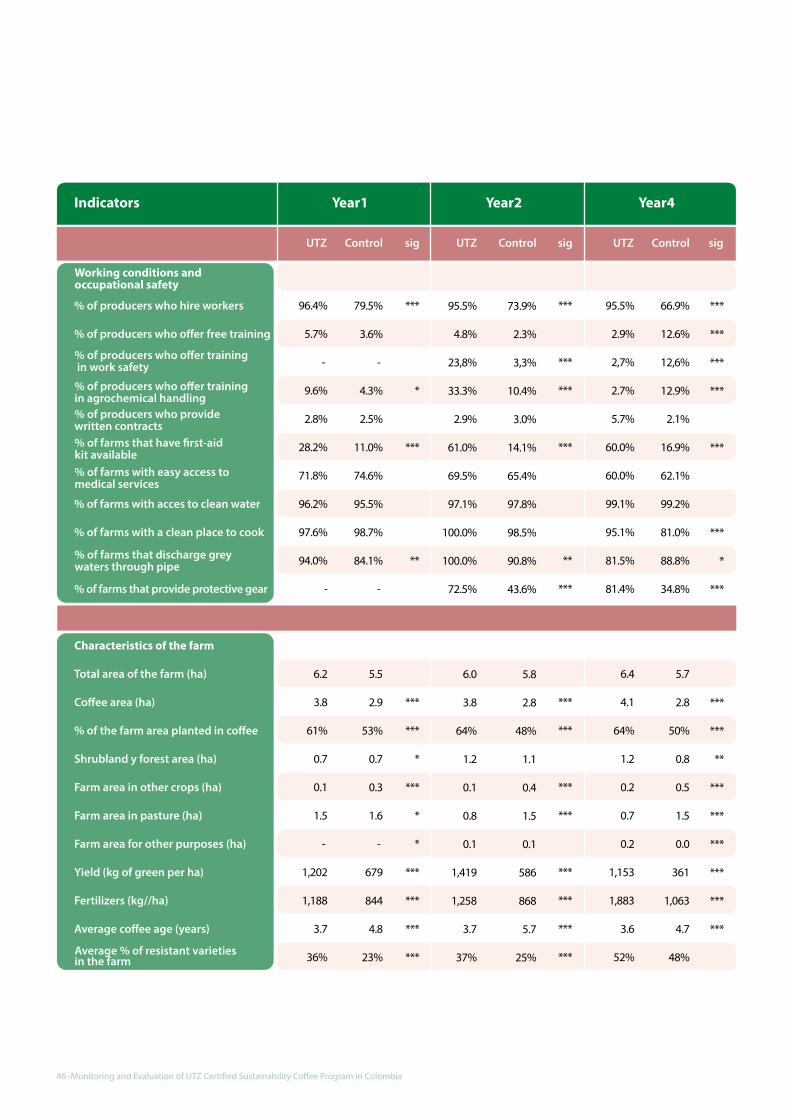
Indicators Year1 Year2 Year4
Working conditions and occupational safety
% of producers who o�er training in work safety
% of producers who o�er training in agrochemical handling% of producers who provide written contracts% of farms that have �rst-aid kit available% of farms with easy access to medical services
% of farms that discharge greywaters through pipe
Average % of resistant varietiesin the farm
***
***
***
***
**
***
***
***
***
***
***
***
***
***
95.5%
2.9%
2,7%
2.7%
5.7%
60.0%
60.0%
99.1%
95.1%
81.5%
81.4%
6.4
4.1
64%
1.2
0.2
0.7
0.2
1,153
1,883
3.6
52%
66.9%
12.6%
12,6%
12.9%
2.1%
16.9%
62.1%
99.2%
81.0%
88.8%
34.8%
5.7
2.8
50%
0.8
0.5
1.5
0.0
361
1,063
4.7
48%
sigControlUTZ sigControlUTZ sigControlUTZ
96.4%
5.7%
-
9.6%
2.8%
28.2%
71.8%
96.2%
97.6%
94.0%
-
6.2
3.8
61%
0.7
0.1
1.5
-
1,202
1,188
3.7
36%
79.5%
3.6%
-
4.3%
2.5%
11.0%
74.6%
95.5%
98.7%
84.1%
-
5.5
2.9
53%
0.7
0.3
1.6
-
679
844
4.8
23%
***
*
***
**
***
***
*
***
*
*
***
***
***
***
95.5%
4.8%
23,8%
33.3%
2.9%
61.0%
69.5%
97.1%
100.0%
100.0%
72.5%
6.0
3.8
64%
1.2
0.1
0.8
0.1
1,419
1,258
3.7
37%
73.9%
2.3%
3,3%
10.4%
3.0%
14.1%
65.4%
97.8%
98.5%
90.8%
43.6%
5.8
2.8
48%
1.1
0.4
1.5
0.1
586
868
5.7
25%
***
***
***
***
***
***
*
***
***
***
**
***
***
***
***
***
***
% of producers who hire workers
% of producers who o�er free training
% of farms with acces to clean water
% of farms with a clean place to cook
% of farms that provide protective gear
Characteristics of the farm
Total area of the farm (ha)
Co�ee area (ha)
% of the farm area planted in co�ee
Shrubland y forest area (ha)
Farm area in other crops (ha)
Farm area in pasture (ha)
Farm area for other purposes (ha)
Yield (kg of green per ha)
Fertilizers (kg//ha)
Average co�ee age (years)
46 - Monitoring and Evaluation of UTZ Certified Sustainability Coffee Program in Colombia

Indicators
% of farms that renovated co�ee trees
% of renovated trees
Litres of agrochemicals used per ha.
Kg. of Nitrogen applied per ha.
% of farms infested by CBB plague
Environmental practices
Type of system used
In�ltration camp
SMTA
Decanter
Other
Pours it into a surface
Pours it directly into the soil
Disposal of domestic water
Septic tank
River, stream, lagoon
Patio, trench
Sewerage
Year1 Year2 Year4
***
*
**
***
***
**
***
**
sigControlUTZ sigControlUTZ sigControlUTZ
5,342
59%
17%
1.6
250.5
55%
57%
5%
13%
n.a
n.a
n.a
n.a
n.a
n.a
n.a
n.a
n.a
n.a
n.a
n.a
n.a
4,754
49%
14%
1.7
222.4
69%
68%
6%
25%
n.a
n.a
n.a
n.a
n.a
n.a
n.a
n.a
n.a
n.a
n.a
n.a
n.a
***
*
**
***
**
**
***
*
5,428
46%
13%
3.6
271.8
65%
80%
6%
30%
n.a
n.a
n.a
n.a
n.a
n.a
n.a
n.a
n.a
n.a
n.a
n.a
n.a
4,788
38%
10%
4,5
248.8
82%
90%
6%
42%
n.a
n.a
n.a
n.a
n.a
n.a
n.a
n.a
n.a
n.a
n.a
n.a
n.a
***
***
***
***
***
***
***
***
***
***
***
***
***
***
***
***
5,352
62%
20%
4.8
367.8
49%
81%
1%
27%
65%
21%
23%
48%
7%
35%
23%
77%
79%
2%
18%
1%
7.9
4,833
56%
19%
3.0
213.3
32%
86%
4%
50%
6%
6%
17%
17%
61%
94%
27%
73%
51%
14%
33%
2%
8.9
Density of co�ee trees at thefarm (trees per ha)
% of farms a�ected with Leaf RustdeseaseAverage % of the farm infested with Co�ee Berry BorerAverage % of the farm a�ected with Leaf Rust desease
% of farms with treatment system for wastewaters
Disposal of wastewaters by farms without treatment system
Liters of water consumed in themilling process
CRECE - 47

Indicators Year1 Year2 Year4
*
*
***
***
***
***
***
***
***
***
***
**
***
**
***
**
**
*
***
***
***
***
**
***
***
***
***
***
**
**
sigControlUTZ sigControlUTZ sigControlUTZ
74%
60%
98%
2%
16%
0%
39%
36%
53%
40%
55%
50%
96%
93%
92%
1%
1%
49%
0%
48%
52%
22%
23%
0%
24%
0%
65%
60%
91%
17%
22%
1%
13%
42%
34%
53%
90%
61%
50%
47%
90%
2%
2%
57%
17%
54%
87%
13%
19%
4%
25%
0%
74%
77%
98%
24%
16%
0%
43%
41%
57%
82%
67%
67%
96%
92%
81%
1%
0%
55%
61%
71%
96%
19%
28%
11%
31%
1%
65%
63%
69%
8%
16%
12%
16%
45%
41%
51%
84%
60%
51%
50%
72%
2%
1%
61%
57%
62%
74%
11%
15%
22%
42%
1%
*
***
***
***
***
***
***
***
**
***
*
***
***
***
***
74%
88%
100%
7%
3%
0%
28%
64%
80%
82%
86%
70%
76%
76%
88%
2%
0%
70%
50%
76%
99%
66%
30%
1%
68%
0%
65%
90%
89%
7%
18%
0%
9%
18%
32%
42%
77%
66%
66%
46%
83%
2%
0%
42%
54%
66%
90%
18%
12%
1%
43%
2%
% of farms that implementconservation practices andwater management
% of producers who applyorganic fertilizers
% of producers who fertilizeunder technical recommendation
There is a recycling programin the farm
% of producers who recycleorganic matter
% of producers who recyclepaper and cardboard
Estimated percentage of soilcover in the co�ee area
Estimated percentage of the farmarea with erosion problems
% of producers who performsoil conservation practices
% of farms with water sources
% of farms with bu�er strips
% of farms with living fences
% of farms with reforested areas
Other
% of farms that perform soil analysis
% of producers who recycle co�ee pulp
% of producers who recycle plastics
Drip irrigation
Tanks or wells for water recolection
Contouring in the plants
Bu�er areas
Soil cover
Pulping with low water use
Channels or draining trenches
Terraces
Living fences
Other practices
48 - Monitoring and Evaluation of UTZ Certified Sustainability Coffee Program in Colombia

Indicators Year1 Year2 Year4
Production cost per kilo(USD / green kilo)Opportunity Cost per kilo(USD / green kilo)
% of total wages not paidor not paid in cash% of producers who employfamily labor without paying for it
***
***
***
***
***
***
***
***
***
***
***
**
***
***
***
***
***
***
***
***
***
*
***
***
***
***
***
***
***
***
***
***
***
***
***
sigControlUTZ sigControlUTZ sigControlUTZ
41%
56%
44%
1.53
0.17
1.74
0.22
2,663
294
3,400
737
30%
94%
110
39%
35%
11%
2%
6%
3%
3%
82%
41%
65%
6%
59%
41%
1.60
1.24
1.66
0.07
1,603
762
1,849
246
47%
89%
18
32%
28%
19%
4%
9%
4%
3%
75%
45%
45%
63%
59%
41%
1.46
0.25
2.22
0.77
2,790
415
5,166
2,377
43%
98%
45
38%
31%
14%
6%
6%
2%
3%
100%
78%
76%
5%
54%
46%
1.60
0.97
1.99
0.39
1,334
616
1,907
572
55%
98%
24
32%
28%
18%
7%
8%
3%
4%
89%
51%
48%
50%
58%
42%
1.72
0.41
2.86
1.14
2,679
514
5,277
2,598
55%
97%
27
38%
33%
10%
3%
7%
6%
4%
94%
38%
59%
15%
56%
44%
2.10
3.03
2.66
0.56
1,086
764
1,767
681
62%
99%
13
27%
32%
12%
7%
11%
7%
4%
95%
38%
49%
Farm economics
% of producers that keep records
Share of hired labor in production costs
Share of inputs in total costs
Revenue per kilo (USD / green kilo)
Net Income per kilo (USD / green kilo)
Total Cost per Ha (USD)
Opportunity Cost per Ha (USD)
Gross Income per Ha (USD)
Net income per Ha (USD)
Average hours of training
Cost structure
Co�ee Picking
Fertilization
Management
Phitosanitary
Weeding
Renewal & Other
Milling
Market
Knows the average price of the zone
Knows the national price
Knows the international price
CRECE - 49

Indicators
Distance to point of sale
Co�ee Sold as UTZ
Co�ee Sold as Conventional
Investment choices of the premium
Planting co�ee
Paying debts
Buying lands
Improving the farm
Personal expenses
Paying for education
Reasons to obtain the UTZ Certi�cation
To improve farm management
To improve the environment
Because the buyer requires it
Other
Producers’ perceptions (score 1 to 10)
Level of income
Household quality of life
Family health
***
***
***
***
*
***
***
***
***
**
*
***
***
***
***
***
***
***
***
***
***
***
**
***
***
***
sigControlUTZ sigControlUTZ sigControlUTZ
5
3
16
50
14%
85%
2%
-
-
-
-
-
-
-
-
45%
21%
3%
24%
6%
0%
7.3
7.8
8.5
4
2
10
50
-
100%
-
-
-
-
-
-
-
-
-
-
-
-
-
-
-
6.0
7.6
7.9
6
4
13
34
36%
61%
4%
-
-
-
-
-
-
-
-
43%
35%
4%
17%
0%
1%
7.0
8.1
8.6
4
2
8
40
-
100%
-
-
-
-
-
-
-
-
-
-
-
-
-
-
-
4.8
7.1
7.3
6
6
17
48
33%
52%
15%
60%
73%
71%
24%
0%
16%
23%
0%
43%
31%
8%
10%
1%
7%
8.5
9.1
9.0
4
4
11
46
-
100%
-
73%
90%
7%
1%
0%
0%
1%
0%
-
-
-
-
-
-
4.9
7.2
7.4
Year1 Year2 Year4
Number of assets at thehousehold (1 to 9 assets)Number of assets at the farm(1 to 15 assets)
Length of travel to thepoint of sale
Co�ee Sold as OtherCerti�cations
% of producers who knowthe premium value
To receive price premiumsand improve access to markets
To improve the qualityof their co�ee
% of producers who sellpremium co�ee
50 - Monitoring and Evaluation of UTZ Certified Sustainability Coffee Program in Colombia
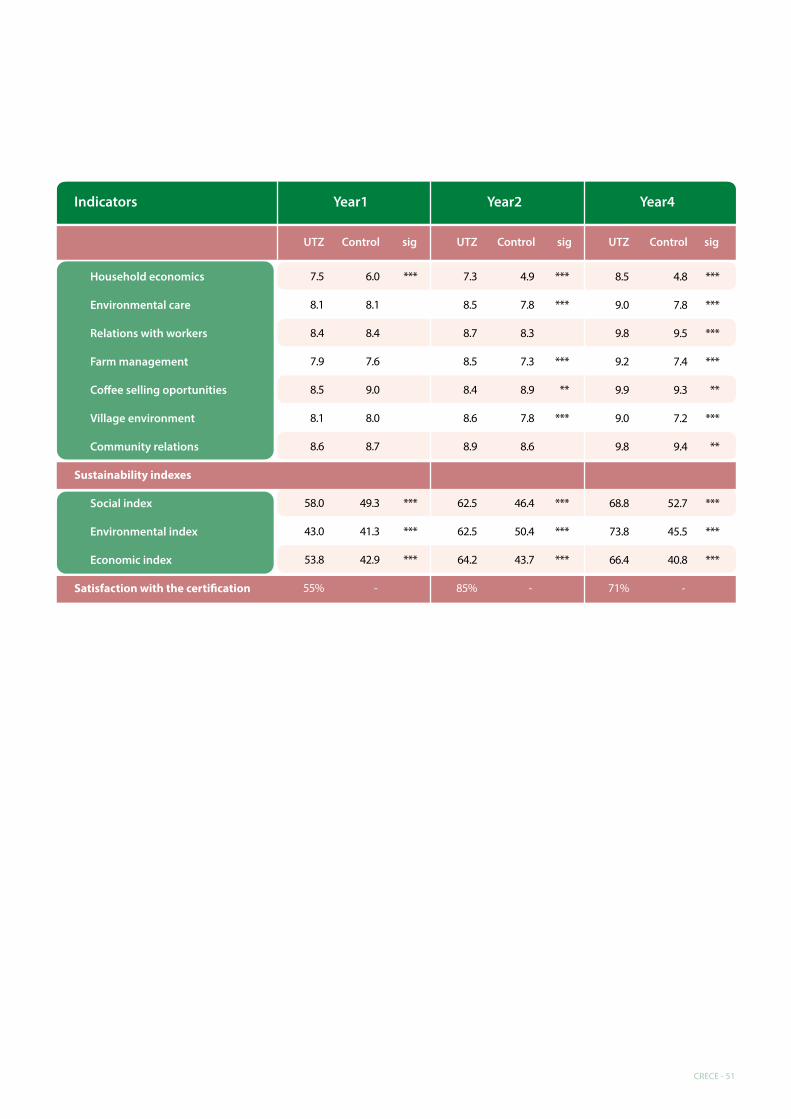
Indicators Year1 Year2 Year4
sigControlUTZ sigControlUTZ sigControlUTZ
7.5
8.1
8.4
7.9
8.5
8.1
8.6
58.0
43.0
53.8
55%
6.0
8.1
8.4
7.6
9.0
8.0
8.7
49.3
41.3
42.9
-
***
***
***
***
7.3
8.5
8.7
8.5
8.4
8.6
8.9
62.5
62.5
64.2
85%
4.9
7.8
8.3
7.3
8.9
7.8
8.6
46.4
50.4
43.7
-
***
***
***
**
***
***
***
***
8.5
9.0
9.8
9.2
9.9
9.0
9.8
68.8
73.8
66.4
71%
4.8
7.8
9.5
7.4
9.3
7.2
9.4
52.7
45.5
40.8
-
***
***
***
***
**
***
**
***
***
***
Household economics
Environmental care
Relations with workers
Farm management
Co�ee selling oportunities
Village environment
Community relations
Sustainability indexes
Social index
Environmental index
Economic index
Satisfaction with the certi�cation
CRECE - 51

Centro de Estudios Regionales Cafeteros y Empresariales – CRECERecinto del Pensamiento Jaime Restrepo Mejía Vía al Magdalena Km. 11
Manizales
Teléfonos: +57 68748891, +57 68748892, +57 [email protected]