Embed Size (px)
Citation preview
Impact Evaluation of DOLE’sSPES: Findings, Challenges, and Lessons Learned
Dr. Emily Beam (University of Vermont)10 October 2017
The SPES IE research is supported by 3ie and the Australian Government. The SPES IE is conducted in partnership with the Department of Labor and Employment, and its Institute for Labor Studies andBureau of Local Employment.
Research Guidance and SupportDepartment of Labor and Employment
Institute for Labor Studies and Bureau of Local Employment
Impact Evaluation Research Supported by3ie and the Australian Government
1. Overview of SPES
• Research design
2. Implementation challenges
3. Who does SPES target?
4. Impact evaluation findings
5. Policy recommendations
6. Lessons for researchers
Outline
1. Overview of SPES
Special Program for Employment of Students
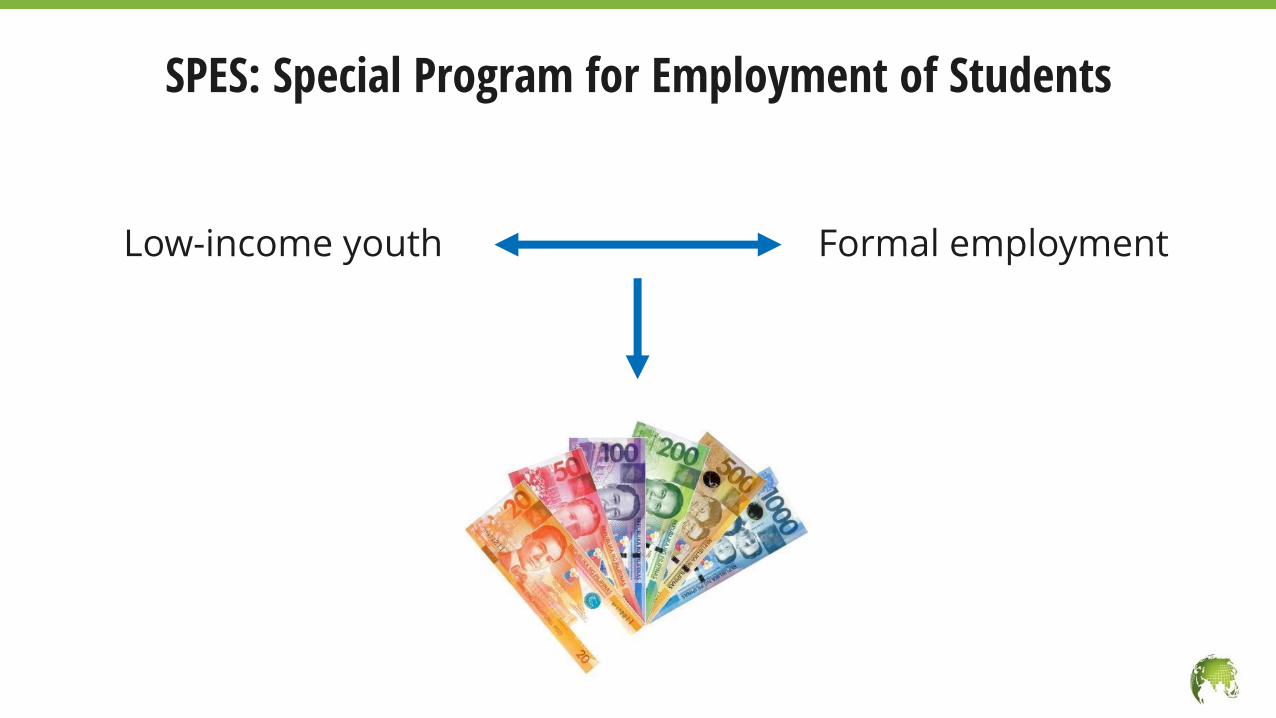
SPES: Special Program for Employment of Students
Low-income youth Formal employment
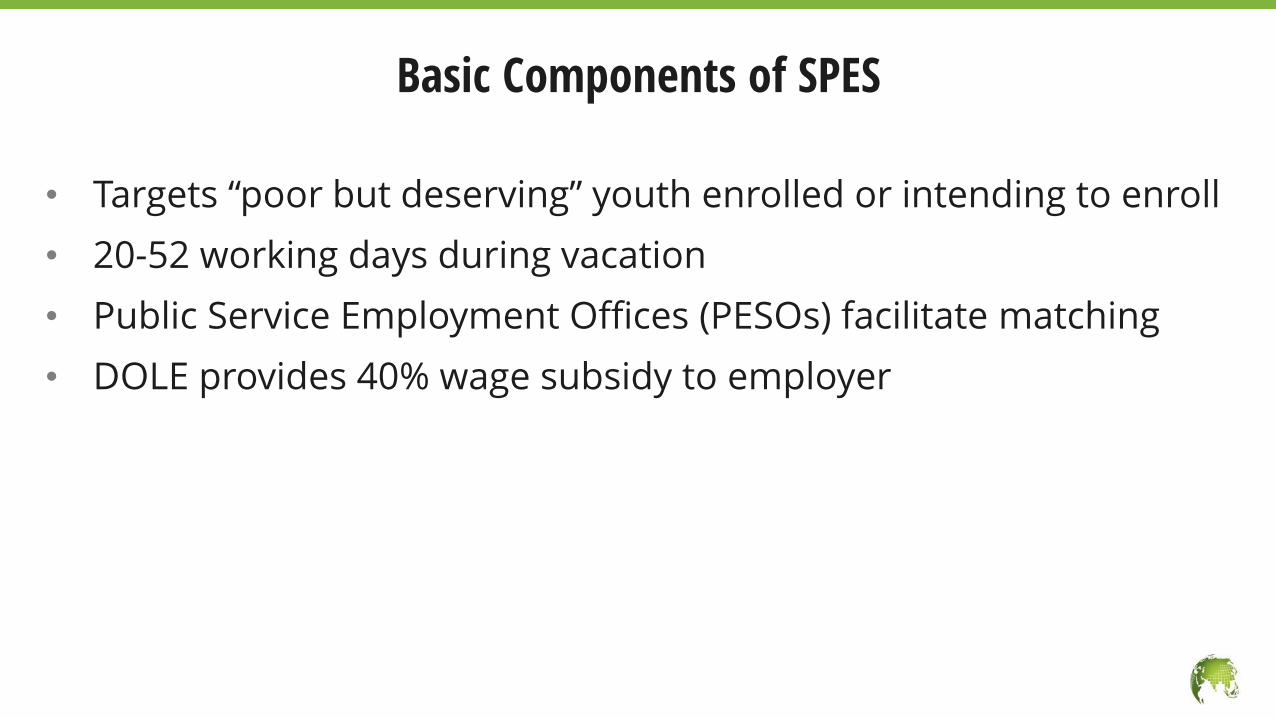
Basic Components of SPES
• Targets “poor but deserving” youth enrolled or intending to enroll
• 20-52 working days during vacation
• Public Service Employment Offices (PESOs) facilitate matching
• DOLE provides 40% wage subsidy to employer
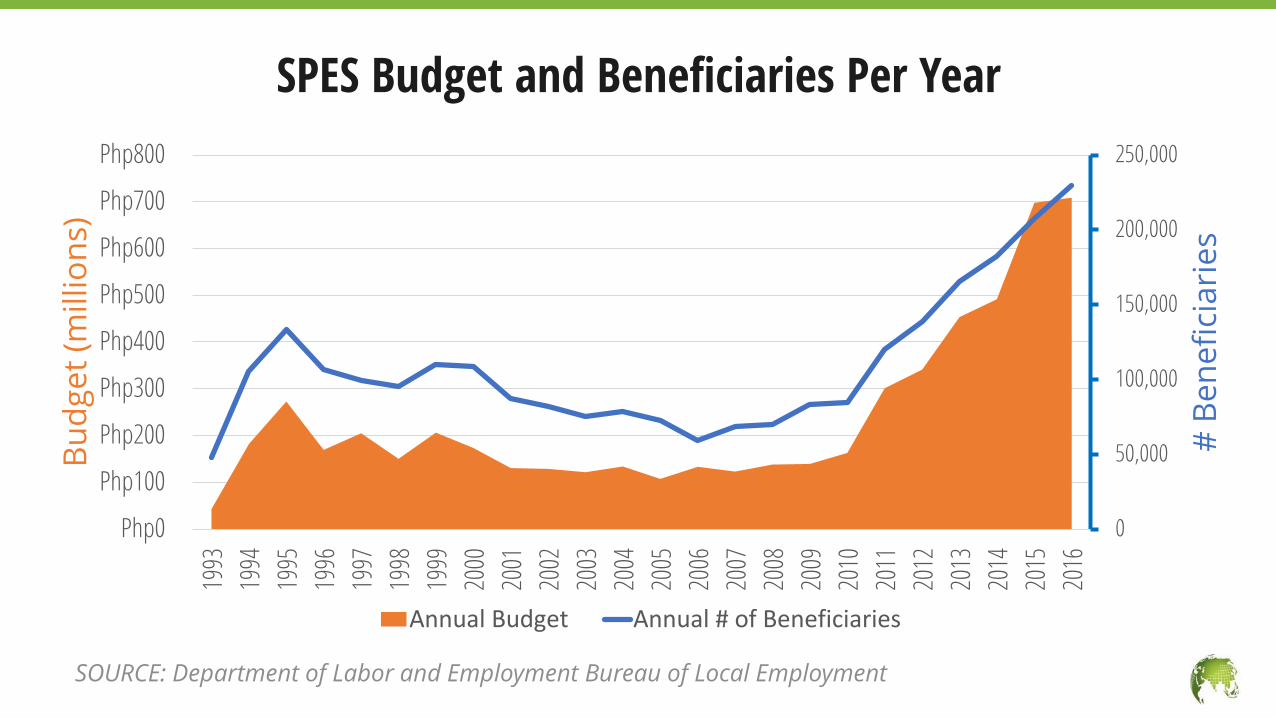
SPES Budget and Beneficiaries Per Year
SOURCE: Department of Labor and Employment Bureau of Local Employment
0
50,000
100,000
150,000
200,000
250,000
Php0
Php100
Php200
Php300
Php400
Php500
Php600
Php700
Php800
1993
1994
1995
1996
1997
1998
1999
2000
2001
2002
2003
2004
2005
2006
2007
2008
2009
2010
2011
2012
2013
2014
2015
2016
# B
en
efi
cia
rie
s
Bu
dg
et
(millio
ns)
Annual Budget Annual # of Beneficiaries
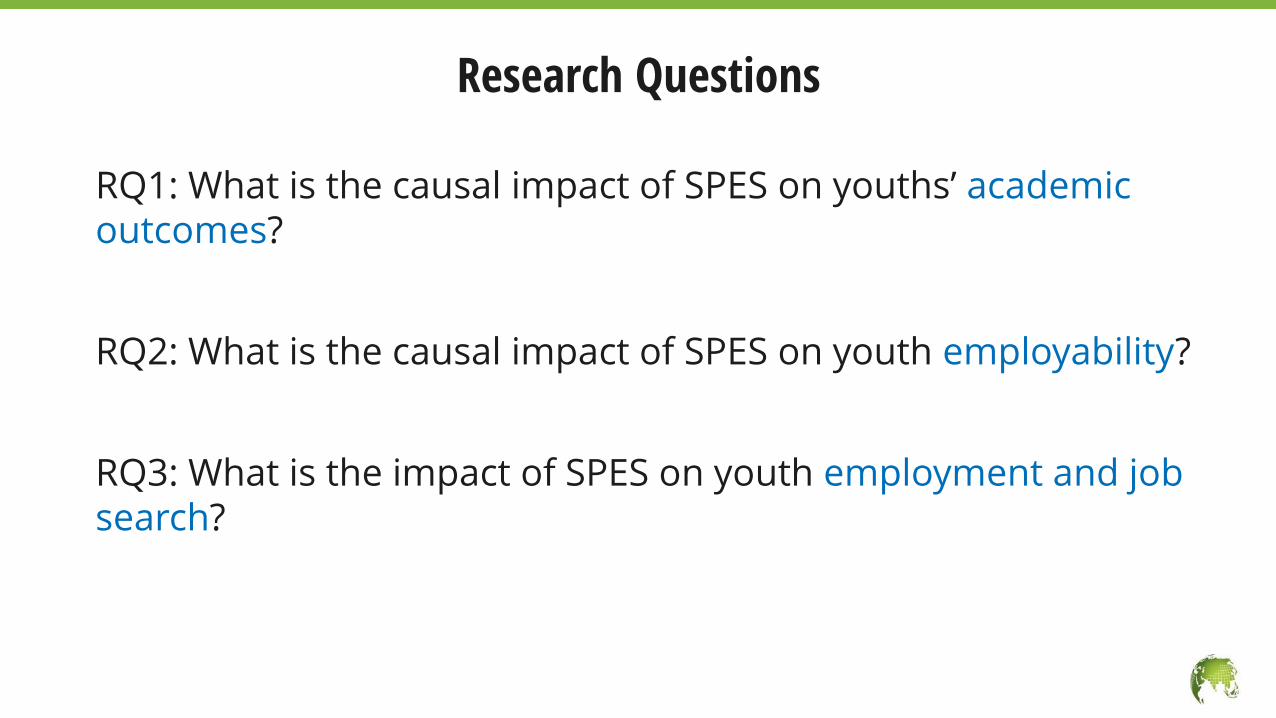
Research Questions
RQ1: What is the causal impact of SPES on youths’ academic outcomes?
RQ2: What is the causal impact of SPES on youth employability?
RQ3: What is the impact of SPES on youth employment and job search?
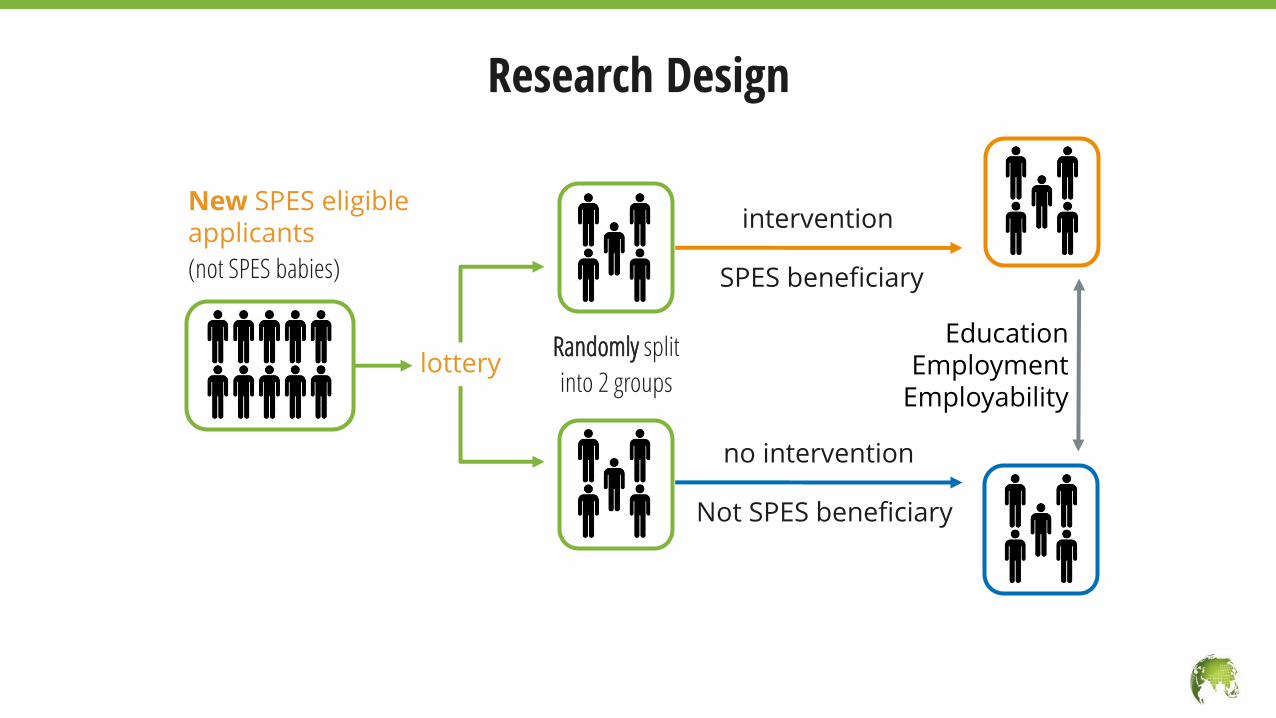
Research Design
lottery
New SPES eligible applicants
(not SPES babies)
Randomly split
into 2 groups
intervention
SPES beneficiary
no intervention
Not SPES beneficiary
EducationEmployment
Employability
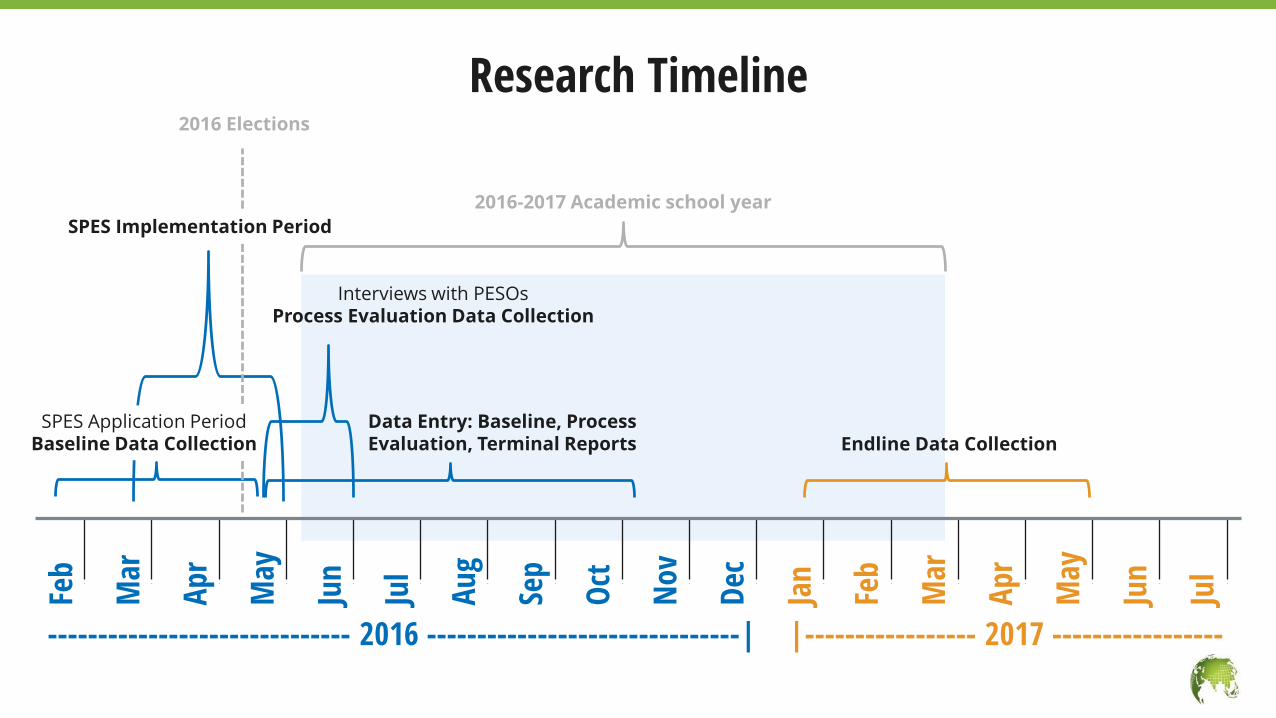
Research TimelineFe
b
Mar
Apr
May
Jun
Jul
Au
g
Sep
Oct
Nov
Dec
Jan
Feb
Mar
Apr
May
Jun
Jul
------------------------------ 2016 -------------------------------| |----------------- 2017 -----------------
2016 Elections
SPES Implementation Period
SPES Application PeriodBaseline Data Collection
Interviews with PESOsProcess Evaluation Data Collection
Data Entry: Baseline, Process Evaluation, Terminal Reports Endline Data Collection
2016-2017 Academic school year
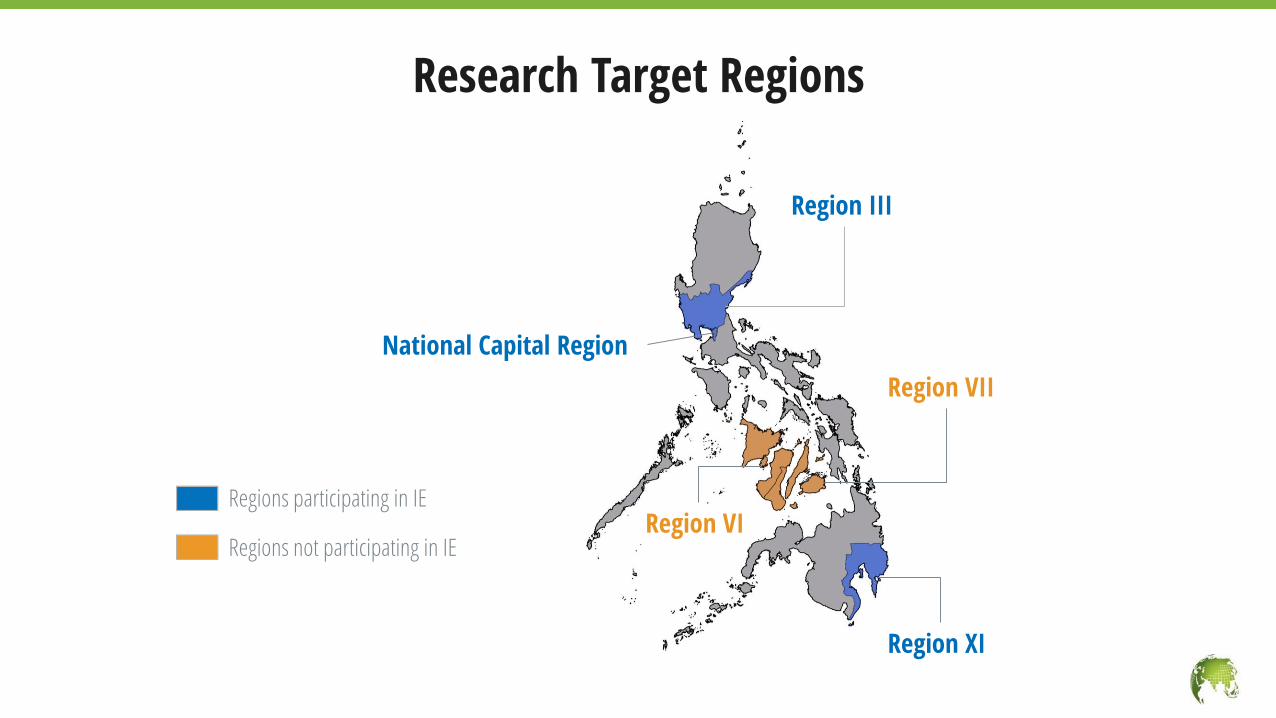
Research Target Regions
National Capital Region
Region III
Region XI
Region VII
Region VIRegions participating in IE
Regions not participating in IE
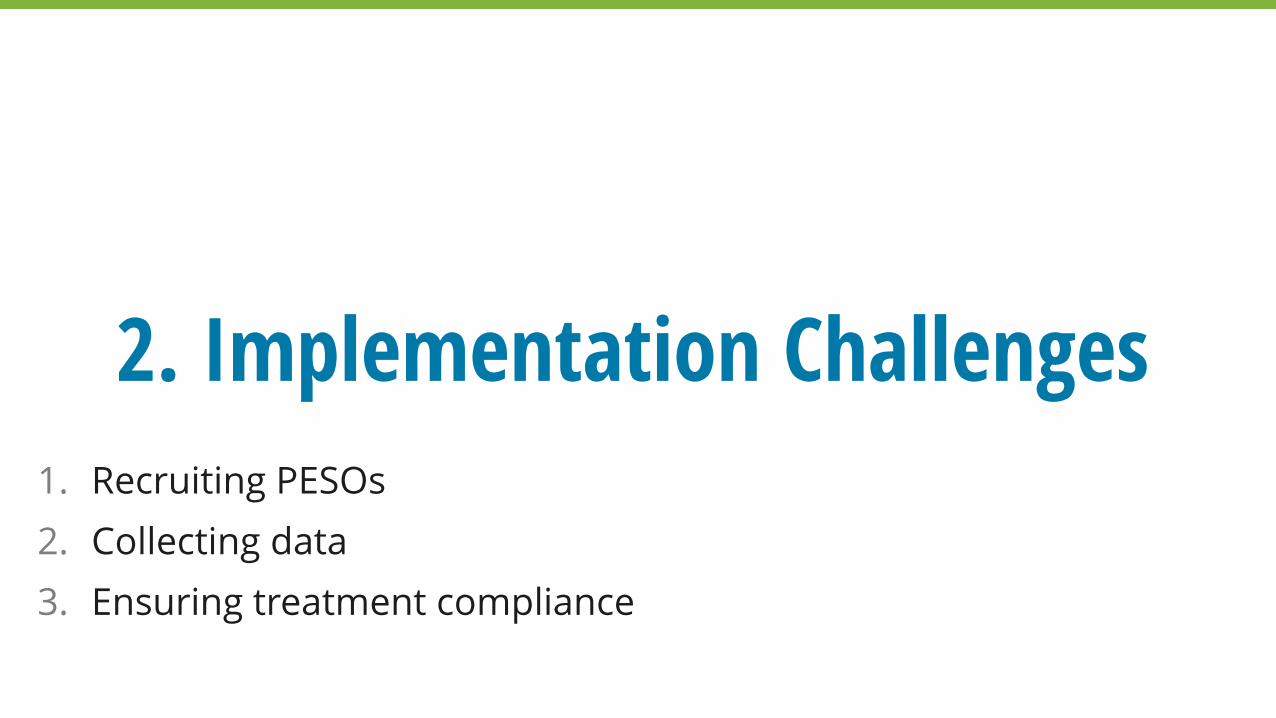
2. Implementation Challenges
1. Recruiting PESOs
2. Collecting data
3. Ensuring treatment compliance
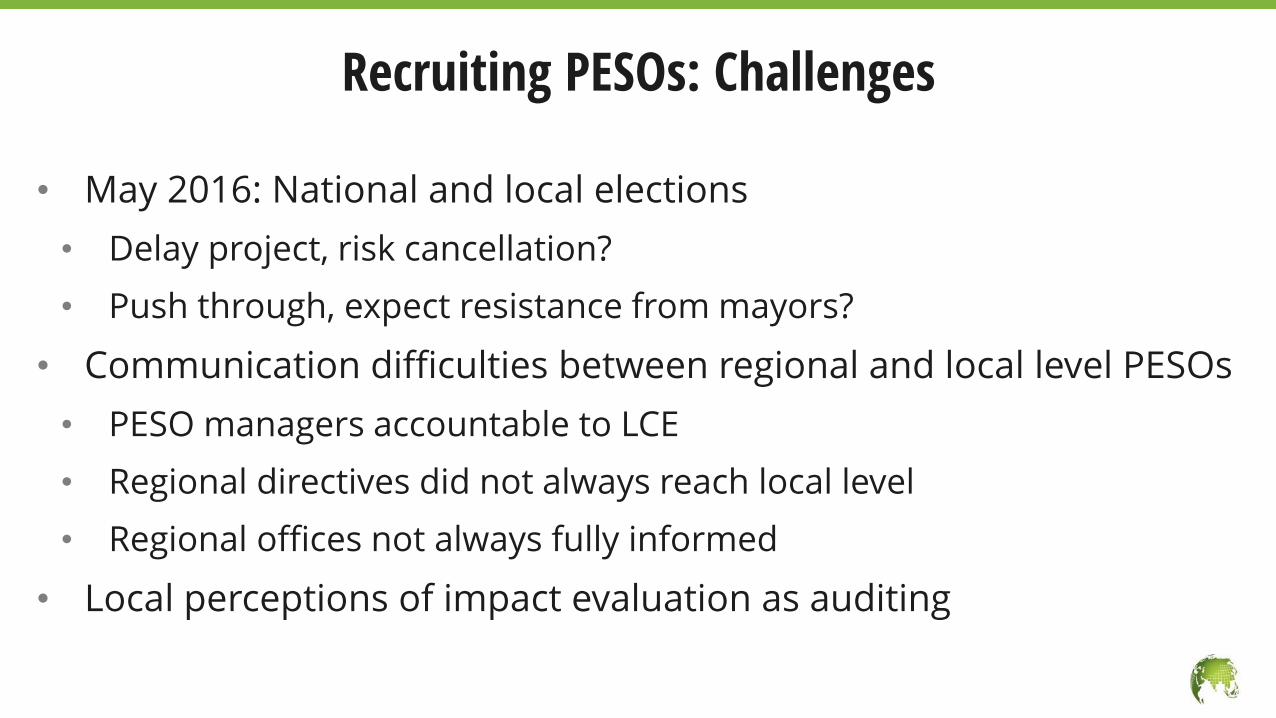
• May 2016: National and local elections
• Delay project, risk cancellation?
• Push through, expect resistance from mayors?
• Communication difficulties between regional and local level PESOs
• PESO managers accountable to LCE
• Regional directives did not always reach local level
• Regional offices not always fully informed
• Local perceptions of impact evaluation as auditing
Recruiting PESOs: Challenges
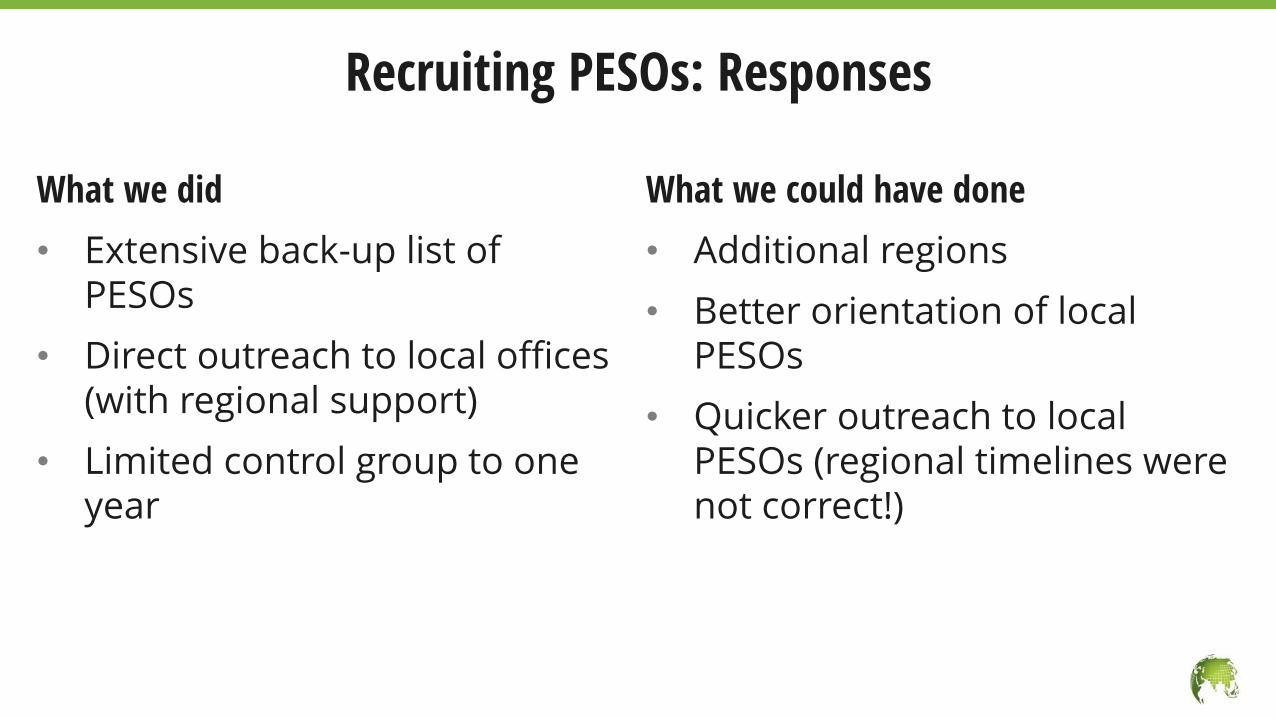
What we did
• Extensive back-up list of PESOs
• Direct outreach to local offices (with regional support)
• Limited control group to one year
What we could have done
• Additional regions
• Better orientation of local PESOs
• Quicker outreach to local PESOs (regional timelines were not correct!)
Recruiting PESOs: Responses
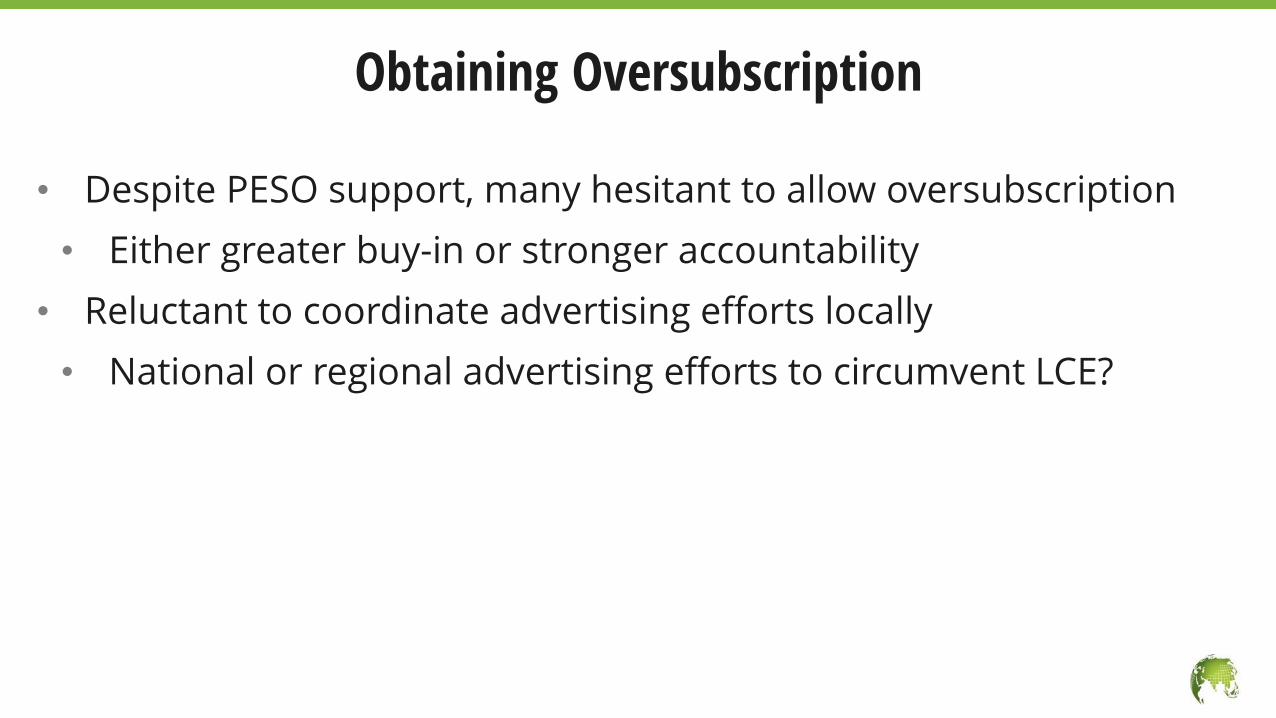
• Despite PESO support, many hesitant to allow oversubscription
• Either greater buy-in or stronger accountability
• Reluctant to coordinate advertising efforts locally
• National or regional advertising efforts to circumvent LCE?
Obtaining Oversubscription
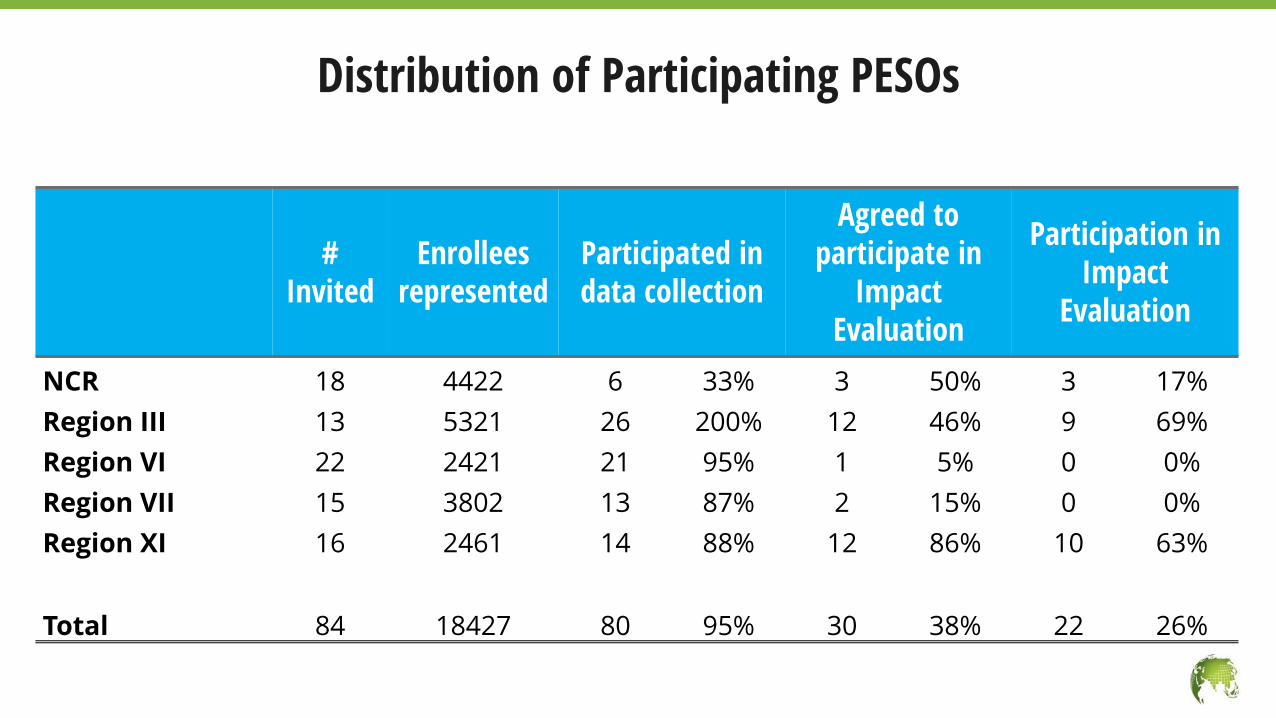
Distribution of Participating PESOs
# Invited
Enrollees represented
Participated in data collection
Agreed to participate in
Impact Evaluation
Participation in Impact
Evaluation
NCR 18 4422 6 33% 3 50% 3 17%
Region III 13 5321 26 200% 12 46% 9 69%
Region VI 22 2421 21 95% 1 5% 0 0%
Region VII 15 3802 13 87% 2 15% 0 0%
Region XI 16 2461 14 88% 12 86% 10 63%
Total 84 18427 80 95% 30 38% 22 26%
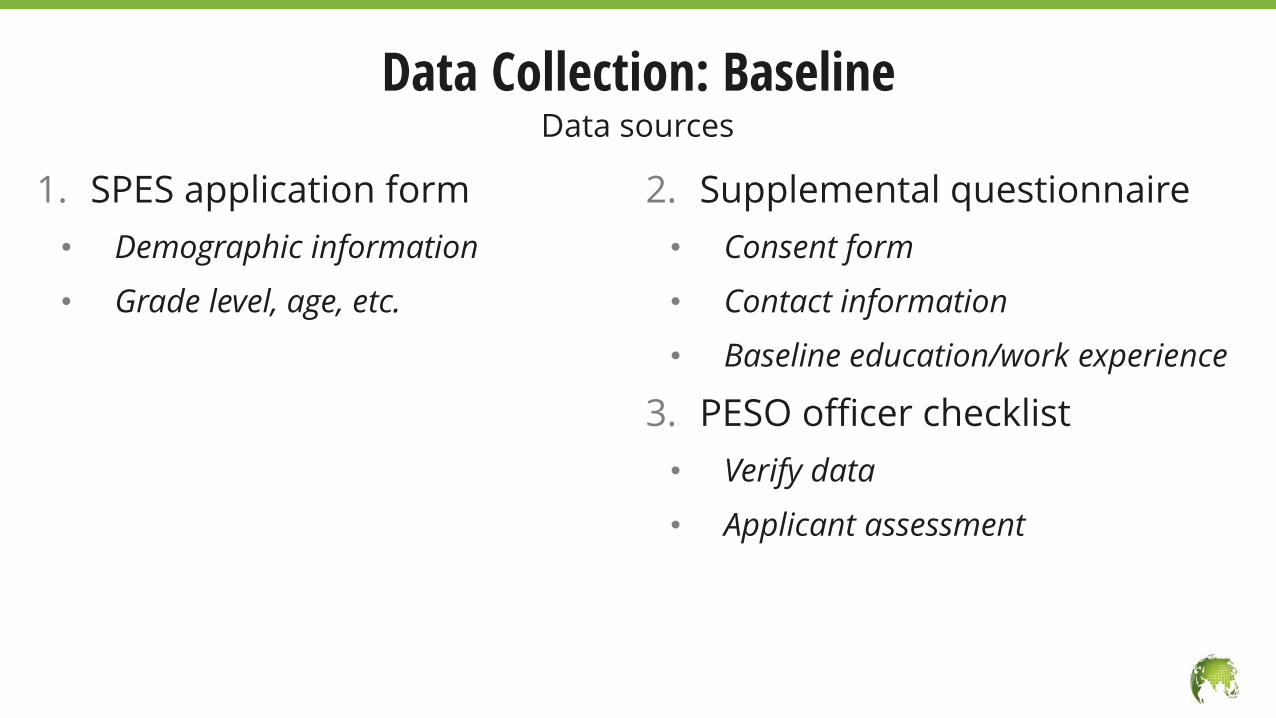
1. SPES application form
• Demographic information
• Grade level, age, etc.
2. Supplemental questionnaire
• Consent form
• Contact information
• Baseline education/work experience
3. PESO officer checklist
• Verify data
• Applicant assessment
Data Collection: BaselineData sources
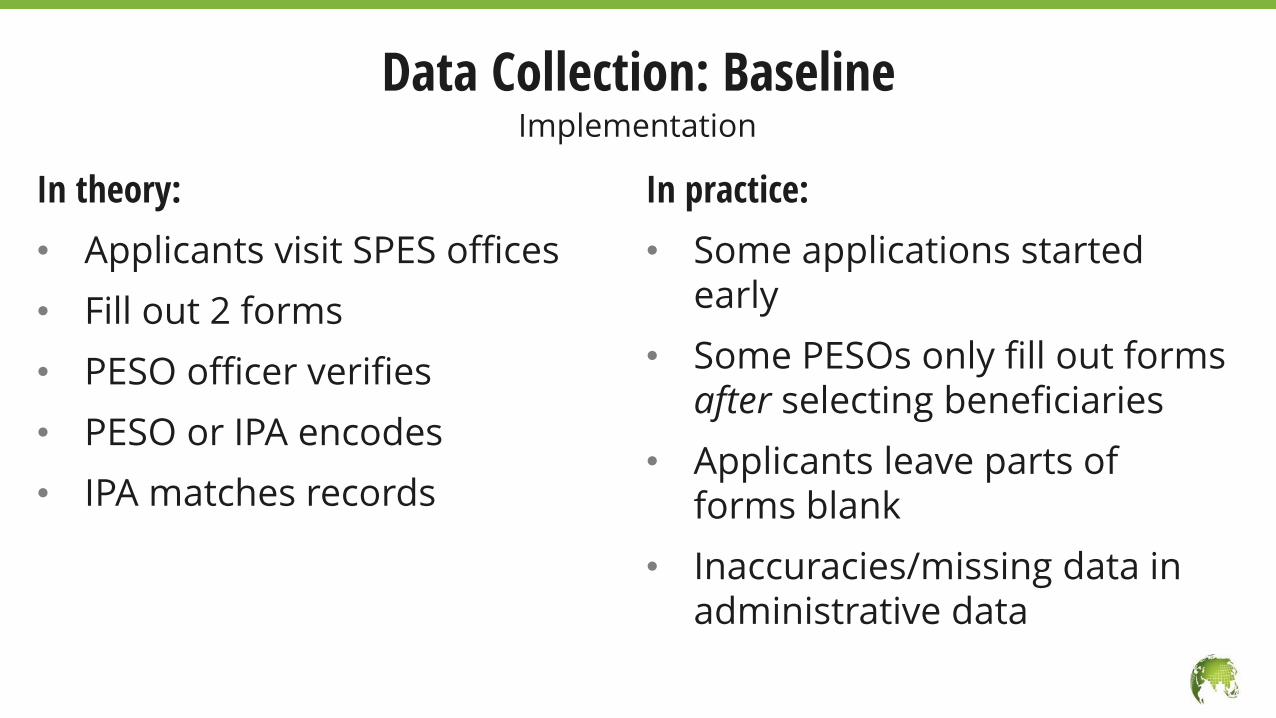
In theory:
• Applicants visit SPES offices
• Fill out 2 forms
• PESO officer verifies
• PESO or IPA encodes
• IPA matches records
In practice:
• Some applications started early
• Some PESOs only fill out forms after selecting beneficiaries
• Applicants leave parts of forms blank
• Inaccuracies/missing data in administrative data
Data Collection: BaselineImplementation
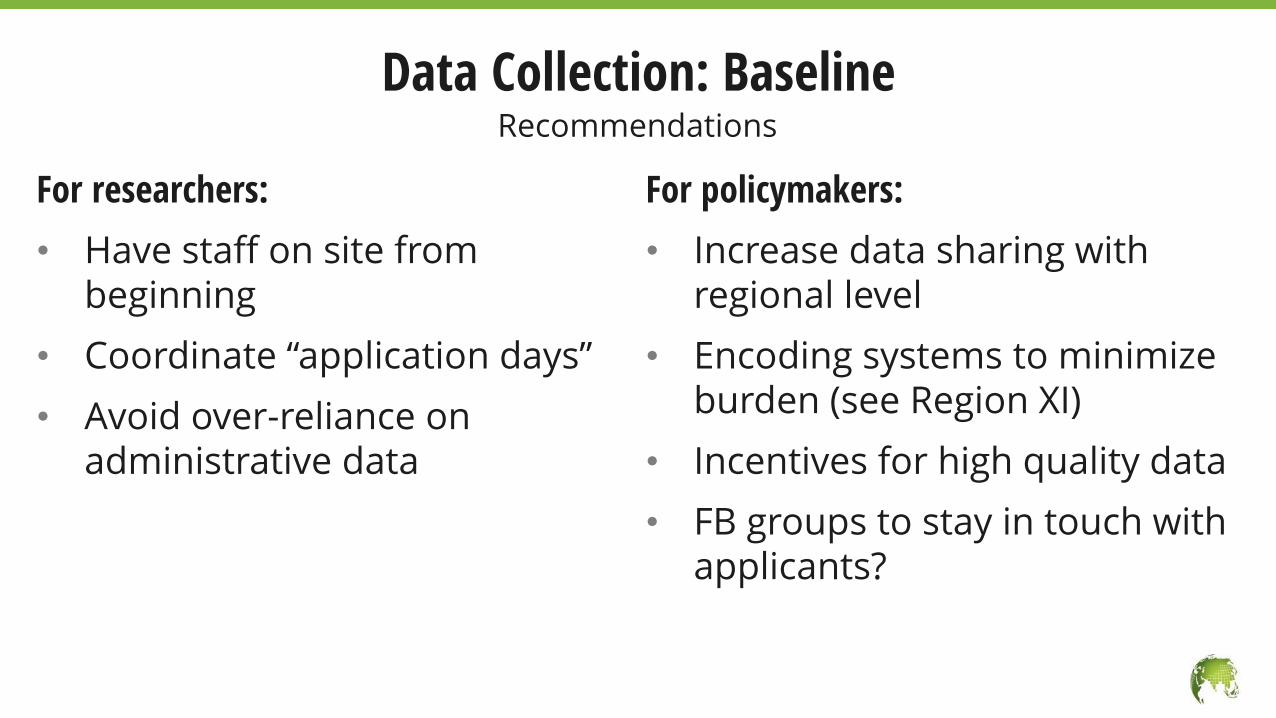
For researchers:
• Have staff on site from beginning
• Coordinate “application days”
• Avoid over-reliance on administrative data
For policymakers:
• Increase data sharing with regional level
• Encoding systems to minimize burden (see Region XI)
• Incentives for high quality data
• FB groups to stay in touch with applicants?
Data Collection: BaselineRecommendations
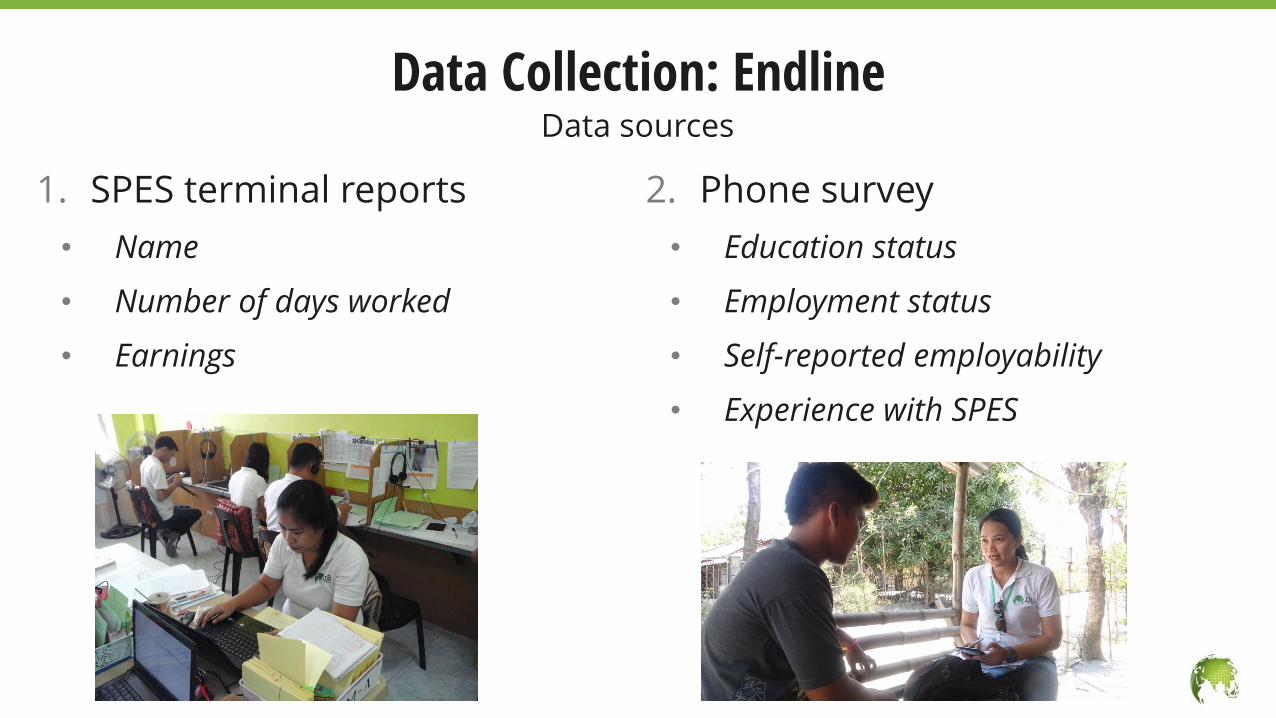
1. SPES terminal reports
• Name
• Number of days worked
• Earnings
2. Phone survey
• Education status
• Employment status
• Self-reported employability
• Experience with SPES
Data Collection: EndlineData sources
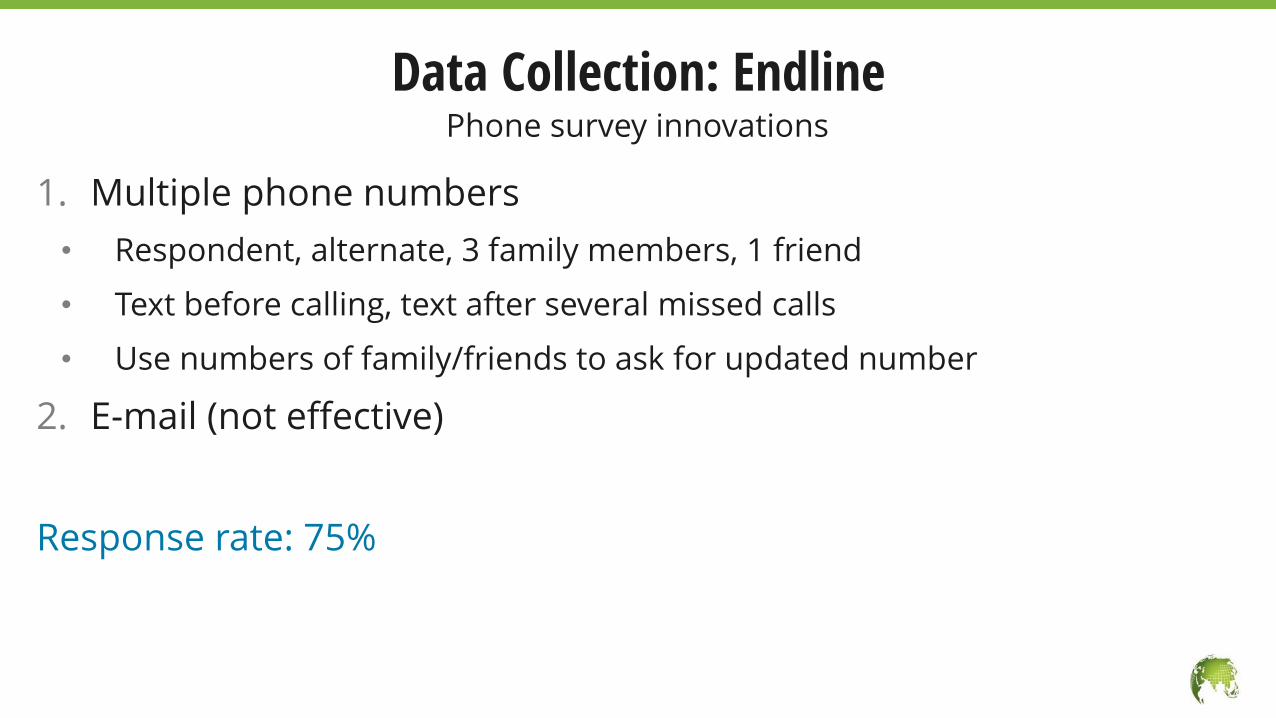
1. Multiple phone numbers
• Respondent, alternate, 3 family members, 1 friend
• Text before calling, text after several missed calls
• Use numbers of family/friends to ask for updated number
2. E-mail (not effective)
Response rate: 75%
Phone survey innovations
Data Collection: Endline
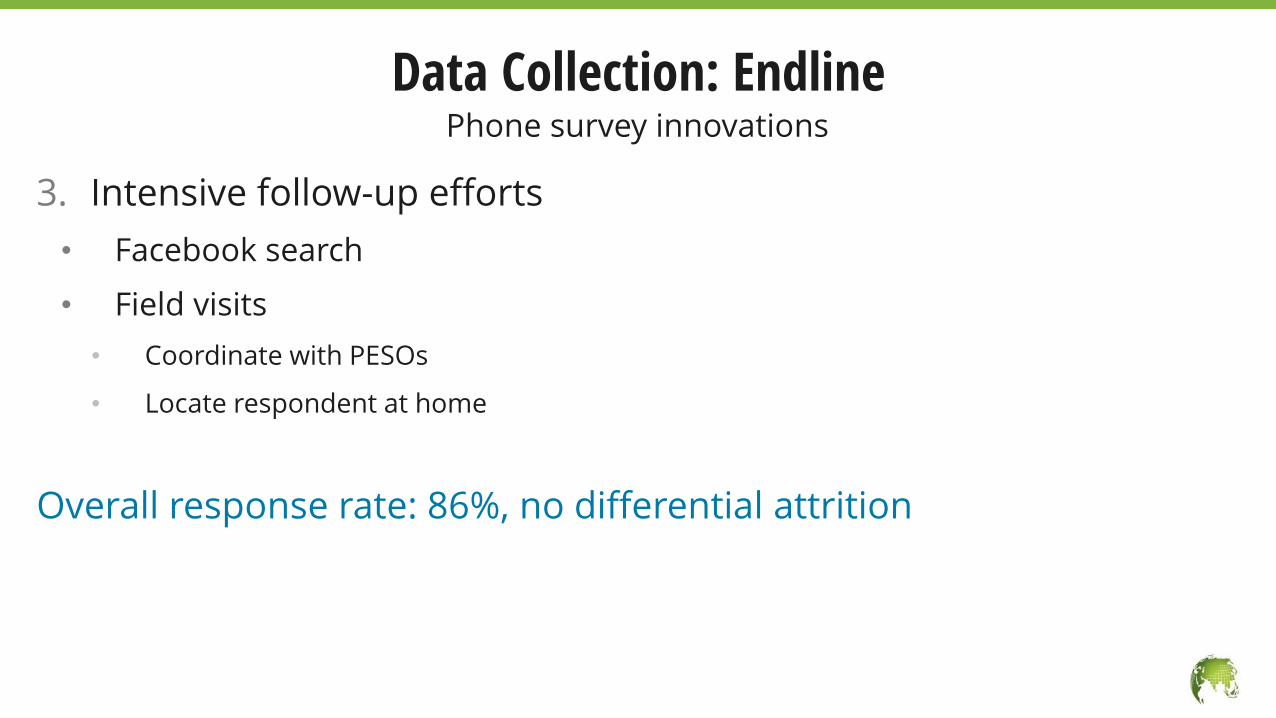
3. Intensive follow-up efforts
• Facebook search
• Field visits
• Coordinate with PESOs
• Locate respondent at home
Overall response rate: 86%, no differential attrition
Phone survey innovations
Data Collection: Endline
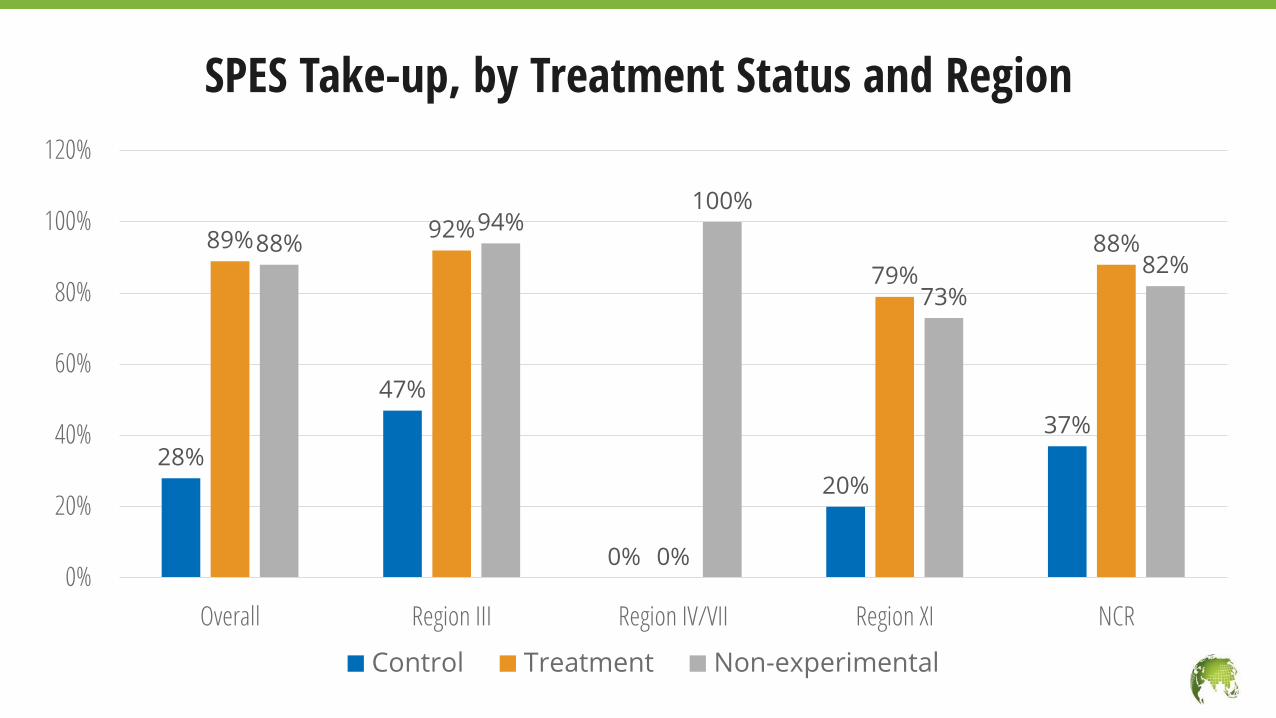
SPES Take-up, by Treatment Status and Region
28%
47%
0%
20%
37%
89% 92%
0%
79%
88%88%94%
100%
73%
82%
0%
20%
40%
60%
80%
100%
120%
Overall Region III Region IV/VII Region XI NCR
Control Treatment Non-experimental
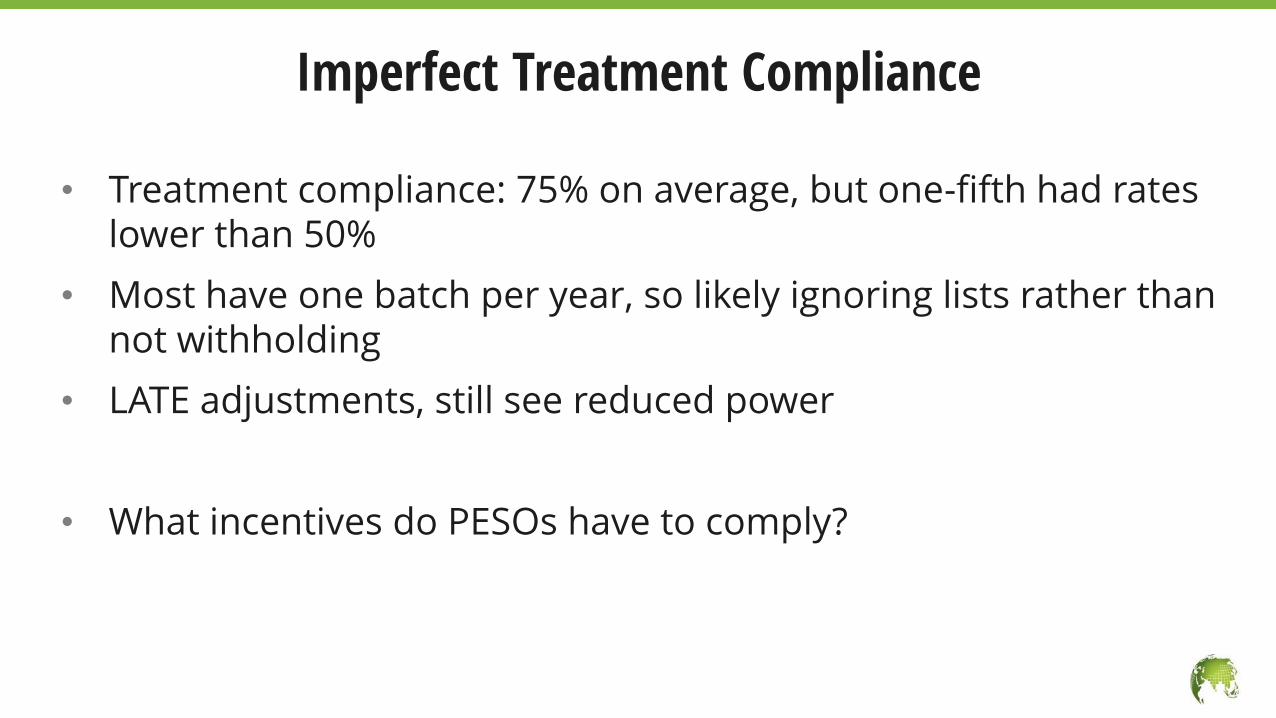
• Treatment compliance: 75% on average, but one-fifth had rates lower than 50%
• Most have one batch per year, so likely ignoring lists rather than not withholding
• LATE adjustments, still see reduced power
• What incentives do PESOs have to comply?
Imperfect Treatment Compliance
3. Who Does SPES Target?
Who are the “poor but deserving”?
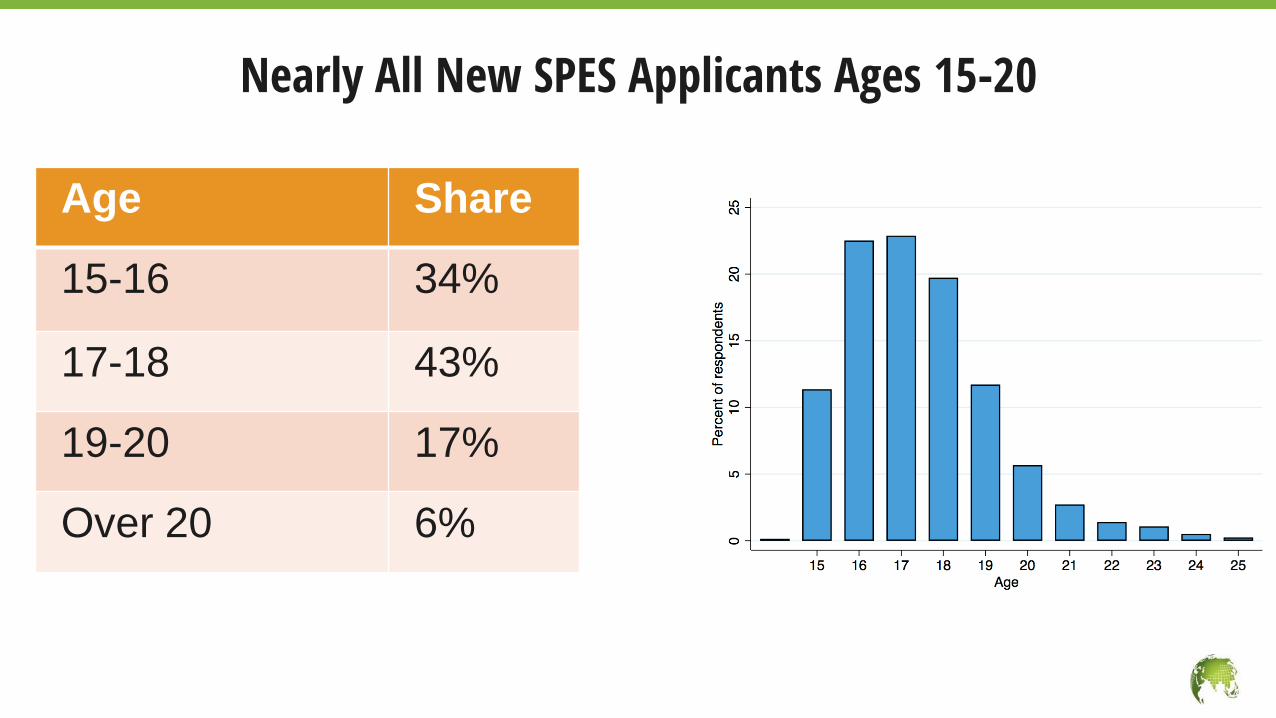
Age Share
15-16 34%
17-18 43%
19-20 17%
Over 20 6%
Nearly All New SPES Applicants Ages 15-20
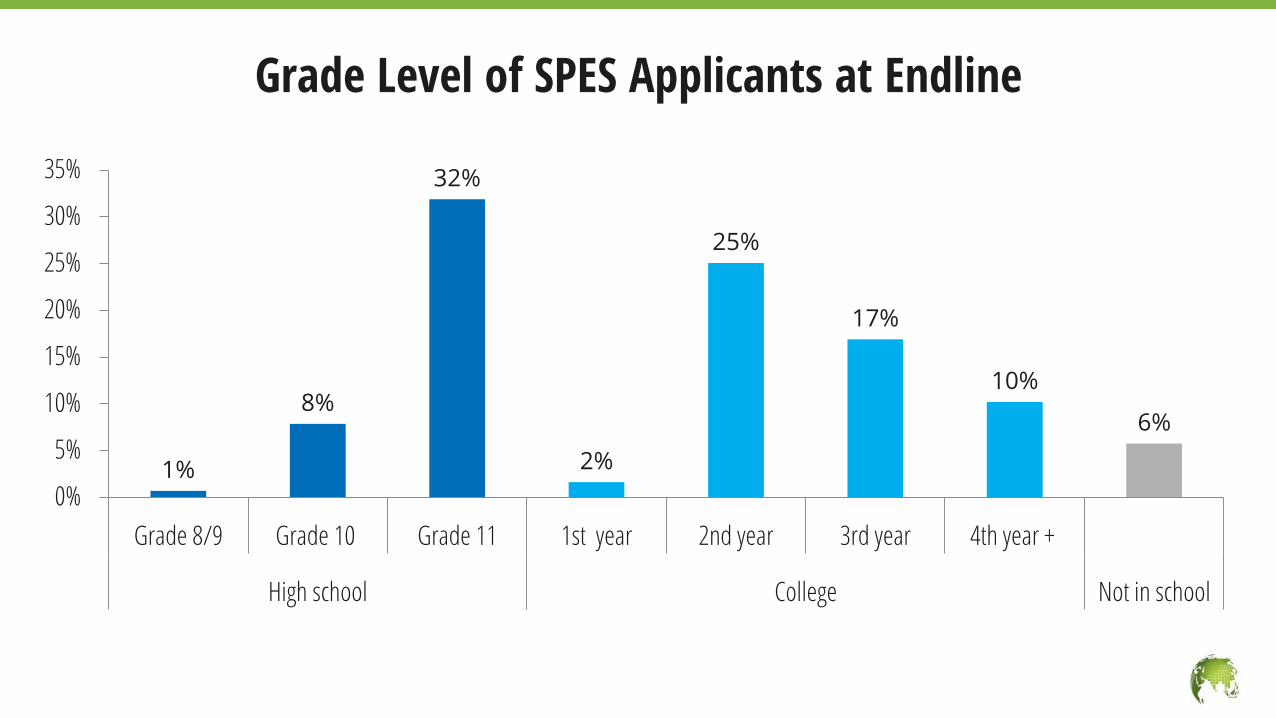
Grade Level of SPES Applicants at Endline
1%
8%
32%
2%
25%
17%
10%
6%
0%
5%
10%
15%
20%
25%
30%
35%
Grade 8/9 Grade 10 Grade 11 1st year 2nd year 3rd year 4th year +
High school College Not in school
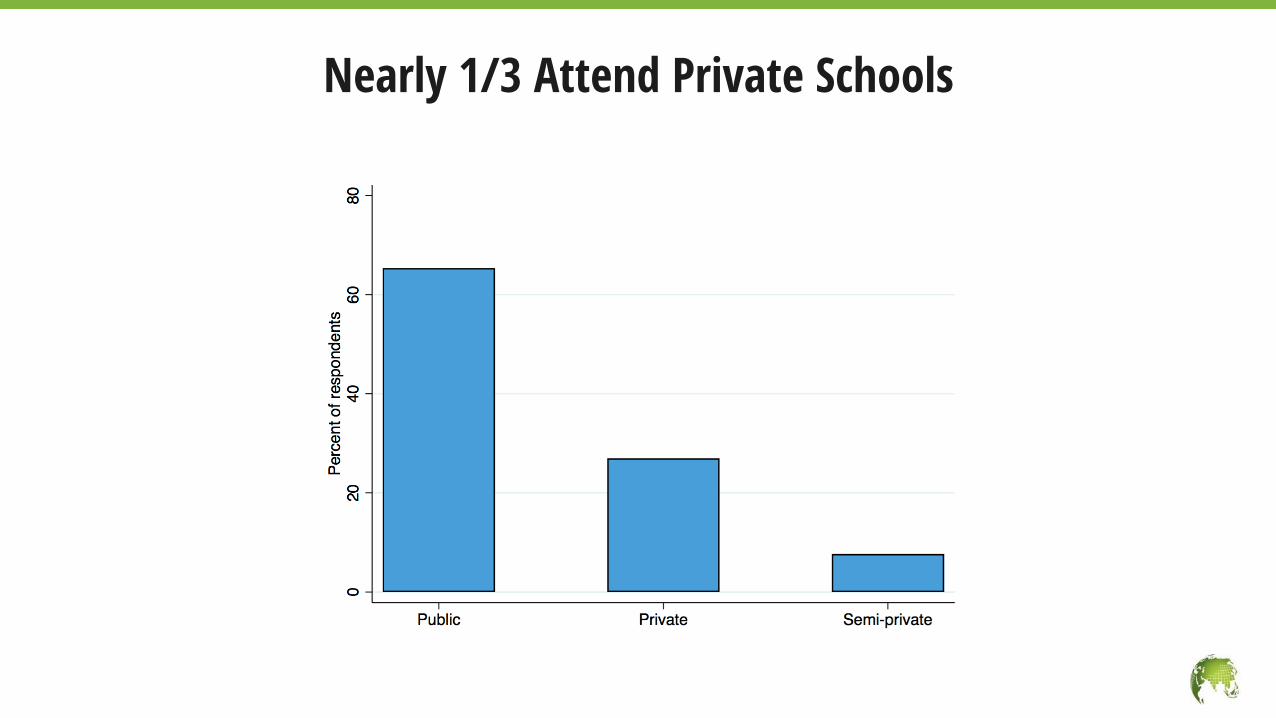
Nearly 1/3 Attend Private Schools
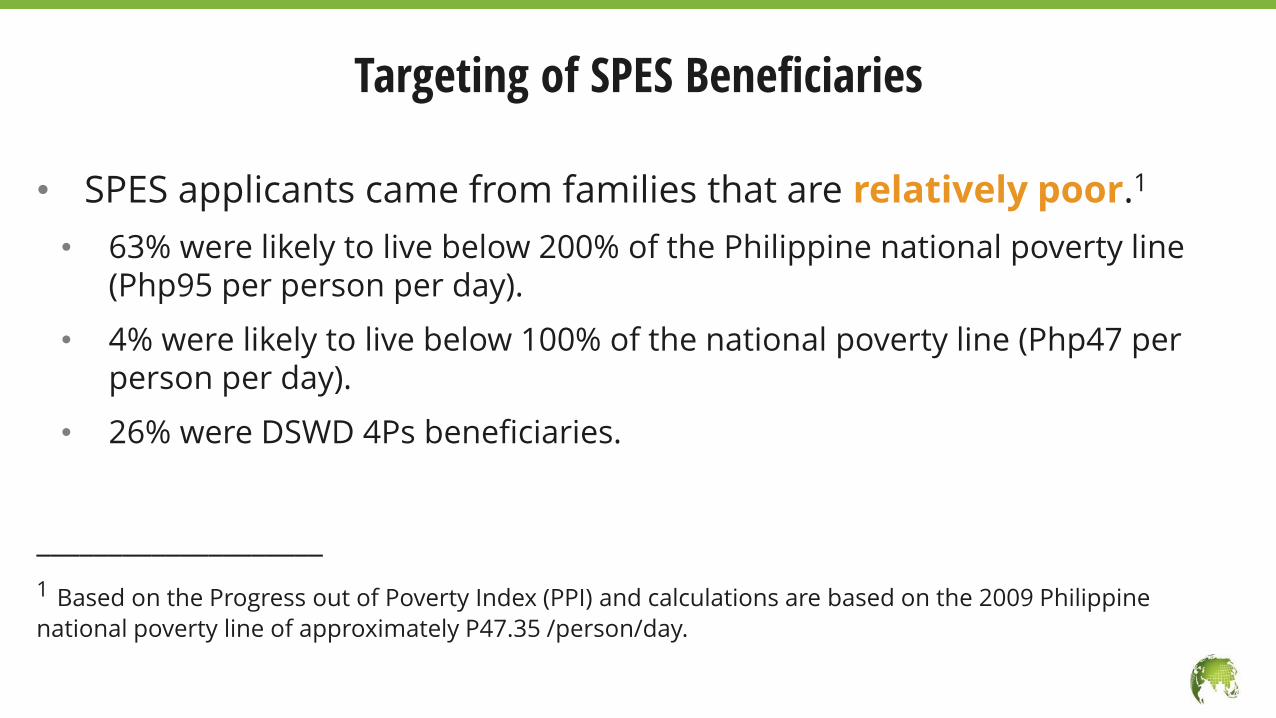
• SPES applicants came from families that are relatively poor.1
• 63% were likely to live below 200% of the Philippine national poverty line (Php95 per person per day).
• 4% were likely to live below 100% of the national poverty line (Php47 per person per day).
• 26% were DSWD 4Ps beneficiaries.
____________________
1 Based on the Progress out of Poverty Index (PPI) and calculations are based on the 2009 Philippine
national poverty line of approximately P47.35 /person/day.
Targeting of SPES Beneficiaries
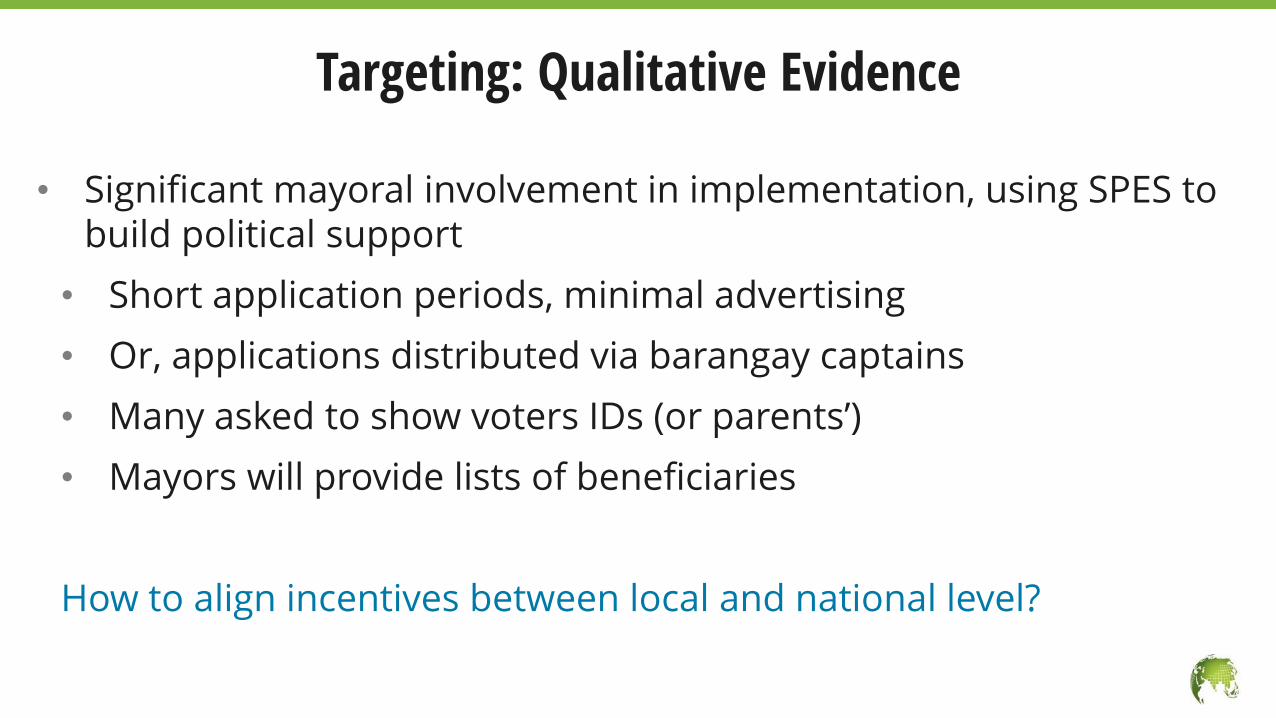
• Significant mayoral involvement in implementation, using SPES to build political support
• Short application periods, minimal advertising
• Or, applications distributed via barangay captains
• Many asked to show voters IDs (or parents’)
• Mayors will provide lists of beneficiaries
How to align incentives between local and national level?
Targeting: Qualitative Evidence
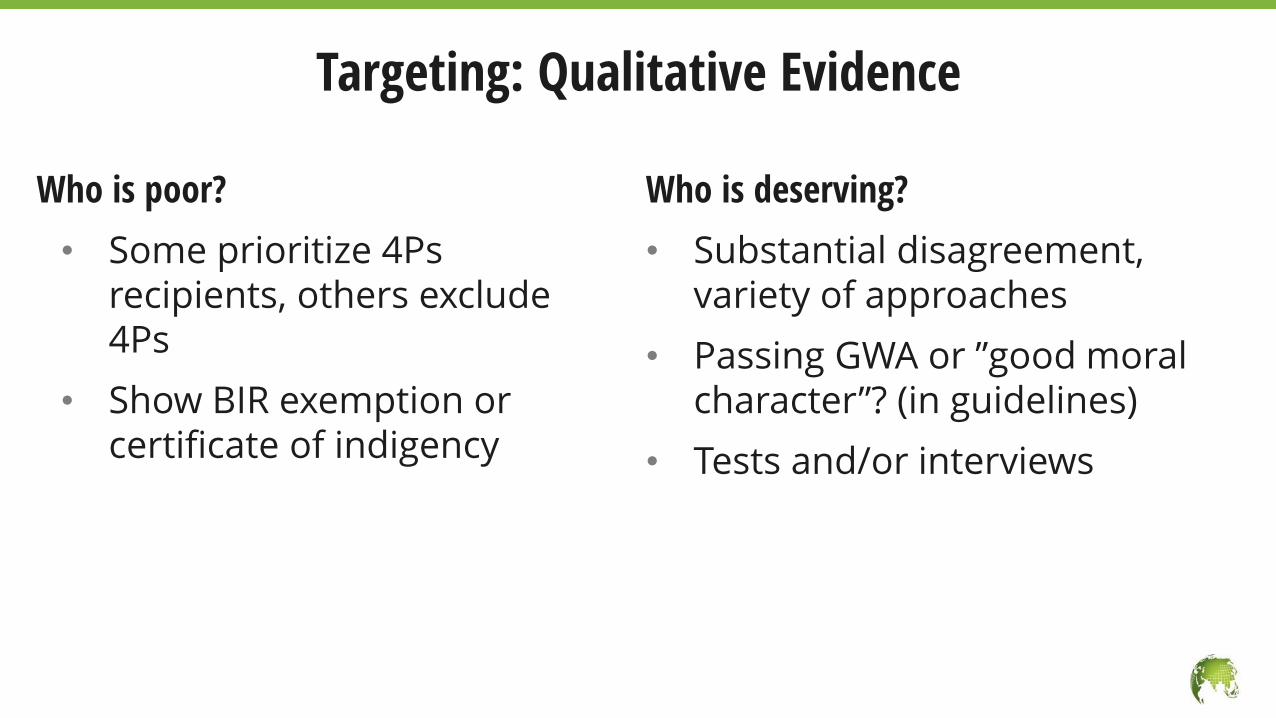
Who is poor?
• Some prioritize 4Ps recipients, others exclude 4Ps
• Show BIR exemption or certificate of indigency
Who is deserving?
• Substantial disagreement, variety of approaches
• Passing GWA or ”good moral character”? (in guidelines)
• Tests and/or interviews
Targeting: Qualitative Evidence
4. Impact Evaluation Findings
EducationRQ1: What is the causal impact of SPES on
youths’ academic outcomes?
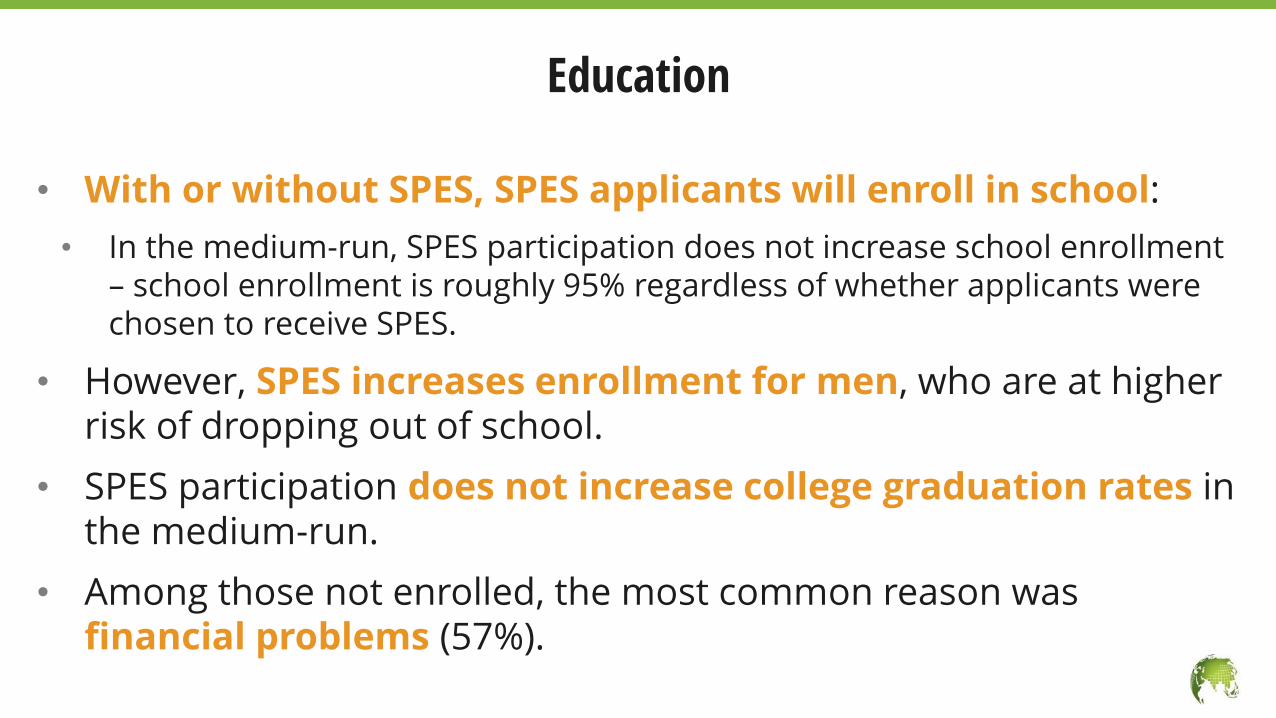
• With or without SPES, SPES applicants will enroll in school:
• In the medium-run, SPES participation does not increase school enrollment – school enrollment is roughly 95% regardless of whether applicants were chosen to receive SPES.
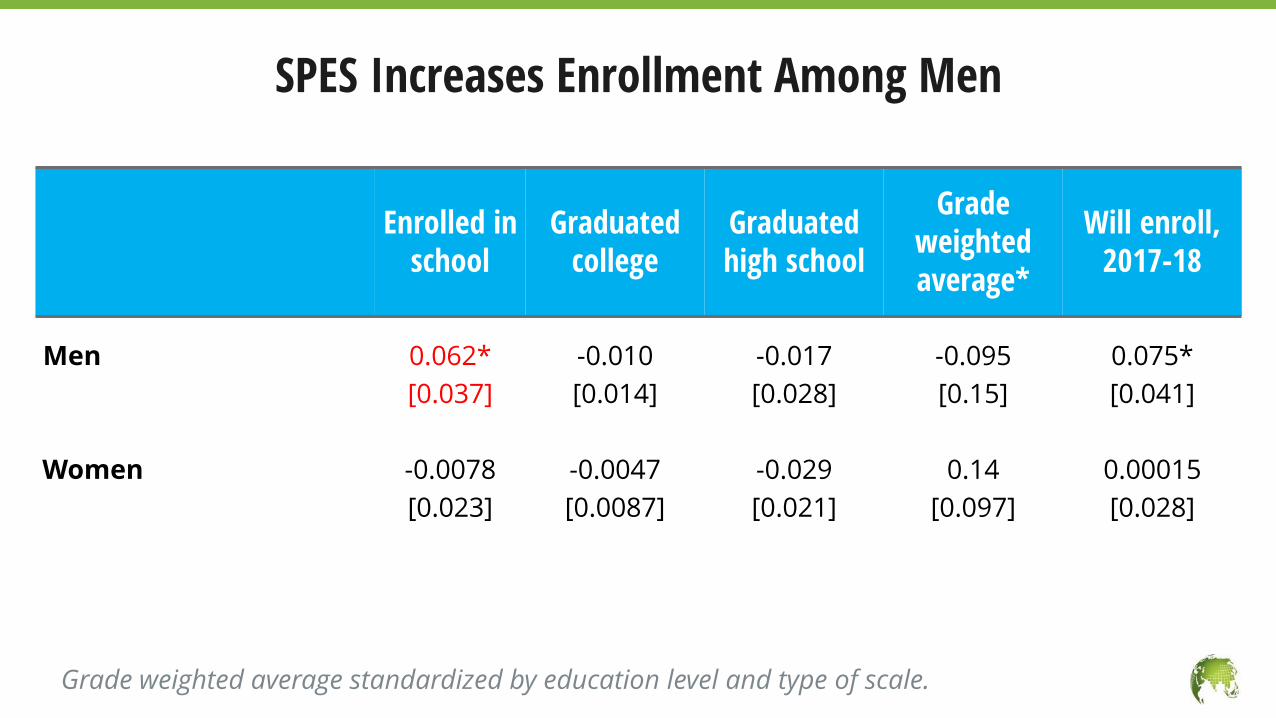
• However, SPES increases enrollment for men, who are at higher risk of dropping out of school.
• SPES participation does not increase college graduation rates in the medium-run.
• Among those not enrolled, the most common reason was financial problems (57%).
Education
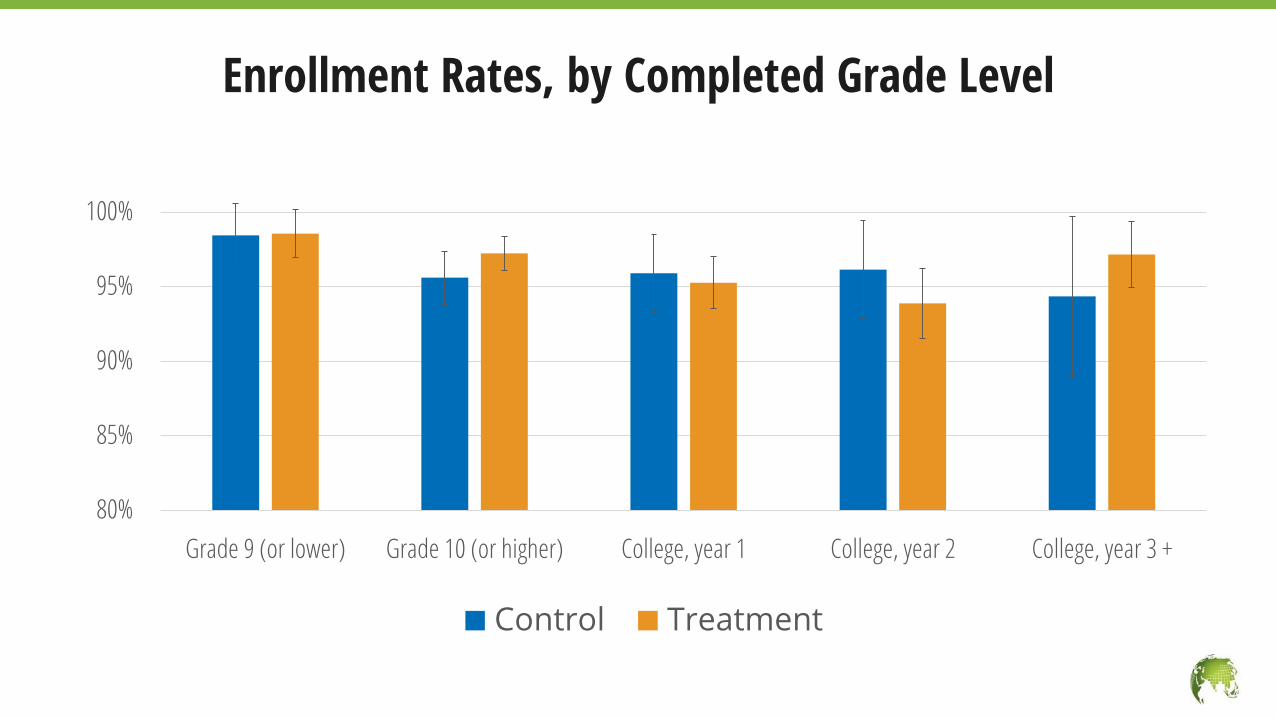
Enrollment Rates, by Completed Grade Level
80%
85%
90%
95%
100%
Grade 9 (or lower) Grade 10 (or higher) College, year 1 College, year 2 College, year 3 +
Control Treatment
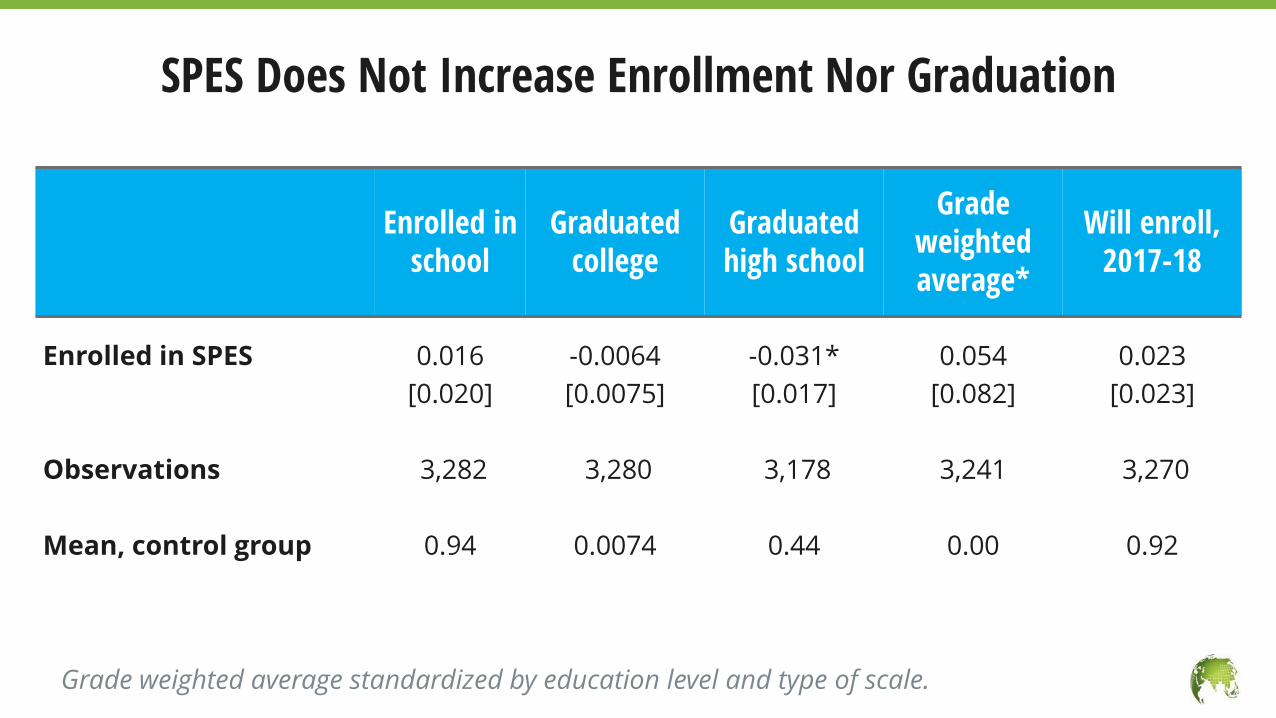
Enrolled in school
Graduated college
Graduated high school
Grade weighted average*
Will enroll, 2017-18
Enrolled in SPES 0.016 -0.0064 -0.031* 0.054 0.023
[0.020] [0.0075] [0.017] [0.082] [0.023]
Observations 3,282 3,280 3,178 3,241 3,270
Mean, control group 0.94 0.0074 0.44 0.00 0.92
SPES Does Not Increase Enrollment Nor Graduation
Grade weighted average standardized by education level and type of scale.
Enrolled in school
Graduated college
Graduated high school
Grade weighted average*
Will enroll, 2017-18
Men 0.062* -0.010 -0.017 -0.095 0.075*
[0.037] [0.014] [0.028] [0.15] [0.041]
Women -0.0078 -0.0047 -0.029 0.14 0.00015
[0.023] [0.0087] [0.021] [0.097] [0.028]
SPES Increases Enrollment Among Men
Grade weighted average standardized by education level and type of scale.
Enrolled in school
Graduated college
Graduated high school
Grade weighted average*
Will enroll, 2017-18
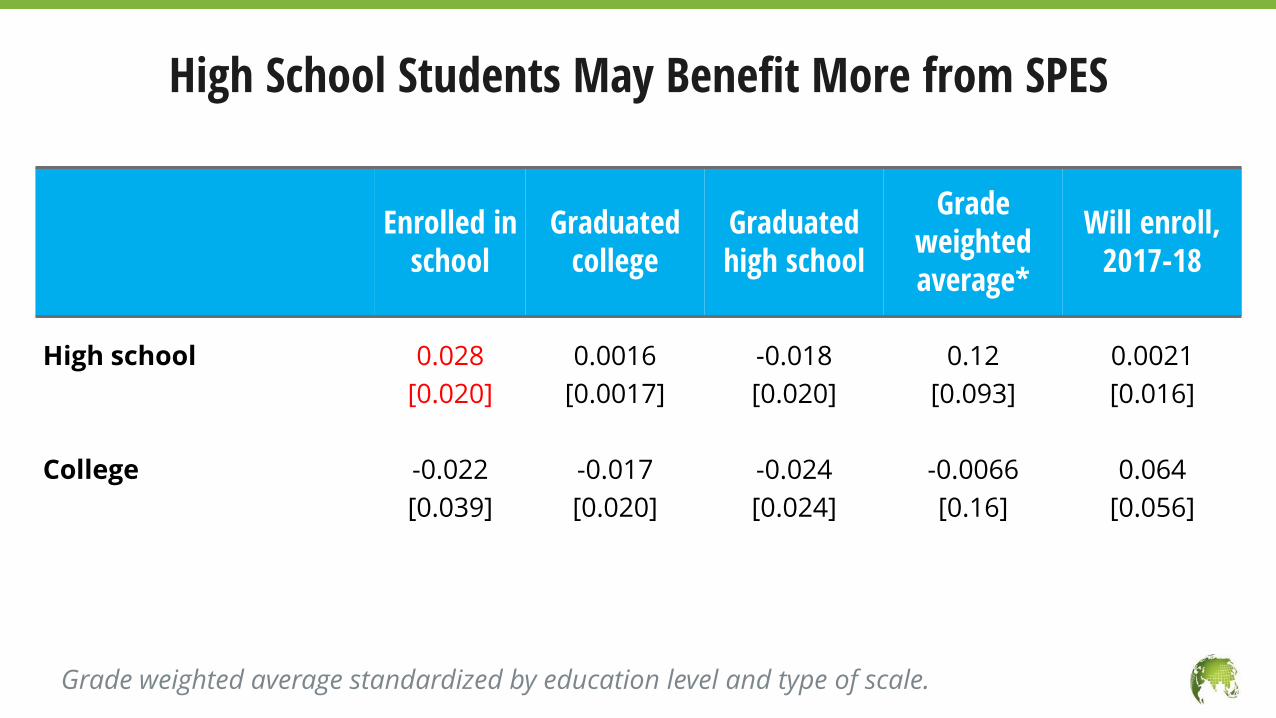
High school 0.028 0.0016 -0.018 0.12 0.0021
[0.020] [0.0017] [0.020] [0.093] [0.016]
College -0.022 -0.017 -0.024 -0.0066 0.064
[0.039] [0.020] [0.024] [0.16] [0.056]
High School Students May Benefit More from SPES
Grade weighted average standardized by education level and type of scale.
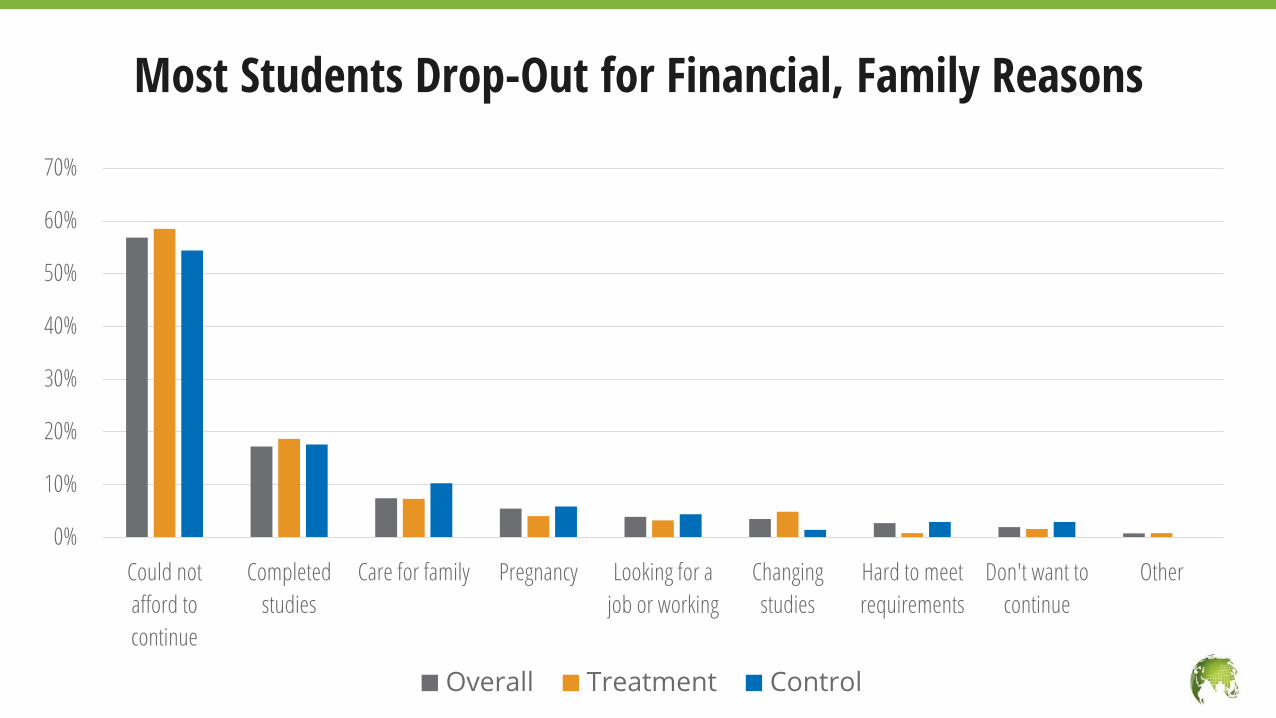
Most Students Drop-Out for Financial, Family Reasons
0%
10%
20%
30%
40%
50%
60%
70%
Could not
afford to
continue
Completed
studies
Care for family Pregnancy Looking for a
job or working
Changing
studies
Hard to meet
requirements
Don't want to
continue
Other
Overall Treatment Control
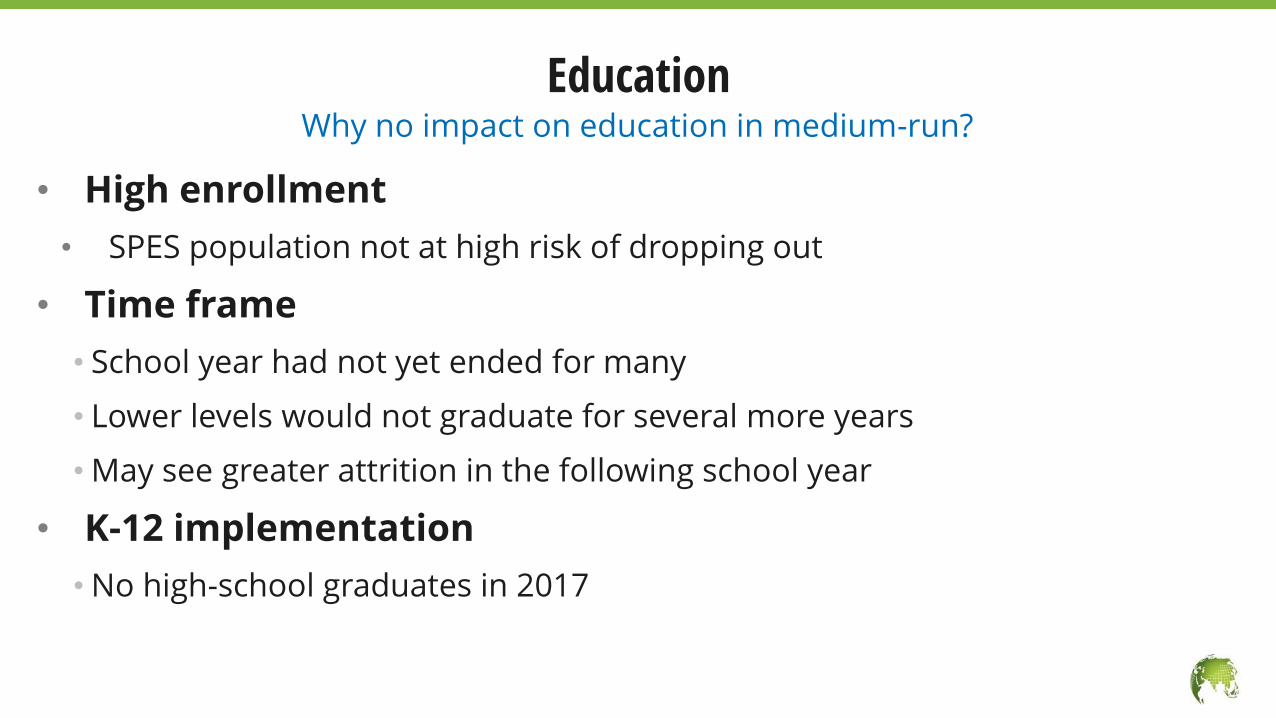
• High enrollment
• SPES population not at high risk of dropping out
• Time frame
• School year had not yet ended for many
• Lower levels would not graduate for several more years
• May see greater attrition in the following school year
• K-12 implementation
• No high-school graduates in 2017
Why no impact on education in medium-run?
Education
EmployabilityRQ2: What is the causal impact of SPES on
youth employability?
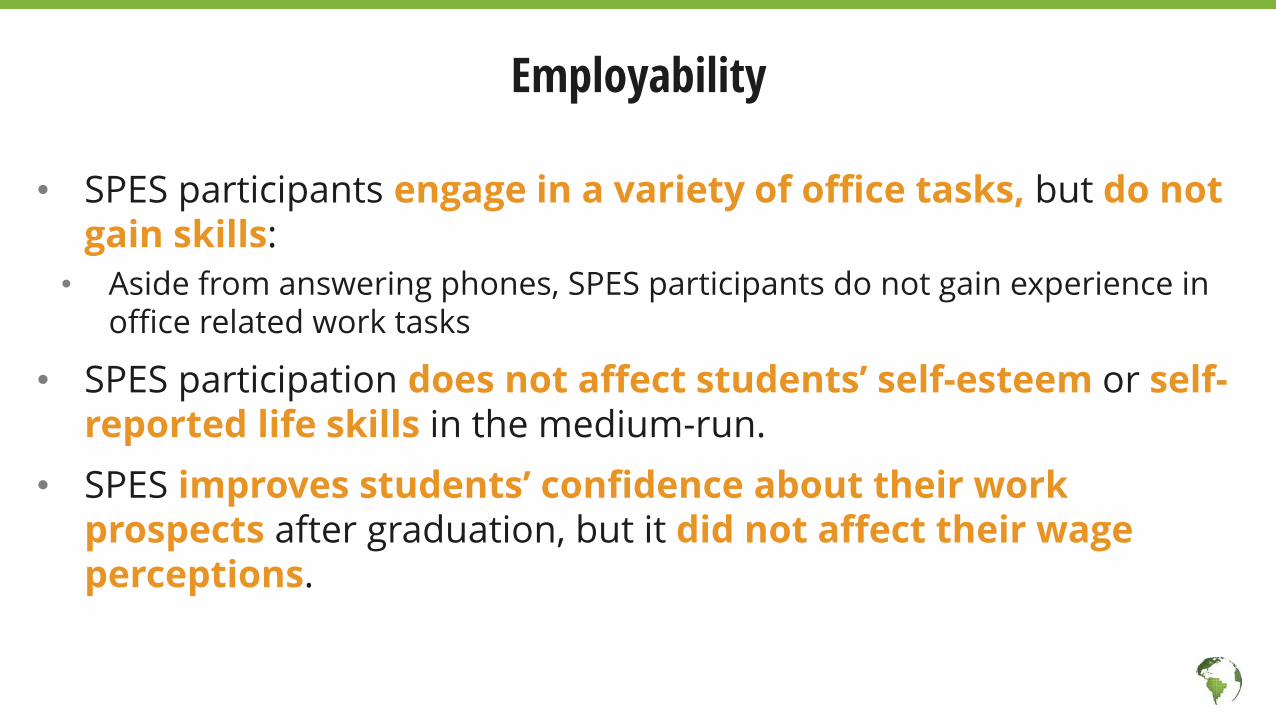
• SPES participants engage in a variety of office tasks, but do not gain skills:
• Aside from answering phones, SPES participants do not gain experience in office related work tasks
• SPES participation does not affect students’ self-esteem or self-reported life skills in the medium-run.
• SPES improves students’ confidence about their work prospects after graduation, but it did not affect their wage perceptions.
Employability
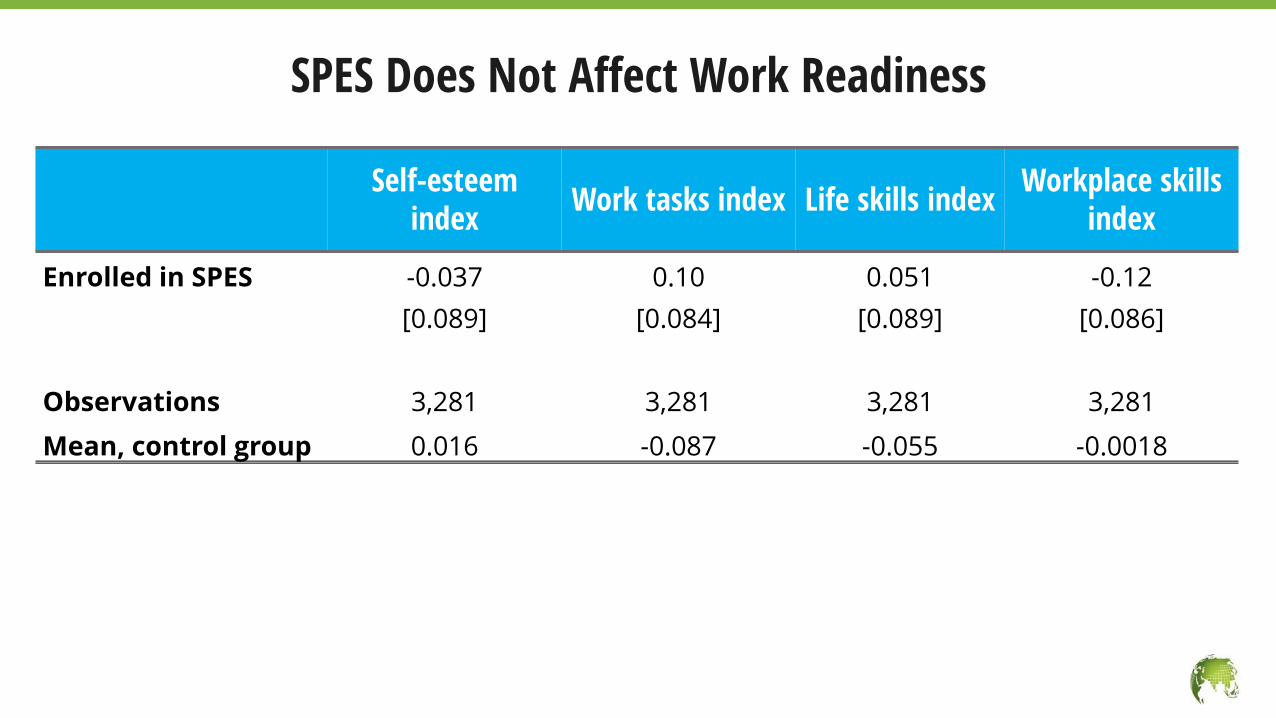
SPES Does Not Affect Work Readiness
Self-esteem index
Work tasks index Life skills indexWorkplace skills
index
Enrolled in SPES -0.037 0.10 0.051 -0.12
[0.089] [0.084] [0.089] [0.086]
Observations 3,281 3,281 3,281 3,281
Mean, control group 0.016 -0.087 -0.055 -0.0018
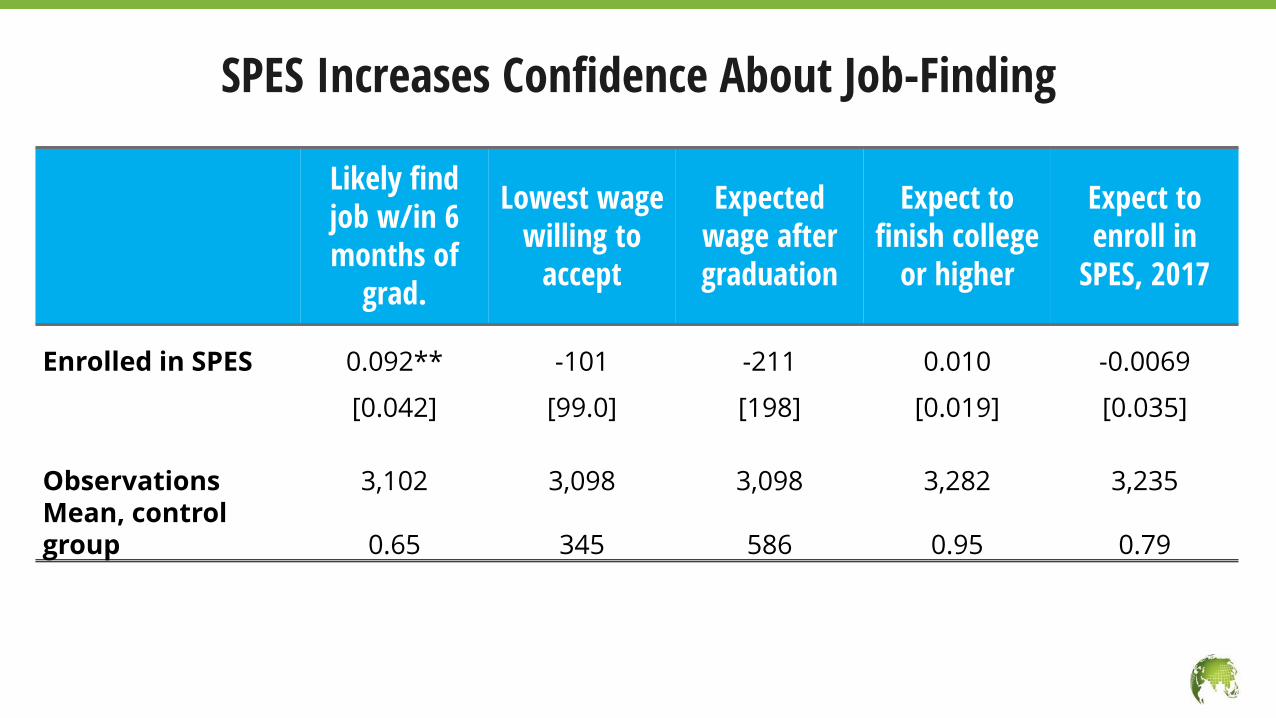
SPES Increases Confidence About Job-Finding
Likely find job w/in 6 months of
grad.
Lowest wage willing to
accept
Expected wage after graduation
Expect to finish college
or higher
Expect to enroll in
SPES, 2017
Enrolled in SPES 0.092** -101 -211 0.010 -0.0069
[0.042] [99.0] [198] [0.019] [0.035]
Observations 3,102 3,098 3,098 3,282 3,235Mean, control group 0.65 345 586 0.95 0.79
Employment
RQ3: What is the impact of SPES on youth employment and job search?
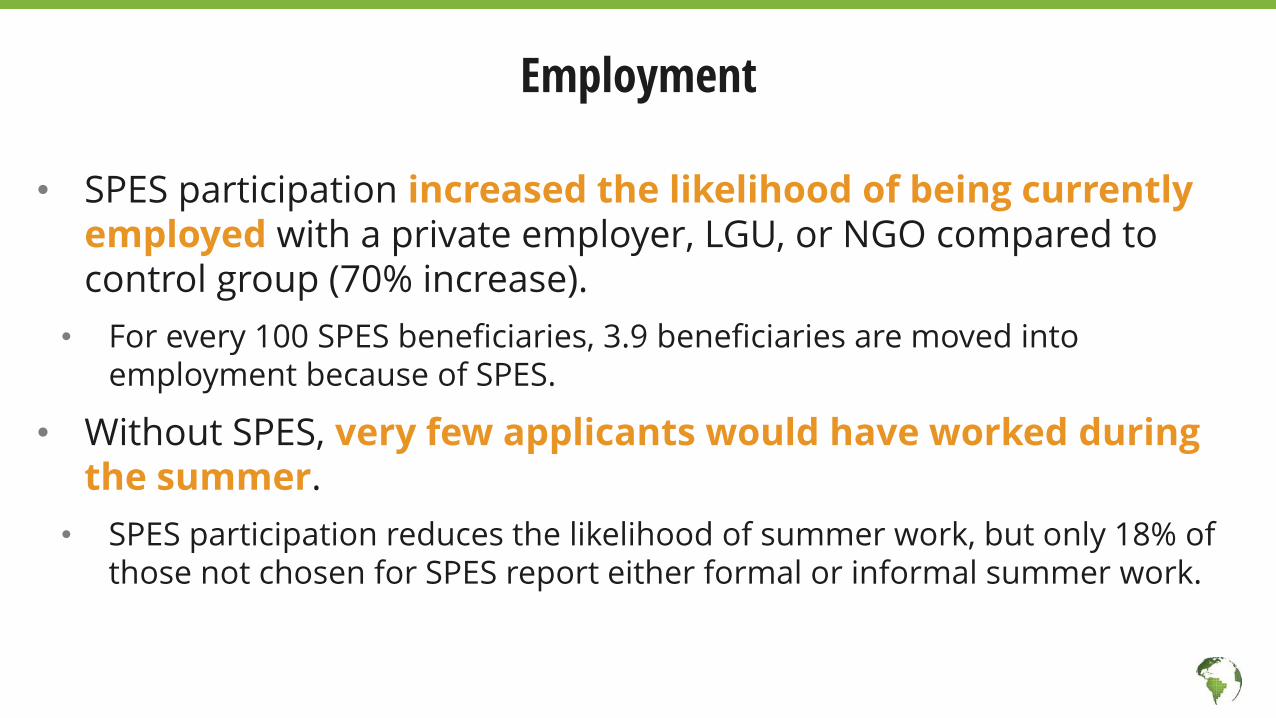
• SPES participation increased the likelihood of being currently employed with a private employer, LGU, or NGO compared to control group (70% increase).
• For every 100 SPES beneficiaries, 3.9 beneficiaries are moved into employment because of SPES.
• Without SPES, very few applicants would have worked during the summer.
• SPES participation reduces the likelihood of summer work, but only 18% of those not chosen for SPES report either formal or informal summer work.
Employment
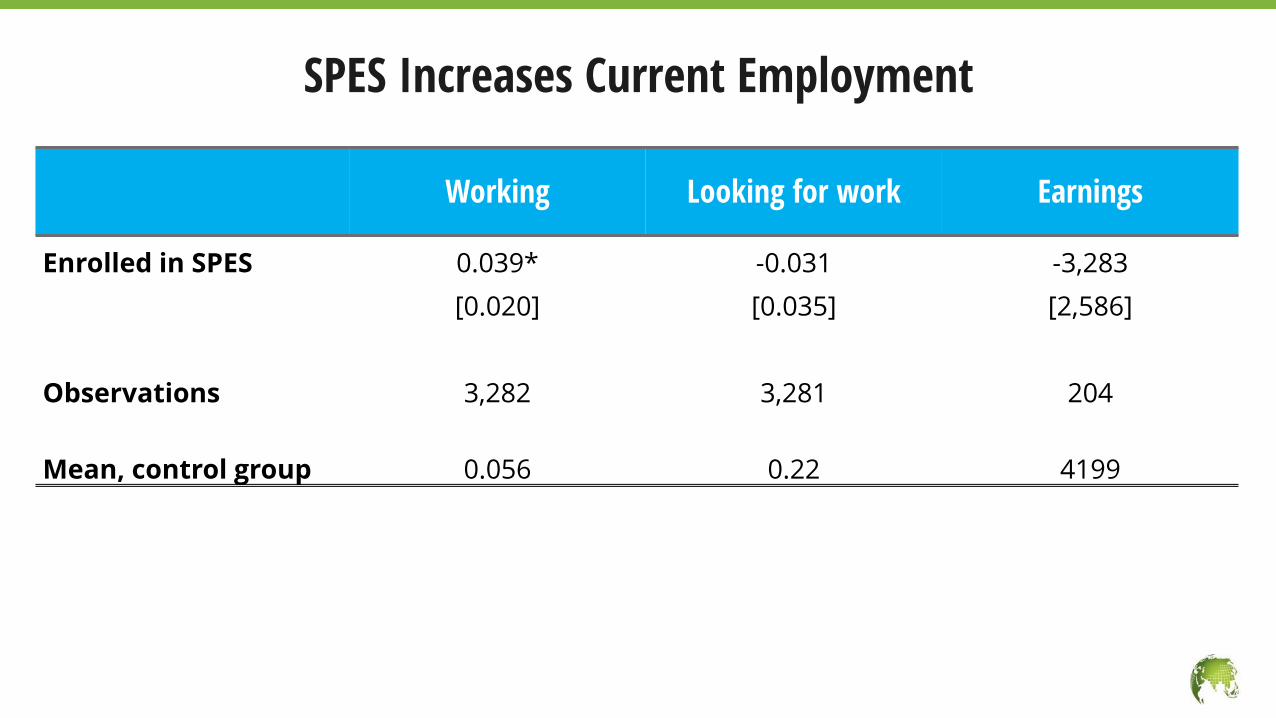
SPES Increases Current Employment
Working Looking for work Earnings
Enrolled in SPES 0.039* -0.031 -3,283
[0.020] [0.035] [2,586]
Observations 3,282 3,281 204
Mean, control group 0.056 0.22 4199
Cost Effectiveness
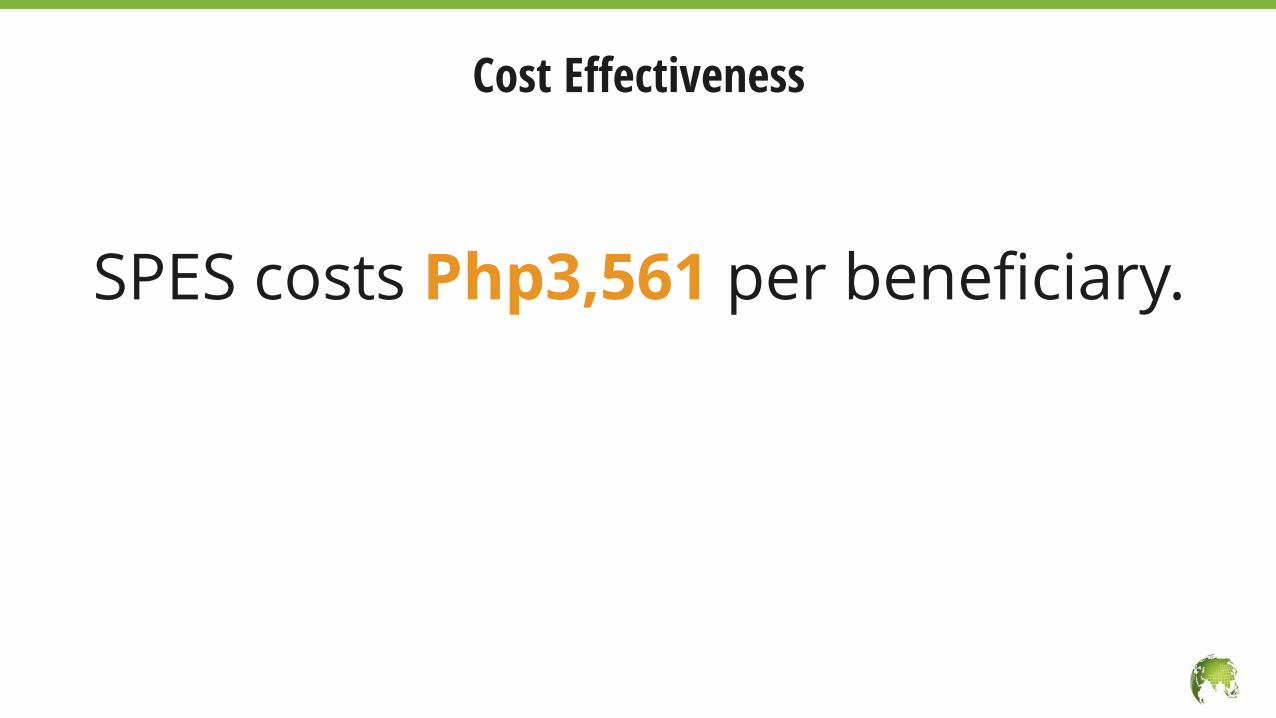
SPES costs Php3,561 per beneficiary.
Cost Effectiveness
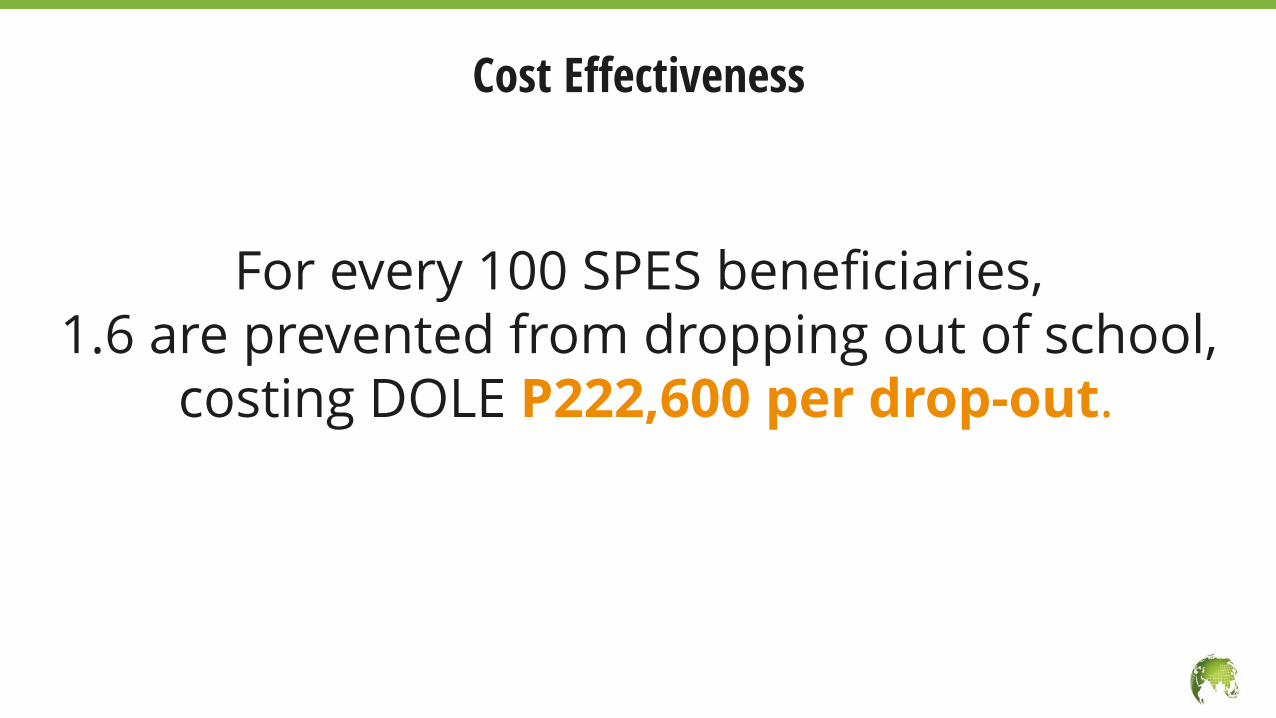
Cost Effectiveness
For every 100 SPES beneficiaries,1.6 are prevented from dropping out of school,
costing DOLE P222,600 per drop-out.
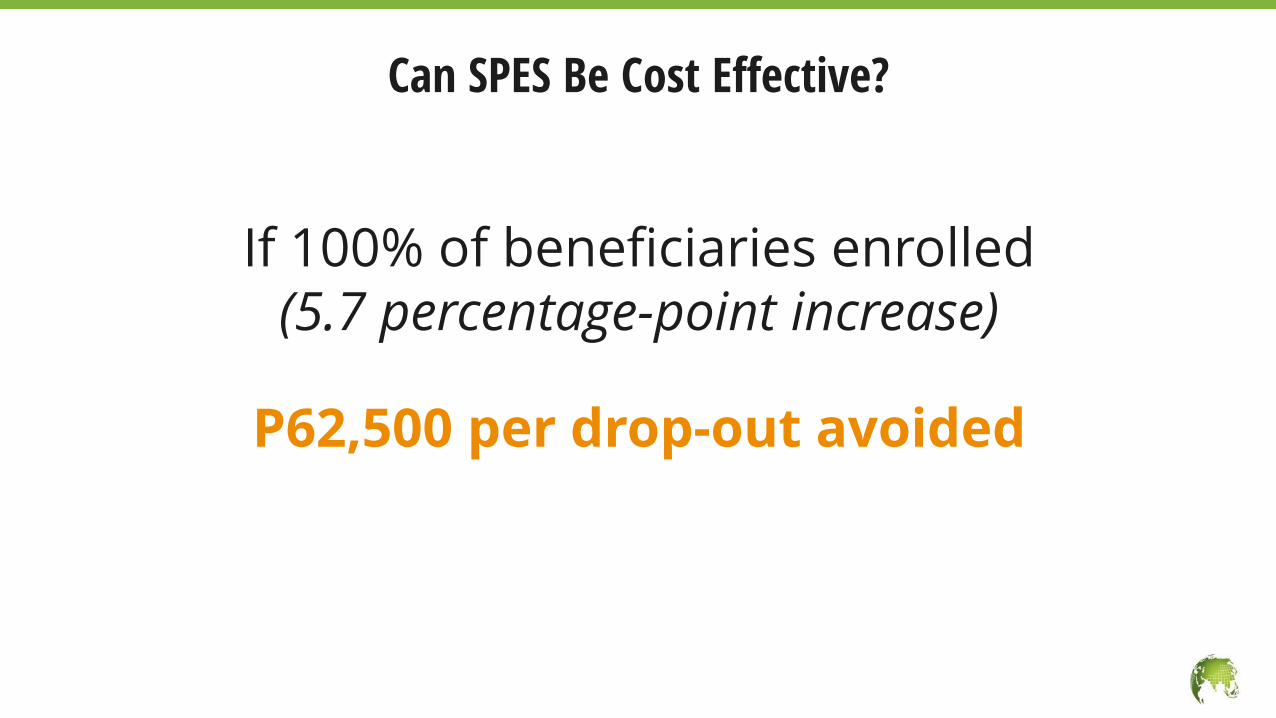
If 100% of beneficiaries enrolled (5.7 percentage-point increase)
P62,500 per drop-out avoided
Can SPES Be Cost Effective?

Cost Effectiveness
For every 100 SPES beneficiaries,3.9 are moved into work,
at a cost of Php91,318 per eventual job found.
Beneficiaries’ Experience of SPES
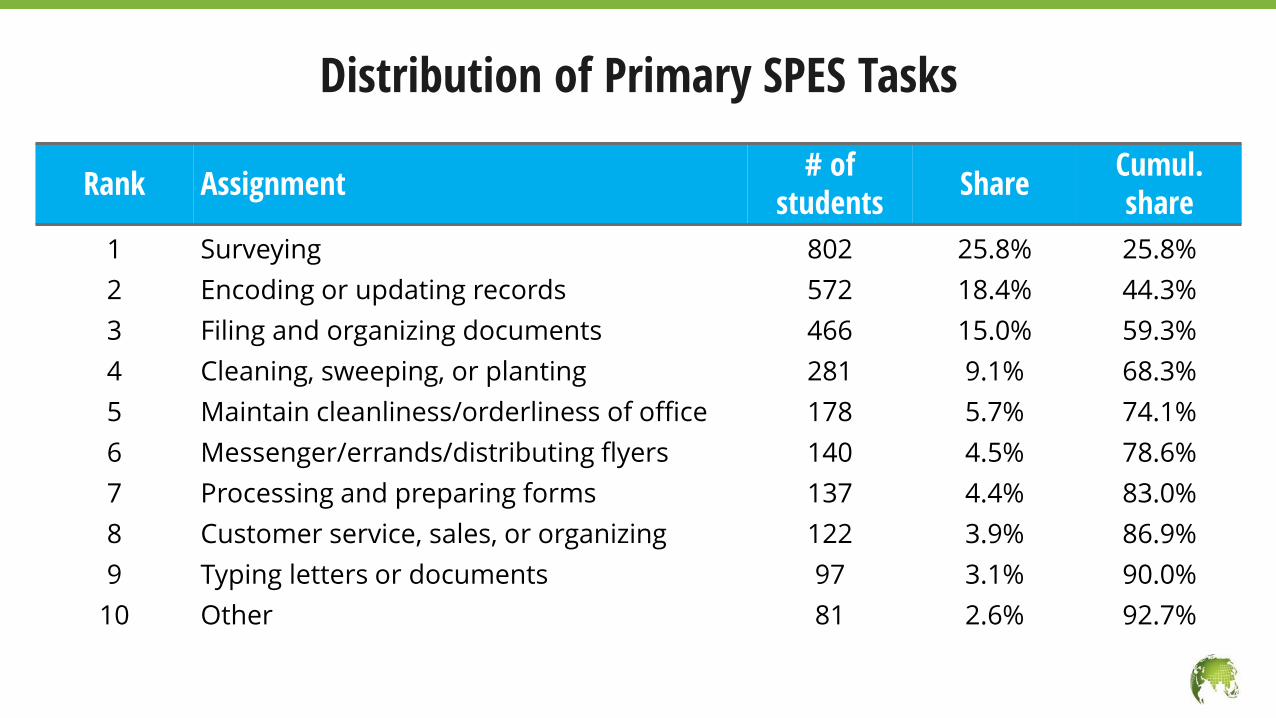
Distribution of Primary SPES Tasks
Rank Assignment# of
studentsShare
Cumul. share
1 Surveying 802 25.8% 25.8%
2 Encoding or updating records 572 18.4% 44.3%
3 Filing and organizing documents 466 15.0% 59.3%
4 Cleaning, sweeping, or planting 281 9.1% 68.3%
5 Maintain cleanliness/orderliness of office 178 5.7% 74.1%
6 Messenger/errands/distributing flyers 140 4.5% 78.6%
7 Processing and preparing forms 137 4.4% 83.0%
8 Customer service, sales, or organizing 122 3.9% 86.9%
9 Typing letters or documents 97 3.1% 90.0%
10 Other 81 2.6% 92.7%
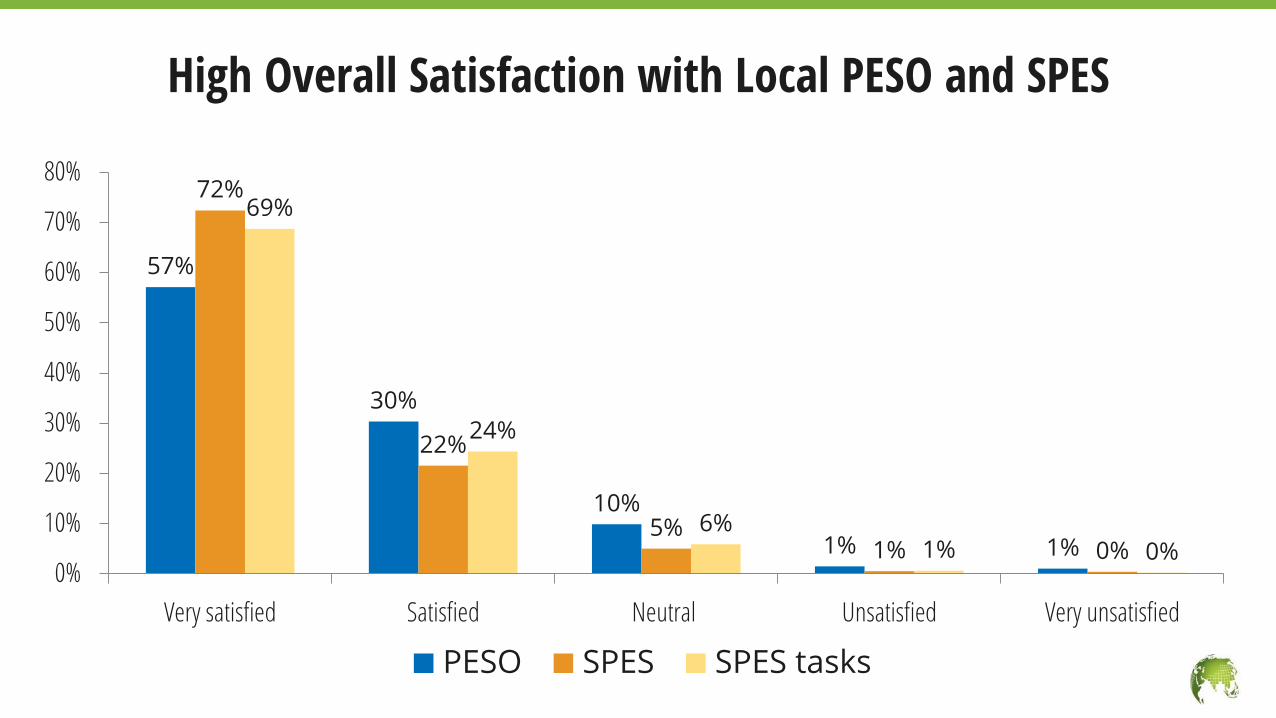
High Overall Satisfaction with Local PESO and SPES
57%
30%
10%
1% 1%
72%
22%
5%1% 0%
69%
24%
6%1% 0%
0%
10%
20%
30%
40%
50%
60%
70%
80%
Very satisfied Satisfied Neutral Unsatisfied Very unsatisfied
PESO SPES SPES tasks
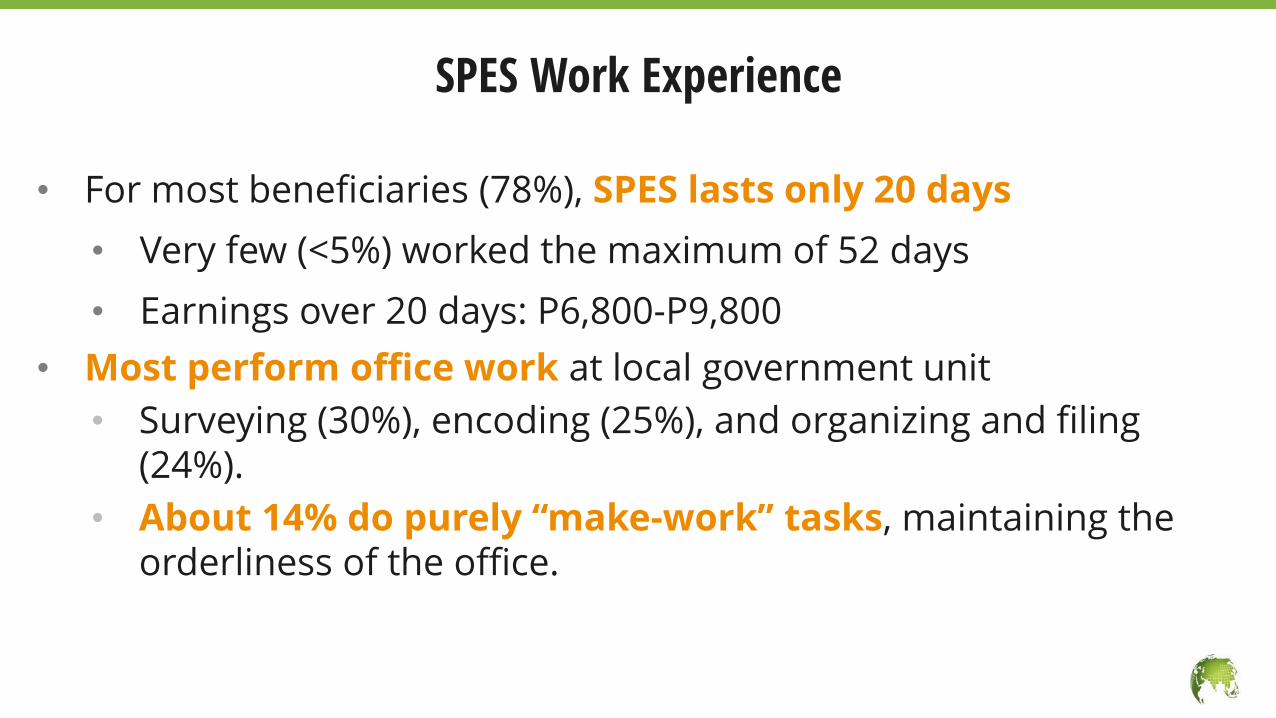
• For most beneficiaries (78%), SPES lasts only 20 days
• Very few (<5%) worked the maximum of 52 days
• Earnings over 20 days: P6,800-P9,800
• Most perform office work at local government unit
• Surveying (30%), encoding (25%), and organizing and filing (24%).
• About 14% do purely “make-work” tasks, maintaining the orderliness of the office.
SPES Work Experience
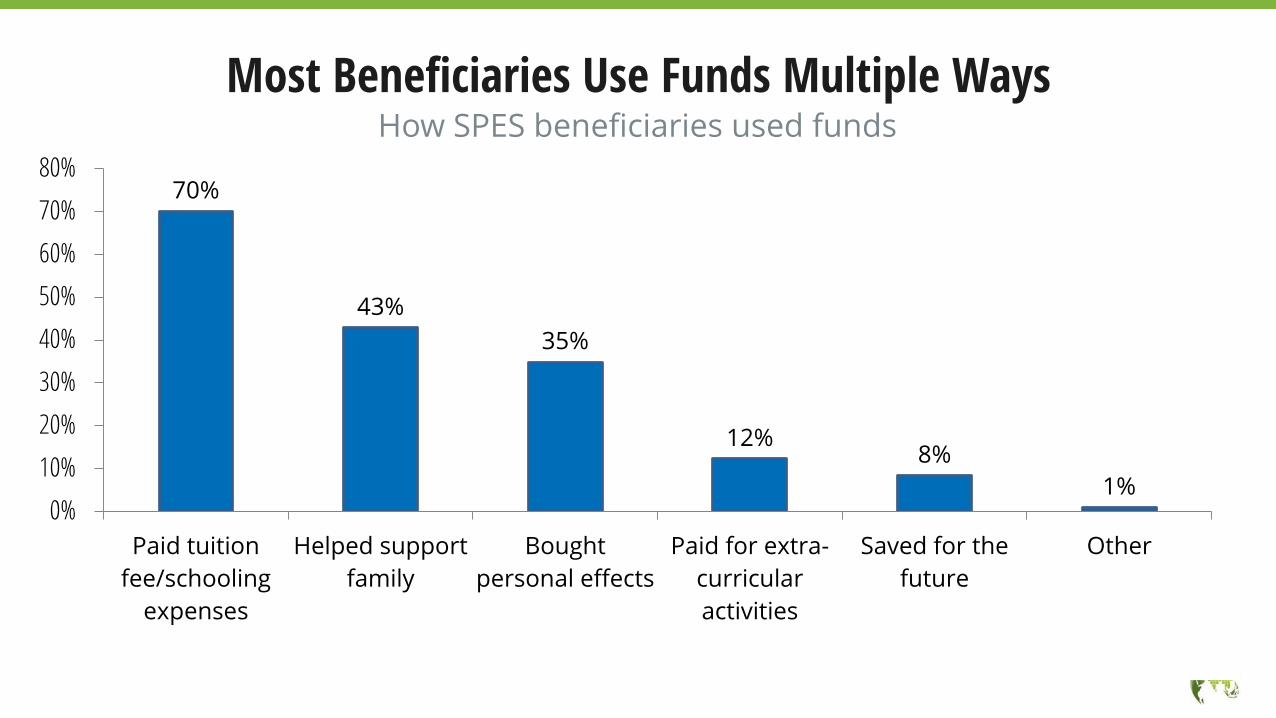
How SPES beneficiaries used funds
Most Beneficiaries Use Funds Multiple Ways
70%
43%
35%
12%8%
1%0%
10%
20%
30%
40%
50%
60%
70%
80%
Paid tuition
fee/schooling
expenses
Helped support
family
Bought
personal effects
Paid for extra-
curricular
activities
Saved for the
future
Other
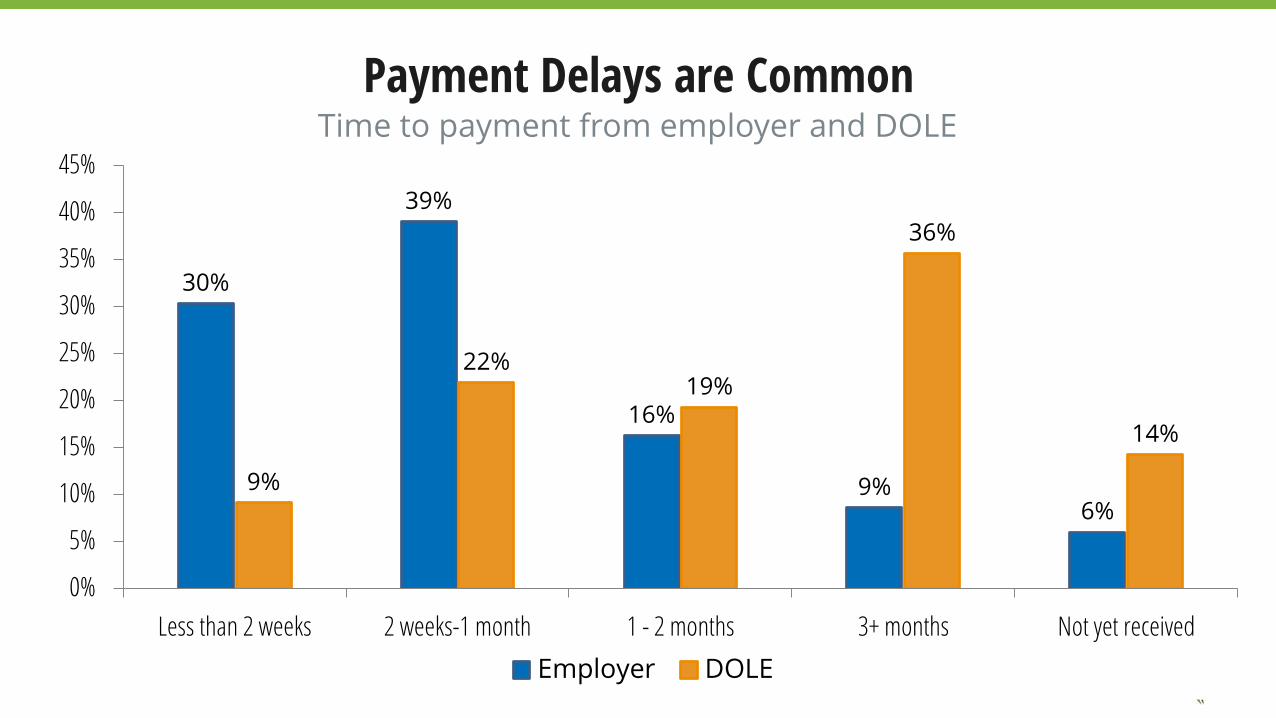
Time to payment from employer and DOLE
Payment Delays are Common
30%
39%
16%
9%6%
9%
22%19%
36%
14%
0%
5%
10%
15%
20%
25%
30%
35%
40%
45%
Less than 2 weeks 2 weeks-1 month 1 - 2 months 3+ months Not yet received
Employer DOLE
5. Specific Findings for Policy and Practice
In the medium run, SPES may be more effective as a work program than an education program, but costs remain high.
• SPES costs roughly P90,000 per job found and P220,000 per drop-out avoided in that academic year.
Specific Findings for Policy and Practice
Resolve payment delays to help students use earnings to fund their education.
Specific Findings for Policy and Practice
Explore ways to help work experience provide meaningful skills.
• Nearly all students are engaged in office work in the LGU, but SPES did not improve students’ experience with specific office tasks, nor changed their general attitudes or motivation for work.
Specific Findings for Policy and Practice
Improved targeting may maximize program effectiveness.
• Men students from poorer families, and high-school students get greatest educational benefits from SPES.
• Refining program targeting through adjustments to screening criteria or outreach methods may help SPES reach those who benefit the most.
Specific Findings for Policy and Practice
Consider adding training to help students build life skills.
• Directly providing students with life-skills training or job-search training may be low cost and more successful.
Specific Findings for Policy and Practice
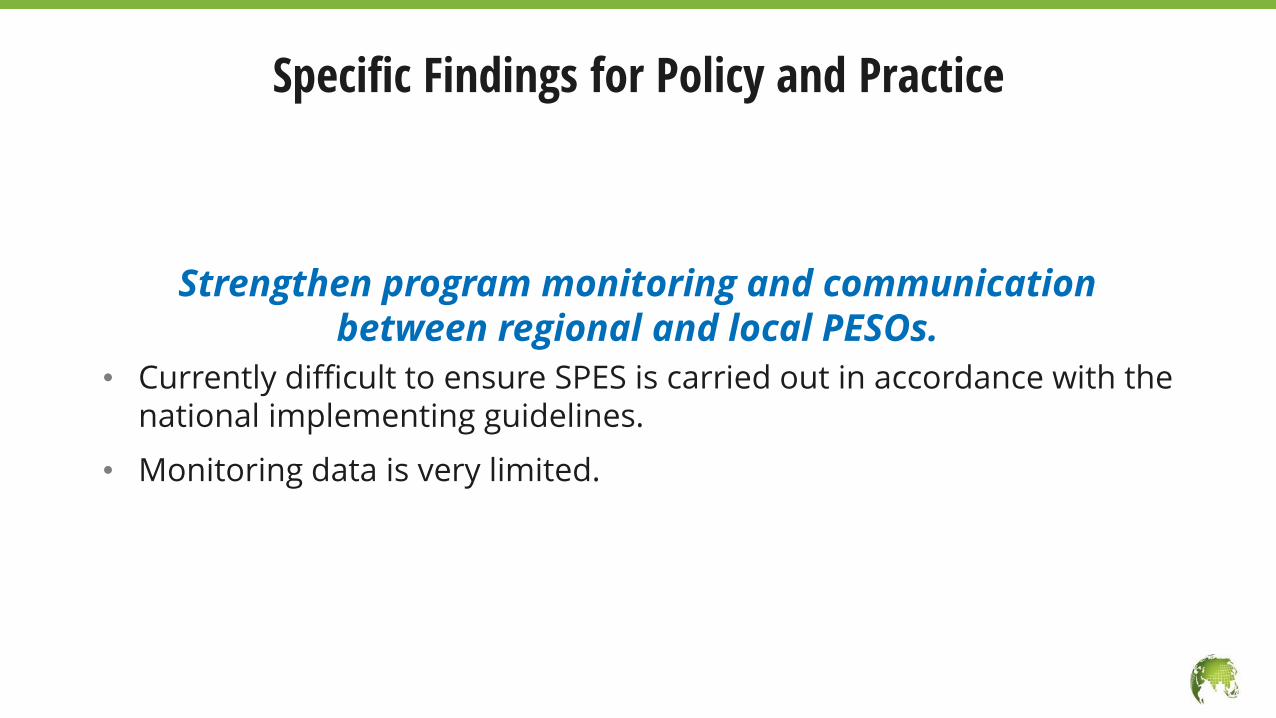
Strengthen program monitoring and communicationbetween regional and local PESOs.
• Currently difficult to ensure SPES is carried out in accordance with the national implementing guidelines.
• Monitoring data is very limited.
Specific Findings for Policy and Practice

6. Lessons for Researchers
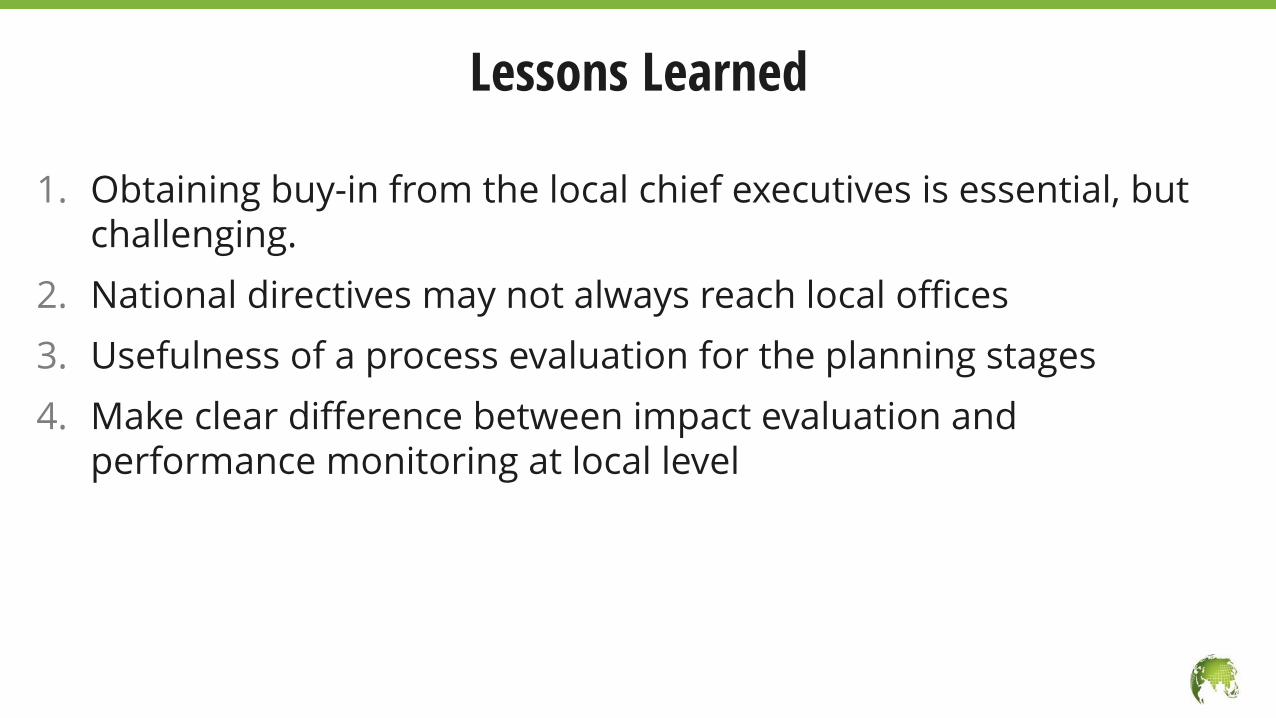
1. Obtaining buy-in from the local chief executives is essential, but challenging.
2. National directives may not always reach local offices
3. Usefulness of a process evaluation for the planning stages
4. Make clear difference between impact evaluation and performance monitoring at local level
Lessons Learned
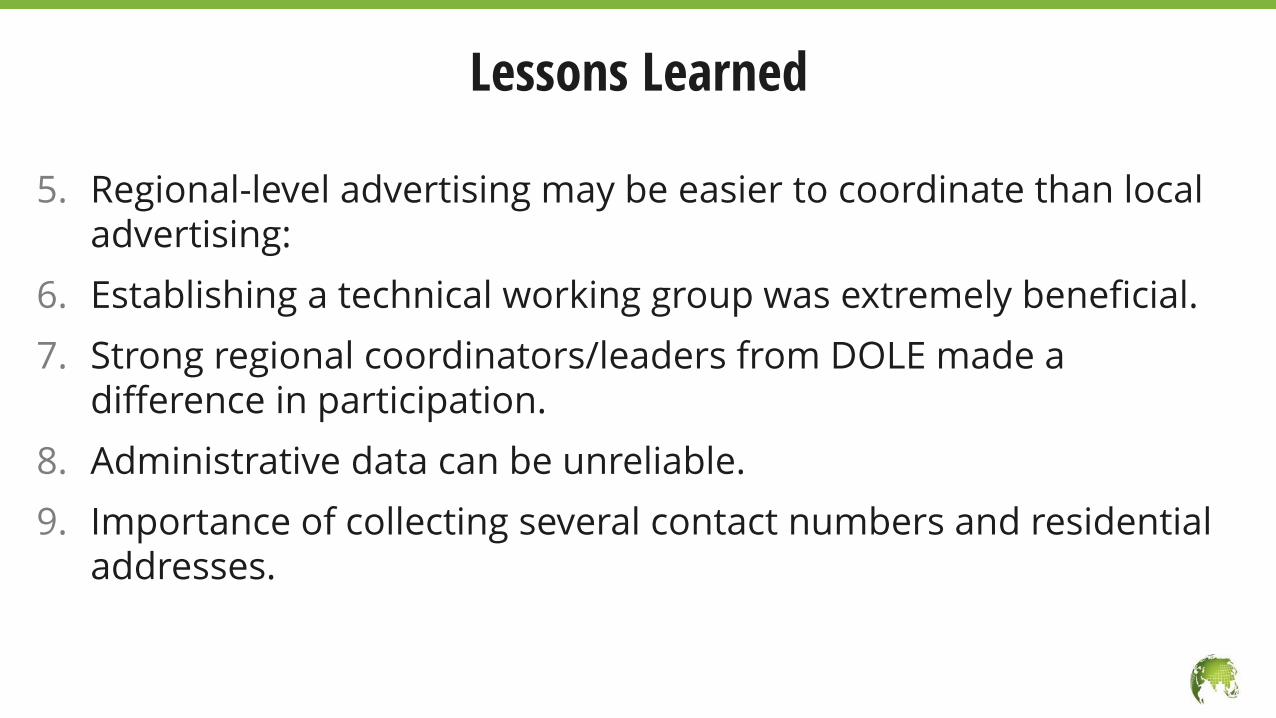
5. Regional-level advertising may be easier to coordinate than local advertising:
6. Establishing a technical working group was extremely beneficial.
7. Strong regional coordinators/leaders from DOLE made a difference in participation.
8. Administrative data can be unreliable.
9. Importance of collecting several contact numbers and residential addresses.
Lessons Learned
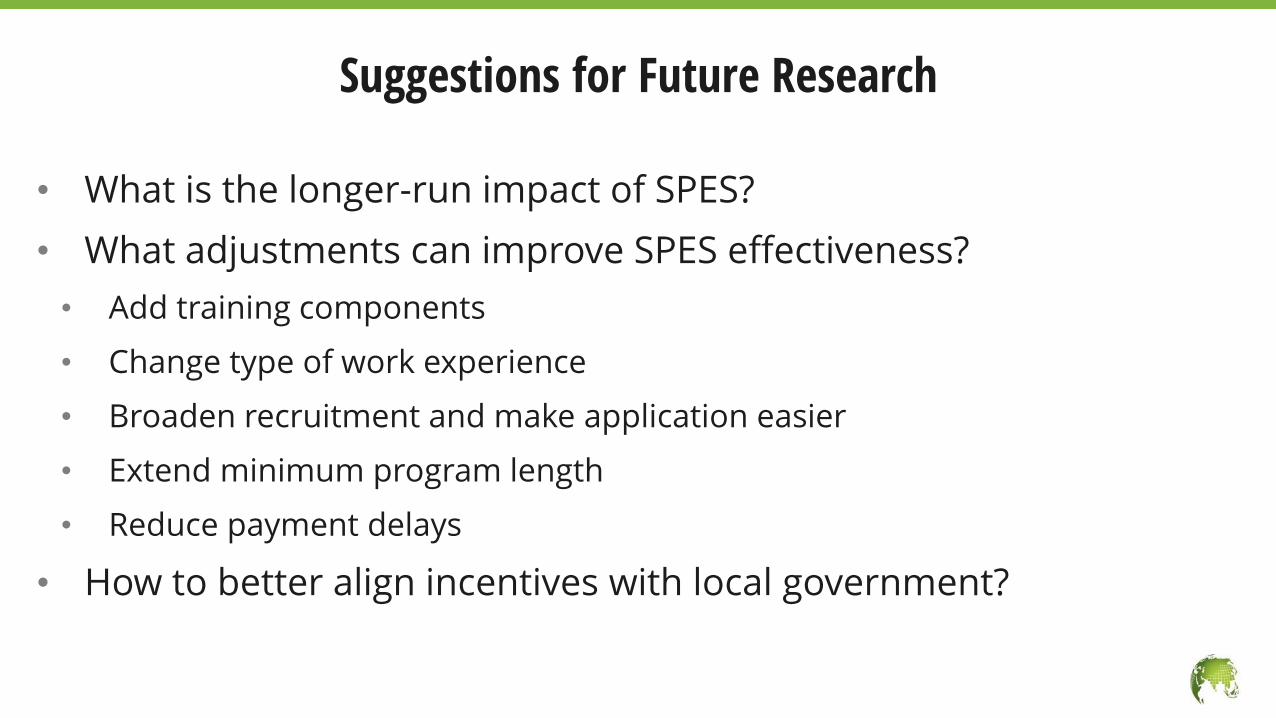
• What is the longer-run impact of SPES?
• What adjustments can improve SPES effectiveness?
• Add training components
• Change type of work experience
• Broaden recruitment and make application easier
• Extend minimum program length
• Reduce payment delays
• How to better align incentives with local government?
Suggestions for Future Research
Thank you
poverty-action.org