Embed Size (px)
Citation preview

Impact Evaluation of Business License Simplification in Peru
October 2012
An Independent Assessment of an International Finance Corporation-Supported Project

Impact Evaluation of Business License Simplification in Peru: An Independent Assessment of an International Finance Corporation-Supported Project

i
© 2013 Independent Evaluation Group The World Bank Group 1818 H Street NW, Washington DC 20433 Telephone: 202-458-4497
Internet: http://ieg.worldbankgroup.org
E-mail: [email protected]
Some rights reserved
1 2 3 4 5 15 14 13
This work is a product of the staff of the Independent Evaluation Group (IEG). Note that IEG and the World Bank Group do not necessarily own each component of the content included in the work. IEG and the World Bank Group therefore do not warrant that the use of the content contained in the work will not infringe on the rights of third parties. The risk of claims resulting from such infringement rests solely with you.
The findings, interpretations, and conclusions expressed in this work do not necessarily reflect the views of IEG, the World Bank, its Board of Executive Directors, or the governments they represent. IEG and the World Bank Group do not guarantee the accuracy of the data included in this work. The boundaries, colors, denominations, and other information shown on any map in this work do not imply any judgment on the part of IEG and the World Bank Group concerning the legal status of any territory or the endorsement or acceptance of such boundaries.
Nothing herein shall constitute or be considered to be a limitation upon or waiver of the privileges and immunities of IEG or the World Bank Group, all of which are specifically reserved.
Rights and Permissions
This work is available under the Creative Commons Attribution 3.0 Unported license (CC BY 3.0) http://creativecommons.org/licenses/by/3.0. Under the Creative Commons Attribution license, you are free to copy, distribute, transmit, and adapt this work, including for commercial purposes, under the following conditions:
Attribution—Please cite the work as follows: IEG (Independent Evaluation Group). 2012. Impact Evaluation of Business License Simplification in Peru: An Independent Assessment of an International Finance Corporation-Supported Project. Washington, DC: World Bank. License: Creative Commons Attribution CC BY 3.0.
Translations—If you create a translation of this work, please add the following disclaimer along with the attribution: This translation was not created by the Independent Evaluation Group or the World Bank Group and should not be considered an official IEG/World Bank Group translation. IEG and the World Bank Group shall not be liable for any content or error in this translation.
All queries on rights and licenses should be addressed to IEG, 1818 H Street, NW, Washington, DC 20433, USA; fax: 202-522-3125; e-mail: [email protected].
Cover photo: Lima, Peru, fruit stall. © Holger Mette/iStock.
Library of Congress Cataloging-in-Publication Data have been applied for.

i
Contents
ACKNOWLEDGMENTS ........................................................................................................................ III
OVERVIEW ............................................................................................................................................. V
ABBREVIATIONS ................................................................................................................................. IX
1. INTRODUCTION ................................................................................................................................. 1
IFC’s Support to Licensing Reform in Lima ............................................................................................................... 3 Broader Issues .......................................................................................................................................................... 5 Previous Evaluations on Business Licensing ............................................................................................................ 6
2. IMPACT OF REFORM ON COSTS AND REGISTRATIONS ............................................................. 9
3. POTENTIAL BENEFITS FROM LICENSE SIMPLIFICATION—EVIDENCE FROM ENTERPRISE OUTCOMES ......................................................................................................................................... 12
Data and Regression Methodology ......................................................................................................................... 12 Evidence from the First Four Rounds of the Enterprise Survey .............................................................................. 13 Evidence from the Fifth Round of the Enterprise Survey ........................................................................................ 18 Benefits from License Simplification—Evidence from Enterprise Behavior ............................................................ 19
4. COST-BENEFIT ASSESSMENT OF THE LICENSE REFORM ....................................................... 23
5. CONCLUSIONS, POLICY IMPLICATIONS, AND IMPLICATIONS FOR IFC .................................. 30
Conclusions ............................................................................................................................................................. 30 Policy Implications ................................................................................................................................................... 32 Implications for IFC ................................................................................................................................................. 33
APPENDIX: DATA TABLES ................................................................................................................ 35
REFERENCES ...................................................................................................................................... 39
ENDNOTES .......................................................................................................................................... 41
Tables
Table 2.1. Summary of Reduction in Costs and Procedures to Obtain a License ................................. 10 Table 3.1. Before-and-After and Double-Difference Estimates of Impact .............................................. 14 Table 3.2. Impact on Revenues (in constant price Peruvian Nuevo Soles) ........................................... 14 Table 3.3. Impact on Profits per Worker ................................................................................................ 15

CONTENTS
ii ii
Table 3.4. Impact on Employment (including owner) .............................................................................15
Table 3.5. Impact on Revenues (constant Nuevo soles) .......................................................................18 Table 3.6. Impact on Profits per Worker (constant Nuevo soles) ...........................................................19 Table 3.7. Impact on Employment (including owner) .............................................................................19
Table 3.8. Costs and Benefits of Getting Licenses—Number of Times Each Item Mentioned by Survey Respondents in First Round of Survey ..................................................................................................22 Table 4.1. Baseline Values and Assumptions Used in Simulations .......................................................26 Table 4.2. Simulation Results: Number of Formal and Informal Firms ...................................................26 Table 4.3. Simulation Results: Number of Firms Experiencing Licensing Costs ....................................26
Table 4.4. Reduction in Waiting Time and Fees Used in the Cost-Benefit Analysis ..............................27 Table 4.5. Sensitivity Analysis ...............................................................................................................28
Figures
Figure 1.1. Central District in Lima Where Reforms Were Implemented . Error! Bookmark not defined. Figure 3.1. Eligible Enterprise Owners Judging the License Worth Getting If the Full License Fee Were Paid .......................................................................................................................................................21

iii
Acknowledgments
This evaluation was prepared by Andrew M. Warner (Task Manager) with
management oversight and valuable comments provided by Marvin Taylor-
Dormond, Ade Freeman, and Stoyan Tenev. In Lima, Miguel Jaramillo and
colleagues at Grupo para Analysis de Desarollo provided valuable assistance in
organizing and collecting new data. Additional helpful comments at various stages
of this evaluation were received from Geeta Batra, Hans-Martin Boehmer, Alexis
Diamond, Surajit Goswami, Caroline Heider, Ali Khadr, Michael Pomerleano,
Alexandra Santillana, Christine Wallich, and Izlem Yenice. Peer review comments
were received from Jeffrey Tanner (Economist, IEG) and Markus Goldstein (Senior
Economist, Africa Poverty Reduction and Economic Management Network, front
office, and Development Economics/Chief Economist, Poverty and Inequality,
World Bank).


v
Overview
It is often claimed that inefficient business regulations and procedures lock enterprises into a vicious circle of informality, where firms have little effective access to financing and are constrained in their ability to grow and prosper beyond the status of microenterprises. At issue are not only the merits of specific business regulations but also the drag on development represented by informality itself.
This evaluation verifies and validates previous conclusions and findings and also presents new evidence. It looks at the effects of reforms supported by the International Finance Corporation’s (IFC’s) Business License Simplification Project in the municipality of Lima, Peru. Under this project, IFC’s Foreign Investment Advisory Services worked with the municipality of Lima to reform the administrative process for obtaining a business license in Cercado de Lima, one of 44 districts that comprise metropolitan Lima. Two evaluations of the project were conducted, sponsored by IFC (see Schnabl, Mullainatha, and Kronberger 2007 and Alcázar, Andrade, and Jaramillo 2011). The first asked whether simplification of business regulations increased registrations; the second asked whether registrations caused improved enterprise outcomes.
New evidence is also presented from an additional survey of the Peru project sponsored by the Independent Evaluation Group (IEG). The IEG survey collected information on a question left unanswered by the earlier evaluations: whether the lack of evidence for impact in those evaluations was the result of insufficient passage of time between the implementation of the project and the collection of data.
In answering whether the license simplification and cost reductions in Peru did in fact lead to greater registration, this evaluation separates the question into two components: Did the reforms reduce costs and procedures, and did the reduction in procedures increase registrations?
The answer to the first question is yes. Even though various sources cite different statistics, they all point to significant reductions in time required, monetary costs, and number of procedures. Available evidence suggests that the median number of days to obtain a license fell from 40 to 16; the average number of requirements to register a business fell from 8 to 4; the median cost fell from $188 to $91; and both the number of visits to municipal offices and the number of inspections fell from 4 to 2. The rise in registrations after the reforms was dramatic: from 1,711 to 8,457 in the first year before settling down to 1,978 in the third year.
Did the increased level of formality lead to better enterprise outcomes? Some have argued that productivity will increase as formal status improves access to financing, facilitates investment, and removes implicit barriers to business growth. IFC and the Business Registration Evaluation Group (BREG) sponsored a second evaluation of the effects of the reforms and found no evidence to support this hypothesis. That evaluation attracted attention because the data collected and the methods used were unusually high quality; in particular, the data collected permitted controls to be introduced for possibly confounding variables and offered a new instrumental variables approach to confront the problem of self-selection bias.
In the present review, the conclusions based on these data were confirmed and the results

OVERVIEW
vi
were replicated. The group of enterprises that obtained licenses in response to the offer of a financial incentive did not exhibit significantly higher average revenues, profits per worker, or employment. Furthermore, the empirical results confirmed here are similar to the results cited in a study of enterprises in Sri Lanka (De Mel, McKenzie, and Woodruff 2012). This latter study found that enterprise sales and employment were not higher after formal status was obtained but that average profits were higher, only because very few firms made huge gains. As in the present evaluation, they found no evidence for broad gains across many firms and many outcome variables.
Three arguments against these findings should be considered. The first is that the (moderately) small sample and the low statistical power of the financial incentive mean that the estimates have a large statistical error. In reply, the maximum possible impact consistent with the data was estimated using new data, and it was found that even these maximum estimates were not large either, ranging from 2 to 28 percent of the relevant means. A second critique is that the results may only apply for the kinds of enterprises in the study, which are mostly retail establishments in service sectors in the center of a city. The response to these arguments is that IFC should test this hypothesis with equally good evidence, as in the IFC-BREG evaluation, to see if positive effects exist for other kinds of enterprises.
A final concern about the potential validity of the findings of the IFC-BREG-sponsored evaluation is that it did not allow sufficient time to elapse for impacts to emerge. To test this criticism, IEG conducted a fifth round of the enterprise survey in May 2012, a further 18 months after the fourth-round survey of November 2010. Overall, the new data offer no evidence that the short passage of time from the earlier evaluation was responsible for the lack of results. There are no statistically
significant positive results for either revenues or profits per worker. There is evidence that employment rose, but only because it declined by a greater amount in the control group, compared with the treatment group. The maximum possible effect is a 28 percent increase in revenues, a 25 percent increase in employment, and a 2 percent increase in profits per worker.
What does this say about policy toward informality? In general, the case for state intervention to promote formality would be strengthened by evidence first that there are large positive effects for enterprise outcomes; second, that enterprises were uninformed about these or tended to underestimate the benefits; or third, that informal status imposes negative externalities on others in society. The evidence here casts doubt on the first argument and in doing so, tends to undercut the premise from the second argument, because it is difficult to argue that firms are poorly informed about the benefits of formal status if little evidence has been found for those benefits.
On the related point of whether enterprise owners were acting rationally by avoiding registration, the evidence is consistent with rational behavior that 55 percent of the enterprises were willing to register when presented with the offer to pay the license fee. This does not necessarily constitute irrational behavior, given all the other costs and benefits of registration, and may in fact be surprisingly high.
When surveyed, enterprise owners show they were aware of items on both the cost and benefit side of the ledger. On the cost side, they most often mentioned the license fees; on the benefit side, the stress and worry of not being registered was frequently mentioned, as was the risk of paying fines. On the final point, however, the evidence here does not say anything either way about the effect of further externalities associated with

OVERVIEW
vii
informalities, such as unfair competition for the formal sector or higher taxes for legitimate enterprises.
What does the evidence say on the ultimate question of whether the license reform was worthwhile based on a cost-benefit analysis? IEG’s calculations indicate that the value to the enterprise owners of the reduction in required office visits, in terms of time savings, would alone justify the cost of the program to IFC. Adding to this the value of the reduction in time to obtain a license further reinforces the point. Saving time and less hassle are benefits that are pure gains to society, as there are no groups that gain from enterprise owners waiting in line or wasting their time on redundant procedures.
In contrast, the reduction in the license fee, although a clear and significant benefit for enterprise owners, means a reduction in municipal revenues, which in turn has some costs to society that are difficult to quantify. The fact that saved time and hassle are quantitatively significant also means that the fundamental justification for projects such as license simplification does not hinge on the question of whether formality causes extra productivity-related benefits to firms.
Regarding IFC, the second IFC-BREG evaluation is a notable example of good practice for several reasons: It addressed a fundamental question at the heart of the justification for the project; and it was based on unique data collected to conduct a test that was capable of delivering accurate answers, and for that reason was influential. The double-difference results (see tables 3.2–3.7) illustrate the pitfalls of relying on before-and-after evidence, as is done in many current
evaluations—conclusions can look very different when there is a control group.
Overall, the results suggest there is little evidence for benefits of higher enterprise profits, revenues, or employment from formalization. This evidence enables IFC to advance the debate and work toward a more focused understanding of what is reasonable to expect from reforms that are being supported.
Recommendations
IFC should follow up this set of evaluations of business licensing for small service-oriented enterprises in the center of Lima with evaluations of different kinds of enterprises, for example, small or medium manufacturing enterprises. These evaluations will help address the issue of whether this kind of enterprise is responsible for the results reviewed here.
IFC should continue to invest in collecting high-quality data to address critical issues that are at the heart of the justification for projects. The evidence reviewed here has attracted attention precisely because conclusions based on good evidence are perceived to be reliable. As tables 3.2–3.7 illustrate, conclusions reached solely on before-and-after evidence can lead to important mistakes.
IFC should construct a base of evidence on other projects to generate a better understanding of which outcomes can be expected for different kinds of projects under what circumstances.


ix
Abbreviations
BREG Business Registration Evaluation Group
ERR Economic rate of return
FIAS Foreign Investment Advisory Service
GRADE Grupo para Analysis de Desarollo
IEG Independent Evaluation Group
IFC International Finance Corporation


1
1. Introduction
Programs to reduce the costs of doing business, replicated in many countries over
the past 15 years, represent one of the major initiatives of the World Bank Group,
particularly the International Finance Corporation (IFC). Apart from the direct
burden of unnecessary procedures and delays, it is often claimed that inefficient
business regulations and procedures lock enterprises into a vicious circle of
informality, where firms have little effective access to financing and are constrained
in their ability to grow and prosper beyond the status of microenterprises. At issue
are not only the merits of specific business regulations but also the drag on
development represented by informality itself.
This evaluation assesses the impact of IFC’s Business License Simplification Project
in the municipality of Lima, Peru. It reviews two previous evaluations sponsored by
IFC and adds new evidence.
Under the project, IFC’s Foreign Investment Advisory Services (FIAS) worked with
the municipality of Lima to reform the administrative process for obtaining a
business license in Cercado de Lima, one of 44 districts that comprise metropolitan
Lima. According to the municipality, 64 percent of the businesses in this district
lacked a business license in 2005, and most of them were microenterprises. The
project was implemented from January 2005 to March 2007.
IFC has since sponsored two evaluations (Schnabl, Mullainatha, and Kronberger
2007; Alcázar, Andrade, and Jaramillo 2011), which asked separate questions. The
first evaluation in 2007 asked whether the project led to reductions in time and
procedures and increased the number of licenses; that study found that it did. A
second evaluation conducted between 2008 and 2011 used an experimental
methodology with treatment and control groups to ask whether the project led to
improved business outcomes. This second evaluation found no evidence of positive
outcomes on businesses.
The present evaluation conducted an independent review of both previous studies,
collected additional data, verified the previous findings, and placed the findings in
the context of related studies and evaluations. The goal was to take stock of the
results, collect and use other evidence, and draw lessons for future IFC and World
Bank operations.
This chapter describes and compares the divergent evidence on which procedures
were simplified by the license reform and by how much. A second chapter reviews

CHAPTER 1 INTRODUCTION
2 2
existing evaluations and previous relevant findings from other countries; a third
replicates and extends the regression evidence on the impact of license reform on
critical business outcomes, such as revenues and employment. The fourth chapter, a
cost-benefit assessment of the desirability of the whole program, reviews what the
behavior of businesses and their own testimony reveals about the benefits of
registration. The final chapter takes into account the findings reviewed in previous
chapters, as well as new evidence in this study, and offers policy implications and
recommendations for IFC.
The overarching evaluation questions concern the nature and the magnitude of the
cost savings and other benefits of business license simplification. The evaluation
questions are as follows:
1. Did the license simplification and cost reductions in fact lead to greater
registration?
2. Is there evidence that greater registrations lead to better enterprise outcomes?
Can the econometric results of the second IFC-sponsored evaluation by
Grupo para Analysis de Desarollo (GRADE)1 be replicated and confirmed?
Are the inferences reached by that study warranted in light of revised
empirical results or additional data?
3. Does a full cost-benefit assessment of the license simplification project
suggest that it improved welfare? On what does the conclusion depend? How
sensitive is the conclusion to plausible changes in the assumptions?
The methodology used to answer these questions will range from a desk review of
previous evaluations and project documents (for question 1); replication of
regression results using survey data collected for the second IFC-sponsored
evaluation (question 2); and computer simulations with a spreadsheet using data
from evaluations and previous sections of this evaluation (question 3). A unique
feature of the second IFC-sponsored evaluation and the follow-on data in this
evaluation is that the data were collected in a manner that permits sharper evidence
than is normally available about causality from license simplification to firm
outcomes (question 2). These data and the reason they permit an answer to the
causality question is discussed further in chapter 3.
In addition to shedding light on the justification for license simplification projects,
the answers to these questions will affect what role the state should have in actively
promoting formal status. The more there are benefits to license simplification, the
more such benefits redound to society in general, rather than solely to individual
enterprises; the more individual enterprises underestimate such benefits, the greater
the justification for state involvement. State involvement could range from simple

CHAPTER 1 INTRODUCTION
3
reduction of fees and red tape, to the offering of financial incentives, to greater
police enforcement of laws requiring enterprises to be formal.
IFC’s Support to Licensing Reform in Lima
The Business License Simplification Project originated in late 2004 as IFC began
work with the municipality of Lima to simplify licensing procedures. Several related
developments, however, had led up to this point. The World Bank publication Doing
Business 2006 found that starting a business in Lima, Peru, entailed 10 separate
procedures, required 102 days, and cost 38 percent of the average per capita gross
domestic product of the country (World Bank 2005). This was relatively high,
compared with Colombia (42 days) or Canada (3 days).
A further study, conducted jointly by the World Bank’s FIAS and the municipal
government in Lima, had identified municipal procedures and bureaucracy as the
main obstacle to registering enterprises. Before the reform, registering an enterprise
required the following 10 major procedures:
Verification of the uniqueness of the proposed name of the enterprise
Notarization of the enterprises constitution
Deposit of capital in a bank
Inscription in the Mercantile Registry
Legalization of the accounting books
Tax registration
Validation of the payroll books at the Ministry of Labor
Obtaining a zoning certificate
Obtaining a technical clearance
Obtaining an operating license.
Of these 10 procedures, only the final three were the responsibility of the municipal
government; yet these three were estimated to consume 60 percent of the total time
to obtain a license (Schnabl, Mullainathan, and Kronberger 2007).
This justified the focus on municipal governments and eventually led to the idea of
conducting a trial program with the municipal government in the district of Cercado
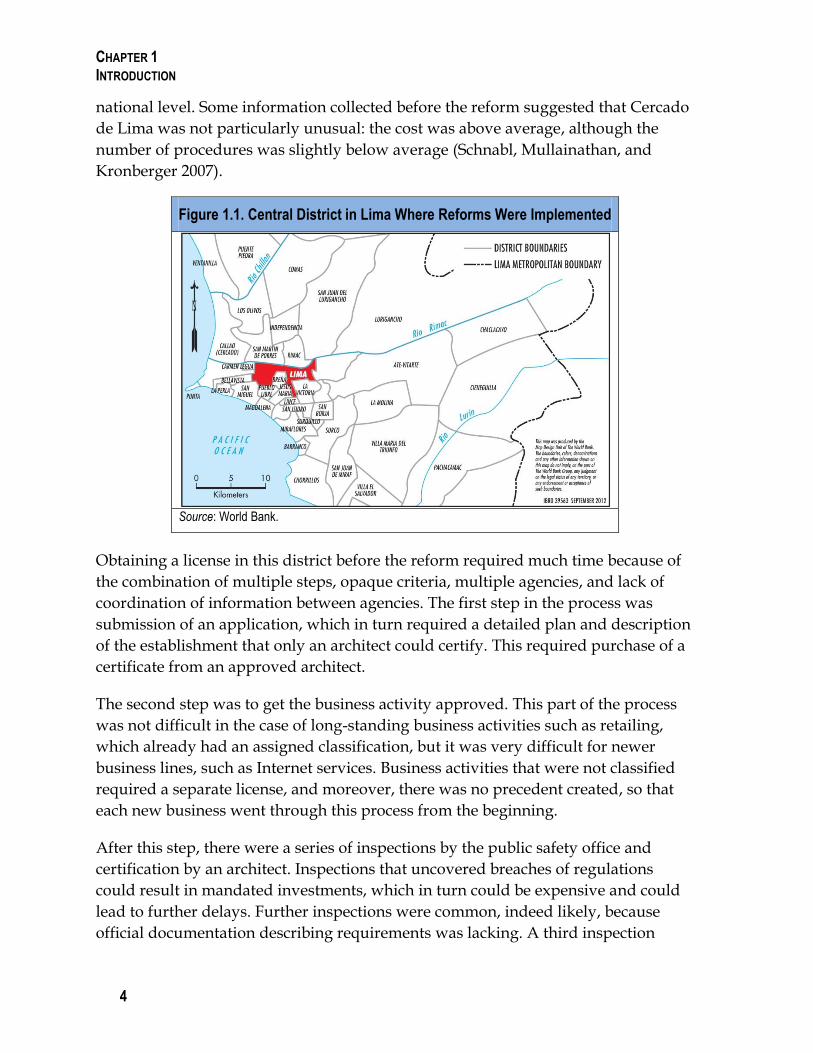
de Lima (figure 1.1). This is one of 45 districts in Lima and was chosen because of
the prohibitive cost of reforming the procedures in many districts at once and to
provide evidence to inform future reform efforts. The district is the historical center
of Lima and was thought to have a large number of businesses operating without
licenses. Licensing procedures in the districts tended to be idiosyncratic, with each
district creating its own rules and procedures, despite attempts to fix policy at the
CHAPTER 1 INTRODUCTION
4 4
national level. Some information collected before the reform suggested that Cercado
de Lima was not particularly unusual: the cost was above average, although the
number of procedures was slightly below average (Schnabl, Mullainathan, and
Kronberger 2007).
Figure 1.1. Central District in Lima Where Reforms Were Implemented
Source: World Bank.
Obtaining a license in this district before the reform required much time because of
the combination of multiple steps, opaque criteria, multiple agencies, and lack of
coordination of information between agencies. The first step in the process was
submission of an application, which in turn required a detailed plan and description
of the establishment that only an architect could certify. This required purchase of a
certificate from an approved architect.
The second step was to get the business activity approved. This part of the process
was not difficult in the case of long-standing business activities such as retailing,
which already had an assigned classification, but it was very difficult for newer
business lines, such as Internet services. Business activities that were not classified
required a separate license, and moreover, there was no precedent created, so that
each new business went through this process from the beginning.
After this step, there were a series of inspections by the public safety office and
certification by an architect. Inspections that uncovered breaches of regulations
could result in mandated investments, which in turn could be expensive and could
lead to further delays. Further inspections were common, indeed likely, because
official documentation describing requirements was lacking. A third inspection

CHAPTER 1 INTRODUCTION
5
would trigger the need for a new license application and new payment of the
registration fees.
On verification that the establishment was in compliance, a certificate was issued.
During this process, the enterprise could be issued a temporary license, a
provisional license, or a permanent license. Provisional licenses were less expensive
but expired after one year. And any time an entrepreneur wanted to convert a
provisional license into a permanent license, an entirely new application process
was required.
There were further zoning requirements for establishments in historical districts, in
which case an inspector came from one agency, or for enterprises located in a
historical monument, in which case inspectors came from another agency. Further,
applications could be stopped or put on hold without advisement, and there was
little coordination between agencies, as the municipality operated with separate
databases.
Broader Issues
License simplification affects broader discussions about regulatory policy, the
informal economy, and the role of both in promoting or constraining development.
In the case of the project in Lima, a major potential social externality that regulations
were intended to respond to was the risk of public safety from fires caused by
exposed wires. Two others were the desire to avoid overcrowding and the
preservation of historical spaces. There is little public rationale for the number of
procedures, lack of coordination, delays, time requirements, redundancies, and lack
of record keeping. Hence, few will defend this aspect of the regulations, and to the
extent that the project was designed to address these issues, it cannot be said that the
project was removing a desirable aspect of regulation.
Licensing reform also bears on the merits and demerits of the informal economy.
One school sees an informal economy as a symptom, an outcome of regulatory
burdens. According to this line of thought, because informality is an outcome and
not a cause, it is not effective to intervene to try to suppress informality without
addressing the causes. Associated with this view is the claim that the informal
economy will tend to disappear with development, as the benefits of larger-scale
operations rise with development or as government institutions become more
efficient and technologically sophisticated. In other words, informality tends to be
viewed as a by-product of low development, not a constraint to development. This
line of reasoning would tend to favor intervention to simplify license regulations

CHAPTER 1 INTRODUCTION
6 6
and unnecessary red tape, but it would tend to be opposed to extra measures to
reduce informality, such as police enforcement.
A second view emphasizes additional issues. Farrell (2004) emphasizes that informal
status perpetuates a low-productivity trap. Formal status will likely improve access
to financing, facilitate investment, and promote higher productivity and business
growth. Informal firms develop networks of low-cost supply chains and build up
relationships that are costly to break; hence, once involved in this network, firms
tend not to escape. Here the informal economy has some staying power and will not
disappear passively with development.
Second, the informal economy is viewed as an unfair burden to the formal sector. It
is unfair competition because the informal sector evades taxes and regulations—
keeping costs low and undermining the ability of the formal sector firms to survive.
It is also unfair in that the informal sector lowers the tax base for business and
income taxes. For any given level of government spending, this raises the budget-
balancing tax on all formal business and further indirectly raises the cost of doing
business for everyone else. These externalities can in principle provide a rationale
for additional enforcement measures, such as police enforcement or punitive fines.
So this school sees the license reform as a step in the right direction but not sufficient
to fully deal with the problem of informality.
Previous Evaluations on Business Licensing
There have been two evaluations of the Business License Simplification Project, but
they evaluate different questions. The first evaluation is Schnabl, Mullainathan, and
Kronberger (2007); much of the same material is in Schnabl and Mullainathan (2012).
These two reports evaluate whether the project led to significant declines in
licensing costs (the same question that can be addressed by the data in table 2.1). The
data collection underlying the 2007 evaluation and the evaluation itself were both
commissioned by IFC.
A second evaluation was done by GRADE (commissioned by IFC and the Business
Registration Evaluation Group [BREG]); it investigated the question of whether and
to what extent the greater formalization caused by the license reform led to better
enterprise outcomes, such as higher revenues, higher investment, higher profits, and
higher employment. A third question that has been addressed in some documents is
the degree to which the benefits of the license simplification exceeded the costs
(Schnabl, Mullainathan, and Kronberger 2007; IFC 2009). Both approach the latter
question in different but incomplete ways. Thus, three major questions have been

CHAPTER 1 INTRODUCTION
7
addressed by previous evaluations: Did the project reduce costs and procedures?
Did formality lead to higher enterprise outcomes? And did benefits exceed the costs
of the project?
Some of the questions addressed by these evaluations are more important than
others. A case can be made that reductions in time and procedures and a greater
number of licenses (what Schnabl, Mullainathan, and Kronberger 2007 evaluate) are
intermediate objectives; the ultimate objective is to raise the welfare of the
businesses involved by saving time and expenses and raising productivity.
According to this line of reasoning, GRADE and IFC are really addressing the more
important questions; whether the reductions in procedures occurred and whether
they led to more licensing is a preliminary evaluation—an input—into the later
evaluations, but not ultimately important.
The informal sector and costly registration procedures have been studied in other
countries. De Soto (1989) argued that bureaucratic red tape and high entry barriers
caused high levels of informality, which in turn impeded firm growth. Empirical
evidence shows that informality and entry barriers are positively associated
(Djankov and colleagues 2002). A reform in Mexico reduced the time required to
register an enterprise at the municipal level from 30 to 2 days. Bruhn (2011) and
Kaplan, Piedra, and Seira (2011) find that registration increased after the reforms. A
critical issue is the degree to which informal status is not rational. Would firms
benefit from registering, even given the high costs of registration, including higher
taxes? In a study using data from Bolivia, McKenzie and Sakho (2010) find a mixed
message: some firms would gain, but many others would not.
Further evidence on the benefits of formal status is contained in a study by De Mel,
McKenzie, and Woodruff (2012), which reports the results of an experiment in
Colombo and Kandy, Sri Lanka, that, like the Peru evaluations considered here,
contained two parts. The first part was to offer enterprises assistance and monetary
incentives to register with the authorities and to observe the degree to which this
was done. The second was to follow the enterprises (both those that did and did not
register) to test whether the act of registration had detectable and significant impacts
on firm performance. Because the incentives were assigned in a random fashion, the
second test was free of selection bias.
These studies found, first, that firms would only register if payments were above the
registration costs. When firms were informed of procedures and costs of registering
and were reimbursed, none chose to register. When firms were offered
approximately $88 or $175 in addition, 17–22 percent chose to register; when they

CHAPTER 1 INTRODUCTION
8 8
were offered $350 in addition, 48 percent chose to register. Problems with land
tenancy were frequently mentioned as critical reasons for not registering.
Enterprises were tracked and observed several months after being offered the
incentives to register, at 15, 22, and 31 months afterward (for example, the incentives
were offered from February through July 2009, and the final survey was conducted
in December 2011). Characteristics of the group that registered were compared with
those of the group that did not register. Average enterprise profits were indeed
higher for those that registered than for those that did not. This is a result about
averages, however, and was driven by rapid growth and high profits of a few
enterprises. Most enterprises experienced no increase in income. No effect of formal
status on sales or employment was found.
The studies found further that formal firms had increased advertising but had no
increase in government contracts or use of bank accounts or loans. The set-up of this
study, examining only existing firms, cannot be used to shed light on entry of new
firms as a result of the reduction in barriers or impact on competing firms (which,
because of constraints in costs and time, could not be interviewed).

9
2. Impact of Reform on Costs and Registrations
This chapter focuses on the first evaluation question: Did the license simplification
and cost reductions in fact lead to greater registration? The effect of the reforms on
license procedures and costs has been recorded in a variety of sources (Schnabl,
Mullainathan, and Kronberger 2007; IFC 2009; Schnabl and Mullainathan 2012) and
in reports from the municipality cited in those documents.
In 2004, IFC and the municipality established a technical secretariat to implement
and manage the reforms. The reforms created new zoning regulations and business
classifications, improved coordination within various offices of the municipality,
accelerated procedures for low-risk businesses, and created a single multipurpose
inspection. There was some divergence between what was created in theory and
what actually happened. Although the intent was to reduce the number of required
inspections to one, a survey immediately after the reforms revealed that the median
number of inspections was actually two, because inspections often led to better
understanding of the required regulations, further changes, and a second inspection.
The impact of the reforms on the number of procedures and time and cost measured
by a before-and-after comparison is summarized in table 2.1. As can be seen, there
are multiple sources reporting what actually happened and some inconsistency.
None of the sources attempt to reconcile disagreements between these numbers, but
they probably were caused by measurement occurring at different times with
different samples of firms. For a consistent source, one can focus on source ―A‖ in
the table, because all three observations are from a similar survey of a consistent
sample performed three times, twice before and once after the reform.
Despite these disagreements in the numbers, the overall picture confirms that there
was a major decline in procedures and costs of obtaining a business license.
Focusing on the study by Schnabl, Mullainathan, and Kronberger (2007) (―A‖ in
table 2.1), the median number of days to obtain a license declined from 40 to 16; the
cost declined from $188 to $91; the number of visits from 4 to 2; and the number of
inspections from 4 to 2. The same study revealed a drop in the percentage of small
business owners reporting that they paid a bribe, from 8 percent to 4 percent, and a
drop in those that reported paying an agent to help them with the process, from 24
percent to 18 percent (not shown in the table). These figures are generally on the
conservative side among all the possible figures in the table. For example, according
to an internal diagnostic report (―E‖ in the table), the number of days to obtain a
license declined from 160 to 16 rather than 40 to 16.

CHAPTER 2 IMPACT OF REFORM ON COSTS AND REGISTRATIONS
10 10
Table 2.1. Summary of Reduction in Costs and Procedures to Obtain a License
Outcome measured Source
Other sources
cited
Value(s) before reform Value(s) after reform
First measurement
Second measurement
First measurement
Second measurement
Third measurement
Days to obtain license
E A 160 16
Mean F D 60 5 10 5
Mean A,B 143 81 15
Median A,B 40 59 16
No. of requirements
Mean C A 8
Mean F D 33 4 4 4
Cost
Mean (―official and unofficial‖)
C A $212
Mean (―official and unofficial‖)
A $288 $212 $112
Mean (―official cost‖)
F D $170 $45 $52 $52
Median (―official and unofficial‖)
A $188 $185 $91
Number of visits to municipal offices
Mean A 4 3 2
Mean F D 11 2 2 2
Number of inspections
Mean A,B 4.3 3.9 2.6
Median A,B 4 3 2
Percentage who reported paying bribe
A 8 10 4
Number of licenses issued
F D 1,711 8,457 4,171 1,978
Sources: (A) Schnabl, Mullainathan, and Kronberger 2007; (B) and (C) Schnabl and Mullainathan 2012; (D) IFC 2009; (E) internal diagnostic report 2005; (F) municipality of Lima official records 2009.
There is also the question as to whether the changes in table 2.1 should be
attributable to the reform effort or to something else. However, it is reasonable to
attribute the changes to the reform, because the reform was the major event that

CHAPTER 2 IMPACT OF REFORM ON COSTS AND REGISTRATIONS
11
occurred during the period and the before-and-after measurements occurred close to
the reform. There is no plausible alternative explanation for the changes.
These data also indicate a large boom in licenses issued immediately after the
reform. The number of registrations ballooned from 1,711 to 8,457 in the year
following the reform, before settling down to 1,978 three years after the reform. This
is a positive development and shows that the reform did achieve its, intermediate
objective of increasing the number of formal official businesses in the district.
Note that this poses a methodological complication for the analysis, because this was
clearly a one-shot increase in licensing, and for some purposes it is desirable to
separate this short-term increase from the long-term or steady-state increase in
licensing caused by the reform. Specifically, the cost-benefit analysis will be based
on estimates of the short- and long-term increases in licensing separately, to analyze
the extent to which the reforms could be justified with and without the benefits of
the short-term increase.

12
3. Potential Benefits from License Simplification—Evidence from Enterprise Outcomes
This chapter focuses on the second set of evaluation questions. Is there evidence that
registration leads to better enterprise outcomes? Can the econometric results of the
GRADE analysis be confirmed, and are the inferences reached by that study
warranted in light of revised empirical results or additional data?
Data and Regression Methodology
A unique feature of the GRADE study was that the data were collected in a manner
that offers a solution to the causality problem, enabling the analyst to test whether
registration caused better business outcomes. The full data come from five rounds of
surveying small enterprises in a specific district of Lima: the first four rounds were
sponsored by IFC and BREG, and the final round by the Independent Evaluation
Group (IEG).
Data from the first four rounds were collected in a baseline survey (May 2008),
followed by three further rounds (November 2008, November–December 2009, and
November 2010). The fifth round of the survey uses exactly the same methodology
as the previous rounds: the same firm conducted the evaluation, the list of questions
came from the same questionnaire, and the same sample of enterprises was
interviewed. The fifth round was conducted in May 2012 and started with the
sample of 239 firms present in the fourth round (November 2010), interviewing
those still in business.
These data permit an analysis using something called an encouragement design,
which is different from a regular experimental design. In a regular experimental
design the treatment is assigned at random to one group; in an encouragement
design an encouragement is assigned at random to one group, and it is hoped that
many of these will decide to obtain the treatment. It is a procedure used when it is
not possible to guarantee that only a certain group will obtain a treatment. In the
IFC-BREG evaluation, a financial incentive was offered to 300 randomly selected
firms in summer 2008 (a few months after the baseline survey was conducted) to
encourage them to obtain a license.

CHAPTER 3 POTENTIAL BENEFITS FROM LICENSE SIMPLIFICATION
13
A special statistical procedure is required to adjust for the fact that the incentive,
rather than the treatment, was assigned randomly. This is what the instrumental
variables procedure does. It uses only the variation in the data caused by the
incentive because the rest could be affected by self-selection.
Evidence from the First Four Rounds of the Enterprise Survey
The main results to be reviewed in the GRADE study are contained in the sixth
GRADE report (Alcázar, Andrade, and Jaramillo 2011, section 5, tables 9–11). These
tables report estimates of the impact of licensing on several enterprise-level
outcomes.
Of all the outcomes that could be measured, labor productivity, or value added per
worker, is one of the most fundamental performance measures for society. Instead of
focusing on labor productivity, the GRADE study focuses on impacts on revenues,
profits, and number of workers (among other factors). This is not a drawback,
however, because understanding the impact on these three factors will provide a
good understanding of whether there has been an impact on labor productivity,
because the concepts are related as follows:
Labor productivity = (value-added)/worker
Value-added = revenues—all nonlabor costs
Total costs = labor costs + non-labor costs
Profits per worker = (revenues—total costs)/worker.
The outcome variables in the econometric work presented here will be revenues,
profits per worker, and number of workers. This list of outcome variables permits a
good understanding of the crucial effects. It also permits a distinction between
achieving intermediate versus final objectives.
Results will be shown first in the simplest possible way: a double-difference
presentation, which shows mean outcome variables for both treatment and control
groups before and after the incentive. These convey the basic message of the data
even though they are not the best methodology available. The best methodology
available is instrumental variables estimation. Tables reporting regressions using
this methodology are large and complicated and are presented in the appendix and
discussed in the text.
The first two estimates of impact will be given in table of the following form (shown
in table 3.1), with the before-and-after estimate of impact given in the right middle
cell and the double-difference estimate of impact given in the bottom right cell. As a

CHAPTER 3 POTENTIAL BENEFITS FROM LICENSE SIMPLIFICATION
14 14
reminder, the double-difference estimate of impact controls for selection biases that
are constant through time but not for selection biases that vary through time.
However, all methods of estimation yield similar conclusions, so the results
presented are not a by-product of selection of a particular method of analysis.
Table 3.1. Before-and-After and Double-Difference Estimates of Impact
Before After Difference
Group that did not get license Average value
Average value
Group that got license (―treated‖ group)
Average value
Average value
Before/After estimate of impact
Double-difference estimate Double-difference estimate of impact (standard error)
Source: IEG.
Turning to the results, note that ―treated‖ firms are defined as those enterprises
reporting to have a license in either the third or fourth rounds of the survey. In
addition, ―before‖ means the observation came from the baseline survey (or the first
round of the survey) and ―after‖ means the observation came from the fourth and
final round of the survey. In the next section, ―after‖ refers to the fifth round,
conducted in May 2012.
Table 3.2 displays the impact of licensing on revenues. Among the group of treated
firms, average revenues were in fact lower after the intervention than before. The
before-and-after estimate is thus positive (837);2 at face value this suggests licensing
improved revenues. Among the control group, revenues were slightly lower,
dropping from 3,422 to 3,129, a difference of –293. The ―double-difference‖ estimate
is thus 1,131, consistent with the idea that licensing positively influences revenues.
The estimate, however, is not statistically significant because the standard error of
1,389 implies a t-ratio of 0.81.
Table 3.2. Impact on Revenues (in constant price Peruvian Nuevo Soles)
Before (April 2008) After (Nov 2010) Difference
Group that did not get license (n = 207) 3,422 3,129 –293
Group that got license (―treated‖ group, n = 122) 7,246 8,084 837
Double-difference estimate –1,131 (s.e. = 1,389)
Source: IEG. Note: s.e. = standard error.
The conclusion from this study is that there is no statistically significant evidence of a
positive impact of licensing on revenues, as the standard error is fairly large. It may be
argued that these results nevertheless do not reject a large effect. What maximum
impact would be consistent with these results? To answer this question, consider the

CHAPTER 3 POTENTIAL BENEFITS FROM LICENSE SIMPLIFICATION
15
95 percent confidence interval of the estimated impact, which ranges from –1,591 to
3,852. If the impact were at the top of this range, at 3,852, it would represent an
increase of 53 percent over the mean of 7,246. By this measure, the maximum possible
impact would be that licensing increased revenues by 53 percent. With the new data,
however, the maximum possible effect is about half this amount.
Profits per worker show very little relation to licensing (table 3.3). Among treated
firms, profits per worker increased slightly, from 708 to 747; hence, the before-and-
after estimate is 39.6. Average profits rose among the control group, from 352 to 463.
So the double-difference estimate is negative (–71.6), casting doubt on the idea that
licensing improves enterprise profits.
Table 3.3. Impact on Profits per Worker
Before (April 2008) After (Nov 2010) Difference
Group that did not get license (n = 209) 351.6 462.8 112.2
Group that got license (―treated‖ group, n = 123) 707.5 747.1 39.6
Double-difference estimate –71.6 (s.e. = 98.6)
Source: IEG. Note: s.e. = standard error.
In this case, the standard error of the estimate is 98.6, so the 95 percent confidence
interval is between –265 and 122. The upper bound of this range (122) is 17 percent
of the mean of 707. By this measure, the maximum effect consistent with this data is
not even 20 percent, suggesting at most a very modest impact on profits.
There is mixed evidence for a rise in employment in response to licensing, and
employment levels of the enterprises under investigation are very small.
Employment declined slightly for both the treatment and control groups (table 3.4),
but more for the control group. Hence, the double-difference estimate is positive,
0.65 and is statistically significant (t-ratio = 2.31). The upper limit of the confidence
interval is 1.19, 39.7 percent of the mean of 3.00. This estimated impact is statistically
significant; nevertheless, a decline in employment, such as occurred for the
treatment group, is not the result proponents of licensing would predict. The
double-difference estimate is positive because employment declined by much more
in the control group than in the treatment group.
Table 3.4. Impact on Employment (including owner)
Before (April 2008) After (Nov 2010) Difference
Group that did not get license (n = 209) 2.44 1.67 –0.77
Group that got license (―treated‖ group, n = 128) 3.00 2.88 –0.13
Double-difference estimate 0.65 (s.e. = 0.28)
Source: IEG. Note: s.e. = standard error.

CHAPTER 3 POTENTIAL BENEFITS FROM LICENSE SIMPLIFICATION
16 16
These results generally cast doubt on the idea that licensing serves to improve
enterprise performance. The only positive result—for employment—came about
because average employment in the control group declined by more than the
treatment group. Although these estimates are potentially affected by selection bias,
selection bias goes in the direction of showing licensing to have a higher impact than
it really does. In other words, even with a positive assist from selection bias, there is
still little evidence that getting a license made a difference for the outcome variables.
Further, instrumental variables estimates, which deal with this selection bias in a
more rigorous manner, confirm and underline this basic conclusion.
The instrumental variables estimates of impact are presented in tables of regression
estimates shown in the appendix. A simplified depiction of the estimated
regressions is given immediately below. In the case of the license simplification
project, the ―treatment variable‖ is obtaining a license, measured as 1 if a license was
obtained and 0 if not. The variable measuring whether an incentive was given, again
1 if yes 0 if not, is said to be the ―instrument‖ for the treatment variable. The
coefficient b1 multiplying the treatment variable is said to give the ―instrumental
variables estimate‖ of impact, in the case where an instrument is used and b1 gives
the ordinary least squares estimate when no instrument is used. Regression tables
appear complicated because ―other control variables‖ can be a large list of variables.
But the coefficient b1 remains the result of interest.
Outcome variable = b0 + b1* treatment variable + b2* other control variables + e
The detailed regression estimates are presented in tables A.1–A.3 in the appendix.
Each table presents four regressions. The regressions in the first two columns are
ordinary least-squares regressions that do not adjust for selection bias. These are
provided for purposes of comparison. The regressions in the last two columns give
the instrumental variable regressions that adjust for selection bias. Both are given in
sets of two: the first in the set giving a regression with no control variables and the
second in the set giving a regression with a full set of control variables. The tables
thus enable a comparison of how the results depend on the estimation method
(instrumental variables or not) and whether there are control variables.
The regression estimates support the same broad conclusions as the double-
difference estimates. Table A.1 shows that although revenues and getting a license
are positively associated in the simplest specification (column 1), this association
disappears with either more controls (column 2) or adjusting for selection bias
(columns 3 and 4). Based on these results, there is no evidence that licenses cause
higher revenues.

CHAPTER 3 POTENTIAL BENEFITS FROM LICENSE SIMPLIFICATION
17
This confirms the results in the sixth GRADE report (Alcázar, Andrade, and
Jaramillo 2011), which contained similar conclusions. The sole difference between
the present results and those reported by GRADE is that the latter eliminated about
20 enterprises from the sample on the grounds that they were unusual observations
(and thus possibly measured in error). The results reported here thus serve as a
confirmation that the conclusions are not sensitive to this choice.
The final two tables of regressions of profits per worker and employment also
confirm previous conclusions. Profits per worker show no evidence of an empirical
relation to licensing (table A.2). There is also little evidence that licensing causes an
increase in employment, once adjustments have been made for selection bias, as
shown in table A.3. The first regression does suggest that licensing is associated with
an increase in employment, but the regressions that control for other variables
(columns 2 and 4) or adjust for selection bias (columns 3 or 4) overturn this result.
These results confirm the conclusion in Alcázar, Andrade, and Jaramillo (2011),
based on the same data:
Results from the fourth round survey confirm … that operating with municipal
license has no statistically significant effect on firms’ performance indicators. Neither
final outcome variables (outputs), such as revenues, sales, profits, profits per
workers, nor intermediate outcome variables, such as number of employees, access
to credit, investment in infrastructure, and machinery (inputs) are statistically
affected if the firms operate with license. For two variables (profits per worker and
number of workers) we obtain significant coefficients, but these are not robust to
alternative methods (§6, p. 28).
These inferences are warranted based on the data collected for the Lima program,
but questions remain. One potential criticism is that the standard errors of the
estimated impacts are large, as was discussed in the case of the double-difference
estimates, but even more so for the instrumental variables estimates. Ultimately this
can only be addressed by building up more data and information, but the estimates
to date do not inspire confidence that the true impacts are large.
A second possible criticism is that the data collected for this analysis did not allow
sufficient passage of time for impacts to be detected. The incentives were offered in
June–July 2008, and the final round of the enterprise survey was conducted in
November 2010, approximately two and a half years later. Whether this is sufficient
time is not possible to know a priori, and at some point the burden of proof should
shift to those who claim that impacts are just around the corner if we wait just a little

CHAPTER 3 POTENTIAL BENEFITS FROM LICENSE SIMPLIFICATION
18 18
longer. What can be done is to collect more data with longer time lags. The next
section reports results from that effort.
Finally, note that the empirical results here are similar to those cited in a study of
enterprises in Sri Lanka by De Mel, McKenzie, and Woodruff (2012). This study also
found that enterprise sales and employment were not higher after formal status was
obtained. In contrast to the evidence here, average profits were higher, but only
because a very few firms made huge gains. As in this evaluation, that study finds no
evidence for broad gains across many firms and many outcome variables.
Evidence from the Fifth Round of the Enterprise Survey
To test the idea that the lack of positive evidence discussed in the previous section
comes from insufficient time to see impacts, IEG conducted a fifth round of the
enterprise survey in May 2012.
Based on the new data, average enterprise revenues rose in the treated group from
7,261 to 8,221 between 2008 and 2012 (in constant Nuevo soles per month, deflated
by the Lima consumer price index). Average revenues in the control group also rose,
from 3,622 to 4,512 (table 3.5). This means that the double-difference estimate is now
only 68.9, not statistically significant at conventional levels (t = 0.07). Licensing has
no significant effect on revenues. According to the upper limit of the 95 percent
confidence interval, the maximum impact is 2,037.6, a rise of 28 percent, compared
with the mean of 7,261.
Table 3.5. Impact on Revenues (constant Nuevo soles)
Before (April 2008) After (May 2012) Difference
Group that did not get license (n = 153) 3,622.1 4,512.4 890.3
Group that got license (―treated‖ group, n = 96) 7,261.3 8,220.6 959.2
Double-difference estimate 68.9 (s.e. = 1,004.4)
Source: IEG. Note: s.e. = standard error.
Average profits per worker are higher among the treated group, but more so in the
control group, so the double-difference estimate is negative. Among the treated
group the difference is 225; among the control group it is 583. Hence, the double-
difference estimate is –358 (table 3.6). Given the standard error of 189.7, the upper
limit of the confidence interval works out to 14, only 2 percent higher than the mean
of 745 for the treated group in 2008.

CHAPTER 3 POTENTIAL BENEFITS FROM LICENSE SIMPLIFICATION
19
Table 3.6. Impact on Profits per Worker (constant Nuevo soles)
Before (April 2008) After (May 2012) Difference
Group that did not get license (n = 152) 367.8 950.7 582.9
Group that got license (―treated‖ group, n = 95) 745.4 970.6 225.2
Double-difference estimate -357.7 (s.e. = 189.7)
Source: IEG. Note: s.e. = standard error.
The new data show a decline in employment among both groups (table 3.7).
Among the treated group, average employment fell from 3.1 to 2.7; among the
control group, it fell from 2.5 to 1.7. The double-difference estimate is positive and
significant because the mean of the control group declined by more than the
treatment group (0.42). The maximum increase in employment consistent with the
data would be 0.76, or 25 percent of the mean of 3.1.
Table 3.7. Impact on Employment (including owner)
Before (April 2008) After (May 2012) Difference
Group that did not get license (n = 152) 2.47 1.72 –0.75
Group that got license (―treated‖ group, n = 97) 3.07 2.70 –0.33
Double-difference estimate 0.42 (s.e. = 0.17)
Source: IEG. Note: s.e. = standard error.
Taken together, the data offer little evidence that important positive effects would
have emerged if more time had passed before data for the earlier study were
collected. The evidence does not show positive effects for either revenues or profits
per worker. It shows small positive effects on employment, but only because
employment in the control groups declined, not because it rose in the treated group.3
Benefits from License Simplification—Evidence from Enterprise Behavior
In June and July 2008, after the reforms were implemented, a monetary incentive
was offered to 300 enterprises that had not yet registered to go to the municipal
offices and register as a formal business. The 300 enterprise owners were chosen
randomly to receive what was called the ―encouragement.‖ If they accepted, the
business owners would be accompanied to the municipal authorities and the group
offering the encouragement would pay part of the registration fee directly. Initially,
the offer was for a payment of 40 Nuevo soles. Of the 300 enterprises, 31 accepted
this offer, and a further 127 were found to be ineligible for a license (one common
reason was that their kind of business, for example, a restaurant, was not permitted
in their specific location). Hence, of those eligible, the acceptance rate was 20
percent.

CHAPTER 3 POTENTIAL BENEFITS FROM LICENSE SIMPLIFICATION
20 20
This take-up rate was deemed too low, and the offer was increased. After some
testing, the implementers found that they had to pay the full cost of the license to
induce a substantial number of enterprises to obtain a license. The offer was
increased to the full amount of the license, and a further 60 enterprises, or 35
percent, obtained a license with this inducement.
As stated previously, this encouragement generated the data used in the
instrumental variables estimation. According to some, the low take-up of the
incentive was seen as a disappointing outcome of the project. But it is not necessarily
disappointing. The business owners are simply revealing something about how
much they value a license.4 This section takes this idea at face value and asks what
can be learned about the value of licensing from this episode.
A rational business owner would assess the costs and benefits of licensing. If C
represents the nonmonetary costs of obtaining a license, F the monetary and time
costs, and B the benefits, we can infer from the fact that an owner decided not to
accept the incentive that he or she assessed C + Fa > B, where Fa represents the
monetary and time costs after the reform and after the encouragement was offered.
In other words, the business owner would register if net costs were below zero (C +
Fa – B < 0) but would not register if net costs were above zero (C + Fa – B > 0). A
summary of the changes that occurred after the incentives were offered is depicted
in figure 3.1. The 40 Nuevo soles incentive was sufficient to offset the net costs for 20
percent of the enterprises, and the full incentive was sufficient to offset the net costs
for a further 35 percent of the enterprises. The exact distribution of how the
enterprises judged the net costs prior to the incentives is unknown, but figure 3.1
shows one example that would be consistent with the facts.
This evidence shows that 55 percent of the enterprises were on the borderline where
refunding the cost of the license was sufficient to tilt the decision to getting a license.
The 40 soles incentive comes to approximately $17; the full cost of the license varied
between $79 and $130, depending on the kind of enterprise; average annual profits
for the firms were $6,060, and the annual minimum wage was $2,136. Hence, the
cost of the license was not large relative to other comparators, suggesting that a lot
of businesses are right on the border where small monetary incentives can tilt the
balance toward getting a license. These figures also show that if licensing caused
average profits to rise by only 10 percent, the gain to the average enterprise
(approximately $600) would far outweigh the cost of the license fee.

CHAPTER 3 POTENTIAL BENEFITS FROM LICENSE SIMPLIFICATION
21
Figure 3.1. Eligible Enterprise Owners Judging the License Worth Getting If the Full License Fee Were Paid
Source: IEG.
The enterprises also provided some information as to which of the costs and benefits
they considered most important. Table 3.8 summarizes costs and benefits, taken
from the list of questions in the enterprise survey.
The results show that on the cost side, the license fees are the most frequently
mentioned item. On the benefit side, the stress and worry of not being registered is
frequently mentioned, as is the risk of paying fines

CHAPTER 3 POTENTIAL BENEFITS FROM LICENSE SIMPLIFICATION
22 22
Table 3.8. Costs and Benefits of Getting Licenses—Number of Times Each Item Mentioned by Survey Respondents in First Round of Survey
Costs of getting a license Number
Benefits of getting a license Number
Have to pay taxes 18 Better prospects for doing business with formal firms
30
May have to pay inspectors
21 Lower risk of non-payment by customers
44
Must receive municipal inspections
20 Can display signs and advertise
41
Must receive civil-defense inspections
11 Easier to access formal credit
75
Have to pay for licenses and incur time costs
40 Have more price/quality options for buying inputs
4
Can participate in public tenders
13
Eligible for programs to assist small firms
22
Lower stress and worry 176
Lower risk of paying fines 151
Source: GRADE data.
.

23
4. Cost-Benefit Assessment of the License Reform
The ultimate question concerning license reform was whether the whole effort was
worthwhile: did impacts and the benefits outweigh the time, effort, and costs
involved?
This chapter focuses on the third set of evaluation questions: Does a full cost-benefit
assessment of the license simplification project suggest that it raised welfare in light
of all the existing and new evidence collected? What does the conclusion depend on?
How sensitive is the conclusion to plausible changes in the assumptions? Although
the license simplification is only a few years old, having been implemented in 2006,
and although some of the consequences are still playing out, several pieces of
evidence can nevertheless be brought together to provide a pretty good picture of
the consequences of the program.
The focus will be on the three major aspects of the license simplification: the
reduction in the license fee, the reduction in the number of office visits required to
obtain a license, and the reduction in the total time to obtain a license. The license fee
is the fee charged for registering an enterprise. This varies with the size, precise
location, and nature of the enterprise and was estimated to average $170 before the
reforms for the district of Lima under analysis (IFC 2009). The fee is levied for new
enterprises and must be renewed each year at approximately the same cost. The
second major aspect of the reform was the reduction in time required to visit the
municipal offices, to wait in line, and to wait in the offices, and the third was
reduction in the overall time delay to obtain the license.
A full cost-benefit analysis of the license reforms must confront the following issues.
First the beneficiaries: the main beneficiary group is the population of current and
future enterprise owners who pay the license fees and experience the delays.
Employees of the enterprises are not necessarily beneficiaries if they earn a market
wage and the wage is set in the wider labor market that is unaffected by the reforms.
In any case, this sector is not a major employer of wage labor; many of the
enterprises employ only one or two casual laborers, if any. Other potential
beneficiary groups are employees of the municipality, beneficiaries of municipal
government expenditures, present and future taxpayers, and firms that may
compete with or complement the small enterprise sector.

CHAPTER 4 COST-BENEFIT ASSESSMENT OF THE LICENSE REFORM
24 24
A priori, which groups are expected to benefit and which to lose from the reforms? The
owners of any enterprise that are potentially in line to obtain licenses benefit from the
reduction in fees and procedures. Beyond that, matters hinge on what precisely happens
if and when the municipalities lose revenues from the reduction in license fees.
Rough estimates suggest that the lost revenue comprises 15 percent of municipal
budgets.5 The fiscal adjustment to lower license revenues could entail expenditure
cuts in other programs, in which case the losers would be the beneficiaries of these
programs. Other fees or taxes could be raised, burdening fee payers or taxpayers. If
funds are borrowed, the issue is sifted into the future, burdening future taxpayers.
Employment in municipal governments could be reduced, burdening employees
who would have to find other employment.
Therefore, the fee reduction aspect of the reforms entails an implicit transfer from
some of these groups to the enterprise owner. The small enterprise owners are low
income, earning close to the minimum wage, but difficulties in identifying the
potential losers make it difficult to determine whether this transfer will be
progressive or regressive.
The second part of the cost-benefit analysis is to determine the features of the reform
that generate benefit flows. In the present case, the fee reduction, the reduction in
office visits, and the reduction in required waiting time are the crucial items for
focus. As already noted, enterprises may benefit further if formal status raises
productivity, although considerable doubt has been cast over this possibility by the
econometric evidence; thus, it will not be formally considered. Benefits may also
stem from any effect of the reforms on the number of firms in formal status: if there
is a large reduction in informality, the competing formal sector would benefit.
People not involved in the enterprise sector may benefit to the extent that formal
status brings greater observance of safety standards by the small enterprises.
The discussion so far has mentioned a number of potential benefit flows, some
complicating factors, and some facts that will remain unknown. All of these are relevant
for a general treatment of the issue, but not to answer specific questions. Here the
bottom line question is whether the IFC project was a worthwhile use of public funds:
did the benefits exceed the costs? This section will demonstrate that it is sufficient to
quantify the benefits associated with saved time and hassle to answer this question.
Three pieces of information are required to estimate the value of a reduction in time
requirements and procedures: the number of beneficiaries likely to be affected over
time, the size of the reductions, and the value to the beneficiaries. In this chapter the
number of persons affected will be estimated using simulations, which in turn use data

CHAPTER 4 COST-BENEFIT ASSESSMENT OF THE LICENSE REFORM
25
and informed estimates from the specific part of Lima where the project occurred. The
size of the reductions will be drawn from the data in table 2.1, and the value of the
reductions to the beneficiaries will be estimated by use of wage data.
This chapter will pull this information together and present the results. After showing
the estimates of the number of enterprises affected by license simplification, it shows
data on the reduction in costs and then shows the results of the cost-benefit analysis as
well as the sensitivity analysis. The sensitivity analysis is used to understand which
assumptions are critical and whether, overall, the net benefit of the program hinges on
parameter assumptions.
Consider first the number of enterprises each year that will likely experience the
registration process. This group is composed of three separate sections: first, the new
entrants that enter formally from the beginning; second, firms that renew licenses; and
third, those informal enterprises that decide to switch and obtain a license.
To estimate the number of firms involved, begin with estimates that there are 50,000
formal and informal enterprises in the district under analysis and that 13,948 of these
are formal.6 This gives a baseline estimate of 36,052 informal firms. We know that each
year it is possible that new firms enter (both formal and informal); existing firms shut
their doors (both formal and informal); and firms switch status (from informal to formal
or vice versa). The probabilities assumed are shown in table 4.1. For example, each year
it is assumed that 2 percent of all active, informal firms become formal firms and that
the likelihood of starting a firm is 10 percent, slightly higher than the likelihood of
closing a firm (9 percent).
It is also assumed that overall population growth in the country is 3 percent, and, given
that urban growth is higher than national population growth and that the population of
small enterprises is drawn from the urban population, the population of potential
entrants grows at 4 percent. The chapter investigates the extent to which the simulation
results depend on these assumptions.
Table 4.2 shows the estimated number of formal and informal firms. The population
of informal firms is first set at slightly more than 36,000 in the base year and grows
to 81,208 by the tenth year. The proportion rises only modestly from 72 percent to 75
percent in the tenth year.

CHAPTER 4 COST-BENEFIT ASSESSMENT OF THE LICENSE REFORM
26 26
Table 4.1. Baseline Values and Assumptions Used in Simulations
Number of firms with formal status 13,948
Number of informal firms 36,052
Annual probability of starting a firm 0.10
Annual probability of closing a firm 0.09
Transition probability: Informal to formal 0.02
Transition probability: Formal to informal 0.01
Annual proportion that must renew license 0.20
Population growth 0.03
Growth of potential informal firms 0.04
Source: IEG.
Table 4.2. Simulation Results: Number of Formal and Informal Firms
Baseline Percent Year 1 Year 2 Year 10 Percent
Formal Firms 13,948 28 15,077 16,251 26,627 25
Informal Firms 36,052 72 41,239 46,191 81,208 75
Total 50,000 56,316 62,441 107,835
Source: IEG.
The estimated number of enterprises that will experience first-time registration costs
is shown in table 4.3. This includes three separate cohorts: new firms that enter each
year, informal firms that switch, and continuing firms that have to renew their
registration. In each year, 20 percent of firms are assumed to require renewal of the
license. For the sake of simplicity, the table shows the first five years of a simulation
that runs for 10 years and more in some of the sensitivity analysis below. Note that
the numbers of renewals and start-ups are higher than the number of firms
switching form formal to informal status.
Table 4.3. Simulation Results: Number of Firms Experiencing Licensing Costs
Year 1 Year 2 Year 3 Year 4 Year 5
New start-ups 1,395 1,508 1,625 1,746 1,871
Renewals 3,015 3,250 3,492 3,741 3,996
Firms switching from informal to formal 721 825 925 1,021 1,115
Total number of incurring costs of registration 5,131 5,583 6,042 6,509 6,982
Source: IEG.
The next step is to combine the estimates of the number of firms affected with the
value of the actual reductions in time and monetary costs. Based on the data in table
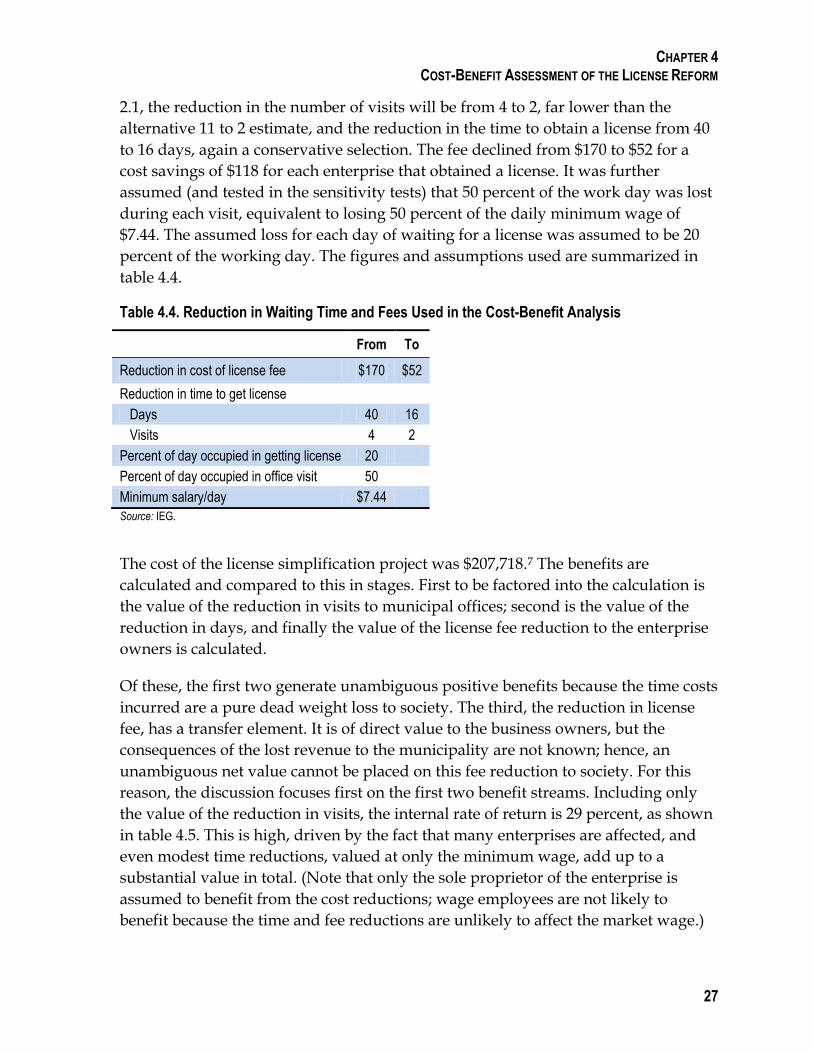
CHAPTER 4 COST-BENEFIT ASSESSMENT OF THE LICENSE REFORM
27
2.1, the reduction in the number of visits will be from 4 to 2, far lower than the
alternative 11 to 2 estimate, and the reduction in the time to obtain a license from 40
to 16 days, again a conservative selection. The fee declined from $170 to $52 for a
cost savings of $118 for each enterprise that obtained a license. It was further
assumed (and tested in the sensitivity tests) that 50 percent of the work day was lost
during each visit, equivalent to losing 50 percent of the daily minimum wage of
$7.44. The assumed loss for each day of waiting for a license was assumed to be 20
percent of the working day. The figures and assumptions used are summarized in
table 4.4.
Table 4.4. Reduction in Waiting Time and Fees Used in the Cost-Benefit Analysis
From To
Reduction in cost of license fee $170 $52
Reduction in time to get license
Days 40 16
Visits 4 2
Percent of day occupied in getting license 20
Percent of day occupied in office visit 50
Minimum salary/day $7.44
Source: IEG.
The cost of the license simplification project was $207,718.7 The benefits are
calculated and compared to this in stages. First to be factored into the calculation is
the value of the reduction in visits to municipal offices; second is the value of the
reduction in days, and finally the value of the license fee reduction to the enterprise
owners is calculated.
Of these, the first two generate unambiguous positive benefits because the time costs
incurred are a pure dead weight loss to society. The third, the reduction in license
fee, has a transfer element. It is of direct value to the business owners, but the
consequences of the lost revenue to the municipality are not known; hence, an
unambiguous net value cannot be placed on this fee reduction to society. For this
reason, the discussion focuses first on the first two benefit streams. Including only
the value of the reduction in visits, the internal rate of return is 29 percent, as shown
in table 4.5. This is high, driven by the fact that many enterprises are affected, and
even modest time reductions, valued at only the minimum wage, add up to a
substantial value in total. (Note that only the sole proprietor of the enterprise is
assumed to benefit from the cost reductions; wage employees are not likely to
benefit because the time and fee reductions are unlikely to affect the market wage.)

CHAPTER 4 COST-BENEFIT ASSESSMENT OF THE LICENSE REFORM
28 28
Table 4.5. Sensitivity Analysis
Assumption Rate of return
(ERR) (%) Change from baseline (%)
Baseline 19.6
Calculate over 20 years rather than 10 years 24.6 25.2
20 percent increase in start probability 23.0 17.2
20 percent increase in failure probability 18.3 –6.9
20 increase in transition probability from informal to formal 19.6 0.0
20 increase in transition probability from formal to informal 19.5 –0.6
20 percent increase in population growth 19.7 0.6
20 percent increase in growth of pool of potential informal firms
19.7 0.1
20 percent increase in percent requiring renewal 22.6 15.0
20 percent smaller reduction in visits 14.2 –27.6
20 percent smaller reduction in work time lost for visits 14.4 –26.8
20 percent smaller wage 14.2 –27.6
2 times more expensive 4.6 –76.7
Include value of reduction in days 114.8 484.7
Include value of reduction in costs 318.5 1,522.3
Source: IEG.
Table 4.5 shows how the final internal rate of return for the project would vary with
changes in key assumptions, so the table offers a guide as to which assumptions are
important. The table displays the change in the estimated rate of return that would
occur with the indicated change in one of the assumptions, maintaining all other
parameter assumptions as in the baseline simulation.
The table also shows that adding an extra 10 years to the horizon of the simulation
(from 10 to 20 years) has modest impact on the rate of return—from 20 to 25 percent,
essentially—so the assumed time horizon is not an issue. It is also apparent that
changes in the demographic parameters have little impact on the rate of return.
Variations in the population growth rates have virtually no impact. Assumptions
about transition probabilities, failure probabilities, and start-up probabilities also
have little importance. The experiment shown in the table is to change these by 20
percent, but one can judge by the small changes that larger changes would also have
little consequence. A more significant example is that if the proportion of existing
firms requiring license renewal each year rose from 20 to 24 percent, the economic
rate of return (ERR) would change from 20 to 23 percent. Overall, however, changes
in the parameters governing the assumed population of enterprises have little
impact on the final rate of return.8

CHAPTER 4 COST-BENEFIT ASSESSMENT OF THE LICENSE REFORM
29
The reference rate of return of 20 percent was calculated using only one benefit
stream: the value of the reduction in office visits. A 20 percent smaller reduction in
required visits (from 4 to 2.4 rather than 4 to 2, for a 20 percent reduction in the gap)
would have an impact—dropping the ERR from 20 to 14 percent. Reductions of 20
percent in the assumed amount of work time lost per day or the average wage
would reduce the ERR by about the same amount. If the project were twice as
expensive, the ERR would still be positive, falling to approximately 5 percent.
Adding in the other benefit streams can make a huge difference to the estimated
return of the project. Adding the value of the reduction in time to obtain a license
would increase the ERR from 20 to 115 percent. Furthermore, if the entire value of
the fee reduction for the enterprise owners was a benefit to society—which would be
the case if the alternative government spending or tax cuts had no social value—the
rate of return would rise from 20 to 319 percent. This shows that, from the
perspective of the enterprise owners, the lion’s share of the value of the project is the
fee reduction. Nevertheless, the reduction in required visits and time alone are
sufficient to justify the costs of the program.
There are legitimate questions that may be raised about the assumptions used in this
analysis, for example, the degree to which waiting in line detracts from productive
work and the value to ascribe to forgone time. Although it is common practice to use
average wages or the minimum wage to value lost time spent waiting in line, the
practice is debatable. Nevertheless, the simulations show that, given the large
number of enterprises affected and the high cost of procedures before the reform,
even very modest assumptions about the value of the changes to the population are
sufficient to justify the project. There is very strong evidence that the project raised
welfare, despite the uncertainties in the analysis and despite the fact that little
evidence has been found for long-term productivity benefits of license reform.

30
5. Conclusions, Policy Implications, and Implications for IFC
Conclusions
This evaluation is about the nature and the magnitude of the cost savings and other
benefits of business license simplification in one of the central districts of Lima, Peru.
The first question was whether the license simplification and cost reductions did, in
fact, lead to greater registration. In answering this, this evaluation separated the
question into its two component parts: Did the reforms reduce costs and procedures,
and did the reduction in procedures increase registrations?
The answer to the first question is yes. Even though different sources cite
inconsistent evidence, all the evidence points to significant reductions in time
required, monetary costs, and the number of procedures. A conservative selection
from the available evidence suggests that the median number of days to obtain a
license fell from 40 to 16; the average number of requirements fell from 8 to 4; the
median cost fell from $188 to $91; and both the number of visits to municipal offices
and the number of inspections fell from 4 to 2. The rise in registrations after the
reforms was dramatic, from 1,711 to 8,457 in the first year before settling down to
1,978 in the third year. Given the short time span, there is no other plausible
explanation than that the reforms were responsible.
Did or will the higher level of formality lead to better enterprise outcomes? Some
proponents for business license simplification claim that businesses will experience
productivity benefits with formal status over and above the direct benefit they
receive from the reduction in procedures, time, and cost savings. Farrell (2004)
claims that informal status perpetuates a low-productivity trap. According to this
view, formality will improve access to financing, will facilitate investment, and will
remove invisible barriers to business growth. The IFC-BREG-sponsored evaluation
found no evidence to support this hypothesis. This evaluation attracted attention
because the data collected and the methods were of unusually high quality and
because they offered a way to adjust for selection bias.
The conclusions based on these data were confirmed here. The group of enterprises
that obtained licenses in response to the financial incentive did not exhibit higher
average revenues or employment (average profits per worker were higher but by a
trivial and not statistically significant amount). Further regression results using
instrumental variables (the best and most accurate technique that copes with the

CHAPTER 5 CONCLUSIONS, POLICY IMPLICATIONS, AND IMPLICATIONS FOR IFC
31
selection bias problem) also showed no evidence that outcomes at the enterprise
level were higher as a result of formal status. Furthermore, the empirical results
confirmed here are similar to the results cited in a study of enterprises in Sri Lanka
by De Mel, McKenzie, and Woodruff (2012). This latter study found that enterprise
sales and employment were not higher after formal status was obtained but that
average profits were higher; however, that was only because a very few firms made
huge gains. As in this evaluation, they found no evidence for broad gains across
many firms and many outcome variables.
Three arguments against these conclusions should be considered. First, the sample is
small and/or the instrumental variable (the financial incentive) is just a moderately
powerful predictor of registration; hence, the estimates have a large statistical error.
In reply, the maximum possible impact consistent with the data was calculated
using the upper limit of the 95 percent confidence interval. It was found that even
these maximum estimates were not so large either, ranging from 17 to 53 percent of
the relevant means.
A second criticism is that the results may only apply for the kinds of enterprises in
the study, which are mostly retail establishments in service sectors in the center of a
city. The response is that this hypothesis should be tested with equally good
evidence, as in the present study, to see if positive effects exist for other kinds of
enterprises.
A third criticism is that the IFC-BREG-sponsored evaluation did not allow sufficient
time to elapse for impacts to emerge. To test this criticism, IEG sponsored a fifth
round of the enterprise survey, conducted 18 months after the fourth-round survey.
Overall, the new data offer no evidence that the short passage of time in the earlier
evaluation was responsible for the lack of results. The new data show small and
statistically insignificant effects on revenues and profits per worker and positive
effects on employment only because employment declined dramatically in the
control group. With the new data, even the maximum possible effect is only an
increase of 28 percent on revenues, 2 percent on profits, and 25 percent on
employment.
A final possible critique is that the results might be unique to the sample of
enterprises chosen. This is possible: the enterprises sampled are not those that
responded immediately to the license reform, and they are small, urban, service-
oriented enterprises in the center of a city.9 Nevertheless, whether results would be
different with other kinds of enterprises awaits further evidence and cannot be
asserted a priori.10

CHAPTER 5 CONCLUSIONS, POLICY IMPLICATIONS, AND IMPLICATIONS FOR IFC
32 32
Policy Implications
What does this say about policy toward informality? The case for state intervention
to promote formality would be strengthened by evidence that (i) there are large
positive effects for enterprise outcomes; (ii) enterprises were uninformed about these
or tended to underestimate the benefits; or (iii) informal status imposes negative
externalities on others in society. The evidence here has cast considerable doubt on
the first argument and in doing so tends to undercut the premise from the second
argument, because it is hard to argue that firms are poorly informed about the
benefits of formal status if little evidence has been found for those benefits.
On the related point of whether enterprise owners are acting rationally by avoiding
registration, the evidence here is consistent with rational behavior. This evidence
shows that 55 percent of the enterprises were willing to register when presented
with the offer to pay the license fee. This is not necessarily irrational behavior, given
all the other costs and benefits of registration, and may, in fact, be surprisingly high.
When surveyed, enterprise owners show they were aware of items on both the cost
and benefit side of the ledger. On the cost side, the license fees were the most
frequently mentioned item; on the benefit side, the stress and worry of not being
registered was frequently mentioned, as was the risk of paying fines. On the final
argument, however, the evidence here does not say anything either way about the
effect of further externalities associated with informalities, such as unfair
competition for the formal sector or higher taxes for legitimate enterprises.
What does the evidence say on the ultimate question of whether the license reform
was worthwhile—whether the full benefits outweighed the full costs of the
program? The calculations here indicate that the value to the enterprise owners of
the reduction in required office visits, in terms of time savings, would alone justify
the cost of the program to IFC. Adding the value of the reduction in time to obtain a
license further reinforces the point, as the cost-benefit calculations showed. Saving
time and hassle are benefits that are pure gains to society, as there are no groups that
gain from enterprise owners waiting in line or wasting their time on redundant
procedures.
In contrast, the reduction in the license fee, although a clear and significant benefit
for enterprise owners, means a reduction in municipal revenues, which in turn has
some costs to society that are difficult to quantify. The fact that gains in terms of
saved time and hassle are quantitatively significant also means that the fundamental
justification for projects such as license simplification does not hinge on the question
of whether formality confers extra benefits on firms.

CHAPTER 5 CONCLUSIONS, POLICY IMPLICATIONS, AND IMPLICATIONS FOR IFC
33
Implications for IFC
IFC sponsored two evaluations for the Business License Simplification Project: The
first examined whether simplification boosted registrations; the second examined
whether registrations caused improved enterprise outcomes. The second evaluation
is a notable example of good practice for several reasons: it addressed a fundamental
question at the heart of the justification for the project; it was based on unique data
collected to conduct a test that was capable of delivering accurate answers, and for
that reason was influential. The double-difference evidence here illustrates the
pitfalls of relying on before-and-after evidence, as is done in many current
evaluations—conclusions can look very different when there is a control group.
The lack of positive results on enterprise outcomes should not be viewed as a
negative experience. In fact, the negative results enable IFC to advance the debate
and to provide a more focused understanding of reasonable expectations for its
projects. IFC deserves credit for collecting information that potentially showed its
projects in an unfavorable light.
There may be an implication here on the basis for promoting licensing reform
projects. Such projects are sometimes promoted as a way to foster dynamic
businesses, but the evidence here, particularly the cost-benefit results, suggests that
the more mundane time and cost savings are an important and significant part of the
benefits. The evidence also shows that the project probably improved social welfare
even if none of the improvements in enterprise outcomes materialized.
There is little evidence for benefits of higher enterprise profits, revenues, or
employment in this specific intervention. Some proponents of licensing projects may
still insist that the evidence regarding other kinds of enterprises would show
different results. This is an area where IFC can improve the evidence base further,
by continuing to sponsor evaluations that test for enterprise outcomes with different
samples of enterprises in different contexts. This holds the promise of sharpening
IFC’s understanding of the circumstances under which promotion of formal status is
likely to be a growth engine in addition to a vehicle to reduce unnecessary
regulatory costs and burdens.
The findings suggest a word of caution in promoting business license simplification
as a growth engine. License simplification may be a necessary but not sufficient
condition for stimulating enterprise growth, or it may work only if other conditions
are satisfied. A stronger body of evidence would need to be developed by IFC to
make either of these claims; such evidence would help to tailor projects to specific
circumstances.

CHAPTER 5 CONCLUSIONS, POLICY IMPLICATIONS, AND IMPLICATIONS FOR IFC
34 34
Based on these findings, IEG has several recommendations:
IFC should follow up this set of evaluations of business licensing for small service-oriented enterprises with evaluations of different kinds of enterprises, for example, small or medium manufacturing enterprises. This will help address the issue of whether the kind of enterprise is responsible for the results seen here.
IFC should continue to invest in collecting high-quality data to address critical issues that are at the heart of the justification for projects. The evidence here has attracted attention precisely because conclusions based on good evidence are perceived to be reliable. As tables 3.2–3.7 illustrate, conclusions reached solely on before-and-after evidence can lead to important mistakes.
IFC should construct a base of evidence on other projects to build a better understanding of which outcomes can be expected for different kinds of projects under what circumstances.

35
Appendix: Data Tables
Table A.1. Impact of Licensing on Enterprise Revenues
(1) (2) (3) (4)
OLS IV
Dependent variable
Obtained license 0.45*** 0.17 0.03 –0.43
(0.13) (0.13) (0.84) (0.94)
Owner –0.14 –0.20
(0.15) (0.18)
Size (floor space) 0.00 0.00
(0.00) (0.00)
Other businesses 0.27 0.29
(0.31) (0.32)
Has partner 0.46* 0.57
(0.26) (0.38)
Age 0.00 0.00
(0.01) (0.01)
Sex 0.04 0.06
(0.11) (0.12)
First business –0.19 –0.23
(0.15) (0.17)
Solicited credit 6 months 0.15 0.20
(0.14) (0.15)
Number of workers 0.07 0.06
(0.07) (0.08)
Purchased equipment 6 months 0.05 0.05
(0.15) (0.15)
Invested in infrastructure 6 months –0.04 0.00
(0.16) (0.18)
Education –0.24** –0.25**
(0.12) (0.12)
Years worked this business –0.01 –0.01
(0.01) (0.01)
Years worked overall 0.00 0.00
(0.01) (0.01)
ln sale price of business 0.21** 0.24**
(0.08) (0.10)
ln self-reported profits –0.10 –0.06
(0.10) (0.12)
ln self-reported revenue 0.46*** 0.33** 0.50*** 0.31**
(0.05) (0.13) (0.10) (0.13)
Constant 3.70*** 3.73*** 3.51*** 3.57***
(0.36) (0.66) (0.53) (0.75)
Observations 245 233 245 233
R-squared 0.33 0.43 0.31 0.38 Source: GRADE data. Note: Robust standard errors in parentheses. *** p<0.01; ** p<0.05; * p<0.1. IV = instrumental variables; OLS = ordinary least squares.

APPENDIX: DATA TABLES
36 36
Table A.2. Impact of Licensing on Enterprise Profits per Worker
(1) (2) (3) (4)
OLS IV
Dependent variable
License 0.20 0.11 -0.86 –0.79
(0.17) (0.20) (1.14) (1.17)
Owner 0.07 –0.02
(0.24) (0.27)
Size (floor space) 0.00 0.00
(0.00) (0.00)
Other businesses –0.02 0.04
(0.29) (0.36)
Has partner 0.83 1.06
(0.53) (0.70)
Age 0.00 0.00
(0.01) (0.01)
Sex 0.11 0.15
(0.14) (0.15)
First business –0.03 –0.08
(0.17) (0.19)
Solicited credit 6mo 0.05 0.13
(0.17) (0.20)
Number of workers –0.12 –0.13
(0.09) (0.09)
Purchased equipment 6 months 0.02 0.04
(0.19) (0.19)
Invested in infrastructure 6 months –0.07 –0.01
(0.22) (0.24)
Education –0.21 –0.24
(0.14) (0.15)
Years worked this business 0.00 0.00
(0.02) (0.03)
Years worked overall 0.00 0.00
(0.02) (0.02)
ln sale price of business 0.17 0.21*
(0.11) (0.12)
ln self-reported profits –0.08 –0.03
(0.12) (0.16)
ln self-reported revenue 0.18 0.16
(0.15) (0.17)
Ln profit per worker 0.09* 0.19
(0.05) (0.12)
Constant 4.46*** 3.18*** 4.22*** 2.81***
(0.24) (0.80) (0.37) (0.94)
Observations 229 222 229 222
R-squared 0.02 0.08 Source: GRADE data. Note: Robust standard errors in parentheses. *** p<0.01; ** p<0.05; * p<0.1. IV = instrumental variable; OLS = ordinary least squares.

APPENDIX: DATA TABLES
37
Table A.3. Impact of Licensing on Enterprise Employment
(1) (2) (3) (4)
OLS IV
Dependent variable
License 0.54*** 0.17 0.52 –0.44
(0.20) (0.23) (1.14) (1.34)
Owner 0.24 0.17
(0.24) (0.28)
Size (floor space) 0.01** 0.01**
(0.00) (0.00)
Other businesses 1.07 1.09
(0.71) (0.68)
Has partner 0.15 0.25
(0.84) (0.84)
Age 0.00 0.00
(0.01) (0.01)
Sex –0.07 –0.04
(0.17) (0.19)
First business –0.04 –0.07
(0.23) (0.26)
Solicited credit 6 months 0.04 0.09
(0.17) (0.22)
Number of workers 0.70*** 0.48*** 0.70*** 0.47***
(0.10) (0.13) (0.14) (0.13)
Purchased equipment 6 months 0.00 0.00
(0.18) (0.18)
Invested in infrastructure 6 months –0.10 –0.04
(0.26) (0.29)
Education –0.16 –0.16
(0.15) (0.16)
Years worked this business 0.00 0.00
(0.02) (0.02)
Years worked overall –0.01 0.00
(0.01) (0.01)
ln sale price of business 0.18 0.20
(0.13) (0.13)
ln self-reported profits –0.01 0.03
(0.14) (0.15)
ln self-reported revenue 0.05 0.04
(0.16) (0.16)
Constant 0.12 –1.25 0.12 –1.44
(0.23) (0.96) (0.23) (1.01)
Observations 252 237 252 237
R-squared 0.33 0.41 0.33 0.38 Source: GRADE data. Note: Robust standard errors in parentheses. *** p<0.01; ** p<0.05; * p<0.1. IV = instrumental variables; OLS = ordinary least squares.

APPENDIX: DATA TABLES
38 38
Table A.4. Summary Statistics
Variable description Unit Obs Mean Std. Dev.
S. dev/ mean
Min Max
Revenues in $ (4th round) Natural logs 247 6.90 1.06 0.40 3.9 10.1
Profits per worker (4th round) Natural logs 237 4.94 1.01 0.40 1.3 7.8
Total workers, including owner (4th round) Number 252 2.10 1.43 0.40 1.0 9.0
Owner 0/1 255 0.86 0.34 0.40 0.0 1.0
Size (floor space) m2 253 31.06 28.41 0.91 2.0 200.0
Has other business 0/1 255 0.05 0.23 4.16 0.0 1.0
Has partner 0/1 255 0.03 0.17 5.57 0.0 1.0
Age Years 255 42.14 12.21 0.29 19.0 74.0
Sex 0/1 255 0.48 0.50 1.05 0.0 1.0
First business 0/1 255 0.78 0.41 0.53 0.0 1.0
Solicited credit last 6 months 0/1 255 0.31 0.46 1.50 0.0 1.0
Total workers, including owner (1st round) Number 255 2.69 1.07 0.40 2.0 7.0
Has purchased equipment last 6 months 0/1 255 0.22 0.41 1.89 0.0 1.0
Has invested infrastructure last 6 months 0/1 255 0.20 0.40 2.00 0.0 1.0
Education 0/1 255 0.37 0.48 1.30 0.0 1.0
Years experience this business Years 255 2.87 5.36 1.87 0.1 45.0
Years experience total Years 255 6.09 7.86 1.29 0.0 45.0
Log sale price of business Natural logs 249 7.60 1.26 0.17 4.1 10.9
Self-reported profits Natural logs 247 5.53 1.22 0.22 0.0 8.3
Revenues in $ (1st round) Natural logs 253 6.81 1.16 0.17 2.8 9.5
Source: GRADE data.

39
References
Alcázar, Lorena, Raúl Andrade, and Miguel Jaramillo. 2011. ―Panel/Tracer Study on the Impact of Business Facilitation Processes on Enterprises and Identification of Priorities for Future Business Enabling Environment Projects in Lima, Peru.‖ Report 6, Mimeo, Grupo para Analysis de Desarollo, Lima, Peru, February.
———. 2010. ―Panel/Tracer Study on the Impact of Business Facilitation Processes on Enterprises and Identification of Priorities for Future Business Enabling Environment Projects in Lima, Peru.‖ Report 5, Mimeo, Grupo para Analysis de Desarollo, ―Impact Evaluation after the Third Round.‖
———. 2010. ―Panel/Tracer Study on the Impact of Business Facilitation Processes on Enterprises and Identification of Priorities for Future Business Enabling Environment Projects in Lima, Peru.‖ Reports 2 and 3, Mimeo, Grupo para Analysis de Desarollo, ―What Are the Real Barriers for Municipal Formalization: A Qualitative Study of Informal Firms in Lima’s Cercado,‖ November.
Bruhn, Miriam. 2011. ―License to Sell: the Effect of Business Registration Reform on Entrepreneurial Activity in Mexico.‖ Review of Economics and Statistics 93(1): 382–86.
De Mel, Suresh, David McKenzie, and Christopher Woodruff. 2012. ―The Demand for, and Consequences of, Formalization among Informal Firms in Sri Lanka.‖ Policy Research Working Paper 5991, World Bank, Washington, DC.
De Soto, Hernando. 1989. The Other Path. New York: Harper and Row Publishers.
Djankov, Simeon, Rafael La Porta, Florencio Lopez-de-Silanes, and Andrei Schleifer. 2002. ―The Regulation of Entry.‖ Quarterly Journal of Economics 117(1): 1–37.
Farrell, Diana. 2004. ―The Hidden Dangers of the Informal Economy.‖ McKinsey Quarterly 3.
IFC (International Finance Corporation). 2009. Doing Business 2010: Reforming through Difficult Times. Washington, DC: World Bank.
Kaplan, David, Eduardo Piedra, and Enrique Seira. 2011. ―Entry Regulation and Business Start-Ups: Evidence from Mexico.‖ Journal of Public Economics 95(11–12): 1501–15.
McKenzie, David, and Yaye Seynabou Sakho. 2010. ―Does It Pay Firms to Register for Taxes? The Impact of Formality on Firm Profitability.‖ Journal of Development Economics 91(1): 15–24.
Schnabl, Philipp, and Sendhil Mullainathan. 2012. ―Does Less Market Entry Regulation Generate More Entrepreneurs? Evidence from a Regulatory Reform in Peru.‖ In International Differences in Entrepreneurship, eds. Joshua Lerner and Antoinette Schoar. Chicago: University of Chicago Press.
Schnabl, Philipp, Sendhil Mullainathan, and Benedikt Kronberger. 2007. ―Evaluation of Business Licensing Simplification in Lima, Peru.‖ Mimeograph, Harvard University, September.
World Bank. 2005. Doing Business 2006. Washington, DC: World Bank.


41
Endnotes
Chapter 1
1 GRADE, in Lima, Peru, conducted the data collection and analysis.
Chapter 3
2 The consumer price index for the municipality of Lima is used to compute constant price figures (http://www.inei.gob.pe/web/aplicaciones/siemweb/index.asp?id=003).
3 The sample size declined from the fourth to the fifth round of the survey. This will bias the results if those exiting differ significantly between the treatment and control groups. GRADE conducted an analysis of all those exiting, without differentiating treatment and control groups. They found that those that left the sample were not more likely to have obtained the encouragement and did not have higher (calculated) profits or incomes, but did tend to be younger firms and have higher (self-reported) profits and higher estimated resale values for their enterprises. This mixed evidence provides no clear signal. IEG then performed a similar analysis differentiating the treatment and control groups. For the control group, IEG found that no variable was significantly related to exiting. For the treatment group, IEG found that those that left the sample were less likely to have invested in equipment or to have sought credit prior to leaving, had higher education levels, and had higher revenues but lower profits. The critical question is whether those exiting the treatment group were those with high potential to grow their revenues and profits, in which case the project would appear to have less of an impact than it really did. However, the evidence appears inconclusive on this point. It is difficult to know if high-revenue firms would be more or less likely to grow revenues in the future. And although more educated entrepreneurs may be thought more successful in the future, those that exited also tended to have lower profits, which suggests that they may have poorer prospects for the future.
4 Alcázar, Andrade, and Jaramillo (2011) provide a useful qualitative insight as to why firms avoid or are not interested in formalization.
Chapter 4
5 From interview with those involved in the enterprise survey.
6 The 36,052 number is derived from Schnabl, Mullainathan, and Kronberger (2007), who state that the cadastral register in El Cercado de Lima ―contained more than 50,000 locations that pursued economic activities,‖ and that the district’s register contained 13,948 licenses (p. 9).
7 The costs are taken from the IFC Doing Business 2010 report (IFC 2009, p. 2). Costs include staff time, travel, consultants, and an 18 percent IFC overhead rate, but do not include in-kind contributions (see p. 2, footnote 8).
8 Clearly, changes in assumptions that cause the number of firms to skyrocket or the proportion of informal or formal firms to exceed zero or one would alter the ERR substantially, but these would be unrealistic. The simulations are constrained by the requirement to produce plausible estimates.

ENDNOTES
42
Chapter 5
9 The quantitative evidence in Alcázar, Andrade, and Jaramillo (2011) supports the notion that some of the firms in this district simply are not considering growing or investing; they exist only for subsistence income maintenance.
10 It is possible that reductions in licensing costs have an effect by increasing the rate of new firm foundation. Because the data here are for established firms, they do not address this possibility.