Embed Size (px)
Citation preview
Impact Evaluation of 2013-14 Commercial Quality Maintenance Programs (HVAC3) California Public Utilities Commission Date: April 1, 2016
CALMAC Study ID CPU0117
LEGAL NOTICE
This report was prepared under the auspices of the California Public Utilities Commission (CPUC). While sponsoring this work, the CPUC does not necessarily represent the views of the Commission or any of its employees except to the extent, if any, that it has formally been approved by the Commission at a public meeting. For information regarding any such action, communicate directly with the Commission at 505 Van Ness Avenue, San Francisco, California 94102. Neither the Commission nor the State of California, nor any officer, employee, or any of its contractors or subcontractors makes any warrant, express or implied, or assumes any legal liability whatsoever for the contents of this document.”
DNV GL - Energy – www.dnvgl.com/energy

Table of contents
1 EXECUTIVE SUMMARY ..................................................................................................... 1 1.1 Study focus 1 1.2 Energy savings calculations 4 1.3 Measure group results 5
Coil-cleaning measure group results 5 1.3.1 RCA measure group results 6 1.3.2 Economizer-repair measure group results 7 1.3.3 Thermostat-adjustment measure group results 7 1.3.4 Supply-fan controls measure group 7 1.3.5 QM measure group 8 1.3.6
1.4 Conclusions and recommendations 8
2 INTRODUCTION ............................................................................................................ 10 2.1 Objectives 11 2.2 Evaluated measure groups 12
Measure group descriptions 12 2.2.1 Claimed gross savings 15 2.2.2
2.3 Research issues 17 2.4 Field M&V approach 18
3 COMPLETED EVALUATION ACTIVITIES............................................................................. 20 3.1 Participation records review 20 3.2 Sample design 21 3.3 Field testing 23
Implementation ride-along visits 23 3.3.1 Post-performance site visits 24 3.3.2
4 GROSS SAVINGS METHODS AND RESULTS ...................................................................... 25 4.1 Coil cleaning 26
Workpaper review: ex ante methodology 26 4.1.1 Ex post methodology 26 4.1.2 Laboratory data 27 4.1.3 Ride-along data 33 4.1.4 Results: ex post analysis using lab data and ride-along data 34 4.1.5 Program-specific results 39 4.1.6
4.2 Refrigerant charge adjustment 40 Workpaper review: ex ante methodology 40 4.2.1 Ex post methodology 41 4.2.2 Field results of measured refrigerant charge 47 4.2.3
4.3 Economizer Measures 55 Economizer repair workpaper summary 55 4.3.1 Economizer control workpaper summary 56 4.3.2 Economizer Characteristics 56 4.3.3 Ex post methodology 58 4.3.4 Installation rate using functional testing results 59 4.3.5
4.4 Thermostat 62 Workpaper review: ex ante methodology 63 4.4.1 Ex post methodology 63 4.4.2 Results 63 4.4.3
4.5 Supply fan control 65
DNV GL – www.dnvgl.com 4/1/16 Page i

Workpaper review: ex ante methodology 66 4.5.1 Ex post methodology 66 4.5.2 Results 67 4.5.3
4.6 Quality maintenance measure 70 Workpaper review: ex ante methodology 70 4.6.1 QM program activity 71 4.6.2 Ex post methodology 72 4.6.3
4.7 Evaluated program-level gross savings 74 PG&E 74 4.7.1 SCE 76 4.7.2 SDG&E 76 4.7.3
5 CONCLUSIONS AND RECOMMENDATIONS ........................................................................ 78
STANDARDIZED HIGH LEVEL SAVINGS .............................................................. AA-1 APPENDIX AA.
STANDARDIZED PER UNIT SAVINGS .................................................................. BB-1 APPENDIX BB.
RECOMMENDATIONS ....................................................................................... CC-1 APPENDIX CC.
DETAILED SIMULATION RESULTS ......................................................................... B-1 APPENDIX B.
EVALUATED QM PROGRAMS ................................................................................. C-1 APPENDIX C.
DETAILED M&V PLAN ........................................................................................... D-1 APPENDIX D.
M&V DATA SUMMARY – NON-RESIDENTIAL QM ...................................................... E-1 APPENDIX E.
IMPLEMENTER DATA ............................................................................................ F-1 APPENDIX F.
SAMPLE DESIGN MEMO ....................................................................................... G-1 APPENDIX G.
ECONOMIZER BATCH PROCESS PROCEDURE .......................................................... H-1 APPENDIX H.
PILOT MEMORANDUM ........................................................................................... I-1 APPENDIX I.
DATA COLLECTION METHODS AND GUIDES ........................................................... J-1 APPENDIX J.
HVAC SYSTEM FUNDAMENTALS & SYSTEM FAULTS ................................................. K-1 APPENDIX K.
HVAC5 LABORATORY METHODOLOGY .................................................................... L-1 APPENDIX L.
PUBLIC COMMENT MATRIX ................................................................................. M-1 APPENDIX M.
List of figures Figure 1. Schematic of a rooftop unit and location of evaluated QM measure groups ................................. 2 Figure 2. Ex ante savings calculation process ....................................................................................... 4 Figure 3. Development of ex post savings ............................................................................................ 5 Figure 4. Coil cleaning in RTU ........................................................................................................... 12 Figure 5. RCA in RTU ....................................................................................................................... 13 Figure 6. Economizer in RTU ............................................................................................................ 14
DNV GL – www.dnvgl.com 4/1/16 Page ii
Figure 7. Thermostat for RTU ........................................................................................................... 14 Figure 8. Supply fan and thermostat in RTU ....................................................................................... 15 Figure 9. Schematic of a RTU and location of evaluated measure groups ................................................ 25 Figure 10. Relative efficiency impact due to condenser coil blockage ..................................................... 29 Figure 11. Relative total capacity impact due to condenser coil blockage ................................................ 30 Figure 12. Impact of evaporator coil blockage on relative efficiency....................................................... 32 Figure 13. Impact of evaporator coil blockage on total and sensible cooling capacity ............................... 32 Figure 14. Refrigerant charge impact on unit efficiency (95°F OAT) ....................................................... 46 Figure 15. Refrigerant charge impact on total capacity (95°F OAT)........................................................ 46 Figure 16. Refrigerant charge impact on sensible capacity (95°F OAT) ................................................... 47 Figure 17. SCE Commercial QM implementer supply fan baseline description .......................................... 68 Figure 18. SCE Commercial QM implementer supply fan treatment when found on .................................. 69 Figure 19. SCE Commercial QM implementer supply fan treatment when found off or auto ...................... 69 Figure 1: Test Equipment Schematic ................................................................................................ L-3 Figure 2: Uncertainty of Laboratory Test Measurements ..................................................................... L-4
List of tables Table 1. Realization rates of evaluated IOU QM programs and measure groups......................................... 3 Table 2. Measure group total ex ante program savings (2013-14) ......................................................... 16 Table 3. Evaluated high-impact measures and savings by commercial program (2013-14) ....................... 17 Table 4. Final optimized sample design .............................................................................................. 22 Table 5. Data set size for measure parameters with corresponding sampling precision ............................ 23 Table 6. Implementation ride-along sample by IOU ............................................................................. 24 Table 7. Post-performance site visit sample by IOU ............................................................................. 24 Table 8. Relevant workpapers affected by QM Disposition .................................................................... 26 Table 9. Laboratory research: Properties of evaluated units ................................................................. 28 Table 10. Test ride-along pre and post coil-cleaning unit characteristics ................................................. 34 Table 11. Ride-along condenser coil cleaning results ........................................................................... 35 Table 12. Condenser coil cleaning DOE-2 adjustment factors ................................................................ 37 Table 13. Ride-along evaporator coil cleaning results........................................................................... 38 Table 14. Condenser coil cleaning results by program .......................................................................... 39 Table 15. Evaporator coil cleaning results by program ......................................................................... 40 Table 16. Commercial HVAC workpaper summary for RCA ................................................................... 41 Table 17. Distribution of overcharge/undercharge claims by program, ................................................... 43 Table 18. Refrigerant charge impact regression coefficients .................................................................. 45 Table 19. Weigh-out circuit results, undercharged ............................................................................... 48 Table 20. Weigh-out results, overcharged .......................................................................................... 48 Table 21. Pre- and post-charge offset by system type and pre-condition ................................................ 49 Table 22. SDG&E Deemed Incentives Commercial HVAC circuit distribution ............................................ 50 Table 23. SCE QM circuit distribution ................................................................................................. 50 Table 24. PG&E (AirCare Plus and Commercial QM) circuit distribution ................................................... 50 Table 25. Ex post DOE-2 adjustment factors ...................................................................................... 51 Table 26. Comparison of ex ante and ex post DOE-2 adjustment factors for RCA .................................... 52 Table 27. Ratio of ex post to ex ante (pre-post) DOE-2 adjustment factors using DEER conditions ............ 53 Table 28. RCA results by program ..................................................................................................... 54 Table 29. Workpaper base-case and measure-case economizer parameter definitions ............................. 56 Table 30. Surveyed economizer control type ...................................................................................... 56 Table 31. Economizer sensor type ..................................................................................................... 57 Table 32. Economizer controller type ................................................................................................. 57 Table 33. Economizer set points ....................................................................................................... 57 Table 34. Results of functional testing to determine installation rates .................................................... 61 Table 35. Economizer results summary .............................................................................................. 62 Table 36. Economizer savings by program ......................................................................................... 62 Table 37. Programmable thermostat workpaper assumptions ............................................................... 63 Table 38. Thermostat field verification results ..................................................................................... 64
DNV GL – www.dnvgl.com 4/1/16 Page iii
Table 39. Distribution of implementer-reported thermostat properties ................................................... 64 Table 40. Thermostat savings by program ......................................................................................... 65 Table 41. Supply fan control measure records in PG&E CQM implementer data ....................................... 67 Table 42. Supply fan control results by program ................................................................................. 70 Table 43: Supply fan control them savings results by program ............................................................. 70 Table 44. Assumed and implemented QM component measure incidence ............................................... 72 Table 45: SCE QM program savings by measure ................................................................................. 73 Table 46: Data set size for measure parameters with corresponding sampling precision .......................... 74 Table 47. PG&E Commercial QM program level electric first-year savings ............................................... 74 Table 48. PG&E Commercial QM program level gas first-year savings .................................................... 75 Table 49. PG&E AirCare Plus program level electric first-year savings .................................................... 75 Table 50. PG&E AirCare Plus program level gas first-year savings ......................................................... 75 Table 51. SCE QM program level electric first-year savings .................................................................. 76 Table 52. SDG&E Deemed program level electric first-year savings ....................................................... 76 Table 53. SDG&E Direct Install program level electric first-year savings ................................................. 77 Table 54. SDG&E Direct Install program level gas first-year savings ...................................................... 77 Table 4: Tests for Manufacturer #1 R-22 7.5-ton non-TXV, 2-Circuit (2 circuit) RTU3 ............................. L-5 Table 5: Tests for Manufacturer #2 R-22 7.5-ton TXV 2-Circuit (2 compressor) RTU1 ............................. L-5 Table 6: Tests for Manufacturer #2 R-22 7.5-ton TXV, 2-Circuit (2 compressor) RTU2 ............................ L-6 Table 7: Tests for Manufacturer #1 R-22 3-ton non-TXV 1-Circuit (1 compressor) RTU5 ......................... L-6 Table 8: Tests for Manufacturer #3 R-22 3-ton TXV 1- Circuit (1 compressor) RTU4 .............................. L-7
DNV GL – www.dnvgl.com 4/1/16 Page iv
1 EXECUTIVE SUMMARY There are hundreds of thousands of aging commercial rooftop air conditioners in operation in California that are key contributors to summer-peak electric demand and annual energy consumption. The California Public Utilities Commission (CPUC) in cooperation with the California Energy Commission (CEC) proposed a big bold energy efficiency strategy within the California Long-Term Energy Efficiency Strategic Plan1 (CLTEESP) to ensure that heating, ventilation, and air conditioning (HVAC) energy performance is optimal for California’s climate. The CPUC developed an HVAC Action Plan2 to meet strategic plan goals through incentive programs and research targeted at HVAC end-use. Further, the Commission designed quality maintenance (QM) and related tune-up programs to support the HVAC big bold strategy by optimizing the performance of existing HVAC equipment.
The CPUC regularly evaluates the achieved energy impacts (in kWh, kW, and therms) of the QM programs offered by three California investor-owned electric utilities (IOUs): San Diego Gas and Electric Company (SDG&E), Southern California Edison (SCE), and Pacific Gas and Electric Company (PG&E). This report presents DNV GL’s impact evaluation of the 2013-14 California IOU commercial programs focused on QM and related HVAC tune-up programs. The primary results of this evaluation are adjustments to key technical assumptions that were used to calculate estimates of energy savings during the program approval period. These adjustments, when run through standard engineering models, result in estimates of achieved gross energy and demand savings, and when compared with ex ante claims, also provide realization rates. The primary goals of this evaluation are to assess the efficacy of the key measures installed and the subsequent savings achieved from QM programs in 2013-14, and to provide insight on how effective these programs are and what improvements can be made to move towards the CLTEESP goals.
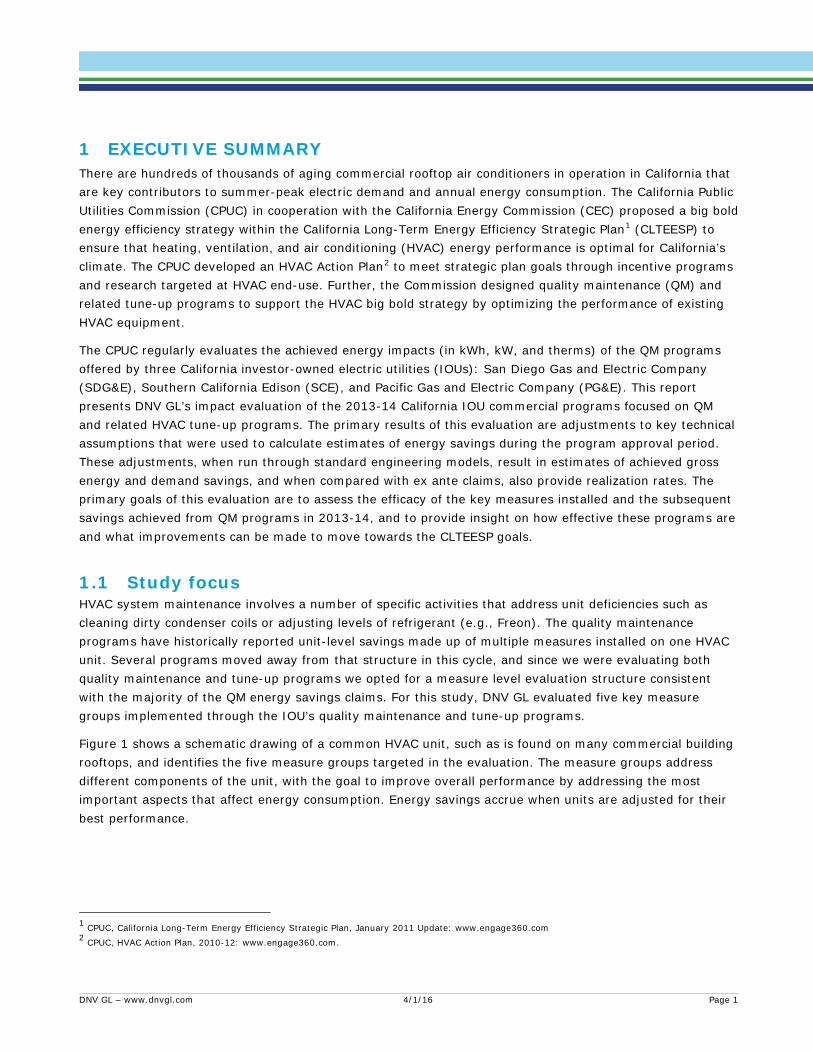
HVAC system maintenance involves a number of specific activities that address unit deficiencies such as cleaning dirty condenser coils or adjusting levels of refrigerant (e.g., Freon). The quality maintenance programs have historically reported unit-level savings made up of multiple measures installed on one HVAC unit. Several programs moved away from that structure in this cycle, and since we were evaluating both quality maintenance and tune-up programs we opted for a measure level evaluation structure consistent with the majority of the QM energy savings claims. For this study, DNV GL evaluated five key measure groups implemented through the IOU’s quality maintenance and tune-up programs.
Figure 1 shows a schematic drawing of a common HVAC unit, such as is found on many commercial building rooftops, and identifies the five measure groups targeted in the evaluation. The measure groups address different components of the unit, with the goal to improve overall performance by addressing the most important aspects that affect energy consumption. Energy savings accrue when units are adjusted for their best performance.
1 CPUC, California Long-Term Energy Efficiency Strategic Plan, January 2011 Update: www.engage360.com 2 CPUC, HVAC Action Plan, 2010-12: www.engage360.com.
1.1 Study focus
DNV GL – www.dnvgl.com 4/1/16 Page 1
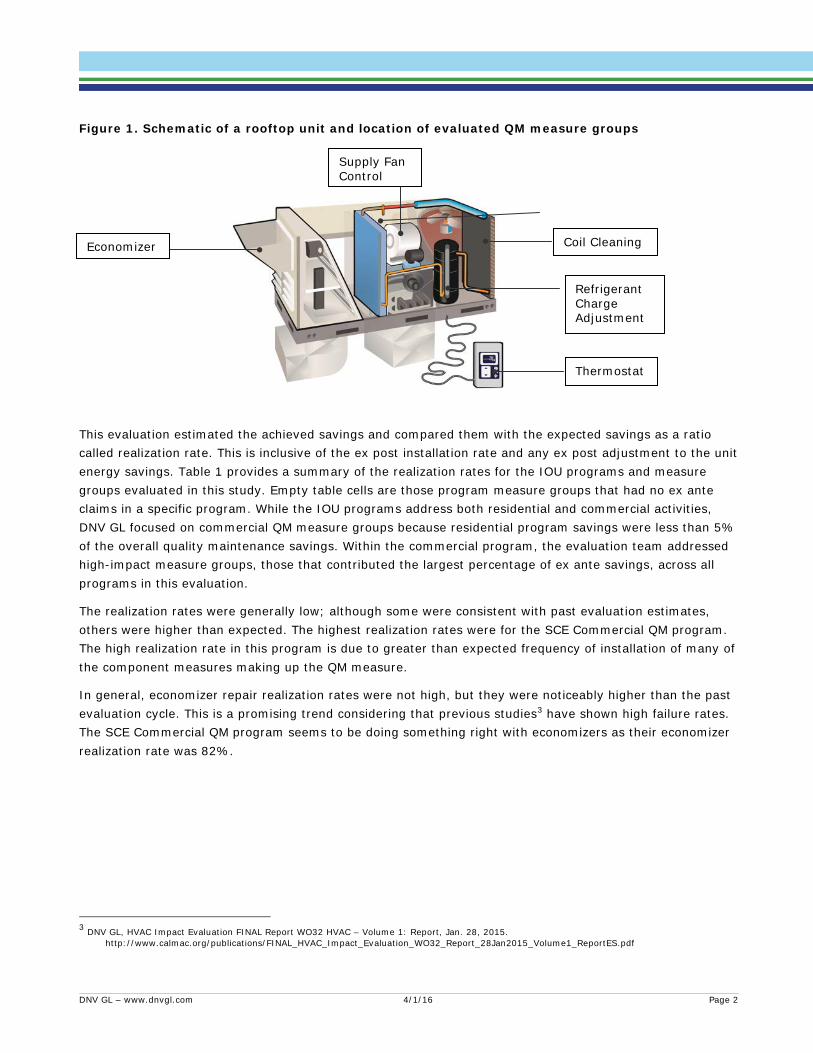
Figure 1. Schematic of a rooftop unit and location of evaluated QM measure groups
This evaluation estimated the achieved savings and compared them with the expected savings as a ratio called realization rate. This is inclusive of the ex post installation rate and any ex post adjustment to the unit energy savings. Table 1 provides a summary of the realization rates for the IOU programs and measure groups evaluated in this study. Empty table cells are those program measure groups that had no ex ante claims in a specific program. While the IOU programs address both residential and commercial activities, DNV GL focused on commercial QM measure groups because residential program savings were less than 5% of the overall quality maintenance savings. Within the commercial program, the evaluation team addressed high-impact measure groups, those that contributed the largest percentage of ex ante savings, across all programs in this evaluation.
The realization rates were generally low; although some were consistent with past evaluation estimates, others were higher than expected. The highest realization rates were for the SCE Commercial QM program. The high realization rate in this program is due to greater than expected frequency of installation of many of the component measures making up the QM measure.
In general, economizer repair realization rates were not high, but they were noticeably higher than the past evaluation cycle. This is a promising trend considering that previous studies3 have shown high failure rates. The SCE Commercial QM program seems to be doing something right with economizers as their economizer realization rate was 82%.
3 DNV GL, HVAC Impact Evaluation FINAL Report WO32 HVAC – Volume 1: Report, Jan. 28, 2015. http://www.calmac.org/publications/FINAL_HVAC_Impact_Evaluation_WO32_Report_28Jan2015_Volume1_ReportES.pdf
Economizer
Thermostat d
Supply Fan Control
Refrigerant Charge Adjustment
Coil Cleaning
DNV GL – www.dnvgl.com 4/1/16 Page 2
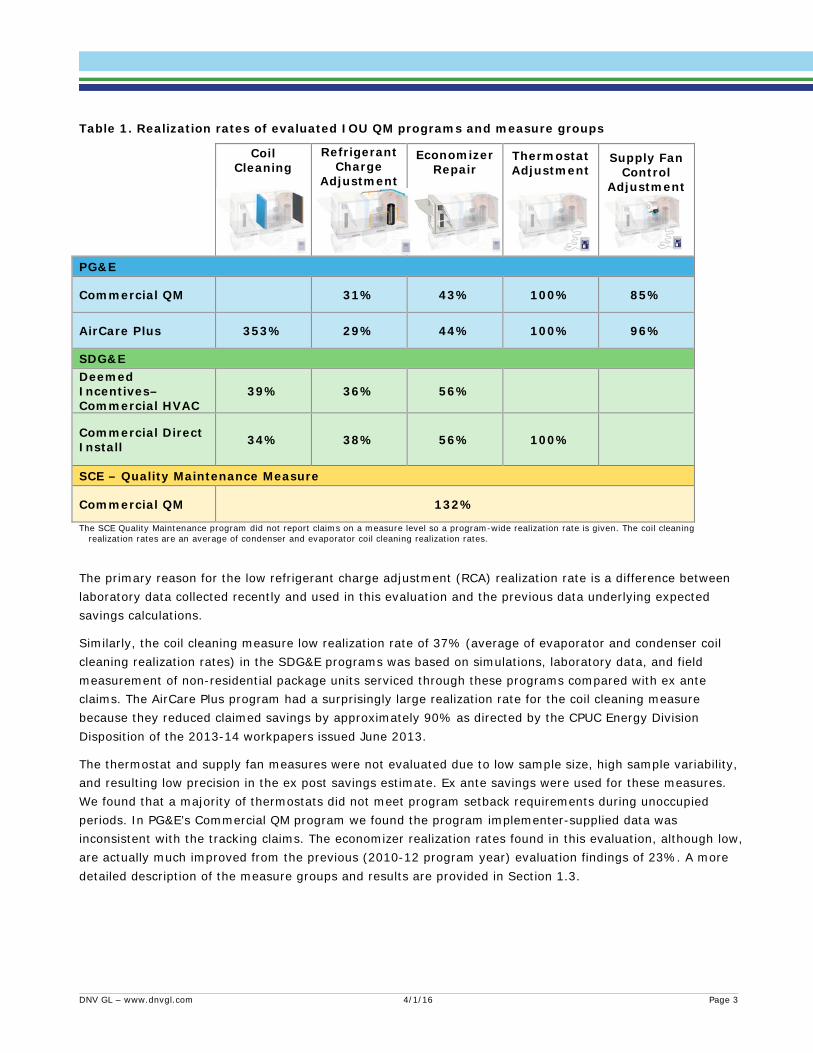
Table 1. Realization rates of evaluated IOU QM programs and measure groups
Coil Cleaning
Refrigerant Charge
Adjustment
Economizer Repair
Thermostat Adjustment
Supply Fan Control
Adjustment
PG&E
Commercial QM 31% 43% 100% 85%
AirCare Plus 353% 29% 44% 100% 96%
SDG&E Deemed Incentives–Commercial HVAC
39% 36% 56%
Commercial Direct Install 34% 38% 56% 100%
SCE – Quality Maintenance Measure
Commercial QM 132%
The SCE Quality Maintenance program did not report claims on a measure level so a program-wide realization rate is given. The coil cleaning realization rates are an average of condenser and evaporator coil cleaning realization rates.
The primary reason for the low refrigerant charge adjustment (RCA) realization rate is a difference between laboratory data collected recently and used in this evaluation and the previous data underlying expected savings calculations.
Similarly, the coil cleaning measure low realization rate of 37% (average of evaporator and condenser coil cleaning realization rates) in the SDG&E programs was based on simulations, laboratory data, and field measurement of non-residential package units serviced through these programs compared with ex ante claims. The AirCare Plus program had a surprisingly large realization rate for the coil cleaning measure because they reduced claimed savings by approximately 90% as directed by the CPUC Energy Division Disposition of the 2013-14 workpapers issued June 2013.
The thermostat and supply fan measures were not evaluated due to low sample size, high sample variability, and resulting low precision in the ex post savings estimate. Ex ante savings were used for these measures. We found that a majority of thermostats did not meet program setback requirements during unoccupied periods. In PG&E’s Commercial QM program we found the program implementer-supplied data was inconsistent with the tracking claims. The economizer realization rates found in this evaluation, although low, are actually much improved from the previous (2010-12 program year) evaluation findings of 23%. A more detailed description of the measure groups and results are provided in Section 1.3.
DNV GL – www.dnvgl.com 4/1/16 Page 3
CPUC Disposition
Ex Ante ProcessIOU is Responsible
Research:What measures to adoptHow much savings for
each?
Develop a work paper for each measure
Develop Programs, encompassing these
measures
TrackIng Data:Tracks Claims and Savings
for CPUC
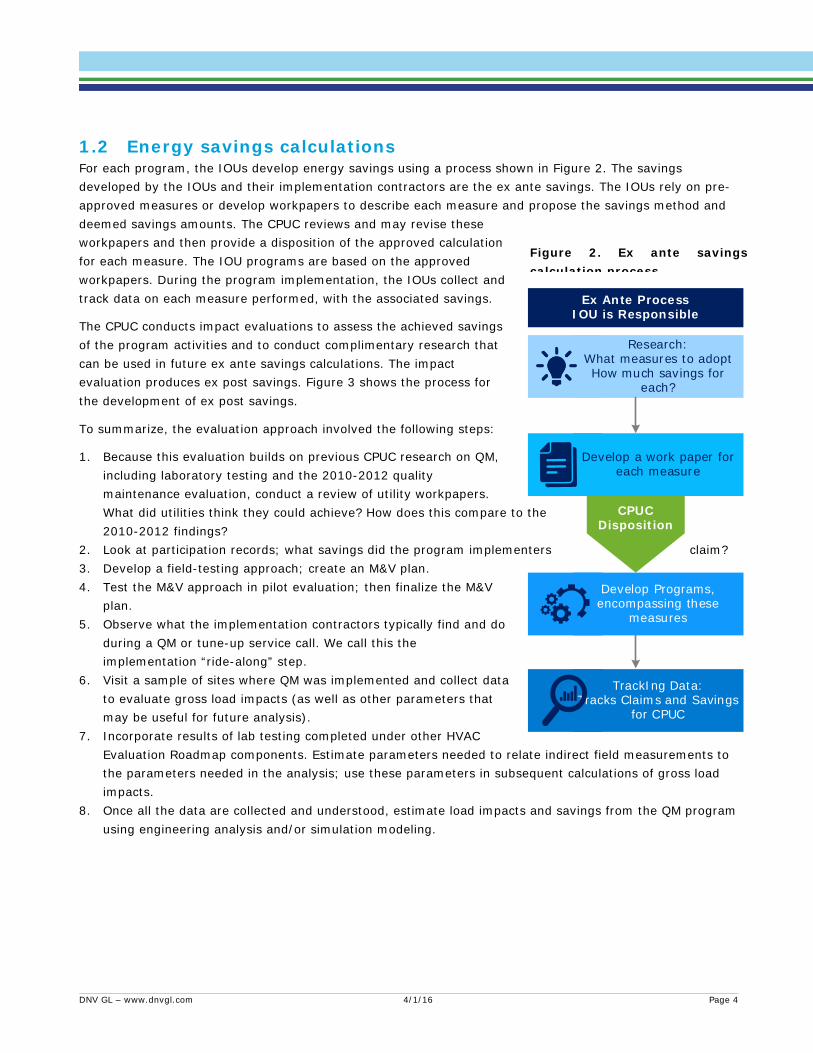
For each program, the IOUs develop energy savings using a process shown in Figure 2. The savings developed by the IOUs and their implementation contractors are the ex ante savings. The IOUs rely on pre-approved measures or develop workpapers to describe each measure and propose the savings method and deemed savings amounts. The CPUC reviews and may revise these workpapers and then provide a disposition of the approved calculation for each measure. The IOU programs are based on the approved workpapers. During the program implementation, the IOUs collect and track data on each measure performed, with the associated savings.
The CPUC conducts impact evaluations to assess the achieved savings of the program activities and to conduct complimentary research that can be used in future ex ante savings calculations. The impact evaluation produces ex post savings. Figure 3 shows the process for the development of ex post savings.
To summarize, the evaluation approach involved the following steps:
1. Because this evaluation builds on previous CPUC research on QM, including laboratory testing and the 2010-2012 quality maintenance evaluation, conduct a review of utility workpapers. What did utilities think they could achieve? How does this compare to the 2010-2012 findings?
2. Look at participation records; what savings did the program implementers claim? 3. Develop a field-testing approach; create an M&V plan. 4. Test the M&V approach in pilot evaluation; then finalize the M&V
plan. 5. Observe what the implementation contractors typically find and do
during a QM or tune-up service call. We call this the implementation “ride-along” step.
6. Visit a sample of sites where QM was implemented and collect data to evaluate gross load impacts (as well as other parameters that may be useful for future analysis).
7. Incorporate results of lab testing completed under other HVAC Evaluation Roadmap components. Estimate parameters needed to relate indirect field measurements to the parameters needed in the analysis; use these parameters in subsequent calculations of gross load impacts.
8. Once all the data are collected and understood, estimate load impacts and savings from the QM program using engineering analysis and/or simulation modeling.
1.2 Energy savings calculations
Figure 2. Ex ante savings calculation process
DNV GL – www.dnvgl.com 4/1/16 Page 4
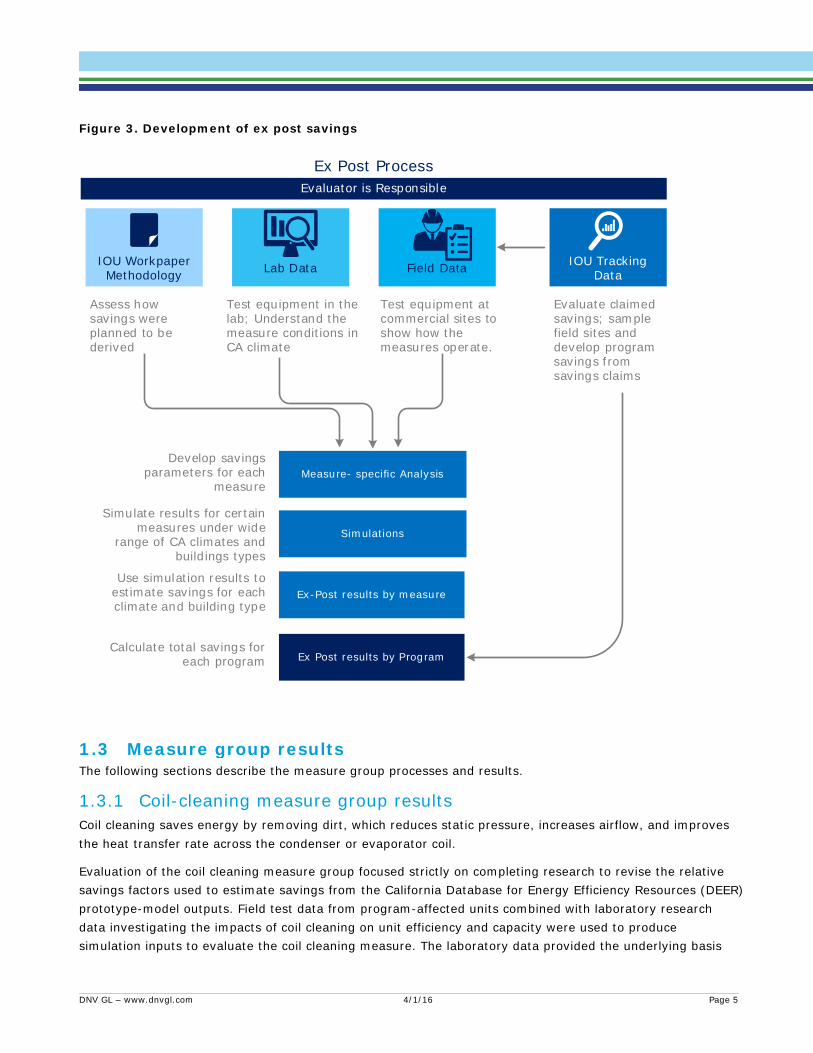
Figure 3. Development of ex post savings
Evaluator is Responsible
Measure- specific Analysis
IOU Workpaper Methodology Lab Data Field Data IOU Tracking
Data
Assess how savings were planned to be derived
Test equipment in the lab; Understand the measure conditions in CA climate
Test equipment at commercial sites to show how the measures operate.
Evaluate claimed savings; sample field sites and develop program savings from savings claims
Simulations
Ex-Post results by measure
Ex Post results by Program
Develop savings parameters for each
measure
Simulate results for certain measures under wide
range of CA climates and buildings types
Use simulation results to estimate savings for each climate and building type
Calculate total savings for each program
Ex Post Process
The following sections describe the measure group processes and results.
Coil-cleaning measure group results 1.3.1Coil cleaning saves energy by removing dirt, which reduces static pressure, increases airflow, and improves the heat transfer rate across the condenser or evaporator coil.
Evaluation of the coil cleaning measure group focused strictly on completing research to revise the relative savings factors used to estimate savings from the California Database for Energy Efficiency Resources (DEER) prototype-model outputs. Field test data from program-affected units combined with laboratory research data investigating the impacts of coil cleaning on unit efficiency and capacity were used to produce simulation inputs to evaluate the coil cleaning measure. The laboratory data provided the underlying basis
1.3 Measure group results
DNV GL – www.dnvgl.com 4/1/16 Page 5

for quantifying two relationships. The first is the relationship between ambient temperature, relative change in compressor discharge pressure due to coil cleaning, and the system efficiency (energy efficiency ratio, EER, or electric input ratio, EIR), and the second is between ambient temperature, relative change in compressor discharge pressure due to coil cleaning, and the system total and sensible cooling capacity.
While the laboratory results show significant impact from condenser coil cleaning, they showed very small impacts of cleaning evaporator coils. Using the laboratory relationships for evaporator coil cleaning, with relative change in system airflow data from the site visits, we calculated the change in coil bypass factor because of evaporator coil cleaning. The coil bypass factor is an input to the DOE2 simulation model that accounts for the fraction of total capacity that supplies latent versus sensible cooling. The revised coil bypass factor was used to develop simulation input parameters to calculate the ex post savings estimates. Applying the revised simulation savings across all measure variations resulted in average gross realization rates of 9% for electric energy (kWh) savings and 22% for electric demand reduction (kW).
Using the laboratory relationships for condenser coil cleaning, with ambient temperature and relative discharge-pressure data points from the site visits, we calculated the improvement in system efficiency and cooling capacity because of condenser coil cleaning. The revised efficiency and capacity were used to develop simulation input parameters to calculate the ex post savings estimates. Applying the revised simulation savings across all measure variations resulted in average gross realization rates of 69% for electric energy (kWh) savings and 122% for electric demand reduction (kW).
RCA measure group results 1.3.2The RCA measure group seeks to improve air conditioning unit performance by adding or removing refrigerant charge from air conditioning refrigeration circuits. Too much or too little refrigerant reduces performance.
DNV GL evaluated refrigerant charge for the 2013-14 programs by measuring the refrigerant charge of units after service combined with service data on the refrigerant adjustments made by the service technician to estimate the pre-service charge. These data were linked to laboratory research results (developed in a related laboratory study) that established the relationship between various charge conditions to EER and sensible and total cooling capacity. Revised EER and capacity from the analysis were then run through the appropriate DEER prototype simulation models to calculate ex post savings from the observed ex post parameters. A random sample of 25 single-compressor and 11 dual-compressor packaged rooftop air conditioners from project year 2013 was used for the assessment. The calculated results were compared with the program-assumed EERs, capacities, and subsequent savings estimates.
Through a review of the PG&E AirCare Plus program data, the evaluation team discovered that many of the claimed charge adjustments were actually coded as “test only” in the program implementer databases. The installation rate for incorrectly claimed units was set to zero since there are supposed to be no savings claimed for only testing for refrigerant charge. Savings for this program were substantially lower once this adjustment was applied.
The ex post estimates of an overall 1.011 adjustment to the EIR and 0.869 adjustment to unit capacity were lower than the ex ante assumptions of a 1.253 adjustment to EIR and a 0.832 adjustment to capacity for typically installed charge adjustments (those where charge was adjusted <20%). Using eQuest to simulate savings across population climate zones and building types leads to statewide gross realization rates of 34% for electric energy (kWh) savings and 23% for electric demand reduction (kW).
DNV GL – www.dnvgl.com 4/1/16 Page 6
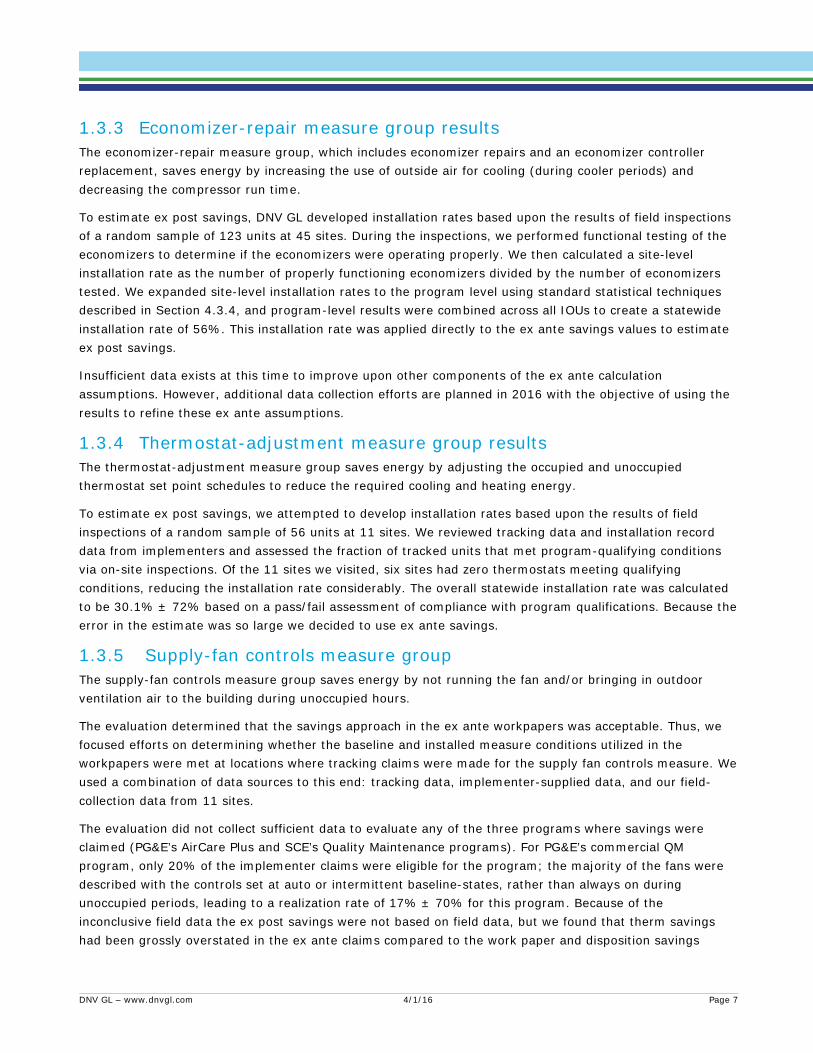
Economizer-repair measure group results 1.3.3The economizer-repair measure group, which includes economizer repairs and an economizer controller replacement, saves energy by increasing the use of outside air for cooling (during cooler periods) and decreasing the compressor run time.
To estimate ex post savings, DNV GL developed installation rates based upon the results of field inspections of a random sample of 123 units at 45 sites. During the inspections, we performed functional testing of the economizers to determine if the economizers were operating properly. We then calculated a site-level installation rate as the number of properly functioning economizers divided by the number of economizers tested. We expanded site-level installation rates to the program level using standard statistical techniques described in Section 4.3.4, and program-level results were combined across all IOUs to create a statewide installation rate of 56%. This installation rate was applied directly to the ex ante savings values to estimate ex post savings.
Insufficient data exists at this time to improve upon other components of the ex ante calculation assumptions. However, additional data collection efforts are planned in 2016 with the objective of using the results to refine these ex ante assumptions.
Thermostat-adjustment measure group results 1.3.4The thermostat-adjustment measure group saves energy by adjusting the occupied and unoccupied thermostat set point schedules to reduce the required cooling and heating energy.
To estimate ex post savings, we attempted to develop installation rates based upon the results of field inspections of a random sample of 56 units at 11 sites. We reviewed tracking data and installation record data from implementers and assessed the fraction of tracked units that met program-qualifying conditions via on-site inspections. Of the 11 sites we visited, six sites had zero thermostats meeting qualifying conditions, reducing the installation rate considerably. The overall statewide installation rate was calculated to be 30.1% ± 72% based on a pass/fail assessment of compliance with program qualifications. Because the error in the estimate was so large we decided to use ex ante savings.
Supply-fan controls measure group 1.3.5The supply-fan controls measure group saves energy by not running the fan and/or bringing in outdoor ventilation air to the building during unoccupied hours.
The evaluation determined that the savings approach in the ex ante workpapers was acceptable. Thus, we focused efforts on determining whether the baseline and installed measure conditions utilized in the workpapers were met at locations where tracking claims were made for the supply fan controls measure. We used a combination of data sources to this end: tracking data, implementer-supplied data, and our field-collection data from 11 sites.
The evaluation did not collect sufficient data to evaluate any of the three programs where savings were claimed (PG&E’s AirCare Plus and SCE’s Quality Maintenance programs). For PG&E’s commercial QM program, only 20% of the implementer claims were eligible for the program; the majority of the fans were described with the controls set at auto or intermittent baseline-states, rather than always on during unoccupied periods, leading to a realization rate of 17% ± 70% for this program. Because of the inconclusive field data the ex post savings were not based on field data, but we found that therm savings had been grossly overstated in the ex ante claims compared to the work paper and disposition savings
DNV GL – www.dnvgl.com 4/1/16 Page 7
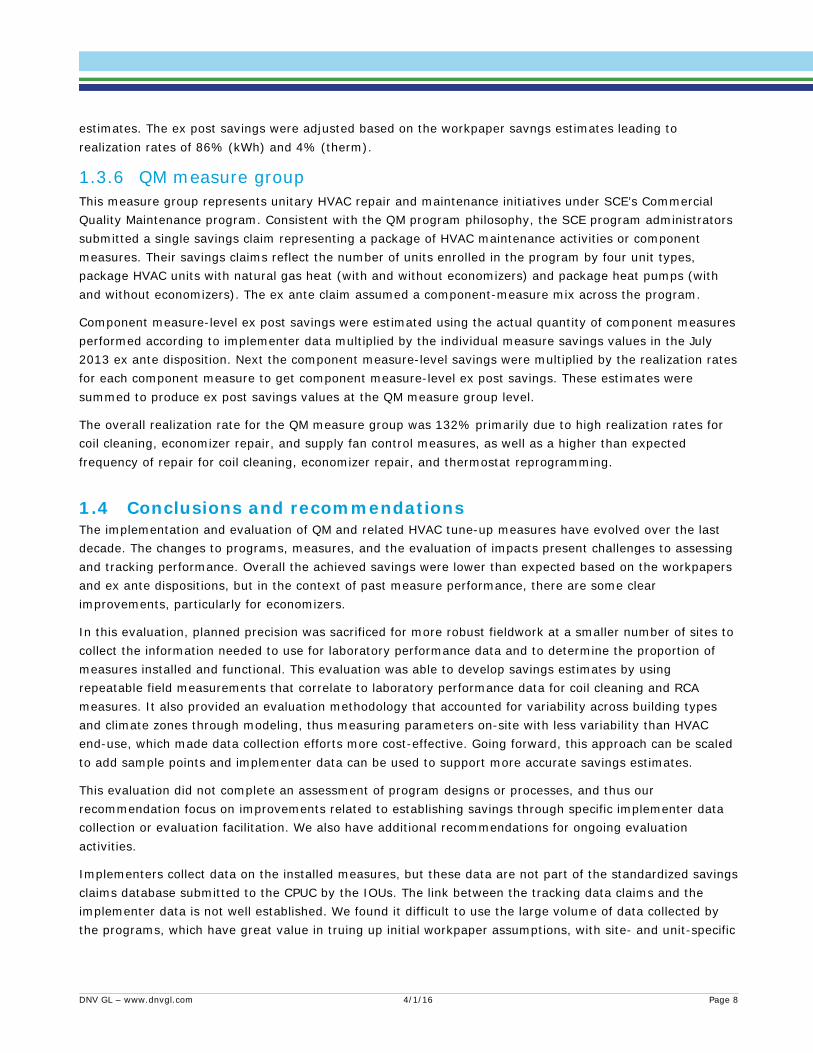
estimates. The ex post savings were adjusted based on the workpaper savngs estimates leading to realization rates of 86% (kWh) and 4% (therm).
QM measure group 1.3.6This measure group represents unitary HVAC repair and maintenance initiatives under SCE’s Commercial Quality Maintenance program. Consistent with the QM program philosophy, the SCE program administrators submitted a single savings claim representing a package of HVAC maintenance activities or component measures. Their savings claims reflect the number of units enrolled in the program by four unit types, package HVAC units with natural gas heat (with and without economizers) and package heat pumps (with and without economizers). The ex ante claim assumed a component-measure mix across the program.
Component measure-level ex post savings were estimated using the actual quantity of component measures performed according to implementer data multiplied by the individual measure savings values in the July 2013 ex ante disposition. Next the component measure-level savings were multiplied by the realization rates for each component measure to get component measure-level ex post savings. These estimates were summed to produce ex post savings values at the QM measure group level.
The overall realization rate for the QM measure group was 132% primarily due to high realization rates for coil cleaning, economizer repair, and supply fan control measures, as well as a higher than expected frequency of repair for coil cleaning, economizer repair, and thermostat reprogramming.
The implementation and evaluation of QM and related HVAC tune-up measures have evolved over the last decade. The changes to programs, measures, and the evaluation of impacts present challenges to assessing and tracking performance. Overall the achieved savings were lower than expected based on the workpapers and ex ante dispositions, but in the context of past measure performance, there are some clear improvements, particularly for economizers.
In this evaluation, planned precision was sacrificed for more robust fieldwork at a smaller number of sites to collect the information needed to use for laboratory performance data and to determine the proportion of measures installed and functional. This evaluation was able to develop savings estimates by using repeatable field measurements that correlate to laboratory performance data for coil cleaning and RCA measures. It also provided an evaluation methodology that accounted for variability across building types and climate zones through modeling, thus measuring parameters on-site with less variability than HVAC end-use, which made data collection efforts more cost-effective. Going forward, this approach can be scaled to add sample points and implementer data can be used to support more accurate savings estimates.
This evaluation did not complete an assessment of program designs or processes, and thus our recommendation focus on improvements related to establishing savings through specific implementer data collection or evaluation facilitation. We also have additional recommendations for ongoing evaluation activities.
Implementers collect data on the installed measures, but these data are not part of the standardized savings claims database submitted to the CPUC by the IOUs. The link between the tracking data claims and the implementer data is not well established. We found it difficult to use the large volume of data collected by the programs, which have great value in truing up initial workpaper assumptions, with site- and unit-specific
1.4 Conclusions and recommendations
DNV GL – www.dnvgl.com 4/1/16 Page 8

data without this link. This may have contributed to some low realization rates, as the IOUs claimed savings that were either ineligible or not actually fully implemented.
Key findings for each measure from the records review include the following:
• Coil cleaning: We recommend encouraging the implementer to collect discharge pressure and outdoor temperature before and after they clean the coil. This could be conducted on a sample basis as well after initial ride-along visits with evaluation technicians. This would build the sample for detailed savings estimates while also allowing for quantification of unit baseline and savings across many more scenarios.
• RCA: A critical piece of information was the amount of charge added or removed from the units by the program for sampled units with savings claims. Each IOU stored this critical piece of information in a variety of ways and it required multiple data requests to obtain this information. We recommend developing a standardized approach for tracking the amount of refrigerant charge added or removed from the HVAC units when the program claims the RCA measure.
• Economizer repair: We found many economizers categorized as “repaired” through the programs that did not operate. Requiring the implementers to submit a photograph of the economizer open and closed for each claimed economizer would necessitate the implementer putting the economizer through its paces after installing the measure and increase the number of economizers left in working order. Additionally, requiring the implementer to record the changeover set point data would allow future evaluators to validate the assumptions in the models used to develop ex ante savings.
• Thermostat adjustment: We recommend encouraging implementers to do a better job recording the thermostat set point temperatures before and after adjustment since this would allow future implementers to modify the ex ante savings assumptions if they are inaccurate.
• Supply fan control: We recommend investigating baseline fan state by either requiring more implementer data and/or performing a baseline study.
There are remaining and new evaluation challenges to overcome. Additional improvements for future evaluations objectives may include:
• Collect more true-baseline data for coil cleaning measures by visiting sites that are entering the program for the first time. Collect additional coil cleaning laboratory data for systems under a variety of HVAC system fault conditions and combinations of conditions, i.e. low airflow, dirty condenser coil, low refrigerant charge, etc.
• Collect more RCA data, particularly from the PG&E AirCare Plus program in the 10% of HVAC units that received charge adjustments with levels of charge added or removed recorded in the implementer data set. We assumed the coefficient of variation was 1.0 in selecting our sample size, but it was actually much higher given the variables that drive savings (e.g., metering device and number of compressors). The larger than anticipated variability means we need a larger sample.
• Collect additional data on why economizers are not functioning. Collect more information to characterize failure modes should lead to more focused repairs in the future. Collect economizer airflow data to further quantify outside airflow rates.
• Collect more thermostat and supply fan control data. We assumed the coefficient of variation was 1.0 in selecting the sample, but it was actually 1.5. We need a larger sample to attain better precision on the ex post savings estimates.
DNV GL – www.dnvgl.com 4/1/16 Page 9
2 INTRODUCTION This report presents DNV GL’s impact evaluation of commercial quality maintenance (QM) and related heating, ventilation, and air conditioning (HVAC) tune-up programs that are part of the California Public Utilities Commission (CPUC) 2013-14 HVAC Research Roadmap. The primary results of this evaluation are adjustments to key technical assumptions that affect the calculation of energy savings. These adjustments, when run through standard engineering models, result in estimates of ex post gross energy impacts (in kWh, kW, and therms) achieved by the 2013-14 HVAC QM programs offered by three California investor-owned electric utilities (IOUs): San Diego Gas and Electric Company (SDG&E), Southern California Edison (SCE), and Pacific Gas and Electric Company (PG&E).
The CPUC-approved evaluation scope of work includes gross and net impacts analyses of high-impact measures groups delivered through commercial HVAC programs. However, since the net impact analysis is not complete at this time, this report does not provide estimated net-to-gross (NTG) ratios for the programs. Results of the net impact analysis will be published later in 2016 as an add-on report. The high-impact measure groups evaluated were chosen from the core offerings of the CPUC commercial QM (statewide) and tune-up (local) HVAC programs. PG&E, SCE, and SDG&E implement commercial and residential HVAC maintenance activities through a variety of different administrative channels and program structures. After an initial data review, only commercial measures were included in the study since residential programs contributed less than five percent of the overall ex ante savings to be evaluated.
“Quality maintenance” in general refers to multiple HVAC energy efficiency improvement measures and specific procedures for their implementation based on ANSI/ASHRAE/ACCA Standard 180, Standard Practice for Inspection and Maintenance of Commercial Building HVAC Systems. In the 2013-14 QM program cycle, PG&E phased out reporting an overarching QM measure in the tracking system and phased in individual measures such as “coil cleaning” and “supply fan control” for its Commercial QM HVAC program. SDG&E discontinued its Commercial QM program all together, and SCE retained its QM program status quo from the previous cycle, though it’s volume was considerably lower than any of the other QM or HVAC tune-up programs.
Therefore, for this evaluation, instead of focusing on the broad QM measure in the tracking data that actually represents multiple measures, we disaggregated it into five more discrete HVAC maintenance measure groups: condenser coil cleaning, refrigerant charge adjustment (RCA), economizer, thermostat, and supply fan control. We then examined those discrete measure groups across programs. Furthermore, the evaluation addresses only high-impact measures such as cleaning condenser and evaporator coils, which provided one-third of the ex ante savings included in this impact evaluation. The five measure groups that are evaluated are described in greater detail in Section 2.2.
Gross program impacts were analyzed using information collected from the following seven research activities:
• Review of CPUC workpapers to document the key parameters and assumptions used to estimate ex ante savings; this included a review of the CPUC Energy Division (ED) disposition of 2013-14 workpapers regarding ex-ante savings estimates
• Review of participation records from the IOUs that includes information recorded by implementation technicians
DNV GL – www.dnvgl.com 4/1/16 Page 10

• Testing the proposed field measurement and verification (M&V) plan by completing a series of pilot tests before executing the full data collection plan and then using the results of the pilot to finalize a field M&V plan for all remaining data collection activities
• Implementation ride-along data collection to evaluate the primary objective of gross load impacts and secondary objectives 1, 3, 4, and 5 described next in Section 2.1
• Post-maintenance site visits sampled from the tracking database and visited after the program cycle is complete. Post-maintenance data were used to evaluate the primary objective of gross load impacts and secondary objectives 1, 3, and 4 described in Section 2.1
• Laboratory testing under the 2013-14 HVAC Laboratory Testing (HVAC5)4 work order to estimate some parameters needed to relate indirect field measurements to the parameters needed in the analysis; data were used to evaluate the primary objective of gross load impacts and secondary objectives 1, 3, and 4 described in Section 2.1
• Estimation of load impacts using engineering analysis and/or simulation modelling • Net impacts will be determined by estimating NTG ratios, and will be reported mid-2016 as an update to
this report. In this report, the program NTG ratios are unchanged from the ex ante tracking data.
The primary objective of this evaluation is to develop the necessary adjustments to key technical parameters leading to the determination of the ex post gross and net impacts for kWh, kW, and therms achieved by the selected five high-impact measures in 2013-14 commercial HVAC QM programs offered by SDG&E, SCE, and PG&E.
The secondary objectives of this impact evaluation are to:
1. Determine reasons for deviations from ex ante savings 2. Estimate participant free-ridership and spillover to support the development of net-to-gross (NTG) ratios
and net savings values 3. Provide results and data that will assist with updating ex ante workpapers and the California Database
for Energy Efficiency Resources (DEER) values 4. Provide timely feedback to the CPUC, IOUs, and other stakeholders on the evaluation research study in
order to facilitate timely program improvements and support future program design efforts and ex ante impact estimates
5. Conduct field observations and measurements of commercial HVAC maintenance faults to provide guidance for the laboratory research study
Robert Mowris & Associates, Inc. (RMA) and two independent subcontractors helped DNV GL achieve these objectives by reviewing program data and collecting new primary data that support defensible ex post savings estimates.
4 Laboratory HVAC Testing Research Plan, prepared for the CPUC by KEMA, Inc., Nov. 17, 2014 (HVAC5 research plan and results).
2.1 Objectives
DNV GL – www.dnvgl.com 4/1/16 Page 11

DNV GL selected five high-impact HVAC measure groups for evaluation under the IOU QM programs. Each of the five groups includes several specific measures related to a particular concept. For example, coil cleaning would include evaporator coil cleaning as well as condenser coil cleaning. High-impact measures are those that provided the greatest program savings. They are not necessarily the measure groups with the highest savings per unit installed; some measures within measure groups are installed much more frequently than others.
Measure group descriptions 2.2.1The measure groups’ processes and locations in a schematic rooftop unit (RTU) are shown next.
2.2.1.1 Coil cleaning This includes condenser or evaporator coil cleaning in the blue and brown areas shown in the HVAC RTU in Figure 4. The coil cleaning process involves spraying the coil with either water or chemical solution to remove the built up grime that accumulates on the coil. Local conditions determine the rate at which particulates deposit on the coil, accumulating faster in areas with a lot of dust or kitchen grease near the HVAC unit.
Coil cleaning saves energy by decreasing static pressure and increasing airflow and heat transfer rate across the condenser or evaporator coil. The heat transfer rate is determined by the mass flow rate of air and the coil’s thermal resistance from air (either conditioned air of outside air) to the refrigerant. Dirt and debris build-up on the coil increases the thermal resistance across the coil, and reduces airflow thus reducing heat transfer rates. This increases the refrigerant pressure differential across the compressor, increasing compressor work/power. To evaluate condenser coil cleaning, compressor suction and discharge pressure and outdoor dry-bulb temperature were measured before and after cleaning.
Figure 4. Coil cleaning in RTU
2.2.1.2 Refrigerant charge adjustment The RCA measure seeks to improve air conditioning unit performance by adding or removing refrigerant charge from air conditioning refrigeration circuits. An improved refrigerant charge level is assumed to
2.2 Evaluated measure groups
DNV GL – www.dnvgl.com 4/1/16 Page 12

produce energy savings compared to both an under or over charged system. The QM programs use system diagnostic tests and adjust charge amounts to achieve fault detection diagnostic targets. The previous program cycle evaluation showed that diagnostic procedure results are inconsistent. This evaluation used the weigh-out method, using factory charge as the metric for optimum refrigerant charge. For the evaluation sample points, the system refrigerant charge was vacuum-pumped out and weighed to assess the current state after program adjustment. Program records were used to estimate how much charge the program added or removed. The two allows us to assess the pre- and post-service state of charge of the system.
Laboratory tests show that even in non-ideal system configurations, such as low system airflow, HVAC system efficiency is maximized at or near the factory refrigerant charge. In Figure 5, the compressor is represented as a black cylinder with refrigerant lines represented in yellow and line insulation in blue. The weigh-out procedure involves pumping the refrigerant out of the system and weighing it on a scale. The weight of refrigerant is compared with factory charge to determine if it is over or undercharged.
Figure 5. RCA in RTU
2.2.1.3 Economizer repair This measure includes economizer repairs and may include an economizer controller replacement with an advanced digital economizer controller. The measure saves energy by increasing the use of outside air for cooling (during cooler periods) and decreasing the compressor run-time. Energy savings are dependent on the volume of outdoor air entering the supply air stream at different economizer positions. This includes repair or replacement of the economizer or controls, located in left side of Figure 6.
DNV GL – www.dnvgl.com 4/1/16 Page 13
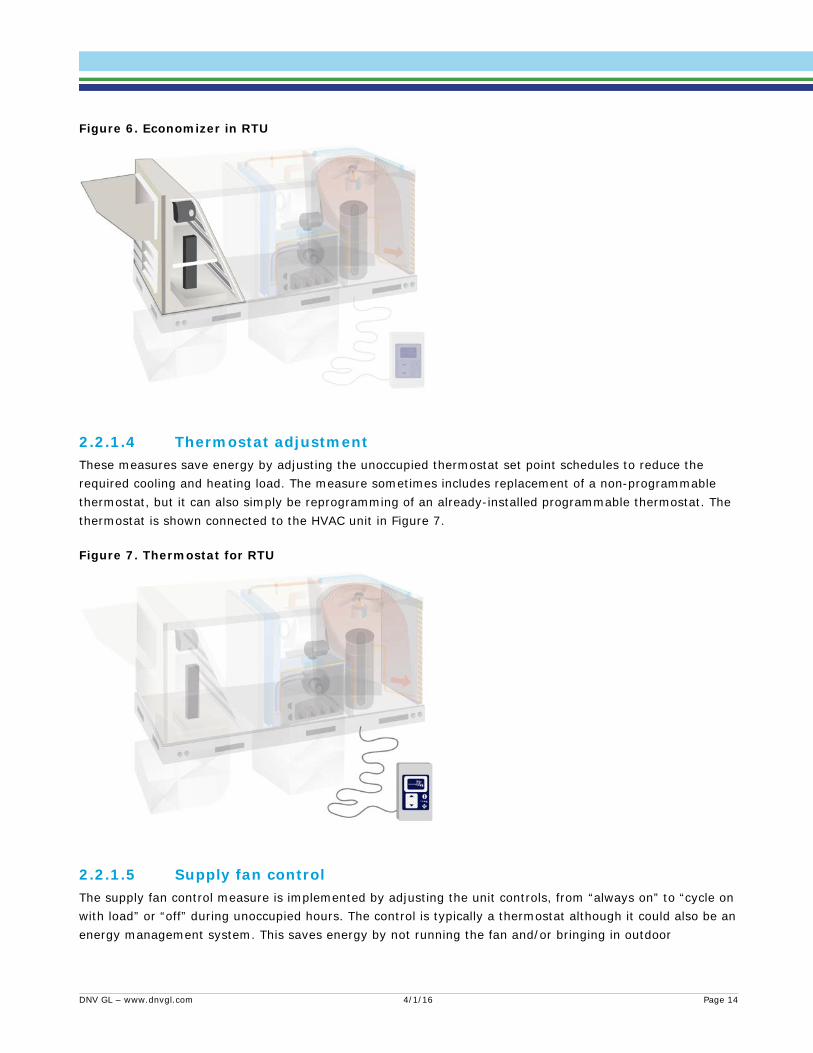
Figure 6. Economizer in RTU
2.2.1.4 Thermostat adjustment These measures save energy by adjusting the unoccupied thermostat set point schedules to reduce the required cooling and heating load. The measure sometimes includes replacement of a non-programmable thermostat, but it can also simply be reprogramming of an already-installed programmable thermostat. The thermostat is shown connected to the HVAC unit in Figure 7.
Figure 7. Thermostat for RTU
2.2.1.5 Supply fan control The supply fan control measure is implemented by adjusting the unit controls, from “always on” to “cycle on with load” or “off” during unoccupied hours. The control is typically a thermostat although it could also be an energy management system. This saves energy by not running the fan and/or bringing in outdoor
DNV GL – www.dnvgl.com 4/1/16 Page 14

ventilation air to the building when then are no occupants. Figure 8 illustrates the supply fan and associated thermostat control system.
Figure 8. Supply fan and thermostat in RTU
Claimed gross savings 2.2.2Though the QM and related tune-up programs are similar with many overlapping measures, they also have measures distinct to a particular program. To decide where to focus evaluation efforts, we identified the measures with the greatest claimed (ex ante) savings from each measure across IOU commercial QM and tune-up programs (Table 2). The first five rows highlighted in yellow show measures with the greatest savings that were chosen for this evaluation. The SCE QM measure, which falls under the maintenance measure group in the table, was also evaluated because it comprises the first five evaluated measures. Measures were evaluated across all programs and IOUs and the average results were applied to claimed measures across all programs and IOUs.
DNV GL – www.dnvgl.com 4/1/16 Page 15
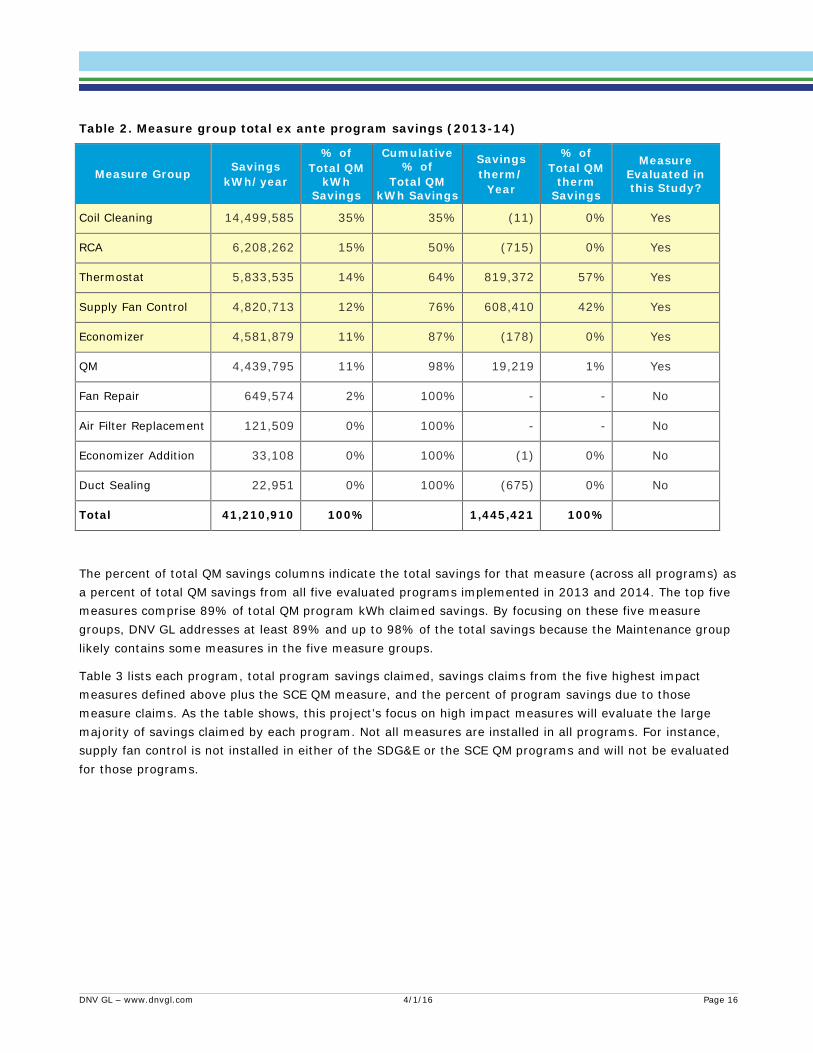
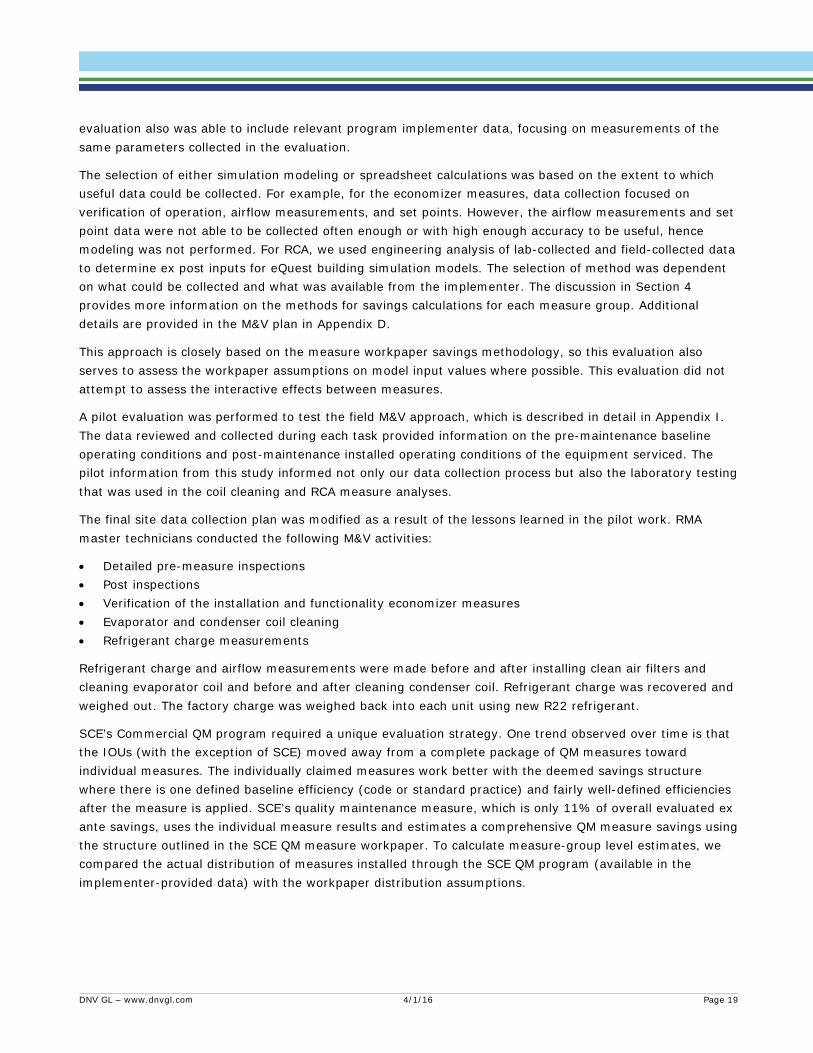
Table 2. Measure group total ex ante program savings (2013-14)
Measure Group Savings kWh/year
% of Total QM
kWh Savings
Cumulative % of
Total QM kWh Savings
Savings therm/
Year
% of Total QM
therm Savings
Measure Evaluated in this Study?
Coil Cleaning 14,499,585 35% 35% (11) 0% Yes
RCA 6,208,262 15% 50% (715) 0% Yes
Thermostat 5,833,535 14% 64% 819,372 57% Yes
Supply Fan Control 4,820,713 12% 76% 608,410 42% Yes
Economizer 4,581,879 11% 87% (178) 0% Yes
QM 4,439,795 11% 98% 19,219 1% Yes
Fan Repair 649,574 2% 100% - - No
Air Filter Replacement 121,509 0% 100% - - No
Economizer Addition 33,108 0% 100% (1) 0% No
Duct Sealing 22,951 0% 100% (675) 0% No
Total 41,210,910 100% 1,445,421 100%
The percent of total QM savings columns indicate the total savings for that measure (across all programs) as a percent of total QM savings from all five evaluated programs implemented in 2013 and 2014. The top five measures comprise 89% of total QM program kWh claimed savings. By focusing on these five measure groups, DNV GL addresses at least 89% and up to 98% of the total savings because the Maintenance group likely contains some measures in the five measure groups.
Table 3 lists each program, total program savings claimed, savings claims from the five highest impact measures defined above plus the SCE QM measure, and the percent of program savings due to those measure claims. As the table shows, this project’s focus on high impact measures will evaluate the large majority of savings claimed by each program. Not all measures are installed in all programs. For instance, supply fan control is not installed in either of the SDG&E or the SCE QM programs and will not be evaluated for those programs.
DNV GL – www.dnvgl.com 4/1/16 Page 16

Table 3. Evaluated high-impact measures and savings by commercial program (2013-14)
Program High-Impact Measures
Program kWh Savings
High-Impact kWh Savings
High-Impact
kWh % of Total
Program SDG&E Deemed Incentives–Commercial HVAC
Coil Cleaning, RCA5 11,915,736 11,882,092 100%
SDG&E Commercial Direct Install Coil Cleaning, RCA6 7,578,677 6,906,688 91%
PG&E Commercial QM RCA, Economizer, Supply Fan Control, Thermostat 14,519,271 11,049,730 76%
PG&E AirCare Plus RCA, Economizer, Thermostat7 6,453,392 6,349,737 98%
SCE Commercial QM QM, Economizer 3,656,361 3,143,757 86%
A description of evaluated QM programs, 2013-14 program activity, and their claimed savings are provided in 0.
This evaluation builds on previous research on QM concepts and programs including the 2010-12 evaluation and 2013-14 laboratory research.
Evaluating deemed savings for QM measures is challenging. A commercial QM “package” is much more like custom retrofit than a deemed measure because each HVAC unit varies in operational efficiency when entering a program, and also upon exiting. For example, a new unit entering in a program may have never had its condenser coils cleaned, but an older unit entering a program would likely have had them cleaned at least once. Upon exiting the program, the period since the last cleaning will also vary among units.
However, unlike custom retrofit programs, each unit in QM and tune-up programs provides small kWh savings, and thousands of units currently participate. Further, the variation in savings across units is great. The traditional evaluation approach would be to draw a sample based on the tracking data and perform energy monitoring to develop savings. Given the large number of units and the variation in savings, a large number of sample points would be needed to meet acceptable precision targets. Because the cost per sample point is high, the traditional approach could be cost prohibitive.
Other notable research challenges in QM measures were discovered in our final impact evaluation of 2010-12 QM programs under Work Order 32 (WO32).8 Key issues included:
5 Economizer is also a measure in SDG&E’s Deemed program, but at 0.4% of program savings, it is not a high impact measure and will not be focused on. It will be included in the sample to the extent that it is present in the measure population.
6 Economizer and thermostat are also measures in SDG&E’s Direct Install program, but at 0.1% and 3% of program savings they are not high impact measures and won’t be focused on. They will be included in the sample to the extent that they are present in the measure population.
7 Coil cleaning and supply fan control are also measures in AirCare Plus, but at 1% and 7% of program savings they are not high impact measures for this program and will not be focused on. They will be included in the sample to the extent that they are present in the measure population.
2.3 Research issues
DNV GL – www.dnvgl.com 4/1/16 Page 17

• Long-term, time-series measurements of system efficiency were problematic given the variations in outdoor air quantities with economizer operation that are difficult to measure in real time. Incomplete mixing of outdoor and return air requires proper instruments and procedures to obtain accurate measurements of mixed-air temperatures and hence outdoor air fractions.
• Pre-program sampling and long-term system monitoring were very difficult to achieve because only service providers know which sites and units receive maintenance within a given program cycle. Furthermore, it is unknown which measures will be applied to the pre-maintenance unit when monitoring equipment was installed. These issues led to a lower-than-anticipated sample size and some sampling bias.
• Insufficiently long monitoring periods or periods without significant air conditioner operation can cause high levels of uncertainty when projected to represent annual energy consumption.
• Pre/post monitoring of individual HVAC units did not distinguish measure-level savings for each unit due to the completion of multiple measures during the same implementation visit.
• It was challenging to re-create baseline for testing because of poor documentation of HVAC systems pre-maintenance for some programs. Programs without adequate documentation for an M&V evaluation were at risk and subject to true-up based on available data from other programs and IOUs.
The WO32 evaluation measured total energy savings for a sampled unit, and then developed average QM measure savings, but the average savings were found to be far off from program ex ante savings claims. The variation in HVAC unit energy consumption was high because the wide range of weather, building type, and climate all affected the results. The coefficient of variation found among HVAC measure savings was so large that the traditional M&V approach of sampling program-treated HVAC units required an infeasible sample size.
To remedy the large variation in HVAC unit energy consumption and associated program-induced savings, this evaluation used field component testing and verification to estimate energy savings for individual measures rather than savings for the entire HVAC unit. Thus, we collected data on observed operational parameters and conditions such as the amount of refrigerant, pressures, temperatures, set points, and other parameters that go into savings calculations. This allowed us to use either an engineering model, a prototypical building simulation model, or a combination of the two to generate total savings. This disaggregated approach avoided the need for a very large sample across multiple climate zones and building types, which would have been much more costly. Instead of measuring overall energy consumed by an HVAC unit, which has large variation across the program population, we measured parameters that can characterize how the units operate with a smaller sample because they have less variation across the program population.
For example, if an economizer is not operational, the unit energy consumption will be increased, but how much will depend on the building and location of the unit. Once the average frequency of failed economizers is known, this effect can be modeled across the population of units taking into account building type and climate zone, which avoids sampling for failed economizers in every climate zone and building type. This
8 DNV GL, HVAC Impact Evaluation FINAL Report WO32 HVAC – Volume 1: Report, Jan. 28, 2015. http://www.calmac.org/publications/FINAL_HVAC_Impact_Evaluation_WO32_Report_28Jan2015_Volume1_ReportES.pdf
2.4 Field M&V approach
DNV GL – www.dnvgl.com 4/1/16 Page 18
evaluation also was able to include relevant program implementer data, focusing on measurements of the same parameters collected in the evaluation.
The selection of either simulation modeling or spreadsheet calculations was based on the extent to which useful data could be collected. For example, for the economizer measures, data collection focused on verification of operation, airflow measurements, and set points. However, the airflow measurements and set point data were not able to be collected often enough or with high enough accuracy to be useful, hence modeling was not performed. For RCA, we used engineering analysis of lab-collected and field-collected data to determine ex post inputs for eQuest building simulation models. The selection of method was dependent on what could be collected and what was available from the implementer. The discussion in Section 4 provides more information on the methods for savings calculations for each measure group. Additional details are provided in the M&V plan in Appendix D.
This approach is closely based on the measure workpaper savings methodology, so this evaluation also serves to assess the workpaper assumptions on model input values where possible. This evaluation did not attempt to assess the interactive effects between measures.
A pilot evaluation was performed to test the field M&V approach, which is described in detail in Appendix I. The data reviewed and collected during each task provided information on the pre-maintenance baseline operating conditions and post-maintenance installed operating conditions of the equipment serviced. The pilot information from this study informed not only our data collection process but also the laboratory testing that was used in the coil cleaning and RCA measure analyses.
The final site data collection plan was modified as a result of the lessons learned in the pilot work. RMA master technicians conducted the following M&V activities:
• Detailed pre-measure inspections • Post inspections • Verification of the installation and functionality economizer measures • Evaporator and condenser coil cleaning • Refrigerant charge measurements
Refrigerant charge and airflow measurements were made before and after installing clean air filters and cleaning evaporator coil and before and after cleaning condenser coil. Refrigerant charge was recovered and weighed out. The factory charge was weighed back into each unit using new R22 refrigerant.
SCE’s Commercial QM program required a unique evaluation strategy. One trend observed over time is that the IOUs (with the exception of SCE) moved away from a complete package of QM measures toward individual measures. The individually claimed measures work better with the deemed savings structure where there is one defined baseline efficiency (code or standard practice) and fairly well-defined efficiencies after the measure is applied. SCE’s quality maintenance measure, which is only 11% of overall evaluated ex ante savings, uses the individual measure results and estimates a comprehensive QM measure savings using the structure outlined in the SCE QM measure workpaper. To calculate measure-group level estimates, we compared the actual distribution of measures installed through the SCE QM program (available in the implementer-provided data) with the workpaper distribution assumptions.
DNV GL – www.dnvgl.com 4/1/16 Page 19
3 COMPLETED EVALUATION ACTIVITIES This section presents the results of completed evaluation activities.
DNV GL reviewed detailed implementer data received from each IOU. The results of this review are discussed in the sections addressing each measure group (Section 4).
In general, some programs’ data included more detail than others,9 there was variation in completeness, and some data fields were populated for one program but not another. Consequently, we based this evaluation on the programs with data and applied to programs without data. The records we received documented the weight of refrigerant added or removed during refrigerant charge adjustment for all programs and the pre- and post-retrofit conditions observed by the programs for thermostat and fan control measures. Condenser and evaporator coil cleaning data was non-existent for the QM programs, but cleaning data were available for the tune up programs. One major problem with all the data received was that we were unable to link it to the tracking data since there was no key field. It is extremely important for future evaluations that this data be linked to tracking data.
Key findings for each measure from the records review include the following:
• Coil cleaning: Only three implementers (those for PG&E AirCare Plus and SDG&E’s Deemed and Direct Install) provided the date of evaporator and condenser coil cleaning in their implementer tracking data. Implementers provided no other coil cleaning data.
• RCA: Implementer data from three of the programs contained the well-populated fields for the refrigerant charge parameters we needed for analysis, namely, the weight of charge added or removed by the implementer through the program. The SDG&E Direct Install program implementer data contained no RCA data at all, and PG&E’s AirCare Plus program data was inconsistent with the ex ante tracking data. The PG&E AirCare Plus implementer data showed the majority of units had no refrigerant adjustment and were test only. Yet, ex ante savings were claimed for adjusting charge on these units. It is not clear which is wrong. We are assuming the implementer data is correct and no savings accrue from these sites. Implementer data should provide detailed records of charge adjustment and in this case we did not find such records. The number of ex ante charge adjustment claims in the tracking data is 5,671. Implementer data shows 5,879 instances of refrigerant charge testing, and only 148 of these showed refrigerant charge adjustments. All other cases were designated as “test only” in the implementer data.
• Economizer: The economizer information was inconsistently populated across the programs, and was not useful to the measure evaluation. In particular, the pre-implementation and post-implementation changeover set point data was unpopulated and could not be used to validate the assumptions in the models used to develop ex ante savings.
• Thermostat: Only the PG&E Commercial QM and SDG&E Direct Install program implementers recorded pre and post-implementation thermostat set point temperatures. For these two programs, the heating and cooling set points were recorded for occupied and unoccupied building periods. Recording these set
9 A catalog of the information available in implementer files is provided in Appendix D (Table 3-1 in Attachment A of the M&V Plan). The most relevant data are highlighted yellow in the table.
3.1 Participation records review
DNV GL – www.dnvgl.com 4/1/16 Page 20

points allows for verification of the workpaper set point assumptions, and would be useful if they were recorded across all programs.
• Fan control: Two programs had extensive fan control data—SCE QM and PG&E Commercial QM. In both programs, the implementer recorded the fan setting during unoccupied building periods when they initially arrived on site. However, the fan setting was very different between the programs, with 78% of fans on during unoccupied periods in buildings in the SCE QM program while only 13% of fans were on in the PG&E Commercial QM program. It is unclear whether there is a real difference between the types of buildings participating in the two programs, or that some of the implementer-collected data is erroneous.
The following is a brief description of the sample design approach for the ex post sites visits. A detailed sample design description is provided in Appendix G.
Ride-along visit sites were not chosen from the tracking data, but instead by contacting program implementers. We planned that DNV GL field staff would accompany the implementer on their first visit to the site at the ride-along visits. Sites were chosen by coordination with implementation contractors performing site visits involving coil cleaning, which is described in detail in section 3.3.1.
IOUs provided the data to the CPUC in the Standard Program Tracking data format for QM and tune-up programs. The file had 96,803 measures with savings tracked for the 2013-14 QM program cycle. As one site could have many records of the same measures due to multiple HVAC units at the same site, and multiple measures installed at each unit, sampling by each record or measure would result in too many locations to choose from. Therefore, we aggregated measure counts into a measure group by program implementer and program name. This aggregation resulted in 23,258 combinations of site, program implementer, program name, and measure group in our sampling frame.
We completed 45 of our sampling goal of 55 ex post sites from five major programs: PG&E’s Commercial HVAC QM, PG&E AirCare Plus, SCE’s Commercial HVAC, and SDG&E’s Deemed Incentive and Direct Install programs. We sampled only on RCA, economizer, and QM measures, though expected to have representation of thermostat and fan control measures with those groups.
The sampling methodology employed a stratified estimation model that first places participants into segments of interest (IOU) and then into strata by size, measured in kWh savings. Samples were then selected based on the segment of interest or control variables like program implementer, program name, and measure group, various kWh strata within the combination of control variables.
Based on our model and our data, our optimized sample design is shown in Table 4.
3.2 Sample design
DNV GL – www.dnvgl.com 4/1/16 Page 21

Table 4. Final optimized sample design
IOU Program Name Measure Group Target Sample
PG&E AirCare Plus Economizer 7
PG&E AirCare Plus RCA 8
PG&E QM Economizer 9
PG&E QM RCA 6
SCE QM QM with Economizer 13
SCE QM QM 2
SDG&E Commercial Direct Install RCA 5
SDG&E Deemed Incentives–Commercial HVAC RCA 5
Total 55
After drawing the sample, we verified if it was indeed distributed across characteristics of interest such as building type, climate zone, and installation contractor to make sure that it represented the population across these indices. (Each program implementer coordinates multiple installation contractors that participate in the program.) A backup sample was drawn similarly according to the priority assigned by the sample design model for instances when a primary sample site could not be completed.
The recruiting process resulted in a total 45 completed site visits consisting of 35 primary sites and 10 backup sample sites. Table 5 shows the number of sites planned and achieved for each measure. It also shows the planned and achieved precision for the individual measure characteristics collected on site visits and used in the measure level analyses. We collected data on multiple HVAC units within one site. Rather than treat the data from each unit as an independent sample point, we used the cluster sampling formula to calculate the standard error and resulting coefficient of variation.
𝑠𝑠𝑠𝑠(𝑦𝑦�) = �∑ (y𝑖𝑖 − y�m𝑖𝑖)2𝑛𝑛𝑖𝑖=1
𝑛𝑛(𝑛𝑛 − 1)𝑚𝑚�2
Where:
𝑛𝑛 = 𝑛𝑛𝑛𝑛𝑚𝑚𝑛𝑛𝑠𝑠𝑛𝑛 𝑜𝑜𝑜𝑜 𝑠𝑠𝑠𝑠𝑚𝑚𝑠𝑠𝑠𝑠𝑠𝑠𝑠𝑠 𝑐𝑐𝑠𝑠𝑛𝑛𝑠𝑠𝑐𝑐𝑠𝑠𝑛𝑛𝑠𝑠𝑚𝑚 = 𝑛𝑛𝑛𝑛𝑚𝑚𝑛𝑛𝑠𝑠𝑛𝑛 𝑠𝑠𝑠𝑠𝑛𝑛 𝑐𝑐𝑠𝑠𝑛𝑛𝑠𝑠𝑐𝑐𝑠𝑠𝑛𝑛𝑦𝑦 = 𝑣𝑣𝑠𝑠𝑛𝑛𝑣𝑣𝑠𝑠𝑛𝑛𝑠𝑠𝑠𝑠 𝑜𝑜𝑜𝑜 𝑣𝑣𝑛𝑛𝑐𝑐𝑠𝑠𝑛𝑛𝑠𝑠𝑠𝑠𝑐𝑐
DNV GL – www.dnvgl.com 4/1/16 Page 22

For most of the measures, we came close to meeting or surpassed the sample target, but did not achieve the planned precision. This is because of the large differences between the estimated variation of the parameter within the population and the actual variation within the measured parameter. The estimated coefficient of variation was 1.0 and the actual coefficients of variation are listed in the table.
Table 5. Data set size for measure parameters with corresponding sampling precision
Measure
Planned Model
Parameter Data Set Size
Planned Precision at
90% confidence
Achieved Model
Parameter Data Set Size
Achieved Precision at
90% confidence
Actual Coefficient of
Variation
Coil Cleaning 29 ± 31% 12 ± 32% 0.28
RCA 22 ± 35% 110 ± 47% 1.26
Economizer 21 ± 36% 24 ± 24% 0.72
Supply Fan Control 12 ± 47% 14 ± 70% 1.6
Thermostat 15 ± 42% 11 ± 72% 1.5 The precisions of supply fan control and thermostat measures were so poor that we passed through the ex ante savings rather than report unreliable
ex post savings.
The measurement and verification effort has two distinct data collection activities in this evaluation: Implementer ride-along visits of current program activity to evaluate the coil cleaning measures and traditional ex post site visits for a sample of the 2013-14 QM population to evaluate all other measures.
Implementation ride-along visits 3.3.1We planned to complete inspection of 45 HVAC units on ride-along visits with implementation technicians focusing on the coil cleaning measures. Due to logistical limitations, we successfully completed inspections of 28 units across five sites. Site inspections were focused in the southern California area because most of the coil cleaning was done in SDG&E territory. In fact, approximately 40% of total savings across all evaluated programs came from coil cleaning in SDG&E programs.
The plan was for ride-along visits to take place with sites that just entered the program in 2015 to capture the baseline of units entering the program for the coil cleaning measure group. We had also planned that we would observe implementer technicians cleaning the coils. However, due to a change in program operation and internal communication issues, sites visited were a mixture of those new to the program and those that had previously participated in the program, and we performed the cleaning ourselves. Thus, the data represent some units with coils that had been cleaned at least once within the past 18 months, rather than units that might have dirtier coils. This is discussed in greater detail in section 4.1.
During the ride-along visits, DNV GL first corrected the refrigerant charge and installed clean filters, then collected data on the change in compressor suction and discharge pressure as well as the static air pressure and airflow across the evaporator coil to assess the system changes before and after evaporator and condenser coil cleaning. We completed the ride-along visits during the cooling season to the degree possible, allowing us to record the change in refrigerant discharge pressure before and after cleaning when units operate in cooling mode. It was important that we corrected the refrigerant charge to manufacturer
3.3 Field testing
DNV GL – www.dnvgl.com 4/1/16 Page 23

recommended levels before performing the coil cleaning measurements so that the measurements would be comparable to our lab data that we used with field data in analysis of coil cleaning savings.
Table 6 shows the number of sites planned and completed. Findings from the ride-along visits are discussed in Section 4.1.
Table 6. Implementation ride-along sample by IOU
IOU Sample Target
Sample Complete % Complete
SDG&E 30 23 77%
PG&E 10 5 50%
SCE 5 0 0%
Total 45 28 62%
Post-performance site visits 3.3.2We visited 28 participant sites to collect data for evaluation of RCA, economizer, supply fan control, and programmable thermostat measures. The fundamental activities included:
• Using the weigh-out method to evaluate RCA, as described in Section 4.2.2 • Determining the economizer functionality, control sequence, and changeover set point • Recording of thermostat settings for supply fan control and thermostat reprogramming measures
Initially we had wanted to measure outside airflow and total system airflow but could not find an outside airflow method that provided results with a meaningful level of certainty. These are difficult measurements to make, and there is no method that provides enough certainty around the results to be useful. The visits occurred in the late fall and winter when building cooling was not required. This allowed for removal and weigh out of refrigerant without interrupting building conditioning. Findings from the site visits are described in Section 4. Table 7 shows the sites planned and completed.
Table 7. Post-performance site visit sample by IOU
IOU Sample Target
Sample Complete % Complete
SDG&E 10 10 100%
PG&E 30 21 70%
SCE 15 14 93%
Total 55 45 82%
DNV GL – www.dnvgl.com 4/1/16 Page 24

4 GROSS SAVINGS METHODS AND RESULTS In this section we describe each measure group’s evaluation separately in detail and then present program-specific results at the end. Detailed program-specific results tables are provided in Appendix A. Each measure-specific section begins with a review of the ex ante methodology, as developed in the IOU workpapers, followed by a description of the ex post methods. Ex post methods may include laboratory studies, program data review, field site visits, and calculations. The ex post savings results are presented in the final subsection of each measure group section.
The following measure groups are included in this report:
• Coil cleaning • RCA • Economizer • Thermostat • Supply Fan control
Figure 9 shows the location of the equipment served by each measure group in a basic rooftop package unit.
• Quality Maintenance
Figure 9. Schematic of a RTU and location of evaluated measure groups
Economizer
Thermostat
Supply Fan Control
Refrigerant Charge Adjustment
Coil Cleaning
DNV GL – www.dnvgl.com 4/1/16 Page 25

In this section we begin with a description of the work paper ex ante methodology, followed by a discussion of laboratory and ride-along data gathered, followed by a description of the ex post analysis methodology, and concludes with the analysis results.
Workpaper review: ex ante methodology 4.1.1The workpaper disposition released by CPUC Energy Division May 2, 2013 covered a comprehensive list of workpapers including all commercial HVAC maintenance measures. The workpapers covered in the disposition also included measures that are part of the suite of treatments in the QM programs. The notable affected workpapers are listed in Table 8:
Table 8. Relevant workpapers affected by QM Disposition
Service Description Related Workpapers
Condenser Coil Cleaning (statewide) SCE13HC037
Evaporator Coil Cleaning PGE3PHVC158
Condenser Coil Cleaning PGE3PHVC156
Coil Cleaning WPSDGENRHC1010 and WPSDGENRHC1020
QM workpapers that estimate RCA savings using DEER measures include a mix of non-charge related services, notably, coil cleaning. The disposition affected these non-charge related services by reducing the UES values to 25% of the DEER RCA UES values and distributing that reduction using the following allocation:
• Condenser coil cleaning – 50% of total (DEER RCA UES values * 0.125) • Evaporator coil cleaning – 25% of total (DEER RCA UES values * 0.0625) • Air flow adjustment – 25% of total (DEER RCA UES values * 0.0625)
We assessed the claimed savings from the coil cleaning measure group and measure names reported in the tracking data to determine how ex ante savings were generated. It appears that PG&E ex ante savings reported in the tracking data are in line with the disposition-defined savings; however, SDG&E ex ante savings are significantly different from the disposition savings for coil cleaning. It appears that SDG&E did not update their UES values for coil cleaning measures according to the disposition.
Ex post methodology 4.1.2Evaluation of the coil cleaning measure group focused on revising key input parameters for the DEER models used to estimate ex ante savings and re-running the simulations to produce ex post savings estimates. No research was conducted to update the baseline cooling energy and demand consumption estimated by the DEER prototype models. The evaluation calculated adjustment factors for condenser coil cleaning using 28 ride-along data points and laboratory research results (HVAC5) correlating the change in discharge pressure
4.1 Coil cleaning
DNV GL – www.dnvgl.com 4/1/16 Page 26
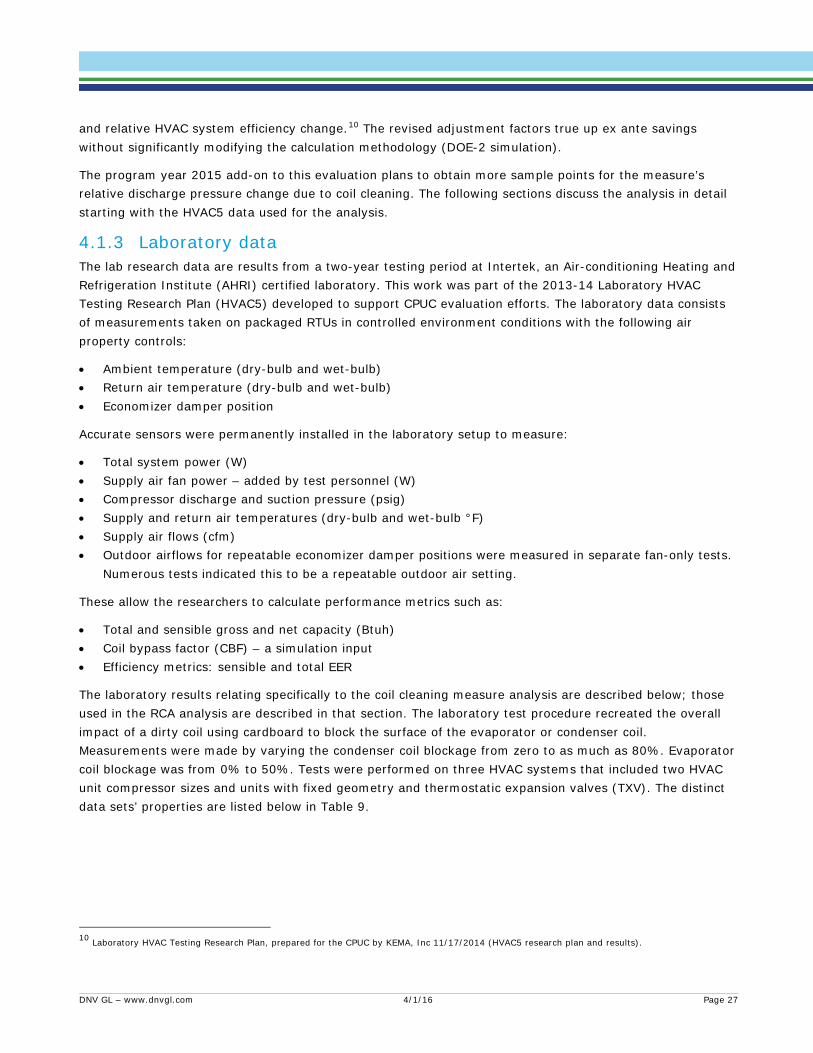
and relative HVAC system efficiency change.10 The revised adjustment factors true up ex ante savings without significantly modifying the calculation methodology (DOE-2 simulation).
The program year 2015 add-on to this evaluation plans to obtain more sample points for the measure’s relative discharge pressure change due to coil cleaning. The following sections discuss the analysis in detail starting with the HVAC5 data used for the analysis.
Laboratory data 4.1.3The lab research data are results from a two-year testing period at Intertek, an Air-conditioning Heating and Refrigeration Institute (AHRI) certified laboratory. This work was part of the 2013-14 Laboratory HVAC Testing Research Plan (HVAC5) developed to support CPUC evaluation efforts. The laboratory data consists of measurements taken on packaged RTUs in controlled environment conditions with the following air property controls:
• Ambient temperature (dry-bulb and wet-bulb) • Return air temperature (dry-bulb and wet-bulb) • Economizer damper position
Accurate sensors were permanently installed in the laboratory setup to measure:
• Total system power (W) • Supply air fan power – added by test personnel (W) • Compressor discharge and suction pressure (psig) • Supply and return air temperatures (dry-bulb and wet-bulb °F) • Supply air flows (cfm) • Outdoor airflows for repeatable economizer damper positions were measured in separate fan-only tests.
Numerous tests indicated this to be a repeatable outdoor air setting.
These allow the researchers to calculate performance metrics such as:
• Total and sensible gross and net capacity (Btuh) • Coil bypass factor (CBF) – a simulation input • Efficiency metrics: sensible and total EER
The laboratory results relating specifically to the coil cleaning measure analysis are described below; those used in the RCA analysis are described in that section. The laboratory test procedure recreated the overall impact of a dirty coil using cardboard to block the surface of the evaporator or condenser coil. Measurements were made by varying the condenser coil blockage from zero to as much as 80%. Evaporator coil blockage was from 0% to 50%. Tests were performed on three HVAC systems that included two HVAC unit compressor sizes and units with fixed geometry and thermostatic expansion valves (TXV). The distinct data sets’ properties are listed below in Table 9.
10 Laboratory HVAC Testing Research Plan, prepared for the CPUC by KEMA, Inc 11/17/2014 (HVAC5 research plan and results).
DNV GL – www.dnvgl.com 4/1/16 Page 27
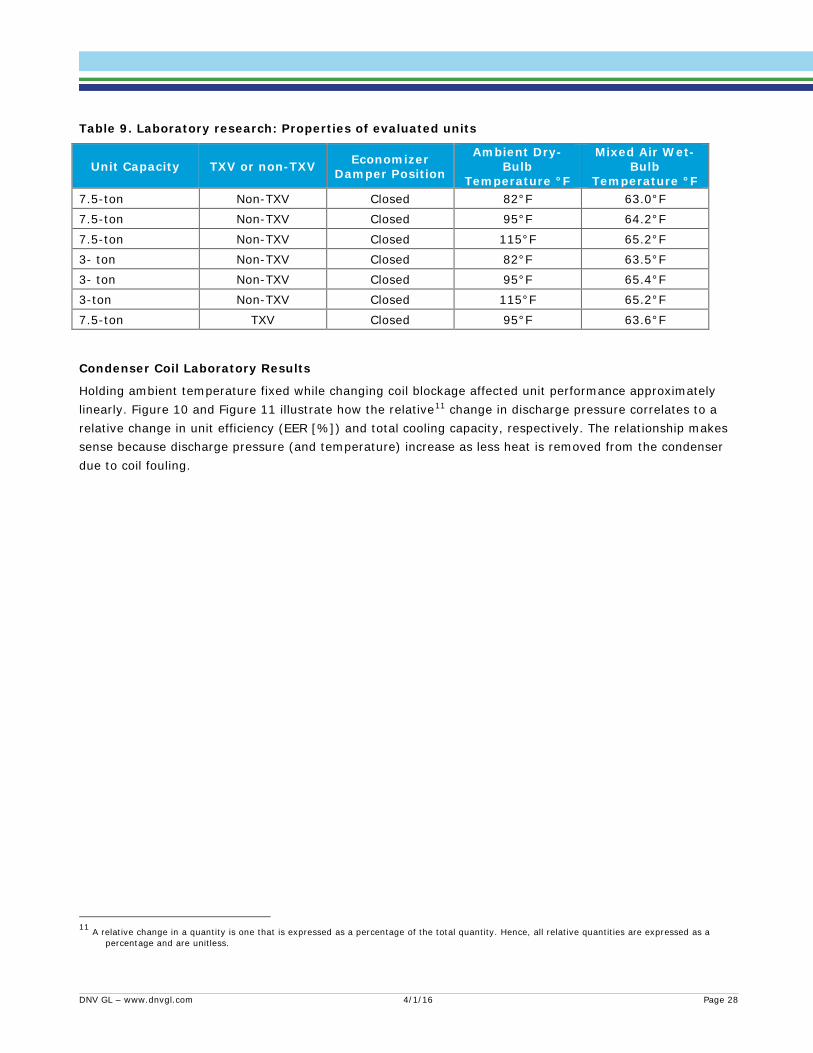
Table 9. Laboratory research: Properties of evaluated units
Unit Capacity TXV or non-TXV Economizer Damper Position
Ambient Dry-Bulb
Temperature °F
Mixed Air Wet-Bulb
Temperature °F 7.5-ton Non-TXV Closed 82°F 63.0°F 7.5-ton Non-TXV Closed 95°F 64.2°F
7.5-ton Non-TXV Closed 115°F 65.2°F 3- ton Non-TXV Closed 82°F 63.5°F 3- ton Non-TXV Closed 95°F 65.4°F 3-ton Non-TXV Closed 115°F 65.2°F
7.5-ton TXV Closed 95°F 63.6°F
Condenser Coil Laboratory Results
Holding ambient temperature fixed while changing coil blockage affected unit performance approximately linearly. Figure 10 and Figure 11 illustrate how the relative11 change in discharge pressure correlates to a relative change in unit efficiency (EER [%]) and total cooling capacity, respectively. The relationship makes sense because discharge pressure (and temperature) increase as less heat is removed from the condenser due to coil fouling.
11 A relative change in a quantity is one that is expressed as a percentage of the total quantity. Hence, all relative quantities are expressed as a percentage and are unitless.
DNV GL – www.dnvgl.com 4/1/16 Page 28
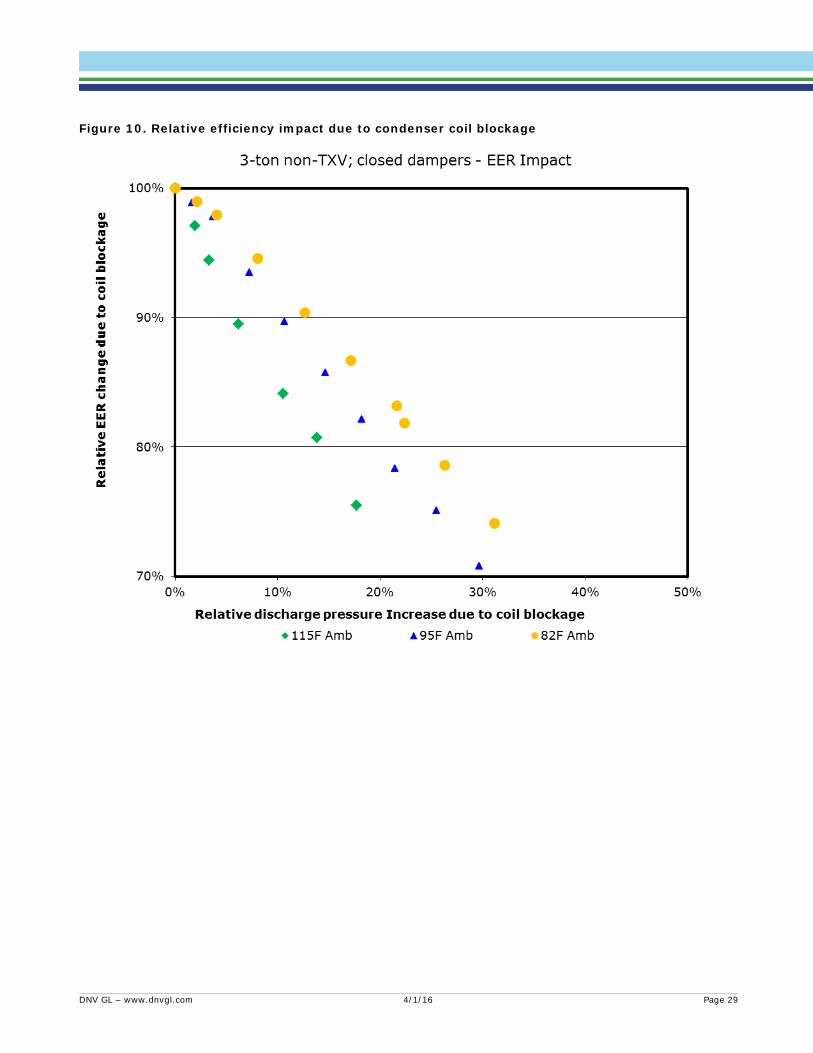
Figure 10. Relative efficiency impact due to condenser coil blockage
DNV GL – www.dnvgl.com 4/1/16 Page 29
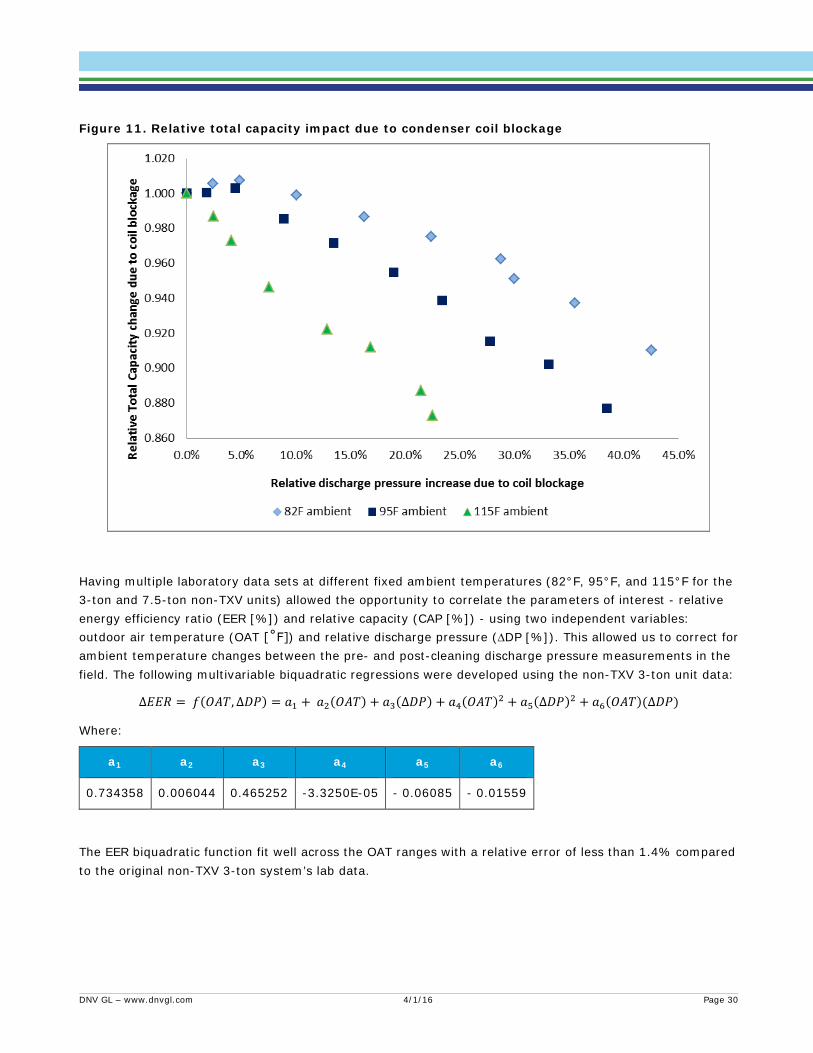
Figure 11. Relative total capacity impact due to condenser coil blockage
Having multiple laboratory data sets at different fixed ambient temperatures (82°F, 95°F, and 115°F for the 3-ton and 7.5-ton non-TXV units) allowed the opportunity to correlate the parameters of interest - relative energy efficiency ratio (EER [%]) and relative capacity (CAP [%]) - using two independent variables: outdoor air temperature (OAT [˚F]) and relative discharge pressure (∆DP [%]). This allowed us to correct for ambient temperature changes between the pre- and post-cleaning discharge pressure measurements in the field. The following multivariable biquadratic regressions were developed using the non-TXV 3-ton unit data:
∆𝐸𝐸𝐸𝐸𝐸𝐸 = 𝑜𝑜(𝑂𝑂𝑂𝑂𝑂𝑂,∆𝐷𝐷𝐷𝐷) = 𝑠𝑠1 + 𝑠𝑠2(𝑂𝑂𝑂𝑂𝑂𝑂) + 𝑠𝑠3(∆𝐷𝐷𝐷𝐷) + 𝑠𝑠4(𝑂𝑂𝑂𝑂𝑂𝑂)2 + 𝑠𝑠5(∆𝐷𝐷𝐷𝐷)2 + 𝑠𝑠6(𝑂𝑂𝑂𝑂𝑂𝑂)(∆𝐷𝐷𝐷𝐷)
Where:
a1 a2 a3 a4 a5 a6
0.734358 0.006044 0.465252 -3.3250E-05 - 0.06085 - 0.01559
The EER biquadratic function fit well across the OAT ranges with a relative error of less than 1.4% compared to the original non-TXV 3-ton system’s lab data.
DNV GL – www.dnvgl.com 4/1/16 Page 30
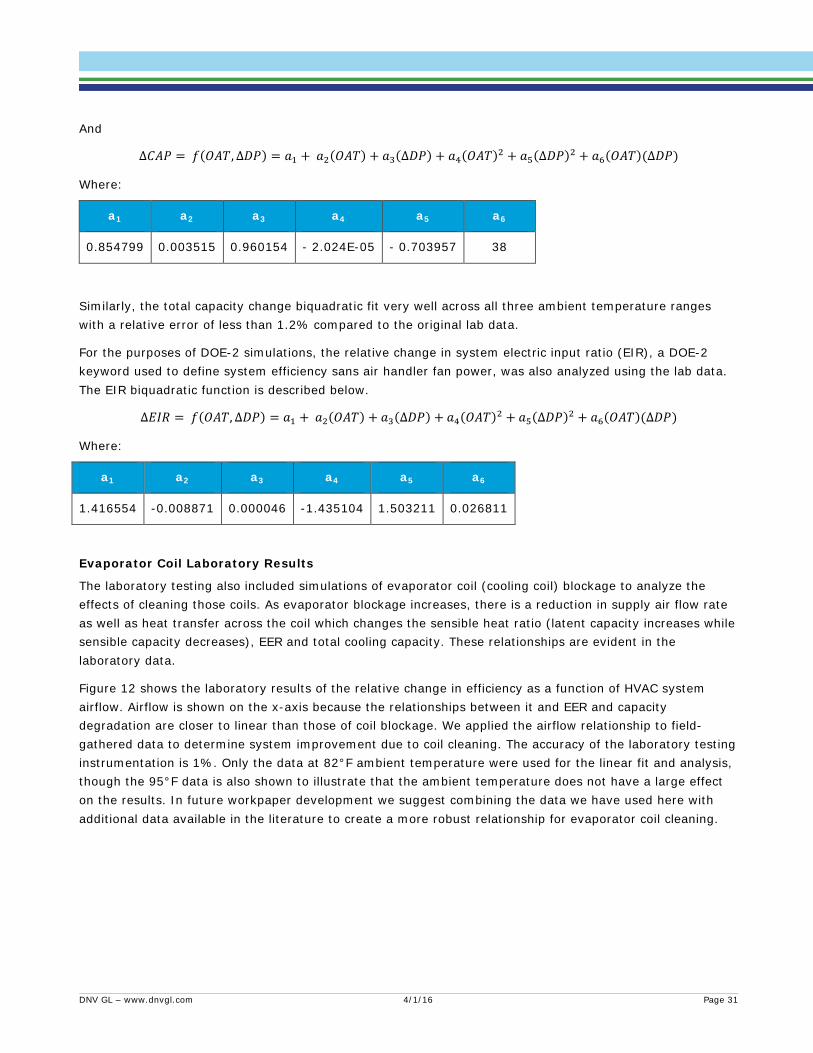
And
∆𝐶𝐶𝑂𝑂𝐷𝐷 = 𝑜𝑜(𝑂𝑂𝑂𝑂𝑂𝑂,∆𝐷𝐷𝐷𝐷) = 𝑠𝑠1 + 𝑠𝑠2(𝑂𝑂𝑂𝑂𝑂𝑂) + 𝑠𝑠3(∆𝐷𝐷𝐷𝐷) + 𝑠𝑠4(𝑂𝑂𝑂𝑂𝑂𝑂)2 + 𝑠𝑠5(∆𝐷𝐷𝐷𝐷)2 + 𝑠𝑠6(𝑂𝑂𝑂𝑂𝑂𝑂)(∆𝐷𝐷𝐷𝐷)
Where:
a1 a2 a3 a4 a5 a6
0.854799 0.003515 0.960154 - 2.024E-05 - 0.703957 38
Similarly, the total capacity change biquadratic fit very well across all three ambient temperature ranges with a relative error of less than 1.2% compared to the original lab data.
For the purposes of DOE-2 simulations, the relative change in system electric input ratio (EIR), a DOE-2 keyword used to define system efficiency sans air handler fan power, was also analyzed using the lab data. The EIR biquadratic function is described below.
∆𝐸𝐸𝐸𝐸𝐸𝐸 = 𝑜𝑜(𝑂𝑂𝑂𝑂𝑂𝑂,∆𝐷𝐷𝐷𝐷) = 𝑠𝑠1 + 𝑠𝑠2(𝑂𝑂𝑂𝑂𝑂𝑂) + 𝑠𝑠3(∆𝐷𝐷𝐷𝐷) + 𝑠𝑠4(𝑂𝑂𝑂𝑂𝑂𝑂)2 + 𝑠𝑠5(∆𝐷𝐷𝐷𝐷)2 + 𝑠𝑠6(𝑂𝑂𝑂𝑂𝑂𝑂)(∆𝐷𝐷𝐷𝐷)
Where:
a1 a2 a3 a4 a5 a6
1.416554 -0.008871 0.000046 -1.435104 1.503211 0.026811
Evaporator Coil Laboratory Results
The laboratory testing also included simulations of evaporator coil (cooling coil) blockage to analyze the effects of cleaning those coils. As evaporator blockage increases, there is a reduction in supply air flow rate as well as heat transfer across the coil which changes the sensible heat ratio (latent capacity increases while sensible capacity decreases), EER and total cooling capacity. These relationships are evident in the laboratory data.
Figure 12 shows the laboratory results of the relative change in efficiency as a function of HVAC system airflow. Airflow is shown on the x-axis because the relationships between it and EER and capacity degradation are closer to linear than those of coil blockage. We applied the airflow relationship to field-gathered data to determine system improvement due to coil cleaning. The accuracy of the laboratory testing instrumentation is 1%. Only the data at 82°F ambient temperature were used for the linear fit and analysis, though the 95°F data is also shown to illustrate that the ambient temperature does not have a large effect on the results. In future workpaper development we suggest combining the data we have used here with additional data available in the literature to create a more robust relationship for evaporator coil cleaning.
DNV GL – www.dnvgl.com 4/1/16 Page 31
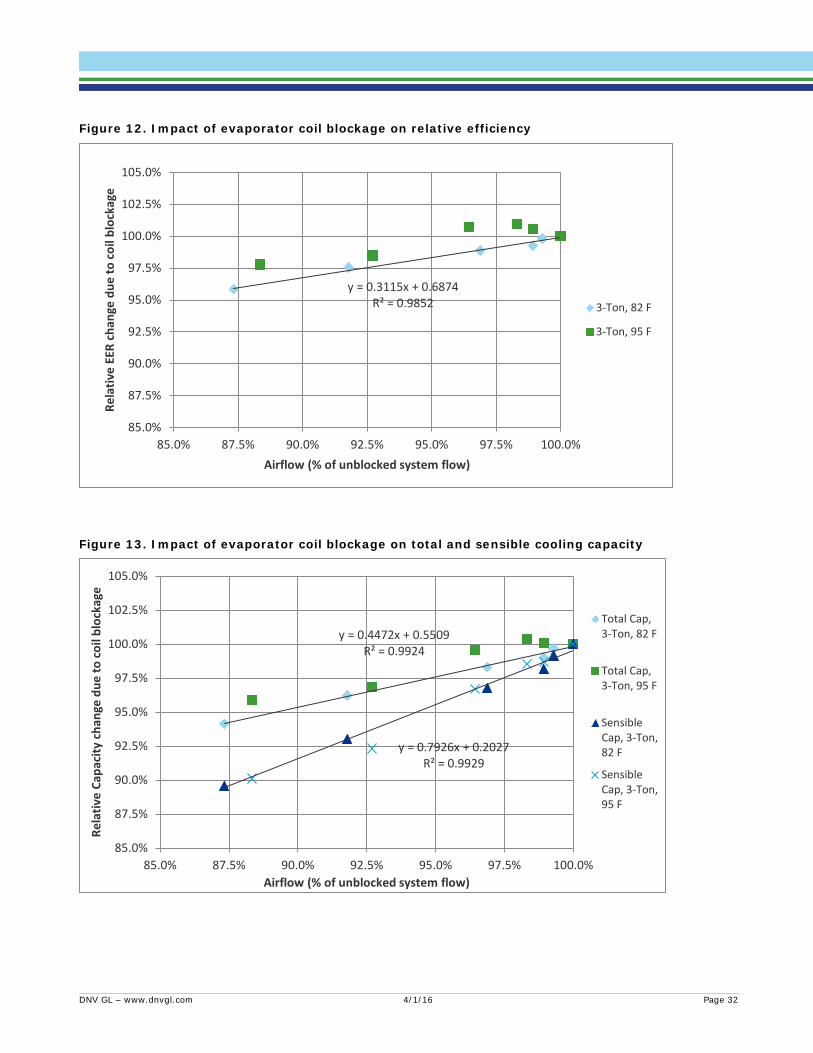
Figure 12. Impact of evaporator coil blockage on relative efficiency
Figure 13. Impact of evaporator coil blockage on total and sensible cooling capacity
y = 0.3115x + 0.6874 R² = 0.9852
85.0%
87.5%
90.0%
92.5%
95.0%
97.5%
100.0%
102.5%
105.0%
85.0% 87.5% 90.0% 92.5% 95.0% 97.5% 100.0%
Rela
tive
EER
chan
ge d
ue to
coi
l blo
ckag
e
Airflow (% of unblocked system flow)
3-Ton, 82 F
3-Ton, 95 F
y = 0.4472x + 0.5509 R² = 0.9924
y = 0.7926x + 0.2027 R² = 0.9929
85.0%
87.5%
90.0%
92.5%
95.0%
97.5%
100.0%
102.5%
105.0%
85.0% 87.5% 90.0% 92.5% 95.0% 97.5% 100.0%
Rela
tive
Capa
city
cha
nge
due
to c
oil b
lock
age
Airflow (% of unblocked system flow)
Total Cap,3-Ton, 82 F
Total Cap,3-Ton, 95 F
SensibleCap, 3-Ton,82 F
SensibleCap, 3-Ton,95 F
DNV GL – www.dnvgl.com 4/1/16 Page 32
Ride-along data 4.1.4The condenser coil cleaning field data were collected during ride-along site visits with the program-participating HVAC contractors from August through October 2015. The effort was focused on the two SDG&E tune-up programs (Deemed and Direct Install). We planned that when a program participant scheduled to have condenser coil cleaning performed the contractor would inform the evaluation team. The evaluation team and HVAC contractor would coordinate to schedule the site visit together in order to measure pre-cleaning “dirty coil” compressor discharge pressures unit performance before the contractor cleaned the condensing coils. Post-cleaning “clean coil” compressor discharge pressure would then be measured after the coils were cleaned. Plans were to convert these pressure changes to unit performance changes using the laboratory correlations described in section 4.1.3.
Unfortunately, due to a temporary freeze on coil cleaning rebates and resulting communication issues, the site visits included prior participants from the 13-14 program cycles with others not appearing in 2013-14 or 2010-12 tracking databases. The three sites that participated in the 2013-14 program had their coils cleaned one-and-a-half years before the ride-along and the two sites not found in the two most recent cycles had coils cleaned more than three years prior to the ride-along visit. Although the 2013-14 visited sites are not fully representative of sites entering the program, they do represent coils that are at least half way through the effective useful measure lifetime of three years. The collected data provides a lower bound for savings values, as new participants, with coils not cleaned for an indefinite period may have additional savings than found here.
It is important to note that in order to be consistent with the laboratory test conditions; the ride-along pre- “dirty coil” unit performance was measured after the units were brought to factory refrigerant charge by the HVAC contractor. Key unit characteristics and pre/post performance metrics including compressor discharge pressure, pre-condenser coil cleaning (Pre-CCC) and post-condenser coil cleaning (Post-CCC) that were used to estimate relative efficiency impacts from condenser coil cleaning are shown in Table 10. Unit sizes ranged from 2 tons to 5 tons and all were non-TXV units. Field evaluator made sure that OAT did not change significantly between the pre and post coil cleaning measurements, with the largest difference measured to be approximately 1°F.
DNV GL – www.dnvgl.com 4/1/16 Page 33
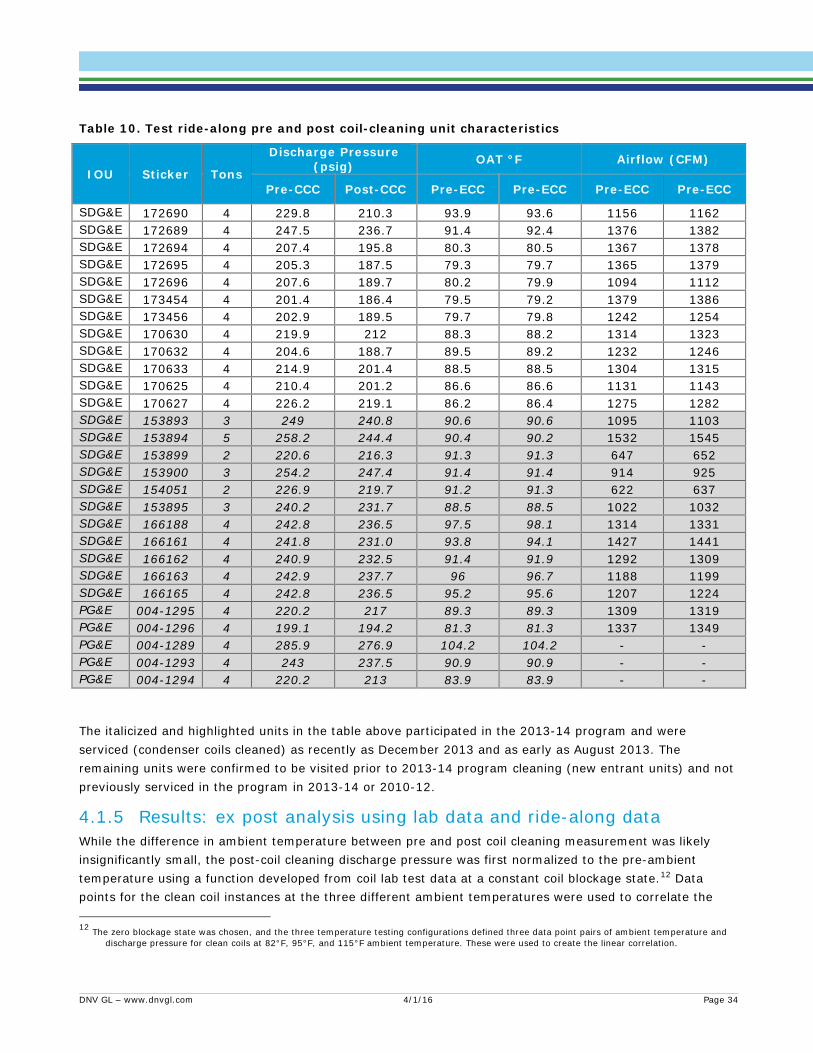
Table 10. Test ride-along pre and post coil-cleaning unit characteristics
IOU Sticker Tons
Discharge Pressure (psig) OAT °F Airflow (CFM)
Pre-CCC Post-CCC Pre-ECC Pre-ECC Pre-ECC Pre-ECC
SDG&E 172690 4 229.8 210.3 93.9 93.6 1156 1162 SDG&E 172689 4 247.5 236.7 91.4 92.4 1376 1382 SDG&E 172694 4 207.4 195.8 80.3 80.5 1367 1378 SDG&E 172695 4 205.3 187.5 79.3 79.7 1365 1379 SDG&E 172696 4 207.6 189.7 80.2 79.9 1094 1112 SDG&E 173454 4 201.4 186.4 79.5 79.2 1379 1386 SDG&E 173456 4 202.9 189.5 79.7 79.8 1242 1254 SDG&E 170630 4 219.9 212 88.3 88.2 1314 1323 SDG&E 170632 4 204.6 188.7 89.5 89.2 1232 1246 SDG&E 170633 4 214.9 201.4 88.5 88.5 1304 1315 SDG&E 170625 4 210.4 201.2 86.6 86.6 1131 1143 SDG&E 170627 4 226.2 219.1 86.2 86.4 1275 1282 SDG&E 153893 3 249 240.8 90.6 90.6 1095 1103 SDG&E 153894 5 258.2 244.4 90.4 90.2 1532 1545 SDG&E 153899 2 220.6 216.3 91.3 91.3 647 652 SDG&E 153900 3 254.2 247.4 91.4 91.4 914 925 SDG&E 154051 2 226.9 219.7 91.2 91.3 622 637 SDG&E 153895 3 240.2 231.7 88.5 88.5 1022 1032 SDG&E 166188 4 242.8 236.5 97.5 98.1 1314 1331 SDG&E 166161 4 241.8 231.0 93.8 94.1 1427 1441 SDG&E 166162 4 240.9 232.5 91.4 91.9 1292 1309 SDG&E 166163 4 242.9 237.7 96 96.7 1188 1199 SDG&E 166165 4 242.8 236.5 95.2 95.6 1207 1224 PG&E 004-1295 4 220.2 217 89.3 89.3 1309 1319 PG&E 004-1296 4 199.1 194.2 81.3 81.3 1337 1349 PG&E 004-1289 4 285.9 276.9 104.2 104.2 - - PG&E 004-1293 4 243 237.5 90.9 90.9 - - PG&E 004-1294 4 220.2 213 83.9 83.9 - -
The italicized and highlighted units in the table above participated in the 2013-14 program and were serviced (condenser coils cleaned) as recently as December 2013 and as early as August 2013. The remaining units were confirmed to be visited prior to 2013-14 program cleaning (new entrant units) and not previously serviced in the program in 2013-14 or 2010-12.
Results: ex post analysis using lab data and ride-along data 4.1.5While the difference in ambient temperature between pre and post coil cleaning measurement was likely insignificantly small, the post-coil cleaning discharge pressure was first normalized to the pre-ambient temperature using a function developed from coil lab test data at a constant coil blockage state.12 Data points for the clean coil instances at the three different ambient temperatures were used to correlate the
12 The zero blockage state was chosen, and the three temperature testing configurations defined three data point pairs of ambient temperature and discharge pressure for clean coils at 82°F, 95°F, and 115°F ambient temperature. These were used to create the linear correlation.
DNV GL – www.dnvgl.com 4/1/16 Page 34
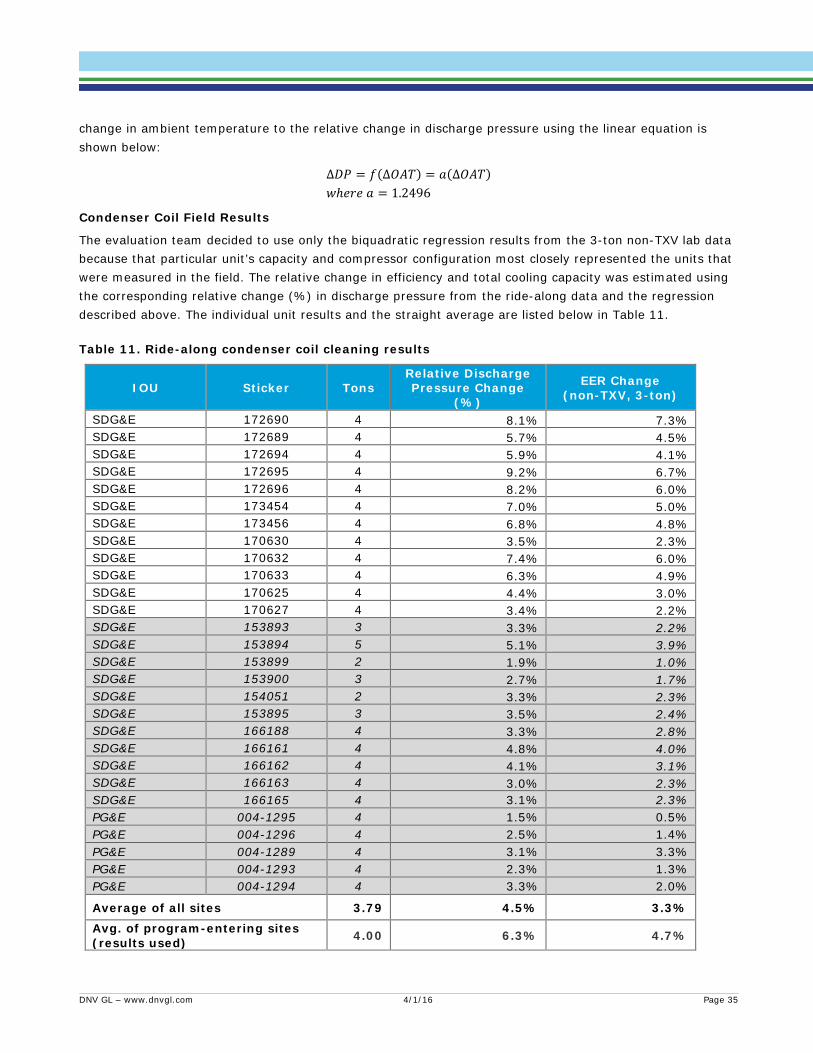
change in ambient temperature to the relative change in discharge pressure using the linear equation is shown below:
∆𝐷𝐷𝐷𝐷 = 𝑜𝑜(∆𝑂𝑂𝑂𝑂𝑂𝑂) = 𝑠𝑠(∆𝑂𝑂𝑂𝑂𝑂𝑂) 𝑤𝑤ℎ𝑠𝑠𝑛𝑛𝑠𝑠 𝑠𝑠 = 1.2496
Condenser Coil Field Results
The evaluation team decided to use only the biquadratic regression results from the 3-ton non-TXV lab data because that particular unit’s capacity and compressor configuration most closely represented the units that were measured in the field. The relative change in efficiency and total cooling capacity was estimated using the corresponding relative change (%) in discharge pressure from the ride-along data and the regression described above. The individual unit results and the straight average are listed below in Table 11.
Table 11. Ride-along condenser coil cleaning results
IOU Sticker Tons Relative Discharge Pressure Change
(%)
EER Change (non-TXV, 3-ton)
SDG&E 172690 4 8.1% 7.3% SDG&E 172689 4 5.7% 4.5% SDG&E 172694 4 5.9% 4.1% SDG&E 172695 4 9.2% 6.7% SDG&E 172696 4 8.2% 6.0% SDG&E 173454 4 7.0% 5.0% SDG&E 173456 4 6.8% 4.8% SDG&E 170630 4 3.5% 2.3% SDG&E 170632 4 7.4% 6.0% SDG&E 170633 4 6.3% 4.9% SDG&E 170625 4 4.4% 3.0% SDG&E 170627 4 3.4% 2.2% SDG&E 153893 3 3.3% 2.2% SDG&E 153894 5 5.1% 3.9% SDG&E 153899 2 1.9% 1.0% SDG&E 153900 3 2.7% 1.7% SDG&E 154051 2 3.3% 2.3% SDG&E 153895 3 3.5% 2.4% SDG&E 166188 4 3.3% 2.8% SDG&E 166161 4 4.8% 4.0% SDG&E 166162 4 4.1% 3.1% SDG&E 166163 4 3.0% 2.3% SDG&E 166165 4 3.1% 2.3% PG&E 004-1295 4 1.5% 0.5% PG&E 004-1296 4 2.5% 1.4% PG&E 004-1289 4 3.1% 3.3% PG&E 004-1293 4 2.3% 1.3% PG&E 004-1294 4 3.3% 2.0%
Average of all sites 3.79 4.5% 3.3%
Avg. of program-entering sites (results used) 4.00 6.3% 4.7%
DNV GL – www.dnvgl.com 4/1/16 Page 35
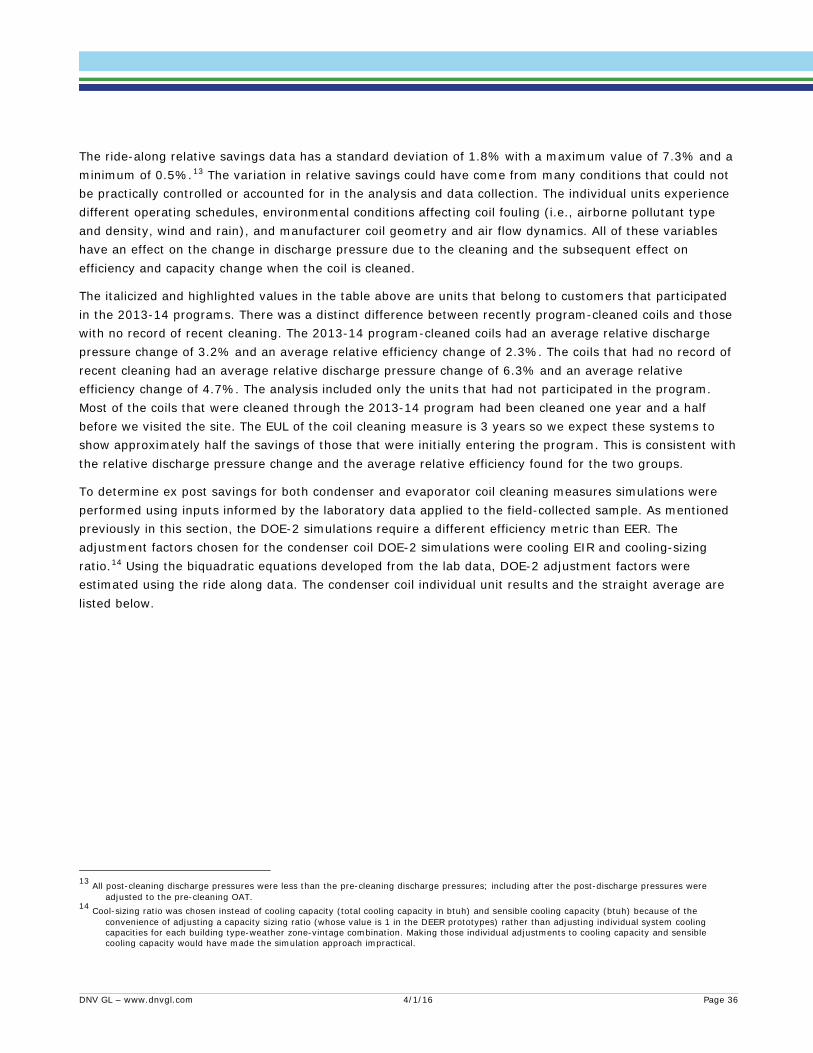
The ride-along relative savings data has a standard deviation of 1.8% with a maximum value of 7.3% and a minimum of 0.5%.13 The variation in relative savings could have come from many conditions that could not be practically controlled or accounted for in the analysis and data collection. The individual units experience different operating schedules, environmental conditions affecting coil fouling (i.e., airborne pollutant type and density, wind and rain), and manufacturer coil geometry and air flow dynamics. All of these variables have an effect on the change in discharge pressure due to the cleaning and the subsequent effect on efficiency and capacity change when the coil is cleaned.
The italicized and highlighted values in the table above are units that belong to customers that participated in the 2013-14 programs. There was a distinct difference between recently program-cleaned coils and those with no record of recent cleaning. The 2013-14 program-cleaned coils had an average relative discharge pressure change of 3.2% and an average relative efficiency change of 2.3%. The coils that had no record of recent cleaning had an average relative discharge pressure change of 6.3% and an average relative efficiency change of 4.7%. The analysis included only the units that had not participated in the program. Most of the coils that were cleaned through the 2013-14 program had been cleaned one year and a half before we visited the site. The EUL of the coil cleaning measure is 3 years so we expect these systems to show approximately half the savings of those that were initially entering the program. This is consistent with the relative discharge pressure change and the average relative efficiency found for the two groups.
To determine ex post savings for both condenser and evaporator coil cleaning measures simulations were performed using inputs informed by the laboratory data applied to the field-collected sample. As mentioned previously in this section, the DOE-2 simulations require a different efficiency metric than EER. The adjustment factors chosen for the condenser coil DOE-2 simulations were cooling EIR and cooling-sizing ratio.14 Using the biquadratic equations developed from the lab data, DOE-2 adjustment factors were estimated using the ride along data. The condenser coil individual unit results and the straight average are listed below.
13 All post-cleaning discharge pressures were less than the pre-cleaning discharge pressures; including after the post-discharge pressures were adjusted to the pre-cleaning OAT.
14 Cool-sizing ratio was chosen instead of cooling capacity (total cooling capacity in btuh) and sensible cooling capacity (btuh) because of the convenience of adjusting a capacity sizing ratio (whose value is 1 in the DEER prototypes) rather than adjusting individual system cooling capacities for each building type-weather zone-vintage combination. Making those individual adjustments to cooling capacity and sensible cooling capacity would have made the simulation approach impractical.
DNV GL – www.dnvgl.com 4/1/16 Page 36
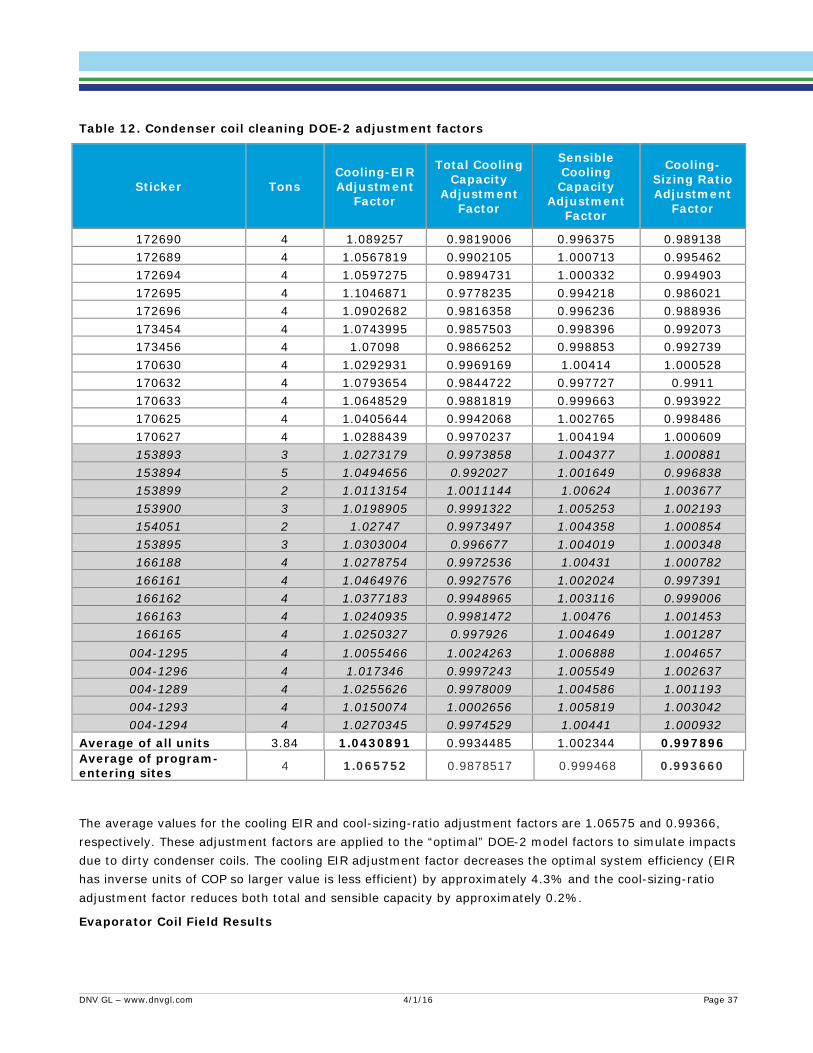
Table 12. Condenser coil cleaning DOE-2 adjustment factors
Sticker Tons Cooling-EIR Adjustment
Factor
Total Cooling Capacity
Adjustment Factor
Sensible Cooling Capacity
Adjustment Factor
Cooling-Sizing Ratio Adjustment
Factor
172690 4 1.089257 0.9819006 0.996375 0.989138 172689 4 1.0567819 0.9902105 1.000713 0.995462 172694 4 1.0597275 0.9894731 1.000332 0.994903 172695 4 1.1046871 0.9778235 0.994218 0.986021 172696 4 1.0902682 0.9816358 0.996236 0.988936 173454 4 1.0743995 0.9857503 0.998396 0.992073 173456 4 1.07098 0.9866252 0.998853 0.992739 170630 4 1.0292931 0.9969169 1.00414 1.000528 170632 4 1.0793654 0.9844722 0.997727 0.9911 170633 4 1.0648529 0.9881819 0.999663 0.993922 170625 4 1.0405644 0.9942068 1.002765 0.998486 170627 4 1.0288439 0.9970237 1.004194 1.000609 153893 3 1.0273179 0.9973858 1.004377 1.000881 153894 5 1.0494656 0.992027 1.001649 0.996838 153899 2 1.0113154 1.0011144 1.00624 1.003677 153900 3 1.0198905 0.9991322 1.005253 1.002193 154051 2 1.02747 0.9973497 1.004358 1.000854 153895 3 1.0303004 0.996677 1.004019 1.000348 166188 4 1.0278754 0.9972536 1.00431 1.000782 166161 4 1.0464976 0.9927576 1.002024 0.997391 166162 4 1.0377183 0.9948965 1.003116 0.999006 166163 4 1.0240935 0.9981472 1.00476 1.001453 166165 4 1.0250327 0.997926 1.004649 1.001287
004-1295 4 1.0055466 1.0024263 1.006888 1.004657 004-1296 4 1.017346 0.9997243 1.005549 1.002637 004-1289 4 1.0255626 0.9978009 1.004586 1.001193 004-1293 4 1.0150074 1.0002656 1.005819 1.003042 004-1294 4 1.0270345 0.9974529 1.00441 1.000932
Average of all units 3.84 1.0430891 0.9934485 1.002344 0.997896 Average of program- entering sites 4 1.065752 0.9878517 0.999468 0.993660
The average values for the cooling EIR and cool-sizing-ratio adjustment factors are 1.06575 and 0.99366, respectively. These adjustment factors are applied to the “optimal” DOE-2 model factors to simulate impacts due to dirty condenser coils. The cooling EIR adjustment factor decreases the optimal system efficiency (EIR has inverse units of COP so larger value is less efficient) by approximately 4.3% and the cool-sizing-ratio adjustment factor reduces both total and sensible capacity by approximately 0.2%.
Evaporator Coil Field Results
DNV GL – www.dnvgl.com 4/1/16 Page 37

The results of applying laboratory data relationships to the evaporator coil cleaning field measurements made on 25 units during ride-along visits are shown in Table 13. The very small change in airflow (1%) is within the measurement error of the TrueFlow equipment (7%) used to make the field measurements. Minimal changes are not unexpected since evaporator coils are not exposed to the elements, and are generally protected by a filter so they often do not foul as quickly as condenser coils. The HVAC units that did not participate in the 2013-14 program showed very little difference from those that did not participate with airflows changing similarly in the two groups. For consistency with the condenser coil cleaning analysis, we used only the units untouched by the program in the evaporator coil ex post analysis. The coil bypass factor (CBF) had the largest percent change since it is a function of the latent/sensible capacity fraction.
Table 13. Ride-along evaporator coil cleaning results
IOU Sticker Tons
Relative Airflow Change
(%)
EER Change
(non-TXV, 3-ton)
CBF Change
(non-TXV, 3-ton)
Total Capacity Change
(non-TXV, 3-ton)
Sensible Capacity Change
(non-TXV, 3-ton)
SDG&E 172690 4 99.5% 0.01% -3.85% 0.42% 0.88%
SDG&E 172689 4 99.6% -0.02% -3.74% 0.38% 0.81%
SDG&E 172694 4 99.2% 0.10% -4.21% 0.55% 1.10%
SDG&E 172695 4 99.0% 0.16% -4.48% 0.64% 1.27%
SDG&E 172696 4 98.4% 0.35% -5.25% 0.91% 1.75%
SDG&E 173454 4 99.5% 0.00% -3.83% 0.42% 0.87%
SDG&E 173456 4 99.0% 0.15% -4.41% 0.62% 1.23%
SDG&E 170630 4 99.3% 0.06% -4.06% 0.49% 1.01%
SDG&E 170632 4 98.9% 0.20% -4.62% 0.69% 1.36%
SDG&E 170633 4 99.2% 0.11% -4.25% 0.56% 1.13%
SDG&E 170625 4 99.0% 0.17% -4.53% 0.66% 1.30%
SDG&E 170627 4 99.5% 0.02% -3.88% 0.43% 0.90%
SDG&E 153893 3 99.3% 0.07% -4.11% 0.51% 1.04%
SDG&E 153894 5 99.2% 0.11% -4.26% 0.57% 1.14%
SDG&E 153899 2 99.2% 0.09% -4.17% 0.53% 1.08%
SDG&E 153900 3 98.8% 0.22% -4.70% 0.72% 1.41%
SDG&E 154051 2 97.6% 0.58% -6.18% 1.24% 2.34%
SDG&E 153895 3 99.0% 0.15% -4.42% 0.62% 1.24%
SDG&E 166188 4 98.7% 0.25% -4.81% 0.76% 1.48%
SDG&E 166161 4 99.0% 0.15% -4.43% 0.62% 1.24%
SDG&E 166162 4 98.7% 0.25% -4.84% 0.77% 1.50%
SDG&E 166163 4 99.1% 0.13% -4.36% 0.60% 1.20%
SDG&E 166165 4 98.6% 0.28% -4.96% 0.81% 1.57%
PG&E 004-1295 4 99.2% 0.08% -4.15% 0.53% 1.07%
PG&E 004-1296 4 99.1% 0.12% -4.32% 0.59% 1.18%
Average of all sites 0.990 0.15% -4.43% 0.63% 1.24%
Avg. of program-entering sites 0.992 0.11% -4.26% 0.57% 1.14%
DNV GL – www.dnvgl.com 4/1/16 Page 38
In the evaporator coil simulations, only one factor was changed: the coil bypass factor, which was adjusted by a factor of 1.0426 across all building types and climate zones. We considered changing the EIR and system capacities, but there were major complications changing these inputs in the batch file tool that we used. This could be a topic of future inquiry.
Program-specific results 4.1.6The results are shown by program in Table 14 and Table 15. The PG&E Commercial QM program did not report any ex ante savings for this measure. However, they performed the measure 71% of the time according to their implementer data. We gave them credit for the measure by assigning savings to their “signing contract” claim that had ex ante savings equal to zero. The SCE Quality Maintenance program reported savings on an aggregated level and has no specific claims for this measure. Results for the SCE QM program are explained in more detail in section 4.6. Appendix B presents the evaporator and condenser coil cleaning results for each climate zone and building type.
The realization rates for the SDG&E programs in Table 14 are as expected since lab data showed savings that were about half of what was in the workpaper. The PG&E AirCare Plus program has extremely high realization rates because their ex ante savings claims followed the disposition that reduced savings to less than 10% of the workpaper saving. The workpaper applied 13% savings to HVAC end-use energy whereas the disposition applied the 13% savings to the predicted refrigerant charge adjustment savings for an HVAC unit. These results for condenser coil cleaning are preliminary as they are based only on data collected at twelve units on two sites. We plan to collect more data in the 2015 program year evaluation. The realization rate results for evaporator coil cleaning are shown in Table 15.
Table 14. Condenser coil cleaning results by program
Program Number
of Claims
Ex Ante kWh
Savings
Ex Ante kW
Savings
Ex Post Instal-lation Rate
Ex Post Reali-zation Rate kWh
Ex Post Reali-
zation Rate kW
Ex Post kWh
Savings
Ex Post kW
Savings
PG&E Commercial QM
4,826 0 0 100% N/A N/A 1,354,873 659
PG&E AirCare Plus 2,032 53,539 34 100% 598% 221% 319,956 76
SDG&E Deemed 11,311 7,008,173 2,295 100% 68% 122% 4,765,519 2,804
SDG&E Direct Install
7,448 3,636,362 1,110 100% 62% 120% 2,246,860 1,331
DNV GL – www.dnvgl.com 4/1/16 Page 39
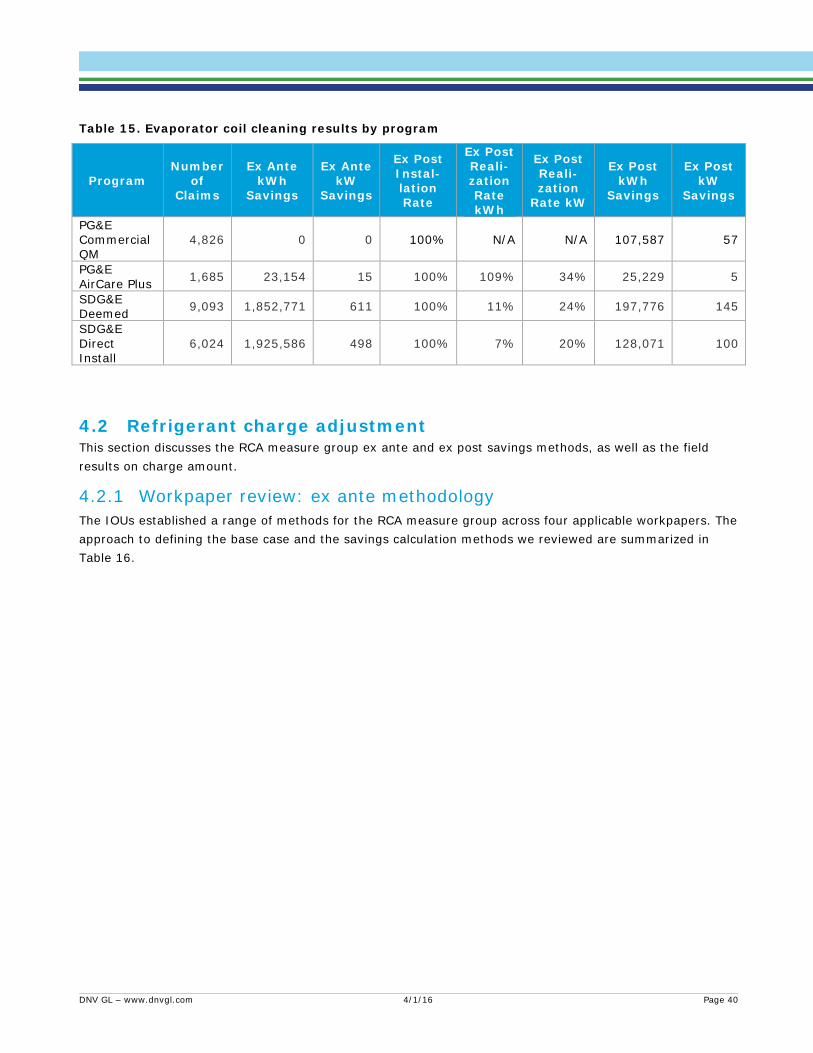
Table 15. Evaporator coil cleaning results by program
Program Number
of Claims
Ex Ante kWh
Savings
Ex Ante kW
Savings
Ex Post Instal-lation Rate
Ex Post Reali-zation Rate kWh
Ex Post Reali-zation
Rate kW
Ex Post kWh
Savings
Ex Post kW
Savings
PG&E Commercial QM
4,826 0 0 100% N/A N/A 107,587 57
PG&E AirCare Plus 1,685 23,154 15 100% 109% 34% 25,229 5
SDG&E Deemed 9,093 1,852,771 611 100% 11% 24% 197,776 145
SDG&E Direct Install
6,024 1,925,586 498 100% 7% 20% 128,071 100
This section discusses the RCA measure group ex ante and ex post savings methods, as well as the field results on charge amount.
Workpaper review: ex ante methodology 4.2.1The IOUs established a range of methods for the RCA measure group across four applicable workpapers. The approach to defining the base case and the savings calculation methods we reviewed are summarized in Table 16.
4.2 Refrigerant charge adjustment
DNV GL – www.dnvgl.com 4/1/16 Page 40
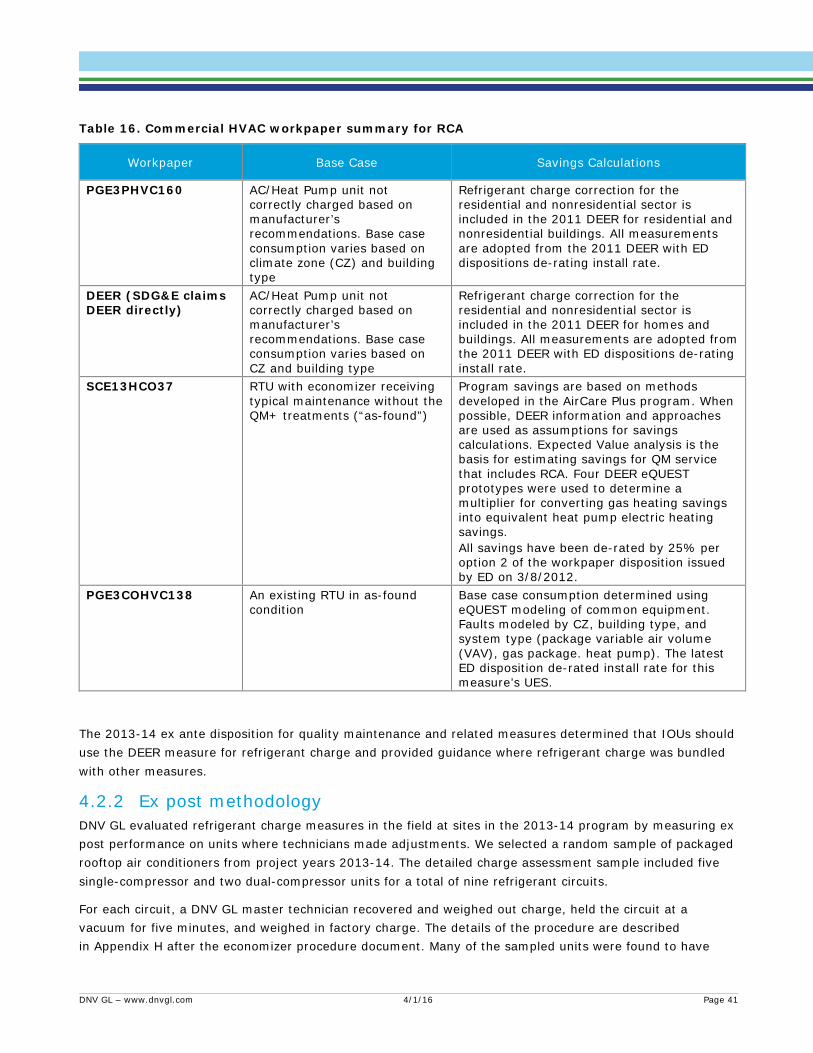
Table 16. Commercial HVAC workpaper summary for RCA
Workpaper Base Case Savings Calculations
PGE3PHVC160 AC/Heat Pump unit not correctly charged based on manufacturer’s recommendations. Base case consumption varies based on climate zone (CZ) and building type
Refrigerant charge correction for the residential and nonresidential sector is included in the 2011 DEER for residential and nonresidential buildings. All measurements are adopted from the 2011 DEER with ED dispositions de-rating install rate.
DEER (SDG&E claims DEER directly)
AC/Heat Pump unit not correctly charged based on manufacturer’s recommendations. Base case consumption varies based on CZ and building type
Refrigerant charge correction for the residential and nonresidential sector is included in the 2011 DEER for homes and buildings. All measurements are adopted from the 2011 DEER with ED dispositions de-rating install rate.
SCE13HCO37 RTU with economizer receiving typical maintenance without the QM+ treatments (“as-found”)
Program savings are based on methods developed in the AirCare Plus program. When possible, DEER information and approaches are used as assumptions for savings calculations. Expected Value analysis is the basis for estimating savings for QM service that includes RCA. Four DEER eQUEST prototypes were used to determine a multiplier for converting gas heating savings into equivalent heat pump electric heating savings. All savings have been de-rated by 25% per option 2 of the workpaper disposition issued by ED on 3/8/2012.
PGE3COHVC138 An existing RTU in as-found condition
Base case consumption determined using eQUEST modeling of common equipment. Faults modeled by CZ, building type, and system type (package variable air volume (VAV), gas package. heat pump). The latest ED disposition de-rated install rate for this measure’s UES.
The 2013-14 ex ante disposition for quality maintenance and related measures determined that IOUs should use the DEER measure for refrigerant charge and provided guidance where refrigerant charge was bundled with other measures.
Ex post methodology 4.2.2DNV GL evaluated refrigerant charge measures in the field at sites in the 2013-14 program by measuring ex post performance on units where technicians made adjustments. We selected a random sample of packaged rooftop air conditioners from project years 2013-14. The detailed charge assessment sample included five single-compressor and two dual-compressor units for a total of nine refrigerant circuits.
For each circuit, a DNV GL master technician recovered and weighed out charge, held the circuit at a vacuum for five minutes, and weighed in factory charge. The details of the procedure are described in Appendix H after the economizer procedure document. Many of the sampled units were found to have
DNV GL – www.dnvgl.com 4/1/16 Page 41
been undercharged at the initial point of service. Significant charge was added to those units and the resulting recovery by the master technician field team indicated that the initially undercharged units ended up being both undercharged and overcharged after initial point of service. The implementer data corroborated this finding that most units were initially undercharged. Recovery and weigh-out of these units indicated cases of both over- and undercharge after service. Units that were still undercharged after the program-added charge realized benefits, but additional potential remained. Units that had charge added and ended up overcharged had multiple potential outcomes, including positive, zero, or slightly negative benefits.
DNV GL determined the impact of refrigerant charge adjustment using the efficiency and capacity estimates at various charge conditions using Laboratory test data developed in HVAC5,15 which provided the estimated EER and cooling output at various charge conditions. The team calculated program-assumed EERs and capacities based on claimed initial charge, actual initial charge, and final charge state.
Using these calculated performance changes, the team determined claimed and actual savings percentages based on average EERs and capacities run through DEER prototype models.
We recognize that this method assumes that a system is at peak performance when it contains the manufacturer recommended charge. This is different from the program assumption that peak system performance is achieved by adjusting the charge using fault-detection diagnostic (i.e., superheat, subcooling, condensing over ambient, and other combinations or proprietary methods) tests that optimize the charge for the operating conditions of that particular system.
For instance, a particular system may have low airflow or a dirty condenser coil that can affect system performance and potentially change the weight of charge in the system that provides peak performance. The previous evaluation effort (WO32) studied the diagnostic procedures extensively and found that they differed by utility program, and did not consistently leave systems in peak performance condition (with respect to refrigerant charge only). Laboratory tests published in the last few years cast doubt on the reliability of diagnostic tests.16 The issue of fault detection is currently the subject of much research at Purdue and the University of Nebraska. Their results should be used to inform program protocols going forward. Laboratory tests performed under HVAC5 suggested that a system performs satisfactorily under other fault conditions (e.g., low airflow or other efficiency-degrading factors) when it is filled with the manufacturer’s recommended charge. Therefore, we have chosen to use manufacturer’s recommended charge as the metric for ideal system refrigerant charge in this evaluation effort.
4.2.2.1 Review of implementer data A critical piece of information was the amount of charge added or removed from the units by the program. Each IOU stored this critical piece of information in a variety of ways and it required multiple data requests to obtain this information. AirCare
The distribution of ex ante overcharge and undercharge claims across programs where implementer data (i.e., charge adjustment amounts) was available and shown in Table 17.
15 Laboratory HVAC Testing Research Plan, prepared for the CPUC by KEMA, Inc. 11/17/2014 (HVAC5 research plan and results). 16 DNV GL, HVAC Impact Evaluation FINAL Report WO32 HVAC – Volume 1: Report, Jan. 28, 2015.
http://www.calmac.org/publications/FINAL_HVAC_Impact_Evaluation_WO32_Report_28Jan2015_Volume1_ReportES.pdf
DNV GL – www.dnvgl.com 4/1/16 Page 42
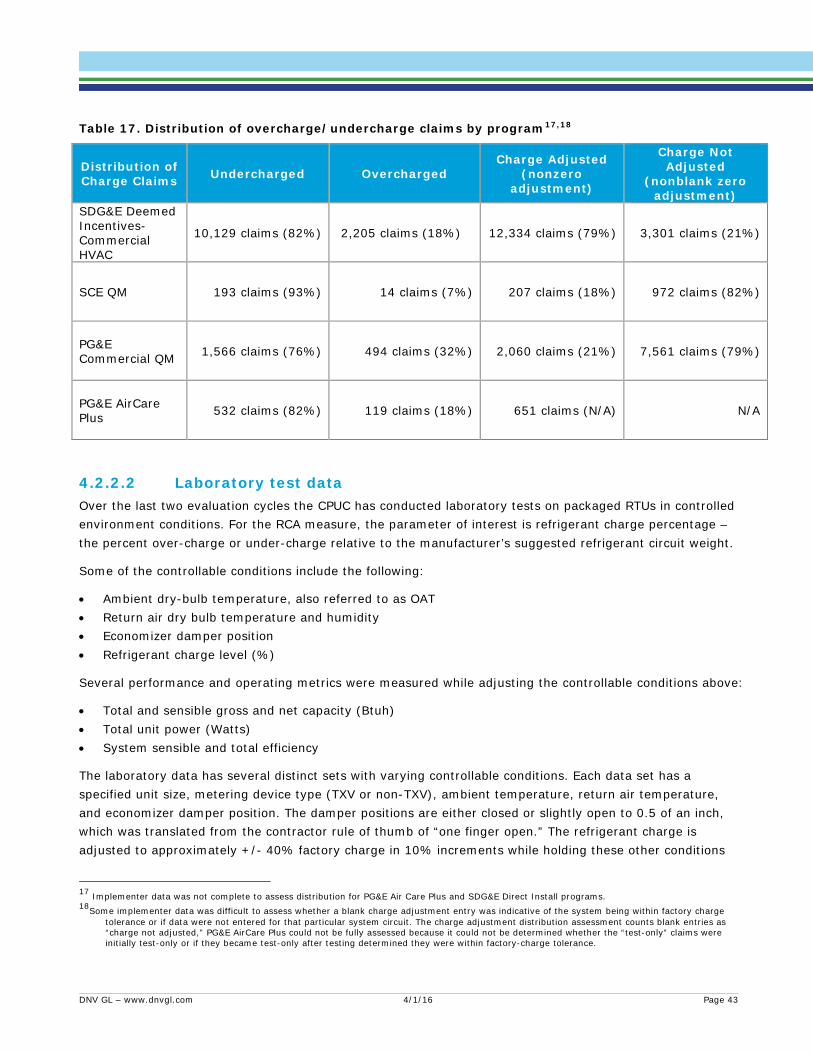
Table 17. Distribution of overcharge/undercharge claims by program17,18
Distribution of Charge Claims Undercharged Overcharged
Charge Adjusted (nonzero
adjustment)
Charge Not Adjusted
(nonblank zero adjustment)
SDG&E Deemed Incentives-Commercial HVAC
10,129 claims (82%) 2,205 claims (18%) 12,334 claims (79%) 3,301 claims (21%)
SCE QM 193 claims (93%) 14 claims (7%) 207 claims (18%) 972 claims (82%)
PG&E Commercial QM 1,566 claims (76%) 494 claims (32%) 2,060 claims (21%) 7,561 claims (79%)
PG&E AirCare Plus 532 claims (82%) 119 claims (18%) 651 claims (N/A) N/A
4.2.2.2 Laboratory test data Over the last two evaluation cycles the CPUC has conducted laboratory tests on packaged RTUs in controlled environment conditions. For the RCA measure, the parameter of interest is refrigerant charge percentage – the percent over-charge or under-charge relative to the manufacturer’s suggested refrigerant circuit weight.
Some of the controllable conditions include the following:
• Ambient dry-bulb temperature, also referred to as OAT • Return air dry bulb temperature and humidity • Economizer damper position • Refrigerant charge level (%)
Several performance and operating metrics were measured while adjusting the controllable conditions above:
• Total and sensible gross and net capacity (Btuh) • Total unit power (Watts) • System sensible and total efficiency
The laboratory data has several distinct sets with varying controllable conditions. Each data set has a specified unit size, metering device type (TXV or non-TXV), ambient temperature, return air temperature, and economizer damper position. The damper positions are either closed or slightly open to 0.5 of an inch, which was translated from the contractor rule of thumb of “one finger open.” The refrigerant charge is adjusted to approximately +/- 40% factory charge in 10% increments while holding these other conditions
17 Implementer data was not complete to assess distribution for PG&E Air Care Plus and SDG&E Direct Install programs. 18Some implementer data was difficult to assess whether a blank charge adjustment entry was indicative of the system being within factory charge
tolerance or if data were not entered for that particular system circuit. The charge adjustment distribution assessment counts blank entries as “charge not adjusted,” PG&E AirCare Plus could not be fully assessed because it could not be determined whether the “test-only” claims were initially test-only or if they became test-only after testing determined they were within factory-charge tolerance.
DNV GL – www.dnvgl.com 4/1/16 Page 43

fixed. The unit performance is measured to determine a correlation between unit efficiency (and capacity) and relative refrigerant charge.
Holding “controllable” conditions (ambient temperature, damper position) fixed while adjusting refrigerant charge affected unit performance non-linearly. For each parameter researched (EIR, Total Capacity, and Sensible Capacity), two separate regressions were developed - one regression formula for overcharged systems (>0%, or “Over”) and one formula for undercharged systems (<0%, or “Under”).19 Additionally, regressions were developed separately for the following system conditions: TXV, Non-TXV systems with one compressor (“NT1”) and Non-TXV systems with dual compressors (“NT2”).
For each parameter researched (EIR, Total Capacity, and Sensible Capacity), two separate regressions were developed - one regression formula for overcharged systems (>0%, or “Over”) and one formula for undercharged systems (<0%, or “Under”). Additionally, regressions were developed separately for the following system conditions: TXV, Non-TXV systems with one compressor (“NT1”) and Non-TXV systems with dual compressors (“NT2”).
Figure 14 below illustrates modeled relative efficiency impact in EIR due to refrigerant charge being different from factory levels. It shows lab results for all available distinct data sets where OAT was held at 95°F. OAT of 95°F was chosen because this temperature matches the conditions for operating requirements for publishing efficiency ratings for packaged air conditioning units.20
There is an observable effect that under-charging has a larger relative impact on unit efficiency than over-charging. Previous literature and laboratory testing show older fixed-geometry (non-TXV) units demonstrating where under and overcharging had similar effects, but in the non-TXV commercial package units tested more recently the non-TXV units exhibit performance much more like TXV units.
For each parameter researched (EIR, Total Capacity, and Sensible Capacity), two separate regressions were developed - one regression formula for overcharged systems (>0%, or “Over”) and one formula for undercharged systems (<0%, or “Under”). Additionally, regressions were developed separately for the following system types: TXV, Non-TXV systems with one compressor (“NT1”) and Non-TXV systems with dual compressors (“NT2”). The regression coefficients are listed below in Table 18. These coefficients are also displayed in Figure 14, Figure 15, and Figure 16.
Refrigerant charge also has a non-linear correlation to unit total capacity and sensible capacity21. Similar to unit efficiency, an under-charged system will typically have a greater impact on system total capacity and sensible capacity compared with an over-charged system, as shown in Figure 15 and Figure 16. The laboratory test results also appear to suggest total and sensible capacities are affected comparably close.
The equations shown in the figures above are used to take field measurements of charge differences as inputs and estimate efficiency and capacity changes and then simulate the energy savings resulting from the performance improvements under various building type and climate conditions.
19 EIR is a DOE-2 keyword input that designates a system’s ratio of electric input power to capacity (the inverse of COP, a dimensionless factor). EIR does not include the system’s air handler fan power so it is a desirable metric to use for performance changes due to refrigerant charge adjustments (which affects condenser unit efficiency)
20 ANSI/AHRI Standard 210/240. 21 An air conditioner lowers the temperature of air and de-humidifies the air. The total amount of energy removed for cooling and de-humidifying is
the total capacity. The amount of energy only going toward lowering temperature is the sensible capacity, and the amount of energy used for de-humidification is the latent capacity.
DNV GL – www.dnvgl.com 4/1/16 Page 44
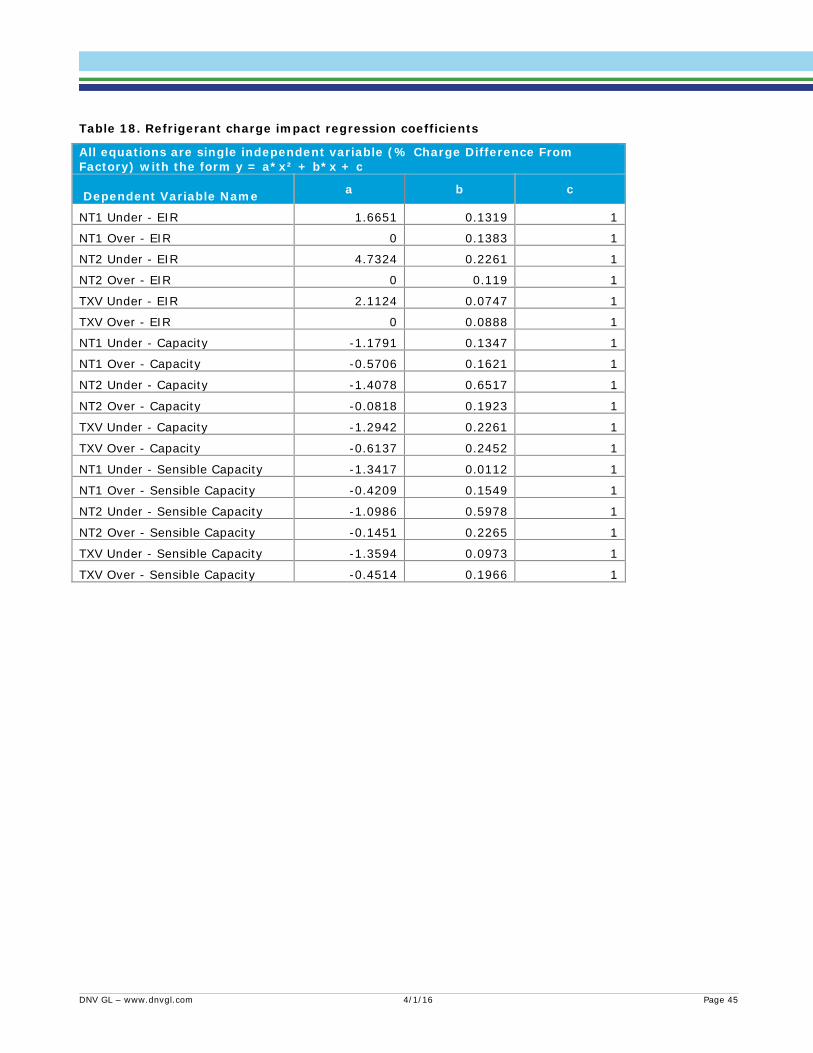
Table 18. Refrigerant charge impact regression coefficients
All equations are single independent variable (% Charge Difference From Factory) with the form y = a*x² + b*x + c
Dependent Variable Name a b c
NT1 Under - EIR 1.6651 0.1319 1
NT1 Over - EIR 0 0.1383 1
NT2 Under - EIR 4.7324 0.2261 1
NT2 Over - EIR 0 0.119 1
TXV Under - EIR 2.1124 0.0747 1
TXV Over - EIR 0 0.0888 1
NT1 Under - Capacity -1.1791 0.1347 1
NT1 Over - Capacity -0.5706 0.1621 1
NT2 Under - Capacity -1.4078 0.6517 1
NT2 Over - Capacity -0.0818 0.1923 1
TXV Under - Capacity -1.2942 0.2261 1
TXV Over - Capacity -0.6137 0.2452 1
NT1 Under - Sensible Capacity -1.3417 0.0112 1
NT1 Over - Sensible Capacity -0.4209 0.1549 1
NT2 Under - Sensible Capacity -1.0986 0.5978 1
NT2 Over - Sensible Capacity -0.1451 0.2265 1
TXV Under - Sensible Capacity -1.3594 0.0973 1
TXV Over - Sensible Capacity -0.4514 0.1966 1
DNV GL – www.dnvgl.com 4/1/16 Page 45
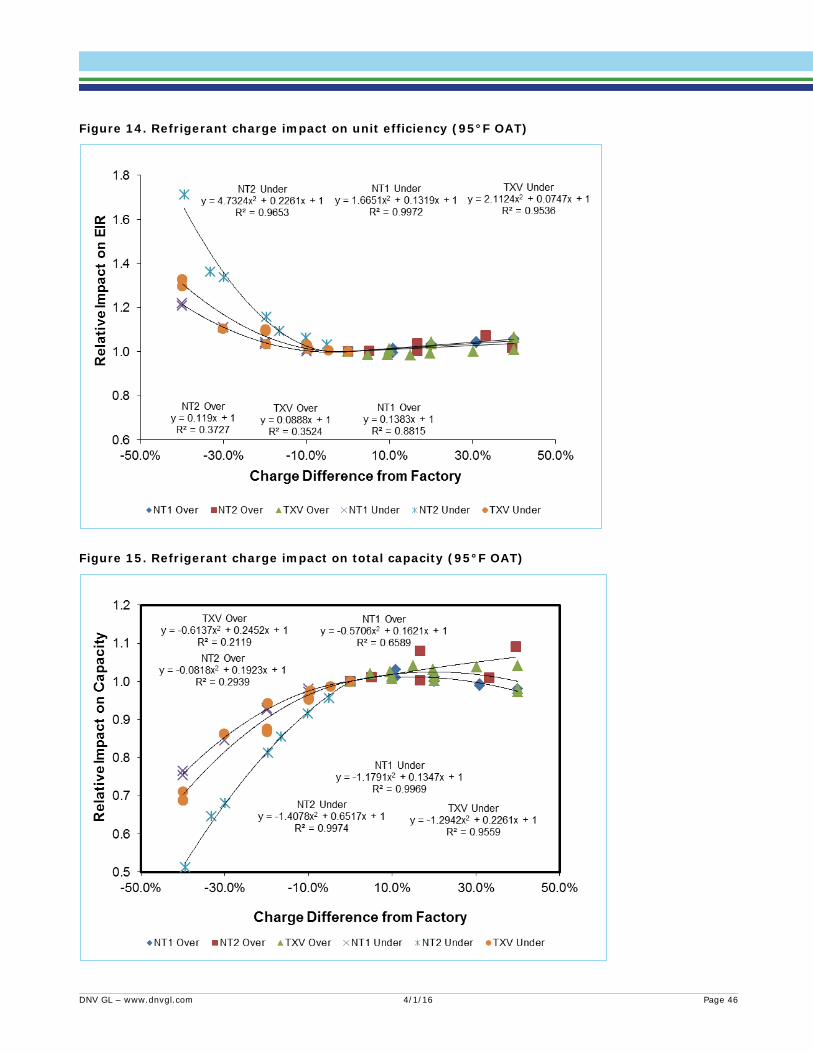
Figure 14. Refrigerant charge impact on unit efficiency (95°F OAT)
Figure 15. Refrigerant charge impact on total capacity (95°F OAT)
DNV GL – www.dnvgl.com 4/1/16 Page 46

Figure 16. Refrigerant charge impact on sensible capacity (95°F OAT)
Field results of measured refrigerant charge 4.2.3Refrigerant weigh-out tests were conducted in order to measure the amount of refrigerant in program-participating units. The charge added or removed from the system recorded by the implementer was subtracted from the refrigerant charge found in the system to determine the starting condition of the refrigerant charge when the implementing technician arrived on site. An important assumption made for the field data is that the refrigerant charge measured during the post-treatment evaluation period is considered to be equivalent to the amount refrigerant charge left by the implementer when the unit was serviced. Data from several units with significant observed leakage were omitted from the evaluation set.
DNV GL recognizes that there could have been up to a three-year lag time between when the technician left the site and when we arrived and that there could have been changes in the system during this time. In fact, anecdotal evidence collected from site contacts during several field visits suggests that repair was needed after units were serviced through the program, so a non-program contractor was called in to restore charge to proper levels. Future evaluation efforts should endeavor to reduce the time lapse between program installation of the measure and evaluation measurement and verification visits.
The following data were critical to estimating the pre- and post-treatment charge percent relative to the factory-recommended charge:
• Unit model number and/or observed nameplate factory charge • Evaluator-observed weigh in of system refrigerant (for each circuit)
DNV GL – www.dnvgl.com 4/1/16 Page 47
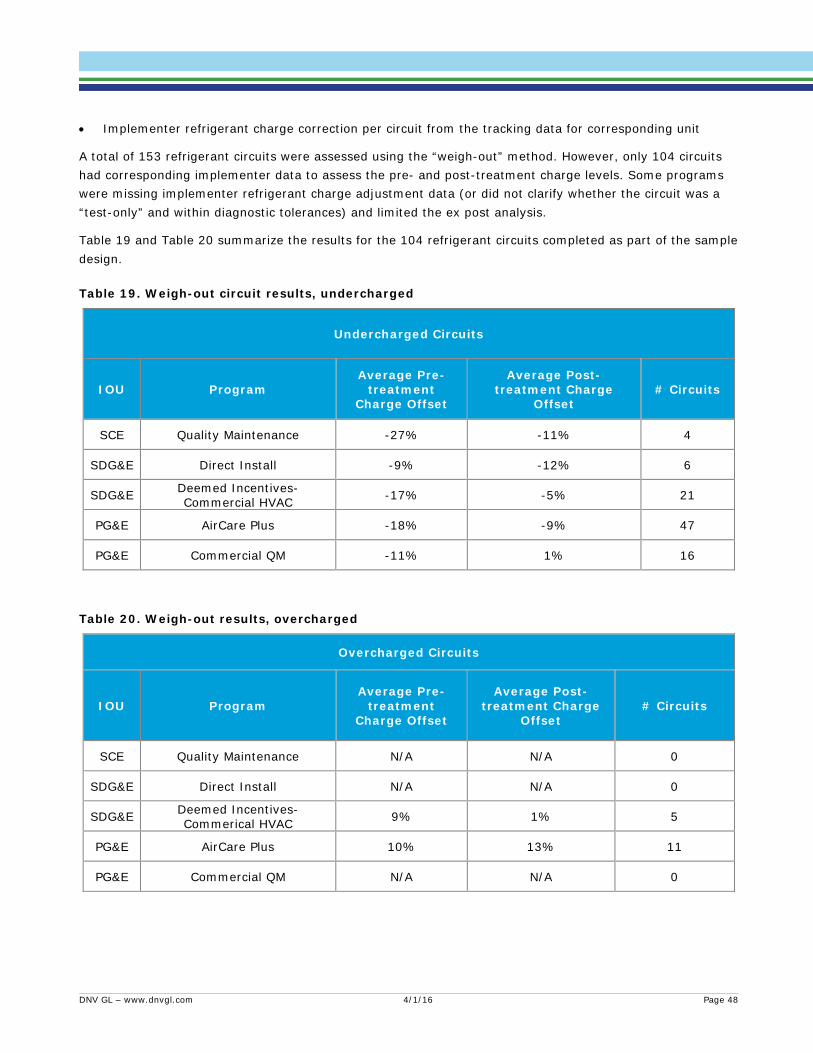
• Implementer refrigerant charge correction per circuit from the tracking data for corresponding unit
A total of 153 refrigerant circuits were assessed using the “weigh-out” method. However, only 104 circuits had corresponding implementer data to assess the pre- and post-treatment charge levels. Some programs were missing implementer refrigerant charge adjustment data (or did not clarify whether the circuit was a “test-only” and within diagnostic tolerances) and limited the ex post analysis.
Table 19 and Table 20 summarize the results for the 104 refrigerant circuits completed as part of the sample design.
Table 19. Weigh-out circuit results, undercharged
Undercharged Circuits
IOU Program Average Pre-
treatment Charge Offset
Average Post-treatment Charge
Offset # Circuits
SCE Quality Maintenance -27% -11% 4
SDG&E Direct Install -9% -12% 6
SDG&E Deemed Incentives-Commercial HVAC -17% -5% 21
PG&E AirCare Plus -18% -9% 47
PG&E Commercial QM -11% 1% 16
Table 20. Weigh-out results, overcharged
Overcharged Circuits
IOU Program Average Pre-
treatment Charge Offset
Average Post-treatment Charge
Offset # Circuits
SCE Quality Maintenance N/A N/A 0
SDG&E Direct Install N/A N/A 0
SDG&E Deemed Incentives-Commerical HVAC 9% 1% 5
PG&E AirCare Plus 10% 13% 11
PG&E Commercial QM N/A N/A 0
DNV GL – www.dnvgl.com 4/1/16 Page 48
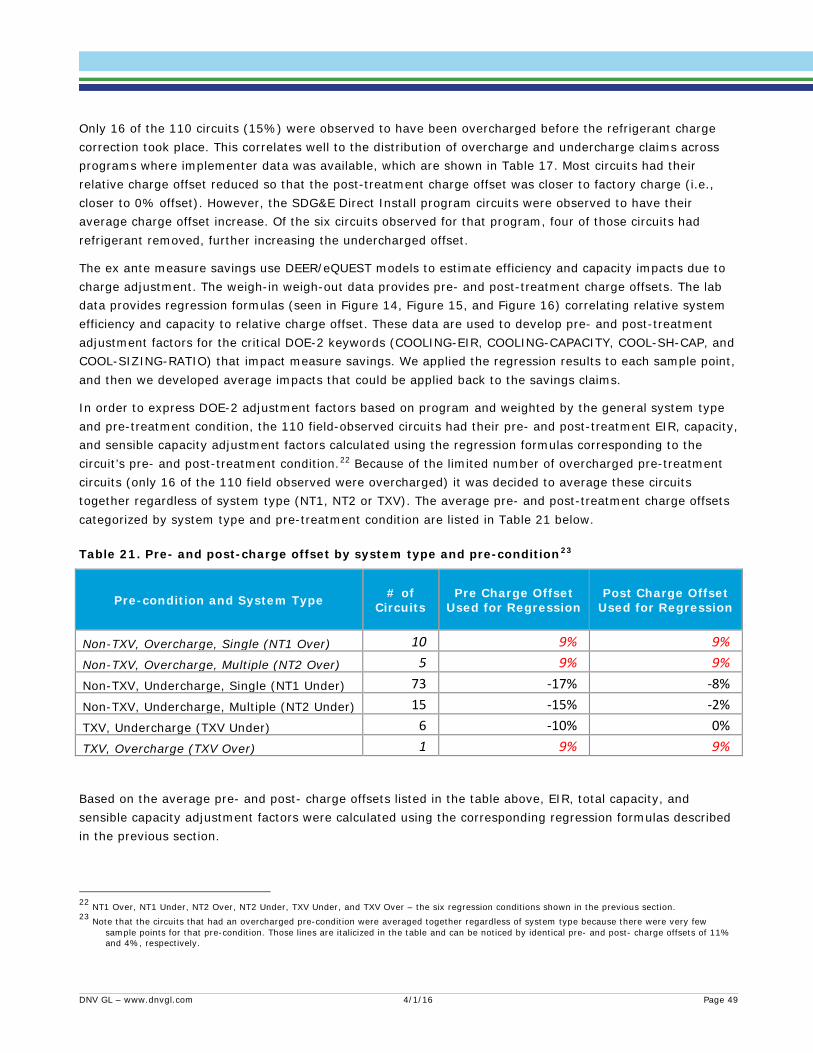
Only 16 of the 110 circuits (15%) were observed to have been overcharged before the refrigerant charge correction took place. This correlates well to the distribution of overcharge and undercharge claims across programs where implementer data was available, which are shown in Table 17. Most circuits had their relative charge offset reduced so that the post-treatment charge offset was closer to factory charge (i.e., closer to 0% offset). However, the SDG&E Direct Install program circuits were observed to have their average charge offset increase. Of the six circuits observed for that program, four of those circuits had refrigerant removed, further increasing the undercharged offset.
The ex ante measure savings use DEER/eQUEST models to estimate efficiency and capacity impacts due to charge adjustment. The weigh-in weigh-out data provides pre- and post-treatment charge offsets. The lab data provides regression formulas (seen in Figure 14, Figure 15, and Figure 16) correlating relative system efficiency and capacity to relative charge offset. These data are used to develop pre- and post-treatment adjustment factors for the critical DOE-2 keywords (COOLING-EIR, COOLING-CAPACITY, COOL-SH-CAP, and COOL-SIZING-RATIO) that impact measure savings. We applied the regression results to each sample point, and then we developed average impacts that could be applied back to the savings claims.
In order to express DOE-2 adjustment factors based on program and weighted by the general system type and pre-treatment condition, the 110 field-observed circuits had their pre- and post-treatment EIR, capacity, and sensible capacity adjustment factors calculated using the regression formulas corresponding to the circuit’s pre- and post-treatment condition.22 Because of the limited number of overcharged pre-treatment circuits (only 16 of the 110 field observed were overcharged) it was decided to average these circuits together regardless of system type (NT1, NT2 or TXV). The average pre- and post-treatment charge offsets categorized by system type and pre-treatment condition are listed in Table 21 below.
Table 21. Pre- and post-charge offset by system type and pre-condition23
Pre-condition and System Type # of Circuits
Pre Charge Offset Used for Regression
Post Charge Offset Used for Regression
Non-TXV, Overcharge, Single (NT1 Over) 10 9% 9%
Non-TXV, Overcharge, Multiple (NT2 Over) 5 9% 9%
Non-TXV, Undercharge, Single (NT1 Under) 73 -17% -8%
Non-TXV, Undercharge, Multiple (NT2 Under) 15 -15% -2%
TXV, Undercharge (TXV Under) 6 -10% 0%
TXV, Overcharge (TXV Over) 1 9% 9%
Based on the average pre- and post- charge offsets listed in the table above, EIR, total capacity, and sensible capacity adjustment factors were calculated using the corresponding regression formulas described in the previous section.
22 NT1 Over, NT1 Under, NT2 Over, NT2 Under, TXV Under, and TXV Over – the six regression conditions shown in the previous section. 23 Note that the circuits that had an overcharged pre-condition were averaged together regardless of system type because there were very few
sample points for that pre-condition. Those lines are italicized in the table and can be noticed by identical pre- and post- charge offsets of 11% and 4%, respectively.
DNV GL – www.dnvgl.com 4/1/16 Page 49
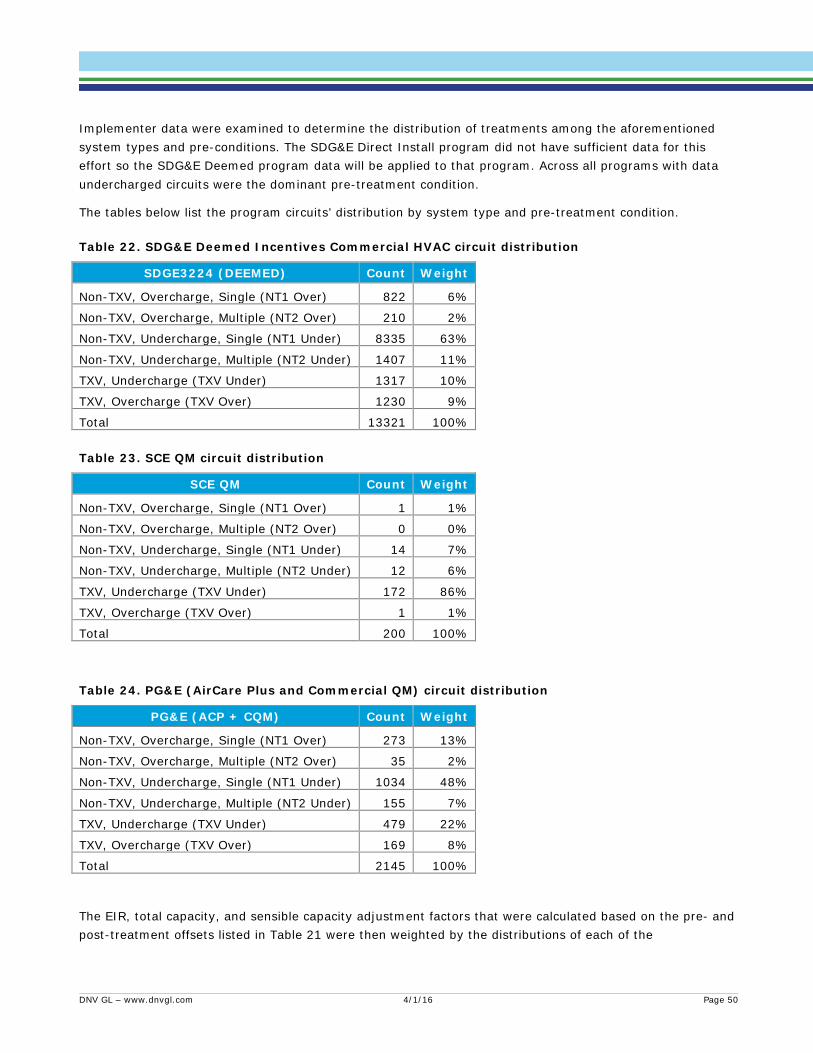
Implementer data were examined to determine the distribution of treatments among the aforementioned system types and pre-conditions. The SDG&E Direct Install program did not have sufficient data for this effort so the SDG&E Deemed program data will be applied to that program. Across all programs with data undercharged circuits were the dominant pre-treatment condition.
The tables below list the program circuits’ distribution by system type and pre-treatment condition.
Table 22. SDG&E Deemed Incentives Commercial HVAC circuit distribution
SDGE3224 (DEEMED) Count Weight
Non-TXV, Overcharge, Single (NT1 Over) 822 6%
Non-TXV, Overcharge, Multiple (NT2 Over) 210 2%
Non-TXV, Undercharge, Single (NT1 Under) 8335 63%
Non-TXV, Undercharge, Multiple (NT2 Under) 1407 11%
TXV, Undercharge (TXV Under) 1317 10%
TXV, Overcharge (TXV Over) 1230 9%
Total 13321 100%
Table 23. SCE QM circuit distribution
SCE QM Count Weight
Non-TXV, Overcharge, Single (NT1 Over) 1 1%
Non-TXV, Overcharge, Multiple (NT2 Over) 0 0%
Non-TXV, Undercharge, Single (NT1 Under) 14 7%
Non-TXV, Undercharge, Multiple (NT2 Under) 12 6%
TXV, Undercharge (TXV Under) 172 86%
TXV, Overcharge (TXV Over) 1 1%
Total 200 100%
Table 24. PG&E (AirCare Plus and Commercial QM) circuit distribution
PG&E (ACP + CQM) Count Weight
Non-TXV, Overcharge, Single (NT1 Over) 273 13%
Non-TXV, Overcharge, Multiple (NT2 Over) 35 2%
Non-TXV, Undercharge, Single (NT1 Under) 1034 48%
Non-TXV, Undercharge, Multiple (NT2 Under) 155 7%
TXV, Undercharge (TXV Under) 479 22%
TXV, Overcharge (TXV Over) 169 8%
Total 2145 100%
The EIR, total capacity, and sensible capacity adjustment factors that were calculated based on the pre- and post-treatment offsets listed in Table 21 were then weighted by the distributions of each of the
DNV GL – www.dnvgl.com 4/1/16 Page 50
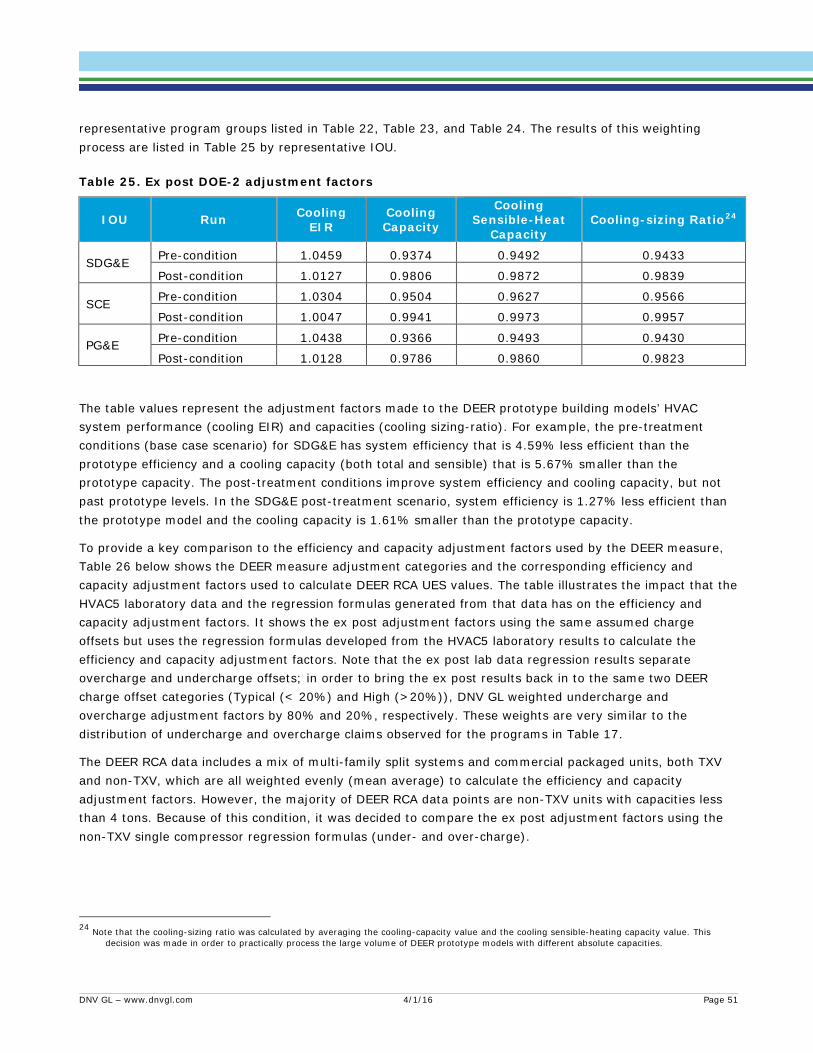
representative program groups listed in Table 22, Table 23, and Table 24. The results of this weighting process are listed in Table 25 by representative IOU.
Table 25. Ex post DOE-2 adjustment factors
IOU Run Cooling EIR
Cooling Capacity
Cooling Sensible-Heat
Capacity Cooling-sizing Ratio24
SDG&E Pre-condition 1.0459 0.9374 0.9492 0.9433
Post-condition 1.0127 0.9806 0.9872 0.9839
SCE Pre-condition 1.0304 0.9504 0.9627 0.9566
Post-condition 1.0047 0.9941 0.9973 0.9957
PG&E Pre-condition 1.0438 0.9366 0.9493 0.9430
Post-condition 1.0128 0.9786 0.9860 0.9823
The table values represent the adjustment factors made to the DEER prototype building models’ HVAC system performance (cooling EIR) and capacities (cooling sizing-ratio). For example, the pre-treatment conditions (base case scenario) for SDG&E has system efficiency that is 4.59% less efficient than the prototype efficiency and a cooling capacity (both total and sensible) that is 5.67% smaller than the prototype capacity. The post-treatment conditions improve system efficiency and cooling capacity, but not past prototype levels. In the SDG&E post-treatment scenario, system efficiency is 1.27% less efficient than the prototype model and the cooling capacity is 1.61% smaller than the prototype capacity.
To provide a key comparison to the efficiency and capacity adjustment factors used by the DEER measure, Table 26 below shows the DEER measure adjustment categories and the corresponding efficiency and capacity adjustment factors used to calculate DEER RCA UES values. The table illustrates the impact that the HVAC5 laboratory data and the regression formulas generated from that data has on the efficiency and capacity adjustment factors. It shows the ex post adjustment factors using the same assumed charge offsets but uses the regression formulas developed from the HVAC5 laboratory results to calculate the efficiency and capacity adjustment factors. Note that the ex post lab data regression results separate overcharge and undercharge offsets; in order to bring the ex post results back in to the same two DEER charge offset categories (Typical (< 20%) and High (>20%)), DNV GL weighted undercharge and overcharge adjustment factors by 80% and 20%, respectively. These weights are very similar to the distribution of undercharge and overcharge claims observed for the programs in Table 17.
The DEER RCA data includes a mix of multi-family split systems and commercial packaged units, both TXV and non-TXV, which are all weighted evenly (mean average) to calculate the efficiency and capacity adjustment factors. However, the majority of DEER RCA data points are non-TXV units with capacities less than 4 tons. Because of this condition, it was decided to compare the ex post adjustment factors using the non-TXV single compressor regression formulas (under- and over-charge).
24 Note that the cooling-sizing ratio was calculated by averaging the cooling-capacity value and the cooling sensible-heating capacity value. This decision was made in order to practically process the large volume of DEER prototype models with different absolute capacities.
DNV GL – www.dnvgl.com 4/1/16 Page 51

Table 26. Comparison of ex ante and ex post DOE-2 adjustment factors for RCA
Refrigerant Adjustment Needed Capacity Multiplier
EIR Multiplier Assumed Charge Offset (%)
Total Sensible
DEER RCA measure (ex ante)25
Typical (< ±20%) 0.893 0.931 1.134 11.7% High (>±20%) 0.832 0.898 1.253 31.8%
HVAC5 laboratory results (ex post) - Assumes non-TXV
Typical (<20%) Undercharge 0.968 0.980 1.007 -11.7%
Typical (<20%) Overcharge 1.011 1.012 1.016 11.7%
High (> 20%) Undercharge 0.838 0.861 1.126 -31.8%
High (> 20%) Overcharge 0.994 1.007 1.044 31.8%
Weighted by Approximate Program Claims (80% undercharged, 20% overcharged)
Typical (< ±20%) 0.977 0.987 1.009 11.7%
High (> ±20%) 0.869 0.890 1.110 31.8%
The DEER RCA measure case scenario assumes optimal charge, or 0% charge offset. Under these conditions, the measure-case DEER RCA adjustment factors are all equal to 1. Using this charge offset as input in to the regression formulas developed from the HVAC5 laboratory data also produces adjustment factor values equal to 1.
Strictly comparing the pre- and post-treatment adjustment factors between what the DEER RCA data produces and what the HVAC5 laboratory data (i.e., ex post) produces at the DEER-assumed pre- and post-treatment charge offsets yields the ratio of ex post to ex ante DOE-2 adjustment factor listed inTable 27 The perfect charge adjustment (0% offset) assumption does not apply in the ex post condition which observed non-optimal charge levels. The table values essentially compare equivalent pre- and post-treatment conditions for the purposes of illustrating the impact of the HVAC5 laboratory data on the base case DOE-2 adjustment factors.
25 The values provided in this table are from the DEER 2011 update documentation that includes workbooks that were unchanged from DEER 2008. The specific workbook referenced for these values is “RCA_DataForRefrigerantChange-CoolingOnly_081004.xls”. The “DOE-2.2 Performance Inputs” worksheet contains the refrigerant adjustment capacity and EIR multipliers all “All units” in Cells L25:N26. The assumed charge offsets were computed by categorizing the charge adjustment values in column B of the aforementioned worksheet.
DNV GL – www.dnvgl.com 4/1/16 Page 52
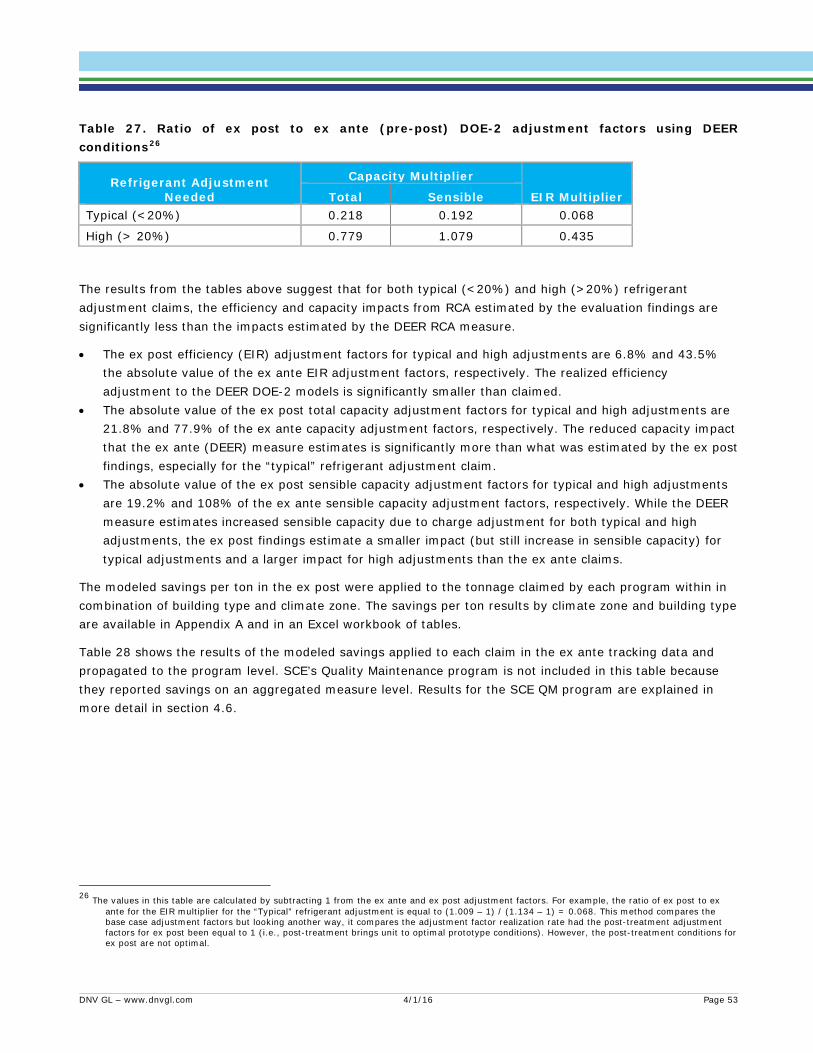
Table 27. Ratio of ex post to ex ante (pre-post) DOE-2 adjustment factors using DEER conditions26
Refrigerant Adjustment Needed
Capacity Multiplier
EIR Multiplier Total Sensible Typical (<20%) 0.218 0.192 0.068
High (> 20%) 0.779 1.079 0.435
The results from the tables above suggest that for both typical (<20%) and high (>20%) refrigerant adjustment claims, the efficiency and capacity impacts from RCA estimated by the evaluation findings are significantly less than the impacts estimated by the DEER RCA measure.
• The ex post efficiency (EIR) adjustment factors for typical and high adjustments are 6.8% and 43.5% the absolute value of the ex ante EIR adjustment factors, respectively. The realized efficiency adjustment to the DEER DOE-2 models is significantly smaller than claimed.
• The absolute value of the ex post total capacity adjustment factors for typical and high adjustments are 21.8% and 77.9% of the ex ante capacity adjustment factors, respectively. The reduced capacity impact that the ex ante (DEER) measure estimates is significantly more than what was estimated by the ex post findings, especially for the “typical” refrigerant adjustment claim.
• The absolute value of the ex post sensible capacity adjustment factors for typical and high adjustments are 19.2% and 108% of the ex ante sensible capacity adjustment factors, respectively. While the DEER measure estimates increased sensible capacity due to charge adjustment for both typical and high adjustments, the ex post findings estimate a smaller impact (but still increase in sensible capacity) for typical adjustments and a larger impact for high adjustments than the ex ante claims.
The modeled savings per ton in the ex post were applied to the tonnage claimed by each program within in combination of building type and climate zone. The savings per ton results by climate zone and building type are available in Appendix A and in an Excel workbook of tables.
Table 28 shows the results of the modeled savings applied to each claim in the ex ante tracking data and propagated to the program level. SCE’s Quality Maintenance program is not included in this table because they reported savings on an aggregated measure level. Results for the SCE QM program are explained in more detail in section 4.6.
26 The values in this table are calculated by subtracting 1 from the ex ante and ex post adjustment factors. For example, the ratio of ex post to ex ante for the EIR multiplier for the “Typical” refrigerant adjustment is equal to (1.009 – 1) / (1.134 – 1) = 0.068. This method compares the base case adjustment factors but looking another way, it compares the adjustment factor realization rate had the post-treatment adjustment factors for ex post been equal to 1 (i.e., post-treatment brings unit to optimal prototype conditions). However, the post-treatment conditions for ex post are not optimal.
DNV GL – www.dnvgl.com 4/1/16 Page 53
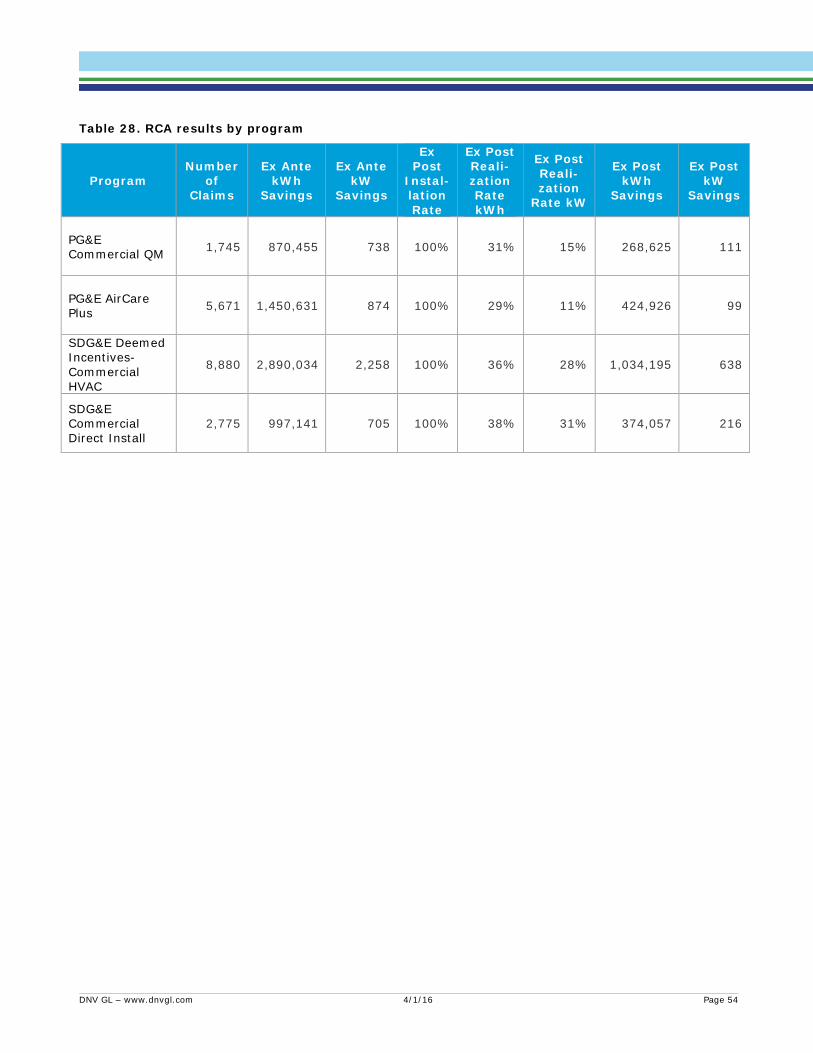
Table 28. RCA results by program
Program Number
of Claims
Ex Ante kWh
Savings
Ex Ante kW
Savings
Ex Post
Instal-lation Rate
Ex Post Reali-zation Rate kWh
Ex Post Reali-zation
Rate kW
Ex Post kWh
Savings
Ex Post kW
Savings
PG&E Commercial QM 1,745 870,455 738 100% 31% 15% 268,625 111
PG&E AirCare Plus 5,671 1,450,631 874 100% 29% 11% 424,926 99
SDG&E Deemed Incentives-Commercial HVAC
8,880 2,890,034 2,258 100% 36% 28% 1,034,195 638
SDG&E Commercial Direct Install
2,775 997,141 705 100% 38% 31% 374,057 216
DNV GL – www.dnvgl.com 4/1/16 Page 54
There are two categories of economizer measures implemented in QM programs for the 2013-14 cycle, economizer retrofit/repair measures and economizer control/adjustment measures. The retrofit/repair measure activity can either be an addition of an economizer to a fixed outside air unit or the repair of a non-functional economizer, or the complete replacement of non-functioning a new economizer and control system. The economizer retrofit/repair measures assume no economizer functionality resulting in a fixed outside air fraction in the pre-treatment case and a functioning economizer in the post case.
The economizer control/adjustment measure categories may include making control settings changes to existing control hardware or replacement of the controller or sensors if the existing controls are not capable of implementing the control setting changes.
The summaries below reflect any applicable changes made to original workpapers based on ex ante review of non-DEER workpapers. The dispositions for these and other measures are posted to the DEER website.
Economizer repair workpaper summary 4.3.1This measure was applicable to any customer who has an existing rooftop unit with a nonfunctional economizer. Technicians repaired common economizer problems and adjusted set points so that the economizer operated as designed in order to optimize the performance of the unit. According to the workpaper, the energy savings for this measure result from repairing the mechanical functionality of an existing economizer. SDG&E and SCE workpapers are based on the PG&E study, all of which are included in this summary.
According to the workpapers, the base case for this measure used DEER models for a retrofit of a new economizer rather than repair of an existing, non-functional economizer. However, the energy savings were assumed to be essentially the same since the performance of a broken economizer is similar to a fixed outside air unit with no economizer. The baseline assumptions for failed economizers were a weighted average assuming that 60% of units failed at the minimum outdoor air setting and 40% of units were failed with outside air dampers in the closed position. A failed-close damper leakage rate of 5% outside air was assumed along with a minimum outside air percentage of 37.5 %. The minimum outside air assumption was derived from minimum outside air ventilation requirement for “Other” building types per Title 24, Part 6, which is 0.15 CFM per square foot and the DEER assumption for HVAC total system airflow, which is 0.4 cfm/sf.
The base case usage for all included building types was determined by degrading the performance of a modified DEER prototype reference model. There were a total of 348 reference models created that represented the measure end state of a functioning economizer with 70% maximum outside air and 73°F economizer dry bulb temperature high limit. The default DEER prototypes used as the reference models for the measure case buildings were based on the “2005DEERNonresidentialPrototypeCharacteristics-051206modified.xls” [7] spreadsheet. The models for packaged VAV, gas packs, and packaged heat pumps with economizers were modified in the following ways:
• Weather file updated from CZ 2 to CZ 2010• System dry-bulb limit set to 73°F for PG&E, 68°F for SCE• System maximum outside air fraction set to 0.70 instead of 1
4.3 Economizer Measures
DNV GL – www.dnvgl.com 4/1/16 Page 55
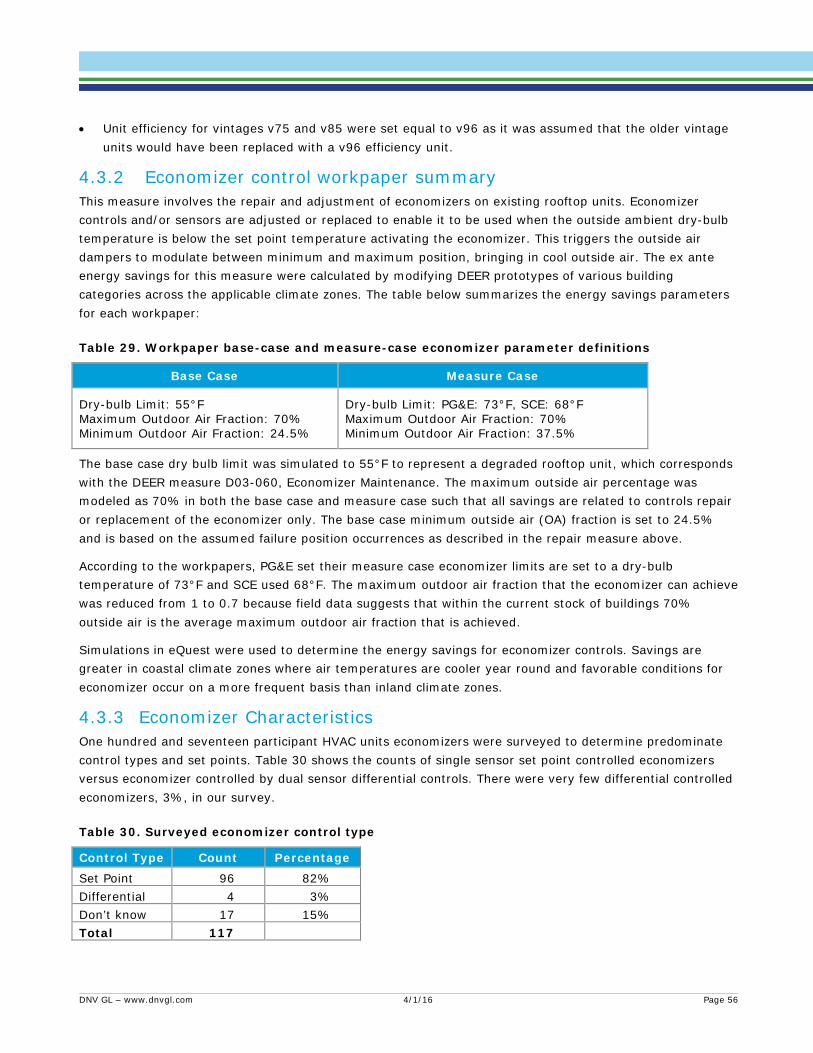
• Unit efficiency for vintages v75 and v85 were set equal to v96 as it was assumed that the older vintageunits would have been replaced with a v96 efficiency unit.
Economizer control workpaper summary 4.3.2This measure involves the repair and adjustment of economizers on existing rooftop units. Economizer controls and/or sensors are adjusted or replaced to enable it to be used when the outside ambient dry-bulb temperature is below the set point temperature activating the economizer. This triggers the outside air dampers to modulate between minimum and maximum position, bringing in cool outside air. The ex ante energy savings for this measure were calculated by modifying DEER prototypes of various building categories across the applicable climate zones. The table below summarizes the energy savings parameters for each workpaper:
Table 29. Workpaper base-case and measure-case economizer parameter definitions
Base Case Measure Case
Dry-bulb Limit: 55°F Maximum Outdoor Air Fraction: 70% Minimum Outdoor Air Fraction: 24.5%
Dry-bulb Limit: PG&E: 73°F, SCE: 68°F Maximum Outdoor Air Fraction: 70% Minimum Outdoor Air Fraction: 37.5%
The base case dry bulb limit was simulated to 55°F to represent a degraded rooftop unit, which corresponds with the DEER measure D03-060, Economizer Maintenance. The maximum outside air percentage was modeled as 70% in both the base case and measure case such that all savings are related to controls repair or replacement of the economizer only. The base case minimum outside air (OA) fraction is set to 24.5% and is based on the assumed failure position occurrences as described in the repair measure above.
According to the workpapers, PG&E set their measure case economizer limits are set to a dry-bulb temperature of 73°F and SCE used 68°F. The maximum outdoor air fraction that the economizer can achieve was reduced from 1 to 0.7 because field data suggests that within the current stock of buildings 70% outside air is the average maximum outdoor air fraction that is achieved.
Simulations in eQuest were used to determine the energy savings for economizer controls. Savings are greater in coastal climate zones where air temperatures are cooler year round and favorable conditions for economizer occur on a more frequent basis than inland climate zones.
Economizer Characteristics 4.3.3One hundred and seventeen participant HVAC units economizers were surveyed to determine predominate control types and set points. Table 30 shows the counts of single sensor set point controlled economizers versus economizer controlled by dual sensor differential controls. There were very few differential controlled economizers, 3%, in our survey.
Table 30. Surveyed economizer control type
Control Type Count Percentage
Set Point 96 82% Differential 4 3% Don’t know 17 15% Total 117
DNV GL – www.dnvgl.com 4/1/16 Page 56
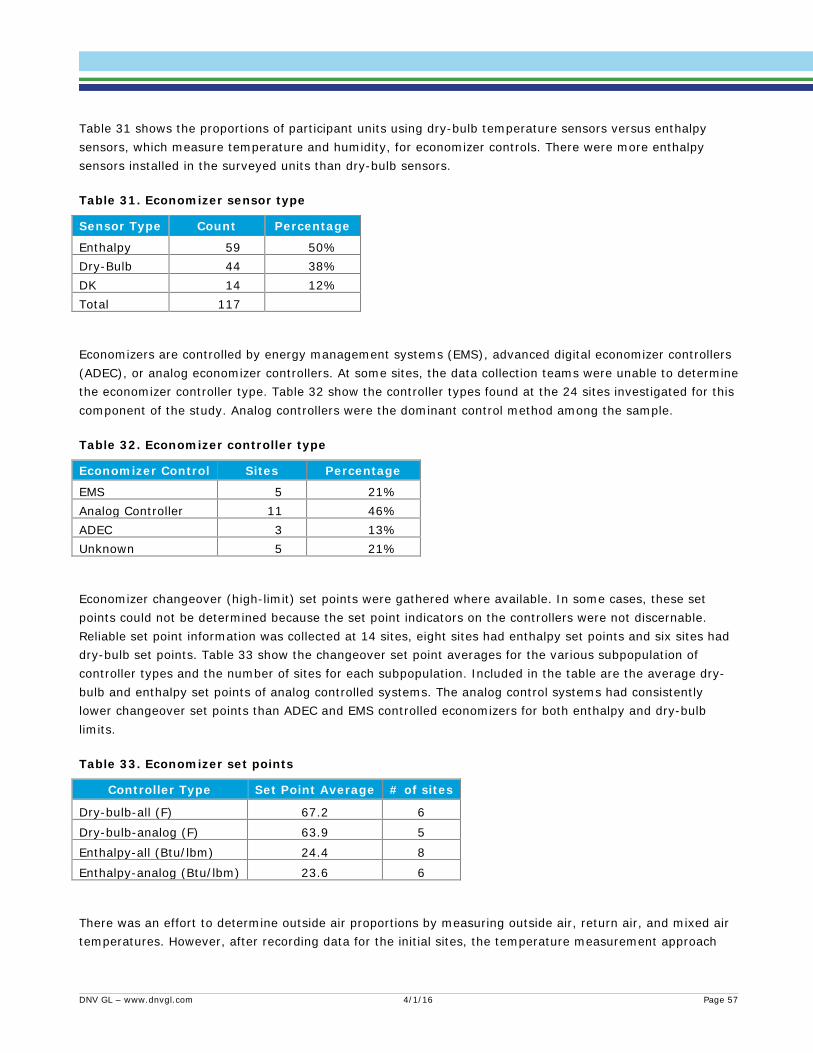
Table 31 shows the proportions of participant units using dry-bulb temperature sensors versus enthalpy sensors, which measure temperature and humidity, for economizer controls. There were more enthalpy sensors installed in the surveyed units than dry-bulb sensors.
Table 31. Economizer sensor type
Sensor Type Count Percentage
Enthalpy 59 50% Dry-Bulb 44 38% DK 14 12% Total 117
Economizers are controlled by energy management systems (EMS), advanced digital economizer controllers (ADEC), or analog economizer controllers. At some sites, the data collection teams were unable to determine the economizer controller type. Table 32 show the controller types found at the 24 sites investigated for this component of the study. Analog controllers were the dominant control method among the sample.
Table 32. Economizer controller type
Economizer Control Sites Percentage
EMS 5 21% Analog Controller 11 46% ADEC 3 13% Unknown 5 21%
Economizer changeover (high-limit) set points were gathered where available. In some cases, these set points could not be determined because the set point indicators on the controllers were not discernable. Reliable set point information was collected at 14 sites, eight sites had enthalpy set points and six sites had dry-bulb set points. Table 33 show the changeover set point averages for the various subpopulation of controller types and the number of sites for each subpopulation. Included in the table are the average dry-bulb and enthalpy set points of analog controlled systems. The analog control systems had consistently lower changeover set points than ADEC and EMS controlled economizers for both enthalpy and dry-bulb limits.
Table 33. Economizer set points
Controller Type Set Point Average # of sites
Dry-bulb-all (F) 67.2 6 Dry-bulb-analog (F) 63.9 5 Enthalpy-all (Btu/lbm) 24.4 8
Enthalpy-analog (Btu/lbm) 23.6 6
There was an effort to determine outside air proportions by measuring outside air, return air, and mixed air temperatures. However, after recording data for the initial sites, the temperature measurement approach
DNV GL – www.dnvgl.com 4/1/16 Page 57

was abandoned due to concerns that stratification in the mixed air chamber made the mixed air temperature measurements unreliable.
In the research plan, we stated our intent was to collect field data on the following parameters, compare it with ex ante assumptions, and adjust these parameters in the ex post model where necessary. The parameters were as follows:
• Minimum outside air, MIN-OA-AIR• Maximum outside air, MAX-OA-AIR• Economizer lockout temperature. LOW-LIMIT-T• Changeover set point, ENTHALPY-LIMIT or DRY-BULB-LIMIT
Minimum OAT was not measured during field data collection with any degree of confidence and the lab results did not provide any additional information that could be used to improve the minimum outside air percentage estimates. The ex ante pre-treatment proportion of 24% and the post-treatment percentage of 37.5% are reasonable and we have no data to contradict or improve on these assumptions. The 37.5% could be a high estimate, but a high minimum OA percentage make for a conservative economizer savings estimate. Since the difference between minimum OA, 37.5% and maximum OA, 70% is only 32.5%, this reduces the economizer energy savings when compared to more typical calculations that assume higher maximum outside air percentages and lower minimum outside air percentages. Since the minimum outside air ex ante assumptions are both reasonable and conservative, we do not believe there is justification to adjust the minimum outside air percentages in the ex post models.
Likewise, the maximum outside air percentage was not measured and the 70% is a more realistic and conservative assumption than is typically used in energy savings calculation where 100% is often used. Similar to the minimum outside air, we see no justification in adjusting the maximum outside air assumption for the ex post simulation models.
Low limit or economizer lockout set points were not used or were not available for most units in the economizer survey. The ex ante assumption was that there was no lockout temperature which was confirmed by our data collection. Therefore no adjustments for the ex post models were necessary.
As described above, the changeover set points, enthalpy or dry-bulb limits, are the set points that when exceeded by temperature or enthalpy, returns the economizer damper to the minimum position. According to the workpapers, SCE modeled the post-treatment case with a 68°F-changeover setpoint. This agrees within uncertainty with the average of 67.2°F average dry-bulb set point from the field data. Therefore, no adjustments to the ex post models are appropriate or necessary. Conversely, PG&E modeled the post-treatment case with a 73°F changeover set point. Although this is a higher set point than we found in the field, we are not confident in the field data results to adjust this parameter in the ex post models. The field data sample is small, dry-bulb set points were collected for only six sites, and only two of those sites were site in PG&E territory.
Ex post methodology 4.3.4The ex post methodology approach for economizer measures consists of developing installation rates based upon the results of functional testing and applying the installation rate to the ex ante savings values. Installation rates were developed at the site level and are projected to the population. The ex ante UES assumptions are reasonable and there were insufficient data on control set point changes to improve upon
DNV GL – www.dnvgl.com 4/1/16 Page 58
the ex ante calculation assumptions. Therefore there were no adjustments made to the ex ante models for the economizer measures.
During the on-site inspections, functional testing of the economizers was performed to determine if the economizers were operating properly. Simply, the number of functioning economizers divided by the number of economizers tested is the site-level installation rate. The site level installation rates were rolled up to the program level, and program-level results were combined to create a statewide installation rate.
During the inspections the surveyors noted the unit nameplate data, economizer characteristics (sensor types, set points, control systems, etc.), building types, and operating schedules. These were compared with the ex ante assumptions. No significant differences were found between the sample as found characteristics and the ex ante assumptions. Therefore, in the absence of any adjustment to the UES, the installation rate for these economizer measures is also the realization rate. The achieved sample size for functional testing only allowed for an installation rate adjustment at this time. Additional data are being collected in 2016 to gather more economizer and thermostat control settings to support future updates to ex ante simulation model parameters and UES assumptions. The economizer field-collected data is provided in Appendix E.
Installation rate using functional testing results 4.3.5When functioning properly, economizer dampers will open when the outside conditions are favorable and the system is calling for cooling. The dampers of a properly functioning economizer should return to the minimum outside air position when the system is operational and not calling for cooling or when conditions are not favorable. If the cooling loads are not met by the economizer, the compressor(s) will engage to meet the cooling needs, and the dampers may adjust to a minimum or an intermediate position depending on the control strategy. The dampers should return to the fully closed position when the unit is not in operation. Typically, when economizers fail, the outside air damper will remain stuck in one position, and will not move under any circumstances.
The economizer functional testing in this evaluation was performed according to manufacturer protocols where available. Many HVAC units had a “test mode” where the unit can be overridden into economizer mode (dampers open) even when conditions are not favorable. Units from one specific manufacturer, for example, were cycled through all operational modes: fan only, economizer mode, one compressor cooling, two compressor cooling, and heating mode by using a “jumper wire” between the test terminals. Other units were equipped with ADEC that have an integrated test mode to perform this actuator test. If the economizer dampers did not open during test mode, it is likely a problem with linkage, actuators or damper motor and is considered a non-functioning economizer for the purpose of the study. Likewise, there are cases where the economizer dampers are stuck and in a fully or partially open position which also constitutes actuator functionality failure.
However, if the economizer opened during test mode, it does not necessarily mean that the economizer was fully functional because there may be problems with the outside air sensor or other components of the economizer control system.
Several methods were used to test the sensors and control system functionality. These included cooling the outside air sensor with either cold spray, or a cold pack until it reached a temperature below the changeover set point. Another sensor/control system test involved manipulating the set point of the economizer controller such that the outside air temperature or enthalpy was below the set point. Other testing procedures included emulating a temperature or enthalpy sensor signal with a decade box (for resistance signals) or a loop calibrator (for 4 mA–20 mA signals). During this testing, the unit needed to be calling for
DNV GL – www.dnvgl.com 4/1/16 Page 59
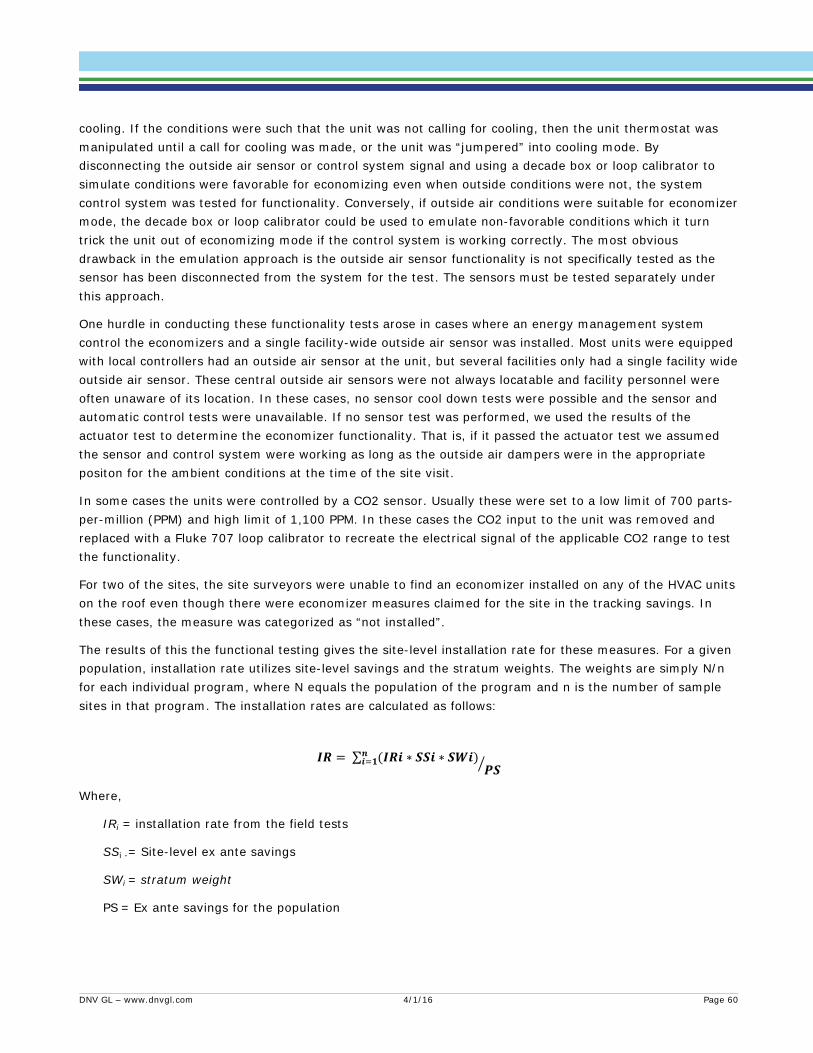
cooling. If the conditions were such that the unit was not calling for cooling, then the unit thermostat was manipulated until a call for cooling was made, or the unit was “jumpered” into cooling mode. By disconnecting the outside air sensor or control system signal and using a decade box or loop calibrator to simulate conditions were favorable for economizing even when outside conditions were not, the system control system was tested for functionality. Conversely, if outside air conditions were suitable for economizer mode, the decade box or loop calibrator could be used to emulate non-favorable conditions which it turn trick the unit out of economizing mode if the control system is working correctly. The most obvious drawback in the emulation approach is the outside air sensor functionality is not specifically tested as the sensor has been disconnected from the system for the test. The sensors must be tested separately under this approach.
One hurdle in conducting these functionality tests arose in cases where an energy management system control the economizers and a single facility-wide outside air sensor was installed. Most units were equipped with local controllers had an outside air sensor at the unit, but several facilities only had a single facility wide outside air sensor. These central outside air sensors were not always locatable and facility personnel were often unaware of its location. In these cases, no sensor cool down tests were possible and the sensor and automatic control tests were unavailable. If no sensor test was performed, we used the results of the actuator test to determine the economizer functionality. That is, if it passed the actuator test we assumed the sensor and control system were working as long as the outside air dampers were in the appropriate positon for the ambient conditions at the time of the site visit.
In some cases the units were controlled by a CO2 sensor. Usually these were set to a low limit of 700 parts-per-million (PPM) and high limit of 1,100 PPM. In these cases the CO2 input to the unit was removed and replaced with a Fluke 707 loop calibrator to recreate the electrical signal of the applicable CO2 range to test the functionality.
For two of the sites, the site surveyors were unable to find an economizer installed on any of the HVAC units on the roof even though there were economizer measures claimed for the site in the tracking savings. In these cases, the measure was categorized as “not installed”.
The results of this the functional testing gives the site-level installation rate for these measures. For a given population, installation rate utilizes site-level savings and the stratum weights. The weights are simply N/n for each individual program, where N equals the population of the program and n is the number of sample sites in that program. The installation rates are calculated as follows:
𝑰𝑰𝑰𝑰 = ∑ (𝑰𝑰𝑰𝑰𝑰𝑰 ∗ 𝑺𝑺𝑺𝑺𝑰𝑰 ∗ 𝑺𝑺𝑺𝑺𝑰𝑰𝒏𝒏𝑰𝑰=𝟏𝟏 )
𝑷𝑷𝑺𝑺�
Where,
IRi = installation rate from the field tests
SSi -= Site-level ex ante savings
SWi = stratum weight
PS = Ex ante savings for the population
DNV GL – www.dnvgl.com 4/1/16 Page 60

Table 34. Results of functional testing to determine installation rates
Site ID Participant
Units on Site
Number of Units Tested
Number of Units Verified
to be Functional
Site Installation
Rate
Case Weight CW*IR
Population Installation
Rate
PG&E Commercial QM
DNVGL22 15 7 3 0.43 8 3.43
DNVGL37 1 1 0 0.00 8 0.00 DNVGL42 2 2 0 0.00 8 0.00 DNVGL11 2 1 0 0.00 8 0.00 DNVGL09 2 2 2 1.00 8 8.00
DNVGL52 11 5 3 0.60 8 4.80 DNVGL33 1 1 1 1.00 8 8.00
43% PG&E AirCare Plus
DNVGL13 31 10 0 0.00 22.3 0.00 DNVGL44 43 8 3 0.38 22.3 8.38 DNVGL16 27 4 4 1.00 22.3 22.33 DNVGL38 45 15 1 0.07 22.3 1.49
DNVGL_B_071 4 4 3 0.75 22.3 16.75 44%
SCE Quality Maintenance
DNVGL45 5 5 4 0.80 6.8 5.47
DNVGL03 28 4 3 0.75 6.8 5.13 DNVGL47 32 4 3 0.75 6.8 5.13 DNVGL08 9 5 4 0.80 6.8 5.47 DNVGL32 2 2 2 1.00 6.8 6.83
DNVGL_B_016 4 2 2 1.00 6.8 6.83 DNVGL12 3 2 2 1.00 6.8 6.83 DNVGL50 10 4 3 0.75 6.8 5.13 DNVGL_B_021 117 27 27 1.00 6.8 6.83
DNVGL34 2 2 0 0.00 6.8 0.00 DNVGL35 2 2 2 1.00 6.8 6.83 DNVGL36 2 2 2 1 6.8 6.83
82%
Totals 15.1 249.7 140.5 56%
DNV GL – www.dnvgl.com 4/1/16 Page 61
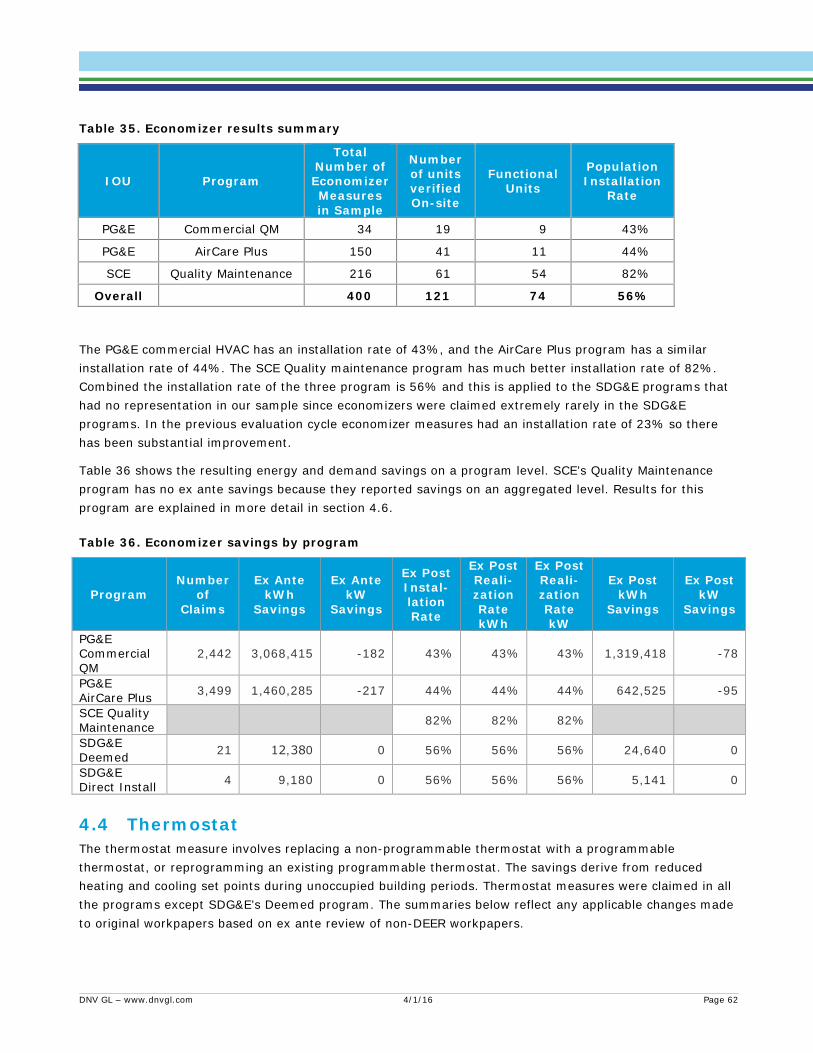
Table 35. Economizer results summary
IOU Program
Total Number of Economizer Measures in Sample
Number of units verified On-site
Functional Units
Population Installation
Rate
PG&E Commercial QM 34 19 9 43%
PG&E AirCare Plus 150 41 11 44%
SCE Quality Maintenance 216 61 54 82%
Overall 400 121 74 56%
The PG&E commercial HVAC has an installation rate of 43%, and the AirCare Plus program has a similar installation rate of 44%. The SCE Quality maintenance program has much better installation rate of 82%. Combined the installation rate of the three program is 56% and this is applied to the SDG&E programs that had no representation in our sample since economizers were claimed extremely rarely in the SDG&E programs. In the previous evaluation cycle economizer measures had an installation rate of 23% so there has been substantial improvement.
Table 36 shows the resulting energy and demand savings on a program level. SCE’s Quality Maintenance program has no ex ante savings because they reported savings on an aggregated level. Results for this program are explained in more detail in section 4.6.
Table 36. Economizer savings by program
Program Number
of Claims
Ex Ante kWh
Savings
Ex Ante kW
Savings
Ex Post Instal-lation Rate
Ex Post Reali-zation Rate kWh
Ex Post Reali-zation Rate kW
Ex Post kWh
Savings
Ex Post kW
Savings
PG&E Commercial QM
2,442 3,068,415 -182 43% 43% 43% 1,319,418 -78
PG&E AirCare Plus 3,499 1,460,285 -217 44% 44% 44% 642,525 -95
SCE Quality Maintenance 82% 82% 82%
SDG&E Deemed 21 12,380 0 56% 56% 56% 24,640 0
SDG&E Direct Install 4 9,180 0 56% 56% 56% 5,141 0
The thermostat measure involves replacing a non-programmable thermostat with a programmable thermostat, or reprogramming an existing programmable thermostat. The savings derive from reduced heating and cooling set points during unoccupied building periods. Thermostat measures were claimed in all the programs except SDG&E’s Deemed program. The summaries below reflect any applicable changes made to original workpapers based on ex ante review of non-DEER workpapers.
4.4 Thermostat
DNV GL – www.dnvgl.com 4/1/16 Page 62

Workpaper review: ex ante methodology 4.4.1Across all IOU workpapers, the baseline assumption for thermostat replacement is a non-programmable thermostat and the baseline for thermostat reprogramming is a thermostat with constant heating and cooling set points. The installed measure in both cases is a thermostat with heating set-back and cooling set-up during building non-occupied times. The workpaper temperature set points are listed below by utility:
Table 37. Programmable thermostat workpaper assumptions
Utility Installed thermostat measure specifications for unoccupied building periods
Cooling set point temperature Heating set point temperature SCE27 85F 60F SDG&E28 85F 55F PG&E29 85F 60F
The workpaper methodology calculates energy savings by modeling the energy consumption of the DEER commercial building types in each California climate zone using the eQuest software. We expect the modeling software and prototypes to provide reasonable savings if the baseline and installed thermostat conditions are consistent with the model assumptions. The Disposition published by Energy Division in May 2013 reduces thermostat reprogramming savings using a 0.5 multiplier and thermostat replacement savings by a 0.25 multiplier. The tracking data claims were consistent with the disposition-adjusted thermostat savings across all programs that claimed this measure. This evaluation focuses on verifying that thermostats installed or reprogrammed through the utility rebate programs conform to the assumptions in the thermostat workpapers.
Ex post methodology 4.4.2DNV GL’s evaluation effort focused on determining whether the baseline and installed measure conditions were met at locations where tracking claims were made for thermostat measures. We used a combination of data sources to this end: tracking data, implementer-supplied data and DNVGL field-collected data. DNV GL planned to visit 15 sites with thermostats installed, but the achieved thermostat sample only contained 11 sites. In several cases this was because the building tenant refused us access to the thermostat during the site visit. Because the sample ended up being smaller than planned, and the associated precision of data collected on thermostat characteristics likewise larger, DNV GL used implementer-supplied data to supplement the field results by corroborating the field-collected results where possible, see program-specific data summaries in section 4.4.3. Ultimately, the average field-collected results across all programs was applied across the board to all the programs.
Results 4.4.3A total of 11 sites including 56 thermostat units were evaluated for this measure. The overall site-level installation rate across all programs is 30.1%. The breakdown of sites visited by program is as follows:
27 Workpaper SCE13HC037 Comprehensive Commercial HVAC RTU QM 28 Workpaper WPSDGENRHC0026 Programmable Thermostat 29 Workpaper Unoccupied Building Controls Measure
DNV GL – www.dnvgl.com 4/1/16 Page 63
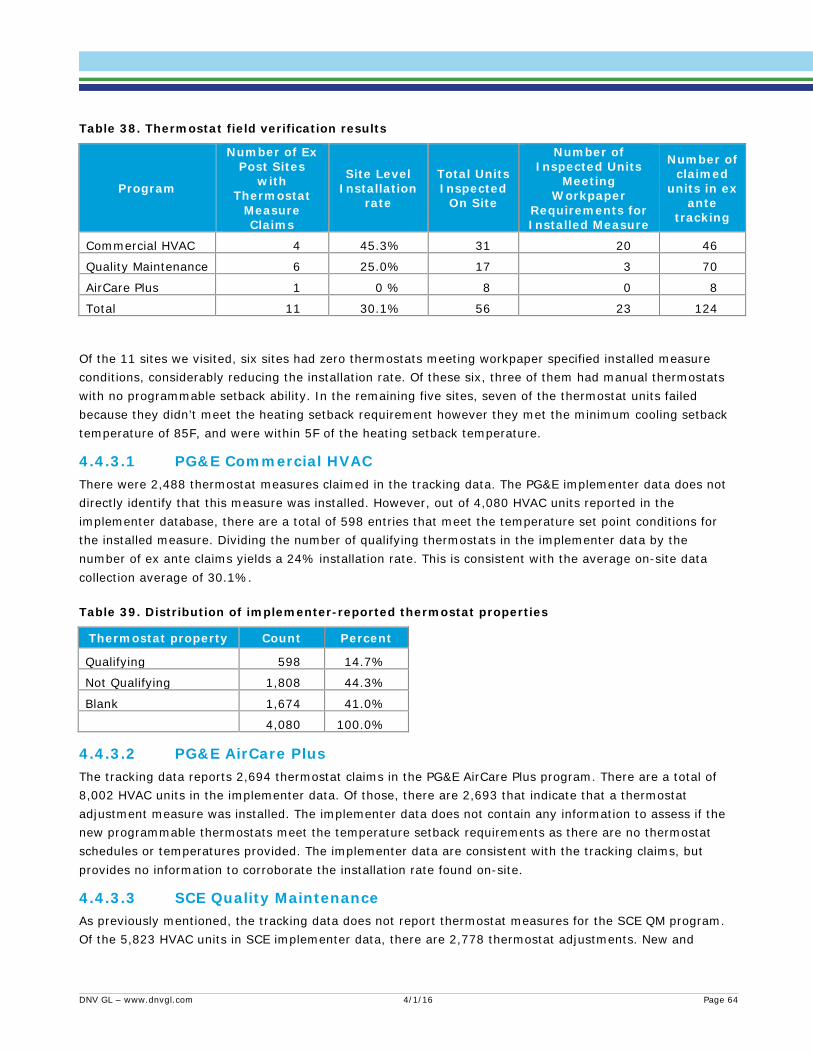
Table 38. Thermostat field verification results
Program
Number of Ex Post Sites
with Thermostat
Measure Claims
Site Level Installation
rate
Total Units Inspected
On Site
Number of Inspected Units
Meeting Workpaper
Requirements for Installed Measure
Number of claimed
units in ex ante
tracking
Commercial HVAC 4 45.3% 31 20 46
Quality Maintenance 6 25.0% 17 3 70
AirCare Plus 1 0 % 8 0 8
Total 11 30.1% 56 23 124
Of the 11 sites we visited, six sites had zero thermostats meeting workpaper specified installed measure conditions, considerably reducing the installation rate. Of these six, three of them had manual thermostats with no programmable setback ability. In the remaining five sites, seven of the thermostat units failed because they didn’t meet the heating setback requirement however they met the minimum cooling setback temperature of 85F, and were within 5F of the heating setback temperature.
4.4.3.1 PG&E Commercial HVAC There were 2,488 thermostat measures claimed in the tracking data. The PG&E implementer data does not directly identify that this measure was installed. However, out of 4,080 HVAC units reported in the implementer database, there are a total of 598 entries that meet the temperature set point conditions for the installed measure. Dividing the number of qualifying thermostats in the implementer data by the number of ex ante claims yields a 24% installation rate. This is consistent with the average on-site data collection average of 30.1%.
Table 39. Distribution of implementer-reported thermostat properties
Thermostat property Count Percent
Qualifying 598 14.7%
Not Qualifying 1,808 44.3%
Blank 1,674 41.0%
4,080 100.0%
4.4.3.2 PG&E AirCare Plus The tracking data reports 2,694 thermostat claims in the PG&E AirCare Plus program. There are a total of 8,002 HVAC units in the implementer data. Of those, there are 2,693 that indicate that a thermostat adjustment measure was installed. The implementer data does not contain any information to assess if the new programmable thermostats meet the temperature setback requirements as there are no thermostat schedules or temperatures provided. The implementer data are consistent with the tracking claims, but provides no information to corroborate the installation rate found on-site.
4.4.3.3 SCE Quality Maintenance As previously mentioned, the tracking data does not report thermostat measures for the SCE QM program. Of the 5,823 HVAC units in SCE implementer data, there are 2,778 thermostat adjustments. New and
DNV GL – www.dnvgl.com 4/1/16 Page 64
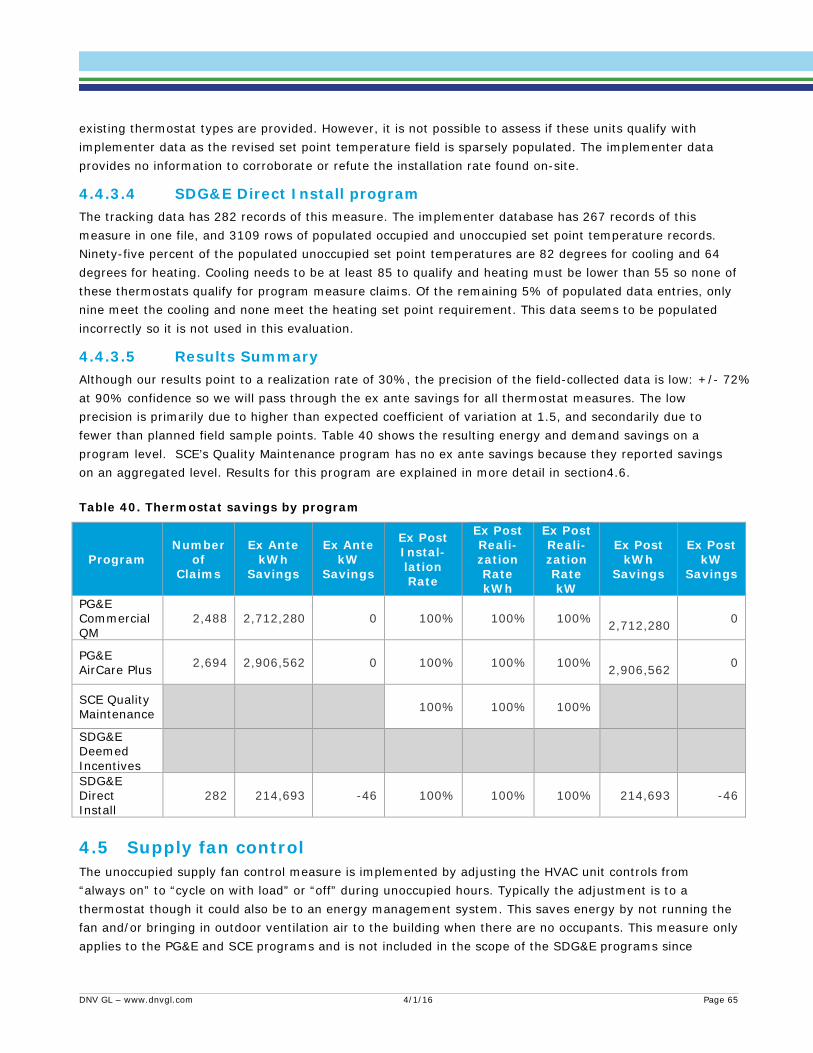
existing thermostat types are provided. However, it is not possible to assess if these units qualify with implementer data as the revised set point temperature field is sparsely populated. The implementer data provides no information to corroborate or refute the installation rate found on-site.
4.4.3.4 SDG&E Direct Install program The tracking data has 282 records of this measure. The implementer database has 267 records of this measure in one file, and 3109 rows of populated occupied and unoccupied set point temperature records. Ninety-five percent of the populated unoccupied set point temperatures are 82 degrees for cooling and 64 degrees for heating. Cooling needs to be at least 85 to qualify and heating must be lower than 55 so none of these thermostats qualify for program measure claims. Of the remaining 5% of populated data entries, only nine meet the cooling and none meet the heating set point requirement. This data seems to be populated incorrectly so it is not used in this evaluation.
4.4.3.5 Results Summary Although our results point to a realization rate of 30%, the precision of the field-collected data is low: +/- 72% at 90% confidence so we will pass through the ex ante savings for all thermostat measures. The low precision is primarily due to higher than expected coefficient of variation at 1.5, and secondarily due to fewer than planned field sample points. Table 40 shows the resulting energy and demand savings on a program level. SCE’s Quality Maintenance program has no ex ante savings because they reported savings on an aggregated level. Results for this program are explained in more detail in section 4.6.
Table 40. Thermostat savings by program
Program Number
of Claims
Ex Ante kWh
Savings
Ex Ante kW
Savings
Ex Post Instal-lation Rate
Ex Post Reali-zation Rate kWh
Ex Post Reali-zation Rate kW
Ex Post kWh
Savings
Ex Post kW
Savings
PG&E Commercial QM
2,488 2,712,280 0 100% 100% 100% 2,712,280 0
PG&E AirCare Plus 2,694 2,906,562 0 100% 100% 100% 2,906,562 0
SCE Quality Maintenance 100% 100% 100%
SDG&E Deemed Incentives SDG&E Direct Install
282 214,693 -46 100% 100% 100% 214,693 -46
The unoccupied supply fan control measure is implemented by adjusting the HVAC unit controls from “always on” to “cycle on with load” or “off” during unoccupied hours. Typically the adjustment is to a thermostat though it could also be to an energy management system. This saves energy by not running the fan and/or bringing in outdoor ventilation air to the building when there are no occupants. This measure only applies to the PG&E and SCE programs and is not included in the scope of the SDG&E programs since
4.5 Supply fan control
DNV GL – www.dnvgl.com 4/1/16 Page 65
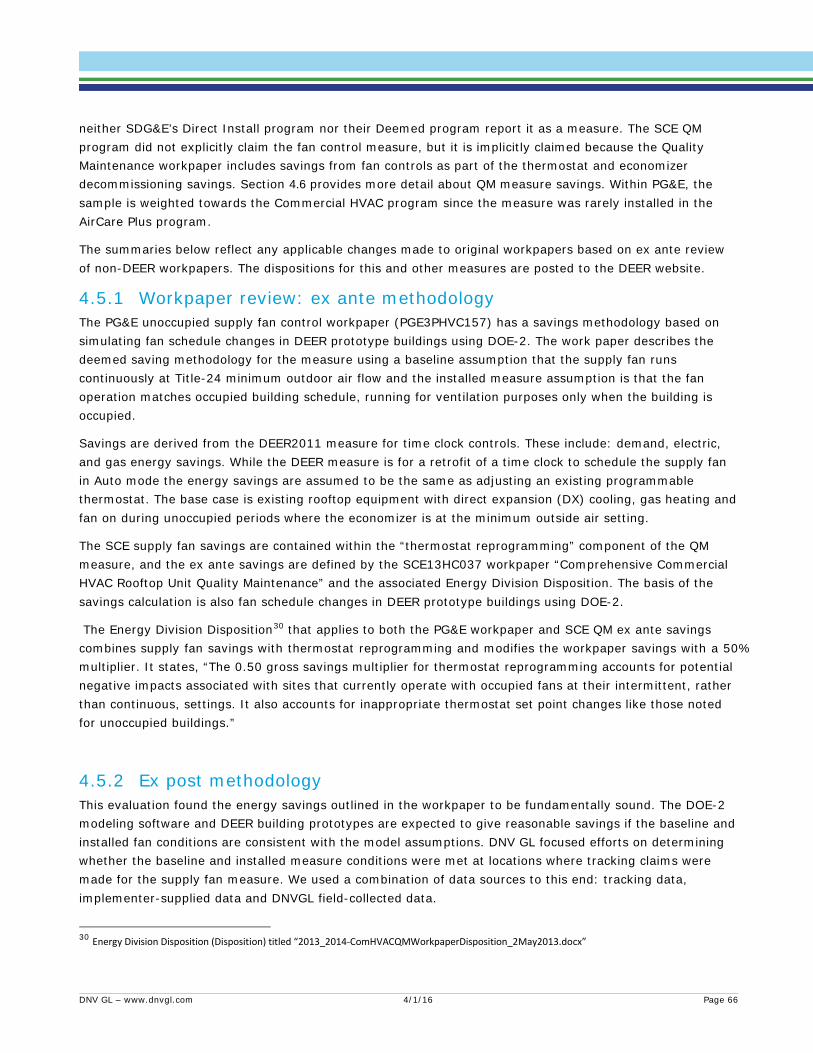
neither SDG&E’s Direct Install program nor their Deemed program report it as a measure. The SCE QM program did not explicitly claim the fan control measure, but it is implicitly claimed because the Quality Maintenance workpaper includes savings from fan controls as part of the thermostat and economizer decommissioning savings. Section 4.6 provides more detail about QM measure savings. Within PG&E, the sample is weighted towards the Commercial HVAC program since the measure was rarely installed in the AirCare Plus program.
The summaries below reflect any applicable changes made to original workpapers based on ex ante review of non-DEER workpapers. The dispositions for this and other measures are posted to the DEER website.
Workpaper review: ex ante methodology 4.5.1The PG&E unoccupied supply fan control workpaper (PGE3PHVC157) has a savings methodology based on simulating fan schedule changes in DEER prototype buildings using DOE-2. The work paper describes the deemed saving methodology for the measure using a baseline assumption that the supply fan runs continuously at Title-24 minimum outdoor air flow and the installed measure assumption is that the fan operation matches occupied building schedule, running for ventilation purposes only when the building is occupied.
Savings are derived from the DEER2011 measure for time clock controls. These include: demand, electric, and gas energy savings. While the DEER measure is for a retrofit of a time clock to schedule the supply fan in Auto mode the energy savings are assumed to be the same as adjusting an existing programmable thermostat. The base case is existing rooftop equipment with direct expansion (DX) cooling, gas heating and fan on during unoccupied periods where the economizer is at the minimum outside air setting.
The SCE supply fan savings are contained within the “thermostat reprogramming” component of the QM measure, and the ex ante savings are defined by the SCE13HC037 workpaper “Comprehensive Commercial HVAC Rooftop Unit Quality Maintenance” and the associated Energy Division Disposition. The basis of the savings calculation is also fan schedule changes in DEER prototype buildings using DOE-2.
The Energy Division Disposition30 that applies to both the PG&E workpaper and SCE QM ex ante savings combines supply fan savings with thermostat reprogramming and modifies the workpaper savings with a 50% multiplier. It states, “The 0.50 gross savings multiplier for thermostat reprogramming accounts for potential negative impacts associated with sites that currently operate with occupied fans at their intermittent, rather than continuous, settings. It also accounts for inappropriate thermostat set point changes like those noted for unoccupied buildings.”
Ex post methodology 4.5.2This evaluation found the energy savings outlined in the workpaper to be fundamentally sound. The DOE-2 modeling software and DEER building prototypes are expected to give reasonable savings if the baseline and installed fan conditions are consistent with the model assumptions. DNV GL focused efforts on determining whether the baseline and installed measure conditions were met at locations where tracking claims were made for the supply fan measure. We used a combination of data sources to this end: tracking data, implementer-supplied data and DNVGL field-collected data.
30 Energy Division Disposition (Disposition) titled “2013_2014-ComHVACQMWorkpaperDisposition_2May2013.docx”
DNV GL – www.dnvgl.com 4/1/16 Page 66
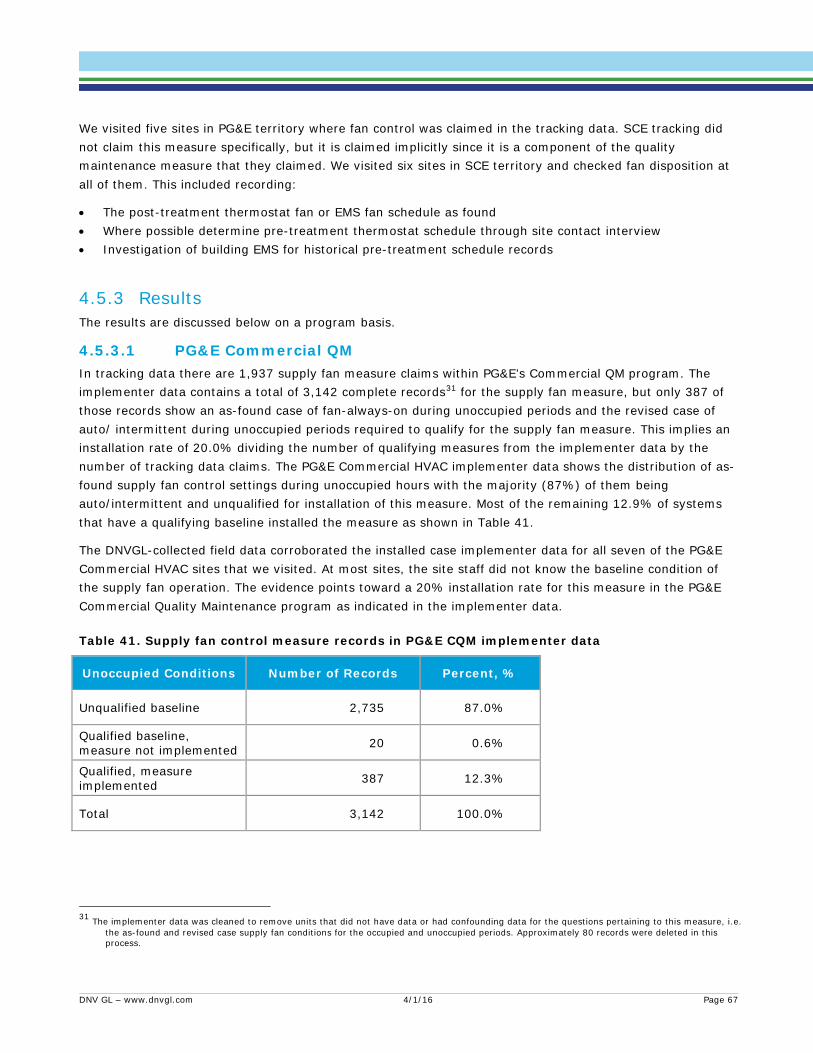
We visited five sites in PG&E territory where fan control was claimed in the tracking data. SCE tracking did not claim this measure specifically, but it is claimed implicitly since it is a component of the quality maintenance measure that they claimed. We visited six sites in SCE territory and checked fan disposition at all of them. This included recording:
• The post-treatment thermostat fan or EMS fan schedule as found • Where possible determine pre-treatment thermostat schedule through site contact interview • Investigation of building EMS for historical pre-treatment schedule records
Results 4.5.3The results are discussed below on a program basis.
4.5.3.1 PG&E Commercial QM In tracking data there are 1,937 supply fan measure claims within PG&E’s Commercial QM program. The implementer data contains a total of 3,142 complete records31 for the supply fan measure, but only 387 of those records show an as-found case of fan-always-on during unoccupied periods and the revised case of auto/ intermittent during unoccupied periods required to qualify for the supply fan measure. This implies an installation rate of 20.0% dividing the number of qualifying measures from the implementer data by the number of tracking data claims. The PG&E Commercial HVAC implementer data shows the distribution of as-found supply fan control settings during unoccupied hours with the majority (87%) of them being auto/intermittent and unqualified for installation of this measure. Most of the remaining 12.9% of systems that have a qualifying baseline installed the measure as shown in Table 41.
The DNVGL-collected field data corroborated the installed case implementer data for all seven of the PG&E Commercial HVAC sites that we visited. At most sites, the site staff did not know the baseline condition of the supply fan operation. The evidence points toward a 20% installation rate for this measure in the PG&E Commercial Quality Maintenance program as indicated in the implementer data.
Table 41. Supply fan control measure records in PG&E CQM implementer data
Unoccupied Conditions Number of Records Percent, %
Unqualified baseline 2,735 87.0%
Qualified baseline, measure not implemented 20 0.6%
Qualified, measure implemented 387 12.3%
Total 3,142 100.0%
31 The implementer data was cleaned to remove units that did not have data or had confounding data for the questions pertaining to this measure, i.e. the as-found and revised case supply fan conditions for the occupied and unoccupied periods. Approximately 80 records were deleted in this process.
DNV GL – www.dnvgl.com 4/1/16 Page 67
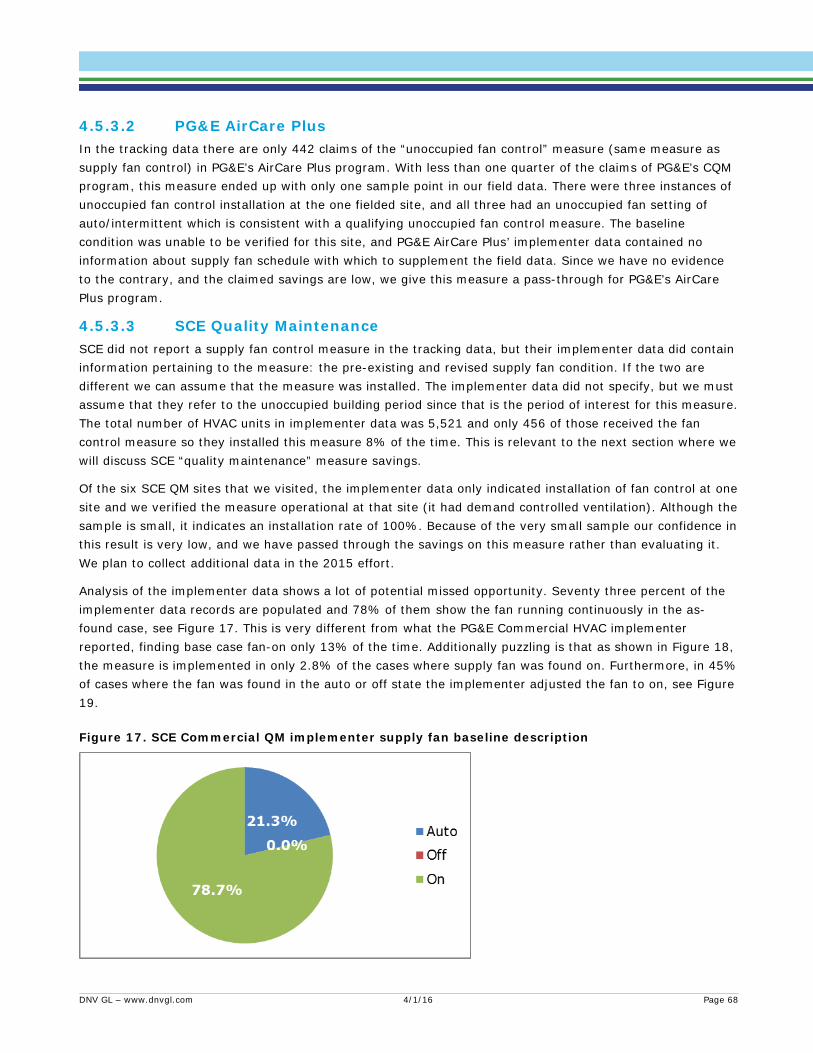
4.5.3.2 PG&E AirCare Plus In the tracking data there are only 442 claims of the “unoccupied fan control” measure (same measure as supply fan control) in PG&E’s AirCare Plus program. With less than one quarter of the claims of PG&E’s CQM program, this measure ended up with only one sample point in our field data. There were three instances of unoccupied fan control installation at the one fielded site, and all three had an unoccupied fan setting of auto/intermittent which is consistent with a qualifying unoccupied fan control measure. The baseline condition was unable to be verified for this site, and PG&E AirCare Plus’ implementer data contained no information about supply fan schedule with which to supplement the field data. Since we have no evidence to the contrary, and the claimed savings are low, we give this measure a pass-through for PG&E’s AirCare Plus program.
4.5.3.3 SCE Quality Maintenance SCE did not report a supply fan control measure in the tracking data, but their implementer data did contain information pertaining to the measure: the pre-existing and revised supply fan condition. If the two are different we can assume that the measure was installed. The implementer data did not specify, but we must assume that they refer to the unoccupied building period since that is the period of interest for this measure. The total number of HVAC units in implementer data was 5,521 and only 456 of those received the fan control measure so they installed this measure 8% of the time. This is relevant to the next section where we will discuss SCE “quality maintenance” measure savings.
Of the six SCE QM sites that we visited, the implementer data only indicated installation of fan control at one site and we verified the measure operational at that site (it had demand controlled ventilation). Although the sample is small, it indicates an installation rate of 100%. Because of the very small sample our confidence in this result is very low, and we have passed through the savings on this measure rather than evaluating it. We plan to collect additional data in the 2015 effort.
Analysis of the implementer data shows a lot of potential missed opportunity. Seventy three percent of the implementer data records are populated and 78% of them show the fan running continuously in the as-found case, see Figure 17. This is very different from what the PG&E Commercial HVAC implementer reported, finding base case fan-on only 13% of the time. Additionally puzzling is that as shown in Figure 18, the measure is implemented in only 2.8% of the cases where supply fan was found on. Furthermore, in 45% of cases where the fan was found in the auto or off state the implementer adjusted the fan to on, see Figure 19.
Figure 17. SCE Commercial QM implementer supply fan baseline description
DNV GL – www.dnvgl.com 4/1/16 Page 68
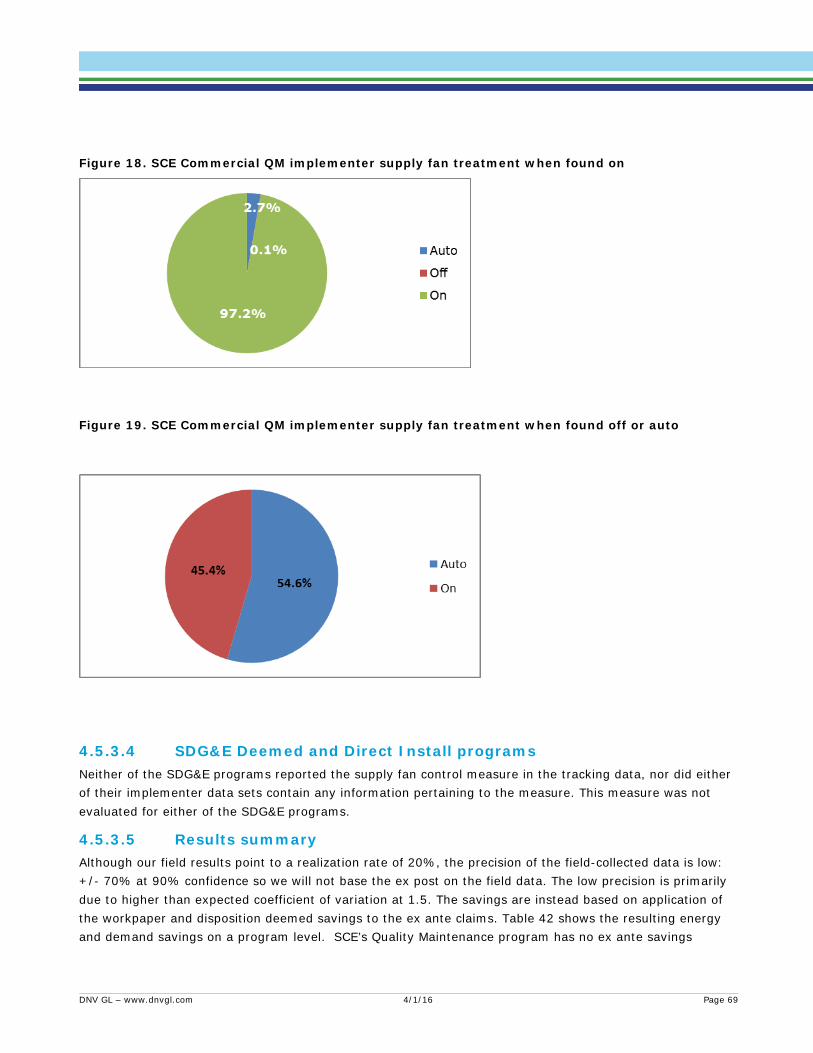
Figure 18. SCE Commercial QM implementer supply fan treatment when found on
Figure 19. SCE Commercial QM implementer supply fan treatment when found off or auto
4.5.3.4 SDG&E Deemed and Direct Install programs Neither of the SDG&E programs reported the supply fan control measure in the tracking data, nor did either of their implementer data sets contain any information pertaining to the measure. This measure was not evaluated for either of the SDG&E programs.
4.5.3.5 Results summary Although our field results point to a realization rate of 20%, the precision of the field-collected data is low: +/- 70% at 90% confidence so we will not base the ex post on the field data. The low precision is primarily due to higher than expected coefficient of variation at 1.5. The savings are instead based on application of the workpaper and disposition deemed savings to the ex ante claims. Table 42 shows the resulting energy and demand savings on a program level. SCE’s Quality Maintenance program has no ex ante savings
DNV GL – www.dnvgl.com 4/1/16 Page 69

because they reported savings on an aggregated level. Results for this program are explained in more detail in section 0. Neither of the SDG&E programs claimed ex ante savings for the supply fan control measure.
Ex ante therm savings for the supply fan measure seem to have been mis-reported in the tracking data. Table 44 shows ex post therm savings pulled from the workpaper with the disposition-required 50% multiplier applied. The realization rate has also been applied for PG&E’s Commercial QM program, but not for the AirCare Plus program since there was not enough data collected in that program.
Table 42. Supply fan control results by program
Program Number
of Claims
Ex Ante kWh
Savings
Ex Ante kW
Savings
Ex Post Instal-lation Rate
Ex Post Reali-zation Rate kWh
Ex Post Reali-zation
Rate kW
Ex Post kWh
Savings
Ex Post kW
Savings
PG&E Commercial QM
1,937 4,367,405 0 100% 85% N/A 3,725,681 0
PG&E AirCare Plus 442 453,308 0 100% 96% N/A 437,371 0
SDG&E Deemed Incentives
SDG&E Direct Install
Table 43: Supply fan control them savings results by program
Program Number
of Claims
Ex Ante therm
Savings
Ex Post Reali-zation Rate
therm
Ex Post therm
Savings
PG&E Commercial QM 1,937 542,120 5% 26,386
PG&E AirCare Plus 442 66,290 2% 1,562
This section addresses the QM measures under SCE’s Quality Maintenance program. The SCE program administrators used a single line item to claim savings for a package of HVAC maintenance activities or measures. This is consistent with the quality maintenance program philosophy.
Workpaper review: ex ante methodology 4.6.1SCE’s work paper SCE13HC037, titled “Comprehensive Commercial HVAC Rooftop Unit Quality Maintenance” details the assumptions made for calculating the savings for these measure packages. It has four categories
4.6 Quality maintenance measure
DNV GL – www.dnvgl.com 4/1/16 Page 70

of measure savings: heat pumps with and without an economizer and natural gas HVAC package systems with and without an economizer.
The following is a list of measures that may be included in the Quality Maintenance measure packages:
• Airflow and coil cleaning • Evaporator and condenser coil cleaning • Refrigeration charge adjustment – single and multiple compressors • Schedule management • Schedule adjustment • Thermostat replacement and adjustment • Economizer service (only for measure types with economizers) • Economizer temperature high limit control • Economizer controls commissioning • Integrate economizer: wiring • Integrate economizer: wiring + thermostat • Economizer linkage renovation • Economizer renovation: damper motor • Economizer renovation: damper motor and controller/sensor
The assumed incidence of any given treatment being performed on a unit was taken from the ED Disposition for Non-Residential HVAC Rooftop Quality Maintenance, dated 5/2/13, and is shown side by side with the implementer distribution in Table 44. Of course, the economizer measures apply only to the economizer-equipped units. Essentially, the ex-ante claims for every unit enrolled in program assumes this measure mix.
QM program activity 4.6.2The tracking data shown in Table 45 reflects the number of units enrolled in the program and the associated ex ante savings. As described above, the QM component measure incidence from the CPUC disposition was embedded in the savings calculation. However, the actual program activity deviated from the disposition forecast. Table 44 shows both the disposition-reported measure incidence distribution and the actual measure incidence derived from implementer data. We have additionally shown the implementer-reported number of each measure installed in the 2013-14 SCE QM program.
DNV GL – www.dnvgl.com 4/1/16 Page 71
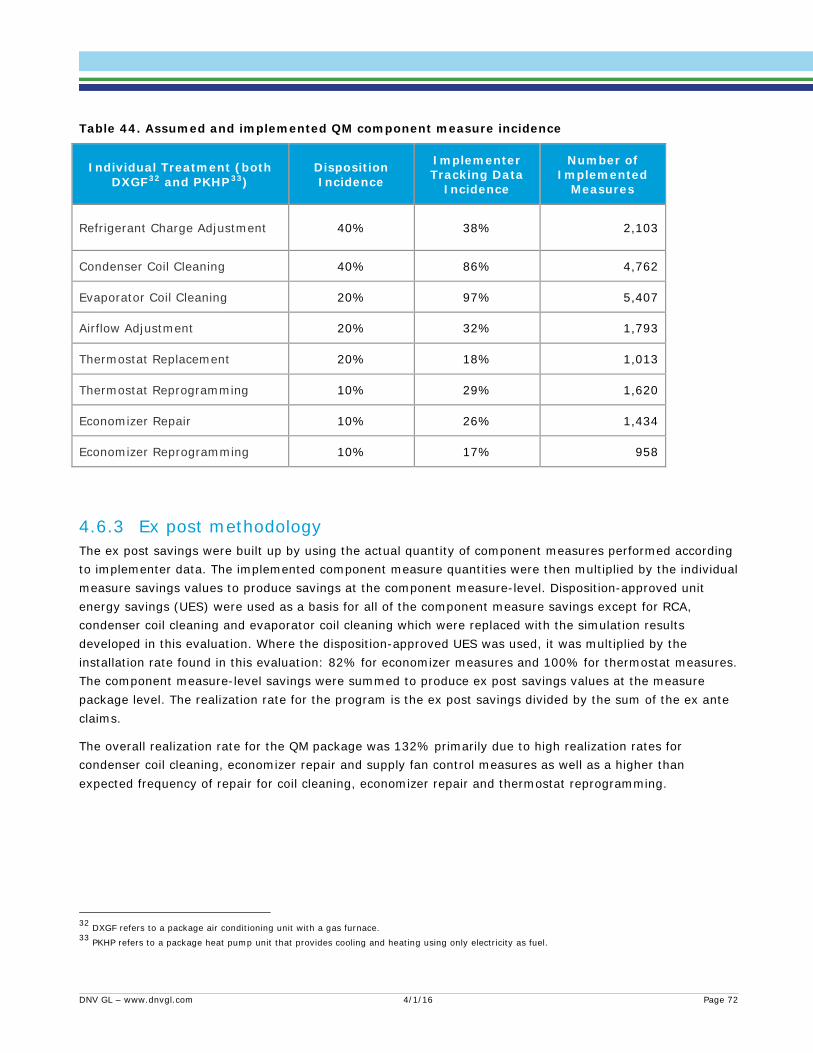
Table 44. Assumed and implemented QM component measure incidence
Individual Treatment (both DXGF32 and PKHP33)
Disposition Incidence
Implementer Tracking Data
Incidence
Number of Implemented
Measures
Refrigerant Charge Adjustment 40% 38% 2,103
Condenser Coil Cleaning 40% 86% 4,762
Evaporator Coil Cleaning 20% 97% 5,407
Airflow Adjustment 20% 32% 1,793
Thermostat Replacement 20% 18% 1,013
Thermostat Reprogramming 10% 29% 1,620
Economizer Repair 10% 26% 1,434
Economizer Reprogramming 10% 17% 958
Ex post methodology 4.6.3The ex post savings were built up by using the actual quantity of component measures performed according to implementer data. The implemented component measure quantities were then multiplied by the individual measure savings values to produce savings at the component measure-level. Disposition-approved unit energy savings (UES) were used as a basis for all of the component measure savings except for RCA, condenser coil cleaning and evaporator coil cleaning which were replaced with the simulation results developed in this evaluation. Where the disposition-approved UES was used, it was multiplied by the installation rate found in this evaluation: 82% for economizer measures and 100% for thermostat measures. The component measure-level savings were summed to produce ex post savings values at the measure package level. The realization rate for the program is the ex post savings divided by the sum of the ex ante claims.
The overall realization rate for the QM package was 132% primarily due to high realization rates for condenser coil cleaning, economizer repair and supply fan control measures as well as a higher than expected frequency of repair for coil cleaning, economizer repair and thermostat reprogramming.
32 DXGF refers to a package air conditioning unit with a gas furnace. 33 PKHP refers to a package heat pump unit that provides cooling and heating using only electricity as fuel.
DNV GL – www.dnvgl.com 4/1/16 Page 72
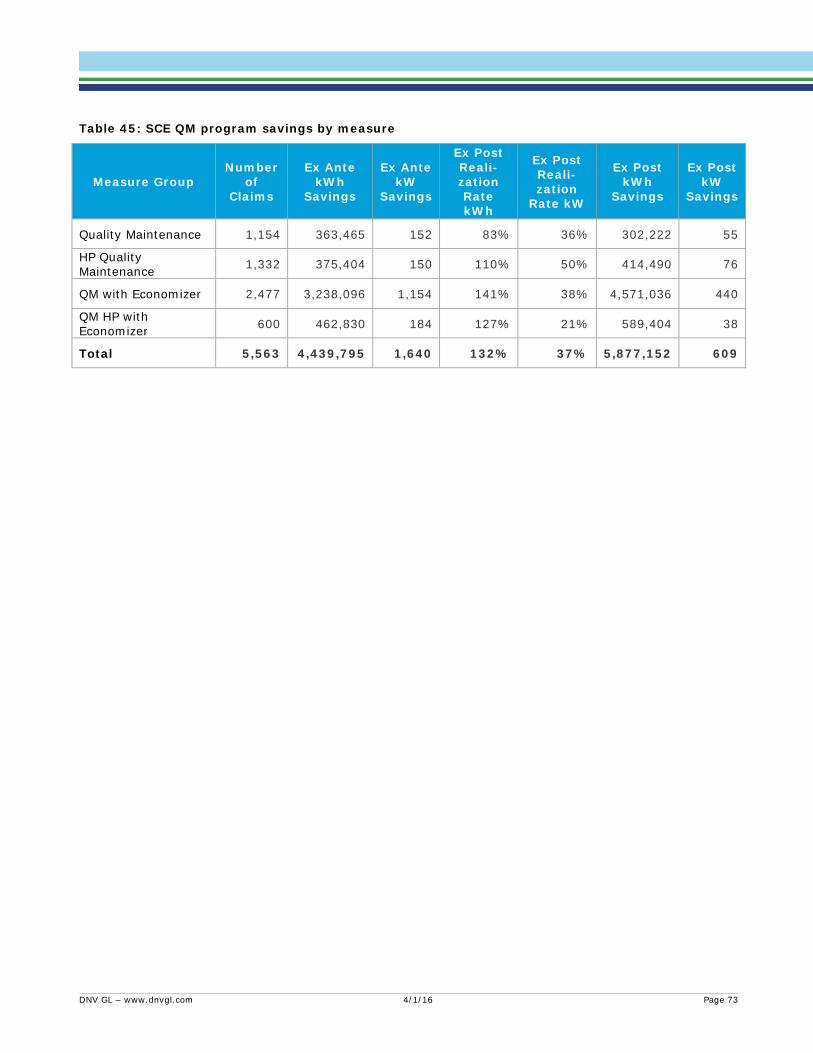
Table 45: SCE QM program savings by measure
Measure Group Number
of Claims
Ex Ante kWh
Savings
Ex Ante kW
Savings
Ex Post Reali-zation Rate kWh
Ex Post Reali-zation
Rate kW
Ex Post kWh
Savings
Ex Post kW
Savings
Quality Maintenance 1,154 363,465 152 83% 36% 302,222 55
HP Quality Maintenance 1,332 375,404 150 110% 50% 414,490 76
QM with Economizer 2,477 3,238,096 1,154 141% 38% 4,571,036 440
QM HP with Economizer 600 462,830 184 127% 21% 589,404 38
Total 5,563 4,439,795 1,640 132% 37% 5,877,152 609
DNV GL – www.dnvgl.com 4/1/16 Page 73

The following tables provide a summary of the extrapolation of the sample to the population and program level realization rate. The totals reported are for the measures evaluated under the HVAC-3 section of the CPUC HVAC Roadmap. In each program there may be additional measures that were assigned to a different part of the CPUC HVAC Roadmap, or were assigned as pass-through. A full accounting by program and measure group is available in Appendix A.
Recall that the evaluation developed parameter estimates that fed into simulations or installation rates across IOUs in many cases. The estimated precisions for the measure groups were described in Table 5 which is reproduced below.
Table 46: Data set size for measure parameters with corresponding sampling precision
Measure
Planned Model
Parameter Data Set
Size
Planned Precision at 90%
confidence
Achieved Model
Parameter Data Set
Size
Achieved Precision at 90%
confidence
Actual Coefficient
of Variation
Coil Cleaning 29 ± 31% 12 ± 32% 0.28
RCA 22 ± 35% 110 ± 47% 1.26
Economizer 21 ± 36% 24 ± 24% 0.72
Supply Fan Control 12 ± 47% 14 ± 70% 1.6
Thermostat 15 ± 42% 11 ± 72% 1.5 The precisions of supply fan control and thermostat measures were so poor that they were not used to determine the ex post savings.
PG&E 4.7.1
Table 47. PG&E Commercial QM program level electric first-year savings
Measure Group Number
of Claims
Ex Ante kWh
Savings
Ex Ante kW
Savings
Ex Post Reali-zation Rate kWh
Ex Post Reali-zation
Rate kW
Ex Post kWh
Savings
Ex Post kW
Savings
Coil Cleaning - Cond 4,826 0 0 N/A N/A 1,354,873 659
Coil Cleaning - Evap 4,826 0 0 N/A N/A 10,7587 57
RCA 1,745 870,455 738 31% 15% 268,625 111
Economizer 2,442 3,068,415 -182 43% 43% 1,319,418 -78
Thermostat 2,488 2,712,280 0 pass N/A 2,712,280 0
Fan Control 1,937 4,367,405 0 96% N/A 3,725,681 0
Total 8,612 11,018,555 557 86% 134% 9,488,464 749
4.7 Evaluated program-level gross savings
DNV GL – www.dnvgl.com 4/1/16 Page 74

Table 48. PG&E Commercial QM program level gas first-year savings
Measure Group Number
of Claims
Ex Ante therm
Savings
Ex Post Reali-zation Rate
therms
Ex Post therm
Savings
Thermostat 2,488 377,660 pass 377,660
Fan Control 1,937 542,120 5% 26,386
Total 4,425 919,780 44% 404,046
Table 49. PG&E AirCare Plus program level electric first-year savings
Measure Group Number
of Claims
Ex Ante kWh
Savings
Ex Ante kW
Savings
Ex Post Reali-zation Rate kWh
Ex Post Reali-zation
Rate kW
Ex Post kWh
Savings
Ex Post kW
Savings
Coil Cleaning - Cond 2,032 53,539 34 598% 221% 319,956 76
Coil Cleaning - Evap 1,685 23,154 15 109% 34% 25,229 5
RCA 5,671 1,450,631 874 29% 11% 424,926 99
Economizer 3,499 1,460,285 -217 44% 44% 642,525 -95
Thermostat 2,694 2,906,562 0 pass pass 2,906,562 0
Fan Control 442 453,308 0 96% N/A 437,371 0
Total 16,023 6,347,479 706 82% 12% 5,209,878 84
Table 50. PG&E AirCare Plus program level gas first-year savings
Measure Group Number
of Claims
Ex Ante therm
Savings
Ex Post Reali-zation Rate
therms
Ex Post therm
Savings
Thermostat 2,694 418,480 pass 418,480
Fan Control 442 66,290 2% 1,562
Total 3,136 484,769 87% 420,041
DNV GL – www.dnvgl.com 4/1/16 Page 75

SCE 4.7.2
Table 51. SCE QM program level electric first-year savings
Measure Group Number
of Claims
Ex Ante kWh
Savings
Ex Ante kW
Savings
Ex Post Reali-zation
Rate kWh
Ex Post Reali-zation
Rate kW
Ex Post kWh
Savings
Ex Post kW
Savings
Quality Maintenance 1,154 363,465 152 83% 36% 302,222 55
HP Quality Maintenance 1,332 375,404 150 110% 50% 414,490 76
QM w/Economizer 600 3,238,096 1,154 141% 38% 4,571,036 440
QM HP w/Economizer 2,477 462,830 184 127% 21% 589,404 38
Total 5,563 4,439,795 1,640 132% 37% 5,877,152 609
SDG&E 4.7.3
Table 52. SDG&E Deemed program level electric first-year savings
Measure Group Number
of Claims
Ex Ante kWh
Savings
Ex Ante kW
Savings
Ex Post Reali-zation Rate kWh
Ex Post Reali-zation
Rate kW
Ex Post kWh
Savings
Ex Post kW
Savings
Coil Cleaning - Cond 11,311 7,008,173 2,295 68% 122% 4,765,519 2,804
Coil Cleaning - Evap 9,093 1,852,771 611 11% 24% 197,776 145
RCA 8,880 2,890,034 2,258 36% 28% 1,034,195 638
Economizer 21 12,380 0 56% 56% 6,933 0
Thermostat
Fan Control
Total 29,305 11,763,357 5,164 51% 69% 6,004,423 3,587
DNV GL – www.dnvgl.com 4/1/16 Page 76
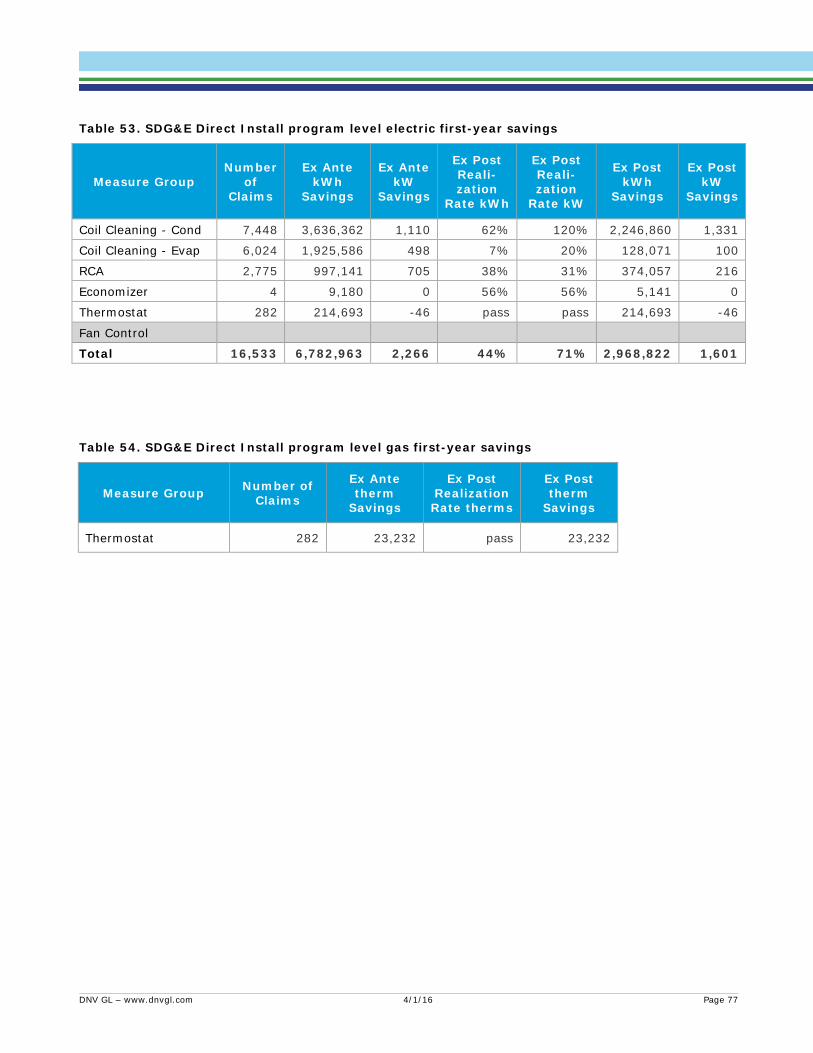
Table 53. SDG&E Direct Install program level electric first-year savings
Measure Group Number
of Claims
Ex Ante kWh
Savings
Ex Ante kW
Savings
Ex Post Reali-zation
Rate kWh
Ex Post Reali-zation
Rate kW
Ex Post kWh
Savings
Ex Post kW
Savings
Coil Cleaning - Cond 7,448 3,636,362 1,110 62% 120% 2,246,860 1,331
Coil Cleaning - Evap 6,024 1,925,586 498 7% 20% 128,071 100
RCA 2,775 997,141 705 38% 31% 374,057 216
Economizer 4 9,180 0 56% 56% 5,141 0
Thermostat 282 214,693 -46 pass pass 214,693 -46
Fan Control
Total 16,533 6,782,963 2,266 44% 71% 2,968,822 1,601
Table 54. SDG&E Direct Install program level gas first-year savings
Measure Group Number of Claims
Ex Ante therm
Savings
Ex Post Realization Rate therms
Ex Post therm
Savings
Thermostat 282 23,232 pass 23,232
DNV GL – www.dnvgl.com 4/1/16 Page 77
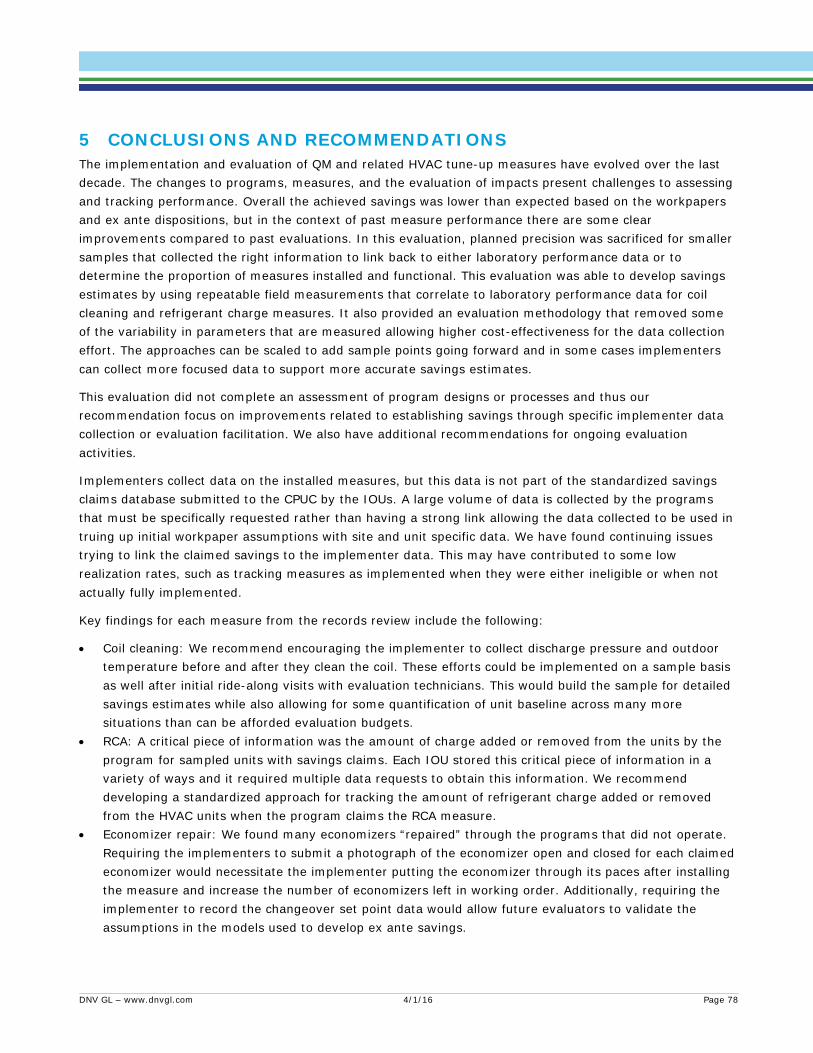
5 CONCLUSIONS AND RECOMMENDATIONS The implementation and evaluation of QM and related HVAC tune-up measures have evolved over the last decade. The changes to programs, measures, and the evaluation of impacts present challenges to assessing and tracking performance. Overall the achieved savings was lower than expected based on the workpapers and ex ante dispositions, but in the context of past measure performance there are some clear improvements compared to past evaluations. In this evaluation, planned precision was sacrificed for smaller samples that collected the right information to link back to either laboratory performance data or to determine the proportion of measures installed and functional. This evaluation was able to develop savings estimates by using repeatable field measurements that correlate to laboratory performance data for coil cleaning and refrigerant charge measures. It also provided an evaluation methodology that removed some of the variability in parameters that are measured allowing higher cost-effectiveness for the data collection effort. The approaches can be scaled to add sample points going forward and in some cases implementers can collect more focused data to support more accurate savings estimates.
This evaluation did not complete an assessment of program designs or processes and thus our recommendation focus on improvements related to establishing savings through specific implementer data collection or evaluation facilitation. We also have additional recommendations for ongoing evaluation activities.
Implementers collect data on the installed measures, but this data is not part of the standardized savings claims database submitted to the CPUC by the IOUs. A large volume of data is collected by the programs that must be specifically requested rather than having a strong link allowing the data collected to be used in truing up initial workpaper assumptions with site and unit specific data. We have found continuing issues trying to link the claimed savings to the implementer data. This may have contributed to some low realization rates, such as tracking measures as implemented when they were either ineligible or when not actually fully implemented.
Key findings for each measure from the records review include the following:
• Coil cleaning: We recommend encouraging the implementer to collect discharge pressure and outdoor temperature before and after they clean the coil. These efforts could be implemented on a sample basis as well after initial ride-along visits with evaluation technicians. This would build the sample for detailed savings estimates while also allowing for some quantification of unit baseline across many more situations than can be afforded evaluation budgets.
• RCA: A critical piece of information was the amount of charge added or removed from the units by the program for sampled units with savings claims. Each IOU stored this critical piece of information in a variety of ways and it required multiple data requests to obtain this information. We recommend developing a standardized approach for tracking the amount of refrigerant charge added or removed from the HVAC units when the program claims the RCA measure.
• Economizer repair: We found many economizers “repaired” through the programs that did not operate. Requiring the implementers to submit a photograph of the economizer open and closed for each claimed economizer would necessitate the implementer putting the economizer through its paces after installing the measure and increase the number of economizers left in working order. Additionally, requiring the implementer to record the changeover set point data would allow future evaluators to validate the assumptions in the models used to develop ex ante savings.
DNV GL – www.dnvgl.com 4/1/16 Page 78
• Thermostat adjustment: We recommend encouraging implementers to do a better job recording the thermostat set point temperatures since this would allow future implementers to modify the ex ante savings assumptions if they are inaccurate.
• Supply fan control: Recommend investigating baseline fan state by either requiring more implementer data and/or performing a baseline study.
There are remaining and new evaluation challenges to overcome. Additional improvements for future evaluations objectives may include:
• Collect more true-baseline data for coil cleaning measures by visiting sites that are entering the program for the first time. Collect additional coil cleaning laboratory data for systems under mixed faults.
• Collect more RCA data – particularly within the AirCare Plus program in the 10% of HVAC units that received charge adjustments with levels of charge added or removed recorded in the implementer data set. We assumed the coefficient of variation was 1.0 in selecting our sample size when actually much higher given the variables that drive savings (metering device and number of compressors). The larger than anticipated variability means we need a larger sample.
• Collect additional data on why economizers are not functioning. Collect more information to characterize failure modes should lead to more focused repairs in the future. Collect economizer airflow data to further quantify outside airflow rates is also needed.
• Collect more thermostat and supply fan control data. We assumed the coefficient of variation was 1.0 in selecting the sample but it was actually 1.5. We need a larger sample to attain better precision on the ex post savings estimates.
DNV GL – www.dnvgl.com 4/1/16 Page 79
STANDARDIZED HIGH LEVEL SAVINGS Appendix AA.
The tables in Appendix AA summarizing natural gas savings make use of the unit MTherms – 1,000 Therms – rather than MMTherms – 1,000,000 Therms – for formatting purposes
DNV GL – www.dnvgl.com 4/1/16 Page AA-1

Impact Evaluation of 2013-14 HVAC3 Commercial Quality Maintenance Programs
Gross Lifecycle Savings (MWh)
PA Standard Report GroupEx-Ante
GrossEx-Post Gross GRR
% Ex-Ante Gross Pass
ThroughEval GRR
PGE AirCare Plus: Coil Cl - Conden 268 1,600 5.98 0.0% 5.98
PGE AirCare Plus: Coil Cl - Evapor 116 126 1.09 0.0% 1.09
PGE AirCare Plus: Economizer 7,301 3,213 0.44 0.0% 0.44
PGE AirCare Plus: Fan Control 2,267 2,187 0.96 0.0% 0.96
PGE AirCare Plus: Passthru: Thermo 14,533 14,533 1.00 100.0%
PGE AirCare Plus: RCA 7,253 2,125 0.29 0.0% 0.29
PGE Com Quality Maint: Coil Cl - C 0 6,774
PGE Com Quality Maint: Coil Cl - E 0 538
PGE Com Quality Maint: Economizer 15,342 6,597 0.43 0.0% 0.43
PGE Com Quality Maint: Fan Control 21,837 18,628 0.85 0.0% 0.85
PGE Com Quality Maint: RCA 4,352 1,343 0.31 0.0% 0.31
PGE Com Quality Maint: Passthru: Thermo 13,561 13,561 1.00 100.0%
PGE Total 86,830 71,225 0.82 16.7% 0.78
SCE Quality Maint: HP Quality Main 1,877 2,072 1.10 0.0% 1.10
SCE Quality Maint: Passthru: Coil 0 0
SCE Quality Maint: Passthru: Econo 0 0
SCE Quality Maint: Passthru: RCA 0 0
SCE Quality Maint: Passthru: Therm 0 0
SCE Quality Maint: QM HP W/Economi 2,314 2,947 1.27 0.0% 1.27
SCE Quality Maint: QM W/Economizer 16,190 22,855 1.41 0.0% 1.41
SCE Quality Maint: Quality Mainten 1,817 1,511 0.83 0.0% 0.83
SCE Total 22,199 29,386 1.32 0.0% 1.32
SDGE Deemed: Coil Cl - Condenser 21,025 14,297 0.68 0.0% 0.68
SDGE Deemed: Coil Cl - Evaporator 5,558 593 0.11 0.0% 0.11
SDGE Deemed: Economizer 124 69 0.56 0.0% 0.56
SDGE Deemed: Passthru: Economizer 0 0
SDGE Deemed: Passthru: Incentives 0 0
SDGE Deemed: RCA 28,900 10,341 0.36 0.0% 0.36
SDGE Direct Install: Coil Cl - Cond 10,909 6,741 0.62 0.0% 0.62
SDGE Direct Install: Coil Cl - Evap 5,777 384 0.07 0.0% 0.07
SDGE Direct Install: Economizer 46 26 0.56 0.0% 0.56
SDGE Direct Install: PassThru Therm 1,623 1,623 1.00 100.0%
SDGE Direct Install: RCA 9,971 3,740 0.38 0.0% 0.38
SDGE Total 83,933 37,813 0.45 1.9% 0.44
Statewide 192,962 138,424 0.72 8.4% 0.69
DNV GL AA - 2 Appendix AA - Std. High Level Savings
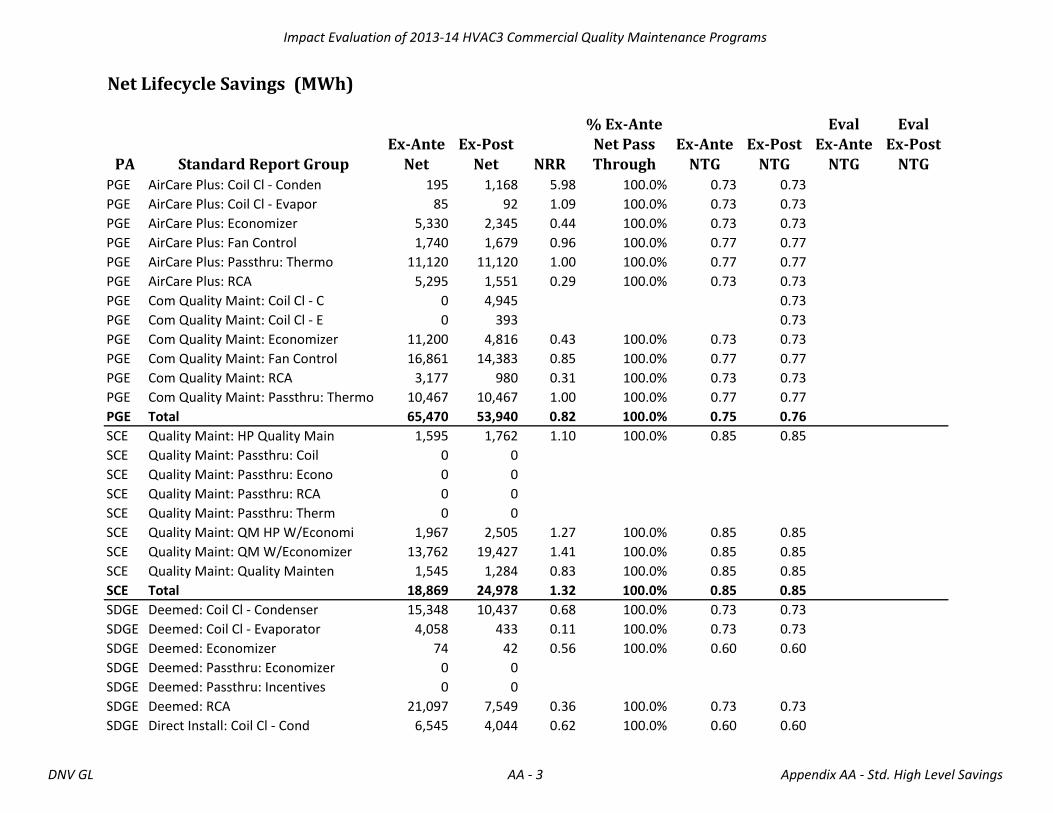
Impact Evaluation of 2013-14 HVAC3 Commercial Quality Maintenance Programs
Net Lifecycle Savings (MWh)
PA Standard Report GroupEx-Ante
NetEx-Post
Net NRR
% Ex-Ante
Net Pass Through
Ex-Ante NTG
Ex-Post NTG
Eval
Ex-Ante NTG
Eval
Ex-Post NTG
PGE AirCare Plus: Coil Cl - Conden 195 1,168 5.98 100.0% 0.73 0.73
PGE AirCare Plus: Coil Cl - Evapor 85 92 1.09 100.0% 0.73 0.73
PGE AirCare Plus: Economizer 5,330 2,345 0.44 100.0% 0.73 0.73
PGE AirCare Plus: Fan Control 1,740 1,679 0.96 100.0% 0.77 0.77
PGE AirCare Plus: Passthru: Thermo 11,120 11,120 1.00 100.0% 0.77 0.77
PGE AirCare Plus: RCA 5,295 1,551 0.29 100.0% 0.73 0.73
PGE Com Quality Maint: Coil Cl - C 0 4,945 0.73
PGE Com Quality Maint: Coil Cl - E 0 393 0.73
PGE Com Quality Maint: Economizer 11,200 4,816 0.43 100.0% 0.73 0.73
PGE Com Quality Maint: Fan Control 16,861 14,383 0.85 100.0% 0.77 0.77
PGE Com Quality Maint: RCA 3,177 980 0.31 100.0% 0.73 0.73
PGE Com Quality Maint: Passthru: Thermo 10,467 10,467 1.00 100.0% 0.77 0.77
PGE Total 65,470 53,940 0.82 100.0% 0.75 0.76
SCE Quality Maint: HP Quality Main 1,595 1,762 1.10 100.0% 0.85 0.85
SCE Quality Maint: Passthru: Coil 0 0
SCE Quality Maint: Passthru: Econo 0 0
SCE Quality Maint: Passthru: RCA 0 0
SCE Quality Maint: Passthru: Therm 0 0
SCE Quality Maint: QM HP W/Economi 1,967 2,505 1.27 100.0% 0.85 0.85
SCE Quality Maint: QM W/Economizer 13,762 19,427 1.41 100.0% 0.85 0.85
SCE Quality Maint: Quality Mainten 1,545 1,284 0.83 100.0% 0.85 0.85
SCE Total 18,869 24,978 1.32 100.0% 0.85 0.85
SDGE Deemed: Coil Cl - Condenser 15,348 10,437 0.68 100.0% 0.73 0.73
SDGE Deemed: Coil Cl - Evaporator 4,058 433 0.11 100.0% 0.73 0.73
SDGE Deemed: Economizer 74 42 0.56 100.0% 0.60 0.60
SDGE Deemed: Passthru: Economizer 0 0
SDGE Deemed: Passthru: Incentives 0 0
SDGE Deemed: RCA 21,097 7,549 0.36 100.0% 0.73 0.73
SDGE Direct Install: Coil Cl - Cond 6,545 4,044 0.62 100.0% 0.60 0.60
DNV GL AA - 3 Appendix AA - Std. High Level Savings
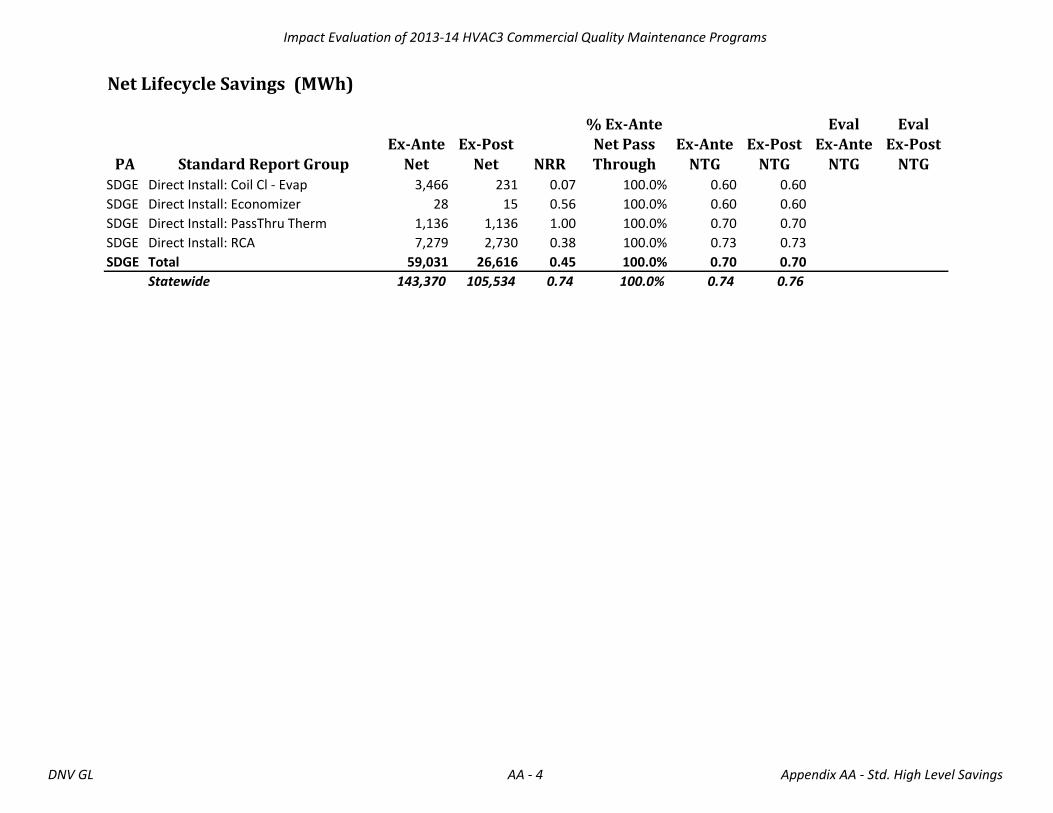
Impact Evaluation of 2013-14 HVAC3 Commercial Quality Maintenance Programs
Net Lifecycle Savings (MWh)
PA Standard Report GroupEx-Ante
NetEx-Post
Net NRR
% Ex-Ante
Net Pass Through
Ex-Ante NTG
Ex-Post NTG
Eval
Ex-Ante NTG
Eval
Ex-Post NTG
SDGE Direct Install: Coil Cl - Evap 3,466 231 0.07 100.0% 0.60 0.60
SDGE Direct Install: Economizer 28 15 0.56 100.0% 0.60 0.60
SDGE Direct Install: PassThru Therm 1,136 1,136 1.00 100.0% 0.70 0.70
SDGE Direct Install: RCA 7,279 2,730 0.38 100.0% 0.73 0.73
SDGE Total 59,031 26,616 0.45 100.0% 0.70 0.70
Statewide 143,370 105,534 0.74 100.0% 0.74 0.76
DNV GL AA - 4 Appendix AA - Std. High Level Savings

Impact Evaluation of 2013-14 HVAC3 Commercial Quality Maintenance Programs
Gross Lifecycle Savings (MW)
PA Standard Report GroupEx-Ante
GrossEx-Post Gross GRR
% Ex-Ante Gross Pass
ThroughEval GRR
PGE AirCare Plus: Coil Cl - Conden 0.2 0.4 2.21 0.0% 2.21
PGE AirCare Plus: Coil Cl - Evapor 0.1 0.0 0.34 0.0% 0.34
PGE AirCare Plus: Economizer -1.1 -0.5 0.44 0.0% 0.44
PGE AirCare Plus: Fan Control 0.0 0.0
PGE AirCare Plus: Passthru: Thermo 0.0 0.0
PGE AirCare Plus: RCA 4.4 0.5 0.11 0.0% 0.11
PGE Com Quality Maint: Coil Cl - C 0.0 3.3
PGE Com Quality Maint: Coil Cl - E 0.0 0.3
PGE Com Quality Maint: Economizer -0.9 -0.4 0.43 0.0% 0.43
PGE Com Quality Maint: Fan Control 0.0 0.0
PGE Com Quality Maint: RCA 3.7 0.6 0.15 0.0% 0.15
PGE Com Quality Maint: Passthru: Thermo 0.0 0.0
PGE Total 6.3 4.2 0.66 0.0% 0.66
SCE Quality Maint: HP Quality Main 0.8 0.4 0.50 0.0% 0.50
SCE Quality Maint: Passthru: Coil 0.0 0.0
SCE Quality Maint: Passthru: Econo 0.0 0.0
SCE Quality Maint: Passthru: RCA 0.0 0.0
SCE Quality Maint: Passthru: Therm 0.0 0.0
SCE Quality Maint: QM HP W/Economi 0.9 0.2 0.21 0.0% 0.21
SCE Quality Maint: QM W/Economizer 5.8 2.2 0.38 0.0% 0.38
SCE Quality Maint: Quality Mainten 0.8 0.3 0.36 0.0% 0.36
SCE Total 8.2 3.0 0.37 0.0% 0.37
SDGE Deemed: Coil Cl - Condenser 6.9 8.4 1.22 0.0% 1.22
SDGE Deemed: Coil Cl - Evaporator 1.8 0.4 0.24 0.0% 0.24
SDGE Deemed: Economizer 0.0 0.0 0.56 0.0% 0.56
SDGE Deemed: Passthru: Economizer 0.0 0.0
SDGE Deemed: Passthru: Incentives 0.0 0.0
SDGE Deemed: RCA 22.6 6.4 0.28 0.0% 0.28
SDGE Direct Install: Coil Cl - Cond 3.3 4.0 1.20 0.0% 1.20
SDGE Direct Install: Coil Cl - Evap 1.5 0.3 0.20 0.0% 0.20
SDGE Direct Install: Economizer 0.0 0.0 0.56 0.0% 0.56
SDGE Direct Install: PassThru Therm -0.4 -0.4 1.00 100.0%
SDGE Direct Install: RCA 7.1 2.2 0.31 0.0% 0.31
SDGE Total 42.8 21.3 0.50 -0.9% 0.50
Statewide 57.3 28.5 0.50 -0.7% 0.50
DNV GL AA - 5 Appendix AA - Std. High Level Savings

Impact Evaluation of 2013-14 HVAC3 Commercial Quality Maintenance Programs
Net Lifecycle Savings (MW)
PA Standard Report GroupEx-Ante
NetEx-Post
Net NRR
% Ex-Ante
Net Pass Through
Ex-Ante NTG
Ex-Post NTG
Eval
Ex-Ante NTG
Eval
Ex-Post NTG
PGE AirCare Plus: Coil Cl - Conden 0.1 0.3 2.21 100.0% 0.73 0.73
PGE AirCare Plus: Coil Cl - Evapor 0.1 0.0 0.34 100.0% 0.73 0.73
PGE AirCare Plus: Economizer -0.8 -0.3 0.44 100.0% 0.73 0.73
PGE AirCare Plus: Fan Control 0.0 0.0
PGE AirCare Plus: Passthru: Thermo 0.0 0.0
PGE AirCare Plus: RCA 3.2 0.4 0.11 100.0% 0.73 0.73
PGE Com Quality Maint: Coil Cl - C 0.0 2.4 0.73
PGE Com Quality Maint: Coil Cl - E 0.0 0.2 0.73
PGE Com Quality Maint: Economizer -0.7 -0.3 0.43 100.0% 0.73 0.73
PGE Com Quality Maint: Fan Control 0.0 0.0
PGE Com Quality Maint: RCA 2.7 0.4 0.15 100.0% 0.73 0.73
PGE Com Quality Maint: Passthru: Thermo 0.0 0.0
PGE Total 4.6 3.0 0.66 100.0% 0.73 0.73
SCE Quality Maint: HP Quality Main 0.6 0.3 0.50 100.0% 0.85 0.85
SCE Quality Maint: Passthru: Coil 0.0 0.0
SCE Quality Maint: Passthru: Econo 0.0 0.0
SCE Quality Maint: Passthru: RCA 0.0 0.0
SCE Quality Maint: Passthru: Therm 0.0 0.0
SCE Quality Maint: QM HP W/Economi 0.8 0.2 0.21 100.0% 0.85 0.85
SCE Quality Maint: QM W/Economizer 4.9 1.9 0.38 100.0% 0.85 0.85
SCE Quality Maint: Quality Mainten 0.6 0.2 0.36 100.0% 0.85 0.85
SCE Total 7.0 2.6 0.37 100.0% 0.85 0.85
SDGE Deemed: Coil Cl - Condenser 5.0 6.1 1.22 100.0% 0.73 0.73
SDGE Deemed: Coil Cl - Evaporator 1.3 0.3 0.24 100.0% 0.73 0.73
SDGE Deemed: Economizer 0.0 0.0 0.56 100.0% 0.60 0.60
SDGE Deemed: Passthru: Economizer 0.0 0.0
SDGE Deemed: Passthru: Incentives 0.0 0.0
SDGE Deemed: RCA 16.5 4.7 0.28 100.0% 0.73 0.73
SDGE Direct Install: Coil Cl - Cond 2.0 2.4 1.20 100.0% 0.60 0.60
DNV GL AA - 6 Appendix AA - Std. High Level Savings

Impact Evaluation of 2013-14 HVAC3 Commercial Quality Maintenance Programs
Net Lifecycle Savings (MW)
PA Standard Report GroupEx-Ante
NetEx-Post
Net NRR
% Ex-Ante
Net Pass Through
Ex-Ante NTG
Ex-Post NTG
Eval
Ex-Ante NTG
Eval
Ex-Post NTG
SDGE Direct Install: Coil Cl - Evap 0.9 0.2 0.20 100.0% 0.60 0.60
SDGE Direct Install: Economizer 0.0 0.0 0.56 100.0% 0.60 0.60
SDGE Direct Install: PassThru Therm -0.3 -0.3 1.00 100.0% 0.70 0.70
SDGE Direct Install: RCA 5.1 1.6 0.31 100.0% 0.73 0.73
SDGE Total 30.6 15.0 0.49 100.0% 0.72 0.70
Statewide 42.2 20.6 0.49 100.0% 0.74 0.72
DNV GL AA - 7 Appendix AA - Std. High Level Savings
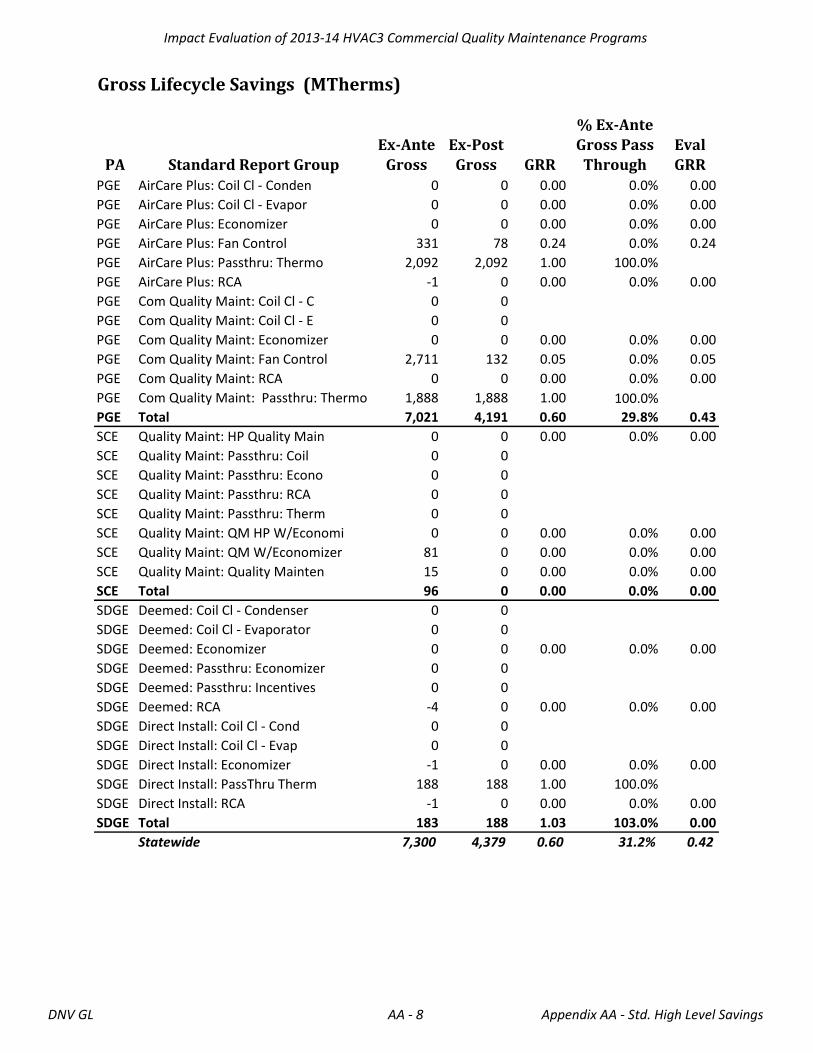
Impact Evaluation of 2013-14 HVAC3 Commercial Quality Maintenance Programs
Gross Lifecycle Savings (MTherms)
PA Standard Report GroupEx-Ante
GrossEx-Post Gross GRR
% Ex-Ante Gross Pass
ThroughEval GRR
PGE AirCare Plus: Coil Cl - Conden 0 0 0.00 0.0% 0.00
PGE AirCare Plus: Coil Cl - Evapor 0 0 0.00 0.0% 0.00
PGE AirCare Plus: Economizer 0 0 0.00 0.0% 0.00
PGE AirCare Plus: Fan Control 331 78 0.24 0.0% 0.24
PGE AirCare Plus: Passthru: Thermo 2,092 2,092 1.00 100.0%
PGE AirCare Plus: RCA -1 0 0.00 0.0% 0.00
PGE Com Quality Maint: Coil Cl - C 0 0
PGE Com Quality Maint: Coil Cl - E 0 0
PGE Com Quality Maint: Economizer 0 0 0.00 0.0% 0.00
PGE Com Quality Maint: Fan Control 2,711 132 0.05 0.0% 0.05
PGE Com Quality Maint: RCA 0 0 0.00 0.0% 0.00
PGE Com Quality Maint: Passthru: Thermo 1,888 1,888 1.00 100.0%
PGE Total 7,021 4,191 0.60 29.8% 0.43
SCE Quality Maint: HP Quality Main 0 0 0.00 0.0% 0.00
SCE Quality Maint: Passthru: Coil 0 0
SCE Quality Maint: Passthru: Econo 0 0
SCE Quality Maint: Passthru: RCA 0 0
SCE Quality Maint: Passthru: Therm 0 0
SCE Quality Maint: QM HP W/Economi 0 0 0.00 0.0% 0.00
SCE Quality Maint: QM W/Economizer 81 0 0.00 0.0% 0.00
SCE Quality Maint: Quality Mainten 15 0 0.00 0.0% 0.00
SCE Total 96 0 0.00 0.0% 0.00
SDGE Deemed: Coil Cl - Condenser 0 0
SDGE Deemed: Coil Cl - Evaporator 0 0
SDGE Deemed: Economizer 0 0 0.00 0.0% 0.00
SDGE Deemed: Passthru: Economizer 0 0
SDGE Deemed: Passthru: Incentives 0 0
SDGE Deemed: RCA -4 0 0.00 0.0% 0.00
SDGE Direct Install: Coil Cl - Cond 0 0
SDGE Direct Install: Coil Cl - Evap 0 0
SDGE Direct Install: Economizer -1 0 0.00 0.0% 0.00
SDGE Direct Install: PassThru Therm 188 188 1.00 100.0%
SDGE Direct Install: RCA -1 0 0.00 0.0% 0.00
SDGE Total 183 188 1.03 103.0% 0.00
Statewide 7,300 4,379 0.60 31.2% 0.42
DNV GL AA - 8 Appendix AA - Std. High Level Savings
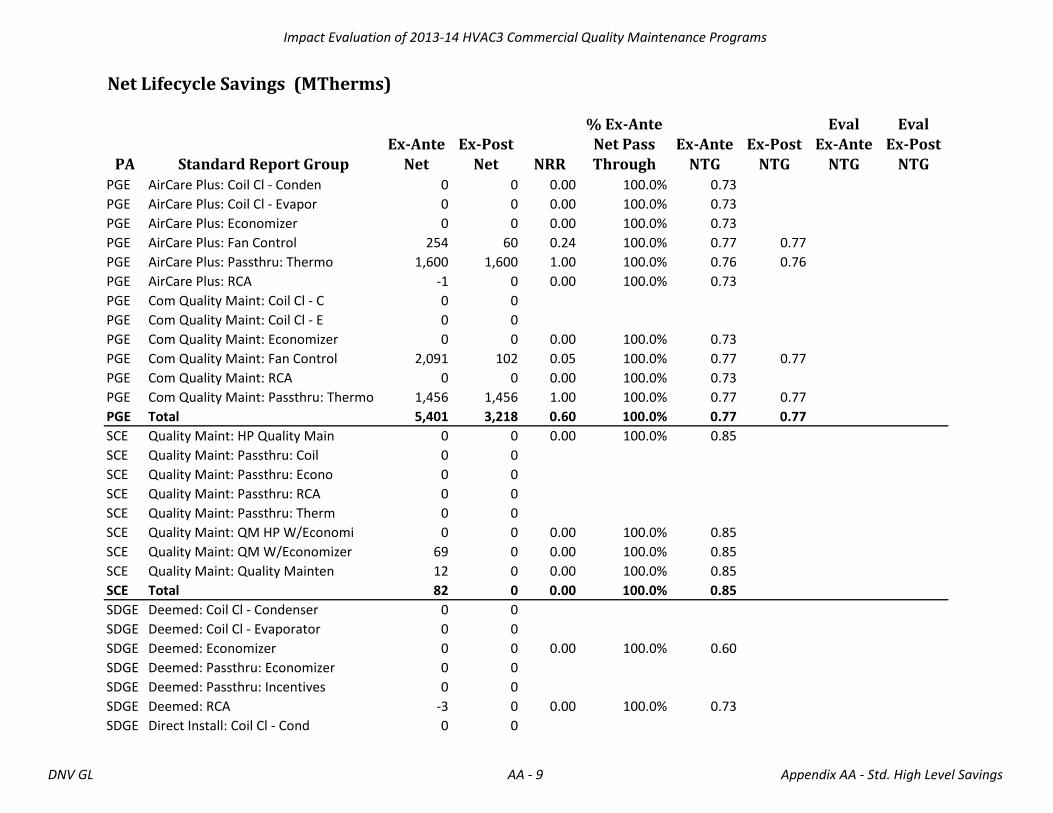
Impact Evaluation of 2013-14 HVAC3 Commercial Quality Maintenance Programs
Net Lifecycle Savings (MTherms)
PA Standard Report GroupEx-Ante
NetEx-Post
Net NRR
% Ex-Ante
Net Pass Through
Ex-Ante NTG
Ex-Post NTG
Eval
Ex-Ante NTG
Eval
Ex-Post NTG
PGE AirCare Plus: Coil Cl - Conden 0 0 0.00 100.0% 0.73
PGE AirCare Plus: Coil Cl - Evapor 0 0 0.00 100.0% 0.73
PGE AirCare Plus: Economizer 0 0 0.00 100.0% 0.73
PGE AirCare Plus: Fan Control 254 60 0.24 100.0% 0.77 0.77
PGE AirCare Plus: Passthru: Thermo 1,600 1,600 1.00 100.0% 0.76 0.76
PGE AirCare Plus: RCA -1 0 0.00 100.0% 0.73
PGE Com Quality Maint: Coil Cl - C 0 0
PGE Com Quality Maint: Coil Cl - E 0 0
PGE Com Quality Maint: Economizer 0 0 0.00 100.0% 0.73
PGE Com Quality Maint: Fan Control 2,091 102 0.05 100.0% 0.77 0.77
PGE Com Quality Maint: RCA 0 0 0.00 100.0% 0.73
PGE Com Quality Maint: Passthru: Thermo 1,456 1,456 1.00 100.0% 0.77 0.77
PGE Total 5,401 3,218 0.60 100.0% 0.77 0.77
SCE Quality Maint: HP Quality Main 0 0 0.00 100.0% 0.85
SCE Quality Maint: Passthru: Coil 0 0
SCE Quality Maint: Passthru: Econo 0 0
SCE Quality Maint: Passthru: RCA 0 0
SCE Quality Maint: Passthru: Therm 0 0
SCE Quality Maint: QM HP W/Economi 0 0 0.00 100.0% 0.85
SCE Quality Maint: QM W/Economizer 69 0 0.00 100.0% 0.85
SCE Quality Maint: Quality Mainten 12 0 0.00 100.0% 0.85
SCE Total 82 0 0.00 100.0% 0.85
SDGE Deemed: Coil Cl - Condenser 0 0
SDGE Deemed: Coil Cl - Evaporator 0 0
SDGE Deemed: Economizer 0 0 0.00 100.0% 0.60
SDGE Deemed: Passthru: Economizer 0 0
SDGE Deemed: Passthru: Incentives 0 0
SDGE Deemed: RCA -3 0 0.00 100.0% 0.73
SDGE Direct Install: Coil Cl - Cond 0 0
DNV GL AA - 9 Appendix AA - Std. High Level Savings
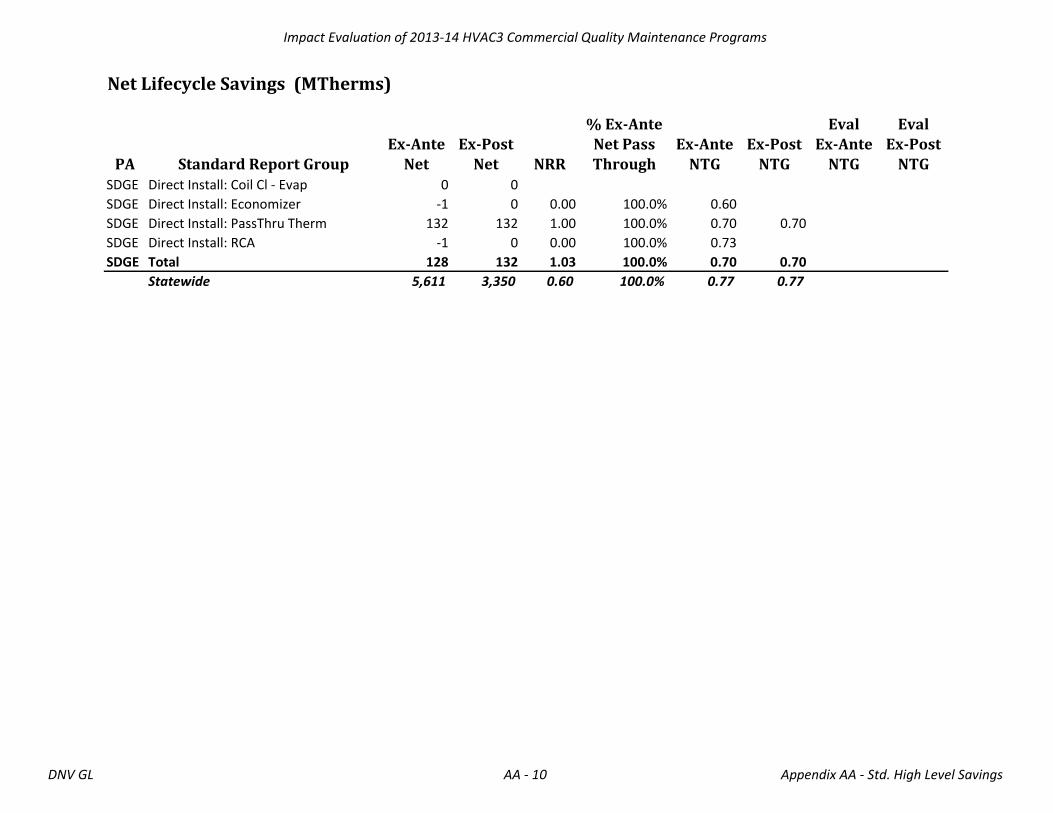
Impact Evaluation of 2013-14 HVAC3 Commercial Quality Maintenance Programs
Net Lifecycle Savings (MTherms)
PA Standard Report GroupEx-Ante
NetEx-Post
Net NRR
% Ex-Ante
Net Pass Through
Ex-Ante NTG
Ex-Post NTG
Eval
Ex-Ante NTG
Eval
Ex-Post NTG
SDGE Direct Install: Coil Cl - Evap 0 0
SDGE Direct Install: Economizer -1 0 0.00 100.0% 0.60
SDGE Direct Install: PassThru Therm 132 132 1.00 100.0% 0.70 0.70
SDGE Direct Install: RCA -1 0 0.00 100.0% 0.73
SDGE Total 128 132 1.03 100.0% 0.70 0.70
Statewide 5,611 3,350 0.60 100.0% 0.77 0.77
DNV GL AA - 10 Appendix AA - Std. High Level Savings
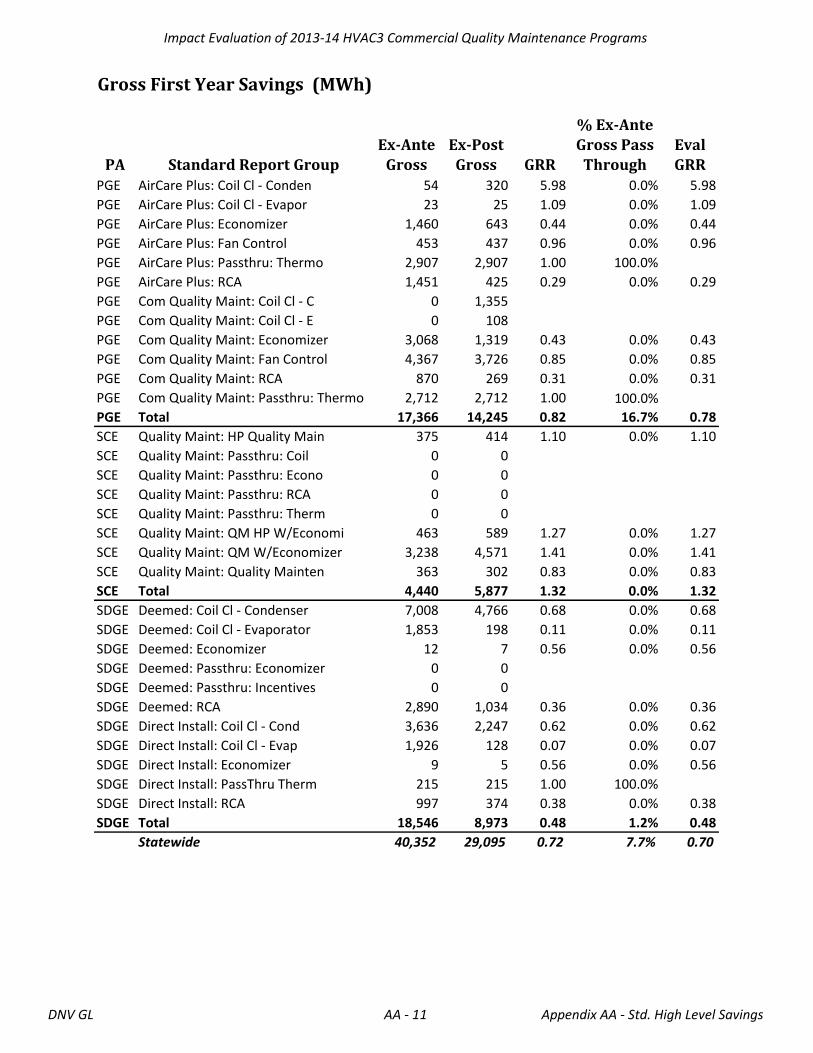
Impact Evaluation of 2013-14 HVAC3 Commercial Quality Maintenance Programs
Gross First Year Savings (MWh)
PA Standard Report GroupEx-Ante
GrossEx-Post Gross GRR
% Ex-Ante Gross Pass
ThroughEval GRR
PGE AirCare Plus: Coil Cl - Conden 54 320 5.98 0.0% 5.98
PGE AirCare Plus: Coil Cl - Evapor 23 25 1.09 0.0% 1.09
PGE AirCare Plus: Economizer 1,460 643 0.44 0.0% 0.44
PGE AirCare Plus: Fan Control 453 437 0.96 0.0% 0.96
PGE AirCare Plus: Passthru: Thermo 2,907 2,907 1.00 100.0%
PGE AirCare Plus: RCA 1,451 425 0.29 0.0% 0.29
PGE Com Quality Maint: Coil Cl - C 0 1,355
PGE Com Quality Maint: Coil Cl - E 0 108
PGE Com Quality Maint: Economizer 3,068 1,319 0.43 0.0% 0.43
PGE Com Quality Maint: Fan Control 4,367 3,726 0.85 0.0% 0.85
PGE Com Quality Maint: RCA 870 269 0.31 0.0% 0.31
PGE Com Quality Maint: Passthru: Thermo 2,712 2,712 1.00 100.0%
PGE Total 17,366 14,245 0.82 16.7% 0.78
SCE Quality Maint: HP Quality Main 375 414 1.10 0.0% 1.10
SCE Quality Maint: Passthru: Coil 0 0
SCE Quality Maint: Passthru: Econo 0 0
SCE Quality Maint: Passthru: RCA 0 0
SCE Quality Maint: Passthru: Therm 0 0
SCE Quality Maint: QM HP W/Economi 463 589 1.27 0.0% 1.27
SCE Quality Maint: QM W/Economizer 3,238 4,571 1.41 0.0% 1.41
SCE Quality Maint: Quality Mainten 363 302 0.83 0.0% 0.83
SCE Total 4,440 5,877 1.32 0.0% 1.32
SDGE Deemed: Coil Cl - Condenser 7,008 4,766 0.68 0.0% 0.68
SDGE Deemed: Coil Cl - Evaporator 1,853 198 0.11 0.0% 0.11
SDGE Deemed: Economizer 12 7 0.56 0.0% 0.56
SDGE Deemed: Passthru: Economizer 0 0
SDGE Deemed: Passthru: Incentives 0 0
SDGE Deemed: RCA 2,890 1,034 0.36 0.0% 0.36
SDGE Direct Install: Coil Cl - Cond 3,636 2,247 0.62 0.0% 0.62
SDGE Direct Install: Coil Cl - Evap 1,926 128 0.07 0.0% 0.07
SDGE Direct Install: Economizer 9 5 0.56 0.0% 0.56
SDGE Direct Install: PassThru Therm 215 215 1.00 100.0%
SDGE Direct Install: RCA 997 374 0.38 0.0% 0.38
SDGE Total 18,546 8,973 0.48 1.2% 0.48
Statewide 40,352 29,095 0.72 7.7% 0.70
DNV GL AA - 11 Appendix AA - Std. High Level Savings
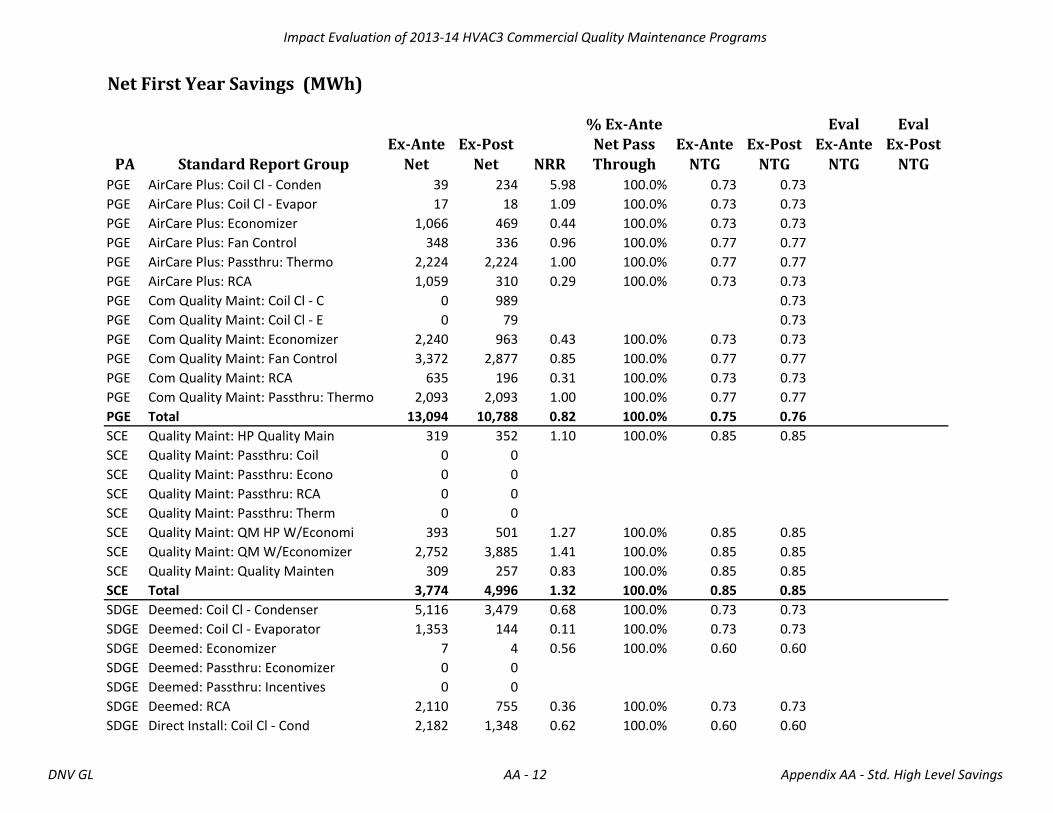
Impact Evaluation of 2013-14 HVAC3 Commercial Quality Maintenance Programs
Net First Year Savings (MWh)
PA Standard Report GroupEx-Ante
NetEx-Post
Net NRR
% Ex-Ante
Net Pass Through
Ex-Ante NTG
Ex-Post NTG
Eval
Ex-Ante NTG
Eval
Ex-Post NTG
PGE AirCare Plus: Coil Cl - Conden 39 234 5.98 100.0% 0.73 0.73
PGE AirCare Plus: Coil Cl - Evapor 17 18 1.09 100.0% 0.73 0.73
PGE AirCare Plus: Economizer 1,066 469 0.44 100.0% 0.73 0.73
PGE AirCare Plus: Fan Control 348 336 0.96 100.0% 0.77 0.77
PGE AirCare Plus: Passthru: Thermo 2,224 2,224 1.00 100.0% 0.77 0.77
PGE AirCare Plus: RCA 1,059 310 0.29 100.0% 0.73 0.73
PGE Com Quality Maint: Coil Cl - C 0 989 0.73
PGE Com Quality Maint: Coil Cl - E 0 79 0.73
PGE Com Quality Maint: Economizer 2,240 963 0.43 100.0% 0.73 0.73
PGE Com Quality Maint: Fan Control 3,372 2,877 0.85 100.0% 0.77 0.77
PGE Com Quality Maint: RCA 635 196 0.31 100.0% 0.73 0.73
PGE Com Quality Maint: Passthru: Thermo 2,093 2,093 1.00 100.0% 0.77 0.77
PGE Total 13,094 10,788 0.82 100.0% 0.75 0.76
SCE Quality Maint: HP Quality Main 319 352 1.10 100.0% 0.85 0.85
SCE Quality Maint: Passthru: Coil 0 0
SCE Quality Maint: Passthru: Econo 0 0
SCE Quality Maint: Passthru: RCA 0 0
SCE Quality Maint: Passthru: Therm 0 0
SCE Quality Maint: QM HP W/Economi 393 501 1.27 100.0% 0.85 0.85
SCE Quality Maint: QM W/Economizer 2,752 3,885 1.41 100.0% 0.85 0.85
SCE Quality Maint: Quality Mainten 309 257 0.83 100.0% 0.85 0.85
SCE Total 3,774 4,996 1.32 100.0% 0.85 0.85
SDGE Deemed: Coil Cl - Condenser 5,116 3,479 0.68 100.0% 0.73 0.73
SDGE Deemed: Coil Cl - Evaporator 1,353 144 0.11 100.0% 0.73 0.73
SDGE Deemed: Economizer 7 4 0.56 100.0% 0.60 0.60
SDGE Deemed: Passthru: Economizer 0 0
SDGE Deemed: Passthru: Incentives 0 0
SDGE Deemed: RCA 2,110 755 0.36 100.0% 0.73 0.73
SDGE Direct Install: Coil Cl - Cond 2,182 1,348 0.62 100.0% 0.60 0.60
DNV GL AA - 12 Appendix AA - Std. High Level Savings

Impact Evaluation of 2013-14 HVAC3 Commercial Quality Maintenance Programs
Net First Year Savings (MWh)
PA Standard Report GroupEx-Ante
NetEx-Post
Net NRR
% Ex-Ante
Net Pass Through
Ex-Ante NTG
Ex-Post NTG
Eval
Ex-Ante NTG
Eval
Ex-Post NTG
SDGE Direct Install: Coil Cl - Evap 1,155 77 0.07 100.0% 0.60 0.60
SDGE Direct Install: Economizer 6 3 0.56 100.0% 0.60 0.60
SDGE Direct Install: PassThru Therm 150 150 1.00 100.0% 0.70 0.70
SDGE Direct Install: RCA 728 273 0.38 100.0% 0.73 0.73
SDGE Total 12,807 6,234 0.49 100.0% 0.69 0.69
Statewide 29,674 22,017 0.74 100.0% 0.74 0.76
DNV GL AA - 13 Appendix AA - Std. High Level Savings

Impact Evaluation of 2013-14 HVAC3 Commercial Quality Maintenance Programs
Gross First Year Savings (MW)
PA Standard Report GroupEx-Ante
GrossEx-Post Gross GRR
% Ex-Ante Gross Pass
ThroughEval GRR
PGE AirCare Plus: Coil Cl - Conden 0.0 0.1 2.21 0.0% 2.21
PGE AirCare Plus: Coil Cl - Evapor 0.0 0.0 0.34 0.0% 0.34
PGE AirCare Plus: Economizer -0.2 -0.1 0.44 0.0% 0.44
PGE AirCare Plus: Fan Control 0.0 0.0
PGE AirCare Plus: Passthru: Thermo 0.0 0.0
PGE AirCare Plus: RCA 0.9 0.1 0.11 0.0% 0.11
PGE Com Quality Maint: Coil Cl - C 0.0 0.7
PGE Com Quality Maint: Coil Cl - E 0.0 0.1
PGE Com Quality Maint: Economizer -0.2 -0.1 0.43 0.0% 0.43
PGE Com Quality Maint: Fan Control 0.0 0.0
PGE Com Quality Maint: RCA 0.7 0.1 0.15 0.0% 0.15
PGE Com Quality Maint: Passthru: Thermo 0.0 0.0
PGE Total 1.3 0.8 0.66 0.0% 0.66
SCE Quality Maint: HP Quality Main 0.2 0.1 0.50 0.0% 0.50
SCE Quality Maint: Passthru: Coil 0.0 0.0
SCE Quality Maint: Passthru: Econo 0.0 0.0
SCE Quality Maint: Passthru: RCA 0.0 0.0
SCE Quality Maint: Passthru: Therm 0.0 0.0
SCE Quality Maint: QM HP W/Economi 0.2 0.0 0.21 0.0% 0.21
SCE Quality Maint: QM W/Economizer 1.2 0.4 0.38 0.0% 0.38
SCE Quality Maint: Quality Mainten 0.2 0.1 0.36 0.0% 0.36
SCE Total 1.6 0.6 0.37 0.0% 0.37
SDGE Deemed: Coil Cl - Condenser 2.3 2.8 1.22 0.0% 1.22
SDGE Deemed: Coil Cl - Evaporator 0.6 0.1 0.24 0.0% 0.24
SDGE Deemed: Economizer 0.0 0.0 0.56 0.0% 0.56
SDGE Deemed: Passthru: Economizer 0.0 0.0
SDGE Deemed: Passthru: Incentives 0.0 0.0
SDGE Deemed: RCA 2.3 0.6 0.28 0.0% 0.28
SDGE Direct Install: Coil Cl - Cond 1.1 1.3 1.20 0.0% 1.20
SDGE Direct Install: Coil Cl - Evap 0.5 0.1 0.20 0.0% 0.20
SDGE Direct Install: Economizer 0.0 0.0 0.56 0.0% 0.56
SDGE Direct Install: PassThru Therm 0.0 0.0 1.00 100.0%
SDGE Direct Install: RCA 0.7 0.2 0.31 0.0% 0.31
SDGE Total 7.4 5.2 0.70 -0.6% 0.70
Statewide 10.3 6.6 0.64 -0.4% 0.64
DNV GL AA - 14 Appendix AA - Std. High Level Savings

Impact Evaluation of 2013-14 HVAC3 Commercial Quality Maintenance Programs
Net First Year Savings (MW)
PA Standard Report GroupEx-Ante
NetEx-Post
Net NRR
% Ex-Ante
Net Pass Through
Ex-Ante NTG
Ex-Post NTG
Eval
Ex-Ante NTG
Eval
Ex-Post NTG
PGE AirCare Plus: Coil Cl - Conden 0.0 0.1 2.21 100.0% 0.73 0.73
PGE AirCare Plus: Coil Cl - Evapor 0.0 0.0 0.34 100.0% 0.73 0.73
PGE AirCare Plus: Economizer -0.2 -0.1 0.44 100.0% 0.73 0.73
PGE AirCare Plus: Fan Control 0.0 0.0
PGE AirCare Plus: Passthru: Thermo 0.0 0.0
PGE AirCare Plus: RCA 0.6 0.1 0.11 100.0% 0.73 0.73
PGE Com Quality Maint: Coil Cl - C 0.0 0.5 0.73
PGE Com Quality Maint: Coil Cl - E 0.0 0.0 0.73
PGE Com Quality Maint: Economizer -0.1 -0.1 0.43 100.0% 0.73 0.73
PGE Com Quality Maint: Fan Control 0.0 0.0
PGE Com Quality Maint: RCA 0.5 0.1 0.15 100.0% 0.73 0.73
PGE Com Quality Maint: Passthru: Thermo 0.0 0.0
PGE Total 0.9 0.6 0.66 100.0% 0.73 0.73
SCE Quality Maint: HP Quality Main 0.1 0.1 0.50 100.0% 0.85 0.85
SCE Quality Maint: Passthru: Coil 0.0 0.0
SCE Quality Maint: Passthru: Econo 0.0 0.0
SCE Quality Maint: Passthru: RCA 0.0 0.0
SCE Quality Maint: Passthru: Therm 0.0 0.0
SCE Quality Maint: QM HP W/Economi 0.2 0.0 0.21 100.0% 0.85 0.85
SCE Quality Maint: QM W/Economizer 1.0 0.4 0.38 100.0% 0.85 0.85
SCE Quality Maint: Quality Mainten 0.1 0.0 0.36 100.0% 0.85 0.85
SCE Total 1.4 0.5 0.37 100.0% 0.85 0.85
SDGE Deemed: Coil Cl - Condenser 1.7 2.0 1.22 100.0% 0.73 0.73
SDGE Deemed: Coil Cl - Evaporator 0.4 0.1 0.24 100.0% 0.73 0.73
SDGE Deemed: Economizer 0.0 0.0 0.56 100.0% 0.60 0.60
SDGE Deemed: Passthru: Economizer 0.0 0.0
SDGE Deemed: Passthru: Incentives 0.0 0.0
SDGE Deemed: RCA 1.6 0.5 0.28 100.0% 0.73 0.73
SDGE Direct Install: Coil Cl - Cond 0.7 0.8 1.20 100.0% 0.60 0.60
DNV GL AA - 15 Appendix AA - Std. High Level Savings
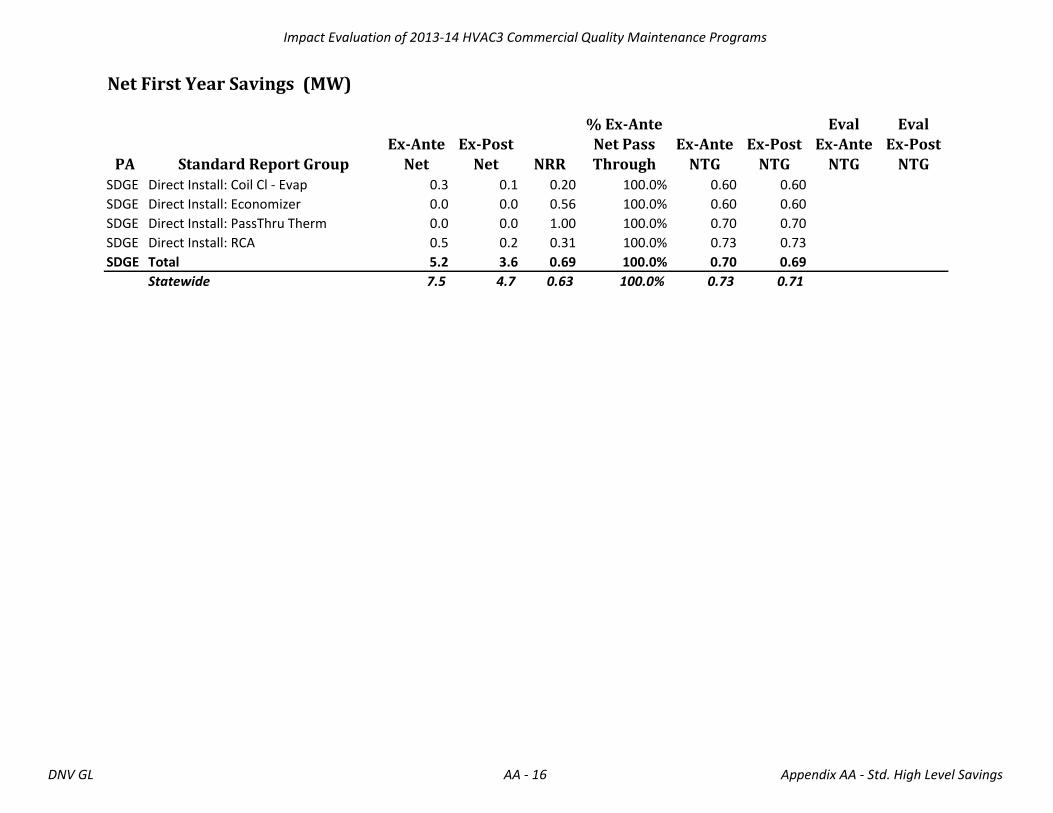
Impact Evaluation of 2013-14 HVAC3 Commercial Quality Maintenance Programs
Net First Year Savings (MW)
PA Standard Report GroupEx-Ante
NetEx-Post
Net NRR
% Ex-Ante
Net Pass Through
Ex-Ante NTG
Ex-Post NTG
Eval
Ex-Ante NTG
Eval
Ex-Post NTG
SDGE Direct Install: Coil Cl - Evap 0.3 0.1 0.20 100.0% 0.60 0.60
SDGE Direct Install: Economizer 0.0 0.0 0.56 100.0% 0.60 0.60
SDGE Direct Install: PassThru Therm 0.0 0.0 1.00 100.0% 0.70 0.70
SDGE Direct Install: RCA 0.5 0.2 0.31 100.0% 0.73 0.73
SDGE Total 5.2 3.6 0.69 100.0% 0.70 0.69
Statewide 7.5 4.7 0.63 100.0% 0.73 0.71
DNV GL AA - 16 Appendix AA - Std. High Level Savings
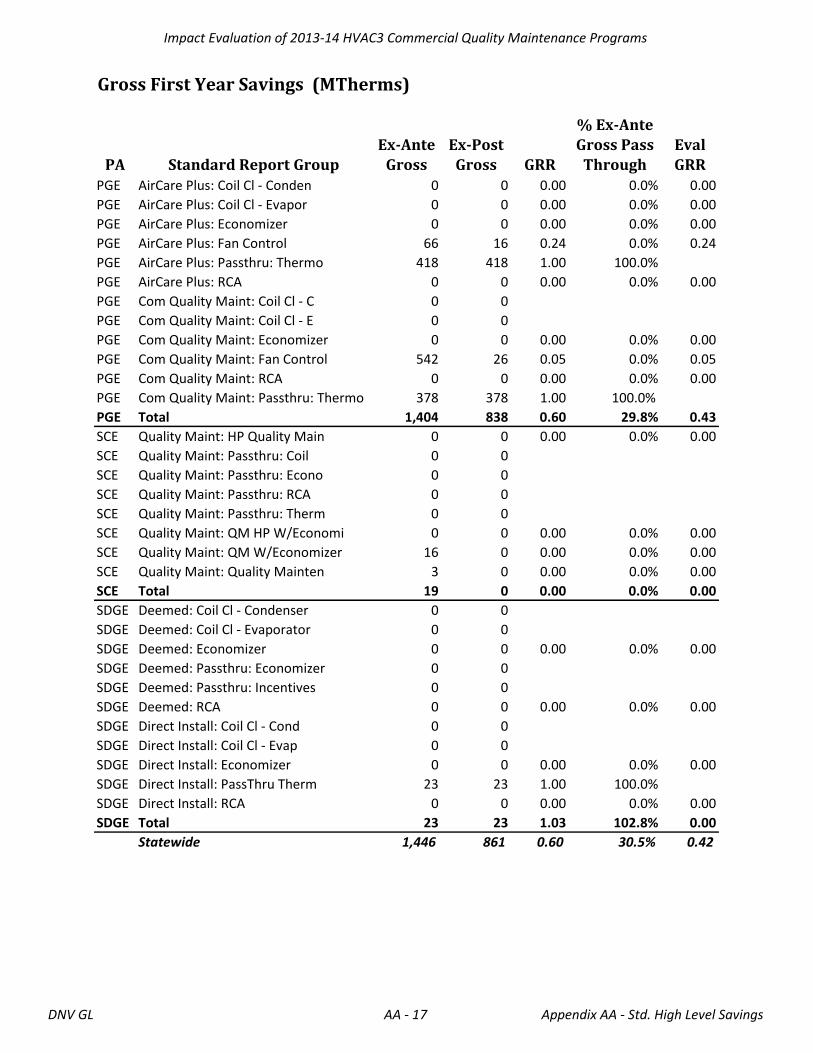
Impact Evaluation of 2013-14 HVAC3 Commercial Quality Maintenance Programs
Gross First Year Savings (MTherms)
PA Standard Report GroupEx-Ante
GrossEx-Post Gross GRR
% Ex-Ante Gross Pass
ThroughEval GRR
PGE AirCare Plus: Coil Cl - Conden 0 0 0.00 0.0% 0.00
PGE AirCare Plus: Coil Cl - Evapor 0 0 0.00 0.0% 0.00
PGE AirCare Plus: Economizer 0 0 0.00 0.0% 0.00
PGE AirCare Plus: Fan Control 66 16 0.24 0.0% 0.24
PGE AirCare Plus: Passthru: Thermo 418 418 1.00 100.0%
PGE AirCare Plus: RCA 0 0 0.00 0.0% 0.00
PGE Com Quality Maint: Coil Cl - C 0 0
PGE Com Quality Maint: Coil Cl - E 0 0
PGE Com Quality Maint: Economizer 0 0 0.00 0.0% 0.00
PGE Com Quality Maint: Fan Control 542 26 0.05 0.0% 0.05
PGE Com Quality Maint: RCA 0 0 0.00 0.0% 0.00
PGE Com Quality Maint: Passthru: Thermo 378 378 1.00 100.0%
PGE Total 1,404 838 0.60 29.8% 0.43
SCE Quality Maint: HP Quality Main 0 0 0.00 0.0% 0.00
SCE Quality Maint: Passthru: Coil 0 0
SCE Quality Maint: Passthru: Econo 0 0
SCE Quality Maint: Passthru: RCA 0 0
SCE Quality Maint: Passthru: Therm 0 0
SCE Quality Maint: QM HP W/Economi 0 0 0.00 0.0% 0.00
SCE Quality Maint: QM W/Economizer 16 0 0.00 0.0% 0.00
SCE Quality Maint: Quality Mainten 3 0 0.00 0.0% 0.00
SCE Total 19 0 0.00 0.0% 0.00
SDGE Deemed: Coil Cl - Condenser 0 0
SDGE Deemed: Coil Cl - Evaporator 0 0
SDGE Deemed: Economizer 0 0 0.00 0.0% 0.00
SDGE Deemed: Passthru: Economizer 0 0
SDGE Deemed: Passthru: Incentives 0 0
SDGE Deemed: RCA 0 0 0.00 0.0% 0.00
SDGE Direct Install: Coil Cl - Cond 0 0
SDGE Direct Install: Coil Cl - Evap 0 0
SDGE Direct Install: Economizer 0 0 0.00 0.0% 0.00
SDGE Direct Install: PassThru Therm 23 23 1.00 100.0%
SDGE Direct Install: RCA 0 0 0.00 0.0% 0.00
SDGE Total 23 23 1.03 102.8% 0.00
Statewide 1,446 861 0.60 30.5% 0.42
DNV GL AA - 17 Appendix AA - Std. High Level Savings

Impact Evaluation of 2013-14 HVAC3 Commercial Quality Maintenance Programs
Net First Year Savings (MTherms)
PA Standard Report GroupEx-Ante
NetEx-Post
Net NRR
% Ex-Ante
Net Pass Through
Ex-Ante NTG
Ex-Post NTG
Eval
Ex-Ante NTG
Eval
Ex-Post NTG
PGE AirCare Plus: Coil Cl - Conden 0 0 0.00 100.0% 0.73
PGE AirCare Plus: Coil Cl - Evapor 0 0 0.00 100.0% 0.73
PGE AirCare Plus: Economizer 0 0 0.00 100.0% 0.73
PGE AirCare Plus: Fan Control 51 12 0.24 100.0% 0.77 0.77
PGE AirCare Plus: Passthru: Thermo 320 320 1.00 100.0% 0.76 0.76
PGE AirCare Plus: RCA 0 0 0.00 100.0% 0.73
PGE Com Quality Maint: Coil Cl - C 0 0
PGE Com Quality Maint: Coil Cl - E 0 0
PGE Com Quality Maint: Economizer 0 0 0.00 100.0% 0.73
PGE Com Quality Maint: Fan Control 418 20 0.05 100.0% 0.77 0.77
PGE Com Quality Maint: RCA 0 0 0.00 100.0% 0.73
PGE Com Quality Maint: Passthru: Thermo 291 291 1.00 100.0% 0.77 0.77
PGE Total 1,080 644 0.60 100.0% 0.77 0.77
SCE Quality Maint: HP Quality Main 0 0 0.00 100.0% 0.85
SCE Quality Maint: Passthru: Coil 0 0
SCE Quality Maint: Passthru: Econo 0 0
SCE Quality Maint: Passthru: RCA 0 0
SCE Quality Maint: Passthru: Therm 0 0
SCE Quality Maint: QM HP W/Economi 0 0 0.00 100.0% 0.85
SCE Quality Maint: QM W/Economizer 14 0 0.00 100.0% 0.85
SCE Quality Maint: Quality Mainten 2 0 0.00 100.0% 0.85
SCE Total 16 0 0.00 100.0% 0.85
SDGE Deemed: Coil Cl - Condenser 0 0
SDGE Deemed: Coil Cl - Evaporator 0 0
SDGE Deemed: Economizer 0 0 0.00 100.0% 0.60
SDGE Deemed: Passthru: Economizer 0 0
SDGE Deemed: Passthru: Incentives 0 0
SDGE Deemed: RCA 0 0 0.00 100.0% 0.73
SDGE Direct Install: Coil Cl - Cond 0 0
DNV GL AA - 18 Appendix AA - Std. High Level Savings

Impact Evaluation of 2013-14 HVAC3 Commercial Quality Maintenance Programs
Net First Year Savings (MTherms)
PA Standard Report GroupEx-Ante
NetEx-Post
Net NRR
% Ex-Ante
Net Pass Through
Ex-Ante NTG
Ex-Post NTG
Eval
Ex-Ante NTG
Eval
Ex-Post NTG
SDGE Direct Install: Coil Cl - Evap 0 0
SDGE Direct Install: Economizer 0 0 0.00 100.0% 0.60
SDGE Direct Install: PassThru Therm 16 16 1.00 100.0% 0.70 0.70
SDGE Direct Install: RCA 0 0 0.00 100.0% 0.73
SDGE Total 16 16 1.03 100.0% 0.70 0.70
Statewide 1,112 660 0.59 100.0% 0.77 0.77
DNV GL AA - 19 Appendix AA - Std. High Level Savings

STANDARDIZED PER UNIT SAVINGS Appendix BB.
DNV GL – www.dnvgl.com 4/1/16 Page BB-1
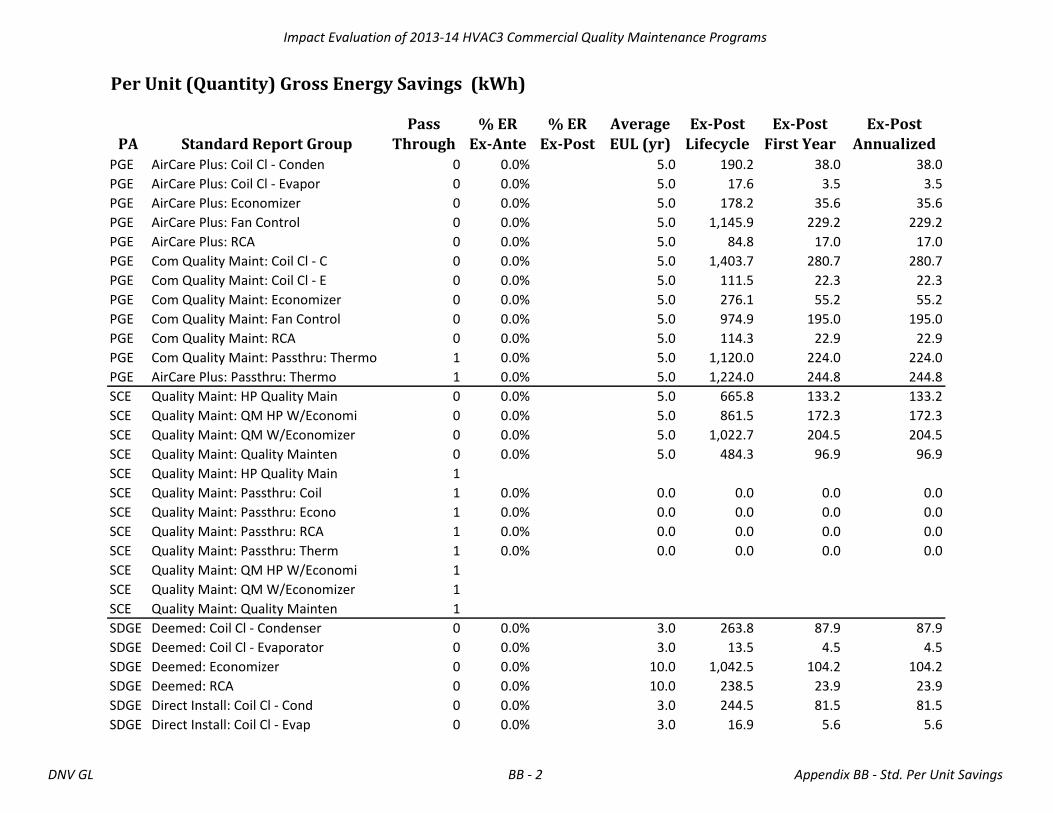
Impact Evaluation of 2013-14 HVAC3 Commercial Quality Maintenance Programs
Per Unit (Quantity) Gross Energy Savings (kWh)
PA Standard Report Group
Pass
Through
% ER
Ex-Ante
% ER
Ex-Post
Average
EUL (yr)
Ex-Post
Lifecycle
Ex-Post
First Year
Ex-Post
Annualized
PGE AirCare Plus: Coil Cl - Conden 0 0.0% 5.0 190.2 38.0 38.0
PGE AirCare Plus: Coil Cl - Evapor 0 0.0% 5.0 17.6 3.5 3.5
PGE AirCare Plus: Economizer 0 0.0% 5.0 178.2 35.6 35.6
PGE AirCare Plus: Fan Control 0 0.0% 5.0 1,145.9 229.2 229.2
PGE AirCare Plus: RCA 0 0.0% 5.0 84.8 17.0 17.0
PGE Com Quality Maint: Coil Cl - C 0 0.0% 5.0 1,403.7 280.7 280.7
PGE Com Quality Maint: Coil Cl - E 0 0.0% 5.0 111.5 22.3 22.3
PGE Com Quality Maint: Economizer 0 0.0% 5.0 276.1 55.2 55.2
PGE Com Quality Maint: Fan Control 0 0.0% 5.0 974.9 195.0 195.0
PGE Com Quality Maint: RCA 0 0.0% 5.0 114.3 22.9 22.9
PGE Com Quality Maint: Passthru: Thermo 1 0.0% 5.0 1,120.0 224.0 224.0
PGE AirCare Plus: Passthru: Thermo 1 0.0% 5.0 1,224.0 244.8 244.8
SCE Quality Maint: HP Quality Main 0 0.0% 5.0 665.8 133.2 133.2
SCE Quality Maint: QM HP W/Economi 0 0.0% 5.0 861.5 172.3 172.3
SCE Quality Maint: QM W/Economizer 0 0.0% 5.0 1,022.7 204.5 204.5
SCE Quality Maint: Quality Mainten 0 0.0% 5.0 484.3 96.9 96.9
SCE Quality Maint: HP Quality Main 1
SCE Quality Maint: Passthru: Coil 1 0.0% 0.0 0.0 0.0 0.0
SCE Quality Maint: Passthru: Econo 1 0.0% 0.0 0.0 0.0 0.0
SCE Quality Maint: Passthru: RCA 1 0.0% 0.0 0.0 0.0 0.0
SCE Quality Maint: Passthru: Therm 1 0.0% 0.0 0.0 0.0 0.0
SCE Quality Maint: QM HP W/Economi 1
SCE Quality Maint: QM W/Economizer 1
SCE Quality Maint: Quality Mainten 1
SDGE Deemed: Coil Cl - Condenser 0 0.0% 3.0 263.8 87.9 87.9
SDGE Deemed: Coil Cl - Evaporator 0 0.0% 3.0 13.5 4.5 4.5
SDGE Deemed: Economizer 0 0.0% 10.0 1,042.5 104.2 104.2
SDGE Deemed: RCA 0 0.0% 10.0 238.5 23.9 23.9
SDGE Direct Install: Coil Cl - Cond 0 0.0% 3.0 244.5 81.5 81.5
SDGE Direct Install: Coil Cl - Evap 0 0.0% 3.0 16.9 5.6 5.6
DNV GL BB - 2 Appendix BB - Std. Per Unit Savings
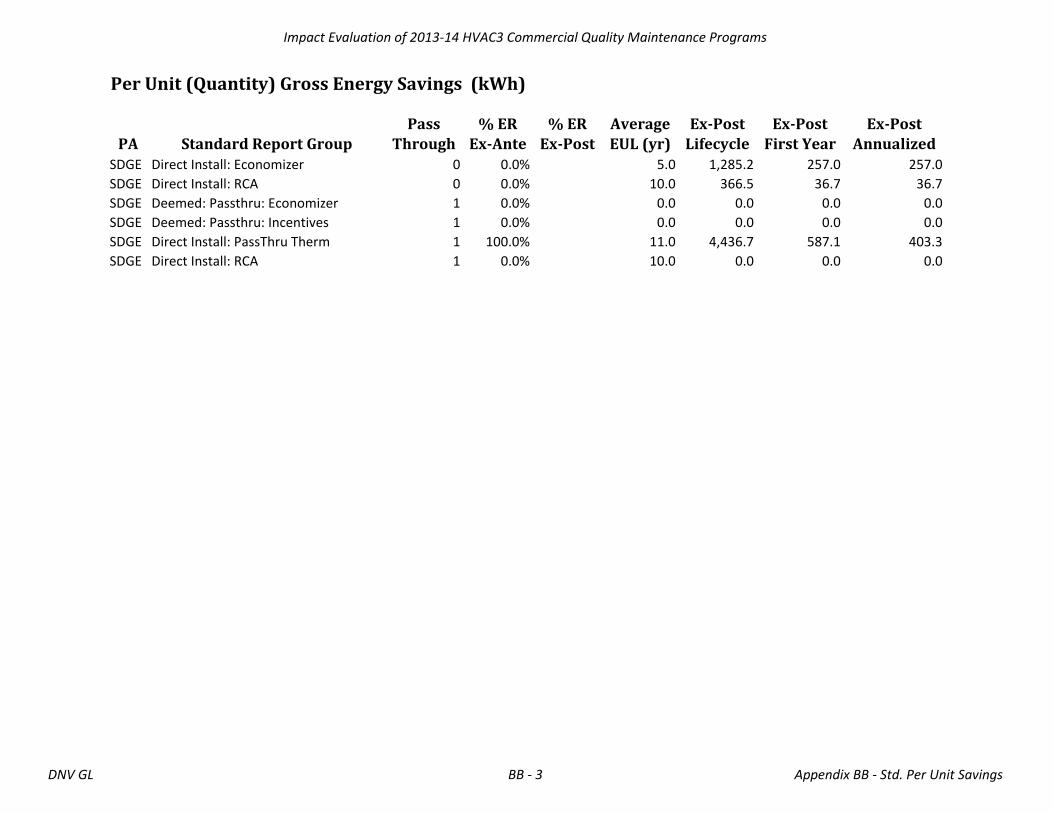
Impact Evaluation of 2013-14 HVAC3 Commercial Quality Maintenance Programs
Per Unit (Quantity) Gross Energy Savings (kWh)
PA Standard Report Group
Pass
Through
% ER
Ex-Ante
% ER
Ex-Post
Average
EUL (yr)
Ex-Post
Lifecycle
Ex-Post
First Year
Ex-Post
AnnualizedSDGE Direct Install: Economizer 0 0.0% 5.0 1,285.2 257.0 257.0
SDGE Direct Install: RCA 0 0.0% 10.0 366.5 36.7 36.7
SDGE Deemed: Passthru: Economizer 1 0.0% 0.0 0.0 0.0 0.0
SDGE Deemed: Passthru: Incentives 1 0.0% 0.0 0.0 0.0 0.0
SDGE Direct Install: PassThru Therm 1 100.0% 11.0 4,436.7 587.1 403.3
SDGE Direct Install: RCA 1 0.0% 10.0 0.0 0.0 0.0
DNV GL BB - 3 Appendix BB - Std. Per Unit Savings

Impact Evaluation of 2013-14 HVAC3 Commercial Quality Maintenance Programs
Per Unit (Quantity) Gross Energy Savings (Therms)
PA Standard Report Group
Pass
Through
% ER
Ex-Ante
% ER
Ex-Post
Average
EUL (yr)
Ex-Post
Lifecycle
Ex-Post
First Year
Ex-Post
Annualized
PGE AirCare Plus: Coil Cl - Conden 0 0.0% 5.0 0.0 0.0 0.0
PGE AirCare Plus: Coil Cl - Evapor 0 0.0% 5.0 0.0 0.0 0.0
PGE AirCare Plus: Economizer 0 0.0% 5.0 0.0 0.0 0.0
PGE AirCare Plus: Fan Control 0 0.0% 5.0 40.9 8.2 8.2
PGE AirCare Plus: RCA 0 0.0% 5.0 0.0 0.0 0.0
PGE Com Quality Maint: Coil Cl - C 0 0.0% 5.0 0.0 0.0 0.0
PGE Com Quality Maint: Coil Cl - E 0 0.0% 5.0 0.0 0.0 0.0
PGE Com Quality Maint: Economizer 0 0.0% 5.0 0.0 0.0 0.0
PGE Com Quality Maint: Fan Control 0 0.0% 5.0 6.9 1.4 1.4
PGE Com Quality Maint: RCA 0 0.0% 5.0 0.0 0.0 0.0
PGE Com Quality Maint: Passthru: Thermo 0.0% 5.0 156.0 31.2 31.2
PGE AirCare Plus: Passthru: Thermo 1 0.0% 5.0 176.2 35.2 35.2
SCE Quality Maint: HP Quality Main 0 0.0% 5.0 0.0 0.0 0.0
SCE Quality Maint: QM HP W/Economi 0 0.0% 5.0 0.0 0.0 0.0
SCE Quality Maint: QM W/Economizer 0 0.0% 5.0 0.0 0.0 0.0
SCE Quality Maint: Quality Mainten 0 0.0% 5.0 0.0 0.0 0.0
SCE Quality Maint: HP Quality Main 1
SCE Quality Maint: Passthru: Coil 1 0.0% 0.0 0.0 0.0 0.0
SCE Quality Maint: Passthru: Econo 1 0.0% 0.0 0.0 0.0 0.0
SCE Quality Maint: Passthru: RCA 1 0.0% 0.0 0.0 0.0 0.0
SCE Quality Maint: Passthru: Therm 1 0.0% 0.0 0.0 0.0 0.0
SCE Quality Maint: QM HP W/Economi 1
SCE Quality Maint: QM W/Economizer 1
SCE Quality Maint: Quality Mainten 1
SDGE Deemed: Coil Cl - Condenser 0 0.0% 3.0 0.0 0.0 0.0
SDGE Deemed: Coil Cl - Evaporator 0 0.0% 3.0 0.0 0.0 0.0
SDGE Deemed: Economizer 0 0.0% 10.0 0.0 0.0 0.0
SDGE Deemed: RCA 0 0.0% 10.0 0.0 0.0 0.0
SDGE Direct Install: Coil Cl - Cond 0 0.0% 3.0 0.0 0.0 0.0
SDGE Direct Install: Coil Cl - Evap 0 0.0% 3.0 0.0 0.0 0.0
DNV GL BB - 4 Appendix BB - Std. Per Unit Savings
1
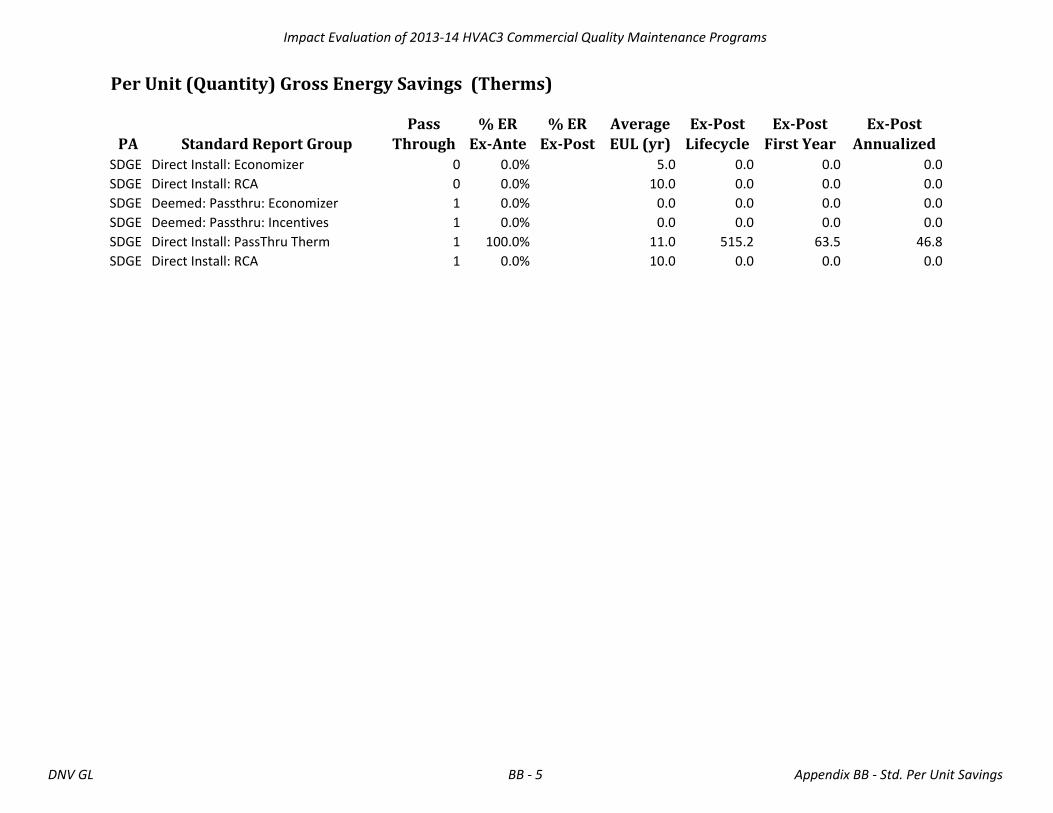
Impact Evaluation of 2013-14 HVAC3 Commercial Quality Maintenance Programs
Per Unit (Quantity) Gross Energy Savings (Therms)
PA Standard Report Group
Pass
Through
% ER
Ex-Ante
% ER
Ex-Post
Average
EUL (yr)
Ex-Post
Lifecycle
Ex-Post
First Year
Ex-Post
AnnualizedSDGE Direct Install: Economizer 0 0.0% 5.0 0.0 0.0 0.0
SDGE Direct Install: RCA 0 0.0% 10.0 0.0 0.0 0.0
SDGE Deemed: Passthru: Economizer 1 0.0% 0.0 0.0 0.0 0.0
SDGE Deemed: Passthru: Incentives 1 0.0% 0.0 0.0 0.0 0.0
SDGE Direct Install: PassThru Therm 1 100.0% 11.0 515.2 63.5 46.8
SDGE Direct Install: RCA 1 0.0% 10.0 0.0 0.0 0.0
DNV GL BB - 5 Appendix BB - Std. Per Unit Savings

Impact Evaluation of 2013-14 HVAC3 Commercial Quality Maintenance Programs
Per Unit (Quantity) Net Energy Savings (kWh)
PA Standard Report Group
Pass
Through
% ER
Ex-Ante
% ER
Ex-Post
Average
EUL (yr)
Ex-Post
Lifecycle
Ex-Post
First Year
Ex-Post
Annualized
PGE AirCare Plus: Coil Cl - Conden 1 0.0% 5.0 138.9 27.8 27.8
PGE AirCare Plus: Coil Cl - Evapor 1 0.0% 5.0 12.8 2.6 2.6
PGE AirCare Plus: Economizer 1 0.0% 5.0 130.1 26.0 26.0
PGE AirCare Plus: Fan Control 1 0.0% 5.0 879.9 176.0 176.0
PGE AirCare Plus: Passthru: Thermo 1 0.0% 5.0 936.5 187.3 187.3
PGE AirCare Plus: RCA 1 0.0% 5.0 61.9 12.4 12.4
PGE Com Quality Maint: Coil Cl - C 1 0.0% 5.0 1,024.7 204.9 204.9
PGE Com Quality Maint: Coil Cl - E 1 0.0% 5.0 81.4 16.3 16.3
PGE Com Quality Maint: Economizer 1 0.0% 5.0 201.6 40.3 40.3
PGE Com Quality Maint: Fan Control 1 0.0% 5.0 752.7 150.5 150.5
PGE Com Quality Maint: RCA 1 0.0% 5.0 83.4 16.7 16.7
PGE Com Quality Maint: Passthru: Thermo 1 0.0% 5.0 864.5 172.9 172.9
SCE Quality Maint: HP Quality Main 1 0.0% 5.0 565.9 113.2 113.2
SCE Quality Maint: Passthru: Coil 1 0.0% 0.0 0.0 0.0 0.0
SCE Quality Maint: Passthru: Econo 1 0.0% 0.0 0.0 0.0 0.0
SCE Quality Maint: Passthru: RCA 1 0.0% 0.0 0.0 0.0 0.0
SCE Quality Maint: Passthru: Therm 1 0.0% 0.0 0.0 0.0 0.0
SCE Quality Maint: QM HP W/Economi 1 0.0% 5.0 732.2 146.4 146.4
SCE Quality Maint: QM W/Economizer 1 0.0% 5.0 869.3 173.9 173.9
SCE Quality Maint: Quality Mainten 1 0.0% 5.0 411.7 82.3 82.3
SDGE Deemed: Coil Cl - Condenser 1 0.0% 3.0 192.6 64.2 64.2
SDGE Deemed: Coil Cl - Evaporator 1 0.0% 3.0 9.8 3.3 3.3
SDGE Deemed: Economizer 1 0.0% 10.0 625.5 62.5 62.5
SDGE Deemed: Passthru: Economizer 1 0.0% 0.0 0.0 0.0 0.0
SDGE Deemed: Passthru: Incentives 1 0.0% 0.0 0.0 0.0 0.0
SDGE Deemed: RCA 1 0.0% 10.0 174.1 17.4 17.4
SDGE Direct Install: Coil Cl - Cond 1 0.0% 3.0 146.7 48.9 48.9
SDGE Direct Install: Coil Cl - Evap 1 0.0% 3.0 10.2 3.4 3.4
SDGE Direct Install: Economizer 1 0.0% 5.0 771.1 154.2 154.2
SDGE Direct Install: PassThru Therm 1 100.0% 11.0 3,105.7 411.0 282.3
DNV GL BB - 6 Appendix BB - Std. Per Unit Savings

Impact Evaluation of 2013-14 HVAC3 Commercial Quality Maintenance Programs
Per Unit (Quantity) Net Energy Savings (kWh)
PA Standard Report Group
Pass
Through
% ER
Ex-Ante
% ER
Ex-Post
Average
EUL (yr)
Ex-Post
Lifecycle
Ex-Post
First Year
Ex-Post
AnnualizedSDGE Direct Install: RCA 1 0.0% 10.0 267.5 26.7 26.7
DNV GL BB - 7 Appendix BB - Std. Per Unit Savings
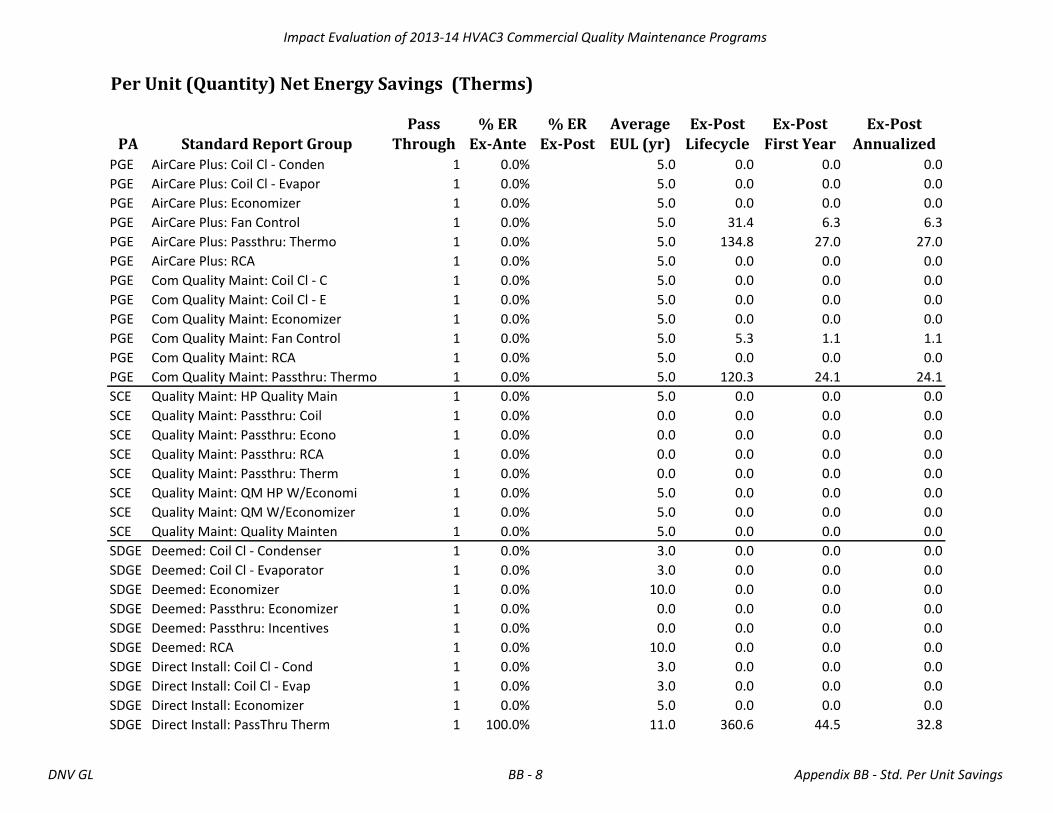
Impact Evaluation of 2013-14 HVAC3 Commercial Quality Maintenance Programs
Per Unit (Quantity) Net Energy Savings (Therms)
PA Standard Report Group
Pass
Through
% ER
Ex-Ante
% ER
Ex-Post
Average
EUL (yr)
Ex-Post
Lifecycle
Ex-Post
First Year
Ex-Post
Annualized
PGE AirCare Plus: Coil Cl - Conden 1 0.0% 5.0 0.0 0.0 0.0
PGE AirCare Plus: Coil Cl - Evapor 1 0.0% 5.0 0.0 0.0 0.0
PGE AirCare Plus: Economizer 1 0.0% 5.0 0.0 0.0 0.0
PGE AirCare Plus: Fan Control 1 0.0% 5.0 31.4 6.3 6.3
PGE AirCare Plus: Passthru: Thermo 1 0.0% 5.0 134.8 27.0 27.0
PGE AirCare Plus: RCA 1 0.0% 5.0 0.0 0.0 0.0
PGE Com Quality Maint: Coil Cl - C 1 0.0% 5.0 0.0 0.0 0.0
PGE Com Quality Maint: Coil Cl - E 1 0.0% 5.0 0.0 0.0 0.0
PGE Com Quality Maint: Economizer 1 0.0% 5.0 0.0 0.0 0.0
PGE Com Quality Maint: Fan Control 1 0.0% 5.0 5.3 1.1 1.1
PGE Com Quality Maint: RCA 1 0.0% 5.0 0.0 0.0 0.0
PGE Com Quality Maint: Passthru: Thermo 1 0.0% 5.0 120.3 24.1 24.1
SCE Quality Maint: HP Quality Main 1 0.0% 5.0 0.0 0.0 0.0
SCE Quality Maint: Passthru: Coil 1 0.0% 0.0 0.0 0.0 0.0
SCE Quality Maint: Passthru: Econo 1 0.0% 0.0 0.0 0.0 0.0
SCE Quality Maint: Passthru: RCA 1 0.0% 0.0 0.0 0.0 0.0
SCE Quality Maint: Passthru: Therm 1 0.0% 0.0 0.0 0.0 0.0
SCE Quality Maint: QM HP W/Economi 1 0.0% 5.0 0.0 0.0 0.0
SCE Quality Maint: QM W/Economizer 1 0.0% 5.0 0.0 0.0 0.0
SCE Quality Maint: Quality Mainten 1 0.0% 5.0 0.0 0.0 0.0
SDGE Deemed: Coil Cl - Condenser 1 0.0% 3.0 0.0 0.0 0.0
SDGE Deemed: Coil Cl - Evaporator 1 0.0% 3.0 0.0 0.0 0.0
SDGE Deemed: Economizer 1 0.0% 10.0 0.0 0.0 0.0
SDGE Deemed: Passthru: Economizer 1 0.0% 0.0 0.0 0.0 0.0
SDGE Deemed: Passthru: Incentives 1 0.0% 0.0 0.0 0.0 0.0
SDGE Deemed: RCA 1 0.0% 10.0 0.0 0.0 0.0
SDGE Direct Install: Coil Cl - Cond 1 0.0% 3.0 0.0 0.0 0.0
SDGE Direct Install: Coil Cl - Evap 1 0.0% 3.0 0.0 0.0 0.0
SDGE Direct Install: Economizer 1 0.0% 5.0 0.0 0.0 0.0
SDGE Direct Install: PassThru Therm 1 100.0% 11.0 360.6 44.5 32.8
DNV GL BB - 8 Appendix BB - Std. Per Unit Savings
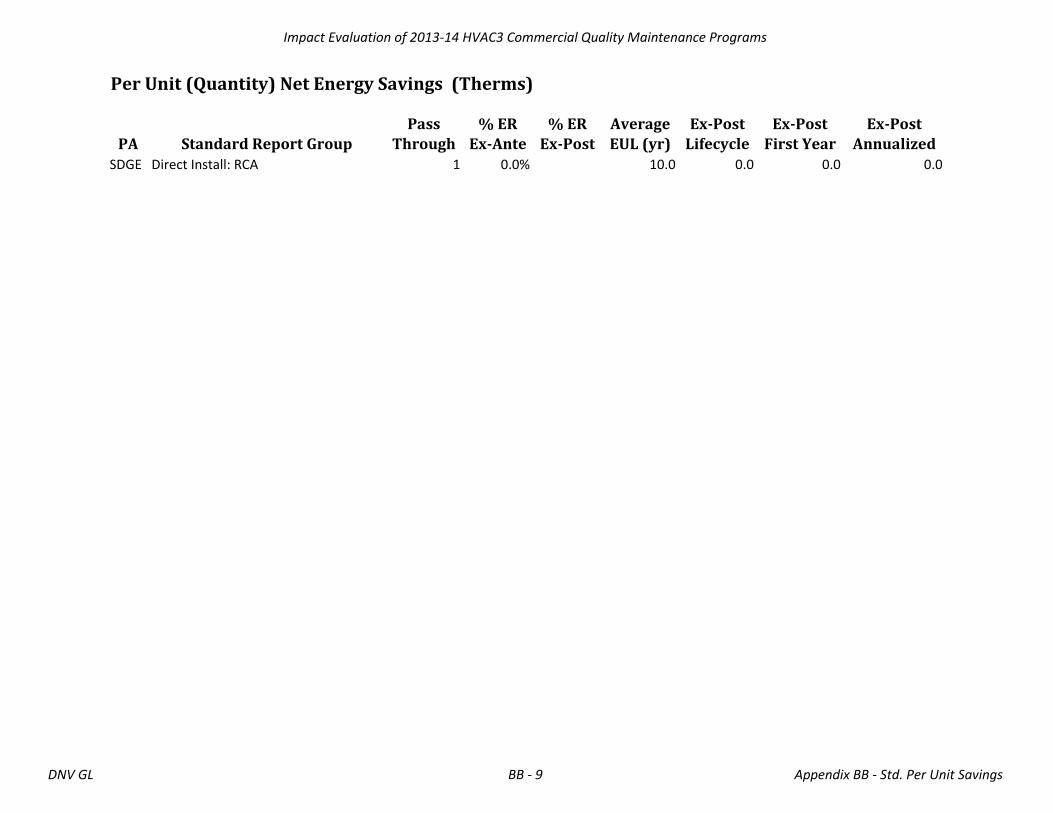
Impact Evaluation of 2013-14 HVAC3 Commercial Quality Maintenance Programs
Per Unit (Quantity) Net Energy Savings (Therms)
PA Standard Report Group
Pass
Through
% ER
Ex-Ante
% ER
Ex-Post
Average
EUL (yr)
Ex-Post
Lifecycle
Ex-Post
First Year
Ex-Post
AnnualizedSDGE Direct Install: RCA 1 0.0% 10.0 0.0 0.0 0.0
DNV GL BB - 9 Appendix BB - Std. Per Unit Savings

RECOMMENDATIONS Appendix CC.
DNV GL – www.dnvgl.com 4/1/16 Page CC-1
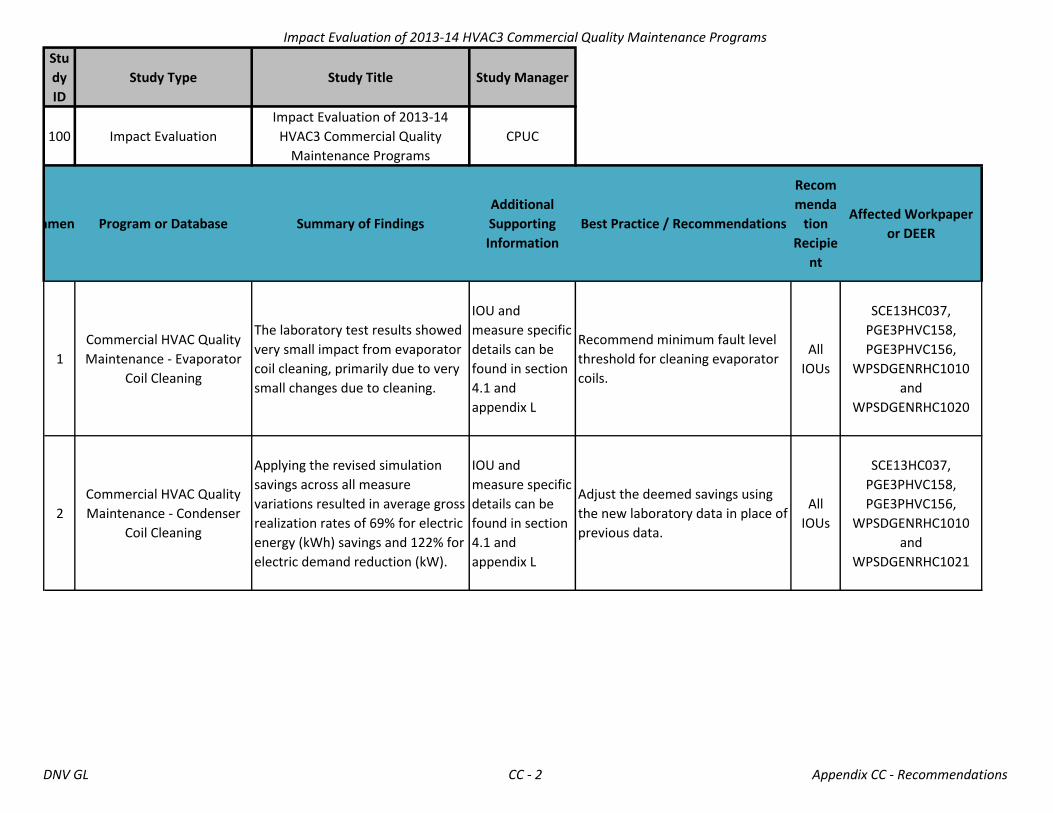
Impact Evaluation of 2013-14 HVAC3 Commercial Quality Maintenance Programs
Stu
dy
ID
Study Type Study Title Study Manager
100 Impact Evaluation
Impact Evaluation of 2013-14
HVAC3 Commercial Quality
Maintenance Programs
CPUC
RecommendationProgram or Database Summary of Findings
Additional
Supporting
Information
Best Practice / Recommendations
Recom
menda
tion
Recipie
nt
Affected Workpaper
or DEER
1
Commercial HVAC Quality
Maintenance - Evaporator
Coil Cleaning
The laboratory test results showed
very small impact from evaporator
coil cleaning, primarily due to very
small changes due to cleaning.
IOU and
measure specific
details can be
found in section
4.1 and
appendix L
Recommend minimum fault level
threshold for cleaning evaporator
coils.
All
IOUs
SCE13HC037,
PGE3PHVC158,
PGE3PHVC156,
WPSDGENRHC1010
and
WPSDGENRHC1020
2
Commercial HVAC Quality
Maintenance - Condenser
Coil Cleaning
Applying the revised simulation
savings across all measure
variations resulted in average gross
realization rates of 69% for electric
energy (kWh) savings and 122% for
electric demand reduction (kW).
IOU and
measure specific
details can be
found in section
4.1 and
appendix L
Adjust the deemed savings using
the new laboratory data in place of
previous data.
All
IOUs
SCE13HC037,
PGE3PHVC158,
PGE3PHVC156,
WPSDGENRHC1010
and
WPSDGENRHC1021
DNV GL CC - 2 Appendix CC - Recommendations

Impact Evaluation of 2013-14 HVAC3 Commercial Quality Maintenance Programs
RecommendationProgram or Database Summary of Findings
Additional
Supporting
Information
Best Practice / Recommendations
Recom
menda
tion
Recipie
nt
Affected Workpaper
or DEER
3Commercial HVAC Quality
Maintenance - Coil Cleaning
Baseline for condenser coil
cleaning can only be characterized
by measuring before the cleaning is
performed.
IOU and
measure specific
details can be
found in section
4.1 and
appendix L
We recommend encouraging the
implementer to collect discharge
pressure and outdoor temperature
before and after they clean the
coil. They would also need to
record the refrigerant charge
offset. This would build the sample
for detailed savings estimates
while also allowing for
quantification of unit baseline and
savings across many more
situations than can be addressed
within the evaluation budget.
All
IOUs
SCE13HC037,
PGE3PHVC158,
PGE3PHVC156,
WPSDGENRHC1010
and
WPSDGENRHC1022
4Commercial HVAC Quality
Maintenance - Coil Cleaning
Precision for coil cleaning
measures was lower than
anticipated. Additionally some of
the sites visited did not represent
the true baseline state as they had
already participated in the
program.
IOU and
measure specific
details can be
found in section
4.1 and
appendix L
Collect more true-baseline data for
coil cleaning measures by visiting
sites that are entering the program
for the first time. Collect additional
coil cleaning laboratory data for
systems under mixed faults.
All
IOUs
SCE13HC037,
PGE3PHVC158,
PGE3PHVC156,
WPSDGENRHC1010
and
WPSDGENRHC1023
DNV GL CC - 3 Appendix CC - Recommendations
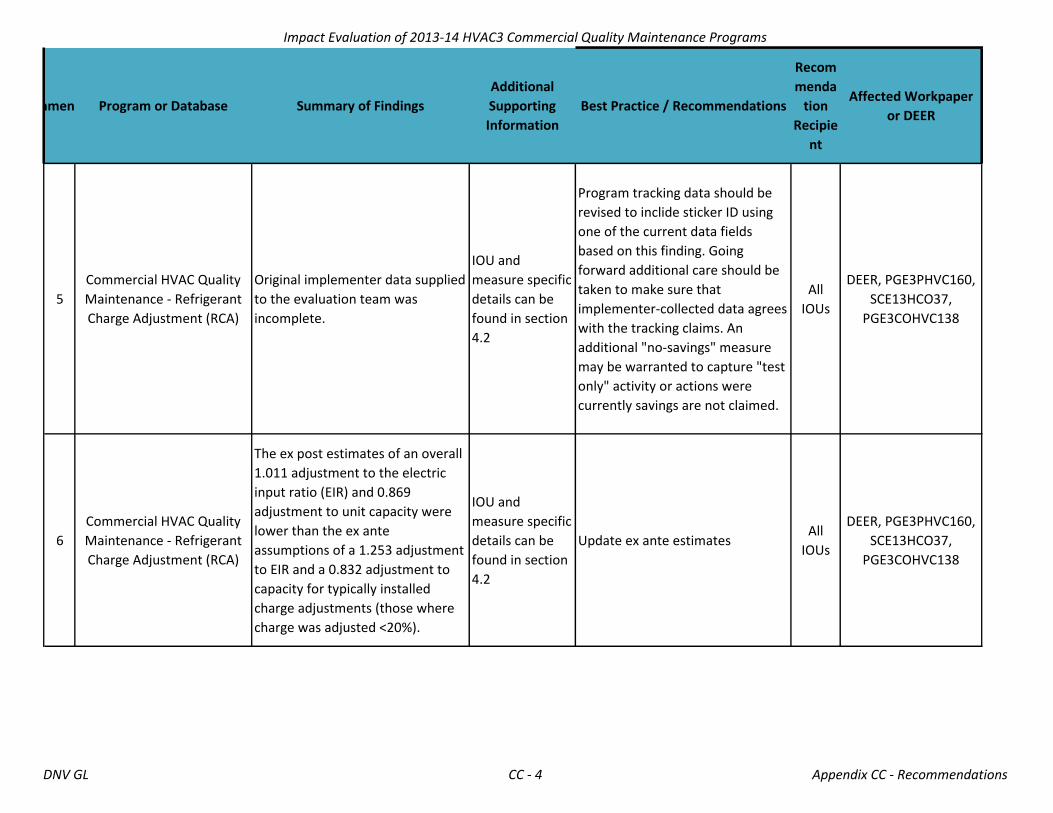
Impact Evaluation of 2013-14 HVAC3 Commercial Quality Maintenance Programs
RecommendationProgram or Database Summary of Findings
Additional
Supporting
Information
Best Practice / Recommendations
Recom
menda
tion
Recipie
nt
Affected Workpaper
or DEER
5
Commercial HVAC Quality
Maintenance - Refrigerant
Charge Adjustment (RCA)
Original implementer data supplied
to the evaluation team was
incomplete.
IOU and
measure specific
details can be
found in section
4.2
Program tracking data should be
revised to inclide sticker ID using
one of the current data fields
based on this finding. Going
forward additional care should be
taken to make sure that
implementer-collected data agrees
with the tracking claims. An
additional "no-savings" measure
may be warranted to capture "test
only" activity or actions were
currently savings are not claimed.
All
IOUs
DEER, PGE3PHVC160,
SCE13HCO37,
PGE3COHVC138
6
Commercial HVAC Quality
Maintenance - Refrigerant
Charge Adjustment (RCA)
The ex post estimates of an overall
1.011 adjustment to the electric
input ratio (EIR) and 0.869
adjustment to unit capacity were
lower than the ex ante
assumptions of a 1.253 adjustment
to EIR and a 0.832 adjustment to
capacity for typically installed
charge adjustments (those where
charge was adjusted <20%).
IOU and
measure specific
details can be
found in section
4.2
Update ex ante estimatesAll
IOUs
DEER, PGE3PHVC160,
SCE13HCO37,
PGE3COHVC138
DNV GL CC - 4 Appendix CC - Recommendations
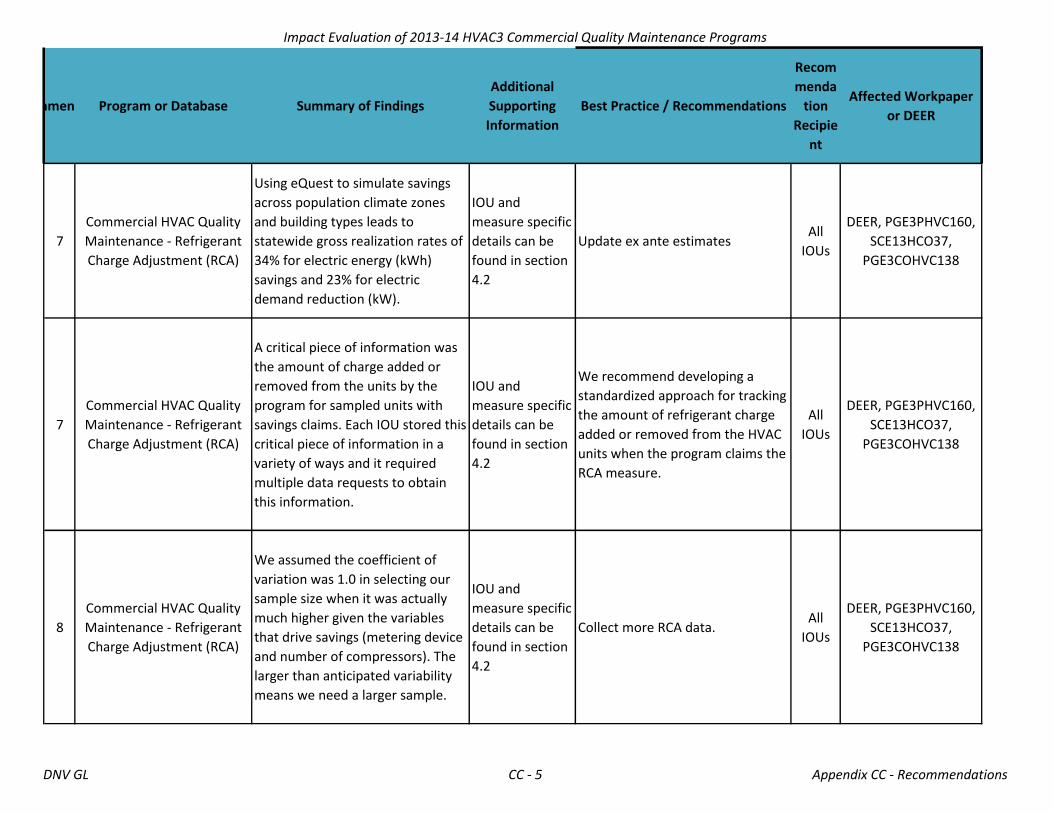
Impact Evaluation of 2013-14 HVAC3 Commercial Quality Maintenance Programs
RecommendationProgram or Database Summary of Findings
Additional
Supporting
Information
Best Practice / Recommendations
Recom
menda
tion
Recipie
nt
Affected Workpaper
or DEER
7
Commercial HVAC Quality
Maintenance - Refrigerant
Charge Adjustment (RCA)
Using eQuest to simulate savings
across population climate zones
and building types leads to
statewide gross realization rates of
34% for electric energy (kWh)
savings and 23% for electric
demand reduction (kW).
IOU and
measure specific
details can be
found in section
4.2
Update ex ante estimatesAll
IOUs
DEER, PGE3PHVC160,
SCE13HCO37,
PGE3COHVC138
7
Commercial HVAC Quality
Maintenance - Refrigerant
Charge Adjustment (RCA)
A critical piece of information was
the amount of charge added or
removed from the units by the
program for sampled units with
savings claims. Each IOU stored this
critical piece of information in a
variety of ways and it required
multiple data requests to obtain
this information.
IOU and
measure specific
details can be
found in section
4.2
We recommend developing a
standardized approach for tracking
the amount of refrigerant charge
added or removed from the HVAC
units when the program claims the
RCA measure.
All
IOUs
DEER, PGE3PHVC160,
SCE13HCO37,
PGE3COHVC138
8
Commercial HVAC Quality
Maintenance - Refrigerant
Charge Adjustment (RCA)
We assumed the coefficient of
variation was 1.0 in selecting our
sample size when it was actually
much higher given the variables
that drive savings (metering device
and number of compressors). The
larger than anticipated variability
means we need a larger sample.
IOU and
measure specific
details can be
found in section
4.2
Collect more RCA data.All
IOUs
DEER, PGE3PHVC160,
SCE13HCO37,
PGE3COHVC138
DNV GL CC - 5 Appendix CC - Recommendations

Impact Evaluation of 2013-14 HVAC3 Commercial Quality Maintenance Programs
RecommendationProgram or Database Summary of Findings
Additional
Supporting
Information
Best Practice / Recommendations
Recom
menda
tion
Recipie
nt
Affected Workpaper
or DEER
9
Commercial HVAC Quality
Maintenance - Economizer
Repair
We developed installation rates
based upon the results of field
inspections of a random sample of
123 units at 45 sites. During the
inspections, functional testing of
the economizers was performed to
determine if the economizers were
operating properly. A site-level
installation rate was then
calculated as the number of
properly functioning economizers
divided by the number of
economizers tested. Program-level
results were combined across all
IOUs to create a statewide
installation rate of 56%.
IOU and
measure specific
details can be
found in section
4.3
Update ex ante estimates to
reflect ex post installation rate
All
IOUs
PGE3PHVC151,
PGE3PHVC152,
SCE13HC046.2,
WPSDGENRHC0027,
WPSDGENRHC0028
DNV GL CC - 6 Appendix CC - Recommendations
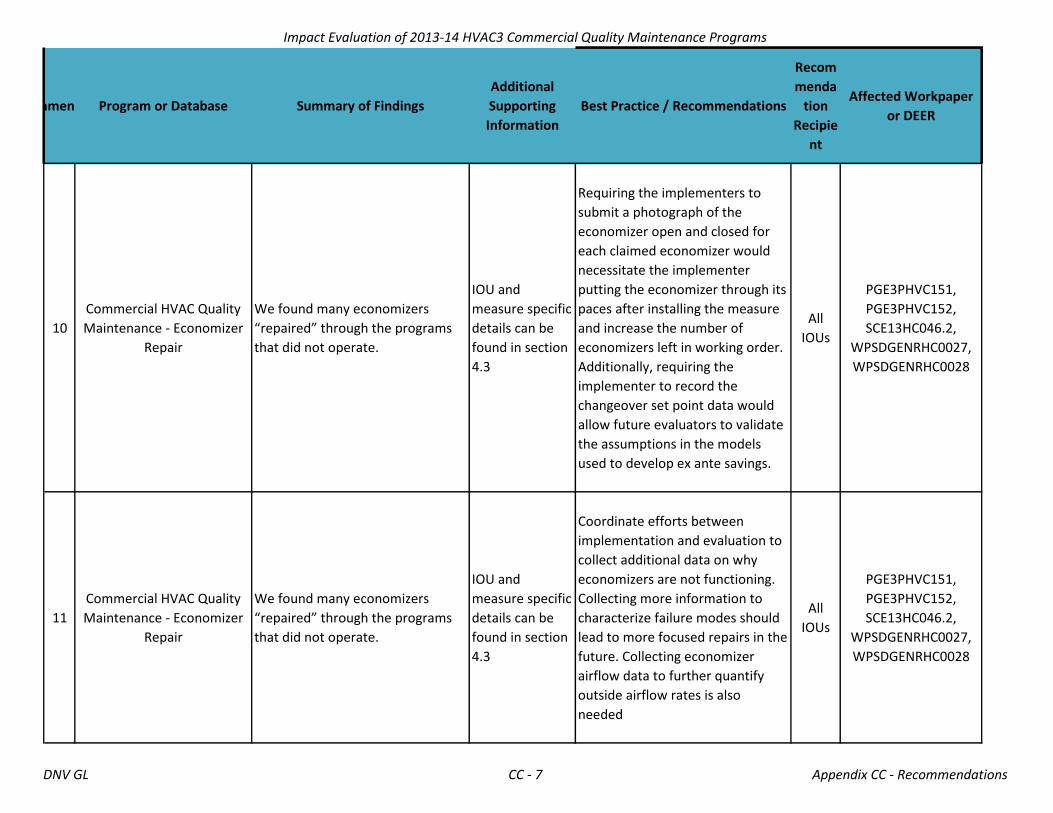
Impact Evaluation of 2013-14 HVAC3 Commercial Quality Maintenance Programs
RecommendationProgram or Database Summary of Findings
Additional
Supporting
Information
Best Practice / Recommendations
Recom
menda
tion
Recipie
nt
Affected Workpaper
or DEER
10
Commercial HVAC Quality
Maintenance - Economizer
Repair
We found many economizers
“repaired” through the programs
that did not operate.
IOU and
measure specific
details can be
found in section
4.3
Requiring the implementers to
submit a photograph of the
economizer open and closed for
each claimed economizer would
necessitate the implementer
putting the economizer through its
paces after installing the measure
and increase the number of
economizers left in working order.
Additionally, requiring the
implementer to record the
changeover set point data would
allow future evaluators to validate
the assumptions in the models
used to develop ex ante savings.
All
IOUs
PGE3PHVC151,
PGE3PHVC152,
SCE13HC046.2,
WPSDGENRHC0027,
WPSDGENRHC0028
11
Commercial HVAC Quality
Maintenance - Economizer
Repair
We found many economizers
“repaired” through the programs
that did not operate.
IOU and
measure specific
details can be
found in section
4.3
Coordinate efforts between
implementation and evaluation to
collect additional data on why
economizers are not functioning.
Collecting more information to
characterize failure modes should
lead to more focused repairs in the
future. Collecting economizer
airflow data to further quantify
outside airflow rates is also
needed
All
IOUs
PGE3PHVC151,
PGE3PHVC152,
SCE13HC046.2,
WPSDGENRHC0027,
WPSDGENRHC0028
DNV GL CC - 7 Appendix CC - Recommendations
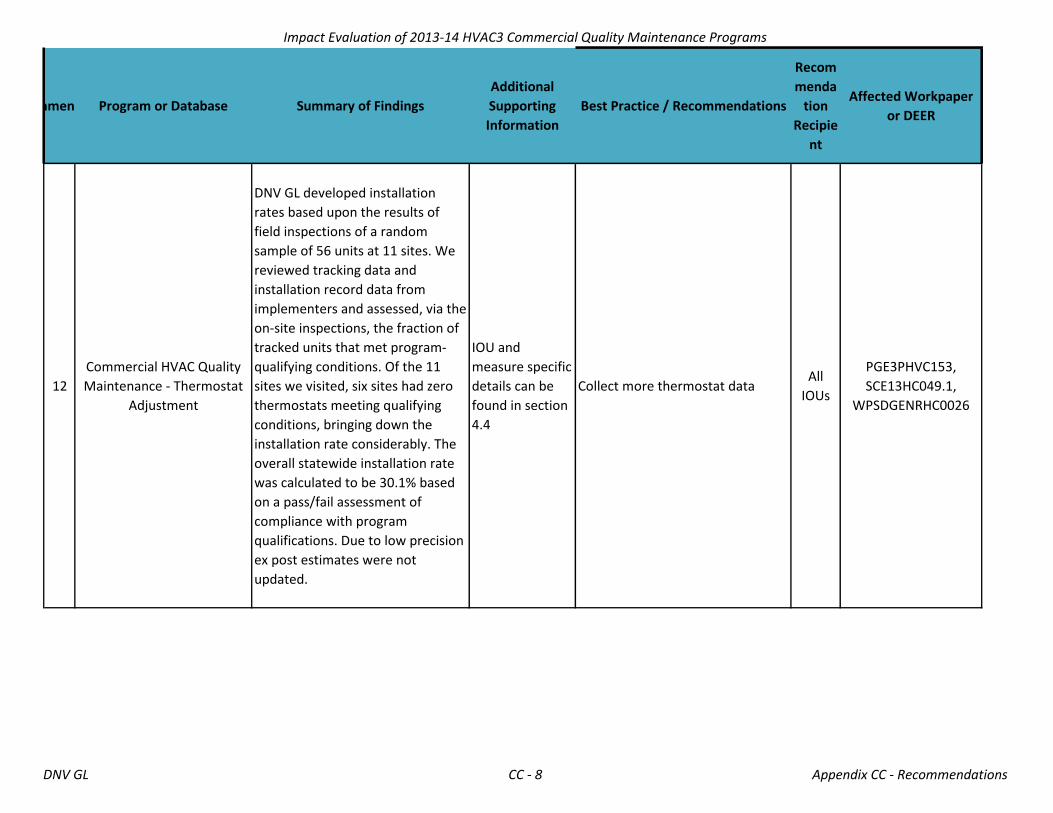
Impact Evaluation of 2013-14 HVAC3 Commercial Quality Maintenance Programs
RecommendationProgram or Database Summary of Findings
Additional
Supporting
Information
Best Practice / Recommendations
Recom
menda
tion
Recipie
nt
Affected Workpaper
or DEER
12
Commercial HVAC Quality
Maintenance - Thermostat
Adjustment
DNV GL developed installation
rates based upon the results of
field inspections of a random
sample of 56 units at 11 sites. We
reviewed tracking data and
installation record data from
implementers and assessed, via the
on-site inspections, the fraction of
tracked units that met program-
qualifying conditions. Of the 11
sites we visited, six sites had zero
thermostats meeting qualifying
conditions, bringing down the
installation rate considerably. The
overall statewide installation rate
was calculated to be 30.1% based
on a pass/fail assessment of
compliance with program
qualifications. Due to low precision
ex post estimates were not
updated.
IOU and
measure specific
details can be
found in section
4.4
Collect more thermostat dataAll
IOUs
PGE3PHVC153,
SCE13HC049.1,
WPSDGENRHC0026
DNV GL CC - 8 Appendix CC - Recommendations

Impact Evaluation of 2013-14 HVAC3 Commercial Quality Maintenance Programs
RecommendationProgram or Database Summary of Findings
Additional
Supporting
Information
Best Practice / Recommendations
Recom
menda
tion
Recipie
nt
Affected Workpaper
or DEER
13
Commercial HVAC Quality
Maintenance - Thermostat
Adjustment
Poor pre and post set point data.
IOU and
measure specific
details can be
found in section
4.4
We recommend encouraging
implementers to do a better job
recording the thermostat set point
temperatures before and after
adjustment since this would allow
future implementers to modify the
ex ante savings assumptions if they
are inaccurate.
All
IOUs
PGE3PHVC153,
SCE13HC049.1,
WPSDGENRHC0026
14
Commercial HVAC Quality
Maintenance - Thermostat
Adjustment & Supply Fan
Controls
We assumed the coefficient of
variation was 1.0 in selecting the
sample but it was actually 1.5.
IOU and
measure specific
details can be
found in section
4.4
Coordinate efforts between
implementation and evaluation to
collect more thermostat and
supply fan control data. We need a
larger sample to attain better
precision on the ex post savings
estimates and we would like some
data to compare pre-maintenance
conditions in the field to
implementer data.
All
IOUs
DEER, PGE3PHVC157,
PGE3PHVC153,
SCE13HC049.1,
WPSDGENRHC0026
DNV GL CC - 9 Appendix CC - Recommendations
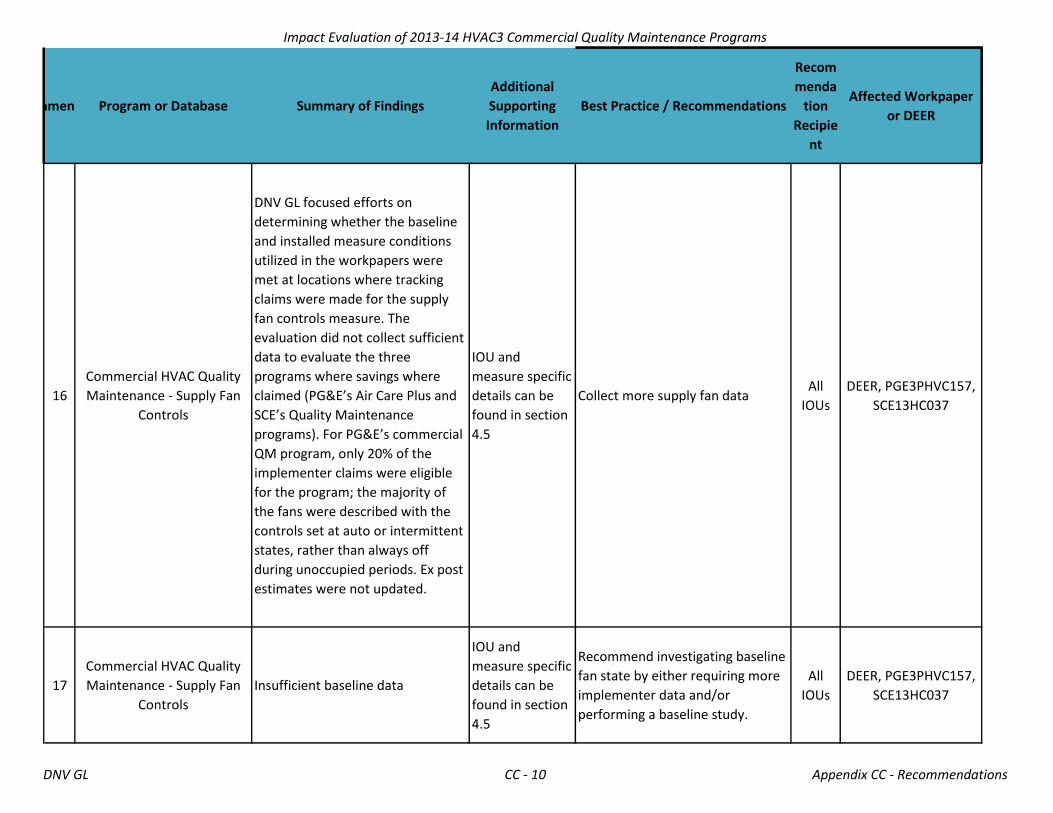
Impact Evaluation of 2013-14 HVAC3 Commercial Quality Maintenance Programs
RecommendationProgram or Database Summary of Findings
Additional
Supporting
Information
Best Practice / Recommendations
Recom
menda
tion
Recipie
nt
Affected Workpaper
or DEER
16
Commercial HVAC Quality
Maintenance - Supply Fan
Controls
DNV GL focused efforts on
determining whether the baseline
and installed measure conditions
utilized in the workpapers were
met at locations where tracking
claims were made for the supply
fan controls measure. The
evaluation did not collect sufficient
data to evaluate the three
programs where savings where
claimed (PG&E’s Air Care Plus and
SCE’s Quality Maintenance
programs). For PG&E’s commercial
QM program, only 20% of the
implementer claims were eligible
for the program; the majority of
the fans were described with the
controls set at auto or intermittent
states, rather than always off
during unoccupied periods. Ex post
estimates were not updated.
IOU and
measure specific
details can be
found in section
4.5
Collect more supply fan dataAll
IOUs
DEER, PGE3PHVC157,
SCE13HC037
17
Commercial HVAC Quality
Maintenance - Supply Fan
Controls
Insufficient baseline data
IOU and
measure specific
details can be
found in section
4.5
Recommend investigating baseline
fan state by either requiring more
implementer data and/or
performing a baseline study.
All
IOUs
DEER, PGE3PHVC157,
SCE13HC037
DNV GL CC - 10 Appendix CC - Recommendations
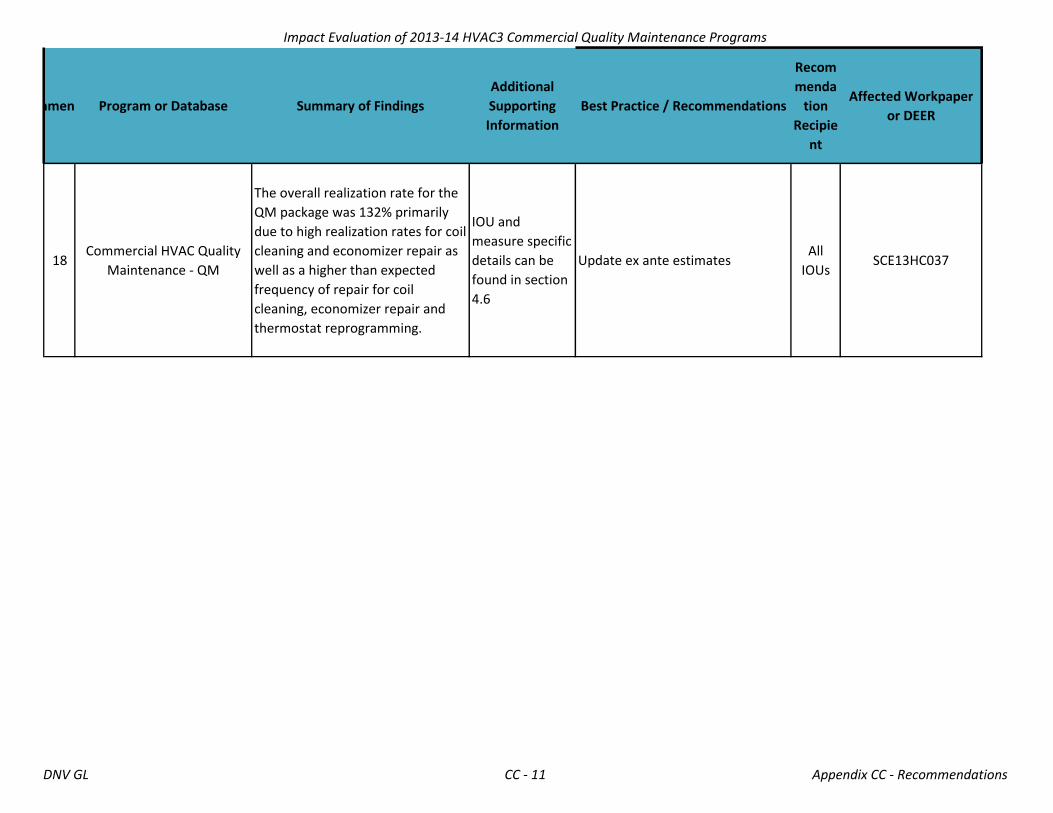
Impact Evaluation of 2013-14 HVAC3 Commercial Quality Maintenance Programs
RecommendationProgram or Database Summary of Findings
Additional
Supporting
Information
Best Practice / Recommendations
Recom
menda
tion
Recipie
nt
Affected Workpaper
or DEER
18Commercial HVAC Quality
Maintenance - QM
The overall realization rate for the
QM package was 132% primarily
due to high realization rates for coil
cleaning and economizer repair as
well as a higher than expected
frequency of repair for coil
cleaning, economizer repair and
thermostat reprogramming.
IOU and
measure specific
details can be
found in section
4.6
Update ex ante estimatesAll
IOUsSCE13HC037
DNV GL CC - 11 Appendix CC - Recommendations
DETAILED SIMULATION RESULTS Appendix B.This appendix contains the detailed simulation unit energy saving results (energy [kWh] and demand energy [kW]) for coil cleaning and RCA measures. Those building type/ climate zone combinations that did not exist in the tracking data were not simulated and are omitted from these tables. We populated the grey cells using the average of other building types because these types were not modeled. They either did not exist as DEER prototypes or (in the case of Grocery) required an eQuest version with that refrigeration system modeling capability.
Coil cleaning measure These are detailed tables for the coil cleaning simulation results, averaged across all IOUs by building type and climate zone. The eQuest simulations were the same for all IOUs: the only difference between them is slightly different vintage weightings used to collapse multiple vintages within each building type.
DNV GL – www.dnvgl.com 4/1/16 Page B-1

Building Type CZ1 CZ2 CZ3 CZ4 CZ5 CZ6 CZ7 CZ8 CZ9 CZ10 CZ11 CZ12 CZ13 CZ14 CZ15 CZ16 Average
SUnAnyAsm 57.0 53.0 74.3 66.8 76.1 89.6 69.5Cnc
Com
ECC 31.9 58.4 62.9 51.1EPr 17.3 28.0 32.7 36.0 32.1 39.2 38.4 32.0ERC 34.9 40.4 37.6ESe 15.5 27.2 30.4 32.4 34.5 36.3 32.6 42.1 31.4EUn 82.1 82.1GroHspHtl 300.0 350.9 325.5MBT 113.3 100.3 106.8MLI 37.5 35.4 51.3 55.5 53.2 46.6MtlNrs 51.5 51.6 42.6 48.6OfL 64.4 57.5 65.6 75.8 77.7 67.3 76.1 74.3 72.5 70.1OfS 57.1 47.8 56.5 67.8 72.9 72.0 63.9 72.9 69.9 65.5 75.5 65.6OTRRFF 64.9 84.9 96.5 82.1RSD 59.8 52.5 81.2 76.4 88.0 79.9 89.9 125.3 81.6Rt3 94.1 94.1RtL 62.9 46.5 73.5 72.8 74.0 91.0 82.8 89.2 88.4 67.2 74.8RtS 61.5 42.0 65.4 78.8 89.5 87.8 82.0 86.6 84.0 75.0 92.4 87.7 135.2 82.1s_MiCs_TCUSCn 7.0 26.5 16.7WRfAverage 61.5 36.9 52.7 86.7 76.0 77.2 65.3 65.4 79.2 55.4 70.6 80.4 130.2 77.7
HVAC Condenser Coil Cleaning Unit Energy Savings [kWh/ ton]
DNV GL – www.dnvgl.com 4/1/16 Page B-2

Building Type CZ1 CZ2 CZ3 CZ4 CZ5 CZ6 CZ7 CZ8 CZ9 CZ10 CZ11 CZ12 CZ13 CZ14 CZ15 CZ16 Average
SUnAnyAsm 0.034 0.037 0.048 0.047 0.053 0.062 0.047Cnc
Com
ECC 0.003 0.030 0.044 0.026EPr 0.000 0.001 0.037 0.005 0.004 0.010 0.012 0.010ERC 0.034 0.023 0.028ESe 0.000 0.000 0.000 0.040 0.006 0.004 0.002 0.010 0.008EUn 0.052 0.052GroHspHtl 0.125 0.157 0.141MBT 0.050 0.056 0.053MLI 0.026 0.036 0.050 0.037 0.054 0.041MtlNrs 0.025 0.031 0.027 0.027OfL 0.035 0.016 0.025 0.034 0.045 0.040 0.049 0.032 0.050 0.036OfS 0.034 0.015 0.022 0.035 0.042 0.046 0.040 0.050 0.031 0.048 0.036 0.036OTRRFF 0.034 0.048 0.057 0.047RSD 0.036 0.037 0.051 0.053 0.060 0.049 0.064 0.050 0.050Rt3 0.054 0.054RtL 0.031 0.022 0.044 0.037 0.039 0.048 0.049 0.053 0.046 0.042 0.041RtS 0.032 0.024 0.042 0.044 0.049 0.052 0.053 0.056 0.051 0.051 0.057 0.060 0.060 0.049s_MiCs_TCUSCn 0.016 0.034 0.025WRfAverage 0.033 0.011 0.022 0.041 0.045 0.049 0.039 0.041 0.040 0.032 0.036 0.051 0.055 0.043
HVAC Condenser Coil Cleaning Unit Energy Savings [kW/ ton]
DNV GL – www.dnvgl.com 4/1/16 Page B-3
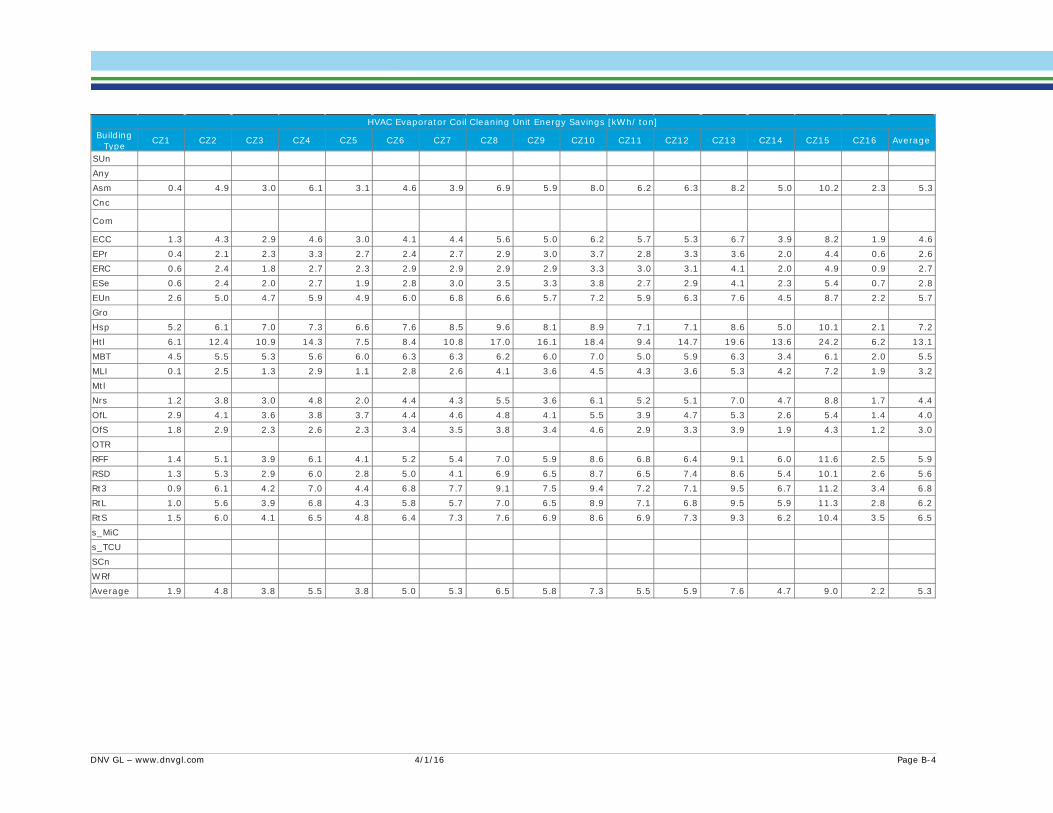
Building Type CZ1 CZ2 CZ3 CZ4 CZ5 CZ6 CZ7 CZ8 CZ9 CZ10 CZ11 CZ12 CZ13 CZ14 CZ15 CZ16 Average
SUnAnyAsm 0.4 4.9 3.0 6.1 3.1 4.6 3.9 6.9 5.9 8.0 6.2 6.3 8.2 5.0 10.2 2.3 5.3Cnc
Com
ECC 1.3 4.3 2.9 4.6 3.0 4.1 4.4 5.6 5.0 6.2 5.7 5.3 6.7 3.9 8.2 1.9 4.6EPr 0.4 2.1 2.3 3.3 2.7 2.4 2.7 2.9 3.0 3.7 2.8 3.3 3.6 2.0 4.4 0.6 2.6ERC 0.6 2.4 1.8 2.7 2.3 2.9 2.9 2.9 2.9 3.3 3.0 3.1 4.1 2.0 4.9 0.9 2.7ESe 0.6 2.4 2.0 2.7 1.9 2.8 3.0 3.5 3.3 3.8 2.7 2.9 4.1 2.3 5.4 0.7 2.8EUn 2.6 5.0 4.7 5.9 4.9 6.0 6.8 6.6 5.7 7.2 5.9 6.3 7.6 4.5 8.7 2.2 5.7GroHsp 5.2 6.1 7.0 7.3 6.6 7.6 8.5 9.6 8.1 8.9 7.1 7.1 8.6 5.0 10.1 2.1 7.2Htl 6.1 12.4 10.9 14.3 7.5 8.4 10.8 17.0 16.1 18.4 9.4 14.7 19.6 13.6 24.2 6.2 13.1MBT 4.5 5.5 5.3 5.6 6.0 6.3 6.3 6.2 6.0 7.0 5.0 5.9 6.3 3.4 6.1 2.0 5.5MLI 0.1 2.5 1.3 2.9 1.1 2.8 2.6 4.1 3.6 4.5 4.3 3.6 5.3 4.2 7.2 1.9 3.2MtlNrs 1.2 3.8 3.0 4.8 2.0 4.4 4.3 5.5 3.6 6.1 5.2 5.1 7.0 4.7 8.8 1.7 4.4OfL 2.9 4.1 3.6 3.8 3.7 4.4 4.6 4.8 4.1 5.5 3.9 4.7 5.3 2.6 5.4 1.4 4.0OfS 1.8 2.9 2.3 2.6 2.3 3.4 3.5 3.8 3.4 4.6 2.9 3.3 3.9 1.9 4.3 1.2 3.0OTRRFF 1.4 5.1 3.9 6.1 4.1 5.2 5.4 7.0 5.9 8.6 6.8 6.4 9.1 6.0 11.6 2.5 5.9RSD 1.3 5.3 2.9 6.0 2.8 5.0 4.1 6.9 6.5 8.7 6.5 7.4 8.6 5.4 10.1 2.6 5.6Rt3 0.9 6.1 4.2 7.0 4.4 6.8 7.7 9.1 7.5 9.4 7.2 7.1 9.5 6.7 11.2 3.4 6.8RtL 1.0 5.6 3.9 6.8 4.3 5.8 5.7 7.0 6.5 8.9 7.1 6.8 9.5 5.9 11.3 2.8 6.2RtS 1.5 6.0 4.1 6.5 4.8 6.4 7.3 7.6 6.9 8.6 6.9 7.3 9.3 6.2 10.4 3.5 6.5s_MiCs_TCUSCnWRfAverage 1.9 4.8 3.8 5.5 3.8 5.0 5.3 6.5 5.8 7.3 5.5 5.9 7.6 4.7 9.0 2.2 5.3
HVAC Evaporator Coil Cleaning Unit Energy Savings [kWh/ ton]
DNV GL – www.dnvgl.com 4/1/16 Page B-4
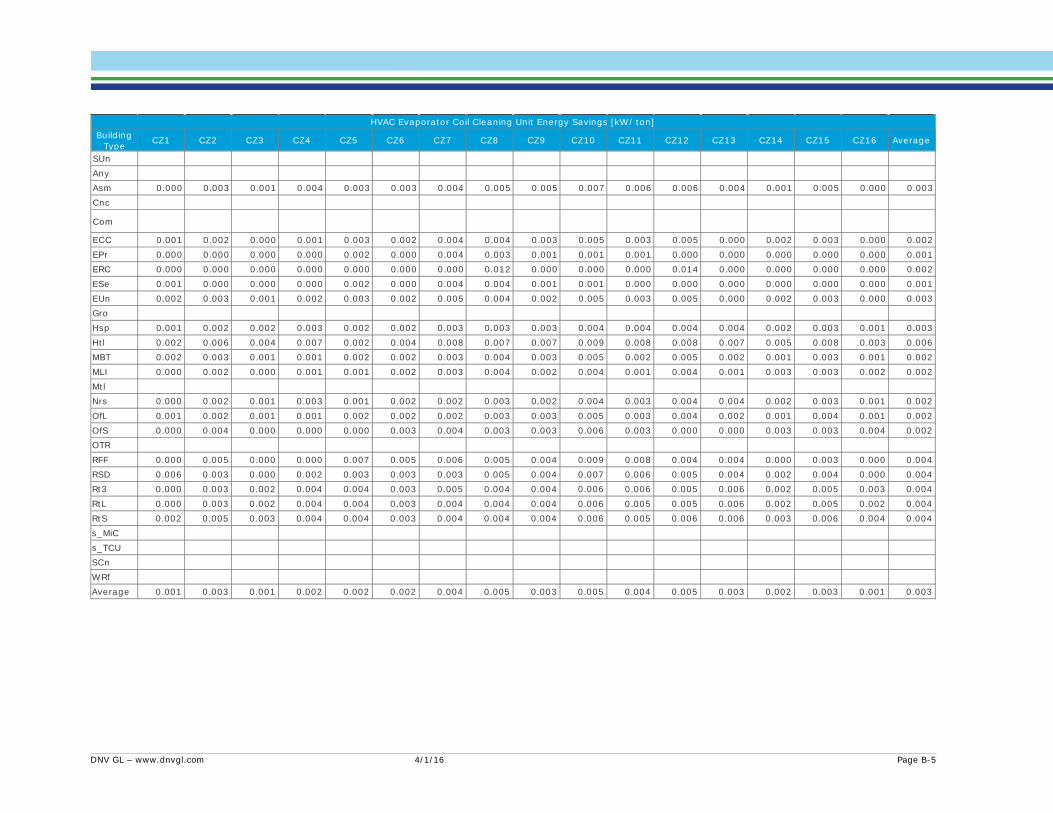
Building Type CZ1 CZ2 CZ3 CZ4 CZ5 CZ6 CZ7 CZ8 CZ9 CZ10 CZ11 CZ12 CZ13 CZ14 CZ15 CZ16 Average
SUnAnyAsm 0.000 0.003 0.001 0.004 0.003 0.003 0.004 0.005 0.005 0.007 0.006 0.006 0.004 0.001 0.005 0.000 0.003Cnc
Com
ECC 0.001 0.002 0.000 0.001 0.003 0.002 0.004 0.004 0.003 0.005 0.003 0.005 0.000 0.002 0.003 0.000 0.002EPr 0.000 0.000 0.000 0.000 0.002 0.000 0.004 0.003 0.001 0.001 0.001 0.000 0.000 0.000 0.000 0.000 0.001ERC 0.000 0.000 0.000 0.000 0.000 0.000 0.000 0.012 0.000 0.000 0.000 0.014 0.000 0.000 0.000 0.000 0.002ESe 0.001 0.000 0.000 0.000 0.002 0.000 0.004 0.004 0.001 0.001 0.000 0.000 0.000 0.000 0.000 0.000 0.001EUn 0.002 0.003 0.001 0.002 0.003 0.002 0.005 0.004 0.002 0.005 0.003 0.005 0.000 0.002 0.003 0.000 0.003GroHsp 0.001 0.002 0.002 0.003 0.002 0.002 0.003 0.003 0.003 0.004 0.004 0.004 0.004 0.002 0.003 0.001 0.003Htl 0.002 0.006 0.004 0.007 0.002 0.004 0.008 0.007 0.007 0.009 0.008 0.008 0.007 0.005 0.008 0.003 0.006MBT 0.002 0.003 0.001 0.001 0.002 0.002 0.003 0.004 0.003 0.005 0.002 0.005 0.002 0.001 0.003 0.001 0.002MLI 0.000 0.002 0.000 0.001 0.001 0.002 0.003 0.004 0.002 0.004 0.001 0.004 0.001 0.003 0.003 0.002 0.002MtlNrs 0.000 0.002 0.001 0.003 0.001 0.002 0.002 0.003 0.002 0.004 0.003 0.004 0.004 0.002 0.003 0.001 0.002OfL 0.001 0.002 0.001 0.001 0.002 0.002 0.002 0.003 0.003 0.005 0.003 0.004 0.002 0.001 0.004 0.001 0.002OfS 0.000 0.004 0.000 0.000 0.000 0.003 0.004 0.003 0.003 0.006 0.003 0.000 0.000 0.003 0.003 0.004 0.002OTRRFF 0.000 0.005 0.000 0.000 0.007 0.005 0.006 0.005 0.004 0.009 0.008 0.004 0.004 0.000 0.003 0.000 0.004RSD 0.006 0.003 0.000 0.002 0.003 0.003 0.003 0.005 0.004 0.007 0.006 0.005 0.004 0.002 0.004 0.000 0.004Rt3 0.000 0.003 0.002 0.004 0.004 0.003 0.005 0.004 0.004 0.006 0.006 0.005 0.006 0.002 0.005 0.003 0.004RtL 0.000 0.003 0.002 0.004 0.004 0.003 0.004 0.004 0.004 0.006 0.005 0.005 0.006 0.002 0.005 0.002 0.004RtS 0.002 0.005 0.003 0.004 0.004 0.003 0.004 0.004 0.004 0.006 0.005 0.006 0.006 0.003 0.006 0.004 0.004s_MiCs_TCUSCnWRfAverage 0.001 0.003 0.001 0.002 0.002 0.002 0.004 0.005 0.003 0.005 0.004 0.005 0.003 0.002 0.003 0.001 0.003
HVAC Evaporator Coil Cleaning Unit Energy Savings [kW/ ton]
DNV GL – www.dnvgl.com 4/1/16 Page B-5
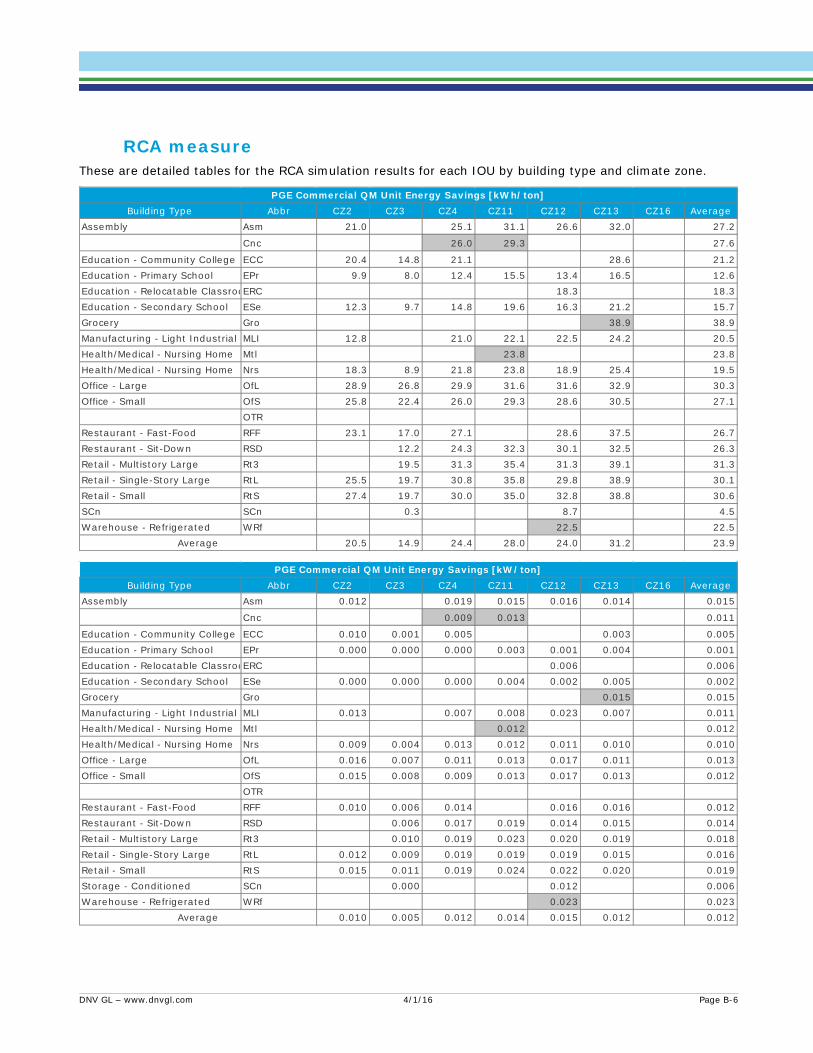
RCA measure These are detailed tables for the RCA simulation results for each IOU by building type and climate zone.
Building Type Abbr CZ2 CZ3 CZ4 CZ11 CZ12 CZ13 CZ16 AverageAssembly Asm 21.0 25.1 31.1 26.6 32.0 27.2
Cnc 26.0 29.3 27.6
Education - Community College ECC 20.4 14.8 21.1 28.6 21.2Education - Primary School EPr 9.9 8.0 12.4 15.5 13.4 16.5 12.6Education - Relocatable ClassrooERC 18.3 18.3Education - Secondary School ESe 12.3 9.7 14.8 19.6 16.3 21.2 15.7Grocery Gro 38.9 38.9Manufacturing - Light Industrial MLI 12.8 21.0 22.1 22.5 24.2 20.5Health/Medical - Nursing Home Mtl 23.8 23.8Health/Medical - Nursing Home Nrs 18.3 8.9 21.8 23.8 18.9 25.4 19.5Office - Large OfL 28.9 26.8 29.9 31.6 31.6 32.9 30.3Office - Small OfS 25.8 22.4 26.0 29.3 28.6 30.5 27.1
OTRRestaurant - Fast-Food RFF 23.1 17.0 27.1 28.6 37.5 26.7Restaurant - Sit-Down RSD 12.2 24.3 32.3 30.1 32.5 26.3Retail - Multistory Large Rt3 19.5 31.3 35.4 31.3 39.1 31.3Retail - Single-Story Large RtL 25.5 19.7 30.8 35.8 29.8 38.9 30.1Retail - Small RtS 27.4 19.7 30.0 35.0 32.8 38.8 30.6SCn SCn 0.3 8.7 4.5Warehouse - Refrigerated WRf 22.5 22.5
20.5 14.9 24.4 28.0 24.0 31.2 23.9
PGE Commercial QM Unit Energy Savings [kWh/ton]
Average
Building Type Abbr CZ2 CZ3 CZ4 CZ11 CZ12 CZ13 CZ16 AverageAssembly Asm 0.012 0.019 0.015 0.016 0.014 0.015
Cnc 0.009 0.013 0.011
Education - Community College ECC 0.010 0.001 0.005 0.003 0.005Education - Primary School EPr 0.000 0.000 0.000 0.003 0.001 0.004 0.001Education - Relocatable ClassrooERC 0.006 0.006Education - Secondary School ESe 0.000 0.000 0.000 0.004 0.002 0.005 0.002Grocery Gro 0.015 0.015Manufacturing - Light Industrial MLI 0.013 0.007 0.008 0.023 0.007 0.011Health/Medical - Nursing Home Mtl 0.012 0.012Health/Medical - Nursing Home Nrs 0.009 0.004 0.013 0.012 0.011 0.010 0.010Office - Large OfL 0.016 0.007 0.011 0.013 0.017 0.011 0.013Office - Small OfS 0.015 0.008 0.009 0.013 0.017 0.013 0.012
OTRRestaurant - Fast-Food RFF 0.010 0.006 0.014 0.016 0.016 0.012Restaurant - Sit-Down RSD 0.006 0.017 0.019 0.014 0.015 0.014Retail - Multistory Large Rt3 0.010 0.019 0.023 0.020 0.019 0.018Retail - Single-Story Large RtL 0.012 0.009 0.019 0.019 0.019 0.015 0.016Retail - Small RtS 0.015 0.011 0.019 0.024 0.022 0.020 0.019Storage - Conditioned SCn 0.000 0.012 0.006Warehouse - Refrigerated WRf 0.023 0.023
0.010 0.005 0.012 0.014 0.015 0.012 0.012Average
PGE Commercial QM Unit Energy Savings [kW/ton]
DNV GL – www.dnvgl.com 4/1/16 Page B-6
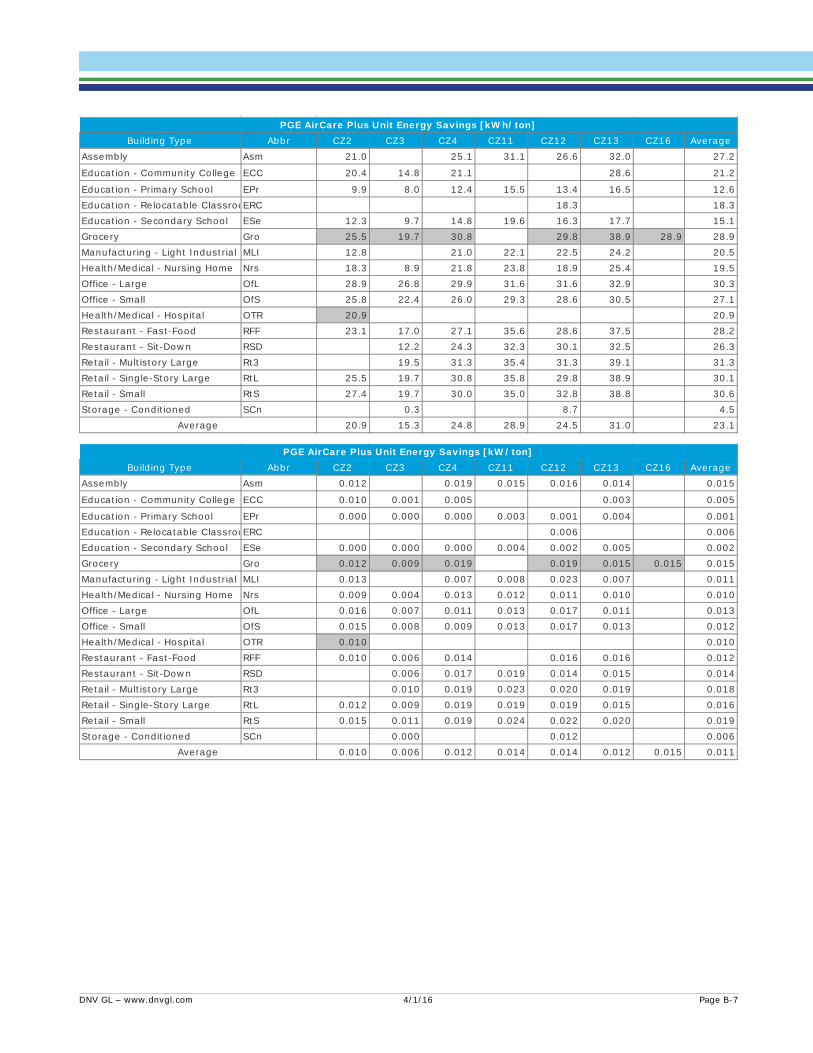
Building Type Abbr CZ2 CZ3 CZ4 CZ11 CZ12 CZ13 CZ16 AverageAssembly Asm 21.0 25.1 31.1 26.6 32.0 27.2
Education - Community College ECC 20.4 14.8 21.1 28.6 21.2
Education - Primary School EPr 9.9 8.0 12.4 15.5 13.4 16.5 12.6Education - Relocatable ClassrooERC 18.3 18.3Education - Secondary School ESe 12.3 9.7 14.8 19.6 16.3 17.7 15.1Grocery Gro 25.5 19.7 30.8 29.8 38.9 28.9 28.9Manufacturing - Light Industrial MLI 12.8 21.0 22.1 22.5 24.2 20.5Health/Medical - Nursing Home Nrs 18.3 8.9 21.8 23.8 18.9 25.4 19.5Office - Large OfL 28.9 26.8 29.9 31.6 31.6 32.9 30.3Office - Small OfS 25.8 22.4 26.0 29.3 28.6 30.5 27.1Health/Medical - Hospital OTR 20.9 20.9Restaurant - Fast-Food RFF 23.1 17.0 27.1 35.6 28.6 37.5 28.2Restaurant - Sit-Down RSD 12.2 24.3 32.3 30.1 32.5 26.3Retail - Multistory Large Rt3 19.5 31.3 35.4 31.3 39.1 31.3Retail - Single-Story Large RtL 25.5 19.7 30.8 35.8 29.8 38.9 30.1Retail - Small RtS 27.4 19.7 30.0 35.0 32.8 38.8 30.6Storage - Conditioned SCn 0.3 8.7 4.5
20.9 15.3 24.8 28.9 24.5 31.0 23.1Average
PGE AirCare Plus Unit Energy Savings [kWh/ton]
Building Type Abbr CZ2 CZ3 CZ4 CZ11 CZ12 CZ13 CZ16 AverageAssembly Asm 0.012 0.019 0.015 0.016 0.014 0.015
Education - Community College ECC 0.010 0.001 0.005 0.003 0.005
Education - Primary School EPr 0.000 0.000 0.000 0.003 0.001 0.004 0.001Education - Relocatable ClassrooERC 0.006 0.006Education - Secondary School ESe 0.000 0.000 0.000 0.004 0.002 0.005 0.002Grocery Gro 0.012 0.009 0.019 0.019 0.015 0.015 0.015Manufacturing - Light Industrial MLI 0.013 0.007 0.008 0.023 0.007 0.011Health/Medical - Nursing Home Nrs 0.009 0.004 0.013 0.012 0.011 0.010 0.010Office - Large OfL 0.016 0.007 0.011 0.013 0.017 0.011 0.013Office - Small OfS 0.015 0.008 0.009 0.013 0.017 0.013 0.012Health/Medical - Hospital OTR 0.010 0.010Restaurant - Fast-Food RFF 0.010 0.006 0.014 0.016 0.016 0.012Restaurant - Sit-Down RSD 0.006 0.017 0.019 0.014 0.015 0.014Retail - Multistory Large Rt3 0.010 0.019 0.023 0.020 0.019 0.018Retail - Single-Story Large RtL 0.012 0.009 0.019 0.019 0.019 0.015 0.016Retail - Small RtS 0.015 0.011 0.019 0.024 0.022 0.020 0.019Storage - Conditioned SCn 0.000 0.012 0.006
0.010 0.006 0.012 0.014 0.014 0.012 0.015 0.011Average
PGE AirCare Plus Unit Energy Savings [kW/ton]
DNV GL – www.dnvgl.com 4/1/16 Page B-7

Building Type Abbr CZ6 CZ8 CZ9 CZ10 CZ13 CZ14 CZ15 Average
Assembly Asm 22.0 28.3 25.5 28.1 26.8 24.7 41.2 28.1
Cnc 23.5 25.9 24.1 25.9 25.3 21.7 36.2 26.1Education - Community College ECC 20.2 24.9 22.3 23.6 24.0 22.1 35.2 24.6Education - Primary School EPr 11.7 13.2 13.1 13.3 13.7 12.1 21.3 14.1Education - Secondary School ESe 14.4 16.5 15.5 15.5 17.4 15.3 27.1 17.4Education - University EUn 33.0 33.9 26.5 28.8 29.0 24.7 40.2 30.9Grocery Gro 28.3 31.3 29.7 33.1 32.7 23.5 46.7 32.2Health/Medical - Nursing Home Nrs 20.7 18.6 23.8 23.2 21.3 18.6 37.2 23.3Office - Large OfL 28.9 29.3 25.9 28.7 27.7 24.3 33.8 28.4Office - Small OfS 26.2 27.6 24.6 27.4 25.6 24.9 32.0 26.9Restaurant - Sit-Down RSD 22.7 27.7 26.6 30.1 27.3 24.6 39.8 28.4Retail - Single-Story Large RtL 28.3 31.3 29.7 33.1 32.7 23.5 46.7 32.2Retail - Small RtS 30.5 33.7 31.4 32.7 32.8 24.0 43.8 32.7
s_MiC 23.5 25.9 24.1 25.9 25.3 21.7 36.2 26.123.9 26.3 24.5 26.4 25.8 21.8 36.9 26.5
SCE QUALITY MAINTENANCE Unit Energy Savings [kWh/ton]
Average
Building Type Abbr CZ6 CZ8 CZ9 CZ10 CZ13 CZ14 CZ15 Average
Assembly Asm 0.013 0.017 0.018 0.020 0.013 0.006 0.012 0.014Cnc 0.010 0.017 0.014 0.016 0.008 0.008 0.010 0.012
Education - Community College ECC 0.008 0.018 0.012 0.017 0.003 0.006 0.009 0.010Education - Primary School EPr 0.000 0.015 0.003 0.002 0.003 0.004 0.003 0.004Education - Secondary School ESe 0.001 0.018 0.003 0.003 0.004 0.005 0.004 0.005Education - University EUn 0.011 0.021 0.012 0.018 0.003 0.010 0.010 0.012Grocery Gro 0.014 0.017 0.018 0.020 0.012 0.014 0.016 0.016Health/Medical - Nursing Home Nrs 0.009 0.011 0.013 0.014 0.008 0.010 0.010 0.011Office - Large OfL 0.013 0.016 0.015 0.018 0.010 0.012 0.012 0.013Office - Small OfS 0.014 0.016 0.016 0.019 0.007 0.013 0.011 0.014Restaurant - Sit-Down RSD 0.014 0.015 0.020 0.020 0.013 0.007 0.013 0.015Retail - Single-Story Large RtL 0.014 0.017 0.018 0.020 0.012 0.014 0.016 0.016Retail - Small RtS 0.017 0.019 0.019 0.021 0.019 0.005 0.014 0.016
s_MiC 0.010 0.017 0.014 0.016 0.008 0.008 0.010 0.0120.011 0.017 0.014 0.016 0.009 0.009 0.011 0.012
SCE QUALITY MAINTENANCE Unit Energy Savings [kW/ton]
Average
DNV GL – www.dnvgl.com 4/1/16 Page B-8

Building Type Abbr CZ7 CZ10 CZ14 CZ15 System Average
Any 31.8 32.6 32.4 32.5 32.3
Assembly Asm 26.6 36.2 33.7 32.2 32.2Com 31.8 32.6 32.4 32.5 32.3
Education - Community College ECC 27.5 27.5 27.5Education - Primary School EPr 16.1 17.1 16.1 16.4 16.4Education - Relocatable Classroom ERC 17.1 19.4 18.2 18.2Education - Secondary School ESe 16.0 17.2 16.6 16.6Education - University EUn 45.6 45.6 45.6Health/Medical - Hospital Hsp 61.1 51.1 47.8 53.3 53.3Manufacturing - Bio/Tech MBT 49.6 47.7 48.6 48.6Manufacturing - Light Industrial MLI 17.8 24.4 21.1 21.1Health/Medical - Nursing Home Nrs 18.6 25.2 21.9 21.9Office - Large OfL 37.6 35.2 36.4 36.4Office - Small OfS 36.8 34.4 35.6 35.6Restaurant - Fast-Food RFF 36.4 41.8 39.1 39.1Restaurant - Sit-Down RSD 30.7 42.5 31.7 51.6 34.9 38.3Retail - Multistory Large Rt3 50.5 50.5 50.5Retail - Single-Story Large RtL 37.2 42.6 39.9 39.9Retail - Small RtS 43.8 42.2 32.6 39.5 39.5Storage - Conditioned SCn 3.5 12.6 8.0 8.0
31.8 32.6 32.4 51.6 32.5 32.7Average
SDG&E Deemed unit energy savings [kWh/ton]
Building Type Abbr CZ7 CZ10 CZ14 CZ15 System AverageAny 0.018 0.019 0.011 0.018 0.017
Assembly Asm 0.019 0.026 0.011 0.019 0.019
Com 0.018 0.019 0.011 0.018 0.017Education - Community College ECC 0.019 0.019 0.019Education - Primary School EPr 0.018 0.002 0.005 0.008 0.008Education - Relocatable Classroom ERC 0.017 0.000 0.009 0.009Education - Secondary School ESe 0.020 0.002 0.011 0.011Education - University EUn 0.026 0.026 0.026Health/Medical - Hospital Hsp 0.019 0.023 0.018 0.020 0.020Manufacturing - Bio/Tech MBT 0.015 0.026 0.020 0.020Manufacturing - Light Industrial MLI 0.018 0.026 0.022 0.022Health/Medical - Nursing Home Nrs 0.010 0.016 0.013 0.013Office - Large OfL 0.018 0.022 0.020 0.020Office - Small OfS 0.020 0.023 0.021 0.021Restaurant - Fast-Food RFF 0.018 0.026 0.022 0.022Restaurant - Sit-Down RSD 0.019 0.028 0.010 0.017 0.019 0.019Retail - Multistory Large Rt3 0.023 0.023 0.023Retail - Single-Story Large RtL 0.020 0.026 0.023 0.023Retail - Small RtS 0.023 0.026 0.010 0.019 0.019Storage - Conditioned SCn 0.008 0.017 0.013 0.013
0.018 0.019 0.011 0.017 0.018 0.018Average
SDG&E Deemed unit energy savings [kW/ton]
DNV GL – www.dnvgl.com 4/1/16 Page B-9
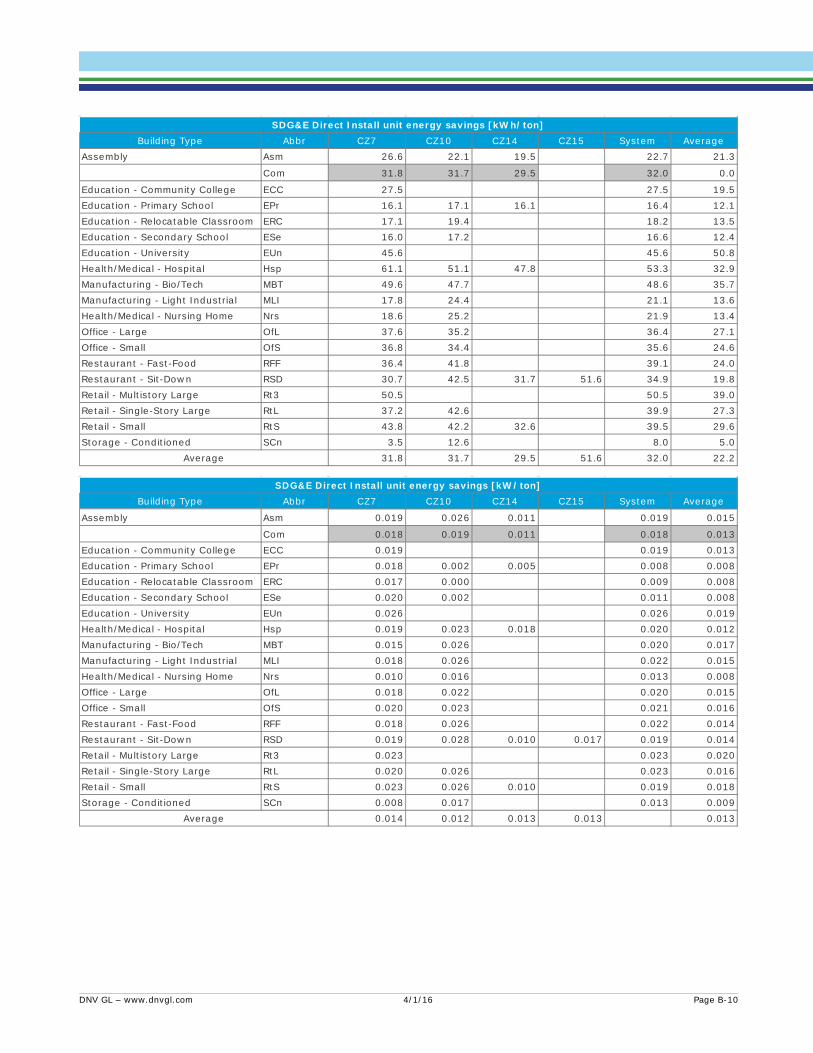
Building Type Abbr CZ7 CZ10 CZ14 CZ15 System AverageAssembly Asm 26.6 22.1 19.5 22.7 21.3
Com 31.8 31.7 29.5 32.0 0.0
Education - Community College ECC 27.5 27.5 19.5Education - Primary School EPr 16.1 17.1 16.1 16.4 12.1Education - Relocatable Classroom ERC 17.1 19.4 18.2 13.5Education - Secondary School ESe 16.0 17.2 16.6 12.4Education - University EUn 45.6 45.6 50.8Health/Medical - Hospital Hsp 61.1 51.1 47.8 53.3 32.9Manufacturing - Bio/Tech MBT 49.6 47.7 48.6 35.7Manufacturing - Light Industrial MLI 17.8 24.4 21.1 13.6Health/Medical - Nursing Home Nrs 18.6 25.2 21.9 13.4Office - Large OfL 37.6 35.2 36.4 27.1Office - Small OfS 36.8 34.4 35.6 24.6Restaurant - Fast-Food RFF 36.4 41.8 39.1 24.0Restaurant - Sit-Down RSD 30.7 42.5 31.7 51.6 34.9 19.8Retail - Multistory Large Rt3 50.5 50.5 39.0Retail - Single-Story Large RtL 37.2 42.6 39.9 27.3Retail - Small RtS 43.8 42.2 32.6 39.5 29.6Storage - Conditioned SCn 3.5 12.6 8.0 5.0
31.8 31.7 29.5 51.6 32.0 22.2
SDG&E Direct Install unit energy savings [kWh/ton]
Average
Building Type Abbr CZ7 CZ10 CZ14 CZ15 System Average
Assembly Asm 0.019 0.026 0.011 0.019 0.015
Com 0.018 0.019 0.011 0.018 0.013Education - Community College ECC 0.019 0.019 0.013Education - Primary School EPr 0.018 0.002 0.005 0.008 0.008Education - Relocatable Classroom ERC 0.017 0.000 0.009 0.008Education - Secondary School ESe 0.020 0.002 0.011 0.008Education - University EUn 0.026 0.026 0.019Health/Medical - Hospital Hsp 0.019 0.023 0.018 0.020 0.012Manufacturing - Bio/Tech MBT 0.015 0.026 0.020 0.017Manufacturing - Light Industrial MLI 0.018 0.026 0.022 0.015Health/Medical - Nursing Home Nrs 0.010 0.016 0.013 0.008Office - Large OfL 0.018 0.022 0.020 0.015Office - Small OfS 0.020 0.023 0.021 0.016Restaurant - Fast-Food RFF 0.018 0.026 0.022 0.014Restaurant - Sit-Down RSD 0.019 0.028 0.010 0.017 0.019 0.014Retail - Multistory Large Rt3 0.023 0.023 0.020Retail - Single-Story Large RtL 0.020 0.026 0.023 0.016Retail - Small RtS 0.023 0.026 0.010 0.019 0.018Storage - Conditioned SCn 0.008 0.017 0.013 0.009
0.014 0.012 0.013 0.013 0.013Average
SDG&E Direct Install unit energy savings [kW/ton]
DNV GL – www.dnvgl.com 4/1/16 Page B-10
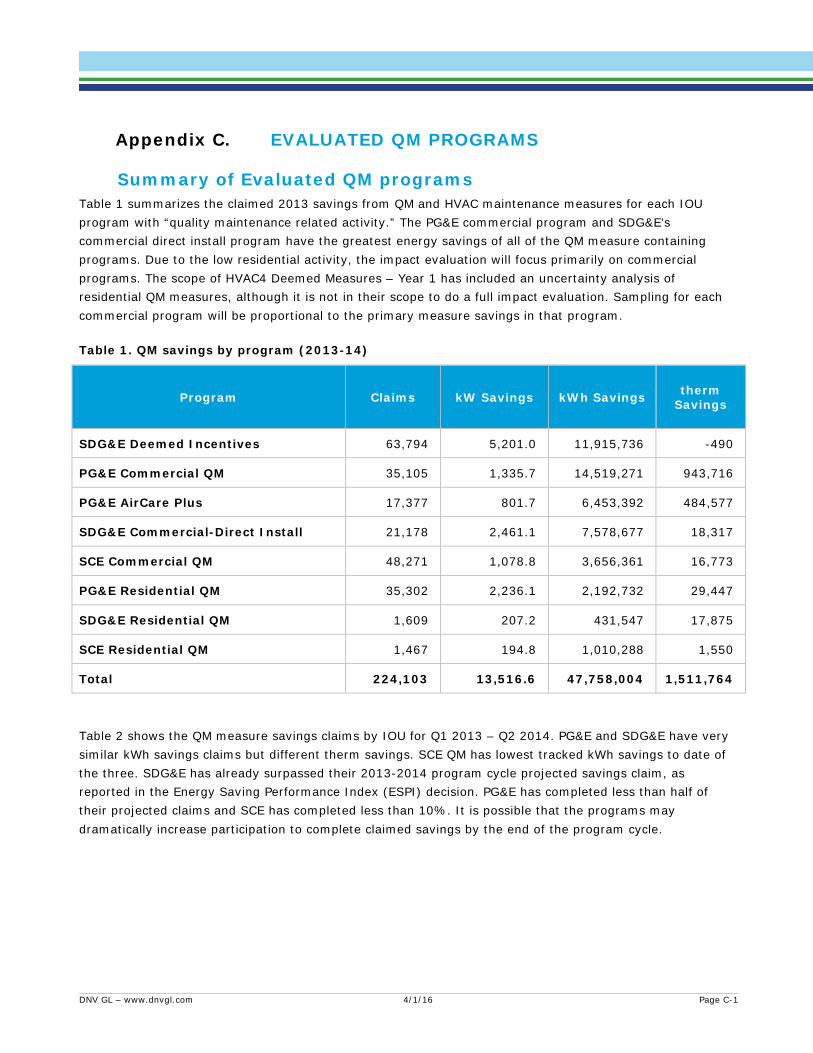
EVALUATED QM PROGRAMS Appendix C.
Table 1 summarizes the claimed 2013 savings from QM and HVAC maintenance measures for each IOU program with “quality maintenance related activity.” The PG&E commercial program and SDG&E’s commercial direct install program have the greatest energy savings of all of the QM measure containing programs. Due to the low residential activity, the impact evaluation will focus primarily on commercial programs. The scope of HVAC4 Deemed Measures – Year 1 has included an uncertainty analysis of residential QM measures, although it is not in their scope to do a full impact evaluation. Sampling for each commercial program will be proportional to the primary measure savings in that program.
Table 1. QM savings by program (2013-14)
Program Claims kW Savings kWh Savings therm Savings
SDG&E Deemed Incentives 63,794 5,201.0 11,915,736 -490
PG&E Commercial QM 35,105 1,335.7 14,519,271 943,716
PG&E AirCare Plus 17,377 801.7 6,453,392 484,577
SDG&E Commercial-Direct Install 21,178 2,461.1 7,578,677 18,317
SCE Commercial QM 48,271 1,078.8 3,656,361 16,773
PG&E Residential QM 35,302 2,236.1 2,192,732 29,447
SDG&E Residential QM 1,609 207.2 431,547 17,875
SCE Residential QM 1,467 194.8 1,010,288 1,550
Total 224,103 13,516.6 47,758,004 1,511,764
Table 2 shows the QM measure savings claims by IOU for Q1 2013 – Q2 2014. PG&E and SDG&E have very similar kWh savings claims but different therm savings. SCE QM has lowest tracked kWh savings to date of the three. SDG&E has already surpassed their 2013-2014 program cycle projected savings claim, as reported in the Energy Saving Performance Index (ESPI) decision. PG&E has completed less than half of their projected claims and SCE has completed less than 10%. It is possible that the programs may dramatically increase participation to complete claimed savings by the end of the program cycle.
Summary of Evaluated QM programs
DNV GL – www.dnvgl.com 4/1/16 Page C-1

Table 2. QM measure savings claim by IOU
IOU Number of Claims
kW Savings
kWh Savings
therm Savings
ESPI 2013-2014 Compliance Filing
Portfolio Projection (kWh)
PG&E 87,784 4,374 23,165,395 1,457,739 >40,000,000
SCE 49,738 1,274 4,666,649 18,322 >30,000,000
SDG&E 86,581 7,869 19,925,960 35,702 >9,000,000
PG&E PG&E offers QM programs for the residential and commercial sectors through its core HVAC offerings. Additionally, AirCare Plus, a third-party AC tune-up program administered by PECI (now ClearResult), is available to commercial PG&E customers. This evaluation looked at measures from the IOU’s commercial QM program and AirCare Plus.
Commercial QM PG&E implements QM measures for the commercial sector through this core HVAC program. Table 3 shows the measure descriptions number of claims, and aggregate kW, kWh, and therm savings from the tracking data. The specific measures include unoccupied fan controls (reprogram thermostat during unoccupied periods), programmable thermostat installation, refrigerant charge adjustment and economizer repair measures. Supply fan controls provided the greatest savings (4,367,405 kWh per year) of the five evaluated measures in the program.
Table 3. PG&E commercial QM program activity (2013-14)
Measures Claims kW kWh/Year Therms/Year
Coil Cleaning 2,171 0.0 0 0
RCA 6,098 738.3 870,455 -68
Economizer 4,546 -181.5 3,099,590 0
Thermostat 2,488 0.0 2,712,280 377,660
Supply Fan Control 1,937 0.0 4,367,405 542,121
HVAC Maintenance 17,564 778.8 3,469,541 24,002
Fan Repair 301 0.0 0 0
Air Filter Replacement
Economizer Addition
Duct Sealing
Total 35,105 1,336 14,519,271 943,716
DNV GL – www.dnvgl.com 4/1/16 Page C-2

AirCare Plus AirCare Plus is a third-party program implementing HVAC QM-type measures. The program is open to commercial customers in PG&E’s service territory. The claimed measures include refrigerant charge adjustment, coil cleaning, cogged drive belt retrofits, programmable thermostat installation, unoccupied fan control (re-program thermostat during unoccupied periods), and economizer repair. The programmable thermostat measure was responsible for the largest amount of energy savings (2,906,562 kWh per year) out of the five evaluated measures Table 4.
Table 4. PG&E AirCare Plus QM activity (2013-14)
Measures Claims kW kWh/Year Therms/Year
Coil Cleaning 3,717 49.2 76,692 -11
RCA 5,671 873.6 1,450,631 -182
Economizer 3,503 -216.7 1,462,544
Thermostat 2,694 0.0 2,906,562 418,480
Supply Fan Control 442 0.0 453,308 66290
HVAC Maintenance
Fan Repair 1,350 95.6 103,654 0
Air Filter Replacement
Economizer Addition
Duct Sealing
Total 17,377 801.7 6,453,392 484,577
SCE SCE has submitted workpapers for both residential and commercial QM measures. The only residential program reporting QM activity is the “Comprehensive Manufactured Homes Program” for Q1 2013-Q2 2014. The evaluation team does not know if SCE expects to complete additional residential QM during the program cycle, but we will determine this during the investigation into program activities and revise the research plan if necessary.
Commercial QM SCE administers all of its commercial HVAC maintenance activities through this broad-based core commercial HVAC program. Aside from the cogged drive belts measures, all of the program’s tracking data measures refer to a QM package of measures. The various claims are based upon the specifics of the cooling system including system type (air conditioner, heat pump or evaporative cooled air conditioner) and whether or not the unit has an economizer.
DNV GL – www.dnvgl.com 4/1/16 Page C-3

The actual QM activities performed are uncertain, since not all units receive all potential HVAC maintenance measures. DNV GL will make data requests to determine the HVAC maintenance measures performed or installed on each unit, similar to request made for the 2010-12 evaluation.
Table 5 lists SCE’s commercial QM program activity including tracked energy savings by measure for 2013-14. Quality Maintenance with Economizer repair or replacement accounted for an overwhelming majority of energy savings across the program at 3,143,757 kWh per year.
Table 5. SCE commercial QM program activity (2013-14)
Measures Claims kW kWh/Year Therms/Year
Coil Cleaning 3,209 0.0 0 0
RCA 6,418 0.0 0 0
Economizer 3,077 1,338 3,700,926 16,287
Thermostat 6,418 0.0 0 0
Supply Fan Control
HVAC Maintenance 2,486 302 738,869 2,932
Fan Repair 3,734 2.0 17,855 0
Air Filter Replacement
Economizer Addition
Duct Sealing
Total 48,271 1,079 3,656,361 16,773
SDG&E SDG&E implements HVAC maintenance measures in the residential and commercial sectors via four different programs:
• Residential HVAC-QI/QM • Deemed Incentives–Commercial HVAC • Deemed Incentives Add-on • Direct Install
This evaluation estimated impacts for measures in the Deemed Incentives-Commercial HVAC and Direct Install program.
Deemed Incentives–Commercial HVAC This third-party HVAC program is marketed as Premium Efficiency Cooling and provides tune-up and QM options. The program includes silver, gold, and platinum tune-up options. The silver option includes ANSI/ASHRAE /ACCA Standard 180 compliant inspections and maintenance (excluding combustion analysis). The gold option aligns with the commercial QM program and provides incentives for a 3-year maintenance agreement (or 1-year with continuous renewal for three years). Platinum requires a three-year agreement
DNV GL – www.dnvgl.com 4/1/16 Page C-4
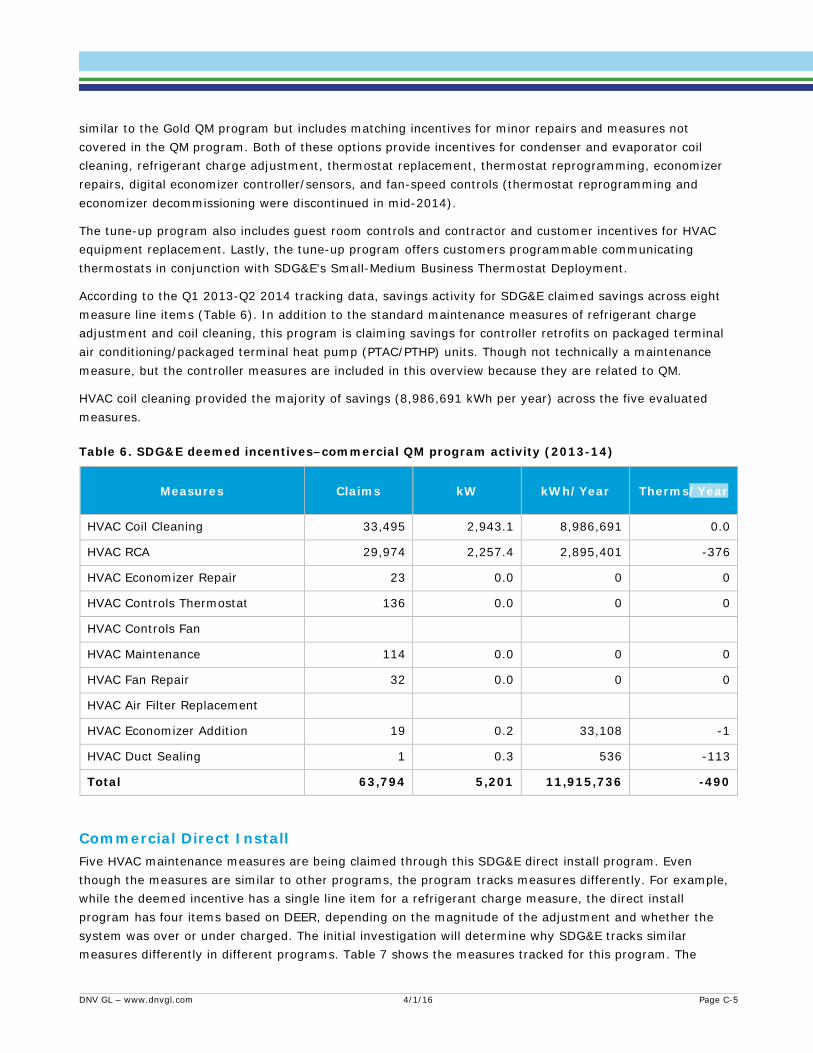
similar to the Gold QM program but includes matching incentives for minor repairs and measures not covered in the QM program. Both of these options provide incentives for condenser and evaporator coil cleaning, refrigerant charge adjustment, thermostat replacement, thermostat reprogramming, economizer repairs, digital economizer controller/sensors, and fan-speed controls (thermostat reprogramming and economizer decommissioning were discontinued in mid-2014).
The tune-up program also includes guest room controls and contractor and customer incentives for HVAC equipment replacement. Lastly, the tune-up program offers customers programmable communicating thermostats in conjunction with SDG&E's Small-Medium Business Thermostat Deployment.
According to the Q1 2013-Q2 2014 tracking data, savings activity for SDG&E claimed savings across eight measure line items (Table 6). In addition to the standard maintenance measures of refrigerant charge adjustment and coil cleaning, this program is claiming savings for controller retrofits on packaged terminal air conditioning/packaged terminal heat pump (PTAC/PTHP) units. Though not technically a maintenance measure, but the controller measures are included in this overview because they are related to QM.
HVAC coil cleaning provided the majority of savings (8,986,691 kWh per year) across the five evaluated measures.
Table 6. SDG&E deemed incentives–commercial QM program activity (2013-14)
Measures Claims kW kWh/Year Therms/Year
HVAC Coil Cleaning 33,495 2,943.1 8,986,691 0.0
HVAC RCA 29,974 2,257.4 2,895,401 -376
HVAC Economizer Repair 23 0.0 0 0
HVAC Controls Thermostat 136 0.0 0 0
HVAC Controls Fan
HVAC Maintenance 114 0.0 0 0
HVAC Fan Repair 32 0.0 0 0
HVAC Air Filter Replacement
HVAC Economizer Addition 19 0.2 33,108 -1
HVAC Duct Sealing 1 0.3 536 -113
Total 63,794 5,201 11,915,736 -490
Commercial Direct Install Five HVAC maintenance measures are being claimed through this SDG&E direct install program. Even though the measures are similar to other programs, the program tracks measures differently. For example, while the deemed incentive has a single line item for a refrigerant charge measure, the direct install program has four items based on DEER, depending on the magnitude of the adjustment and whether the system was over or under charged. The initial investigation will determine why SDG&E tracks similar measures differently in different programs. Table 7 shows the measures tracked for this program. The
DNV GL – www.dnvgl.com 4/1/16 Page C-5

dominant HVAC maintenance measure in this program is condenser coil cleaning which accounts for nearly half of kWh savings of the HVAC maintenance savings for this program in Q1 2013–Q2 2014.
Table 7. SDG&E commercial direct-install QM program activity (2013-14)
Measures Claims kW kWh/Year Therms/Year
HVAC Coil Cleaning 14,944 1623.9 5,632,737 0
HVAC RCA 2,654 695.9 981,222 -77
HVAC Economizer Repair 220 1.5 90,260 -1,708
HVAC Controls Thermostat 267 -44.1 202,469 20,664
HVAC Controls Fan
HVAC Maintenance
HVAC Fan Repair
HVAC Air Filter Replacement 2,942 174.7 649,574 0
HVAC Economizer Addition
HVAC Duct Sealing 151 9.4 22,415 -562
Total 21,178 2461.2 7,578,677 18317
Workpapers for SDG&E’s commercial QM measures include WPSDGENRHC1010 Commercial Evaporator Coil Cleaning, WPSDGENRHC1020 Commercial Condenser Coil Cleaning and WPSDGENRHC1030 Air Filter Replacement. DNV GL was not able to locate the workpaper associated with “Duct seal testing” or “Checked and re-positioned outside air dampers.” We have been informed by the ex ante team that the Evaporator and Condenser Coil Cleaning workpapers have not been approved, and that they expect the Commercial QM workpaper and related disposition to apply to the coil cleaning measures in SDG&E’s tune-up programs.
.
DNV GL – www.dnvgl.com 4/1/16 Page C-6
DETAILED M&V PLAN Appendix D.
Overview The approach to measurement and verification of QM and “tune-up” programs is designed here to reduce a complex problem fraught with uncertainty due to large variation in HVAC unit energy consumption and associated program-induced savings. As WO32 found, the coefficient of variation among HVAC measure savings is so large that the traditional M&V approach of sampling program-treated HVAC units requires an unfeasible sample size (within reasonable budget limitations.) A different analysis approach will be taken in this impact evaluation. The data collected on site will be aggregated and inputs developed for eQuest prototype building simulation models to evaluate each top measure in each program. Instead of modeling each site, one set of building type / vintage prototypes will be run for each California climate zone in each IOU program. The data will be segmented by building type/vintage only where the workpapers segment model inputs along those lines. This evaluation will not attempt to assess the interactive effects between measures. The workpapers for the QM programs use a similar methodology to develop savings so the evaluation will also serve to assess the workpaper assumptions on model input values where possible.
The data reviewed and collected during each task is planned to provide information on the pre-maintenance baseline operating condition and post-maintenance installed operating condition of the equipment serviced. The pilot information from this study has informed laboratory testing and the lab testing in turn will be used to inform the analysis that will estimate the ex post savings achieved by QM and “tune-up” measures.
Below are five measures of interest that will be the subject of this evaluation as laid out in the research plan. Any program pre-requisites associated with these measures will also be considered. These represent the most significant measures with regards to implementer savings claims across the QM programs.
• Condenser and evaporator coil cleaning • Refrigerant charge adjustment • Economizer retrofit/repair • Programmable thermostat installation/adjustment • Supply fan control adjustment
M&V Tasks
Workpaper Review The first M&V activity completed was a review and comparison of the workpaper dispositions issued by the CPUC and workpapers associated with identified key program measures. A summary of this review is tabulated in Table 2 in Appendix E. We have also researched the key parameters, assumptions and calculation methodology used to estimate ex ante savings. Workpaper assumptions used for individual measure impact evaluation are documented in the measure detail sections of this report.
Participation Records Review We have requested and received detailed implementer data from each IOU. Some programs’ data included more detail than others. The research team recognizes the potential for bias due to the expected variety in data received. However, the information is still informative even with bias. The received information documents the weight of refrigerant added or removed during refrigerant charge adjustment for all programs and the pre and post-retrofit conditions observed by the programs for thermostat and fan control
DNV GL – www.dnvgl.com 4/1/16 Page D-1
measures. Condenser and evaporator coil cleaning data is non-existent for the QM programs, but cleaning date is available for the “tune up” programs. Economizer information is spotty across the programs, and will be of use only in some cases. See Table 1 in Appendix E for a catalog of information available in implementer files. The most relevant data is highlighted yellow in the table.
Field Efforts The measurement and verification effort have two distinct data collection activities. Pre/post “ride-along” visits of current program activity to evaluate the coil cleaning measures and traditional ex post site visits for a sample of the 2013-2014 QM population to evaluate all other measures.
Implementation Ride-Along – Coil Cleaning Measure Focus The plan is to complete 45 ride-along visits with implementation technicians focusing on the coil cleaning measures. The ride-along visits will take place with sites that are just entering the program in 2015. In this manner we are assured to capture the baseline of units entering the program. We will use these ride-along visits to collect data on the change in compressor suction and discharge pressure as well as the static (air) pressure and airflow across the evaporator coil to assess the system changes before and after evaporator and condenser coil cleaning.
To record the change in refrigerant pressure across the coils, the unit must be operating in cooling mode. Therefore, these ride-alongs must take place during the cooling season.
We will also record observations of the operating conditions of the HVAC units on site, including supply fan operating schedule and thermostat settings including any energy management system overrides. These recorded observations will provide baseline data points for the supply fan control and thermostat measures. We don’t expect changes to be made to these measures at the same time as coil cleaning, so don’t expect to be able to record post-retrofit states at these visits.
In addition, these visits allow for observation of the maintenance decision-making process and “real life” issues faced by technicians. These observations are expected to support the discussion of any variance between ex ante and ex post estimates.
Post-Retrofit Site Visits - Other Priority Measure focus We will visit 55 participant sites to collect data for evaluation of the refrigerant charge adjustment (RCA), economizer, supply fan control and programmable thermostat measures. The fundamental activities include,
• Using the weigh in/out method to evaluate RCA • Testing outside airflow and return airflow at economizer “open” and “closed” positions • Determine economizer control sequence, and changeover set point • Recording of thermostat settings for supply fan control and programmable thermostat • Administering a survey to facility to determine pre-treatment thermostat and fan control settings and
pre-existing overriding unit controls (EMS or time-clock controllers).
These visits can occur during cooler temperatures when the building cooling is not required. This allows for removal of refrigerant without interrupting building conditioning. Testing of economizer outside air flow is benefited by cold (or hot) outdoor temperatures as these tests require a 15 degree temperature difference between outdoor air and indoor (return) air temperatures to get below 10% uncertainty. If uncertainty up to 20% is acceptable then temperature differences of up to six degrees may be used. Investigation (Using WO32 measured data) of enthalpy and humidity balance showed that humidity sensors do not improve the
DNV GL – www.dnvgl.com 4/1/16 Page D-2

uncertainty due to the low-humidity California environment and well-known inaccuracy and time-lag in humidity sensor readings.
Field M&V Plan The site field M&V plan for non-residential QM will be tested during the M&V pilot task. The final site data collection plan will be modified as a result of the lessons learned in the pilot
Safety Any project or activity involving fieldwork escalates risk. To mitigate risk, DNV GL requires business line managers, project managers, contractor representatives, and all affected employees to complete the Job Safety and Environmental Analysis (JSEA) prior to undertaking fieldwork. The JSEA serves as a template to identify risks associated with any task to be completed in the field. It also provides a means of documenting the field task procedure, risk mitigation strategies, required tools and personal protective equipment (PPE), and any required authorizations, permits, or forms. One of the forms is the Energized Electrical Form. Whenever a field task involves work on exposed energized conductors over 50 V, a DNV GL or RMA Qualified Electrical Worker (QEW) will be required to perform that task. In the event the task is to be completed by a subcontractor of DNV GL, the subcontractor is expected to provide its QEWs with training comparable to that outlined in the DNV GL Energy Advisory QEW Program. The DNV GL QEW program is designed to be consistent with Occupational Safety and Health Administration (OSHA) standards 29CFR1910.269 and 29CFR1910.339 as well as the 2012 edition of the National Fire Protection Association (NFPA) 70E Standard for Electrical Safety in the Workplace.
Data Collection Plan Table 1 is a high level summary of the data that will be recorded for each unit tested. This summary table is followed by a detailed list of the metering and testing equipment to be used for field data collection for ride-alongs and post only site visits. Monitoring equipment will be installed only for the day that we visit the site and may be supplemented by additional spot measurements. Data collected with this equipment will feed into laboratory testing and the program level DEER prototype energy simulation analyses. Those analyses will produce program-level savings estimates on a measure by measure basis. The uncertainty associated with field measurements and the modeling analyses was covered in the 2010-12 WO32 Task 3.1 and 3.2 deliverables (see Appendix E.).
M&V data summary Table 1 shows the data summary for commercial M&V inputs.
Table 1: Needs a title
Data Plan
Program/Measure List
IOU Program Number & Name; Measures present at site based on tracking data
Site Sample Stratum and Weight
Claim IDs – Site ID IOU-Program tracking data based sample information
DNV GL – www.dnvgl.com 4/1/16 Page D-3
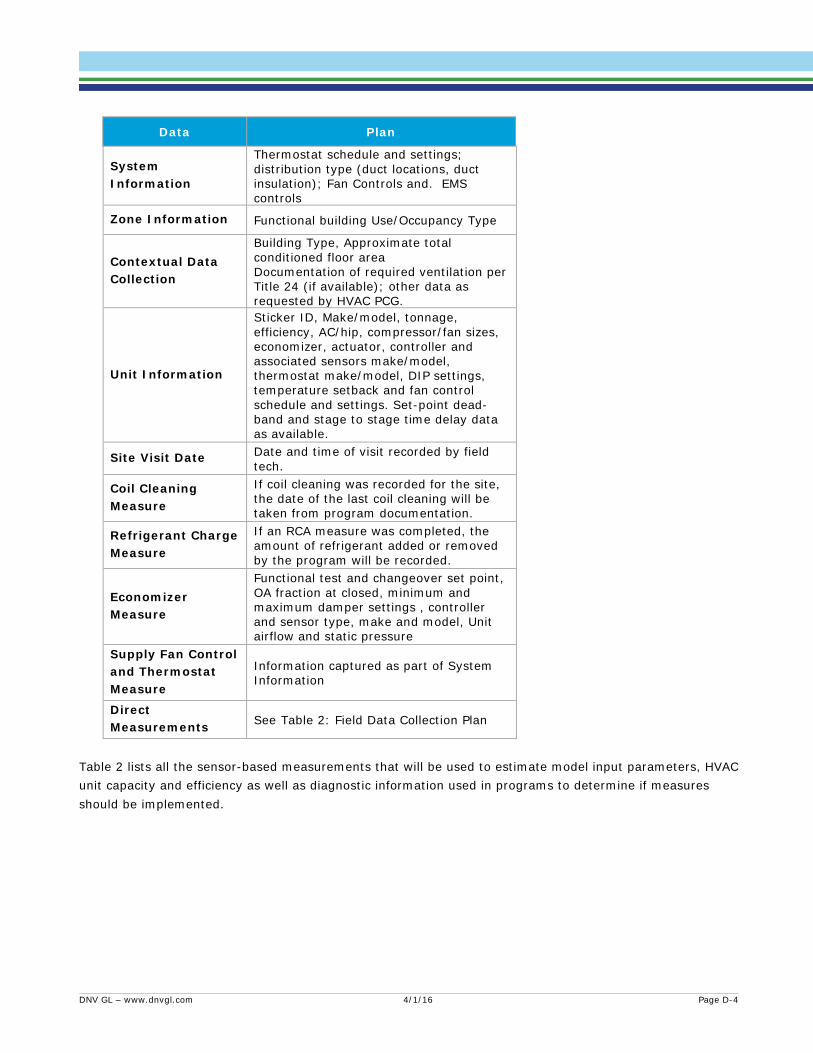
Data Plan
System Information
Thermostat schedule and settings; distribution type (duct locations, duct insulation); Fan Controls and. EMS controls
Zone Information Functional building Use/Occupancy Type
Contextual Data Collection
Building Type, Approximate total conditioned floor area Documentation of required ventilation per Title 24 (if available); other data as requested by HVAC PCG.
Unit Information
Sticker ID, Make/model, tonnage, efficiency, AC/hip, compressor/fan sizes, economizer, actuator, controller and associated sensors make/model, thermostat make/model, DIP settings, temperature setback and fan control schedule and settings. Set-point dead-band and stage to stage time delay data as available.
Site Visit Date Date and time of visit recorded by field tech.
Coil Cleaning Measure
If coil cleaning was recorded for the site, the date of the last coil cleaning will be taken from program documentation.
Refrigerant Charge Measure
If an RCA measure was completed, the amount of refrigerant added or removed by the program will be recorded.
Economizer Measure
Functional test and changeover set point, OA fraction at closed, minimum and maximum damper settings , controller and sensor type, make and model, Unit airflow and static pressure
Supply Fan Control and Thermostat Measure
Information captured as part of System Information
Direct Measurements See Table 2: Field Data Collection Plan
Table 2 lists all the sensor-based measurements that will be used to estimate model input parameters, HVAC unit capacity and efficiency as well as diagnostic information used in programs to determine if measures should be implemented.
DNV GL – www.dnvgl.com 4/1/16 Page D-4

Table 2: Field Data Collection Plan
Parameter to Measure
Parameter Range
M&V Equipment Brand and Model
Rated Full Scale Accuracy
Minimum Planned Metering Duration
Planned Metering Interval
Supply Air – Temperature/RH 45°F-65°F
Onset Smart sensor S-THB-M002
Rotronics HC2-S Probe (WB/DB) and HygroLog
HL-NT data logger
Onset: ± 0.36°F ± 3.5% RH
Rotronics: ±0.8 %rh / ±0.18 F
90-120 minutes 1 minute
Return Air – Temperature/RH 50°F-80°F
Onset Smart sensor S-THB-M002
Rotronics HC2-S Probe (WB/DB) and HygroLog
HL-NT data logger
Onset: ± 0.36°F ± 3.5% RH
Rotronics: ±0.8 %rh / ±0.18 F
90-120 minutes 1 minute
Unit and supply fan power measurement: V, A, kW, kWh, Pf
0 to 250 kW PowerSight PS3500 Or Dent ElitePro
1% kW, 0.5% Amps, phase shift and 50th harmonic
(PS3500)
Average over 15 minutes N/A
Ambient Air Temperature 30°F-120°F
Onset Smart sensor S-THB-M002
Rotronics HC2-S Probe (WB/DB) and HygroLog
HL-NT data logger
Onset: ± 0.36°F ± 3.5% RH
Rotronics: ±0.8 %rh / ±0.18 F
90-120 minutes 1 minute
Mixed Air Temperature 30°F-120°F
Four to eight Onset Smart sensor S-THB-
M002 Rotronics HC2-S Probe (WB/DB) and HygroLog HL-NT data logger in
addition to an averaging temperature senor
Onset: ± 0.36°F ± 3.5% RH
Rotronics: ±0.8 %rh / ±0.18 F
90-120 minutes 1 minute
Airflow 365-2,100 CFM/plate
Energy Conservatory True Flow Grid
± 7% CFM
Average of 2 tests N/A
DNV GL – www.dnvgl.com 4/1/16 Page D-5
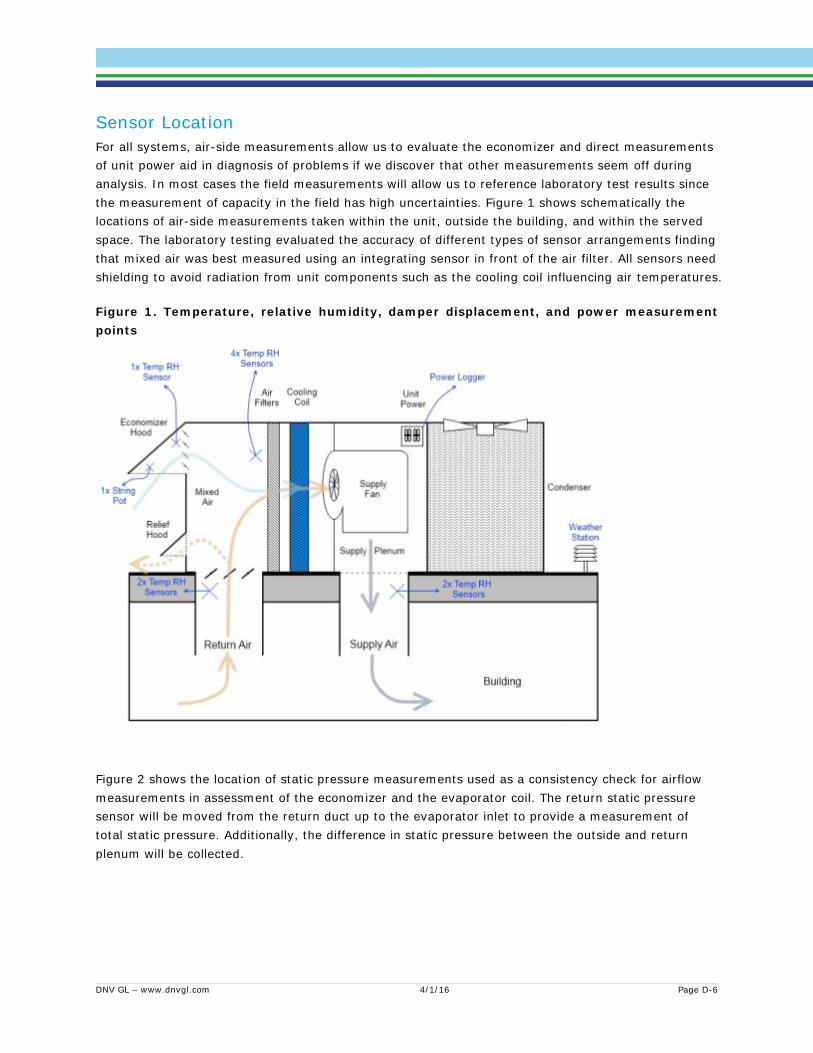
Sensor Location For all systems, air-side measurements allow us to evaluate the economizer and direct measurements of unit power aid in diagnosis of problems if we discover that other measurements seem off during analysis. In most cases the field measurements will allow us to reference laboratory test results since the measurement of capacity in the field has high uncertainties. Figure 1 shows schematically the locations of air-side measurements taken within the unit, outside the building, and within the served space. The laboratory testing evaluated the accuracy of different types of sensor arrangements finding that mixed air was best measured using an integrating sensor in front of the air filter. All sensors need shielding to avoid radiation from unit components such as the cooling coil influencing air temperatures.
Figure 1. Temperature, relative humidity, damper displacement, and power measurement points
Figure 2 shows the location of static pressure measurements used as a consistency check for airflow measurements in assessment of the economizer and the evaporator coil. The return static pressure sensor will be moved from the return duct up to the evaporator inlet to provide a measurement of total static pressure. Additionally, the difference in static pressure between the outside and return plenum will be collected.
DNV GL – www.dnvgl.com 4/1/16 Page D-6

Figure 2. Static pressure measurement points
Figure 3 shows the placement of the True Flow grid and sensors used to determine system airflow.
DNV GL – www.dnvgl.com 4/1/16 Page D-7
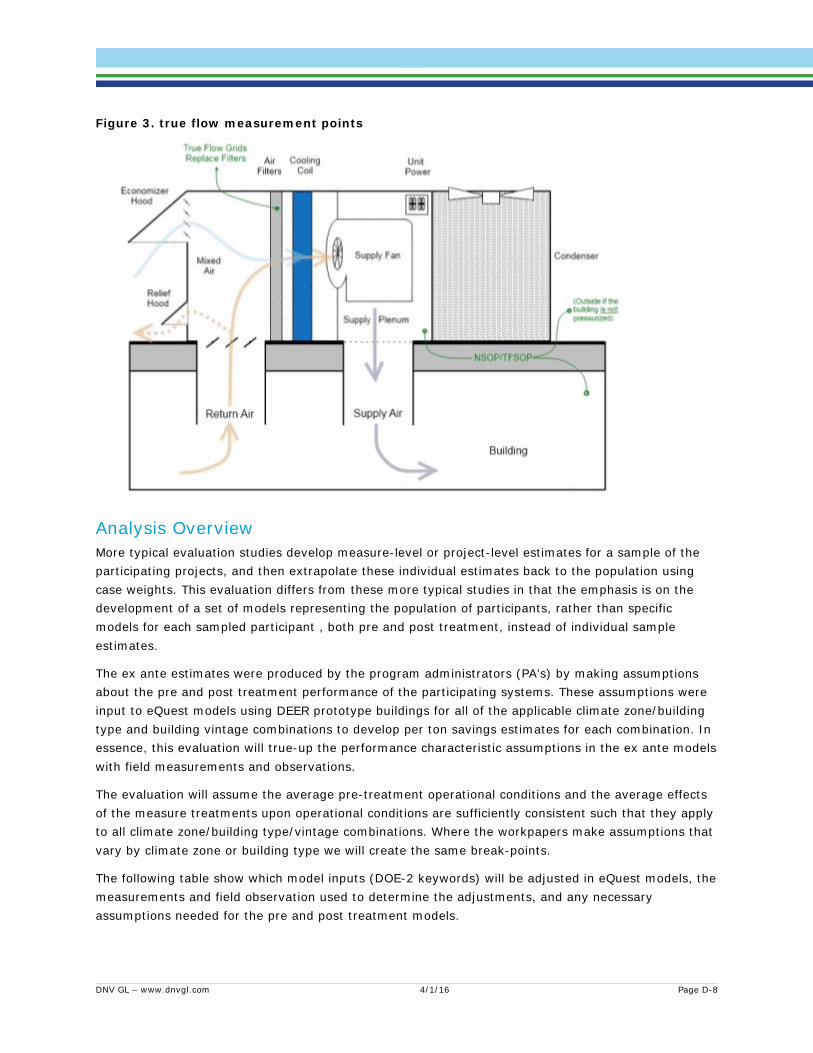
Figure 3. true flow measurement points
Analysis Overview More typical evaluation studies develop measure-level or project-level estimates for a sample of the participating projects, and then extrapolate these individual estimates back to the population using case weights. This evaluation differs from these more typical studies in that the emphasis is on the development of a set of models representing the population of participants, rather than specific models for each sampled participant , both pre and post treatment, instead of individual sample estimates.
The ex ante estimates were produced by the program administrators (PA’s) by making assumptions about the pre and post treatment performance of the participating systems. These assumptions were input to eQuest models using DEER prototype buildings for all of the applicable climate zone/building type and building vintage combinations to develop per ton savings estimates for each combination. In essence, this evaluation will true-up the performance characteristic assumptions in the ex ante models with field measurements and observations.
The evaluation will assume the average pre-treatment operational conditions and the average effects of the measure treatments upon operational conditions are sufficiently consistent such that they apply to all climate zone/building type/vintage combinations. Where the workpapers make assumptions that vary by climate zone or building type we will create the same break-points.
The following table show which model inputs (DOE-2 keywords) will be adjusted in eQuest models, the measurements and field observation used to determine the adjustments, and any necessary assumptions needed for the pre and post treatment models.
DNV GL – www.dnvgl.com 4/1/16 Page D-8
Once the pre and post model inputs have been finalized for each of the measures, a batch processor will be utilized to adjust the models and generate savings estimates for all climate zone/building type/vintage combinations. We believe that this measure-based approach is appropriate because the tracking data for all of the programs, with the exception of SCE, lists savings for each of the individual measures being evaluated. The program level savings for these programs will be calculated by applying the ex post climate zone/building type/vintage savings by measure to the entire participant population. SCE program savings will be calculated for the “quality maintenance” measure, as in the Quality Maintenance Workpaper by calculating savings for each of the individual measures, and summing the savings using a frequency of occurrence of the individual measures within an instance of the “quality maintenance” measure. The frequency of measure occurrence assumed in the workpaper will be checked against the frequency of occurrence recorded in implementer data obtained from the 2013-2014 program records.
DNV GL – www.dnvgl.com 4/1/16 Page D-9

Table 1. DOE-2 Keywords
Coil Cleaning
DOE-2 Keyword Relevant Measurements Ex Post Model Adjustments Baseline
COOLING-EIR - Cooling energy input ratio is
the ratio of input power to output capacity, the
inverse of the coefficient of
performance. This is the operational
efficiency rating of the unit at standard
conditions
Pre and post refrigerant discharge pressures at similar
temperature conditions for
condenser coil. Substitute airflow for discharge pressure for evaporator coil.
Pressure changes will be converted to changes in percentage improvement in COOLING-EIR using correlations developed in lab tests. The ex post
models will use the average nominal rated efficiency of the sample. The degraded pre-
treatment efficiency will be reflected in the baseline model
The baseline EIR will be the adjusted
down to represent the average efficiency
degradation due to dirty coils as
determined from the ride-along sample.
COOL-SH-CAP - Cooling sensible heat capacity is maximum amount of sensible
heat that the system can instantaneously be
removed from the airstream
Pre and post refrigerant discharge
and suction pressures at similar
temperature conditions.
Similar to the efficiency adjustments, sensible capacity adjustments for coil cleaning will be
determined using lab correlations. The ex post model will have use the average sensible cooling
degradation factor for a system with clean coils that is determined from lab tests. The fully degraded
pre-treatment sensible capacity will be reflected in the baseline model.
The baseline COOL-SH-CAP will be
degraded to reflect the average pre-
treatment percentage degraded
sensible cooling capacity of the
sample. COOLING-CAPACITY - The cooling capacity is the maximum amount of heat, both sensible and latent, that the
system can instantaneously
removed from the airstream.
Pre and post refrigerant discharge
and suction pressures at similar
temperature conditions.
Similar to the efficiency adjustments, capacity adjustments for charge adjustments will be
determined using lab correlations. The ex post model will have use the average total cooling degradation factor for a system with a proper
manufacturer-specified refrigerant charge that is determined from lab tests. The fully degraded pre-treatment sensible capacity will be reflected in the
baseline model.
The baseline COOLING-CAPACITY will be degraded to reflect the average
pre-treatment percentage degraded total cooling capacity
of the sample.
DNV GL – www.dnvgl.com 4/1/16 Page D-10
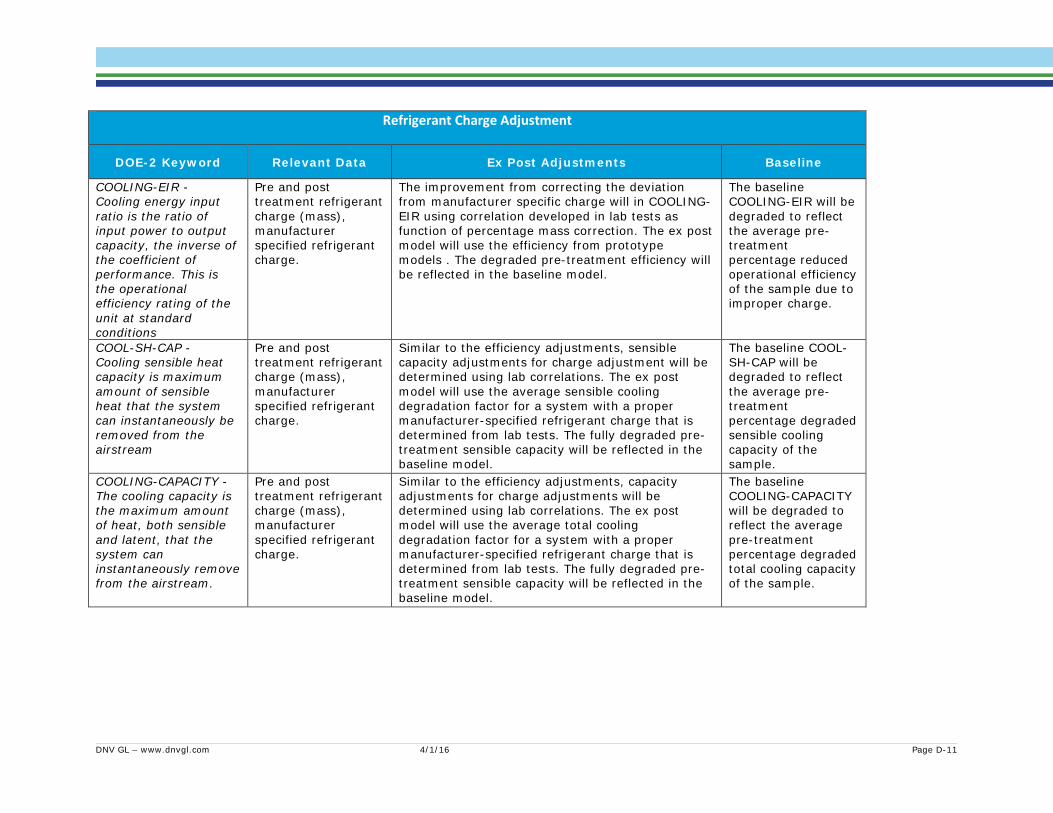
Refrigerant Charge Adjustment
DOE-2 Keyword Relevant Data Ex Post Adjustments Baseline
COOLING-EIR - Cooling energy input ratio is the ratio of input power to output capacity, the inverse of the coefficient of performance. This is the operational efficiency rating of the unit at standard conditions
Pre and post treatment refrigerant charge (mass), manufacturer specified refrigerant charge.
The improvement from correcting the deviation from manufacturer specific charge will in COOLING-EIR using correlation developed in lab tests as function of percentage mass correction. The ex post model will use the efficiency from prototype models . The degraded pre-treatment efficiency will be reflected in the baseline model.
The baseline COOLING-EIR will be degraded to reflect the average pre-treatment percentage reduced operational efficiency of the sample due to improper charge.
COOL-SH-CAP - Cooling sensible heat capacity is maximum amount of sensible heat that the system can instantaneously be removed from the airstream
Pre and post treatment refrigerant charge (mass), manufacturer specified refrigerant charge.
Similar to the efficiency adjustments, sensible capacity adjustments for charge adjustment will be determined using lab correlations. The ex post model will use the average sensible cooling degradation factor for a system with a proper manufacturer-specified refrigerant charge that is determined from lab tests. The fully degraded pre-treatment sensible capacity will be reflected in the baseline model.
The baseline COOL-SH-CAP will be degraded to reflect the average pre-treatment percentage degraded sensible cooling capacity of the sample.
COOLING-CAPACITY - The cooling capacity is the maximum amount of heat, both sensible and latent, that the system can instantaneously remove from the airstream.
Pre and post treatment refrigerant charge (mass), manufacturer specified refrigerant charge.
Similar to the efficiency adjustments, capacity adjustments for charge adjustments will be determined using lab correlations. The ex post model will use the average total cooling degradation factor for a system with a proper manufacturer-specified refrigerant charge that is determined from lab tests. The fully degraded pre-treatment sensible capacity will be reflected in the baseline model.
The baseline COOLING-CAPACITY will be degraded to reflect the average pre-treatment percentage degraded total cooling capacity of the sample.
DNV GL – www.dnvgl.com 4/1/16 Page D-11

Economizer Measures
DOE-2 Keyword Relevant Data Ex Post Adjustments Baseline
MIN-OA-AIR - Minimum outside air percentage is the percentage of outside air drawn through the system when the economizer damper position is at its minimum position. MIN-AIR-SCH will be used to define periods when damper is closed according to eQuest prototypes.
The measurements for determining min OA fraction are outside air, return air and mixed air temperatures.
. The ex post MIN-OA-AIR will be derived from measurements using the following equation.
The baseline (pre-treatment) min OA will be determined from implementer data where possible if there were changes to the min damper position. If no changes were made to the minimum damper position, the baseline model will use the same min OA % as the ex post.
MAX-OA-FRACTION, Maximum outside air fraction is the percentage fraction of outside air drawn through the system when the economizer damper position is at its maximum open position.
Same as min OA
The MAX-OA-FRACTION will be derived using the same equation as MIN-OA-AIR
The baseline (pre-treatment) maximum OA will be determined from implementer data where possible if there were changes to the maximum damper position. If no changes were made to the minimum damper position, the baseline model will use the same maximum OA % as the ex post.
RATOATMATOATOA
−−
=%
DNV GL – www.dnvgl.com 4/1/16 Page D-12
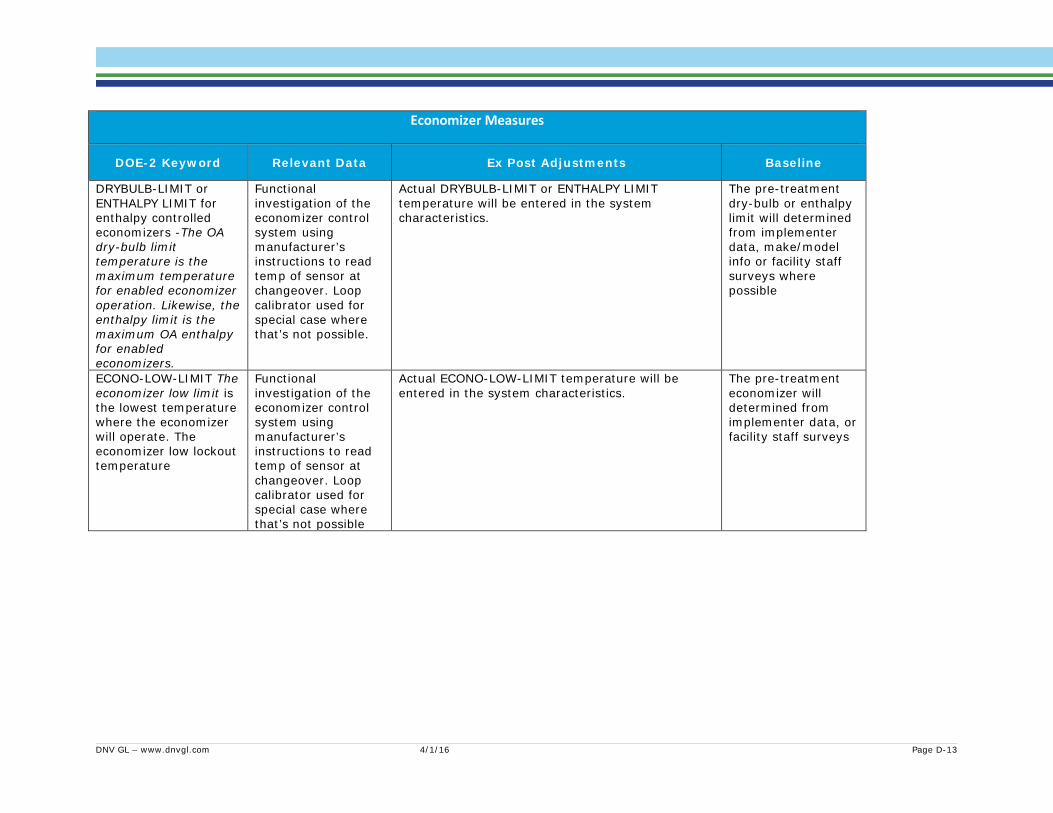
Economizer Measures
DOE-2 Keyword Relevant Data Ex Post Adjustments Baseline
DRYBULB-LIMIT or ENTHALPY LIMIT for enthalpy controlled economizers -The OA dry-bulb limit temperature is the maximum temperature for enabled economizer operation. Likewise, the enthalpy limit is the maximum OA enthalpy for enabled economizers.
Functional investigation of the economizer control system using manufacturer’s instructions to read temp of sensor at changeover. Loop calibrator used for special case where that’s not possible.
Actual DRYBULB-LIMIT or ENTHALPY LIMIT temperature will be entered in the system characteristics.
The pre-treatment dry-bulb or enthalpy limit will determined from implementer data, make/model info or facility staff surveys where possible
ECONO-LOW-LIMIT The economizer low limit is the lowest temperature where the economizer will operate. The economizer low lockout temperature
Functional investigation of the economizer control system using manufacturer’s instructions to read temp of sensor at changeover. Loop calibrator used for special case where that’s not possible
Actual ECONO-LOW-LIMIT temperature will be entered in the system characteristics.
The pre-treatment economizer will determined from implementer data, or facility staff surveys
DNV GL – www.dnvgl.com 4/1/16 Page D-13

Programmable Thermostat and Supply Fan Control Measures
DOE-2 Keyword Relevant
Measurements Ex Post Model Adjustments Baseline
HEAT-TEMP-SCH
COOL-TEMP-SCH Thermostat heating and cooling set point schedules Also FAN-SCH to establish fan schedule, INDOOR-FAN-MODE to specify if the fans only run on a call for heating or cooling, and MIN-AIR-SCH to schedule the OA damper if it completely closes when the fan is off.
Inspection of thermostat. EMS settings, survey of facility staff, and implementer records
The implementer-provided installed thermostat set point schedules, verified against as-found schedules, will be used be input into the ex post models
The pre-treatment schedules will determined from implementer data or facility staff surveys.
NIGHT- CYCLE- CTRL _ - Night cycle control specifies the behavior of the system fans during unoccupied periods.
Inspection of thermostat. EMS settings, or survey of facility staff, and implementer records
For supply fan control measures the NIGHT- CYCLE- CTRL will be set to CYCLE –ON-ANY or STAY-OFF which means that the fans will cycle on or stay off when if any zone served by the system falls out of the range of unoccupied set point temperatures.
The pre-treatment schedules will determined from implementer data or facility staff surveys. If is fans ran previously ran constantly, there will be no NIGHT- CYCLE- CTRL keyword as fan schedule was ALWAYS-ON
DNV GL – www.dnvgl.com 4/1/16 Page D-14
Measure Specific Data Collection and Analysis Details Field data collection will acquire data associated with coil cleaning, RCA, thermostat, economizer and supply fan adjustment measure assumptions. This section documents the protocol to be followed when collecting and analyzing data for each of these measures.
Coil Cleaning (Condenser or Evaporator) – Ride Along Coil cleaning saves energy by reducing static pressure and increasing airflow and heat transfer rate across the condenser or evaporator coil. The heat transfer rate is determined by the mass flow rate of air and the change in air enthalpy across the coil. Dirt and debris build-up on the coil increases total static pressure, and reduces airflow and heat transfer rates. This increases the refrigerant pressure differential across the compressor, increasing compressor work/power. Compressor discharge and suction pressures can be measured on most units. To evaluate condenser coil cleaning the compressor suction and discharge pressure and outdoor dry bulb temperature will be measured before and after cleaning. The discharge pressure change will be correlated to laboratory data on unit performance. For evaporator coils laboratory results showed the better metrics to be static pressure and airflow changes before and after cleaning, so those will used in evaporator coil cleaning assessment.
During the ride-along visit, ambient temperature, static pressure and airflow across the coil. outdoor temperatures, discharge pressures, fan power, and total power will be measured in the “pre-treatment” condition and in the “cleaned” condition. The refrigerant charge level must be brought to factory recommended charge, and the air filters must be clean in order to properly evaluate the coil cleaning measure, as laboratory data was collected with those conditions. A team member will visit the site before the ride along to assure that those two conditions are met. Otherwise, the “pre-treatment” condition is the coil’s condition when the technician walks on site. The “cleaned” condition will be achieved when the implementing technician cleans the coils during the ride-along visit. The cleaning methods will be noted such as pre-rinse and direction of the rinse, water and/or chemical solvents used to clean the coil, dwell time, and post-rinse and direction.
If possible, the date of the most recent previous cleaning will be determined from participation records or site interviews. This will provide a data set of heat transfer and capacity increase due to coil cleaning and length of time since previous cleaning.
For condenser coils the suction and discharge pressure changes will be converted to a change in operational efficiency using correlations being developed in laboratory testing to determine condenser coil cleaning impact, and similarly the change in static pressure will be used to determine evaporator coil impact. Using the lab data correlation is more reliable than direct measurement of field operating efficiency due to significantly less measurement uncertainty in the lab. The systems in the lab were at factory recommended charge so it is necessary to adjust the field units to factory charge before making field measurements as the charge level greatly affects the refrigerant pressures and temperatures.
Coil Cleaning Site Data Collection In addition to the standard unit identification and served zone characterization, the coil cleaning ride-alongs will include the following data collection tasks for pre and post-treatment conditions.
• Compressor(s) discharge and suction pressures • Supply air and return air static operating pressures
DNV GL – www.dnvgl.com 4/1/16 Page D-15
• Outside air temperature • Return air temperature • Supply air temperature • Airflow across the evaporator
Coil Cleaning Analysis In previous laboratory testing, evaporator coil blockage has been shown to primarily influence refrigerant suction pressure of the unit, whereas condenser coil blockage has been shown to mainly produce changes in refrigerant discharge pressure. Evaporator coil blockage also correlates well to static pressure increase across the coil and air handler airflow decrease. Since pilot tests found suction pressure difficult to measure, this analysis will use static pressure and airflow as the metrics that correlate field conditions to efficiency changes using lab data.
In order to estimate condenser coil cleaning annual energy and peak demand impacts, the estimated percentage efficiency improvement will be applied in place of the 13% energy savings percentage and 6.5% peak coincident demand savings percentage assumed by the measure work paper.
An example of the laboratory test data used in the evaluation of condenser coil cleaning is provided in Figure 4. Unit performance metrics have been found to vary in an approximately linear fashion with respect to the pressure difference across the compressor (discharge pressure minus suction pressure). Because of this linear relationship, the impact of condenser coil cleaning is dependent on the initial and final pressure differentials across the unit when measurements are made under similar conditions (ambient temperature and return air dry and wet-bulb). The actual starting and ending points obtained from field data are not particularly relevant, just the change in the pressure difference across the compressor produced by the cleaning effort. The refrigerant operating pressure measurements collected during the ride-along visits will be translated into a gross coil cleaning impact.
DNV GL – www.dnvgl.com 4/1/16 Page D-16

Figure 4: Condenser Blockage Lab Data – 3-ton Non-TXV Unit
45 sets of pre/post cleaning data points were planned to be collected in the ride-along activities in order to provide a statistically relevant data set according to the sample design. However, only 28 data point sets across four sites were ultimately collected, all of which were in the SDG&E territory.
There was concern regarding how representative the sites’ units would be for the program population. Two of the four sites participated in the 2013-14 program and had coils cleaned as recent as December 2013. This time span (at least 1.5 years since a coil cleaning) was considered to be reasonably long enough to treat the ride-along data as representative because the condenser coil cleaning measure lifetime is only one year.
Refrigerant Charge Adjustment – Ex Post The refrigerant charge and airflow measure seeks to improve air conditioning unit performance by adding or removing refrigerant charge from air conditioning refrigeration circuits. An improved refrigerant charge level is assumed to produce energy savings compared to both an under system. The QM programs use system diagnostic tests, and adjust charge amounts to achieve superheat and subcooling targets. For the evaluation sample points, the system refrigerant charge will be assessed using the “weigh-in, weigh-out” method.
The “weigh-in, weigh-out” method is conducted by evacuating the refrigerant from the unit under observation into a recovery vessel and weighing the vessel with the recovered refrigerant. The tare weight of the recovery vessel is subtracted from the weight of the vessel and recovered refrigerant to calculate the mass of the refrigerant. The mass of the refrigerant will then be compared to the manufacturer specified charge for the unit under observation to calculate a percentage difference from specified.
60%
80%
100%
120%
140%
160%
190 210 230 250 270
Compressor Pressure Difference (psi)
Co
nd
en
ser
Blo
cka
ge
Im
pa
ct
Total Cap Sen Cap cbf CU Pwr EIR EER
DNV GL – www.dnvgl.com 4/1/16 Page D-17
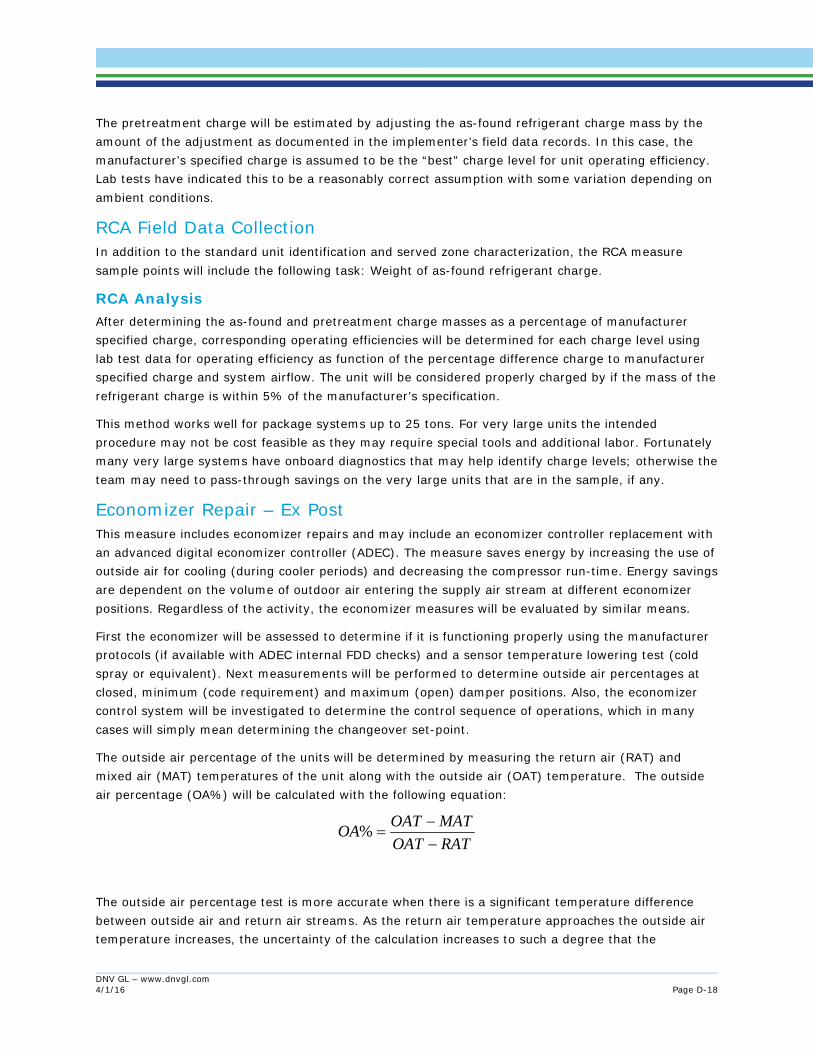
The pretreatment charge will be estimated by adjusting the as-found refrigerant charge mass by the amount of the adjustment as documented in the implementer’s field data records. In this case, the manufacturer’s specified charge is assumed to be the “best” charge level for unit operating efficiency. Lab tests have indicated this to be a reasonably correct assumption with some variation depending on ambient conditions.
RCA Field Data Collection In addition to the standard unit identification and served zone characterization, the RCA measure sample points will include the following task: Weight of as-found refrigerant charge.
RCA Analysis After determining the as-found and pretreatment charge masses as a percentage of manufacturer specified charge, corresponding operating efficiencies will be determined for each charge level using lab test data for operating efficiency as function of the percentage difference charge to manufacturer specified charge and system airflow. The unit will be considered properly charged by if the mass of the refrigerant charge is within 5% of the manufacturer’s specification.
This method works well for package systems up to 25 tons. For very large units the intended procedure may not be cost feasible as they may require special tools and additional labor. Fortunately many very large systems have onboard diagnostics that may help identify charge levels; otherwise the team may need to pass-through savings on the very large units that are in the sample, if any.
Economizer Repair – Ex Post This measure includes economizer repairs and may include an economizer controller replacement with an advanced digital economizer controller (ADEC). The measure saves energy by increasing the use of outside air for cooling (during cooler periods) and decreasing the compressor run-time. Energy savings are dependent on the volume of outdoor air entering the supply air stream at different economizer positions. Regardless of the activity, the economizer measures will be evaluated by similar means.
First the economizer will be assessed to determine if it is functioning properly using the manufacturer protocols (if available with ADEC internal FDD checks) and a sensor temperature lowering test (cold spray or equivalent). Next measurements will be performed to determine outside air percentages at closed, minimum (code requirement) and maximum (open) damper positions. Also, the economizer control system will be investigated to determine the control sequence of operations, which in many cases will simply mean determining the changeover set-point.
The outside air percentage of the units will be determined by measuring the return air (RAT) and mixed air (MAT) temperatures of the unit along with the outside air (OAT) temperature. The outside air percentage (OA%) will be calculated with the following equation:
RATOATMATOATOA
−−
=%
The outside air percentage test is more accurate when there is a significant temperature difference between outside air and return air streams. As the return air temperature approaches the outside air temperature increases, the uncertainty of the calculation increases to such a degree that the
DNV GL – www.dnvgl.com 4/1/16 Page D-18
measurement are not reliable According to an uncertainty analysis that we performed, the temperature difference should be at least 8 F with associated uncertainty less than 15% to conduct the measurements. Our team discussed in depth the difficulty of accurate airflow measurements, not only because of the required temperature difference between indoors and outdoors, but also because of the difficulty measuring average mixed air temperature due to uneven mixing of the return and outside airflows before they enter the coil. As an alternative, we suggested measuring the static pressure and damper position (using a ruler), and correlating this to lab or manufacturers data to determine airflow through the economizer. We are taking the necessary measurements, but not certain that we will be able to find the appropriate manufacturers data. If we are able to find it then the two methods will be compared, and the best one chosen for the impact analysis.
If the temperature difference is less than ideal, then the evaluation team may manipulate the indoor temperature to achieve a 10 degree difference. Consulting the weather forecast for the day of the site visit will help guide the approach. If the outside temperature going to be near the assumed indoor temperature, the data collection team will arrive early and cool down the zone under consideration by locking on the cooling and closing the outdoor air damper completely. Once the target temperature difference has been achieved then the outside air damper would be set to the as-found post-treatment closed position and the measurements would be conducted. Next the damper would be set to the as-found post-treatment open position and another set of measurement would be performed. This method has been proven viable during initial pilot testing.
Economizer Site Data Collection In addition to the standard unit identification and served zone characterization, the economizer measure evaluation sample point will include the following data collection tasks.
• An assessment of economizer functionality. • Change over set point determination. • Outdoor, return and mixed air temperature at all damper positions of interest. • Control Sequence (record first/second stage deadbands, time delay, any intermediate points
or integrated controls and anything else that influences how long the damper is fully open) • An assessment of claimed repairs (mechanical, controls) • Total system airflow measurement (TrueFlow measurement) • Pre-treatment characteristics (Site facility contact survey)
Economizer Analysis The ratio of as-found economizer measures that are installed and functional with the potential to generate savings will be the basis for the installation rate. Airflow (total system flow and outdoor air fraction), changeover set point and economizer control strategy, data collected will be used to determine the actual energy and peak demand impacts of economizers.
The implementation data we have received thus far is insufficient to determine a pre-treatment baseline condition for economizer measures, even after requesting additional information from the implementers. Review of the workpapers found the economizer baseline assumptions in the disposition34 to be 60% occurrence of minimum outdoor air setting and 40% occurrence of failed closed. The minimum flow rate assumption was 37.5% based on T-24 minimum airflow requirement
34 Energy Division Disposition (Disposition) titled “2013_2014-ComHVACQMWorkpaperDisposition_2May2013.docx”
DNV GL – www.dnvgl.com 4/1/16 Page D-19

for “other” buildings of 0.15 cfm/ft2 divided by the prototype design air flow rate of 0.4 cfm/ft2. The disposition assumes 5% leakage for closed dampers. The baseline assumption for the maximum open position is 70%. This investigation will verify the economizer flow rate assumptions at maximum, minimum and closed positions, but will not address the occurrence of failure mode. We recommend a future baseline study to assess failure mode.
Once the pre and post operating characteristics are determined, appropriate DEER DOE-2 building prototype models will be utilized to estimate annual energy savings and peak demand reduction. The adjusted model inputs will include the minimum outside air percentage (MIN-OA-AIR), the maximum outside air fraction (MAX-OA-FRACTION), maximum temperature for economizer operation (DRYBULB-LIMIT) or changeover set point and, where in cases where it can be determined, the minimum temperature for enabled economizer (ECONO-LOW-LIMIT). We will also consider if the controls are set up to implement effective economizer/compressor integration, and set ECONOMIZER-LOCKOUT accordingly.
Programmable Thermostat Adjustment – Ex Post PG&E, SCE, and SDG&E programs installed the programmable thermostat and thermostat reprogramming measures. These measures save energy by adjusting the occupied and unoccupied thermostat set point schedules to reduce the required cooling and heating load. The post-treatment thermostat settings and energy management control system (EMCS) settings will be recorded during all ex post site visits where the thermostat measure was implemented. Contractor adjustments to thermostat set points and any overarching energy management control programming will also be collected on ride-along visits to supplement the post maintenance sample. Site contact survey will attempt to determine the pre-maintenance schedules and settings during post-maintenance site visits. All collected information will be compared to program records. Based on the adjustment date and the observed thermostat settings relative to program objectives, an estimate will be developed regarding the installation rate and persistence of these measures.
The impact of the thermostat replacement and thermostat reprogramming measures will be determined for each IOU program implementing a thermostat measure using pre/post data regarding occupied and unoccupied thermostat schedules and settings to develop realization rates.
Thermostat Site Data Collection The thermostat measure site data collection will include the following tasks.
• The post-treatment thermostat schedule as found • Facility site contact survey to determine pre-treatment thermostat schedule
Thermostat Analysis Energy savings impacts of thermostat replacement will be calculated using pre-existing and post-program thermostat schedules. Both the pre-existing and post-retrofit heating and cooling thermostat schedule is available for all programs in the implementer data that has been supplied. Schedule data used in simulation modeling (methodology guided by workpapers) will inform the realization rate to determine energy impacts. The workpaper baseline assumption for thermostat replacement is a non-programmable thermostat. The installed measure assumes a thermostat with heating set-back and cooling set-up during building non-occupied times. The impact analysis will include a comparison of the implementer-supplied building operation schedules and set point temperatures to the prototype
DNV GL – www.dnvgl.com 4/1/16 Page D-20

building schedules and set point temperatures. Modifications will be made, and calculations re-run if workpaper assumptions are found to be inaccurate.
Unoccupied Supply Fan Control Adjustment – Ex Post The unoccupied supply fan control measure is implemented by adjusting the unit controls, typically a thermostat though could also be an energy management system (EMS) from “always on” to “cycle on with load” or “off” during unoccupied hours. This saves energy by not running the fan and/or bringing in outdoor ventilation air to the building when then are no occupants.
Post-maintenance site visits will determine the actual thermostat or EMS (and unoccupied supply fan) operating sequence through interviews with facility personal and tests on the equipment. The pre-maintenance condition will be determined through either program records or interviews with facility managers.
The ratio of as-found unoccupied supply fan controllers that have evidence of having been reprogrammed or replaced according to program specifications divided by the total number inspected will be the basis for calculating the installation rate.
Supply Fan Control Data Collection The supply fan control site data collection will include the following tasks.
• The post-treatment thermostat or EMS schedule as found • Facility site contact survey to determine pre-treatment thermostat schedule • Investigation of building EMS for historical pre-treatment schedule records
Supply Fan Control Analysis Energy savings impacts of unoccupied supply fan control (thermostat or EMS reprogramming) will be calculated using pre-existing and post-program supply fan schedules. Both of these schedules are available for all programs in the implementer data that has been supplied. Schedule data used in simulation modeling (methodology guided by workpapers) will inform the realization rate to determine energy impacts. The workpaper baseline assumption for supply fan control is that the supply fan runs continuously at Title-24 minimum outdoor air flow and the installed measure assumption is that the fan operation matches occupied building schedule. The impact analysis will include a comparison of the implementer-supplied schedules to the workpaper-assumed schedules. Modifications will be made, and calculations re-run if workpaper assumptions are found to be inaccurate.
Quality Control (QC) and Review DNV GL considers project management to be the process of meeting established goals regarding technical scope, schedule, and budget by managing risks, uncertainties, expectations, constraints, and resources in the planning and execution of sponsored contract work. QC for projects in each of these areas is an essential goal in all of our project management policies and practices. To ensure that each task and project is completed within budget, on time, and meeting the required scope, DNV GL uses project management techniques, tools and controls based on the Project Management Body of Knowledge, as published by the Project Management Institute (PMI).
This section documents the project’s anticipated quality control steps.
DNV GL – www.dnvgl.com 4/1/16 Page D-21
Pilot Task The entire pilot task is a quality control element. In the pilot phase, the EM&V section of the plan will be scrutinized to confirm that all the necessary field and survey data can be collected for the analysis. The M&V Plan will be revised as a separate deliverable to the CPUC before the main field data collection task begins. The revised Plan will detail the analysis methodology, including how each measurement collected in the field will inform the impact analysis. The Plan will also include an uncertainty discussion.
Experienced field staff will perform these tests, paying particular attention to developing and testing on-site field protocols for clarity and completeness of instructions. Field staff will also focus closely on the data-collection instrument, again checking for clarity and completeness of the form. Their observations will be reviewed, and necessary protocol and data collection form adjustments will be made. All adjustments will be communicated to all evaluation field staff. The data collected during the pilot task will be reviewed and analyzed prior to full project implementation. Review and analysis of pilot data prevents systematic errors from occurring during full implementation.
Data Collection
Recruiting During recruiting, the evaluation team will confirm that names, addresses, phone numbers, program participation status, equipment size and replacement date (if any) match tracking data for participants. Recruiters will confirm driving instructions, check for access codes for security gates (including roof hatch and ladder locks), and gather any other information that will help prevent late arrivals and ensure more on-site quality time. Essentially, recruiters will confirm that this site has received maintenance and that reaching the site will proceed as expected.
On-Site During site visits, field staff will perform power measurements, temperature monitoring, refrigerant and airflow tests using methods determined during the pilot.
While conducting spot power and refrigerant charge tests, one team member will perform the tests while the other team member observes technique, records results, and reads results back for confirmation. Both staff members will be fully trained in, and in compliance with, all applicable DNV GL safety policies.
Field staff will take photographs of the building exterior, the True Flow grid installation, HVAC compressor unit nameplates, air handling unit (AHU) nameplates, supply fan nameplates, and all unusual situations. These photos will help resolve any post-visit issues.
Field staff will be encouraged and expected to consult with senior technical advisors immediately whenever unexpected, unusual, or potentially dangerous situations arise.
Post Visit After the site visit, one member of each team will transcribe the results and observations into digital form. The other team member will then review the transcription for accuracy and completeness.
DNV GL – www.dnvgl.com 4/1/16 Page D-22

Analysis After the results have been transcribed and reviewed by the field team, the analysis team will perform the following quality control activities:
• Review HVAC airflow data to ensure that they are within range of nominal airflow values. • Review supply fan and condensing-unit spot power measurements. • For airflow, and power consumption, investigate any outliers. Outliers will be investigated
through photographs, field notes, and field staff interviews. • Verify that refrigerant pressure and temperature measurements were properly labelled and
recorded and are consistent with the corresponding air-side temperature and relative humidity values.
DNV GL – www.dnvgl.com 4/1/16 Page D-23

M&V DATA SUMMARY – NON-RESIDENTIAL Appendix E.QM
Data summaries will be supplied as a separate zip file: HVAC3_FieldData.zip
DNV GL – www.dnvgl.com 4/1/16 Page E-1

IMPLEMENTER DATA Appendix F.
Table 1. Catalog of Implementer Data
Level Data Request Field SCE QM PG&E QM ACP SDG&E Key RowID AUTO NA YES YES Key StickerID YES YES YES YES Key SAID YES YES YES YES Key PremiseID NO NO NO YES Site CustomerName YES YES YES YES Site CustomerAddress YES YES YES YES Site CustomerCity YES YES YES YES Site CustomerZIP YES YES YES YES Site CustomerContact YES YES YES YES Site CustomerPhone YES YES YES YES Site CustomerEmail YES YES YES YES Site NAICS NO NO NO YES Site ContractorName YES YES YES YES Site ContractorAddress YES NO NO YES Site ContractorCity YES NO NO YES Site ContractorZip YES NO NO YES Site ContractorPhone YES NO NO YES Site DEERBldgType YES Tracking Tracking YES Site ClimateZone YES Tracking Tracking YES Site Vintage YES Tracking Tracking YES Site ServiceAgreementID YES Tracking Tracking YES Site IncentiveAmount YES Tracking YES YES Site TotalCost NO NO NO NO Site InvoiceNumber YES NO NO NO Site SiteNotes NO NO NO NO Unit TechnicianName YES NO YES YES Unit Make YES YES YES YES Unit Model YES YES YES YES Unit Serial YES YES YES YES Unit CoolingCapacity (Tons) YES YES YES YES Unit TotalCircuits YES YES YES YES Unit CircuitNumber YES YES YES YES Unit CircuitCapacity YES YES YES YES Unit UnitID YES YES YES YES Unit UnitType YES YES YES YES Unit HeatingType YES YES YES YES
Unit AreaServed YES - Location
YES - Location NO YES
Unit UnitAge YES YES NO NO Unit Orifice YES YES YES YES Unit Refrigerant YES YES YES YES Unit UES_kW YES YES YES YES Unit UES_kWh YES YES YES YES Unit UES_therm YES YES YES YES Unit DateService NO YES YES YES Unit DateUpload YES YES NO YES Test RefrigerantChargeTest YES YES YES YES Test AirflowTest NO NO NO YES
DNV GL – www.dnvgl.com 4/1/16 Page F-1

Level Data Request Field SCE QM PG&E QM ACP SDG&E MeasureID RefrigerantChargeAdjust YES YES YES YES MeasureID AirflowRepair YES YES NO YES MeasureID CondenserCoilClean YES YES YES YES MeasureID CondenserCoilComb NO NO NO YES MeasureID EvaporatorCoilClean YES YES YES YES MeasureID EconomizerRepair YES YES YES YES MeasureID EconomizerControlRepair YES YES YES YES MeasureID EconomizerControlReplace YES YES YES YES MeasureID FanVBelt YES YES YES YES MeasureID ThermostatAdjust YES YES YES YES MeasureID ThermostatReplace YES YES YES YES MeasureID SupplyFanControl NO NO YES NO MeasureID AirFilterReplace NO NO YES NO
Airflow Air flow diagnostic protocol NO NO NO
YES - Bad/No Data
Airflow Air flow measurement technique NO NO NO
YES - Bad/No Data
Airflow Air Flow test-in uncorrected cfm NO NO NO
YES - Bad/No Data
Airflow Air Flow test-in FDD results NO NO NO NO
Airflow Air Flow test-out corrected cfm NO YES NO
YES - Bad/No Data
Airflow Air Flow test-out FDD results NO NO NO NO EvapCoil Evaporator coil cleaning date NO NO YES YES EvapCoil Evaporator coil cleaning time NO NO NO NO EvapCoil Evaporator coil cleaning method NO NO NO NO EvapCoil Evaporator coil cleaner used NO NO NO NO EvapCoil Evaporator coil cleaning notes NO NO NO NO CondCoil Condenser coil cleaning date NO NO YES YES CondCoil Condenser coil cleaning time NO NO NO NO CondCoil Condenser coil cleaning method NO NO NO NO CondCoil Condenser coil cleaner used NO NO NO NO CondCoil Condenser coil cleaning notes NO NO NO NO
RefCharge Diagnostic protocol used NO NO
All Same - Field Diagnostics VSP
RefCharge Refrigerant charge test-in date NO YES YES YES RefCharge Refrigerant charge test-in time NO YES NO YES RefCharge Coils cleaned before, during, or after test-in? NO NO NO YES
RefCharge Refrigerant charge test-in suction temperature for each circuit YES YES YES YES
RefCharge Refrigerant charge test-in suction pressure for each circuit YES YES YES YES
RefCharge Refrigerant charge test-in discharge pressure for each circuit YES YES NO YES
RefCharge Refrigerant charge test-in liquid line pressure for each circuit YES YES YES YES
RefCharge Refrigerant charge test-in discharge temperature for each circuit NO NO LL Temp NO
RefCharge Refrigerant charge test-in outdoor DB temperature YES YES YES YES
DNV GL – www.dnvgl.com 4/1/16 Page F-2

Level Data Request Field SCE QM PG&E QM ACP SDG&E RefCharge Refrigerant charge test-in return DB temperature NO NO YES YES RefCharge Refrigerant charge test-in return wetbulb temp NO NO YES YES RefCharge Refrigerant charge test-in supply DB temperature YES YES YES YES RefCharge Refrigerant charge test-in supply WB temperature NO NO NO YES
RefCharge Refrigerant charge test-in evap coil entering DB temp YES YES NO NO
RefCharge Refrigerant charge test-in evap coil entering WB temp YES YES NO NO
RefCharge Refrigerant charge test-in superheat target NO NO NO YES RefCharge Refrigerant charge test-in actual superheat YES YES YES YES RefCharge Refrigerant charge test-in subcool target NO NO NO YES RefCharge Refrigerant charge test-in actual subcool YES YES YES YES RefCharge Refrigerant charge test-in temperature split target NO NO NO YES RefCharge Refrigerant charge test-in actual temperature split YES YES NO YES RefCharge Refrigerant charge test-in results NO NO NO NO RefCharge Refrigerant charge test-in notes NO NO NO NO RefCharge Factory refrigerant charge per circuit YES YES YES YES RefCharge Refrigerant added or removed per circuit YES YES YES YES RefCharge Refrigerant charge test-out date NO NO YES YES RefCharge Refrigerant charge test-out time NO NO YES NO
RefCharge Refrigerant charge test-out suction temperature for each circuit YES YES YES YES
RefCharge Refrigerant charge test-out suction pressure for each circuit YES YES YES YES
RefCharge Refrigerant charge test-out discharge pressure for each circuit YES YES NO YES
RefCharge Refrigerant charge test-out liquid line pressure for each circuit YES YES YES YES
RefCharge Refrigerant charge test-out liquid line temperature for each circuit YES YES LL Temp NO
RefCharge Refrigerant charge test-out outdoor DB temperature YES YES YES YES RefCharge Refrigerant charge test-out return DB temperature NO NO YES YES RefCharge Refrigerant charge test-out return wetbulb temp NO NO YES YES RefCharge Refrigerant charge test-out supply DB temperature YES YES YES YES RefCharge Refrigerant charge test-out supply WB temperature NO NO NO YES
RefCharge Refrigerant charge test-out evap coil entering DB temp YES YES NO NO
RefCharge Refrigerant charge test-out evap coil entering WB temp YES YES NO NO
RefCharge Refrigerant charge test-out superheat target NO NO NO YES RefCharge Refrigerant charge test-out actual superheat YES YES YES YES RefCharge Refrigerant charge test-out subcool target NO NO NO YES RefCharge Refrigerant charge test-out actual subcool YES YES YES YES RefCharge Refrigerant charge test-out temperature split target NO NO NO YES RefCharge Refrigerant charge test-out actual temperature split YES YES NO YES RefCharge Refrigerant charge test-out results NO NO NO NO RefCharge Refrigerant charge test-out notes NO NO NO NO Economizer Economizer repair date NO YES YES YES Economizer Economizer repair time NO YES NO NO Economizer Pre-existing economizer make NO YES YES NO Economizer Pre-existing economizer model NO YES YES NO Economizer Pre-existing economizer equipped with DCV control? NO Lookup Lookup NO
Economizer Economizer test-in OA damper position YES NO NO YES - Bad/No
DNV GL – www.dnvgl.com 4/1/16 Page F-3
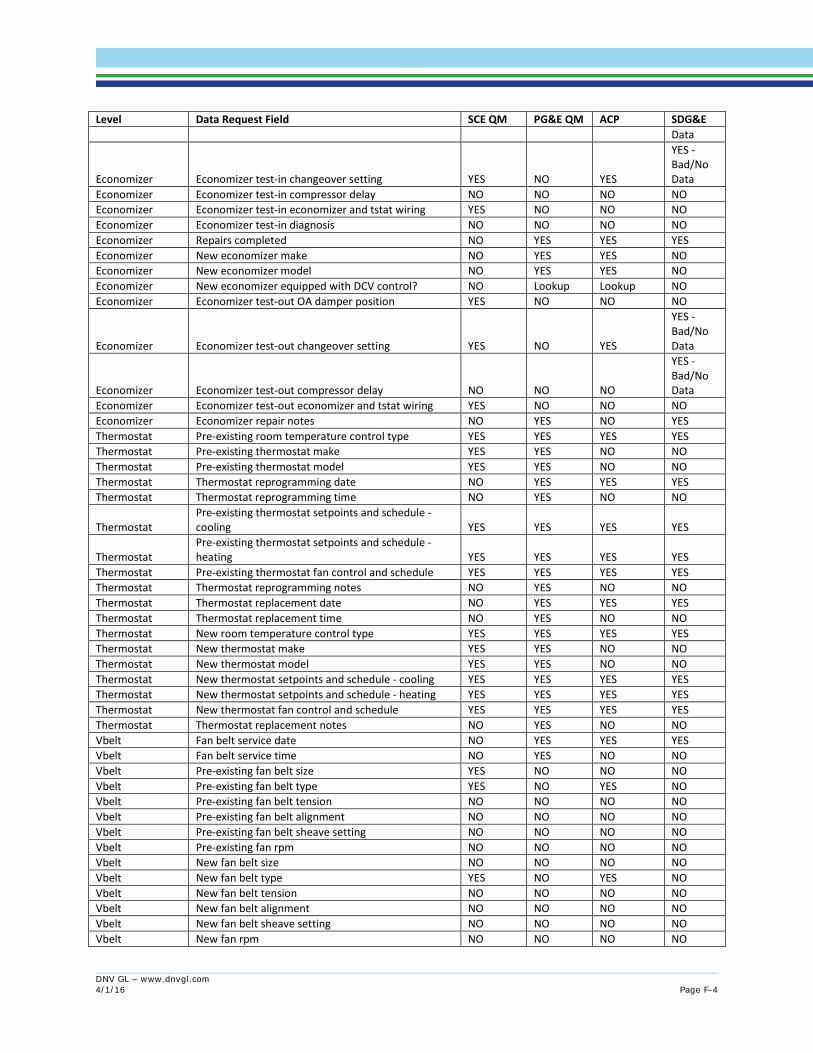
Level Data Request Field SCE QM PG&E QM ACP SDG&E
Data
Economizer Economizer test-in changeover setting YES NO YES
YES - Bad/No Data
Economizer Economizer test-in compressor delay NO NO NO NO Economizer Economizer test-in economizer and tstat wiring YES NO NO NO Economizer Economizer test-in diagnosis NO NO NO NO Economizer Repairs completed NO YES YES YES Economizer New economizer make NO YES YES NO Economizer New economizer model NO YES YES NO Economizer New economizer equipped with DCV control? NO Lookup Lookup NO Economizer Economizer test-out OA damper position YES NO NO NO
Economizer Economizer test-out changeover setting YES NO YES
YES - Bad/No Data
Economizer Economizer test-out compressor delay NO NO NO
YES - Bad/No Data
Economizer Economizer test-out economizer and tstat wiring YES NO NO NO Economizer Economizer repair notes NO YES NO YES Thermostat Pre-existing room temperature control type YES YES YES YES Thermostat Pre-existing thermostat make YES YES NO NO Thermostat Pre-existing thermostat model YES YES NO NO Thermostat Thermostat reprogramming date NO YES YES YES Thermostat Thermostat reprogramming time NO YES NO NO
Thermostat Pre-existing thermostat setpoints and schedule - cooling YES YES YES YES
Thermostat Pre-existing thermostat setpoints and schedule - heating YES YES YES YES
Thermostat Pre-existing thermostat fan control and schedule YES YES YES YES Thermostat Thermostat reprogramming notes NO YES NO NO Thermostat Thermostat replacement date NO YES YES YES Thermostat Thermostat replacement time NO YES NO NO Thermostat New room temperature control type YES YES YES YES Thermostat New thermostat make YES YES NO NO Thermostat New thermostat model YES YES NO NO Thermostat New thermostat setpoints and schedule - cooling YES YES YES YES Thermostat New thermostat setpoints and schedule - heating YES YES YES YES Thermostat New thermostat fan control and schedule YES YES YES YES Thermostat Thermostat replacement notes NO YES NO NO Vbelt Fan belt service date NO YES YES YES Vbelt Fan belt service time NO YES NO NO Vbelt Pre-existing fan belt size YES NO NO NO Vbelt Pre-existing fan belt type YES NO YES NO Vbelt Pre-existing fan belt tension NO NO NO NO Vbelt Pre-existing fan belt alignment NO NO NO NO Vbelt Pre-existing fan belt sheave setting NO NO NO NO Vbelt Pre-existing fan rpm NO NO NO NO Vbelt New fan belt size NO NO NO NO Vbelt New fan belt type YES NO YES NO Vbelt New fan belt tension NO NO NO NO Vbelt New fan belt alignment NO NO NO NO Vbelt New fan belt sheave setting NO NO NO NO Vbelt New fan rpm NO NO NO NO
DNV GL – www.dnvgl.com 4/1/16 Page F-4
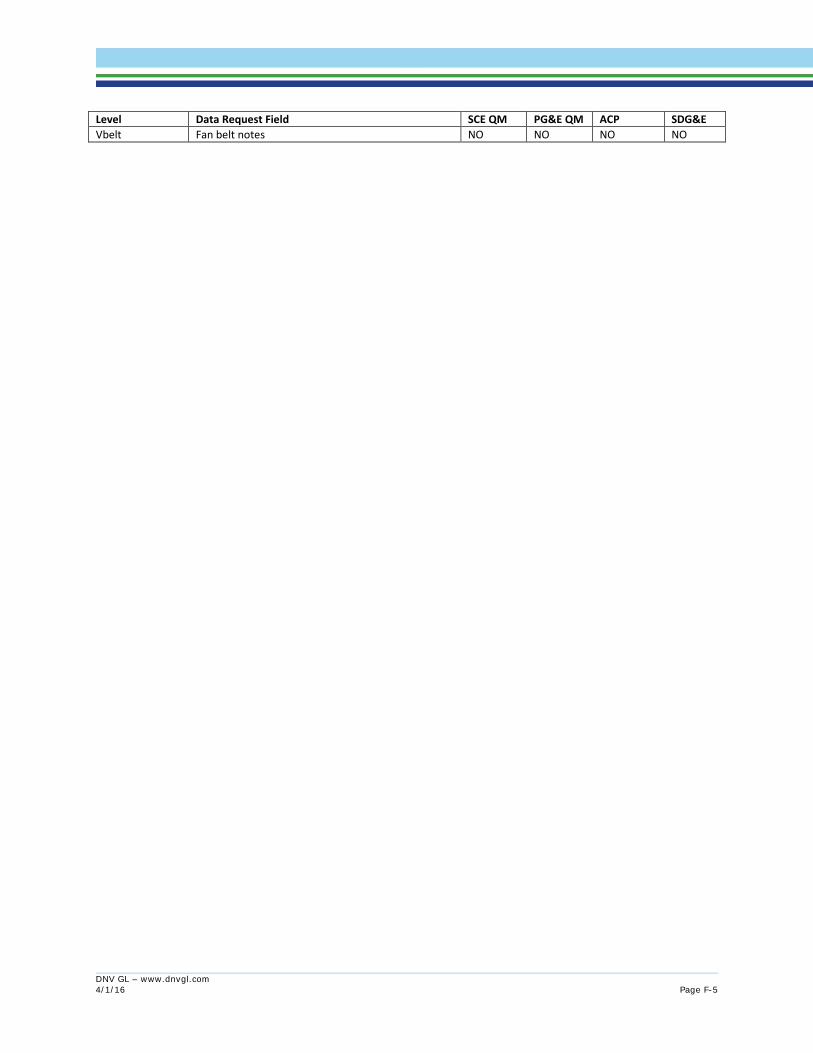
Level Data Request Field SCE QM PG&E QM ACP SDG&E Vbelt Fan belt notes NO NO NO NO
DNV GL – www.dnvgl.com 4/1/16 Page F-5

Table 2. Workpaper Summary
Measure Category Service Incentive Related
Workpapers Workpaper Savings [kwh] Workpaper
Savings [kW]
Savings Per Comments
RCA and Coil Cleaning
• Evaporator Coil Cleaning
WPSDGENRHC1010 77 kWh
Ton
.022 kW
• Condenser Coil Cleaning
WPSDGENRHC1020 kWh: 13% below baseline
Ton
Savings of 13% are applied across the board
kW: 6.5% below baseline
Savings of 6.5% are applied across the board
• Refrigerant System Service
WPSDGENRHC1040 kWh: 3% below baseline
Ton
kWh savings of 3% are applied across the board
kW: 1.5% below baseline
kW savings of 1.5% are applied across the board
• Condenser Coil Cleaning
SCE13HC037
105.75 - 606.00 kWh
Ton
Workpaper doesn't break out coil cleaning savings separately; these are total savings per ton on non-economizer-equipped units. Savings vary by CZ, vintage, and unit type
0.03675 - 0.05400 kW
• Evaporator Coil Cleaning
PGE3PHVC158 6.8 - 127.6 kWh
Ton Savings vary by CZ, vintage, and unit type
0.0216 - 0.0450 kW
• Condenser Coil Cleaning
PGE3PHVC156 0 - 300.0 kWh
Ton Savings vary by CZ, vintage, and unit type 0.0000 -
DNV GL – www.dnvgl.com 4/1/16 Page F-6

Measure Category Service Incentive Related
Workpapers Workpaper Savings [kwh] Workpaper
Savings [kW]
Savings Per Comments
0.1929 kW
• Refrigerant Charge and Airflow Service
PGE3PHVC160 0.00 - 223.0 kWh
Ton Savings vary by CZ, vintage, and unit type
0.00 - 0.2530 kW
Economizer Repair and
Control Revision
• Economizer Functional Test SCE13HC037
108.73 - 688.69 kWh
Ton
Workpaper doesn't break out economizer savings separately; these are total savings per ton on economizer-equipped units. Savings vary by CZ, vintage, and unit type
0.04650 - 0.07950 kW
• Economizer Functional Test
PGE3HVC151
0.0 - 2290.0 kWh
Ton
These are total savings per ton for economizer-equipped units. Savings vary by CZ, vintage, and unit type
-0.0007 - 0.4360 kW
• Integrate Economizer Wiring
SCE13HC037
108.73 - 688.69 kWh
Ton
Workpaper doesn't break out economizer savings separately; these are total savings per ton on economizer-equipped units. Savings vary by CZ, vintage, and unit type
0.04650 - 0.07950 kW
• Integrate Economizer Wiring
PGE3HVC151
0.0 - 2290.0 kWh
Ton
These are total savings per ton for economizer-equipped units. Savings vary by CZ, vintage, and unit type
-0.0007 - 0.4360 kW
DNV GL – www.dnvgl.com 4/1/16 Page F-7

Measure Category Service Incentive Related
Workpapers Workpaper Savings [kwh] Workpaper
Savings [kW]
Savings Per Comments
• Replace Damper Motor
SCE13HC037
108.73 - 688.69 kWh
Ton
Workpaper doesn't break out economizer savings separately; these are total savings per ton on economizer-equipped units. Savings vary by CZ, vintage, and unit type
0.04650 - 0.07950 kW
• Replace Damper Motor PGE3HVC151
0.0 - 2290.0 kWh
Ton
These are total savings per ton for economizer-equipped units. Savings vary by CZ, vintage, and unit type
-0.0007 - 0.4360 kW
• Replace Controller/Sensor SCE13HC037
108.73 - 688.69 kWh
Ton
Workpaper doesn't break out economizer savings separately; these are total savings per ton on economizer-equipped units. Savings vary by CZ, vintage, and unit type
0.04650 - 0.07950 kW
• Replace Controller/Sensor
PGE3HVC152
11.66 - 506.83 kWh
Ton Savings vary by CZ, vintage, and unit type
-0.0099 - 0.06867 kW
• Renovate Linkage & other components
PGE3HVC151 0.0 - 2290.0 kWh
Ton These are total savings per ton for economizer-equipped units. Savings vary by CZ, vintage, and unit type
-0.0007 - 0.4360 kW
• Economizer Control Package
PGE3HVC151 0.0 - 2290.0 kWh
Ton -0.0007 -
DNV GL – www.dnvgl.com 4/1/16 Page F-8
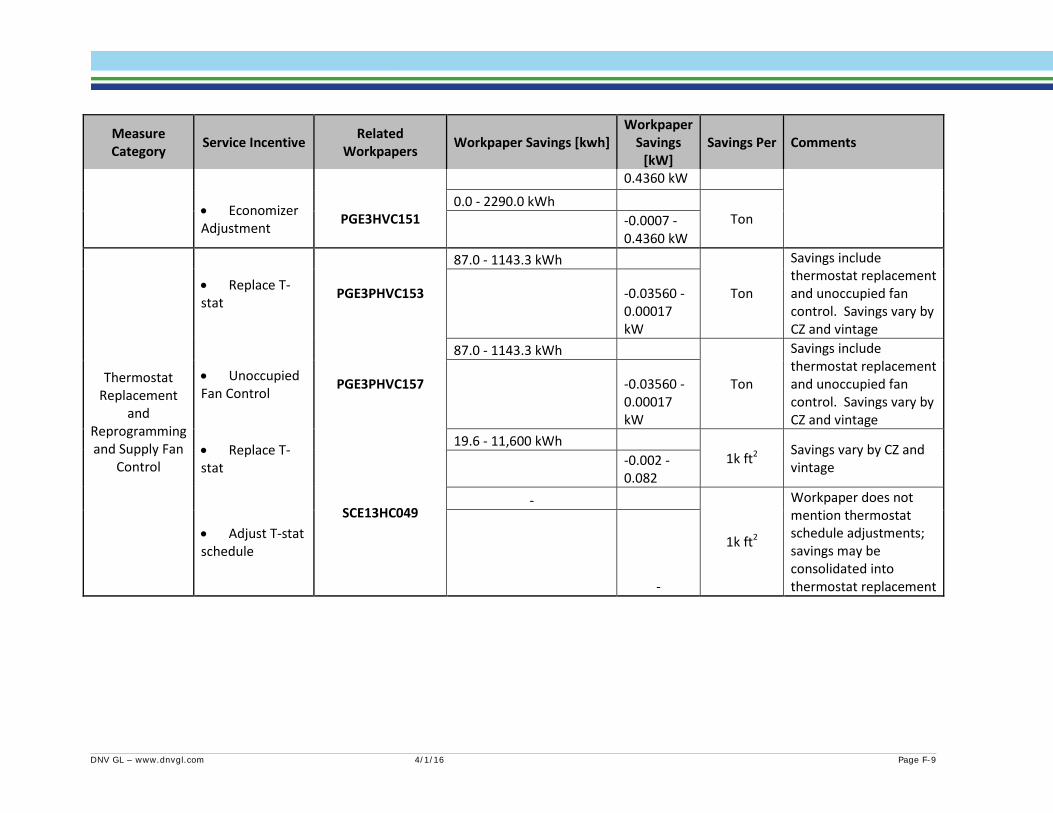
Measure Category Service Incentive Related
Workpapers Workpaper Savings [kwh] Workpaper
Savings [kW]
Savings Per Comments
0.4360 kW
• Economizer Adjustment PGE3HVC151
0.0 - 2290.0 kWh Ton
-0.0007 - 0.4360 kW
Thermostat Replacement
and Reprogramming and Supply Fan
Control
• Replace T-stat
PGE3PHVC153
87.0 - 1143.3 kWh
Ton
Savings include thermostat replacement and unoccupied fan control. Savings vary by CZ and vintage
-0.03560 - 0.00017 kW
• Unoccupied Fan Control
PGE3PHVC157
87.0 - 1143.3 kWh
Ton
Savings include thermostat replacement and unoccupied fan control. Savings vary by CZ and vintage
-0.03560 - 0.00017 kW
• Replace T-stat
SCE13HC049
19.6 - 11,600 kWh 1k ft2 Savings vary by CZ and
vintage
-0.002 - 0.082
• Adjust T-stat schedule
-
1k ft2
Workpaper does not mention thermostat schedule adjustments; savings may be consolidated into thermostat replacement -
DNV GL – www.dnvgl.com 4/1/16 Page F-9
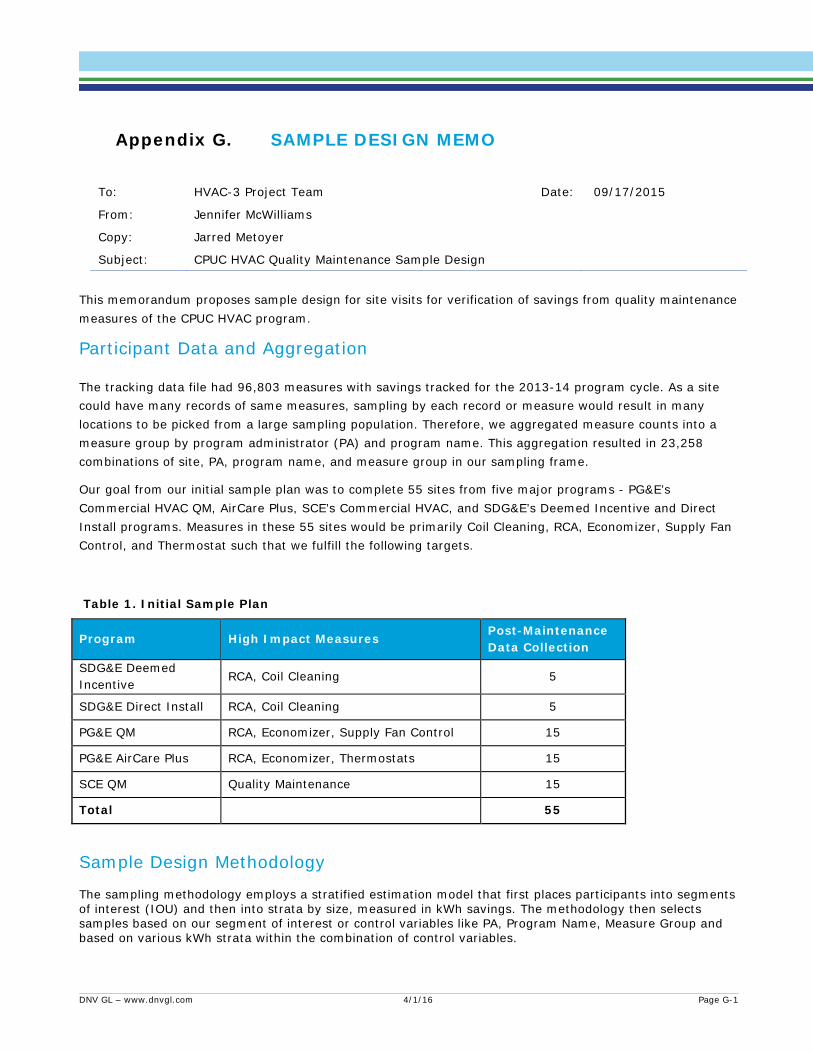
SAMPLE DESIGN MEMO Appendix G.
To: HVAC-3 Project Team Date: 09/17/2015
From: Jennifer McWilliams
Copy: Jarred Metoyer
Subject: CPUC HVAC Quality Maintenance Sample Design
This memorandum proposes sample design for site visits for verification of savings from quality maintenance measures of the CPUC HVAC program.
Participant Data and Aggregation
The tracking data file had 96,803 measures with savings tracked for the 2013-14 program cycle. As a site could have many records of same measures, sampling by each record or measure would result in many locations to be picked from a large sampling population. Therefore, we aggregated measure counts into a measure group by program administrator (PA) and program name. This aggregation resulted in 23,258 combinations of site, PA, program name, and measure group in our sampling frame.
Our goal from our initial sample plan was to complete 55 sites from five major programs - PG&E’s Commercial HVAC QM, AirCare Plus, SCE’s Commercial HVAC, and SDG&E’s Deemed Incentive and Direct Install programs. Measures in these 55 sites would be primarily Coil Cleaning, RCA, Economizer, Supply Fan Control, and Thermostat such that we fulfill the following targets.
Table 1. Initial Sample Plan
Program High Impact Measures Post-Maintenance Data Collection
SDG&E Deemed Incentive
RCA, Coil Cleaning 5
SDG&E Direct Install RCA, Coil Cleaning 5
PG&E QM RCA, Economizer, Supply Fan Control 15
PG&E AirCare Plus RCA, Economizer, Thermostats 15
SCE QM Quality Maintenance 15
Total 55
Sample Design Methodology The sampling methodology employs a stratified estimation model that first places participants into segments of interest (IOU) and then into strata by size, measured in kWh savings. The methodology then selects samples based on our segment of interest or control variables like PA, Program Name, Measure Group and based on various kWh strata within the combination of control variables.
DNV GL – www.dnvgl.com 4/1/16 Page G-1
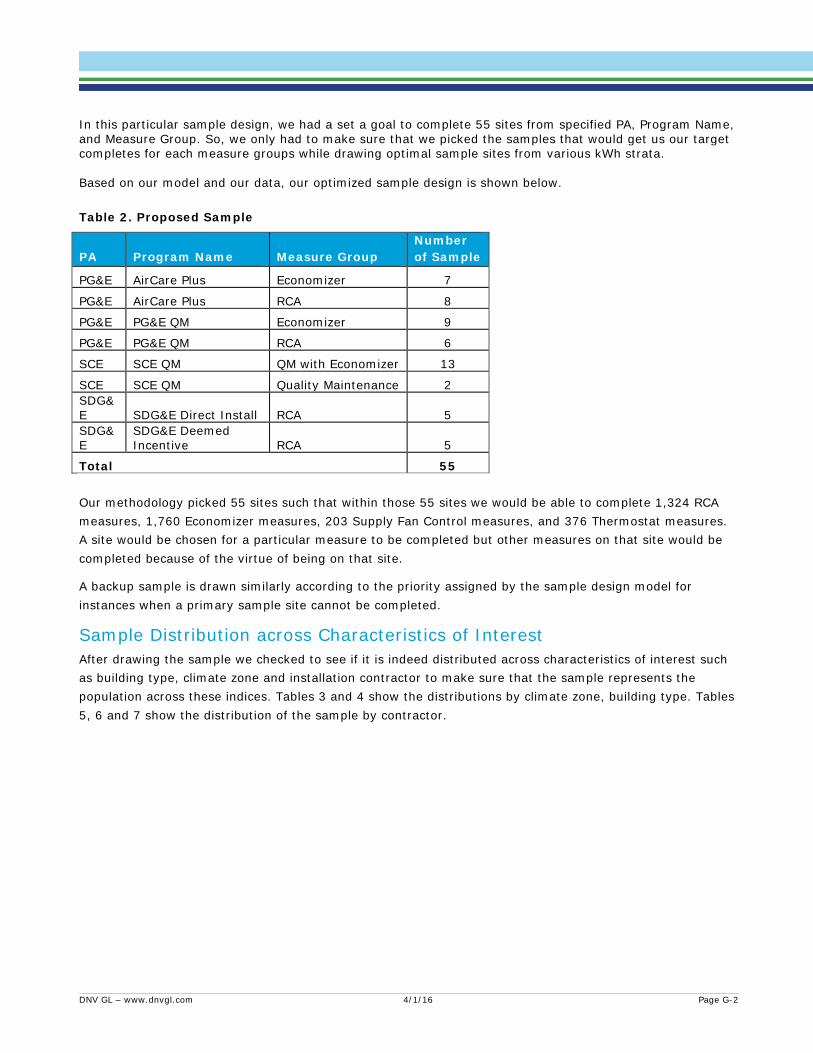
In this particular sample design, we had a set a goal to complete 55 sites from specified PA, Program Name, and Measure Group. So, we only had to make sure that we picked the samples that would get us our target completes for each measure groups while drawing optimal sample sites from various kWh strata. Based on our model and our data, our optimized sample design is shown below.
Table 2. Proposed Sample
PA Program Name Measure Group Number of Sample
PG&E AirCare Plus Economizer 7
PG&E AirCare Plus RCA 8
PG&E PG&E QM Economizer 9
PG&E PG&E QM RCA 6
SCE SCE QM QM with Economizer 13
SCE SCE QM Quality Maintenance 2 SDG&E SDG&E Direct Install RCA 5 SDG&E
SDG&E Deemed Incentive RCA 5
Total 55
Our methodology picked 55 sites such that within those 55 sites we would be able to complete 1,324 RCA measures, 1,760 Economizer measures, 203 Supply Fan Control measures, and 376 Thermostat measures. A site would be chosen for a particular measure to be completed but other measures on that site would be completed because of the virtue of being on that site.
A backup sample is drawn similarly according to the priority assigned by the sample design model for instances when a primary sample site cannot be completed.
Sample Distribution across Characteristics of Interest After drawing the sample we checked to see if it is indeed distributed across characteristics of interest such as building type, climate zone and installation contractor to make sure that the sample represents the population across these indices. Tables 3 and 4 show the distributions by climate zone, building type. Tables 5, 6 and 7 show the distribution of the sample by contractor.
DNV GL – www.dnvgl.com 4/1/16 Page G-2

Table 3. Sample Distribution by Climate Zone
Sample Measures
POP Measures kWh % kWh
Climate Zone2 79% / 62% 1 133 481,761 1%3 44% / 34% 3 338 2,898,139 5%4 35% / 28% 6 487 3,302,694 5%5 0% / 0% 0 2 166 0%6 28% / 22% 2 494 3,277,386 5%7 18% / 14% 4 4881 12,469,197 19%8 38% / 30% 6 278 3,000,200 5%9 87% / 68% 1 57 424,946 1%10 18% / 14% 10 3716 14,302,109 22%11 22% / 17% 2 639 3,255,302 5%12 18% / 14% 9 3935 8,390,709 13%13 12% / 9% 8 8117 11,785,249 18%14 101% / 79% 1 45 383,441 1%15 265% / 207% 0 23 87,764 0%16 57% / 44% 0 12 98,361 0%9999 (Unkown) 100% / 78% 0 101 207,812 0%
Relative Precision (kWh) (90 %
Confidence / 80 % Confidence)
DNV GL – www.dnvgl.com 4/1/16 Page G-3

Table 4. Sample Distribution by Building Type
The tables below show the sample distribution by contractor. Contractors with zero claimed savings or fewer than 10 sites have been removed. An important factor to remember when looking at these tables is that the sample was pulled for sites where a primary measure was installed: RCA or Economizer Repair/Replace. There were multiple contractors who did not install any primary measures so they were excluded from the sample selection.
Sample Measures
POP Measures kWh % kWh
Building Type 60% / 47% 1 50 456,156 1%Amusement and Recreation 30% / 23% 3 574 5,462,814 8%DMO 0% / 0% 0 2351 2,943,565 5%ERC 114% / 89% 0 49 697,730 1%Education - Community College 77% / 60% 0 19 438,566 1%Education - Primary School 16% / 12% 16 1106 15,706,572 24%Education - Secondary School 35% / 27% 2 200 3,148,855 5%Education - University 340% / 265% 0 2 42,951 0%Grocery 65% / 51% 1 138 401,729 1%Health/Medical - Hospital 246% / 192% 0 25 111,993 0%Health/Medical - Nursing Home 85% / 67% 1 172 827,636 1%Lodging - Hotel 0% / 0% 0 4 898,968 1%MTL 571% / 445% 0 3 1,835 0%Manufacturing - Bio/Tech 96% / 75% 0 41 419,063 1%Manufacturing - Light Industrial 23% / 18% 2 228 4,200,371 7%Miscellaneous 90% / 70% 3 84 696,019 1%Multiple 163% / 127% 0 8 1,924 0%Multiple - Any 28% / 22% 5 1975 7,759,980 12%Multiple - Commercial 35% / 28% 0 132 488,246 1%Office - Large 38% / 30% 6 404 3,876,859 6%Office - Small 19% / 15% 7 2108 6,044,933 9%RES 0% / 0% 0 1189 429,165 1%Restaurant - Fast Food 81% / 63% 1 255 431,121 1%Restaurant - Sit Down 37% / 29% 1 665 1,206,971 2%Retail - 3 story 99% / 77% 1 45 349,950 1%Retail - Large 1 story 40% / 31% 1 193 1,111,277 2%Retail - Small 22% / 17% 3 2571 3,493,233 5%Single Family Residential 0% / 0% 0 8642 2,654,305 4%Storage - Conditioned 102% / 79% 0 21 54,444 0%Storage - Refrigerated Warehouse 780% / 608% 0 4 8,008 0%Total 7% / 6% 55 23258 64,365,236 100%
Relative Precision (kWh) (90 %
Confidence / 80 % Confidence)
DNV GL – www.dnvgl.com 4/1/16 Page G-4
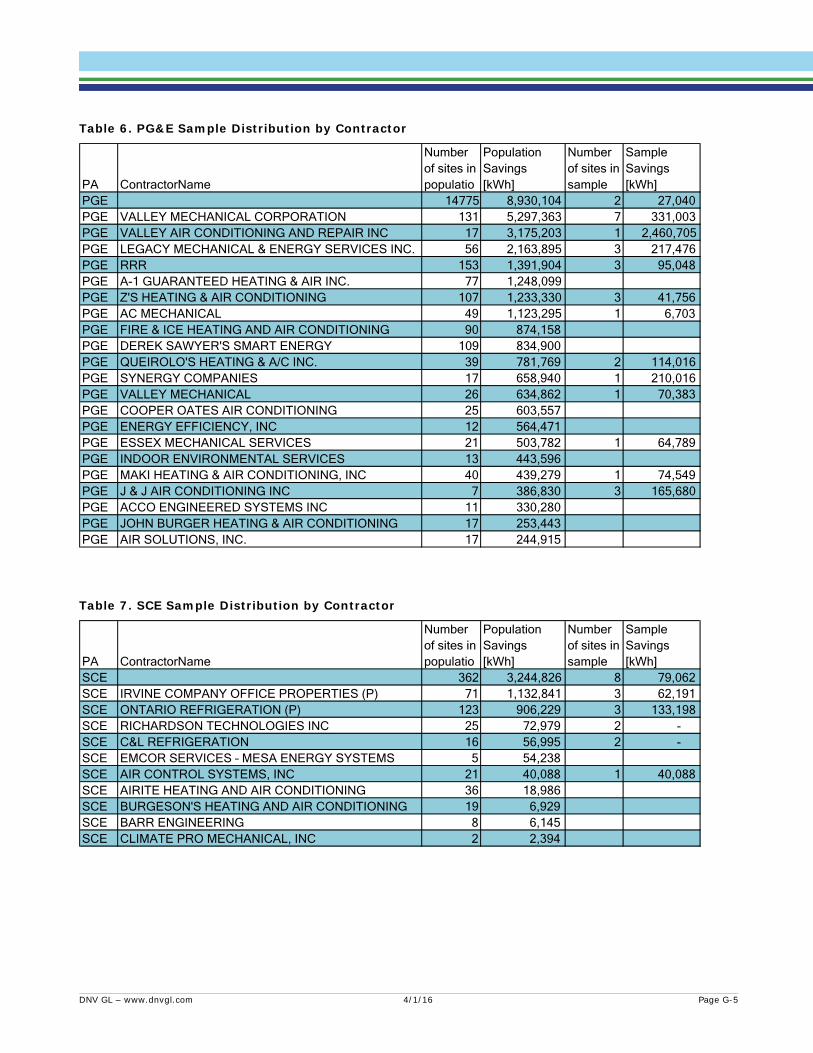
Table 6. PG&E Sample Distribution by Contractor
Table 7. SCE Sample Distribution by Contractor
PA ContractorName
Number of sites in populatio
Population Savings [kWh]
Number of sites in sample
Sample Savings [kWh]
PGE 14775 8,930,104 2 27,040 PGE VALLEY MECHANICAL CORPORATION 131 5,297,363 7 331,003 PGE VALLEY AIR CONDITIONING AND REPAIR INC 17 3,175,203 1 2,460,705 PGE LEGACY MECHANICAL & ENERGY SERVICES INC. 56 2,163,895 3 217,476 PGE RRR 153 1,391,904 3 95,048 PGE A-1 GUARANTEED HEATING & AIR INC. 77 1,248,099 PGE Z'S HEATING & AIR CONDITIONING 107 1,233,330 3 41,756 PGE AC MECHANICAL 49 1,123,295 1 6,703 PGE FIRE & ICE HEATING AND AIR CONDITIONING 90 874,158 PGE DEREK SAWYER'S SMART ENERGY 109 834,900 PGE QUEIROLO'S HEATING & A/C INC. 39 781,769 2 114,016 PGE SYNERGY COMPANIES 17 658,940 1 210,016 PGE VALLEY MECHANICAL 26 634,862 1 70,383 PGE COOPER OATES AIR CONDITIONING 25 603,557 PGE ENERGY EFFICIENCY, INC 12 564,471 PGE ESSEX MECHANICAL SERVICES 21 503,782 1 64,789 PGE INDOOR ENVIRONMENTAL SERVICES 13 443,596 PGE MAKI HEATING & AIR CONDITIONING, INC 40 439,279 1 74,549 PGE J & J AIR CONDITIONING INC 7 386,830 3 165,680 PGE ACCO ENGINEERED SYSTEMS INC 11 330,280 PGE JOHN BURGER HEATING & AIR CONDITIONING 17 253,443 PGE AIR SOLUTIONS, INC. 17 244,915
PA ContractorName
Number of sites in populatio
Population Savings [kWh]
Number of sites in sample
Sample Savings [kWh]
SCE 362 3,244,826 8 79,062 SCE IRVINE COMPANY OFFICE PROPERTIES (P) 71 1,132,841 3 62,191 SCE ONTARIO REFRIGERATION (P) 123 906,229 3 133,198 SCE RICHARDSON TECHNOLOGIES INC 25 72,979 2 - SCE C&L REFRIGERATION 16 56,995 2 - SCE EMCOR SERVICES – MESA ENERGY SYSTEMS 5 54,238 SCE AIR CONTROL SYSTEMS, INC 21 40,088 1 40,088 SCE AIRITE HEATING AND AIR CONDITIONING 36 18,986 SCE BURGESON'S HEATING AND AIR CONDITIONING 19 6,929 SCE BARR ENGINEERING 8 6,145 SCE CLIMATE PRO MECHANICAL, INC 2 2,394
DNV GL – www.dnvgl.com 4/1/16 Page G-5

Table 8. SDG&E Sample Distribution by Contractor
PA ContractorName
Number of sites in populatio
Population Savings [kWh]
Number of sites in sample
Sample Savings [kWh]
SDGE CONSERVATION SERVICES GROUP 1400 17,788,012 5 163,496 SDGE MATRIX 1990 5,765,846 1 2,743 SDGE SYNERGY COMPANIES 781 4,454,984 4 40,112 SDGE KEMA SERVICES, INC. 370 247,842 SDGE KEMA 290 184,829
DNV GL – www.dnvgl.com 4/1/16 Page G-6

ECONOMIZER BATCH PROCESS PROCEDURE Appendix H.DNV GL developed a batch process procedure to efficiently determine savings for the economizer control measure. This procedure is defined based on the HVAC 3 Quality Maintenance economizer control measure.
The workpaper used for this measure is PGE3PHVC152 Economizer Control Revision # 0 Economizer Control dated August 28, 2012. This workpaper covers both economizer control-replace (c103) and control-adjustment (c104). However, the attached executive summary spreadsheet just lists savings for the economizer control-replace measure. Workpaper PGE3PHVC151 defines Economizer Repair measure. A disposition has been submitted and the savings for economizer repair has been corrected, but savings for economizer control is not changed.
1. Find and review the workpaper for the selected measure and double check if a disposition has been submitted.
2. The workpaper provides applicable 13 building types, 3 system types, and 9 climate zones in PG&E territories. System type DXGF and PKHP apply to all 13 building types and PVAV applied to 6 building types. There are totally 288 records for economizer control-replace measure in the executive summary spreadsheet.
Table 1. Applicable building types and system types
System Type
Building Type Building Code Gas Packs Heat Pump Packaged
VAV
Assembly Asm √ √
Education – Primary School EPr √ √
Education – Secondary School ESe √ √ √
Education – Community College ECC √ √ √
Health/Medical – Nursing Home Nrs √ √ √
Manufacturing – Light Industrial MLI √ √
Office – Large OfL √ √ √
Office – Small OfS √ √ √
Restaurant - Sit-Down RSD √ √
Restaurant - Fast-Food RFF √ √
Retail - Multistory Large* Rt3 √ √ √
Retail - Single-Story Large RtL √ √
Retail – Small RtS √ √
3. Use MASControl v3.00.20 to generate all combinations based on building types, climate zones,
system types, and 7 vintage (75, 85, 96, 03, 07, 11, and 14). The cooling system size depends on the climate zone. Therefore, system size should be collected for each climate zone. The thermostat option should be Blank for all non-residential measures and Case options should be CAv and Msr. Select appropriate measures for each HVAC type so that MASControl can create prototype models successfully.
DNV GL – www.dnvgl.com 4/1/16 Page H-1
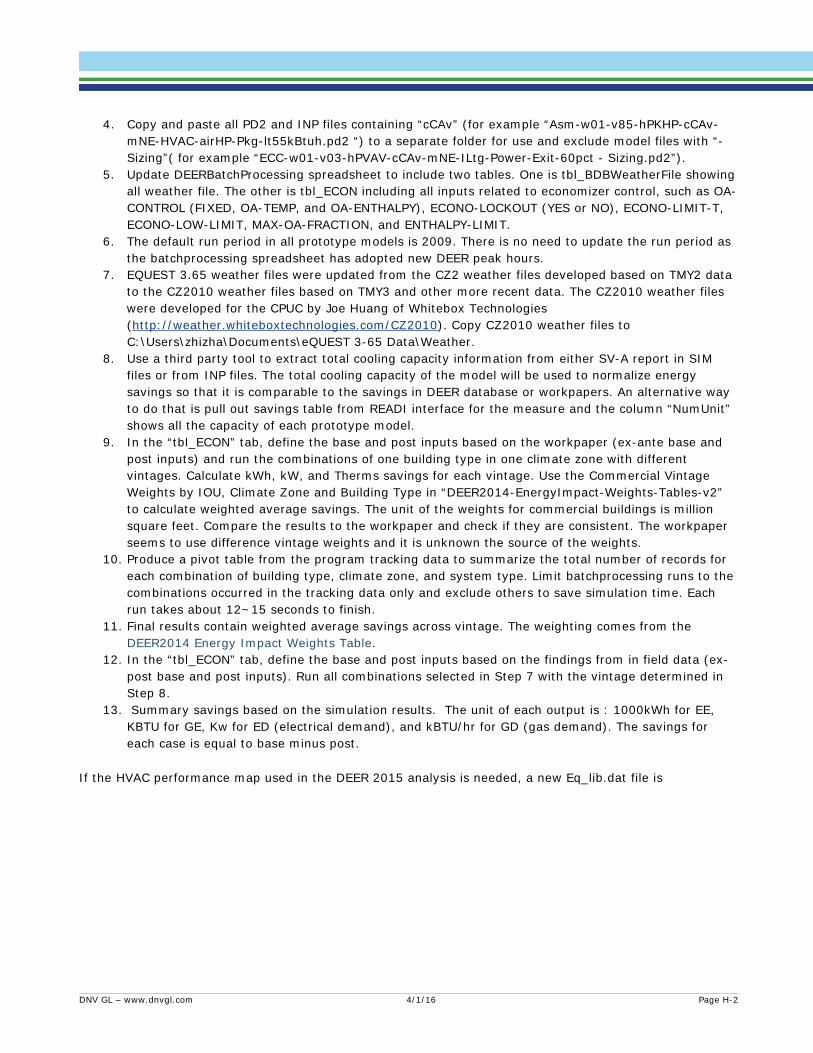
4. Copy and paste all PD2 and INP files containing “cCAv” (for example “Asm-w01-v85-hPKHP-cCAv-
mNE-HVAC-airHP-Pkg-lt55kBtuh.pd2 “) to a separate folder for use and exclude model files with “- Sizing”( for example “ECC-w01-v03-hPVAV-cCAv-mNE-ILtg-Power-Exit-60pct - Sizing.pd2”).
5. Update DEERBatchProcessing spreadsheet to include two tables. One is tbl_BDBWeatherFile showing all weather file. The other is tbl_ECON including all inputs related to economizer control, such as OA-CONTROL (FIXED, OA-TEMP, and OA-ENTHALPY), ECONO-LOCKOUT (YES or NO), ECONO-LIMIT-T, ECONO-LOW-LIMIT, MAX-OA-FRACTION, and ENTHALPY-LIMIT.
6. The default run period in all prototype models is 2009. There is no need to update the run period as the batchprocessing spreadsheet has adopted new DEER peak hours.
7. EQUEST 3.65 weather files were updated from the CZ2 weather files developed based on TMY2 data to the CZ2010 weather files based on TMY3 and other more recent data. The CZ2010 weather files were developed for the CPUC by Joe Huang of Whitebox Technologies (http://weather.whiteboxtechnologies.com/CZ2010). Copy CZ2010 weather files to C:\Users\zhizha\Documents\eQUEST 3-65 Data\Weather.
8. Use a third party tool to extract total cooling capacity information from either SV-A report in SIM files or from INP files. The total cooling capacity of the model will be used to normalize energy savings so that it is comparable to the savings in DEER database or workpapers. An alternative way to do that is pull out savings table from READI interface for the measure and the column “NumUnit” shows all the capacity of each prototype model.
9. In the “tbl_ECON” tab, define the base and post inputs based on the workpaper (ex-ante base and post inputs) and run the combinations of one building type in one climate zone with different vintages. Calculate kWh, kW, and Therms savings for each vintage. Use the Commercial Vintage Weights by IOU, Climate Zone and Building Type in “DEER2014-EnergyImpact-Weights-Tables-v2” to calculate weighted average savings. The unit of the weights for commercial buildings is million square feet. Compare the results to the workpaper and check if they are consistent. The workpaper seems to use difference vintage weights and it is unknown the source of the weights.
10. Produce a pivot table from the program tracking data to summarize the total number of records for each combination of building type, climate zone, and system type. Limit batchprocessing runs to the combinations occurred in the tracking data only and exclude others to save simulation time. Each run takes about 12~15 seconds to finish.
11. Final results contain weighted average savings across vintage. The weighting comes from the DEER2014 Energy Impact Weights Table.
12. In the “tbl_ECON” tab, define the base and post inputs based on the findings from in field data (ex-post base and post inputs). Run all combinations selected in Step 7 with the vintage determined in Step 8.
13. Summary savings based on the simulation results. The unit of each output is : 1000kWh for EE, KBTU for GE, Kw for ED (electrical demand), and kBTU/hr for GD (gas demand). The savings for each case is equal to base minus post.
If the HVAC performance map used in the DEER 2015 analysis is needed, a new Eq_lib.dat file is
DNV GL – www.dnvgl.com 4/1/16 Page H-2
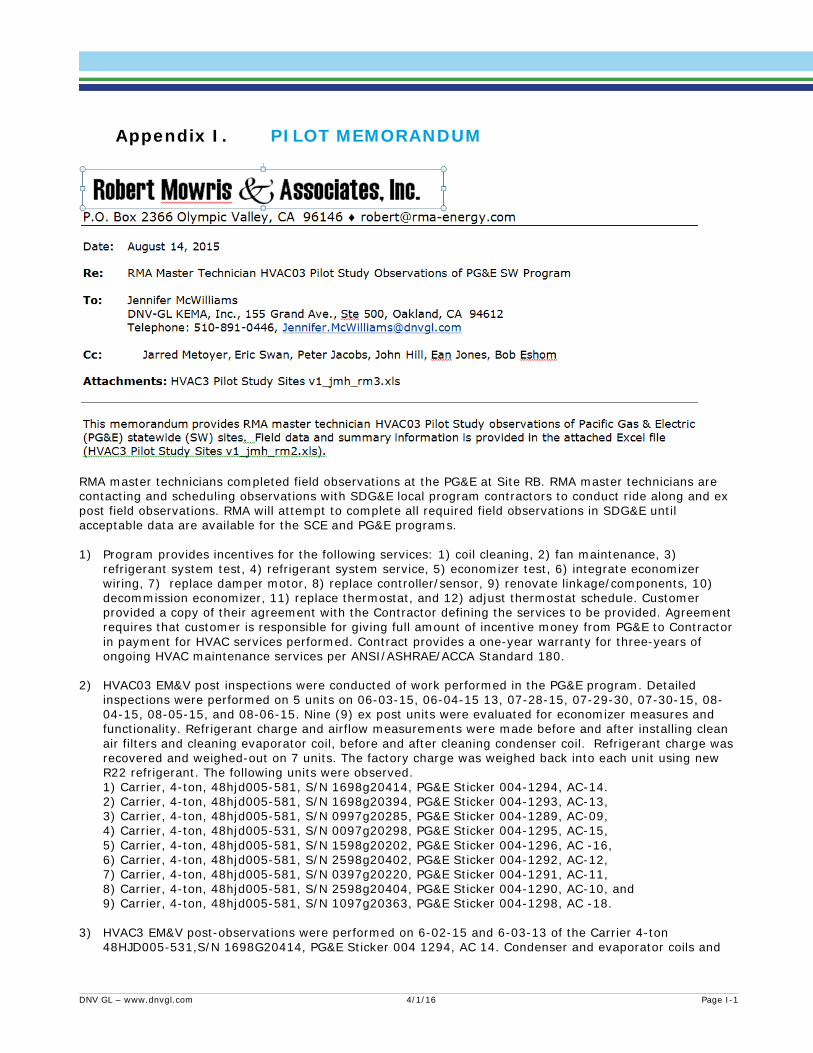
PILOT MEMORANDUM Appendix I.
RMA master technicians completed field observations at the PG&E at Site RB. RMA master technicians are contacting and scheduling observations with SDG&E local program contractors to conduct ride along and ex post field observations. RMA will attempt to complete all required field observations in SDG&E until acceptable data are available for the SCE and PG&E programs. 1) Program provides incentives for the following services: 1) coil cleaning, 2) fan maintenance, 3)
refrigerant system test, 4) refrigerant system service, 5) economizer test, 6) integrate economizer wiring, 7) replace damper motor, 8) replace controller/sensor, 9) renovate linkage/components, 10) decommission economizer, 11) replace thermostat, and 12) adjust thermostat schedule. Customer provided a copy of their agreement with the Contractor defining the services to be provided. Agreement requires that customer is responsible for giving full amount of incentive money from PG&E to Contractor in payment for HVAC services performed. Contract provides a one-year warranty for three-years of ongoing HVAC maintenance services per ANSI/ASHRAE/ACCA Standard 180.
2) HVAC03 EM&V post inspections were conducted of work performed in the PG&E program. Detailed
inspections were performed on 5 units on 06-03-15, 06-04-15 13, 07-28-15, 07-29-30, 07-30-15, 08-04-15, 08-05-15, and 08-06-15. Nine (9) ex post units were evaluated for economizer measures and functionality. Refrigerant charge and airflow measurements were made before and after installing clean air filters and cleaning evaporator coil, before and after cleaning condenser coil. Refrigerant charge was recovered and weighed-out on 7 units. The factory charge was weighed back into each unit using new R22 refrigerant. The following units were observed. 1) Carrier, 4-ton, 48hjd005-581, S/N 1698g20414, PG&E Sticker 004-1294, AC-14. 2) Carrier, 4-ton, 48hjd005-581, S/N 1698g20394, PG&E Sticker 004-1293, AC-13, 3) Carrier, 4-ton, 48hjd005-581, S/N 0997g20285, PG&E Sticker 004-1289, AC-09, 4) Carrier, 4-ton, 48hjd005-531, S/N 0097g20298, PG&E Sticker 004-1295, AC-15, 5) Carrier, 4-ton, 48hjd005-581, S/N 1598g20202, PG&E Sticker 004-1296, AC -16, 6) Carrier, 4-ton, 48hjd005-581, S/N 2598g20402, PG&E Sticker 004-1292, AC-12, 7) Carrier, 4-ton, 48hjd005-581, S/N 0397g20220, PG&E Sticker 004-1291, AC-11, 8) Carrier, 4-ton, 48hjd005-581, S/N 2598g20404, PG&E Sticker 004-1290, AC-10, and 9) Carrier, 4-ton, 48hjd005-581, S/N 1097g20363, PG&E Sticker 004-1298, AC -18.
3) HVAC3 EM&V post-observations were performed on 6-02-15 and 6-03-13 of the Carrier 4-ton
48HJD005-531,S/N 1698G20414, PG&E Sticker 004 1294, AC 14. Condenser and evaporator coils and
DNV GL – www.dnvgl.com 4/1/16 Page I-1

filters were dirty. Air filters were changed four months prior to site visit (dated 2/15/15). The economizer was retrofitted with new parts including a Honeywell 7220 Jade Control module and Honeywell C7401F2006/U 20K Ohm NTC outdoor air sensor. The new controller was screwed into the relief damper keeping it closed. Cold spray test did not cause the economizer damper to open due to issues with the actuator. Economizer minimum damper position was set to 10% open (2.8V), but dampers were closed. Observed economizer controller error message is "MA ERR" indicating missing mixed-air (MA) sensor. Defaults software system setting is OCC = INPUT, but no thermostat wire was attached to the OCC terminal, and no jumper was attached from terminal R to OCC. Missing thermostat occupancy (“OCC”) wire causes the economizer damper to be closed (2.0 V) instead of minimum damper position of 10% open (MIN POS = 2.8 V) when cooling or heating. Default changeover set point was 67F (DRYBLB). There was a 1/3” gap between economizer and sheet metal cabinet causing excessive unintended perimeter leakage. With economizer outdoor air dampers closed, the measured outdoor air fraction (OAF) for the 4-ton unit (004-1294) was 33.3 +/- 4.2% at the following conditions: Tm=70F, Tr=60F, To=90F. The uncertainty was calculated using the Engineering Equation Solver (Figure 1).35
Figure 1. Outdoor Air Fraction and Uncertainty for 4-ton non-TXV Unit (004-1294)
The manufacturer provides charts of suction temperature as a function of suction pressure and OAT (see
Carrier 2005. 48HJ004-007 Single-Package Rooftop Heating/Cooling Standard and Low NOx Units. Installation, Start-up, and Service Instructions. Form 48HJ-22SI. Fig. 56 – Cooling Charging Charts. http://www.docs.hvacpartners.com/idc/groups/public/documents/techlit/48hj-22si.pdf.). Initial measurements with dirty coils, dirty air filters, and overcharge (133.3 ounces or 104% of factory charge 128 ounces) indicated temperature split was 28.7°F or 8.4°F above 20.3°F CEC RCA target and above 20 +/- 2°F program tolerance (measured airflow was 323 cfm/ton).36 Suction temperature was 36.8°F and 11.1°F above the 25.7°F manufacturer target. Superheat was 5.3°F and within tolerance of the 5°F CEC RCA target and below 20 +/- 5°F program tolerance. EST was 32°F and below 46 +/- 6°F program tolerance. Final measurements with clean coils, clean air filters, and overcharge (133.3 ounces)
35 Mixed air and return air temperatures were measured with accurate sensors mounted in the same pre/post locations. Repeated measurements indicated reasonable accuracy as long as OAT was at least 20F above return air temperature.
36 CEC protocols are intended to only apply to residential systems, but are used by technicians to diagnose refrigerant charge for commercial packaged units. Statewide commercial HVAC maintenance program tolerances are as follows: superheat 20 +/-5F, subcooling 11+/-4F, temperature split 20+/-2F, evaporator saturation 46+/-6F, condenser over ambient 25+/-5F. Source: Southern California Edison Company (SCE). June 2012. SCE HVAC Optimization Technician Training, page 13.
DNV GL – www.dnvgl.com 4/1/16 Page I-2
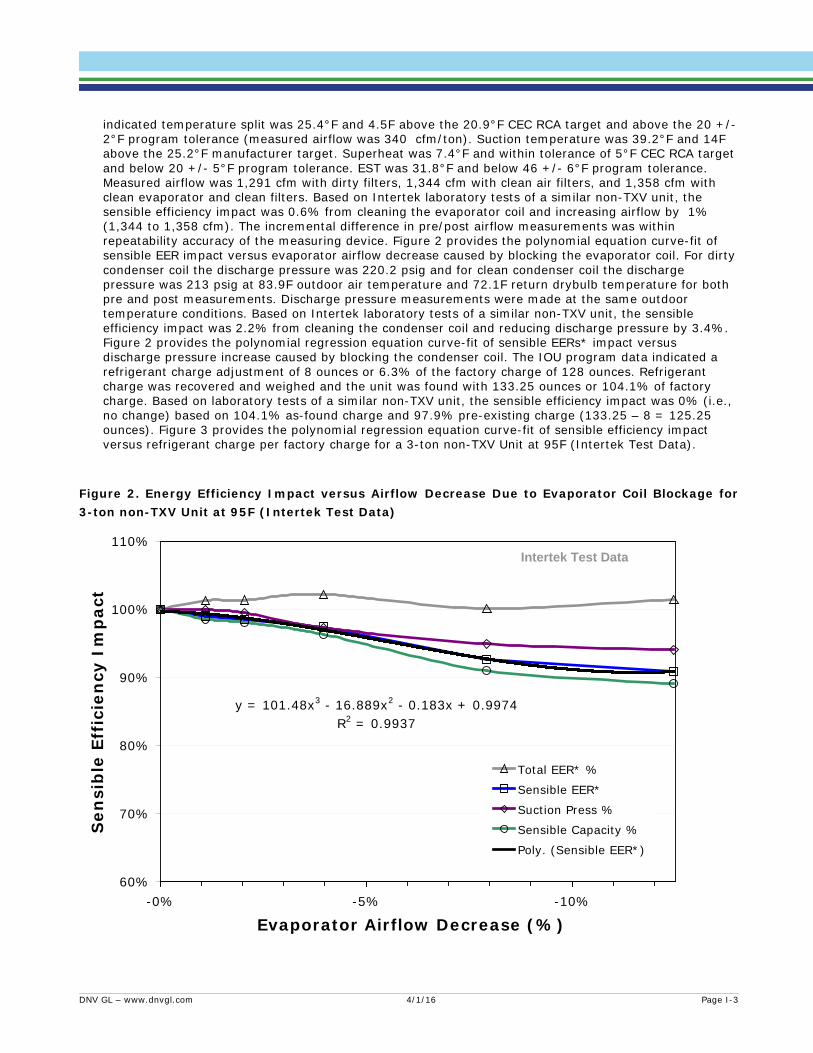
indicated temperature split was 25.4°F and 4.5F above the 20.9°F CEC RCA target and above the 20 +/- 2°F program tolerance (measured airflow was 340 cfm/ton). Suction temperature was 39.2°F and 14F above the 25.2°F manufacturer target. Superheat was 7.4°F and within tolerance of 5°F CEC RCA target and below 20 +/- 5°F program tolerance. EST was 31.8°F and below 46 +/- 6°F program tolerance. Measured airflow was 1,291 cfm with dirty filters, 1,344 cfm with clean air filters, and 1,358 cfm with clean evaporator and clean filters. Based on Intertek laboratory tests of a similar non-TXV unit, the sensible efficiency impact was 0.6% from cleaning the evaporator coil and increasing airflow by 1% (1,344 to 1,358 cfm). The incremental difference in pre/post airflow measurements was within repeatability accuracy of the measuring device. Figure 2 provides the polynomial equation curve-fit of sensible EER impact versus evaporator airflow decrease caused by blocking the evaporator coil. For dirty condenser coil the discharge pressure was 220.2 psig and for clean condenser coil the discharge pressure was 213 psig at 83.9F outdoor air temperature and 72.1F return drybulb temperature for both pre and post measurements. Discharge pressure measurements were made at the same outdoor temperature conditions. Based on Intertek laboratory tests of a similar non-TXV unit, the sensible efficiency impact was 2.2% from cleaning the condenser coil and reducing discharge pressure by 3.4%. Figure 2 provides the polynomial regression equation curve-fit of sensible EERs* impact versus discharge pressure increase caused by blocking the condenser coil. The IOU program data indicated a refrigerant charge adjustment of 8 ounces or 6.3% of the factory charge of 128 ounces. Refrigerant charge was recovered and weighed and the unit was found with 133.25 ounces or 104.1% of factory charge. Based on laboratory tests of a similar non-TXV unit, the sensible efficiency impact was 0% (i.e., no change) based on 104.1% as-found charge and 97.9% pre-existing charge (133.25 – 8 = 125.25 ounces). Figure 3 provides the polynomial regression equation curve-fit of sensible efficiency impact versus refrigerant charge per factory charge for a 3-ton non-TXV Unit at 95F (Intertek Test Data).
Figure 2. Energy Efficiency Impact versus Airflow Decrease Due to Evaporator Coil Blockage for 3-ton non-TXV Unit at 95F (Intertek Test Data)
y = 101.48x3 - 16.889x2 - 0.183x + 0.9974R2 = 0.9937
60%
70%
80%
90%
100%
110%
-0% -5% -10%
Evaporator Airflow Decrease (%)
Sen
sib
le E
ffic
ien
cy I
mp
act
Total EER* %
Sensible EER*
Suction Press %
Sensible Capacity %
Poly. (Sensible EER*)
Intertek Test Data
DNV GL – www.dnvgl.com 4/1/16 Page I-3

Note: Black line is the polynomial regression curve fit.
Figure 3. Energy Efficiency Impact versus Discharge Pressure Increase Due to Condenser Coil Blockage for 3-ton non-TXV Unit at 95F (Intertek Test Data)
Note: Black line is the polynomial regression curve fit.
y = 7.947410x3 - 3.503888x2 - 0.503908x + 1.000000R2 = 0.996784
60%
70%
80%
90%
100%
110%
120%
130%
0% 5% 10% 15% 20% 25%
Discharge Pressure Increase (%)
Sen
sib
le E
ffic
ien
cy I
mp
act
Total Power %
Sensible EER* %
Sensible Capacity %
Intertek Test Data
DNV GL – www.dnvgl.com 4/1/16 Page I-4
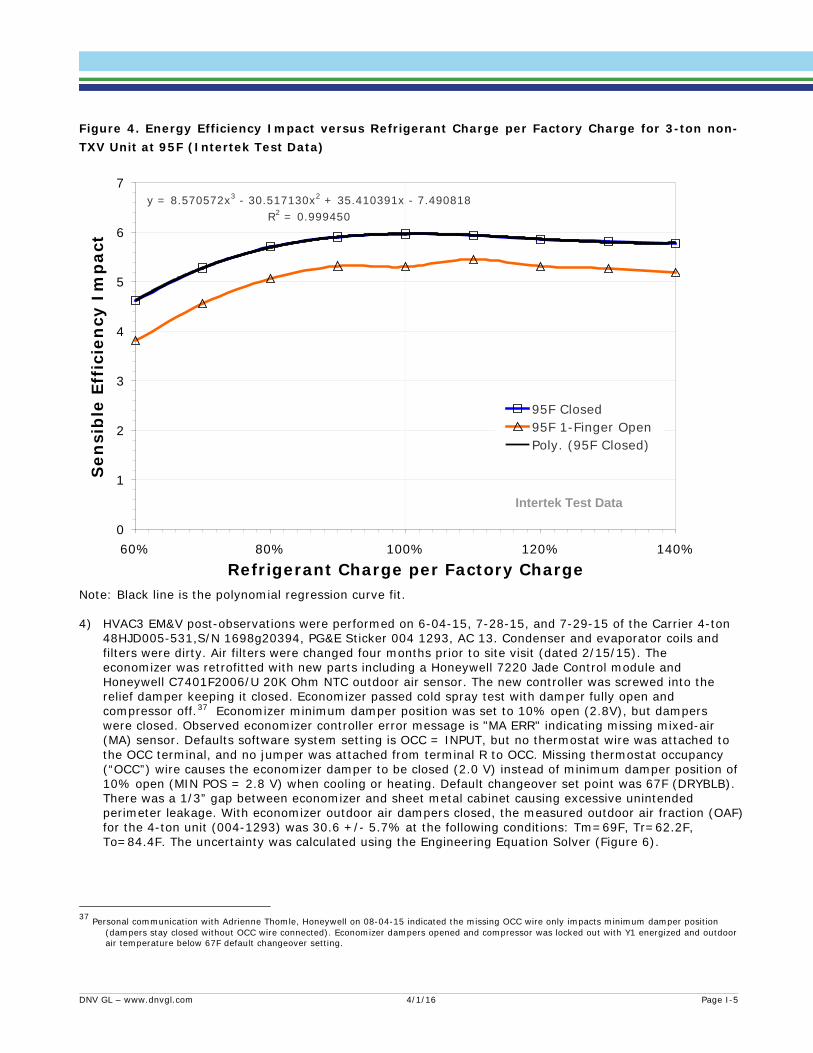
Figure 4. Energy Efficiency Impact versus Refrigerant Charge per Factory Charge for 3-ton non-TXV Unit at 95F (Intertek Test Data)
Note: Black line is the polynomial regression curve fit. 4) HVAC3 EM&V post-observations were performed on 6-04-15, 7-28-15, and 7-29-15 of the Carrier 4-ton
48HJD005-531,S/N 1698g20394, PG&E Sticker 004 1293, AC 13. Condenser and evaporator coils and filters were dirty. Air filters were changed four months prior to site visit (dated 2/15/15). The economizer was retrofitted with new parts including a Honeywell 7220 Jade Control module and Honeywell C7401F2006/U 20K Ohm NTC outdoor air sensor. The new controller was screwed into the relief damper keeping it closed. Economizer passed cold spray test with damper fully open and compressor off.37 Economizer minimum damper position was set to 10% open (2.8V), but dampers were closed. Observed economizer controller error message is "MA ERR" indicating missing mixed-air (MA) sensor. Defaults software system setting is OCC = INPUT, but no thermostat wire was attached to the OCC terminal, and no jumper was attached from terminal R to OCC. Missing thermostat occupancy (“OCC”) wire causes the economizer damper to be closed (2.0 V) instead of minimum damper position of 10% open (MIN POS = 2.8 V) when cooling or heating. Default changeover set point was 67F (DRYBLB). There was a 1/3” gap between economizer and sheet metal cabinet causing excessive unintended perimeter leakage. With economizer outdoor air dampers closed, the measured outdoor air fraction (OAF) for the 4-ton unit (004-1293) was 30.6 +/- 5.7% at the following conditions: Tm=69F, Tr=62.2F, To=84.4F. The uncertainty was calculated using the Engineering Equation Solver (Figure 6).
37 Personal communication with Adrienne Thomle, Honeywell on 08-04-15 indicated the missing OCC wire only impacts minimum damper position (dampers stay closed without OCC wire connected). Economizer dampers opened and compressor was locked out with Y1 energized and outdoor air temperature below 67F default changeover setting.
y = 8.570572x3 - 30.517130x2 + 35.410391x - 7.490818R2 = 0.999450
0
1
2
3
4
5
6
7
60% 80% 100% 120% 140%
Refrigerant Charge per Factory Charge
Sen
sib
le E
ffic
ien
cy I
mp
act
95F Closed95F 1-Finger OpenPoly. (95F Closed)
Intertek Test Data
DNV GL – www.dnvgl.com 4/1/16 Page I-5
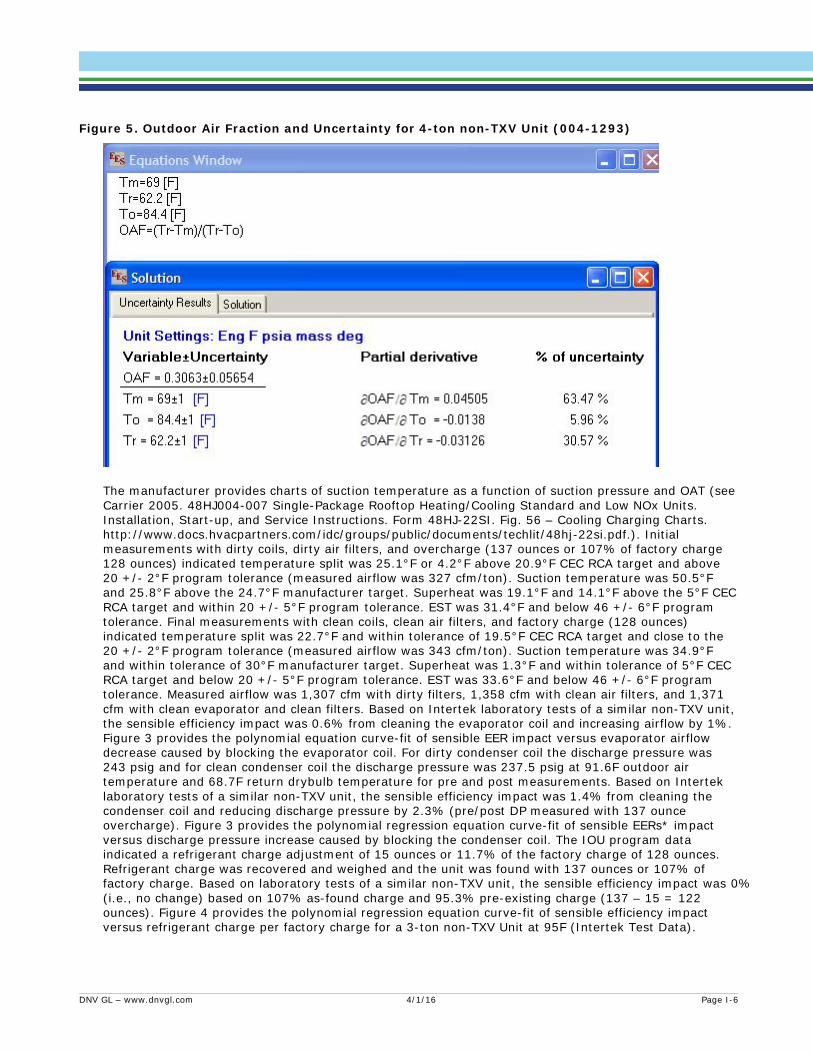
Figure 5. Outdoor Air Fraction and Uncertainty for 4-ton non-TXV Unit (004-1293)
The manufacturer provides charts of suction temperature as a function of suction pressure and OAT (see
Carrier 2005. 48HJ004-007 Single-Package Rooftop Heating/Cooling Standard and Low NOx Units. Installation, Start-up, and Service Instructions. Form 48HJ-22SI. Fig. 56 – Cooling Charging Charts. http://www.docs.hvacpartners.com/idc/groups/public/documents/techlit/48hj-22si.pdf.). Initial measurements with dirty coils, dirty air filters, and overcharge (137 ounces or 107% of factory charge 128 ounces) indicated temperature split was 25.1°F or 4.2°F above 20.9°F CEC RCA target and above 20 +/- 2°F program tolerance (measured airflow was 327 cfm/ton). Suction temperature was 50.5°F and 25.8°F above the 24.7°F manufacturer target. Superheat was 19.1°F and 14.1°F above the 5°F CEC RCA target and within 20 +/- 5°F program tolerance. EST was 31.4°F and below 46 +/- 6°F program tolerance. Final measurements with clean coils, clean air filters, and factory charge (128 ounces) indicated temperature split was 22.7°F and within tolerance of 19.5°F CEC RCA target and close to the 20 +/- 2°F program tolerance (measured airflow was 343 cfm/ton). Suction temperature was 34.9°F and within tolerance of 30°F manufacturer target. Superheat was 1.3°F and within tolerance of 5°F CEC RCA target and below 20 +/- 5°F program tolerance. EST was 33.6°F and below 46 +/- 6°F program tolerance. Measured airflow was 1,307 cfm with dirty filters, 1,358 cfm with clean air filters, and 1,371 cfm with clean evaporator and clean filters. Based on Intertek laboratory tests of a similar non-TXV unit, the sensible efficiency impact was 0.6% from cleaning the evaporator coil and increasing airflow by 1%. Figure 3 provides the polynomial equation curve-fit of sensible EER impact versus evaporator airflow decrease caused by blocking the evaporator coil. For dirty condenser coil the discharge pressure was 243 psig and for clean condenser coil the discharge pressure was 237.5 psig at 91.6F outdoor air temperature and 68.7F return drybulb temperature for pre and post measurements. Based on Intertek laboratory tests of a similar non-TXV unit, the sensible efficiency impact was 1.4% from cleaning the condenser coil and reducing discharge pressure by 2.3% (pre/post DP measured with 137 ounce overcharge). Figure 3 provides the polynomial regression equation curve-fit of sensible EERs* impact versus discharge pressure increase caused by blocking the condenser coil. The IOU program data indicated a refrigerant charge adjustment of 15 ounces or 11.7% of the factory charge of 128 ounces. Refrigerant charge was recovered and weighed and the unit was found with 137 ounces or 107% of factory charge. Based on laboratory tests of a similar non-TXV unit, the sensible efficiency impact was 0% (i.e., no change) based on 107% as-found charge and 95.3% pre-existing charge (137 – 15 = 122 ounces). Figure 4 provides the polynomial regression equation curve-fit of sensible efficiency impact versus refrigerant charge per factory charge for a 3-ton non-TXV Unit at 95F (Intertek Test Data).
DNV GL – www.dnvgl.com 4/1/16 Page I-6

5) HVAC3 EM&V post-observations were performed on 7-29-15 and 7-30-15 of the Carrier 4-ton
48HJD005-531,S/N 0997g20285, PG&E Sticker 004-1289, AC-09. Condenser and evaporator coils and filters were dirty. Air filters were changed four months prior to site visit (dated 2/24/15). The economizer was retrofitted with new parts including a Honeywell 7220 Jade Control module and Honeywell C7401F2006/U 20K Ohm NTC outdoor air sensor. The new controller was screwed into the relief damper keeping it closed. Economizer minimum damper position was set to 10% open (2.8V), but dampers were closed. Economizer passed cold spray test with damper fully open and compressor off.38 Observed economizer controller error message is "MA ERR" indicating missing mixed-air (MA) sensor. Defaults software system setting is OCC = INPUT, but no thermostat wire was attached to the OCC terminal, and no jumper was attached from terminal R to OCC. Missing thermostat occupancy (“OCC”) wire causes the economizer damper to be closed (2.0 V) instead of minimum damper position of 10% open (MIN POS = 2.8 V) when cooling or heating. Default changeover set point was 67F (DRYBLB). There was a 1/3” gap between economizer and sheet metal cabinet causing excessive unintended perimeter leakage. With economizer outdoor air dampers closed, the measured outdoor air fraction (OAF) for the 4-ton unit (004-1289) was 26.3 +/- 3.9% at the following conditions: Tm=80.1F, Tr=71.5F, To=104.4F. The uncertainty was calculated using the Engineering Equation Solver (Figure 6).
Figure 6. Outdoor Air Fraction and Uncertainty for 4-ton non-TXV Unit (004-1289)
The manufacturer provides charts of suction temperature as a function of suction pressure and OAT (see
Carrier 2005. 48HJ004-007 Single-Package Rooftop Heating/Cooling Standard and Low NOx Units. Installation, Start-up, and Service Instructions. Form 48HJ-22SI. Fig. 56 – Cooling Charging Charts. http://www.docs.hvacpartners.com/idc/groups/public/documents/techlit/48hj-22si.pdf.). Initial measurements with dirty coils, dirty air filters, and undercharge (116 ounces or 90.6% of factory charge 128 ounces) indicated temperature split was 20.8°F or -0.7°F below 21.5°F CEC RCA target and within 20 +/- 2°F program tolerance (measured airflow was 314 cfm/ton). Suction temperature was 62.4°F or 23.9 above 38.5°F manufacturer target indicating undercharge. Superheat was 22.5°F or 17.5 above 5°F CEC RCA target and within 20 +/- 5°F program tolerance. EST was 40°F and within 46 +/- 6°F program tolerance. Refrigerant charge was recovered and weighed-out at 116 ounces of 90.6% of 128
38 Personal communication with Adrienne Thomle, Honeywell on 08-04-15 indicated the missing OCC wire only impacts minimum damper position (dampers stay closed without OCC wire connected). Economizer dampers opened and compressor was locked out with Y1 energized and outdoor air temperature below 67F default changeover setting.
DNV GL – www.dnvgl.com 4/1/16 Page I-7
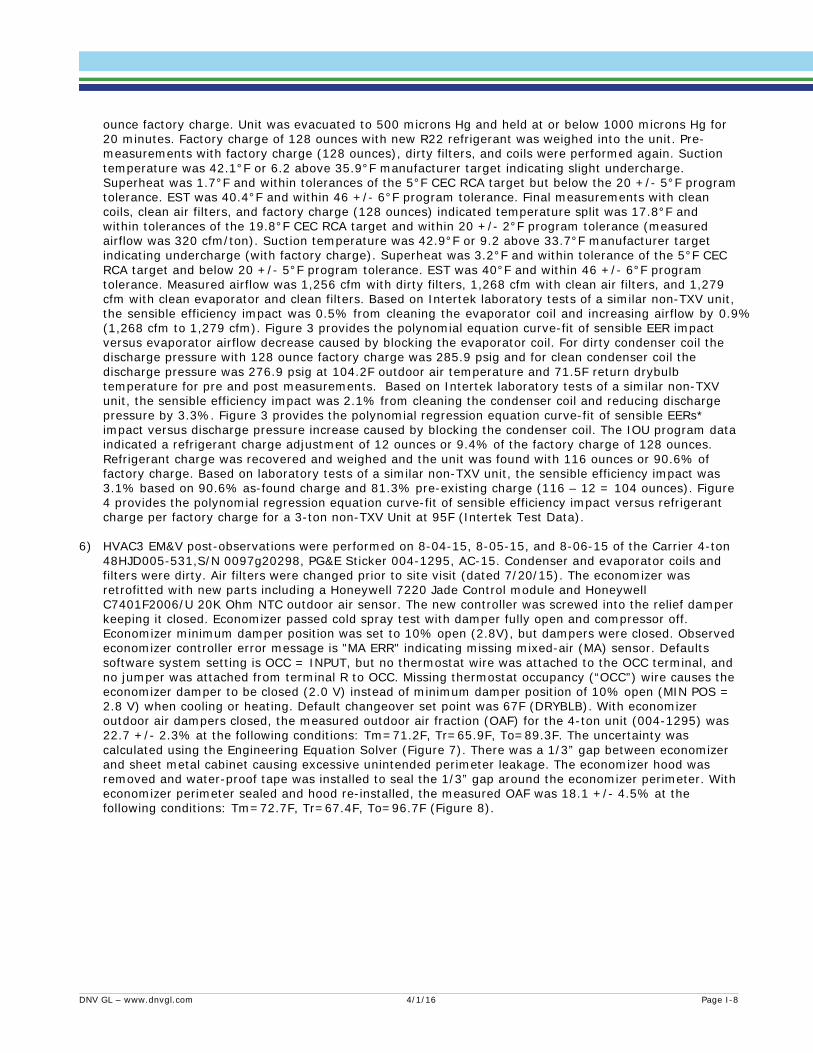
ounce factory charge. Unit was evacuated to 500 microns Hg and held at or below 1000 microns Hg for 20 minutes. Factory charge of 128 ounces with new R22 refrigerant was weighed into the unit. Pre-measurements with factory charge (128 ounces), dirty filters, and coils were performed again. Suction temperature was 42.1°F or 6.2 above 35.9°F manufacturer target indicating slight undercharge. Superheat was 1.7°F and within tolerances of the 5°F CEC RCA target but below the 20 +/- 5°F program tolerance. EST was 40.4°F and within 46 +/- 6°F program tolerance. Final measurements with clean coils, clean air filters, and factory charge (128 ounces) indicated temperature split was 17.8°F and within tolerances of the 19.8°F CEC RCA target and within 20 +/- 2°F program tolerance (measured airflow was 320 cfm/ton). Suction temperature was 42.9°F or 9.2 above 33.7°F manufacturer target indicating undercharge (with factory charge). Superheat was 3.2°F and within tolerance of the 5°F CEC RCA target and below 20 +/- 5°F program tolerance. EST was 40°F and within 46 +/- 6°F program tolerance. Measured airflow was 1,256 cfm with dirty filters, 1,268 cfm with clean air filters, and 1,279 cfm with clean evaporator and clean filters. Based on Intertek laboratory tests of a similar non-TXV unit, the sensible efficiency impact was 0.5% from cleaning the evaporator coil and increasing airflow by 0.9% (1,268 cfm to 1,279 cfm). Figure 3 provides the polynomial equation curve-fit of sensible EER impact versus evaporator airflow decrease caused by blocking the evaporator coil. For dirty condenser coil the discharge pressure with 128 ounce factory charge was 285.9 psig and for clean condenser coil the discharge pressure was 276.9 psig at 104.2F outdoor air temperature and 71.5F return drybulb temperature for pre and post measurements. Based on Intertek laboratory tests of a similar non-TXV unit, the sensible efficiency impact was 2.1% from cleaning the condenser coil and reducing discharge pressure by 3.3%. Figure 3 provides the polynomial regression equation curve-fit of sensible EERs* impact versus discharge pressure increase caused by blocking the condenser coil. The IOU program data indicated a refrigerant charge adjustment of 12 ounces or 9.4% of the factory charge of 128 ounces. Refrigerant charge was recovered and weighed and the unit was found with 116 ounces or 90.6% of factory charge. Based on laboratory tests of a similar non-TXV unit, the sensible efficiency impact was 3.1% based on 90.6% as-found charge and 81.3% pre-existing charge (116 – 12 = 104 ounces). Figure 4 provides the polynomial regression equation curve-fit of sensible efficiency impact versus refrigerant charge per factory charge for a 3-ton non-TXV Unit at 95F (Intertek Test Data).
6) HVAC3 EM&V post-observations were performed on 8-04-15, 8-05-15, and 8-06-15 of the Carrier 4-ton
48HJD005-531,S/N 0097g20298, PG&E Sticker 004-1295, AC-15. Condenser and evaporator coils and filters were dirty. Air filters were changed prior to site visit (dated 7/20/15). The economizer was retrofitted with new parts including a Honeywell 7220 Jade Control module and Honeywell C7401F2006/U 20K Ohm NTC outdoor air sensor. The new controller was screwed into the relief damper keeping it closed. Economizer passed cold spray test with damper fully open and compressor off. Economizer minimum damper position was set to 10% open (2.8V), but dampers were closed. Observed economizer controller error message is "MA ERR" indicating missing mixed-air (MA) sensor. Defaults software system setting is OCC = INPUT, but no thermostat wire was attached to the OCC terminal, and no jumper was attached from terminal R to OCC. Missing thermostat occupancy (“OCC”) wire causes the economizer damper to be closed (2.0 V) instead of minimum damper position of 10% open (MIN POS = 2.8 V) when cooling or heating. Default changeover set point was 67F (DRYBLB). With economizer outdoor air dampers closed, the measured outdoor air fraction (OAF) for the 4-ton unit (004-1295) was 22.7 +/- 2.3% at the following conditions: Tm=71.2F, Tr=65.9F, To=89.3F. The uncertainty was calculated using the Engineering Equation Solver (Figure 7). There was a 1/3” gap between economizer and sheet metal cabinet causing excessive unintended perimeter leakage. The economizer hood was removed and water-proof tape was installed to seal the 1/3” gap around the economizer perimeter. With economizer perimeter sealed and hood re-installed, the measured OAF was 18.1 +/- 4.5% at the following conditions: Tm=72.7F, Tr=67.4F, To=96.7F (Figure 8).
DNV GL – www.dnvgl.com 4/1/16 Page I-8
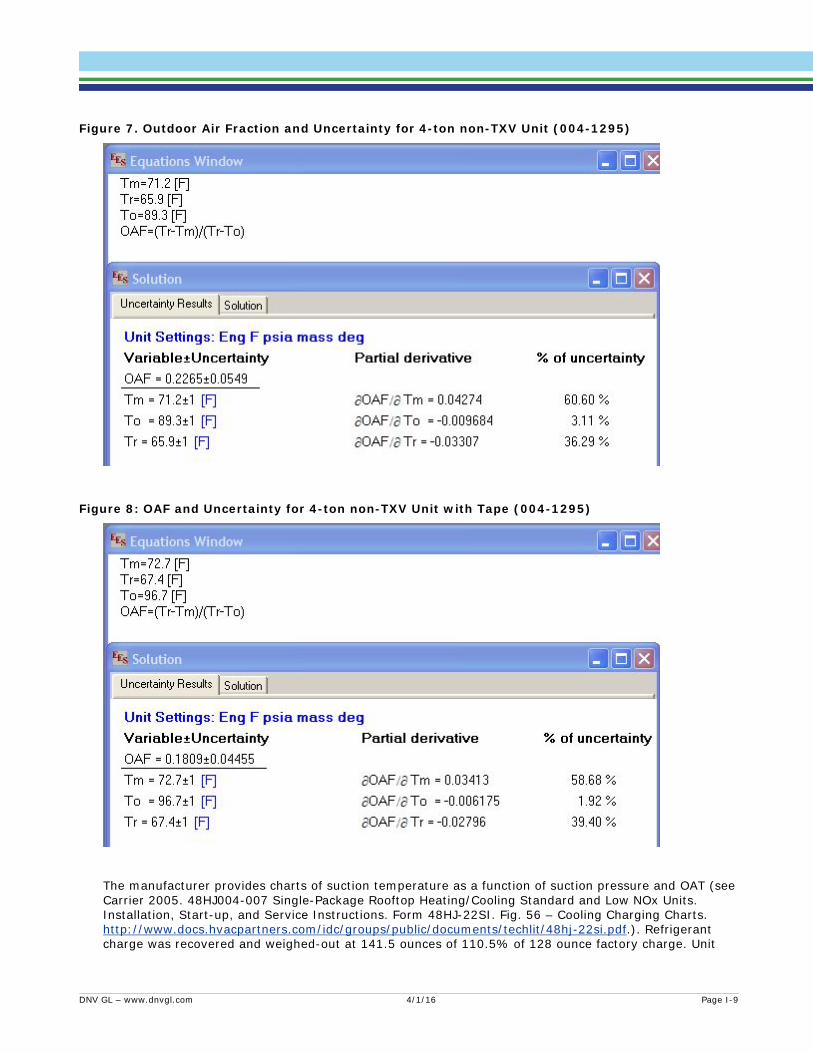
Figure 7. Outdoor Air Fraction and Uncertainty for 4-ton non-TXV Unit (004-1295)
Figure 8: OAF and Uncertainty for 4-ton non-TXV Unit with Tape (004-1295)
The manufacturer provides charts of suction temperature as a function of suction pressure and OAT (see
Carrier 2005. 48HJ004-007 Single-Package Rooftop Heating/Cooling Standard and Low NOx Units. Installation, Start-up, and Service Instructions. Form 48HJ-22SI. Fig. 56 – Cooling Charging Charts. http://www.docs.hvacpartners.com/idc/groups/public/documents/techlit/48hj-22si.pdf.). Refrigerant charge was recovered and weighed-out at 141.5 ounces of 110.5% of 128 ounce factory charge. Unit
DNV GL – www.dnvgl.com 4/1/16 Page I-9
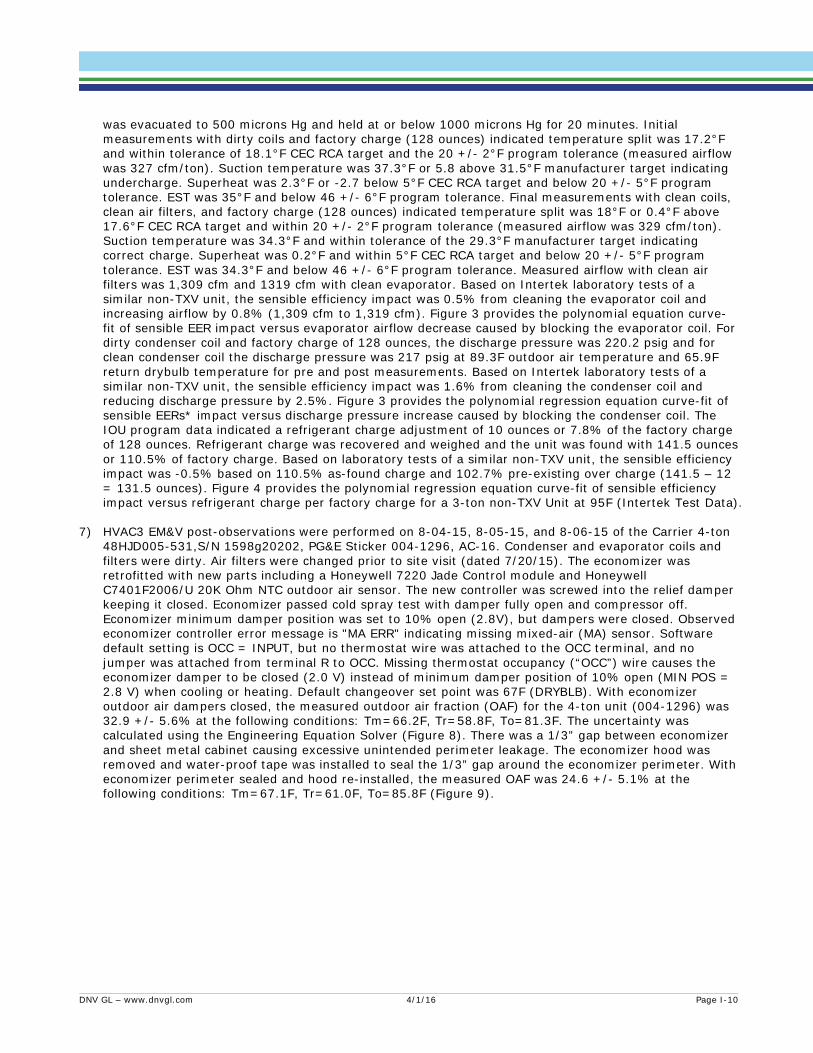
was evacuated to 500 microns Hg and held at or below 1000 microns Hg for 20 minutes. Initial measurements with dirty coils and factory charge (128 ounces) indicated temperature split was 17.2°F and within tolerance of 18.1°F CEC RCA target and the 20 +/- 2°F program tolerance (measured airflow was 327 cfm/ton). Suction temperature was 37.3°F or 5.8 above 31.5°F manufacturer target indicating undercharge. Superheat was 2.3°F or -2.7 below 5°F CEC RCA target and below 20 +/- 5°F program tolerance. EST was 35°F and below 46 +/- 6°F program tolerance. Final measurements with clean coils, clean air filters, and factory charge (128 ounces) indicated temperature split was 18°F or 0.4°F above 17.6°F CEC RCA target and within 20 +/- 2°F program tolerance (measured airflow was 329 cfm/ton). Suction temperature was 34.3°F and within tolerance of the 29.3°F manufacturer target indicating correct charge. Superheat was 0.2°F and within 5°F CEC RCA target and below 20 +/- 5°F program tolerance. EST was 34.3°F and below 46 +/- 6°F program tolerance. Measured airflow with clean air filters was 1,309 cfm and 1319 cfm with clean evaporator. Based on Intertek laboratory tests of a similar non-TXV unit, the sensible efficiency impact was 0.5% from cleaning the evaporator coil and increasing airflow by 0.8% (1,309 cfm to 1,319 cfm). Figure 3 provides the polynomial equation curve-fit of sensible EER impact versus evaporator airflow decrease caused by blocking the evaporator coil. For dirty condenser coil and factory charge of 128 ounces, the discharge pressure was 220.2 psig and for clean condenser coil the discharge pressure was 217 psig at 89.3F outdoor air temperature and 65.9F return drybulb temperature for pre and post measurements. Based on Intertek laboratory tests of a similar non-TXV unit, the sensible efficiency impact was 1.6% from cleaning the condenser coil and reducing discharge pressure by 2.5%. Figure 3 provides the polynomial regression equation curve-fit of sensible EERs* impact versus discharge pressure increase caused by blocking the condenser coil. The IOU program data indicated a refrigerant charge adjustment of 10 ounces or 7.8% of the factory charge of 128 ounces. Refrigerant charge was recovered and weighed and the unit was found with 141.5 ounces or 110.5% of factory charge. Based on laboratory tests of a similar non-TXV unit, the sensible efficiency impact was -0.5% based on 110.5% as-found charge and 102.7% pre-existing over charge (141.5 – 12 = 131.5 ounces). Figure 4 provides the polynomial regression equation curve-fit of sensible efficiency impact versus refrigerant charge per factory charge for a 3-ton non-TXV Unit at 95F (Intertek Test Data).
7) HVAC3 EM&V post-observations were performed on 8-04-15, 8-05-15, and 8-06-15 of the Carrier 4-ton
48HJD005-531,S/N 1598g20202, PG&E Sticker 004-1296, AC-16. Condenser and evaporator coils and filters were dirty. Air filters were changed prior to site visit (dated 7/20/15). The economizer was retrofitted with new parts including a Honeywell 7220 Jade Control module and Honeywell C7401F2006/U 20K Ohm NTC outdoor air sensor. The new controller was screwed into the relief damper keeping it closed. Economizer passed cold spray test with damper fully open and compressor off. Economizer minimum damper position was set to 10% open (2.8V), but dampers were closed. Observed economizer controller error message is "MA ERR" indicating missing mixed-air (MA) sensor. Software default setting is OCC = INPUT, but no thermostat wire was attached to the OCC terminal, and no jumper was attached from terminal R to OCC. Missing thermostat occupancy (“OCC”) wire causes the economizer damper to be closed (2.0 V) instead of minimum damper position of 10% open (MIN POS = 2.8 V) when cooling or heating. Default changeover set point was 67F (DRYBLB). With economizer outdoor air dampers closed, the measured outdoor air fraction (OAF) for the 4-ton unit (004-1296) was 32.9 +/- 5.6% at the following conditions: Tm=66.2F, Tr=58.8F, To=81.3F. The uncertainty was calculated using the Engineering Equation Solver (Figure 8). There was a 1/3” gap between economizer and sheet metal cabinet causing excessive unintended perimeter leakage. The economizer hood was removed and water-proof tape was installed to seal the 1/3” gap around the economizer perimeter. With economizer perimeter sealed and hood re-installed, the measured OAF was 24.6 +/- 5.1% at the following conditions: Tm=67.1F, Tr=61.0F, To=85.8F (Figure 9).
DNV GL – www.dnvgl.com 4/1/16 Page I-10
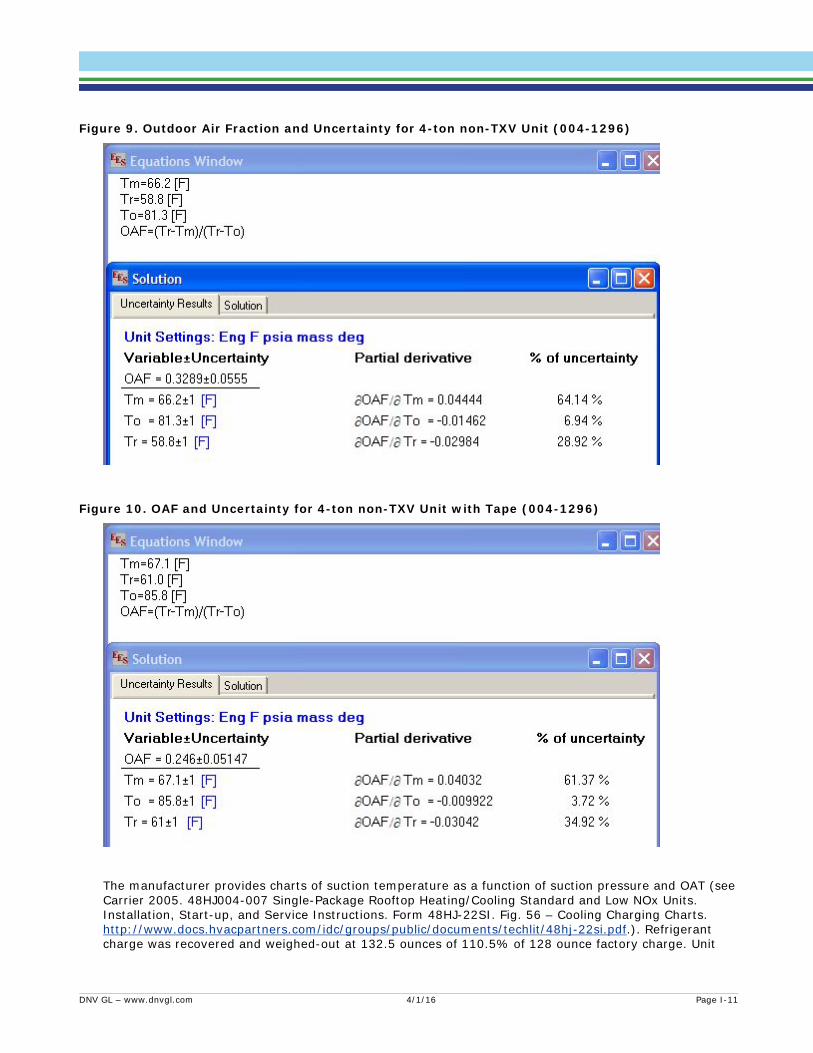
Figure 9. Outdoor Air Fraction and Uncertainty for 4-ton non-TXV Unit (004-1296)
Figure 10. OAF and Uncertainty for 4-ton non-TXV Unit with Tape (004-1296)
The manufacturer provides charts of suction temperature as a function of suction pressure and OAT (see
Carrier 2005. 48HJ004-007 Single-Package Rooftop Heating/Cooling Standard and Low NOx Units. Installation, Start-up, and Service Instructions. Form 48HJ-22SI. Fig. 56 – Cooling Charging Charts. http://www.docs.hvacpartners.com/idc/groups/public/documents/techlit/48hj-22si.pdf.). Refrigerant charge was recovered and weighed-out at 132.5 ounces of 110.5% of 128 ounce factory charge. Unit
DNV GL – www.dnvgl.com 4/1/16 Page I-11
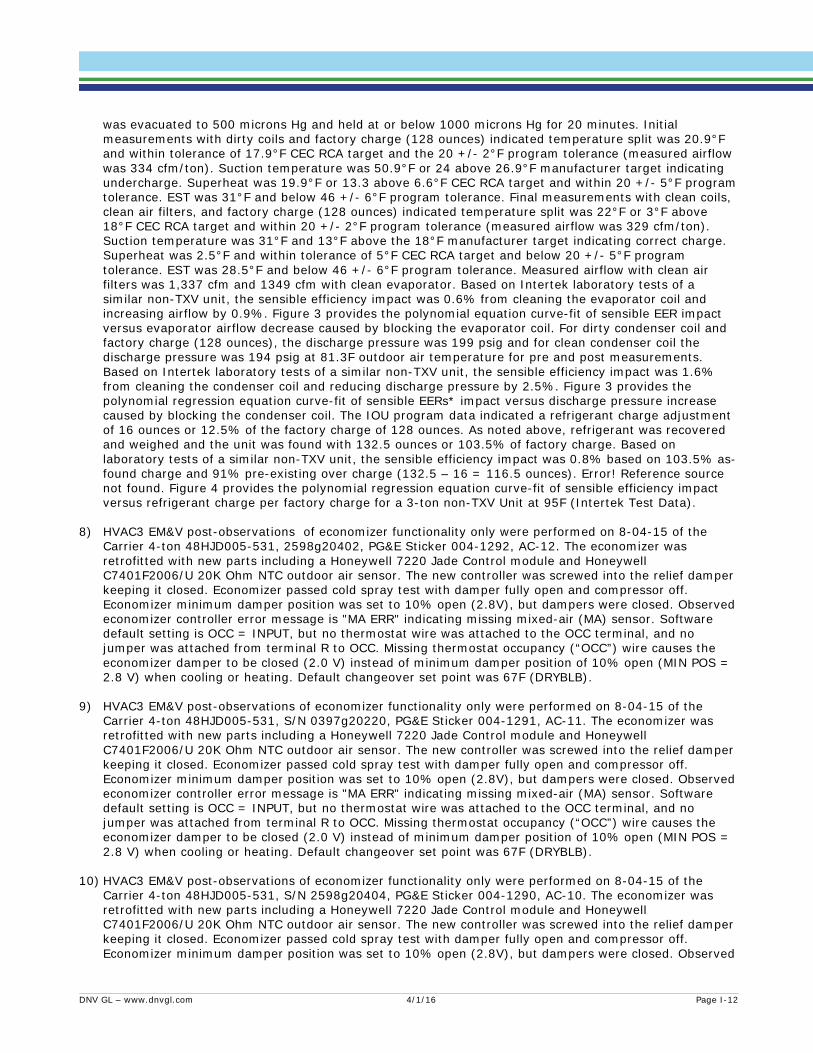
was evacuated to 500 microns Hg and held at or below 1000 microns Hg for 20 minutes. Initial measurements with dirty coils and factory charge (128 ounces) indicated temperature split was 20.9°F and within tolerance of 17.9°F CEC RCA target and the 20 +/- 2°F program tolerance (measured airflow was 334 cfm/ton). Suction temperature was 50.9°F or 24 above 26.9°F manufacturer target indicating undercharge. Superheat was 19.9°F or 13.3 above 6.6°F CEC RCA target and within 20 +/- 5°F program tolerance. EST was 31°F and below 46 +/- 6°F program tolerance. Final measurements with clean coils, clean air filters, and factory charge (128 ounces) indicated temperature split was 22°F or 3°F above 18°F CEC RCA target and within 20 +/- 2°F program tolerance (measured airflow was 329 cfm/ton). Suction temperature was 31°F and 13°F above the 18°F manufacturer target indicating correct charge. Superheat was 2.5°F and within tolerance of 5°F CEC RCA target and below 20 +/- 5°F program tolerance. EST was 28.5°F and below 46 +/- 6°F program tolerance. Measured airflow with clean air filters was 1,337 cfm and 1349 cfm with clean evaporator. Based on Intertek laboratory tests of a similar non-TXV unit, the sensible efficiency impact was 0.6% from cleaning the evaporator coil and increasing airflow by 0.9%. Figure 3 provides the polynomial equation curve-fit of sensible EER impact versus evaporator airflow decrease caused by blocking the evaporator coil. For dirty condenser coil and factory charge (128 ounces), the discharge pressure was 199 psig and for clean condenser coil the discharge pressure was 194 psig at 81.3F outdoor air temperature for pre and post measurements. Based on Intertek laboratory tests of a similar non-TXV unit, the sensible efficiency impact was 1.6% from cleaning the condenser coil and reducing discharge pressure by 2.5%. Figure 3 provides the polynomial regression equation curve-fit of sensible EERs* impact versus discharge pressure increase caused by blocking the condenser coil. The IOU program data indicated a refrigerant charge adjustment of 16 ounces or 12.5% of the factory charge of 128 ounces. As noted above, refrigerant was recovered and weighed and the unit was found with 132.5 ounces or 103.5% of factory charge. Based on laboratory tests of a similar non-TXV unit, the sensible efficiency impact was 0.8% based on 103.5% as-found charge and 91% pre-existing over charge (132.5 – 16 = 116.5 ounces). Error! Reference source not found. Figure 4 provides the polynomial regression equation curve-fit of sensible efficiency impact versus refrigerant charge per factory charge for a 3-ton non-TXV Unit at 95F (Intertek Test Data).
8) HVAC3 EM&V post-observations of economizer functionality only were performed on 8-04-15 of the
Carrier 4-ton 48HJD005-531, 2598g20402, PG&E Sticker 004-1292, AC-12. The economizer was retrofitted with new parts including a Honeywell 7220 Jade Control module and Honeywell C7401F2006/U 20K Ohm NTC outdoor air sensor. The new controller was screwed into the relief damper keeping it closed. Economizer passed cold spray test with damper fully open and compressor off. Economizer minimum damper position was set to 10% open (2.8V), but dampers were closed. Observed economizer controller error message is "MA ERR" indicating missing mixed-air (MA) sensor. Software default setting is OCC = INPUT, but no thermostat wire was attached to the OCC terminal, and no jumper was attached from terminal R to OCC. Missing thermostat occupancy (“OCC”) wire causes the economizer damper to be closed (2.0 V) instead of minimum damper position of 10% open (MIN POS = 2.8 V) when cooling or heating. Default changeover set point was 67F (DRYBLB).
9) HVAC3 EM&V post-observations of economizer functionality only were performed on 8-04-15 of the
Carrier 4-ton 48HJD005-531, S/N 0397g20220, PG&E Sticker 004-1291, AC-11. The economizer was retrofitted with new parts including a Honeywell 7220 Jade Control module and Honeywell C7401F2006/U 20K Ohm NTC outdoor air sensor. The new controller was screwed into the relief damper keeping it closed. Economizer passed cold spray test with damper fully open and compressor off. Economizer minimum damper position was set to 10% open (2.8V), but dampers were closed. Observed economizer controller error message is "MA ERR" indicating missing mixed-air (MA) sensor. Software default setting is OCC = INPUT, but no thermostat wire was attached to the OCC terminal, and no jumper was attached from terminal R to OCC. Missing thermostat occupancy (“OCC”) wire causes the economizer damper to be closed (2.0 V) instead of minimum damper position of 10% open (MIN POS = 2.8 V) when cooling or heating. Default changeover set point was 67F (DRYBLB).
10) HVAC3 EM&V post-observations of economizer functionality only were performed on 8-04-15 of the
Carrier 4-ton 48HJD005-531, S/N 2598g20404, PG&E Sticker 004-1290, AC-10. The economizer was retrofitted with new parts including a Honeywell 7220 Jade Control module and Honeywell C7401F2006/U 20K Ohm NTC outdoor air sensor. The new controller was screwed into the relief damper keeping it closed. Economizer passed cold spray test with damper fully open and compressor off. Economizer minimum damper position was set to 10% open (2.8V), but dampers were closed. Observed
DNV GL – www.dnvgl.com 4/1/16 Page I-12

economizer controller error message is "MA ERR" indicating missing mixed-air (MA) sensor. Software default setting is OCC = INPUT, but no thermostat wire was attached to the OCC terminal, and no jumper was attached from terminal R to OCC. Missing thermostat occupancy (“OCC”) wire causes the economizer damper to be closed (2.0 V) instead of minimum damper position of 10% open (MIN POS = 2.8 V) when cooling or heating. Default changeover set point was 67F (DRYBLB).
11) HVAC3 EM&V post-observations of economizer functionality only were performed on 8-04-15 of the
Carrier 4-ton 48HJD005-531, S/N 1097g20363, PG&E Sticker 004-1298, AC -18. The economizer was retrofitted with new parts including a Honeywell 7220 Jade Control module and Honeywell C7401F2006/U 20K Ohm NTC outdoor air sensor. The new controller was screwed into the relief damper keeping it closed. Economizer passed cold spray test with damper fully open and compressor off. Economizer minimum damper position was set to 10% open (2.8V), but dampers were closed. Observed economizer controller error message is "MA ERR" indicating missing mixed-air (MA) sensor. Software default setting is OCC = INPUT, but no thermostat wire was attached to the OCC terminal, and no jumper was attached from terminal R to OCC. Missing thermostat occupancy (“OCC”) wire causes the economizer damper to be closed (2.0 V) instead of minimum damper position of 10% open (MIN POS = 2.8 V) when cooling or heating. Default changeover set point was 67F (DRYBLB).
The following observations from the same site were provided previously regarding digital economizer
retrofits reported as failed due to thermostat occupancy wire not connected to the OCC terminal. Recent HVAC3 observations indicated the economizers function without the OCC wire connected. Personal communication with Adrienne Thomle, Honeywell, on 08-04-15 indicated the missing OCC wire only impacts minimum damper position (dampers stay closed without OCC wire connected). Economizer dampers opened and compressor was locked out with Y1 energized and outdoor air temperature below the 67F default changeover setting. These findings are important for ex post observations of economizers in IOU programs with significant economizer savings claims (i.e., PG&E ACP, PG&E statewide, and SCE statewide programs).
13) WO32 EM&V post-observations were performed on 11-05-13 and 11-06-13 of the Bryant 12.5-ton
581BEV150224AEAA, S/N 0600G30800, PG&E Sticker 004 2203, AC MPS. The economizer was retrofitted with new parts including a Honeywell 7220 Jade Control module, Honeywell C7250A1001 mixed air sensor, and Honeywell C7401F2006/U outdoor air sensors. Cold spray caused damper to open and compressors to stop operating indicating economizer is functional. Economizer minimum damper position was set to 10% open (2.8V). Economizer dampers on tested units were closed due to ground (“GND”) and thermostat occupancy (“OCC”) wires not being attached to controller. Default setting is “OCC” so economizer damper does not return to minimum closed position when cooling (“OCC/E-GND” input wires). There was a 1/3” gap between economizer and sheet metal cabinet causing excessive unintended perimeter leakage. Condenser and evaporator coils were cleaned. Customer paid for technician to straighten condenser coil fins that were previously vandalized. Air filters were changed three months prior to site visit (dated 8/29/13). The 5-AMP fuse tripped off after 5-10 minutes of operation, and insufficient time was available to trouble-shoot the problem.
14) EM&V post-observations were performed on 11-05-13 and 11-06-13 of the Bryant 8.5-ton
581BEV102125ADPA, S/N 0600G30283, PG&E Sticker 004 2202, AC 30. The economizer was retrofitted with new parts including a Honeywell 7220 Jade Control module, Honeywell C7250A1001 mixed air sensor, and Honeywell C7401F2006/U outdoor air sensors. Cold spray caused damper to open and compressors to stop operating indicating economizer is functional. Economizer dampers were set to 10% open (2.8V). Economizer dampers on tested units were closed due to missing ground (“GND”) and thermostat occupancy (“OCC”) wire attached. Default setting is “OCC” so economizer damper does not return to minimum closed position when cooling (“OCC/E-GND” input wires). There was a 1/3” gap between economizer and sheet metal cabinet causing excessive unintended perimeter leakage. Condenser and evaporator coils were cleaned. Air filters were changed three months prior to site visit (dated 8/29/13). Air filters on top rack of unit incorrectly installed and fallen out. Customer paid for technician to straighten condenser coil fins that were previously vandalized. Fan belt tension was too tight and misaligned by 3/16 inch.
DNV GL – www.dnvgl.com 4/1/16 Page I-13

DATA COLLECTION METHODS AND GUIDES Appendix J.This appendix includes field guides for the economizer and RCA measures, followed by field forms.
ECONOMIZER GUIDE
Economizer Definitions, Sequence of Operation, Testing Procedures, Rules of Thumb, Wiring Diagrams
Definitions
Economizer - There are a few different types of economizers. Sensible economizers are controlled by the temperature of the air and provide sensors to measure the outside air temperature, return air temperature and the mixed air temperature. Enthalpy economizers operate similarly, except they respond to enthalpy (i.e. the total amount of heat in the air) instead of temperature. The working components of an economizer consist of an outside air damper, a return air damper, an electronic controller, sensors and a sheet metal frame. We almost always see relief dampers; often we see a relief fan or a remote air damper that exhausts the building air during economizer operation. Better quality economizers have two outside air dampers – a smaller one sized to admit the amount of outside air required during occupancy (roughly 20 – 30% of the total system CFM) and a larger damper used in economizer operation and capable of admitting the full CFM of the fan. The economizer modulates exhaust air, return air, and outside air dampers to maintain the mixed air temperature at its set point (around 60ºF.) The action of the outside air damper and relief damper, if there is one, should always be opposite that of the return air damper (dampers are usually linked to work simultaneously but in opposition). When the outside air is cool enough to cool the building (~60ºF or less) and there is a call for cooling, the economizer is energized and modulates the outside air damper (and any relief damper) open and the return air damper closed. If the system uses a relief fan, it should start. As the outside temperature increases above what is required to cool the building, the outside air damper and relief damper modulate closed and the return damper modulates open. In dual enthalpy economizers, the enthalpy of the return air is compared to the enthalpy of the outside air. These sensors are often mounted to the sheet metal air intake. (Note: enthalpy is the total heat content of the air). When the enthalpy of the outside air is lower than that of the return air, the economizer cycle is actuated just as the sensible economizer described above is actuated when the outdoor temperature is cool. The big advantage of the enthalpy economizer is that it takes into account the humidity in the air when deciding if outside air is adequate to cool the building. This can increase economizer savings an additional 10-15% when compared to a sensible economizer.
Minimum Outside Air (OA) – A building requires fresh air for people to feel energized and be healthy. Commonly the OA is set to 5-20 cfm/person. An office should provide 15 cfm/person. This is
DNV GL – www.dnvgl.com 4/1/16 Page J-1

designated by ASHRAE. In my experience I see many buildings that are over-ventilated, meaning there is too much outside air. However conference rooms are often under-ventilated, making meetings feel long and attendees drowsy. An economizer should never fully close unless there is no call for conditioned air. Therefore the minimum position of the dampers should not be 100% closed; rather, it should be designed to provide 5-20 cfm/person depending on the space type (e.g.: 5 cfm/person for a prison, 20 cfm/person for a gym).
Demand Controlled Ventilation (DCV) – In some cases the unit will be controlled by DCV. A CO2 sensor in the space measures carbon dioxide output from humans and sends a signal to increase or decrease OA. A typical level for OA CO2 is ~400 parts per million (PPM). HVAC engineers usually set the controls to accept anywhere from 700 to 1000 PPM. So a room full of people will quickly reach 1,000 PPM and the economizer will open to provide OA. However while the concentration is less than 700 PPM, the OA will reduce to minimum to conserve energy. Concentrations of CO2 above 1,000 PPM cause people to feel drowsy and the room to seem “stuffy” and even humid.
Economizer sensors – These are primarily enthalpy or temperature. There is also a dry bulb snap disc sensor that is prone to failure. Snap disc sensors measure dry bulb temperature only, and usually just change state around 55˚F. In a “good” installation the snap disk sensor has been removed and replaced with more sophisticated sensors. When the OA temperature is below 45-50˚F all economizers will receive a low-limit signal to shut the OA damper to protect the evaporator coil from freezing. An economizer is considered integrated if the sensor is located in the mixed air plenum and non-integrated if the sensor is downstream of the coil. If the economizer is controlled by dual enthalpy or dual temperature sensors then it will only engage when the difference between the OA and return air indicates the need.
Building Automation System – These can go by many names - BAS, Energy Management System,
Building Management System, and so on. A BAS has a good amount of monitoring and control of the units. If you are working on one of these you can request the facilities manager to tell the unit to operate the economizer and the testing will be easier. However if you want to jump one be very careful as they are sensitive. That being said, they operate with relays and transistors like the rest of the unit so carefully find the relays that send power to G, Y, R, etc. and just them with 24VAC. Just be careful as they are sensitive. You can also get screen shots or printouts of the set points as can be seen below. This is very handy, especially on more sophisticated buildings.
DNV GL – www.dnvgl.com 4/1/16 Page J-2
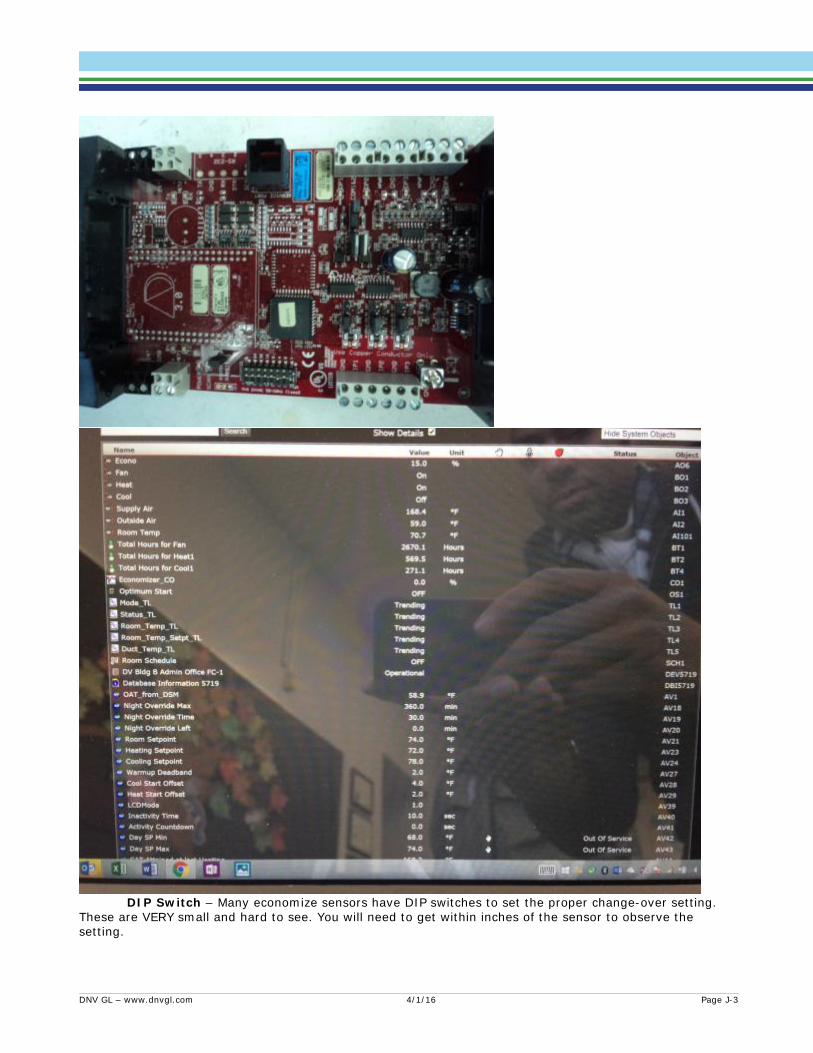
DIP Switch – Many economize sensors have DIP switches to set the proper change-over setting.
These are VERY small and hard to see. You will need to get within inches of the sensor to observe the setting.
DNV GL – www.dnvgl.com 4/1/16 Page J-3
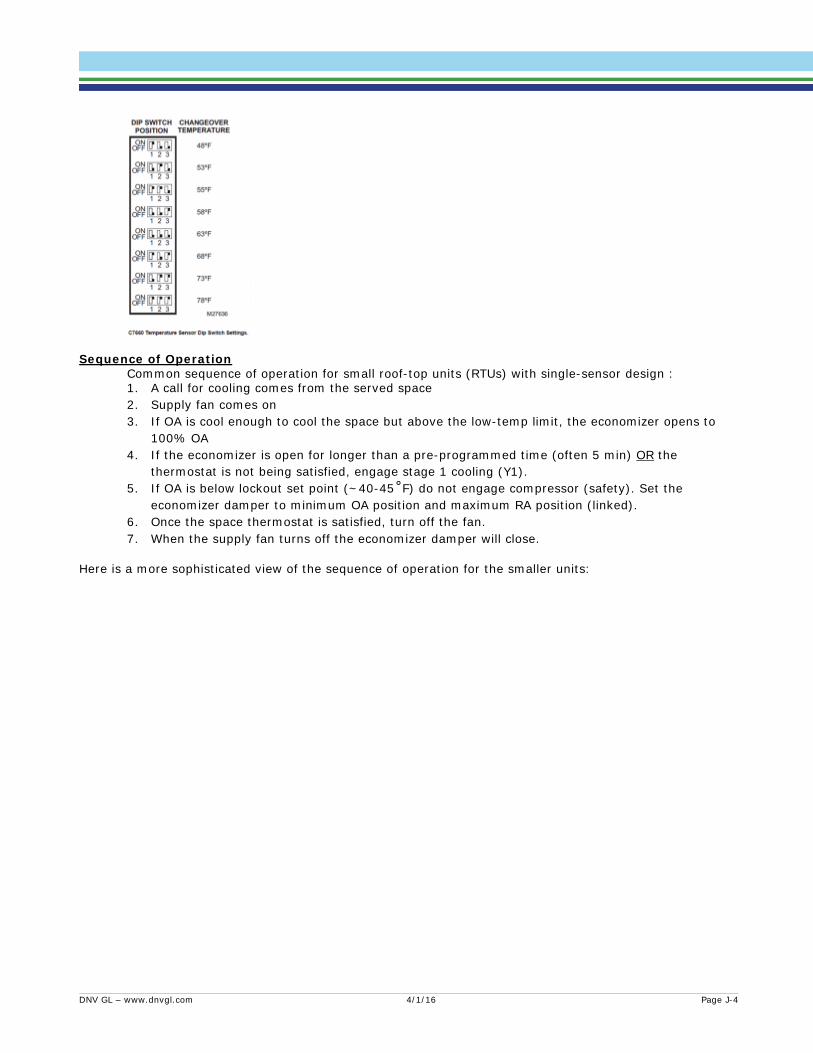
Sequence of Operation
Common sequence of operation for small roof-top units (RTUs) with single-sensor design : 1. A call for cooling comes from the served space 2. Supply fan comes on 3. If OA is cool enough to cool the space but above the low-temp limit, the economizer opens to
100% OA 4. If the economizer is open for longer than a pre-programmed time (often 5 min) OR the
thermostat is not being satisfied, engage stage 1 cooling (Y1). 5. If OA is below lockout set point (~40-45˚F) do not engage compressor (safety). Set the
economizer damper to minimum OA position and maximum RA position (linked). 6. Once the space thermostat is satisfied, turn off the fan. 7. When the supply fan turns off the economizer damper will close.
Here is a more sophisticated view of the sequence of operation for the smaller units:
DNV GL – www.dnvgl.com 4/1/16 Page J-4

Economizer Testing Procedure
The following steps will cover the vast majority of the scenarios you should find. Please note which step you were able to confirm. Step 1: Find the unit and record the manufacturer, serial and model numbers, and other data specified on the sheet. In all cases below you must note the “As Found” condition (sensor positions, A-B-C-D, damper conditions, etc.) and make sure you put them back as found even if they don’t seem to make sense. Our role is not to commission the units and perhaps they have been specially tuned to where they are. Never assume the economizer is just broken or that the setup is not correct.
a. Gain access to the unit.
DNV GL – www.dnvgl.com 4/1/16 Page J-5
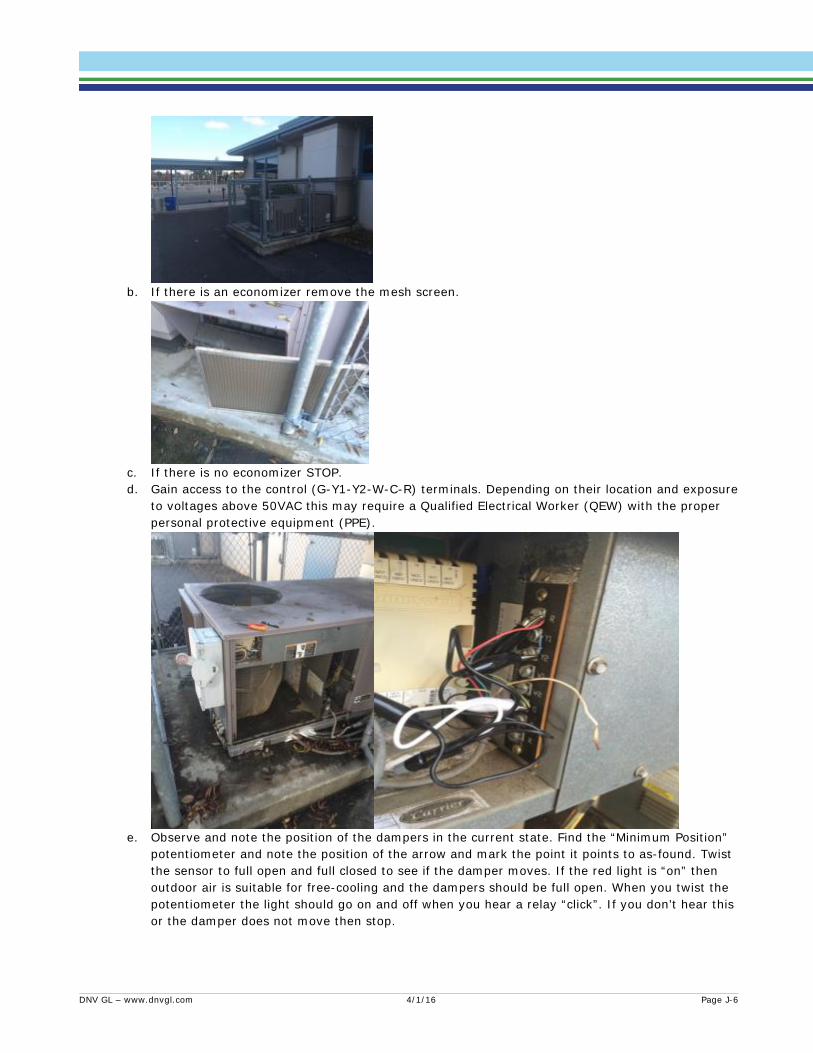
b. If there is an economizer remove the mesh screen.
c. If there is no economizer STOP. d. Gain access to the control (G-Y1-Y2-W-C-R) terminals. Depending on their location and exposure
to voltages above 50VAC this may require a Qualified Electrical Worker (QEW) with the proper personal protective equipment (PPE).
e. Observe and note the position of the dampers in the current state. Find the “Minimum Position”
potentiometer and note the position of the arrow and mark the point it points to as-found. Twist the sensor to full open and full closed to see if the damper moves. If the red light is “on” then outdoor air is suitable for free-cooling and the dampers should be full open. When you twist the potentiometer the light should go on and off when you hear a relay “click”. If you don’t hear this or the damper does not move then stop.
DNV GL – www.dnvgl.com 4/1/16 Page J-6
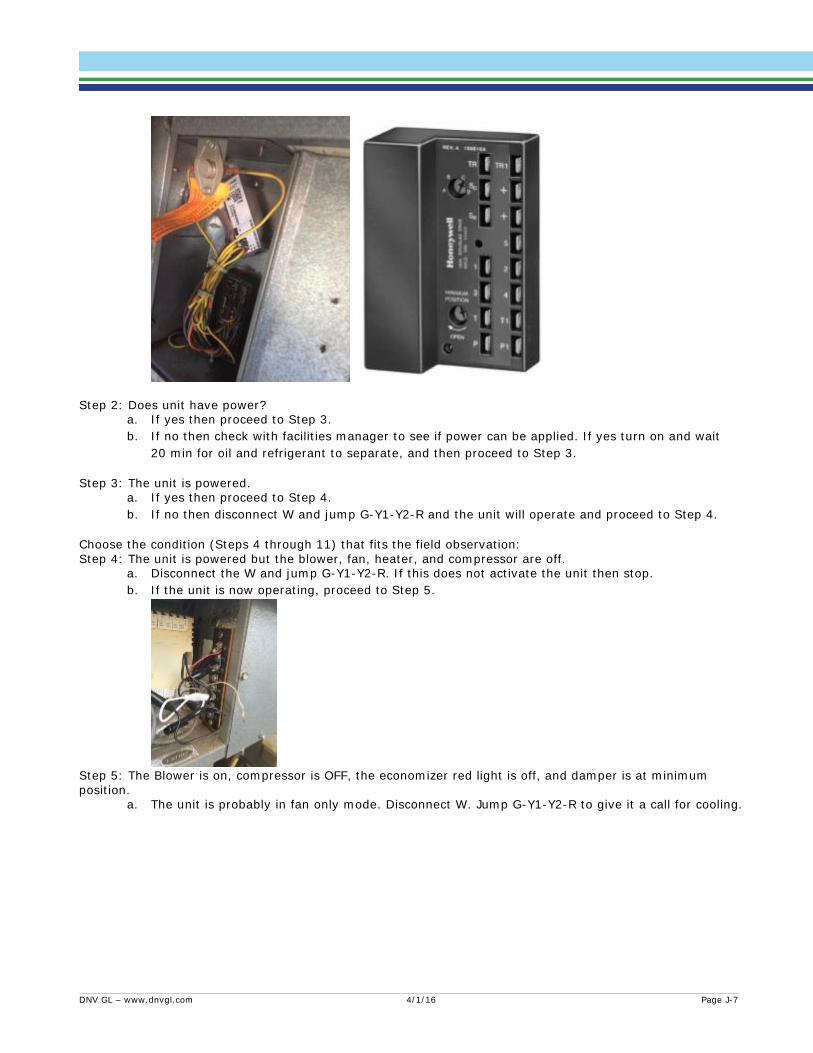
Step 2: Does unit have power?
a. If yes then proceed to Step 3. b. If no then check with facilities manager to see if power can be applied. If yes turn on and wait
20 min for oil and refrigerant to separate, and then proceed to Step 3.
Step 3: The unit is powered. a. If yes then proceed to Step 4. b. If no then disconnect W and jump G-Y1-Y2-R and the unit will operate and proceed to Step 4.
Choose the condition (Steps 4 through 11) that fits the field observation: Step 4: The unit is powered but the blower, fan, heater, and compressor are off.
a. Disconnect the W and jump G-Y1-Y2-R. If this does not activate the unit then stop. b. If the unit is now operating, proceed to Step 5.
Step 5: The Blower is on, compressor is OFF, the economizer red light is off, and damper is at minimum position.
a. The unit is probably in fan only mode. Disconnect W. Jump G-Y1-Y2-R to give it a call for cooling.
DNV GL – www.dnvgl.com 4/1/16 Page J-7
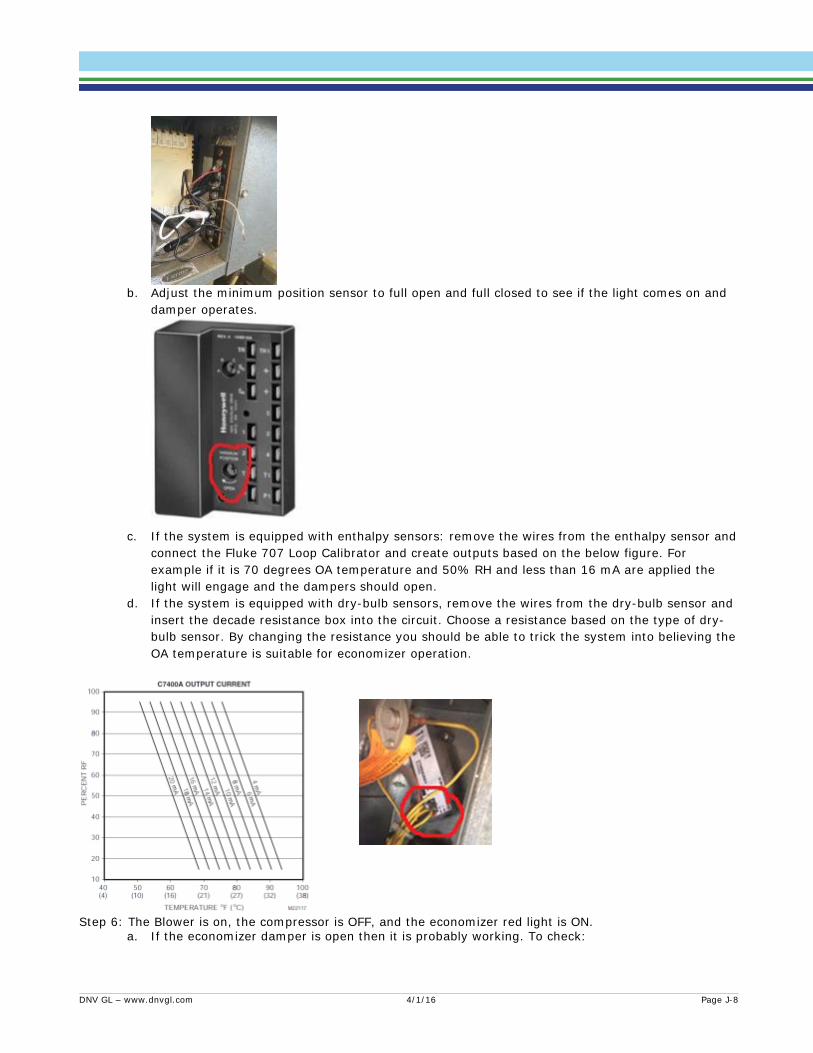
b. Adjust the minimum position sensor to full open and full closed to see if the light comes on and
damper operates.
c. If the system is equipped with enthalpy sensors: remove the wires from the enthalpy sensor and
connect the Fluke 707 Loop Calibrator and create outputs based on the below figure. For example if it is 70 degrees OA temperature and 50% RH and less than 16 mA are applied the light will engage and the dampers should open.
d. If the system is equipped with dry-bulb sensors, remove the wires from the dry-bulb sensor and insert the decade resistance box into the circuit. Choose a resistance based on the type of dry-bulb sensor. By changing the resistance you should be able to trick the system into believing the OA temperature is suitable for economizer operation.
Step 6: The Blower is on, the compressor is OFF, and the economizer red light is ON.
a. If the economizer damper is open then it is probably working. To check:
DNV GL – www.dnvgl.com 4/1/16 Page J-8

i. For Enthalpy systems: disconnect the enthalpy sensor and attach the Fluke 707
Loop Calibrator. Reference Step c for testing procedure. For Temperature systems: disconnect the DB sensor and attach the resistance decade box. Reference Step 5 d for testing procedure.
ii. If the test is successful the unit is working correctly. b. If the damper is closed then something is wrong; the red light should be off. There is no
further need to test. However, check the control arms by wiggling a bit and observing if the actuator arms or damper blades are rusted, frozen in place, or disconnected.
Step 7: The Blower is on, compressor is on, the economizer red light is on, and damper is at minimum position.
a. This is not correct because if the light is on the OA is suitable for free cooling and the dampers should be open.
b. To test: a. Check the control arms by wiggling a bit and observing if the actuator arms or damper
blades are rusted, frozen in place, or disconnected. b. Adjust the minimum position sensor to ensure the damper is functioning. c. Use either Step 5 c or 5 d to make sure the sensor is “talking” to the economizer damper
accurately. d. There is a good chance none of these worked because the unit is malfunctioning.
Step 8: The Blower is on, 1 of 2 compressors are on, the economizer red light is off, and damper is at minimum position.
a. Adjust the minimum position sensor to full open and full closed to see if the light comes on and damper operates.
b. Adjust the A-B-C-D change over sensor to A. The red light should come on and the compressor should turn off, and the damper should modulate to open. If this happens then all is well.
c. Adjust the A-B-C-D change over sensor to A. If the red light does not turn on and therefore the dampers don’t open then the conditions are probably not acceptable for free cooling or the enthalpy sensor has failed. Replace the enthalpy sensor with the Fluke 707 Loop Calibrator and use Step 5c to test. If it works then the enthalpy sensor has failed. If it does not work then something more serious is wrong.
Step 9: The Blower is on, all compressors are on (stages 1, 2), the economizer red light is off, and damper is at minimum position.
a. This is correct. Full cooling should result in the light off and damper closed. b. To test the full functionality:
a. Adjust the minimum position sensor to full open and full closed to see if the light comes on and damper operates.
b. See step 5c.
Step 10: The Blower is on, compressor is OFF, the economizer red light is off, and damper is at minimum position.
a. This is correct and unit could be in fan only mode. b. Jump G-Y1-Y2-R to give it a call for cooling. c. To test the full functionality:
a. Adjust the minimum position sensor to full open and full closed to see if the light comes on and damper operates.
b. See step 5c. a. If you don’t have the Fluke 707 Loop Calibrator then Adjust the A-B-C-D change-over
sensor to A. The red light should come on and the compressor should turn off, and the damper should modulate to open. If this happens then all is well.
DNV GL – www.dnvgl.com 4/1/16 Page J-9

c. Adjust the A-B-C-D change-over sensor to A. If the red light does not turn on and
therefore the dampers don’t open then the conditions are probably not acceptable for free cooling or the enthalpy sensor has failed.
Step 11: If everything appears to be working but the sensor is not giving you the results you want and you want to test the functionality of the sensor:
a. Using the chart in the below figure, determine where the current outdoor conditions are compared to the curves labeled A, B, C & D.
b. Slowly adjust the change-over setting and observe where in the A, B, C, D range the controller switched.
c. If the unit is in heating mode the economizer will be in minimum position.
d. Look for a mixed/discharge air sensor that will not let the economizer operate if it is not landed on the supply air (SA) terminal on the control board.
e. The snap disc sensor has overridden the unit to not allow the economizer to operate. The snap disc is often set around 55 degrees but once it gets dirty or old it can be much higher. For example a snap disk sensor could be dirty and not allow free cooling until the temperature is above 75 degree. There is not an easy way to verify if this sensor is ‘bad’. A simple jumper or 620 ohm resistor may override it.
f. Compare where the controller switches to the expected value from the below chart and judge if the controller changed over at the expected setting. If not, suspect a bad sensor.
Chart explanation: This chart is a generalization of what the A-B-C-D sensor is reading. For example, when cooling is requested if the sensor is set to D it will follow the D curve. So if the dry bulb temperature is 65 degrees, and the humidity is 30% the economizer should activate because it is to the left of the curve. However if it was 65 degrees and 50% humidity the economizer would be closed because it would be to the right of the curve. Any temperature above 75 degrees, with the sensor set to D, the economizer should be closed because it is always going to be right of the curve. Similarly, anything less than 50 degrees would
DNV GL – www.dnvgl.com 4/1/16 Page J-10
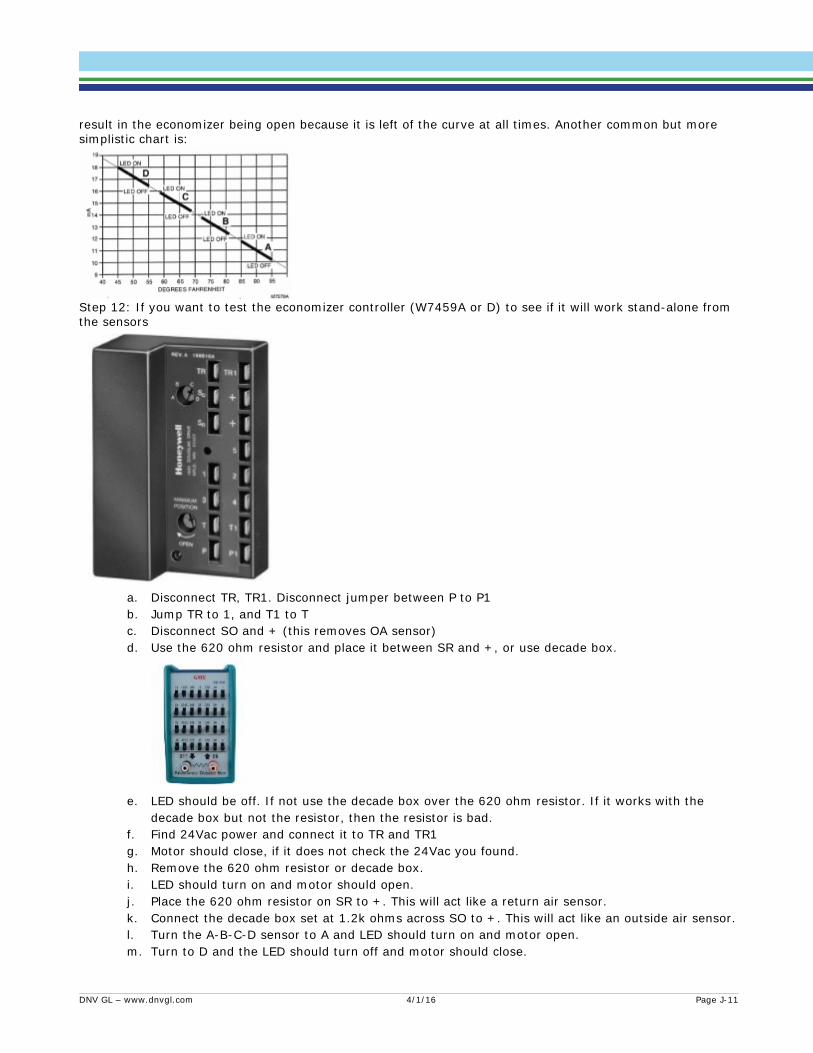
result in the economizer being open because it is left of the curve at all times. Another common but more simplistic chart is:
Step 12: If you want to test the economizer controller (W7459A or D) to see if it will work stand-alone from the sensors
a. Disconnect TR, TR1. Disconnect jumper between P to P1 b. Jump TR to 1, and T1 to T c. Disconnect SO and + (this removes OA sensor) d. Use the 620 ohm resistor and place it between SR and +, or use decade box.
e. LED should be off. If not use the decade box over the 620 ohm resistor. If it works with the
decade box but not the resistor, then the resistor is bad. f. Find 24Vac power and connect it to TR and TR1 g. Motor should close, if it does not check the 24Vac you found. h. Remove the 620 ohm resistor or decade box. i. LED should turn on and motor should open. j. Place the 620 ohm resistor on SR to +. This will act like a return air sensor. k. Connect the decade box set at 1.2k ohms across SO to +. This will act like an outside air sensor. l. Turn the A-B-C-D sensor to A and LED should turn on and motor open. m. Turn to D and the LED should turn off and motor should close.
DNV GL – www.dnvgl.com 4/1/16 Page J-11
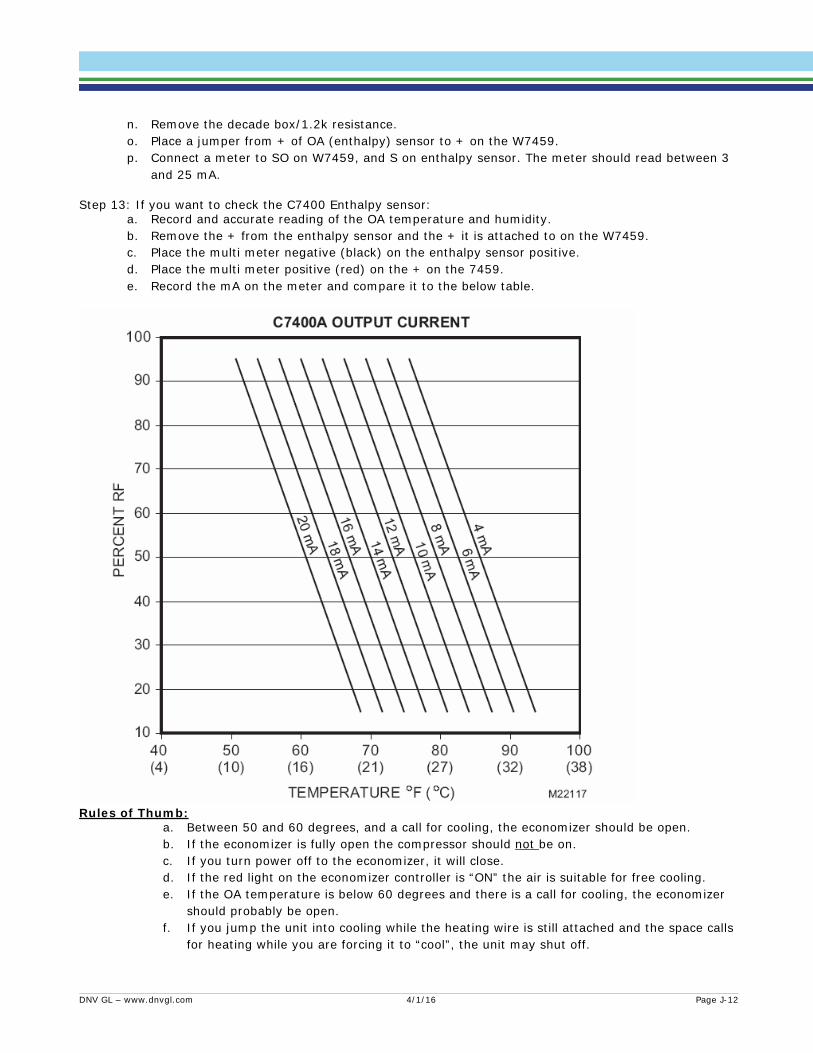
n. Remove the decade box/1.2k resistance. o. Place a jumper from + of OA (enthalpy) sensor to + on the W7459. p. Connect a meter to SO on W7459, and S on enthalpy sensor. The meter should read between 3
and 25 mA.
Step 13: If you want to check the C7400 Enthalpy sensor: a. Record and accurate reading of the OA temperature and humidity. b. Remove the + from the enthalpy sensor and the + it is attached to on the W7459. c. Place the multi meter negative (black) on the enthalpy sensor positive. d. Place the multi meter positive (red) on the + on the 7459. e. Record the mA on the meter and compare it to the below table.
Rules of Thumb:
a. Between 50 and 60 degrees, and a call for cooling, the economizer should be open. b. If the economizer is fully open the compressor should not be on. c. If you turn power off to the economizer, it will close. d. If the red light on the economizer controller is “ON” the air is suitable for free cooling. e. If the OA temperature is below 60 degrees and there is a call for cooling, the economizer
should probably be open. f. If you jump the unit into cooling while the heating wire is still attached and the space calls
for heating while you are forcing it to “cool”, the unit may shut off.
DNV GL – www.dnvgl.com 4/1/16 Page J-12
g. Here are the stages of how an economizer usually works:
a. When outside air conditions are very cold (~40 degrees): The unit is in the heating
mode. Mechanical cooling is off, economizer dampers are at minimum outside air position,
and the heating coil operates to maintain supply air temperature set point. If you are trying
to “cool” the snap disk may stop the economizer from working.
b. When outside air conditions are cold (~50 degrees): The unit is in economizer cooling
mode. The heating coil is off, mechanical cooling is off, and economizer dampers modulate
to maintain supply air temperature set point.
c. When outside air conditions are cool (~60 degrees): The unit is operating in
"integrated economizer" and mechanical cooling mode. Heating coil is off, economizer
dampers are at 100% open, and mechanical cooling operates to maintain supply air
temperature reset. Again this is integrated mode. Not-integrated means the OA air is used
until further cooling is needed and they shut and turn the compressors on.
d. When outside air conditions are hot: The unit is in mechanical cooling mode. The heating
coil is off, economizer dampers are at minimum outside air position, and mechanical cooling
operates to maintain supply air temperature set point.
Wiring Diagram for a W7459 Controller:
DNV GL – www.dnvgl.com 4/1/16 Page J-13

REFRIGERANT CHARGE GUIDE TO BENCHMARKS AND PROCEDURES Benchmarks (BM)
1. Vacuum for cleaning and leak testing recovery system components* ≤ 1000 Microns and steady hold 2. Vacuum on AC circuit required to complete recovery process ≤ 13 inches of mercury and steady 3. Vacuum on AC circuit required to verify leakage of AC circuit 750 microns or less and hold for 10
minutes, finish at ≤ 100 micron delta is a pass 4. Final recovery cylinder weight to match “Empty Weight” to demonstrate return of refrigerant to AC
circuit (*) recovery system components includes bottle, hoses, recovery machine
Procedure 1. Recover any leftover refrigerant from testing equipment. 2. Zero recovery scale on stable, level base and verify accuracy using a calibration weight. 3. Weigh recovery cylinder and record weight with connecting hose attached, record as “Empty Weight”. 4. Beginning of the day testing equipment clean out vacuum to ≤ 1000 Microns and verify steady hold
(BM #1). 5. Recover refrigerant from the AC refrigerant circuit until a vacuum at 13 inches of mercury or less (or
auto shutdown level of recovery equipment) is established (BM #2). 6. Apply heat to the base and end coils of the evaporator and condenser coils, the compressor, filters,
and any low points in the refrigeration system. Continue and/or restart recovery operation if the internal pressure has increased above 13 inches of mercury (some machines auto cycle in response to this)(BM#2). Continue until the process of heating no longer causes internal pressure changes. For recovery machines (RM) that contain a purge function, purge the RM so that all refrigerant is pushed into the connecting hose and cylinder side of the machine. For RM’s without a purge function, allow to operate until only trace vapor remains, then record measured weight change of RM (delta
DNV GL – www.dnvgl.com 4/1/16 Page J-14

weight RM under vacuum “clean” versus at step 7 “trace quantity”) and add trace quantity to measured amount in step 7.
7. Isolate the cylinder with connecting hose and record its weight as “Full Cylinder” weight. 8. Switch orientation of hoses at recovery machine for return pumping utilizing low-loss connectors,
always avoiding introduction of atmosphere. 9. Pull a vacuum on the AC refrigeration circuit until a minimum vacuum at 750 microns is established
(BM#3). Isolate the AC refrigeration circuit from the recovery/vacuum equipment and hold for 10 minutes. Record the starting and ending microns if ending microns is no more than 100 microns higher than starting. Repeat this step if greater delta occurs. After 3 times, and after connection troubleshooting efforts are exhausted, record results and note suspected reason(s) for failure.
10. Return recovered refrigerant back into AC refrigerant circuit until auto recovery equipment finishes the process, or the tank is at or near empty weight (non-automatic equipment). Purge recovery equipment if so equipped. Heat tank if necessary to ensure full refrigerant return.
11. Disconnect recovery cylinder with supply hose and weigh it, compare to empty weight measurement to assure that all refrigerant has been returned to the AC circuit.
12. For systems that contained less refrigerant than the recommended manufacturers charge, add an additional quantity of clean refrigerant back into the system equal to the estimated amount of refrigerant left in recovery system hoses (between recovery machine and AC refrigeration circuit). For systems that contained more than the manufacturers charge, no refrigerant should be added.
DNV GL – www.dnvgl.com 4/1/16 Page J-15
Ex Post Site Data Collection Form
Site Information
Start Time
Date
Site Name
Address
Site Address
City
Contractor
Site Contact 1
Technician 1
Site Contact 2
Technician 2
Building Type
Building Operating Hours
Notes:
DNV GL – www.dnvgl.com 4/1/16 Page J-16

Ex Post Site Data Collection Form
Page Three - Thermostat Settings
Unit Served:
Prgrmable Tstat Measure □ SF Fan Control □
Thermostat Location:
Period Name
Applicable Days and Times Cooling SP Heating SP On/Auto/Off
1
2
3
4
5
6
7
8
9
10
11
12
13
14
Unit Served:
Prgrmable Tstat Measure □ SF Fan Control □
Thermostat Location:
Period Name
Applicable Days and Times Cooling SP Heating SP On/Auto/Off
DNV GL – www.dnvgl.com 4/1/16 Page J-17
Ex Post Site Data Collection Form
1
2
3
4
5
6
7
8
9
10
11
12
13
14
DNV GL – www.dnvgl.com 4/1/16 Page J-18
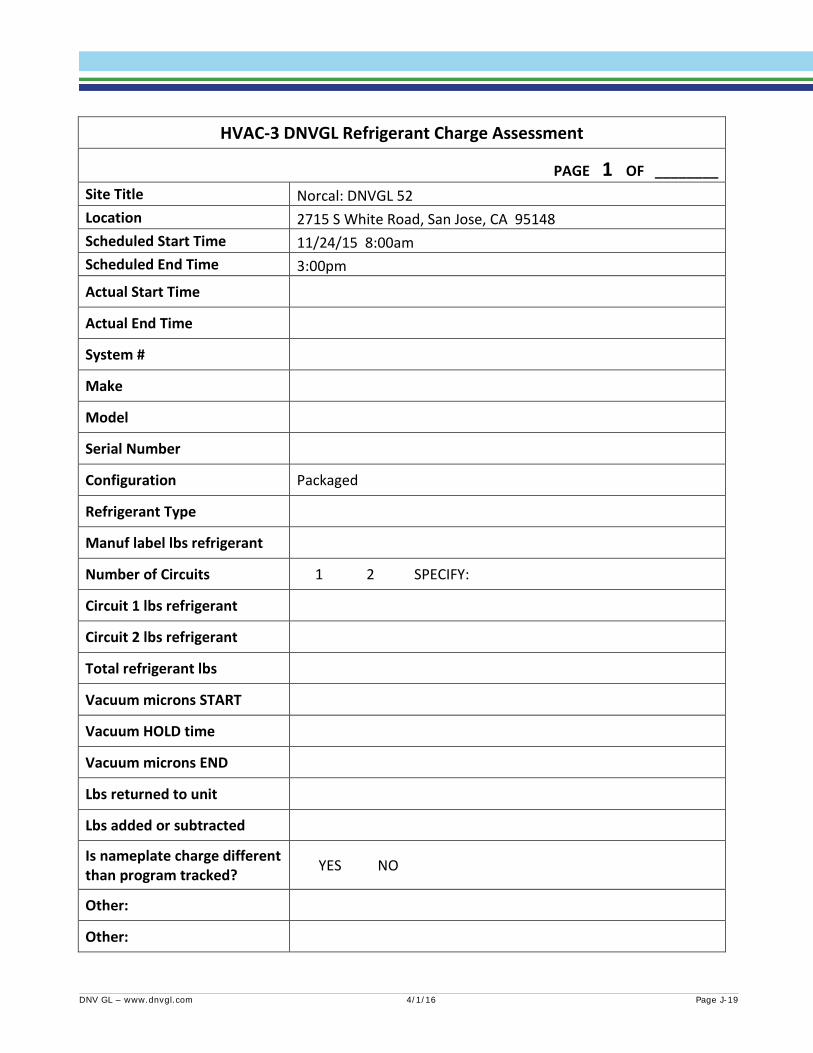
HVAC-3 DNVGL Refrigerant Charge Assessment
PAGE 1 OF ________ Site Title Norcal: DNVGL 52 Location 2715 S White Road, San Jose, CA 95148 Scheduled Start Time 11/24/15 8:00am Scheduled End Time 3:00pm
Actual Start Time
Actual End Time
System #
Make
Model
Serial Number
Configuration Packaged
Refrigerant Type
Manuf label lbs refrigerant
Number of Circuits 1 2 SPECIFY:
Circuit 1 lbs refrigerant
Circuit 2 lbs refrigerant
Total refrigerant lbs
Vacuum microns START
Vacuum HOLD time
Vacuum microns END
Lbs returned to unit
Lbs added or subtracted Is nameplate charge different than program tracked? YES NO
Other:
Other:
DNV GL – www.dnvgl.com 4/1/16 Page J-19
HVAC-3 DNVGL Refrigerant Charge Assessment
PAGE 1 OF ________ Notes:
DNV GL – www.dnvgl.com 4/1/16 Page J-20
HVAC SYSTEM FUNDAMENTALS & SYSTEM Appendix K.FAULTS
HVAC Fundamentals Utility QM programs focus primarily on unitary HVAC systems serving commercial and residential buildings. These systems mostly share common attributes, even though some variation exists due to a unit’s size and its application. Three components account for the bulk of HVAC-system electricity consumption: 1) compressor, 2) condenser fan, and 3) evaporator fan.39 The compressor increases refrigerant pressure and temperature and circulates superheated vapor to the condenser where it is condensed to a liquid and sub-cooled through the condenser heat transfer coils and then circulates through the expansion device where the pressure is reduced causing the liquid to further cool and it enters the evaporator coil as cold refrigerant. The condenser fan moves outdoor air through the condenser coil to reject heat from the refrigeration system that has been absorbed from the building return air and outdoor air mixture. The evaporator blower fan moves mixed air made up of return air from the conditioned space and outdoor air (required to meet ASHRAE 62.1 outdoor air ventilation requirements) through the air handler where the air is cooled and dehumidified by passing through the evaporator coil (or heated by the heating coil) and supplied to the conditioned space. Compressors, condenser fans and evaporator blower fans operate simultaneously when the cooling system is operating without the economizer.40 The evaporator fan operates by itself in ventilation-only mode or when the economizer is operating properly in 1st-stage cooling mode (using only outdoor air to cool). The compressor and condenser fan operate simultaneously with the evaporator fan in 2nd-stage cooling (with economizer dampers closed, partially open, or fully open) to provide cooling and ventilation.
Individual unit power consumption typically peaks at the highest outdoor air temperatures. As a result, the number of individual units simultaneously operating across a region of the state also peaks. Consequently, peak HVAC electric consumption has high coincidence with the electricity grid’s system peak demand in California.
Aspects of the HVAC system that influence its energy consumption and peak power include:
• The amount and quality of refrigerant in the system; • Effectiveness of the heat exchangers including the evaporator coil, furnace heat exchanger and
condenser coil; • Outdoor airflow required to meet ventilation requirements; • Unintended outdoor airflow through the system (including unintended damper leakage, duct leakage,
cabinet leakage, and curb leakage); • Compressor operation, controls, and efficiency; • Indoor/outdoor fans, fan motors, controls, speed, sheaves, pulleys, belts, operation, and efficiency; • Electrical (contactors/capacitors) and control system operation and efficiency; • Furnace operation and efficiency; • Effectiveness and operation of the economizer, dampers, sensors, and controls; • Fault detection diagnostic (FDD) operation and controls; and
39 Controls account for a very small amount of electricity consumption. 40 Many commercial packaged units (greater than 5 tons cooling capacity) with multiple condenser fans will cycle off one or more condenser fans
when compressor is operating at low outdoor air temperatures to avoid low pressure cut-out or icing of the evaporator coil.
DNV GL – www.dnvgl.com 4/1/16 Page K-1
• Thermostat and/or Energy Management System (EMS) controls.
Tuning and maintaining these aspects will optimize the HVAC system’s operating efficiency with respect to meeting the space cooling and heating requirements. If the maintenance services increase the delivered system efficiency this will reduce the length of time the unit operates to achieve the thermostat set point. The maintenance services are intended to reduce the unit’s average annual energy consumption and coincident system peak demand.41 For units that are accidentally overcharged under the programs, the cooling capacity and compressor power can increase and operational time can decrease with no net energy savings. Annual energy consumption for a unit is determined by the operational cooling and heating efficiency and the cooling, heating, and ventilation requirements for that unit.
HVAC System Faults Maintenance and repair measures fundamentally seek to improve the various components described in this appendix. Utility programs include measures that seek to identify and repair a number or deficiencies or faults with existing HVAC units. Ideally, the repairs lead to optimized cooling efficiency that reduces runtime and/or power draw at the same conditions. When evaluating program measures using whole-building interval data and sub-metered data it can be difficult to separate the normal energy use variations that are present before and after maintenance from the faults corrected by the program. The previous WO32 EM&V study attempted to collect this kind of data for a representative sample of units receiving QM services in the IOU programs. Units included in the data logger sample did not receive many QM services offered in the programs to repair faults such as failed economizers, stuck-open dampers, suboptimal airflow, damaged/corroded coils, or other issues. Therefore, the WO32 sub-metered data found either no change in energy usage or increased energy usage. Whole-building interval data has not been demonstrated to evaluate energy savings from QM services since the estimated savings are less than 10% of total building energy usage.42
Considering this situation, direct methods to assess each system component are time consuming while alternative indirect diagnostic methods cannot disaggregate measure savings unless all other system changes are controlled. For example, using indirect diagnostics based on refrigerant pressures and temperatures to assess refrigerant charge amount requires that heat exchanger coils are clean, air filters are cleaned or replaced, system airflow is within design specification, and (for commercial units) outside air is accounted for in measuring return air conditions. The direct method to evaluate refrigerant charge measures is to recover the as-found refrigerant charge and weigh the amount on a digital scale. This evaluation focuses on direct methods, which are more expensive but allow for isolation of specific measure characteristics. Direct measurements are possible and very reliable for power input, refrigerant amount, return air temperature, supply air temperature, and outside air temperature. Direct measurements are possible but with notable uncertainty for mixed air temperature, all humidity43 and thus enthalpy readings, and airflow. In this evaluation, direct methods will be used wherever possible, and indirect methods will be
41 Under peak cooling conditions, a properly-sized and properly charged packaged unit might use more power to maintain the cooling set point than an undercharged unit that runs continuously but uses less power and cannot maintain the cooling set point on a hot day. This will typically not occur since most commercial packaged units are over-sized.
42 Page 146 of the California Evaluation Framework states the following. “Option C is limited to projects where the expected savings exceeds the metered energy consumption by at least 10% (footnote 142). Footnote 142 states the following. “10% is the minimum savings criterion established in ASHRAE Guideline 14. Depending on the variability of the data, a greater energy savings fraction may be required for a successful billing analysis.” According to the Federal Energy Management Program (FEMP) [Insert FEMP reference here], “Utility bill comparison is a very simple and, typically, an unreliable method.”
43 The issue measuring humidity is the time delay in the sensors. Temperature sensors, on the other hand, react almost immediately. When there is an abrupt change in humidity, the enthalpy will be incorrect until the humidity sensor stabilizes.
DNV GL – www.dnvgl.com 4/1/16 Page K-2
used where direct methods are unreliable. For instance, an indirect method to get outside air fraction is being considered because the direct method is unreliable due to the uneven profile of the mixed air temperature across the evaporator coil. The indirect method is to measure return, outside, and supply temperatures, air handler fan energy, and system airflow (with cooling coil not operating). The supply temperature with the compressor off is a well-mixed representation of the mixed air temperature once fan heat is accounted for. The outside air fraction is calculated knowing the total airflow and the temperatures of the mixed air (modified supply air temperature used as a proxy), return air and outside air.
DNV GL – www.dnvgl.com 4/1/16 Page K-3

HVAC5 LABORATORY METHODOLOGY Appendix L.This appendix presents the methodology used in the laboratory testing conducted by Robert Mowris and Associates under HVAC5, as part of the CPUC HVAC Roadmap.
6 LABORATORY TEST METHODS AND PLANS The laboratory test methods followed the ANSI/ASHRAE Standard 37.44 Intitial tests were performed to evaluate the “out-of-box” as-purchased performance with factory fan speed and refrigerant charge. After completing the initial tests, refrigerant was recovered into reclaim tanks, accurately weighed and each refrigerant circuit was evacuated below 500 microns of mercury (μHg) held at or below 1000 μHg for 30 minutes, before weighing in the factory refrigerant charge (ASHRAE 2010).45 In order to perform the AHRI standard test procedure, a number of changes were made to each unit including installing larger diameter supply fan pulleys on some units to achieve AHRI airflow and ESP requirements, sealing the cabinet to reduce leakage, adding insulation to the cabinet base, or modifying refrigerant charge to achieve published ratings. The AHRI verification tests were performed per ANSI/AHRI Standard 210/240 or 340/360 at standard rating conditions to verify each unit was within 95% of the published AHRI ratings for performance ratios and cooling capacities.46
After intial tests were performed, each unit was subsequently tested at non-standard application conditions to emulate typical field conditions in the State of California.47 Additional tests were performed on each unit with and without economizers installed and outdoor air damper positions varying from closed to fully open to evaluate proper ventilation to meet ASHRAE 62.1 and the impact of overventilation on application efficiency.48 Economizer tests were also performed with the gap between the economizer perimeter frame and cabinet sealed with tape to evaluate unintended outdoor air leakage. Tests were performed on each unit to evaluate the application energy efficiency impacts of HVAC maintenance faults by varying refrigerant charge from 60 to 140% of factory charge, evaporator blockage from 5 to 50%, condenser blockage from 5 to 80%, airflow from 65 to 110%, economizere damper positon with unsealed and sealed perimeter, restrictions, non-condensables, and multiple faults. After each unit was tested at non-standard conditions with single or multiple faults, it was necessary to re-establish factory conditions and the baseline. Re-establishing the baseline after multiple refrigerant charge additions or removals or non-condensables involves recovery of refrigerant
44 ANSI/ASHRAE Standard 37-2009. Methods of Testing for Rating Electrically Driven Unitary Air-Conditioning and Heat Pump Equipment.
45 ASHRAE. 2010. ASHRAE Handbook-Refrigeration. Page 8.2. Table 1. American Society of Heating Refrigeration and Air Conditioning Engineers, Inc. Carrier Corporation. 2010. Commercial Packaged Engineering Standard Work Procedure: System Evacuation and Dehydration. Carrier A United Technologies Company. JB 2007. Deep Vacuum: Its Principle and Application. JB Industries, Inc. www.jbind.com. 46
ANSI/AHRI Standard 210/240 or 340/360 rated conditions at steady-state operation were performed at OAT of 95ºF [35C] drybulb and return air temperature of 80ºF [26.7C] dry bulb and 67ºF [19.4C] wet bulb.
47 Non-standard application conditions at steady-state operation were performed at ambient OAT of 95F, 115F, 82F, and 55F drybulb and return air
temperature of 75F drybulb and 62F wetbulb.
48 ANSI/ASHRAE 2010. ANSI/ASHRAE 62.1-2010. Standard Ventilation for Acceptable Indoor Air Quality.
DNV GL – www.dnvgl.com 4/1/16 Page L-1
charge and evacuation to below 500 micron mercury (μHg) vacuum held at or below 1000 microns for 30 minutes and weighing in the factory charge (ASHRAE 2010).
The laboratory-based test results are reported using the “application efficiency” defined as the “application rating” in ANSI/AHRI 210/240 and ANSI/AHRI 340/360.49 The application energy efficiency ratio (EER*) is calculated as cooling capacity divided by total electric power. The application sensible energy efficiency ratio (EER*s) is calculated as the sensible cooling capacity divided by total electric power. The EER*s is reported to indicate how efficiently the unit operates based on sensible drybulb thermostat settings which control air conditioning operational time. The application field conditions include non-standard return/outdoor air temperatures and external static pressure conditions appropriate to California climate conditions and economizers installed with and without maintenance faults. Laboratory test results were also used to evaluate the accuracy of manuacturer and generic CEC refrigerant charge and ariflow FDD protocols under non-faulted and faulted test conditions they were not intended to diagnose. The laboratory tests results of FDD protocols are provided to understand the limitations of using refrigerant charge and airflow FDD protocols to perform comprehensive HVAC maintenance services. Laboratory tests were performed using the following test conditions.
Outdoor temperatures for HVAC maintenance fault tests (DB/WB): 82/62, 95/75, 115/80,50
Indoor temperatures for HVAC maintenance fault tests (DB/WB): 70/57, 75/62, 80/67,
Economizer outdoor temperature tests (DB/WB): 70/60, 65/57, 60/54, 55/51,51
Airflow (cfm/ton): 250, 300, 350, 400, 450 cfm/ton,52 and
External static pressure (IWC): 0.15 to 2.0.53
Initial test equipment set-up can take 24 to 48 hours and removal of equipment can take 12 to 24 hours. Some of the tests were driven by findings discovered during the course of testing. Thus, not all tests have been conducted across all tested units. The test equipment schematic for a single-compressor packaged unit is shown in Figure 1. Refrigerant-side pressure/temperature measurements are installed before the expansion device, evaporator outlet, compressor suction, compressor discharge and condenser outlet. Setup requires digitally-controlled precision louvered dampers installed on supply
49 Application ratings are based on tests performed at application conditions. Standard ratings are based on tests performed at standard rating
conditions including airflow and external static pressure at 95F OAT and 80F drybulb and 67F wetbulb return temperatures. ANSI/AHRI 340/360-2007 Standard for Performance Rating of Commercial and Industrial Unitary Air-Conditioning and Heat Pump Equipment. ANSI/AHRI 2008 Standard for Performance Rating of Unitary Air-Conditioning and Air-Source Heat Pump Equipment Standard 210/240.
50 Outdoor wetbulb temperatures are defined in the tests to measure the impact of economizer outdoor air leakage on total cooling capacity. 51 Economizer outdoor temperature test conditions are selected to measure system EER*s and cooling capacity without compressor operation and with 1st-stage and 2nd-stage operation (for multi-compressor systems). The tests are performed to evaluate change-over settings and performance based on outdoor air provided by economizers. 52 Airflow targets varied due to limitations of blower-drive system, motor, and external static pressure setup. 53 External static pressure for each test varied depending on speed (rpm), airflow (cfm), and horsepower of the blower-drive system. Test conditions were based on field data available in the “Small HVAC Problems and Potential Savings Reports,” October 2003, California Energy Commission 500-03-082-A-25. http://www.energy.ca.gov/2003publications/CEC-500-2003-082/CEC-500-2003-082-A-25.PDF.
DNV GL – www.dnvgl.com 4/1/16 Page L-2

and return ducts to control inlet static pressure (ISP) and external static pressure (ESP) similar to in-situ conditions. Controlling inlet and total static pressure provided realistic test conditions to measure performance when varying airflow, fan speed and economizer outdoor-air damper positions from closed to fully open.
Figure 20: Test Equipment Schematic
DNV GL – www.dnvgl.com 4/1/16 Page L-3
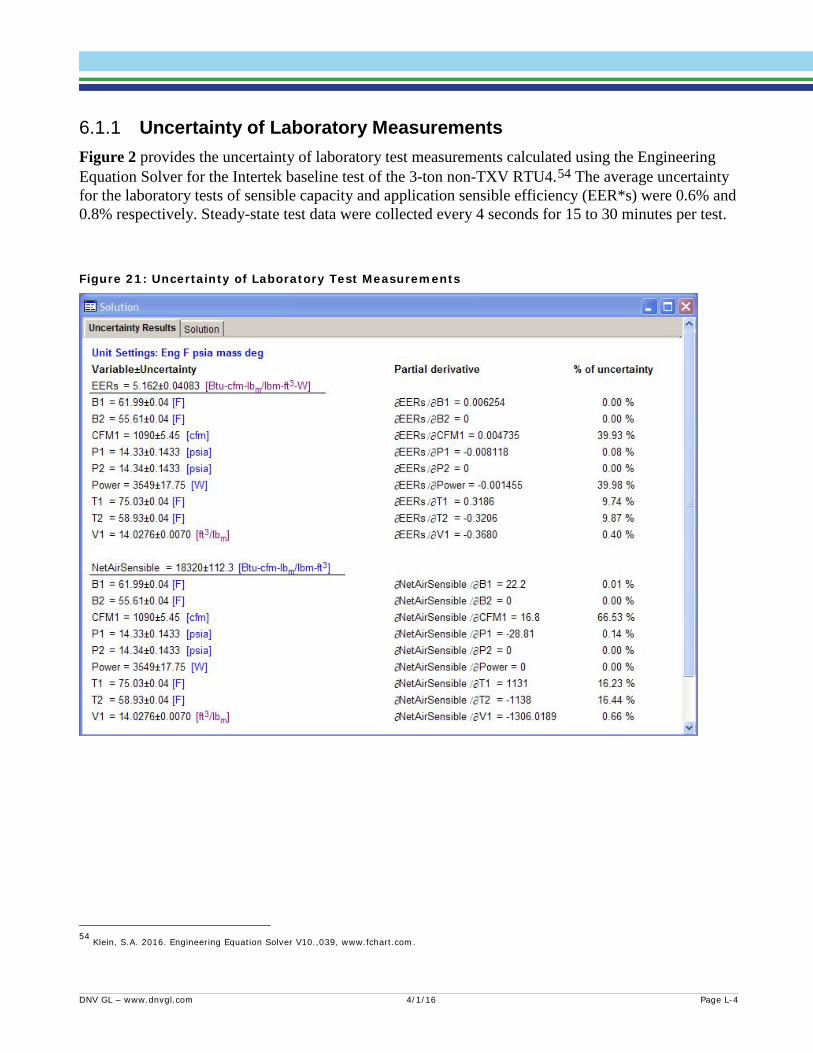
Uncertainty of Laboratory Measurements 6.1.1Figure 2 provides the uncertainty of laboratory test measurements calculated using the Engineering Equation Solver for the Intertek baseline test of the 3-ton non-TXV RTU4.54 The average uncertainty for the laboratory tests of sensible capacity and application sensible efficiency (EER*s) were 0.6% and 0.8% respectively. Steady-state test data were collected every 4 seconds for 15 to 30 minutes per test.
Figure 21: Uncertainty of Laboratory Test Measurements
54 Klein, S.A. 2016. Engineering Equation Solver V10.,039, www.fchart.com.
DNV GL – www.dnvgl.com 4/1/16 Page L-4

Table 4 through Table 8 provide the status of laboratory tests completed on the 7.5-ton non-TXV RTU3, 7.5-ton TXV RTU1 and RTU2, 3-ton non-TXV RTU5, and 3-ton TXV RTU4.
Table 55: Tests for Manufacturer #1 R-22 7.5-ton non-TXV, 2-Circuit (2 circuit) RTU3
Test Type Status Section Out-of-Box and Cycling Tests (1st-stage only and both compressors) Vertical Finished 4.1.1 Refrigerant Charge -20 to +60% (in 20% intervals) of factory charge (1st set of tests) Vertical Finished 4.1.8 Out-of-Box and Cycling Tests (1st-stage only and both compressors) Vertical Finished 4.1.1 Measurement Instruments (remainder were tested on horizontal setup) Vertical Finished 4.5 AHRI Verification Horiz. Finished 4.1.2 Manufacturer Refrigerant Charge Diagnostics Horiz/Vert Finished 4.1.3 Economizer Damper Leakage Tests at 55F (C, 1, 2, 3, O) Economizer #4 Horiz. Finished 4.1.4 Economizer Damper Tests at 95F (C, 1, 2, 3, O) Economizer #4 Horiz. Finished 4.1.5 Economizer 55 to 70F OAT, No-1-2-compressors Economizer #4 Horiz. Finished 4.1.6 Airflow 100%, 83%, 68% of 400 scfm/ton, at 82, 95, 115F closed & 1-finger open dampers Horiz. Finished 4.1.7 Restrictions: install service valve upstream of filter drier Horiz. Finished 4.1.11 Non-Condensables (0.33% nitrogen per factory charge) Horiz. Finished 4.1.12 Economizer Outdoor Airflow Damper Leakage Tests with and without perimeter tape (C, 1, 2, 3, O) at 55F OAT and no compressors (control ISP & ESP) Horiz. Finished 4.1.4 Economizer Damper at 95F OAT with and w/o perimeter tape (C, 1, 2, 3, O) (dampers control ISP & ESP) Horiz. Finished 4.1.5 Refrigerant Charge -40 to +40% (in 10% intervals) of factory charge at 95F OAT and 250, 330 (83% airflow) (control ISP & ESP) (2nd set of tests) Horiz. Finished 4.1.8 Evaporator Coil Blockage (30 to 50%) (supply/return dampers control ISP & ESP) reduce evaporator airflow by 8 to 18% Horiz. Finished 4.1.9 Condenser Coil Blockage (5 to 80%) (supply/return dampers control ISP & ESP) increase discharge pressure by 2 to 40% Horiz. Finished 4.1.10 Multiple Fault Tests low airflow, 2 finger-open damper, untaped economizer perimeter/gaps, 50% blocked coils, -10% refrigerant charge (control ISP & ESP) Horiz. Finished 4.1.13 Measurement Instruments and Refrigerant Hose Attach/Detach Tests Horiz. Partial 4.5
Table 56: Tests for Manufacturer #2 R-22 7.5-ton TXV 2-Circuit (2 compressor) RTU1
Test Type Status Section Out-of-Box 3HP fan Horiz. Finished 4.2.1 AHRI Verification 2HP fan Horiz. Finished 4.2.2
DNV GL – www.dnvgl.com 4/1/16 Page L-5

Table 57: Tests for Manufacturer #2 R-22 7.5-ton TXV, 2-Circuit (2 compressor) RTU2
Test Type Status Section Out-of-Box and Cycling Tests (both compressors) Horiz. Finished 4.2.1 AHRI Verification Horiz. Finished 4.2.2 Manufacturer Refrigerant Charge Diagnostics Horiz. Finished 4.2.3 Economizer Outdoor Airflow Damper Leakage Tests at 55F OAT with no compressors with and w/o perimeter tape (C, 1, 2, 3, O) (supply/return dampers control ISP & ESP) Economizer #0, #1, #2 Horiz. Finished 4.2.4 Economizer Damper at 95F OAT with and without perimeter tape (C, 1, 2, 3, O) (supply/return dampers control ISP & ESP) Economizer #1, #2 Horiz. Finished 4.2.5 Airflow Standard Static 2-hp Fan Motor 108%, 100%, 87%, 75%, 63% of 400 cfm/ton (dampers control ISP & ESP) Horiz. Finished 4.2.6 Airflow High Static 3-hp Fan Motor 100%, 88%, 80%, 76%, 63% of 400 cfm/ton (dampers control ISP & ESP) Horiz. Finished 4.2.6 Refrigerant Charge -40 to +40% (+/-5% or 10% intervals) of factory charge at 82F, 95F and 115F OAT and 250, 300, 350, 400 cfm/ton (control ISP & ESP) Horiz. Partial 4.2.7 Condenser Coil Blockage (5, 10, 20, 30, 40, 50, 60, 70, 80%) (supply/return dampers control ISP & ESP) increase discharge pressure by 2 to 33% Horiz. Finished 4.2.8 Evaporator Coil Blockage (base, 30 to 80%) (supply, return dampers to control ISP/ESP) decrease evaporator airflow by 8 to 18% Horiz. Finished 4.2.9 Restrictions (supply/return dampers control ISP & ESP) Multiple Fault Tests Horiz. Finished 4.2.10 Non-Condensables 0.25 to 1% nitrogen per factory charge both circuits (supply/return dampers control ISP & ESP) Multiple Fault Tests Horiz. Finished 4.2.11 Multiple Fault Tests (supply/return dampers control ISP & ESP) Horiz. Finished 4.2.12 Measurement Instruments and Refrigerant Hose Attach/Detach Tests Horiz. Partial 4.5.1
Table 58: Tests for Manufacturer #1 R-22 3-ton non-TXV 1-Circuit (1 compressor) RTU5
Test Type Status Section
Out-of-Box Horiz. Finished 0 AHRI Verification A, B, C and D Horiz. Finished 4.3.2 Manufacturer Refrigerant Charge Diagnostics Horiz. Finished 4.3.3 Economizer Outdoor Airflow Damper Leakage Tests with and without perimeter tape (C, 1, 2, 3, O) at 55F OAT and no compressors (supply/return dampers control ISP & ESP) Economizer #5 Horiz. Finished 4.3.4 Economizer Damper at 95F with and w/o perimeter tape (C, 1, 2, 3, O) (dampers control ISP & ESP) Economizer #5 Horiz. Finished 4.3.5 Refrigerant Charge -40 to +40% (+/-10% intervals) of factory charge at 82F, 95F and 115F OAT and 250 to 450 cfm/ton (supply/return dampers control ISP & ESP) Horiz. Partial 4.3.6 Evaporator Coil Blockage (30 to 80%) (supply/return dampers control ISP & ESP) reduce evaporator airflow by 1 to 13% Horiz. Finished 4.3.8 Condenser Coil Blockage (5 to 80%) (supply/return dampers control ISP & ESP) increase discharge pressure by 2 to 30% Horiz. Finished 4.3.7 Multiple Fault Tests (supply/return dampers control ISP & ESP) Horiz. Finished 4.3.9 Measurement Instruments and Refrigerant Hose Attach/Detach Tests Horiz. Partial 4.5
DNV GL – www.dnvgl.com 4/1/16 Page L-6
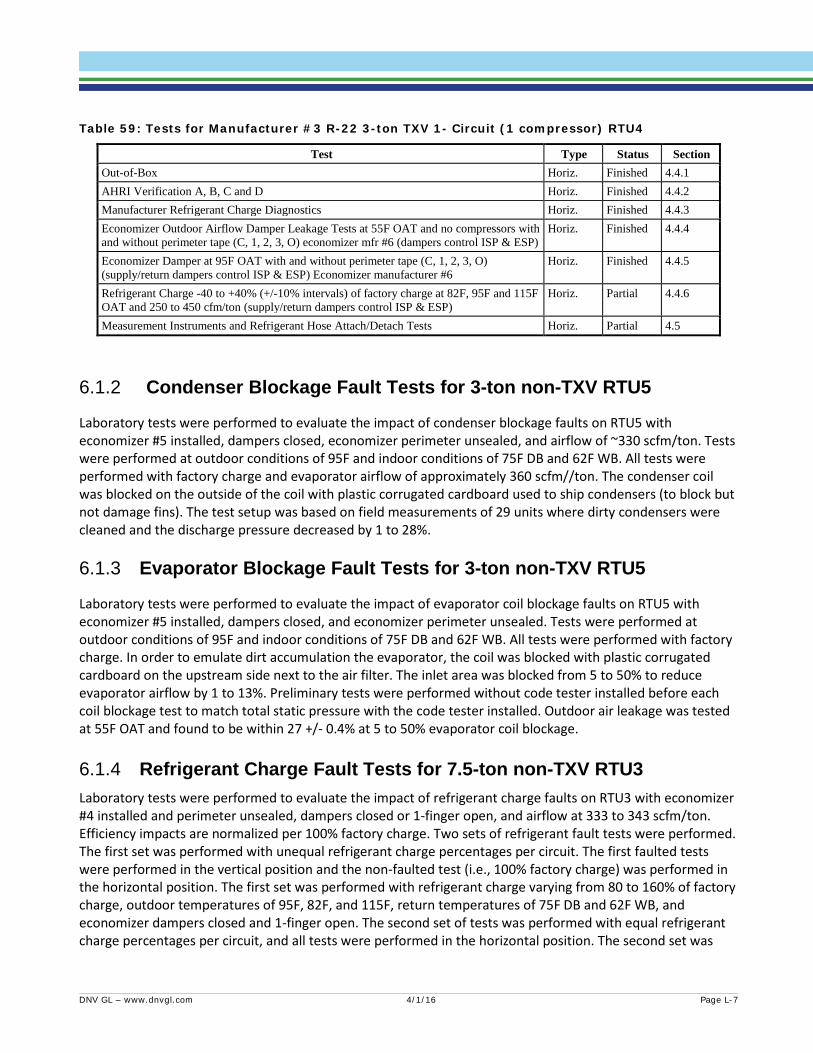
Table 59: Tests for Manufacturer #3 R-22 3-ton TXV 1- Circuit (1 compressor) RTU4
Test Type Status Section Out-of-Box Horiz. Finished 4.4.1 AHRI Verification A, B, C and D Horiz. Finished 4.4.2 Manufacturer Refrigerant Charge Diagnostics Horiz. Finished 4.4.3 Economizer Outdoor Airflow Damper Leakage Tests at 55F OAT and no compressors with and without perimeter tape (C, 1, 2, 3, O) economizer mfr #6 (dampers control ISP & ESP)
Horiz. Finished 4.4.4
Economizer Damper at 95F OAT with and without perimeter tape (C, 1, 2, 3, O) (supply/return dampers control ISP & ESP) Economizer manufacturer #6
Horiz. Finished 4.4.5
Refrigerant Charge -40 to +40% (+/-10% intervals) of factory charge at 82F, 95F and 115F OAT and 250 to 450 cfm/ton (supply/return dampers control ISP & ESP)
Horiz. Partial 4.4.6
Measurement Instruments and Refrigerant Hose Attach/Detach Tests Horiz. Partial 4.5
Condenser Blockage Fault Tests for 3-ton non-TXV RTU5 6.1.2
Laboratory tests were performed to evaluate the impact of condenser blockage faults on RTU5 with economizer #5 installed, dampers closed, economizer perimeter unsealed, and airflow of ~330 scfm/ton. Tests were performed at outdoor conditions of 95F and indoor conditions of 75F DB and 62F WB. All tests were performed with factory charge and evaporator airflow of approximately 360 scfm//ton. The condenser coil was blocked on the outside of the coil with plastic corrugated cardboard used to ship condensers (to block but not damage fins). The test setup was based on field measurements of 29 units where dirty condensers were cleaned and the discharge pressure decreased by 1 to 28%.
Evaporator Blockage Fault Tests for 3-ton non-TXV RTU5 6.1.3
Laboratory tests were performed to evaluate the impact of evaporator coil blockage faults on RTU5 with economizer #5 installed, dampers closed, and economizer perimeter unsealed. Tests were performed at outdoor conditions of 95F and indoor conditions of 75F DB and 62F WB. All tests were performed with factory charge. In order to emulate dirt accumulation the evaporator, the coil was blocked with plastic corrugated cardboard on the upstream side next to the air filter. The inlet area was blocked from 5 to 50% to reduce evaporator airflow by 1 to 13%. Preliminary tests were performed without code tester installed before each coil blockage test to match total static pressure with the code tester installed. Outdoor air leakage was tested at 55F OAT and found to be within 27 +/- 0.4% at 5 to 50% evaporator coil blockage.
Refrigerant Charge Fault Tests for 7.5-ton non-TXV RTU3 6.1.4Laboratory tests were performed to evaluate the impact of refrigerant charge faults on RTU3 with economizer #4 installed and perimeter unsealed, dampers closed or 1-finger open, and airflow at 333 to 343 scfm/ton. Efficiency impacts are normalized per 100% factory charge. Two sets of refrigerant fault tests were performed. The first set was performed with unequal refrigerant charge percentages per circuit. The first faulted tests were performed in the vertical position and the non-faulted test (i.e., 100% factory charge) was performed in the horizontal position. The first set was performed with refrigerant charge varying from 80 to 160% of factory charge, outdoor temperatures of 95F, 82F, and 115F, return temperatures of 75F DB and 62F WB, and economizer dampers closed and 1-finger open. The second set of tests was performed with equal refrigerant charge percentages per circuit, and all tests were performed in the horizontal position. The second set was
DNV GL – www.dnvgl.com 4/1/16 Page L-7

performed with refrigerant charge varying from 60 to 140% of factory charge, outdoor temperatures of 95F, return temperatures of 75F DB and 62F WB, and economizer dampers closed. For the first set of tests with dampers closed the unsealed outdoor air leakage was 17.3% and with dampers at 1-finger open the outdoor air leakage was 26%. For the second set of tests with dampers closed the unsealed outdoor air leakage was 16%. For the second tests, preliminary measurements were performed without code tester installed for each setup in order to match total static pressure with the code tester installed. Circuit-specific manufacturer refrigerant charge diagnostics are based on suction temperature (ST) as a function of outdoor drybulb (DB) temperature (i.e., condenser entering air) and suction pressure (SP).
Refrigerant Charge Fault Tests for 7.5-ton TXV RTU2 6.1.5
Laboratory tests were performed to evaluate the impact of refrigerant charge faults on RTU2 with economizer #1 installed and perimeter unsealed, dampers closed, and airflow at 356 scfm/ton. Tests were performed at outdoor conditions of 95F and indoor conditions of 75F DB and 62F WB. With dampers closed the unsealed outdoor air leakage was 12%. Tests were performed with factory charge varying from 60 to 140% of factory charge.
Refrigerant Charge Fault Tests for 3-ton non-TXV RTU5 6.1.6
Laboratory tests were performed to evaluate the impact of refrigerant charge faults on the application energy efficiency of RTU5 with economizer #5 installed and perimeter unsealed, dampers closed, and airflow at 375 scfm/ton. Tests were performed at outdoor temperatures of 95F and return temperatures of 75F DB and 62F WB with factory charge varying from 60 to 140% of factory charge. With economizer #5 dampers closed the outdoor airflow was 23.5% and with dampers 1-finger open the outdoor airflow was 32.6%. Refrigerant charge was added or removed in increments of 10% of the factory charge for each test. Preliminary measurements were performed without code tester installed for each test setup in order to match total static pressure with the code tester installed.
Refrigerant Charge Fault Tests for 3-ton TXV RTU4 6.1.7
Laboratory tests were performed to evaluate the impact of refrigerant charge faults on RTU4. Tests were performed with factory charge varying from 60 to 140% of factory charge, economizer #6 perimeter unsealed, dampers closed and 1-finger open, and 376 to 407 scfm/ton total evaporator airflow. Tests were performed at outdoor conditions of 95F and indoor conditions of 75F DB and 62F WB. With dampers closed the unsealed outdoor air leakage was 19.9% and with dampers at 1-finger open outdoor air leakage was 27.8%
DNV GL – www.dnvgl.com 4/1/16 Page L-8

PUBLIC COMMENT MATRIX Appendix M.This appendix presents the public comments received on the publically posted draft of this report and DNV GL’s response to each of the comments.
Subject Comment From
Page # or
Section
Comment / Suggestion Reply / Response
Realization rate versus the installation rate
SDG&E 2 "The evaluation estimated the achieved savings and compared them to the expected savings as a ratio called realization rate. This is inclusive of the ex post installation rate and any ex post adjustment to the unit energy savings." This report indicates that the realization rate includes the installation rate (and any other adjustments to gross savings). Often the installation rate is a separate adjustment from the realization rate (e.g., the E3 calculator). Please confirm that for this report the realization rate is inclusive of installation rate and any ex post adjustments to the savings as stated.
Yes, confirmed that the realization rate is inclusive of the installation rate for this study.
Program differences between IOUs
SDG&E 3 "The AirCare Plus program had a particularly low realization rate because not only did it suffer from the above problem, but also, approximately 90% of the refrigerant charge adjustment claims in the tracking data seemed to be erroneous." There are obvious technical and methodological differentiators across IOU programs that have not been accounted for in this study. The erroneous PG&E data set that led to over-reporting of savings where no refrigerant charge adjustment was performed should be discarded and the realization rates for each utility reported and applied separately.
Programs have been evaluated separately except where noted. The erroneous PG&E data has been corrected. Refer to research plan where it is stated that data from different programs will be combined where there are no significant differences across programs.
DNV GL – www.dnvgl.com 4/1/16 Page M-1

Subject Comment
From Page #
or Section
Comment / Suggestion Reply / Response
Program differences between IOUs
SDG&E 6 "Through a review of the PG&E Air Care Plus program data, the evaluation team discovered that many of the claimed charge adjustments were actually coded as "test only" in the implementer databases. The installation rate for incorrectly claimed units was set to zero since there are supposed to be no savings claimed for only testing for refrigerant charge." Please confirm that the statewide installation rates will not be applied across all IOUs equally. If so, the erroneous PG&E ACP program data used to calculate the PG&E ACP refrigerant charge realization rate should be discarded (i.e., the savings should not be set to zero, but the units should be removed from the sample as not representative of the CQM population for SDG&E).
The installation rates were calculated separately for each utility.
Program differences between IOUs
SDG&E 6 "Using equest to simulate savings across population climate zones and building types leads to statewide gross realization rates of 39% for electric energy (kWh) savings and 113% for electric demand reduction (kW)." There are obvious technical and methodological differentiators across IOU programs that have not been accounted for in this study. The erroneous PG&E data set that led to over-reporting of savings where no refrigerant charge adjustment was performed should be discarded and the realization rates for each utility reported and applied separately.
The erroneous PG&E data did not affect the realization rates in the other IOU programs.
DNV GL – www.dnvgl.com 4/1/16 Page M-2

Subject Comment
From Page #
or Section
Comment / Suggestion Reply / Response
Coil Cleaning
SDG&E 6 "While the laboratory results show impact from condenser coil cleaning, they showed negligible impacts of treating evaporator coil blockage, and currently no impacts from cleaning evaporator coils are supportable based on the laboratory data." It appears that the evaluators did not consider or evaluate the effects on coil fouling and heat exchange when evaluating the evaporator coil cleaning measure. By limiting the effects measured to airflow blockage, it is not surprising that the systemic/performance effects were not appreciably greater than the measurement error.
We have performed further analysis and found small savings for evaporator coil cleaning. The report was amended.
Coil Cleaning
SDG&E 27 "The laboratory test procedure recreated the overall impact of a dirty coil using cardboard to block the surface of the evaporator or condenser coil." Using blanking panels (cardboard in the case of the impact report) simulates reduced airflow associated with dirty coils but perhaps not the reduced heat transfer. According to an HVAC Energy Efficiency Maintenance Study prepared by Davis Energy Group, Inc. from 2010 (see http://www.calmac.org/publications/ HVAC_EE_Maintenance_Final.pdf): "In the lab, blockage is simulated by reducing airflow with panels. In the field, fouling not only blocks airflow but also coats coil surfaces, changing the heat transfer characteristics. The relationship between lab tested blockage and coil fouling in the field has not been established" (p.13).
We agree that the area blockage procedure does not fully replicate real world coil fouling conditions in a laboratory. Report edited to acknowledge this limitation and that other studies have yet to develop a procedure to replicate dirty coils or to quantify typical level of dirtiness/change in heat transfer.
DNV GL – www.dnvgl.com 4/1/16 Page M-3
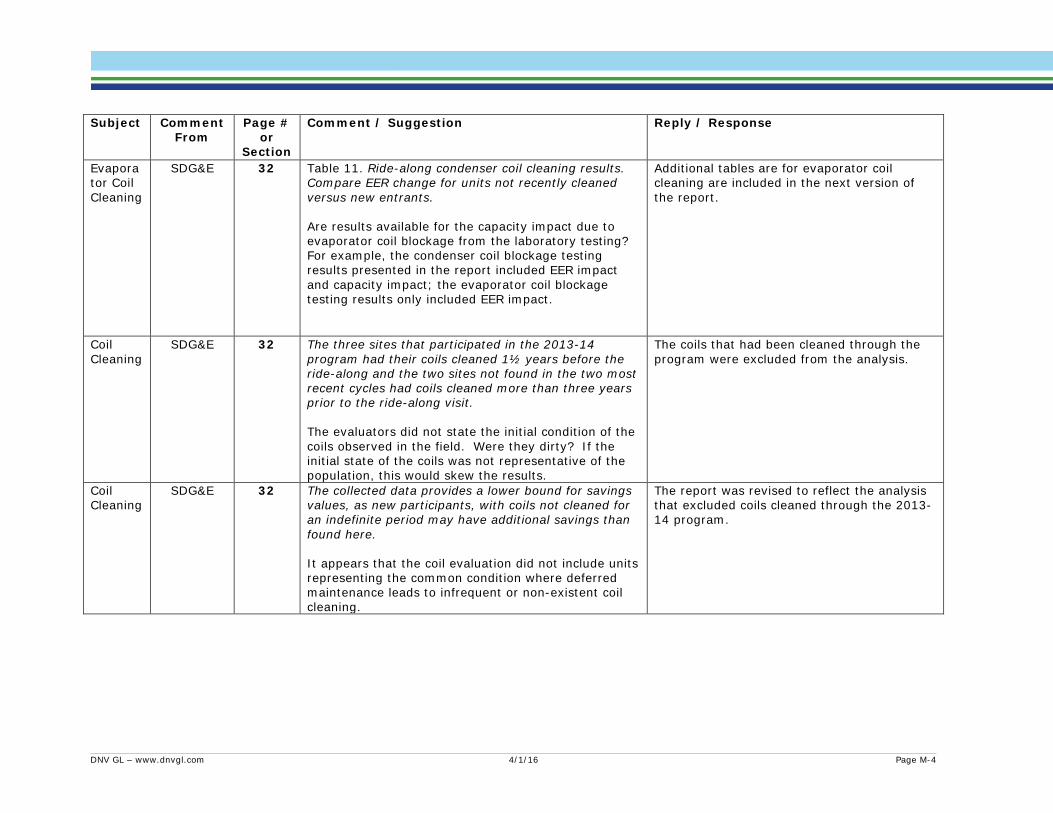
Subject Comment
From Page #
or Section
Comment / Suggestion Reply / Response
Evaporator Coil Cleaning
SDG&E 32 Table 11. Ride-along condenser coil cleaning results. Compare EER change for units not recently cleaned versus new entrants. Are results available for the capacity impact due to evaporator coil blockage from the laboratory testing? For example, the condenser coil blockage testing results presented in the report included EER impact and capacity impact; the evaporator coil blockage testing results only included EER impact.
Additional tables are for evaporator coil cleaning are included in the next version of the report.
Coil Cleaning
SDG&E 32 The three sites that participated in the 2013-14 program had their coils cleaned 1½ years before the ride-along and the two sites not found in the two most recent cycles had coils cleaned more than three years prior to the ride-along visit. The evaluators did not state the initial condition of the coils observed in the field. Were they dirty? If the initial state of the coils was not representative of the population, this would skew the results.
The coils that had been cleaned through the program were excluded from the analysis.
Coil Cleaning
SDG&E 32 The collected data provides a lower bound for savings values, as new participants, with coils not cleaned for an indefinite period may have additional savings than found here. It appears that the coil evaluation did not include units representing the common condition where deferred maintenance leads to infrequent or non-existent coil cleaning.
The report was revised to reflect the analysis that excluded coils cleaned through the 2013-14 program.
DNV GL – www.dnvgl.com 4/1/16 Page M-4
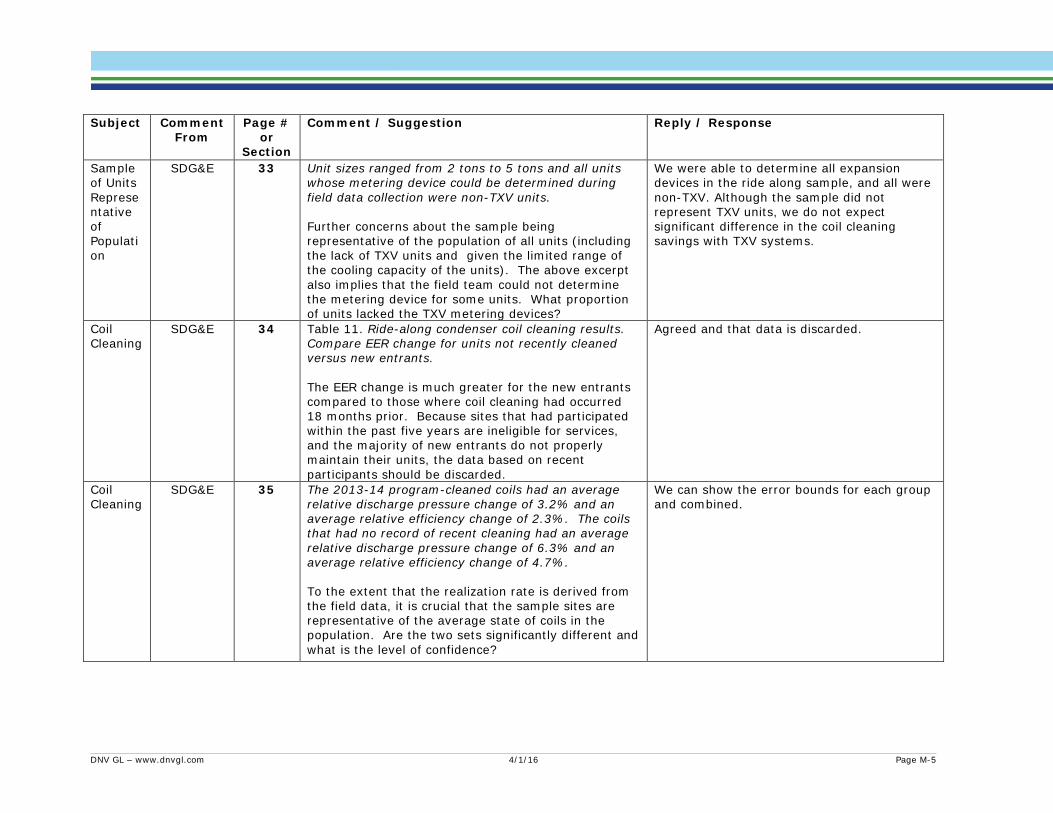
Subject Comment
From Page #
or Section
Comment / Suggestion Reply / Response
Sample of Units Representative of Population
SDG&E 33 Unit sizes ranged from 2 tons to 5 tons and all units whose metering device could be determined during field data collection were non-TXV units. Further concerns about the sample being representative of the population of all units (including the lack of TXV units and given the limited range of the cooling capacity of the units). The above excerpt also implies that the field team could not determine the metering device for some units. What proportion of units lacked the TXV metering devices?
We were able to determine all expansion devices in the ride along sample, and all were non-TXV. Although the sample did not represent TXV units, we do not expect significant difference in the coil cleaning savings with TXV systems.
Coil Cleaning
SDG&E 34 Table 11. Ride-along condenser coil cleaning results. Compare EER change for units not recently cleaned versus new entrants. The EER change is much greater for the new entrants compared to those where coil cleaning had occurred 18 months prior. Because sites that had participated within the past five years are ineligible for services, and the majority of new entrants do not properly maintain their units, the data based on recent participants should be discarded.
Agreed and that data is discarded.
Coil Cleaning
SDG&E 35 The 2013-14 program-cleaned coils had an average relative discharge pressure change of 3.2% and an average relative efficiency change of 2.3%. The coils that had no record of recent cleaning had an average relative discharge pressure change of 6.3% and an average relative efficiency change of 4.7%. To the extent that the realization rate is derived from the field data, it is crucial that the sample sites are representative of the average state of coils in the population. Are the two sets significantly different and what is the level of confidence?
We can show the error bounds for each group and combined.
DNV GL – www.dnvgl.com 4/1/16 Page M-5
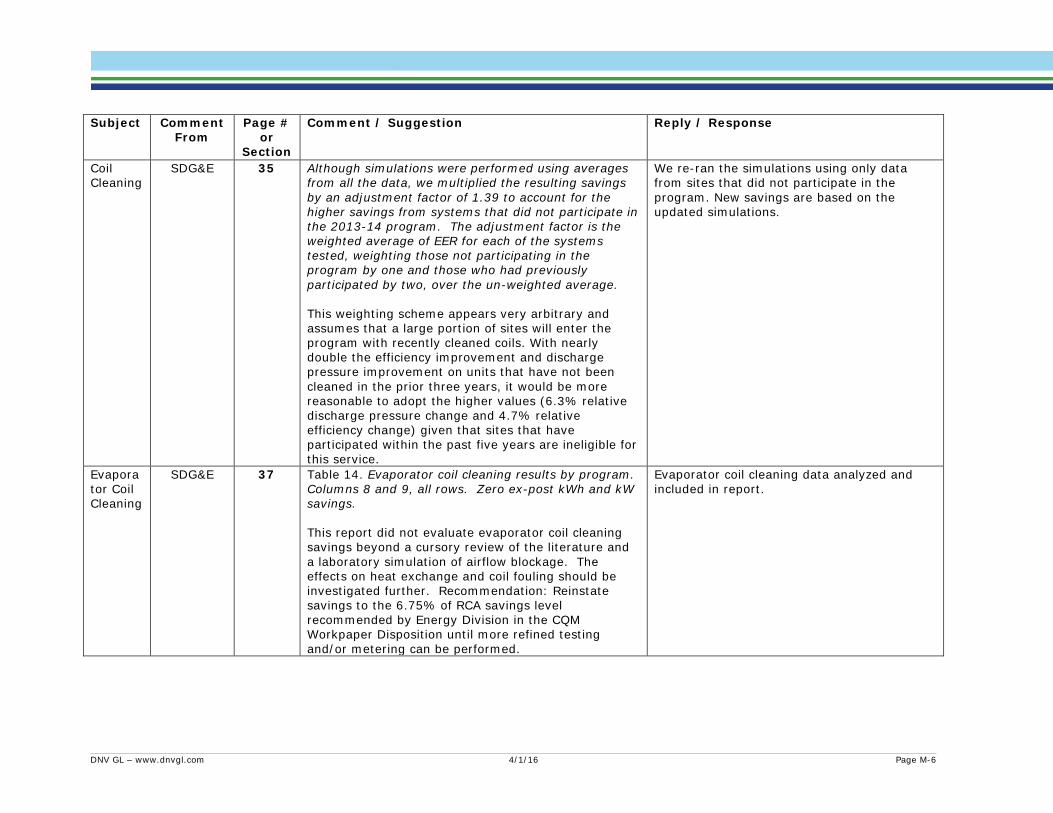
Subject Comment
From Page #
or Section
Comment / Suggestion Reply / Response
Coil Cleaning
SDG&E 35 Although simulations were performed using averages from all the data, we multiplied the resulting savings by an adjustment factor of 1.39 to account for the higher savings from systems that did not participate in the 2013-14 program. The adjustment factor is the weighted average of EER for each of the systems tested, weighting those not participating in the program by one and those who had previously participated by two, over the un-weighted average. This weighting scheme appears very arbitrary and assumes that a large portion of sites will enter the program with recently cleaned coils. With nearly double the efficiency improvement and discharge pressure improvement on units that have not been cleaned in the prior three years, it would be more reasonable to adopt the higher values (6.3% relative discharge pressure change and 4.7% relative efficiency change) given that sites that have participated within the past five years are ineligible for this service.
We re-ran the simulations using only data from sites that did not participate in the program. New savings are based on the updated simulations.
Evaporator Coil Cleaning
SDG&E 37 Table 14. Evaporator coil cleaning results by program. Columns 8 and 9, all rows. Zero ex-post kWh and kW savings. This report did not evaluate evaporator coil cleaning savings beyond a cursory review of the literature and a laboratory simulation of airflow blockage. The effects on heat exchange and coil fouling should be investigated further. Recommendation: Reinstate savings to the 6.75% of RCA savings level recommended by Energy Division in the CQM Workpaper Disposition until more refined testing and/or metering can be performed.
Evaporator coil cleaning data analyzed and included in report.
DNV GL – www.dnvgl.com 4/1/16 Page M-6
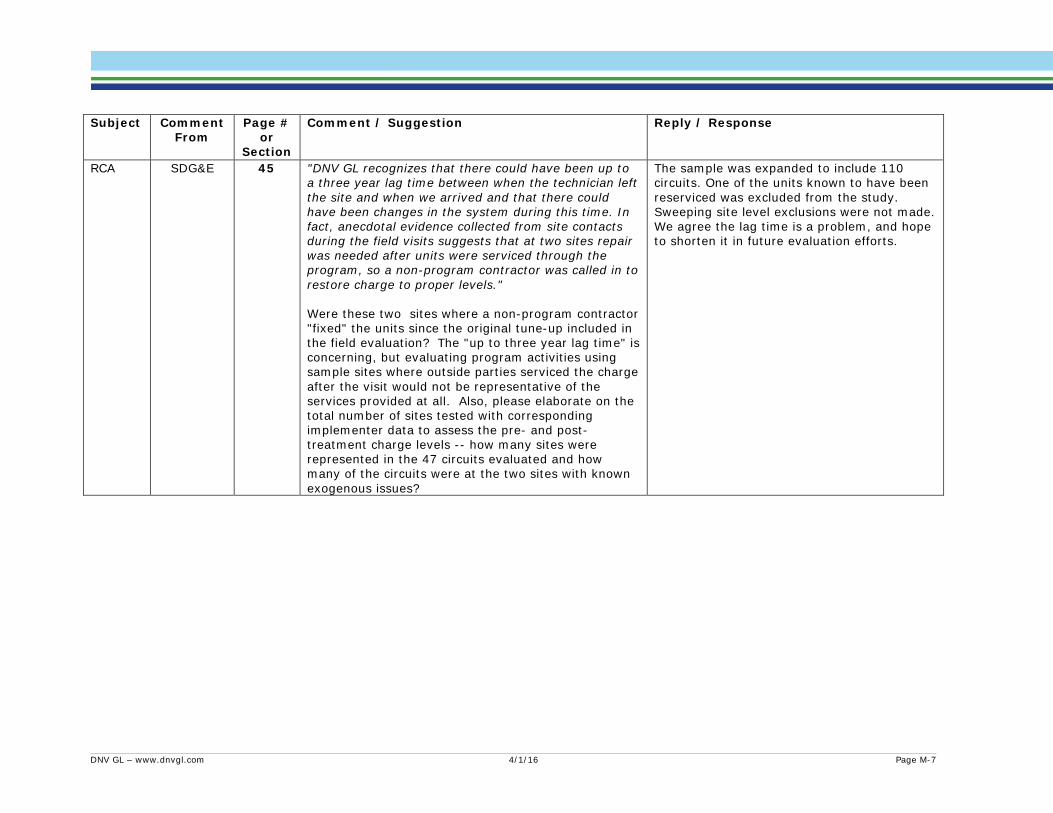
Subject Comment
From Page #
or Section
Comment / Suggestion Reply / Response
RCA SDG&E 45 "DNV GL recognizes that there could have been up to a three year lag time between when the technician left the site and when we arrived and that there could have been changes in the system during this time. In fact, anecdotal evidence collected from site contacts during the field visits suggests that at two sites repair was needed after units were serviced through the program, so a non-program contractor was called in to restore charge to proper levels." Were these two sites where a non-program contractor "fixed" the units since the original tune-up included in the field evaluation? The "up to three year lag time" is concerning, but evaluating program activities using sample sites where outside parties serviced the charge after the visit would not be representative of the services provided at all. Also, please elaborate on the total number of sites tested with corresponding implementer data to assess the pre- and post-treatment charge levels -- how many sites were represented in the 47 circuits evaluated and how many of the circuits were at the two sites with known exogenous issues?
The sample was expanded to include 110 circuits. One of the units known to have been reserviced was excluded from the study. Sweeping site level exclusions were not made. We agree the lag time is a problem, and hope to shorten it in future evaluation efforts.
DNV GL – www.dnvgl.com 4/1/16 Page M-7
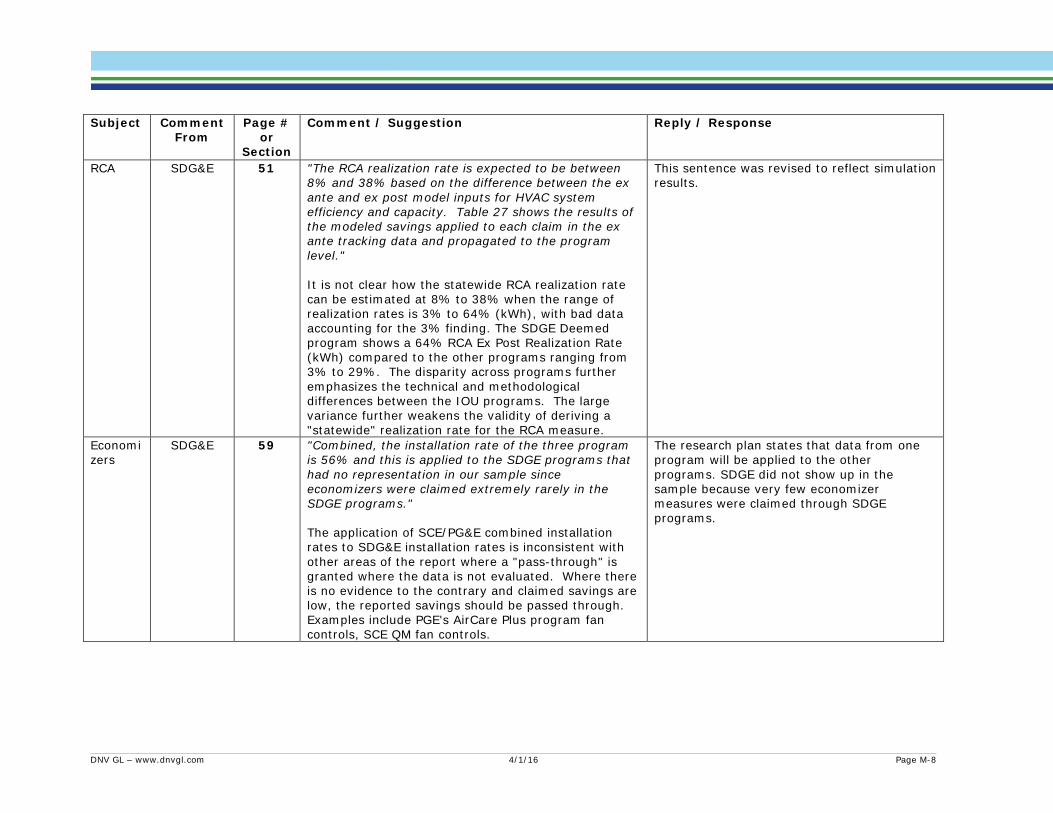
Subject Comment
From Page #
or Section
Comment / Suggestion Reply / Response
RCA SDG&E 51 "The RCA realization rate is expected to be between 8% and 38% based on the difference between the ex ante and ex post model inputs for HVAC system efficiency and capacity. Table 27 shows the results of the modeled savings applied to each claim in the ex ante tracking data and propagated to the program level." It is not clear how the statewide RCA realization rate can be estimated at 8% to 38% when the range of realization rates is 3% to 64% (kWh), with bad data accounting for the 3% finding. The SDGE Deemed program shows a 64% RCA Ex Post Realization Rate (kWh) compared to the other programs ranging from 3% to 29%. The disparity across programs further emphasizes the technical and methodological differences between the IOU programs. The large variance further weakens the validity of deriving a "statewide" realization rate for the RCA measure.
This sentence was revised to reflect simulation results.
Economizers
SDG&E 59 "Combined, the installation rate of the three program is 56% and this is applied to the SDGE programs that had no representation in our sample since economizers were claimed extremely rarely in the SDGE programs." The application of SCE/PG&E combined installation rates to SDG&E installation rates is inconsistent with other areas of the report where a "pass-through" is granted where the data is not evaluated. Where there is no evidence to the contrary and claimed savings are low, the reported savings should be passed through. Examples include PGE's AirCare Plus program fan controls, SCE QM fan controls.
The research plan states that data from one program will be applied to the other programs. SDGE did not show up in the sample because very few economizer measures were claimed through SDGE programs.
DNV GL – www.dnvgl.com 4/1/16 Page M-8
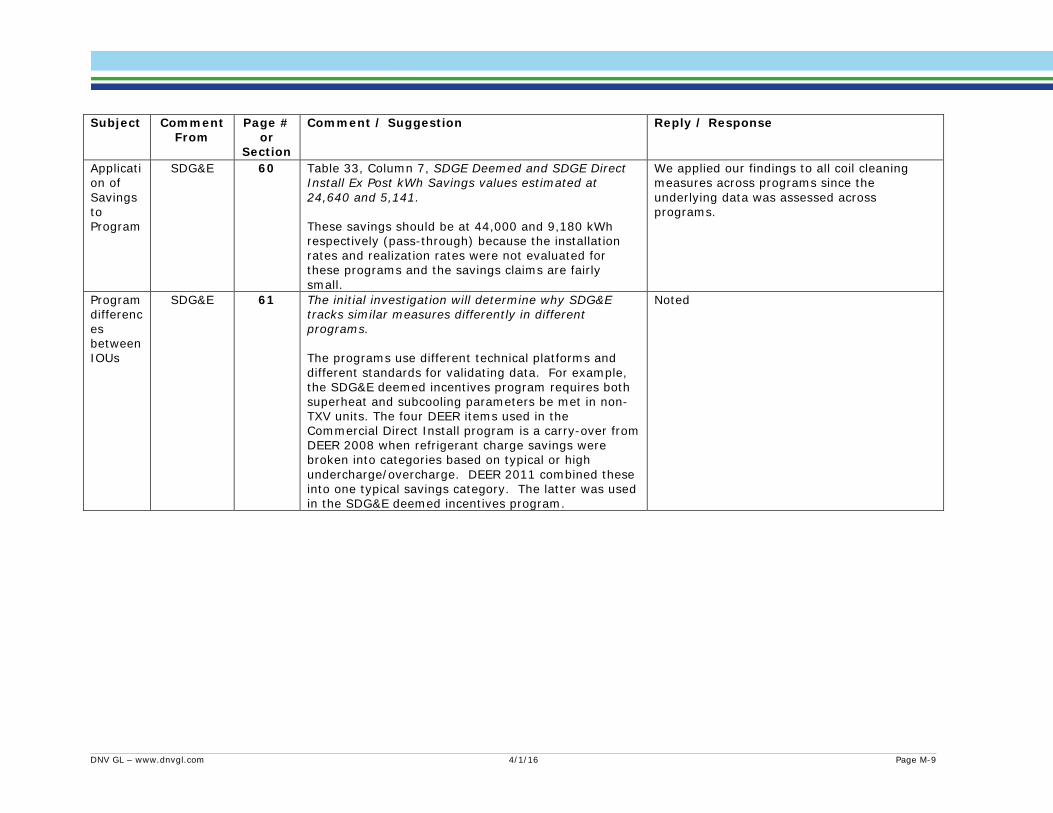
Subject Comment
From Page #
or Section
Comment / Suggestion Reply / Response
Application of Savings to Program
SDG&E 60 Table 33, Column 7, SDGE Deemed and SDGE Direct Install Ex Post kWh Savings values estimated at 24,640 and 5,141. These savings should be at 44,000 and 9,180 kWh respectively (pass-through) because the installation rates and realization rates were not evaluated for these programs and the savings claims are fairly small.
We applied our findings to all coil cleaning measures across programs since the underlying data was assessed across programs.
Program differences between IOUs
SDG&E 61 The initial investigation will determine why SDG&E tracks similar measures differently in different programs. The programs use different technical platforms and different standards for validating data. For example, the SDG&E deemed incentives program requires both superheat and subcooling parameters be met in non-TXV units. The four DEER items used in the Commercial Direct Install program is a carry-over from DEER 2008 when refrigerant charge savings were broken into categories based on typical or high undercharge/overcharge. DEER 2011 combined these into one typical savings category. The latter was used in the SDG&E deemed incentives program.
Noted
DNV GL – www.dnvgl.com 4/1/16 Page M-9
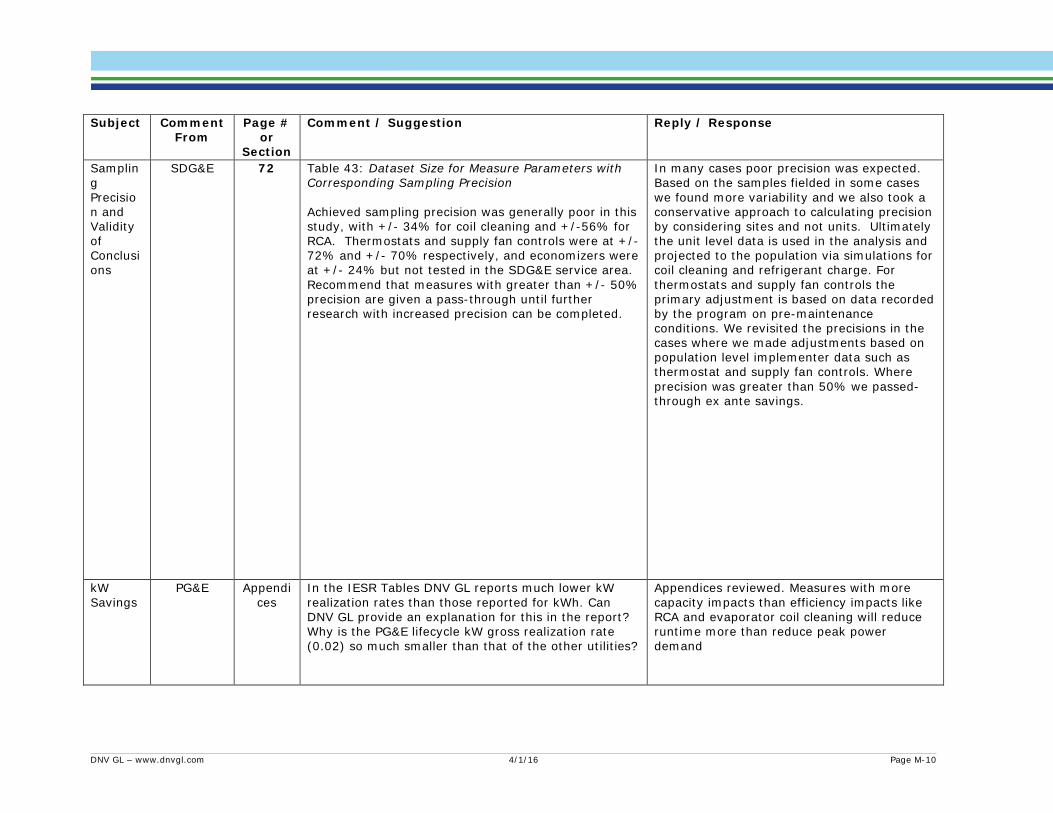
Subject Comment
From Page #
or Section
Comment / Suggestion Reply / Response
Sampling Precision and Validity of Conclusions
SDG&E 72 Table 43: Dataset Size for Measure Parameters with Corresponding Sampling Precision Achieved sampling precision was generally poor in this study, with +/- 34% for coil cleaning and +/-56% for RCA. Thermostats and supply fan controls were at +/- 72% and +/- 70% respectively, and economizers were at +/- 24% but not tested in the SDG&E service area. Recommend that measures with greater than +/- 50% precision are given a pass-through until further research with increased precision can be completed.
In many cases poor precision was expected. Based on the samples fielded in some cases we found more variability and we also took a conservative approach to calculating precision by considering sites and not units. Ultimately the unit level data is used in the analysis and projected to the population via simulations for coil cleaning and refrigerant charge. For thermostats and supply fan controls the primary adjustment is based on data recorded by the program on pre-maintenance conditions. We revisited the precisions in the cases where we made adjustments based on population level implementer data such as thermostat and supply fan controls. Where precision was greater than 50% we passed-through ex ante savings.
kW Savings
PG&E Appendices
In the IESR Tables DNV GL reports much lower kW realization rates than those reported for kWh. Can DNV GL provide an explanation for this in the report? Why is the PG&E lifecycle kW gross realization rate (0.02) so much smaller than that of the other utilities?
Appendices reviewed. Measures with more capacity impacts than efficiency impacts like RCA and evaporator coil cleaning will reduce runtime more than reduce peak power demand
DNV GL – www.dnvgl.com 4/1/16 Page M-10

Subject Comment
From Page #
or Section
Comment / Suggestion Reply / Response
Laboratory data
PG&E For several high impact measures, the final determination of ex post savings was based on limited laboratory data offered outside the context of a full review. In particular, savings for refrigerant charge adjustment and coil cleaning relied on correlations to laboratory analysis that is not supported with sufficient detail to be verified. This is especially problematic for evaporator coil cleaning for which no savings were awarded based exclusively on laboratory analysis. PG&E is willing to trust such findings when we can also verify the methodology and analysis. It is much more difficult to support a 0% GRR with no opportunity to verify methods.
More detail about laboratory procedures and data added to the report.
Economizers
PG&E DNV GL assigns a low realization rate for economizer measures (0.43). Can DNV GL provide a quantative breakdown of the reasons for economizer failures?
It was not within scope to diagnose the reasons for economizer failure. Determining the cause of economizer failure is much more time intensive than the functional tests which determine if the economizer is working or not.
Baseline PG&E Can DNV GL please be more specific throughout the report on exactly what defines baseline for each of the investigated measures? Is it always existing conditions before the unit was enrolled in the program? Is it based on standard maintenance and if so, what defines standard maintenance? Is it a mix of pre existing conditions and assumed standard maintenance practices? Are program non participants all assumed to have their HVAC systems serviced at a regular time interval?
The baselines for each of the measures are described in the workpapers and summarized in each measure section.
kW Savings
PG&E Can DNV GL please discuss why PG&E programs have negative kW economizer savings both ex ante and ex post while other programs have zero (SDG&E) or positive (SCE) kW economizer savings?
This is an artifact of the ex ante claims; the negative got carried through from the ex ante in cases where a realization rate was applied.
DNV GL – www.dnvgl.com 4/1/16 Page M-11
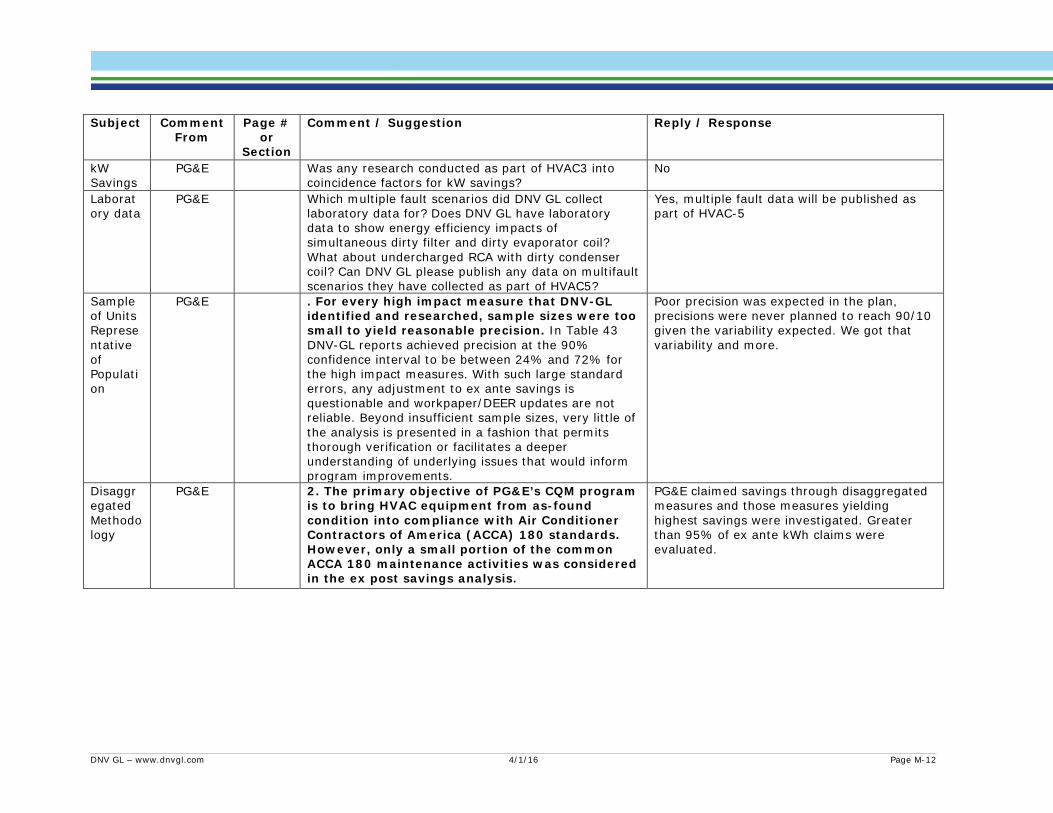
Subject Comment
From Page #
or Section
Comment / Suggestion Reply / Response
kW Savings
PG&E Was any research conducted as part of HVAC3 into coincidence factors for kW savings?
No
Laboratory data
PG&E Which multiple fault scenarios did DNV GL collect laboratory data for? Does DNV GL have laboratory data to show energy efficiency impacts of simultaneous dirty filter and dirty evaporator coil? What about undercharged RCA with dirty condenser coil? Can DNV GL please publish any data on multifault scenarios they have collected as part of HVAC5?
Yes, multiple fault data will be published as part of HVAC-5
Sample of Units Representative of Population
PG&E . For every high impact measure that DNV-GL identified and researched, sample sizes were too small to yield reasonable precision. In Table 43 DNV-GL reports achieved precision at the 90% confidence interval to be between 24% and 72% for the high impact measures. With such large standard errors, any adjustment to ex ante savings is questionable and workpaper/DEER updates are not reliable. Beyond insufficient sample sizes, very little of the analysis is presented in a fashion that permits thorough verification or facilitates a deeper understanding of underlying issues that would inform program improvements.
Poor precision was expected in the plan, precisions were never planned to reach 90/10 given the variability expected. We got that variability and more.
Disaggregated Methodology
PG&E 2. The primary objective of PG&E’s CQM program is to bring HVAC equipment from as-found condition into compliance with Air Conditioner Contractors of America (ACCA) 180 standards. However, only a small portion of the common ACCA 180 maintenance activities was considered in the ex post savings analysis.
PG&E claimed savings through disaggregated measures and those measures yielding highest savings were investigated. Greater than 95% of ex ante kWh claims were evaluated.
DNV GL – www.dnvgl.com 4/1/16 Page M-12
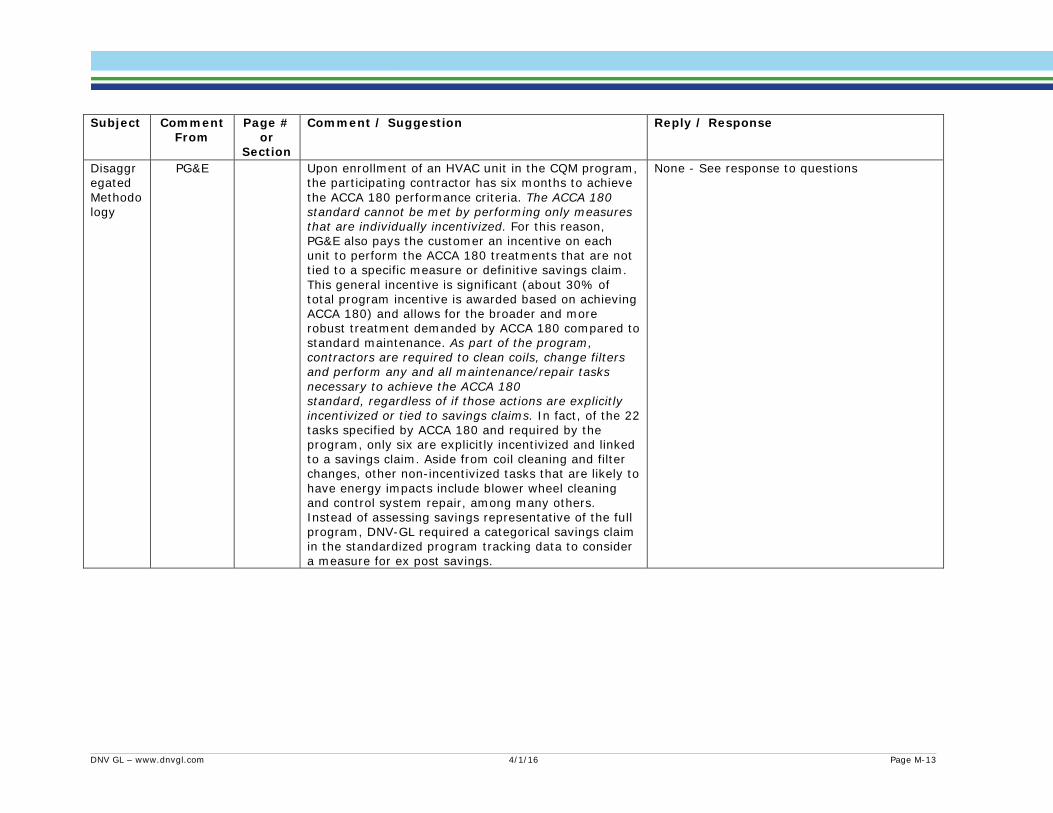
Subject Comment
From Page #
or Section
Comment / Suggestion Reply / Response
Disaggregated Methodology
PG&E Upon enrollment of an HVAC unit in the CQM program, the participating contractor has six months to achieve the ACCA 180 performance criteria. The ACCA 180 standard cannot be met by performing only measures that are individually incentivized. For this reason, PG&E also pays the customer an incentive on each unit to perform the ACCA 180 treatments that are not tied to a specific measure or definitive savings claim. This general incentive is significant (about 30% of total program incentive is awarded based on achieving ACCA 180) and allows for the broader and more robust treatment demanded by ACCA 180 compared to standard maintenance. As part of the program, contractors are required to clean coils, change filters and perform any and all maintenance/repair tasks necessary to achieve the ACCA 180 standard, regardless of if those actions are explicitly incentivized or tied to savings claims. In fact, of the 22 tasks specified by ACCA 180 and required by the program, only six are explicitly incentivized and linked to a savings claim. Aside from coil cleaning and filter changes, other non-incentivized tasks that are likely to have energy impacts include blower wheel cleaning and control system repair, among many others. Instead of assessing savings representative of the full program, DNV-GL required a categorical savings claim in the standardized program tracking data to consider a measure for ex post savings.
None - See response to questions
DNV GL – www.dnvgl.com 4/1/16 Page M-13
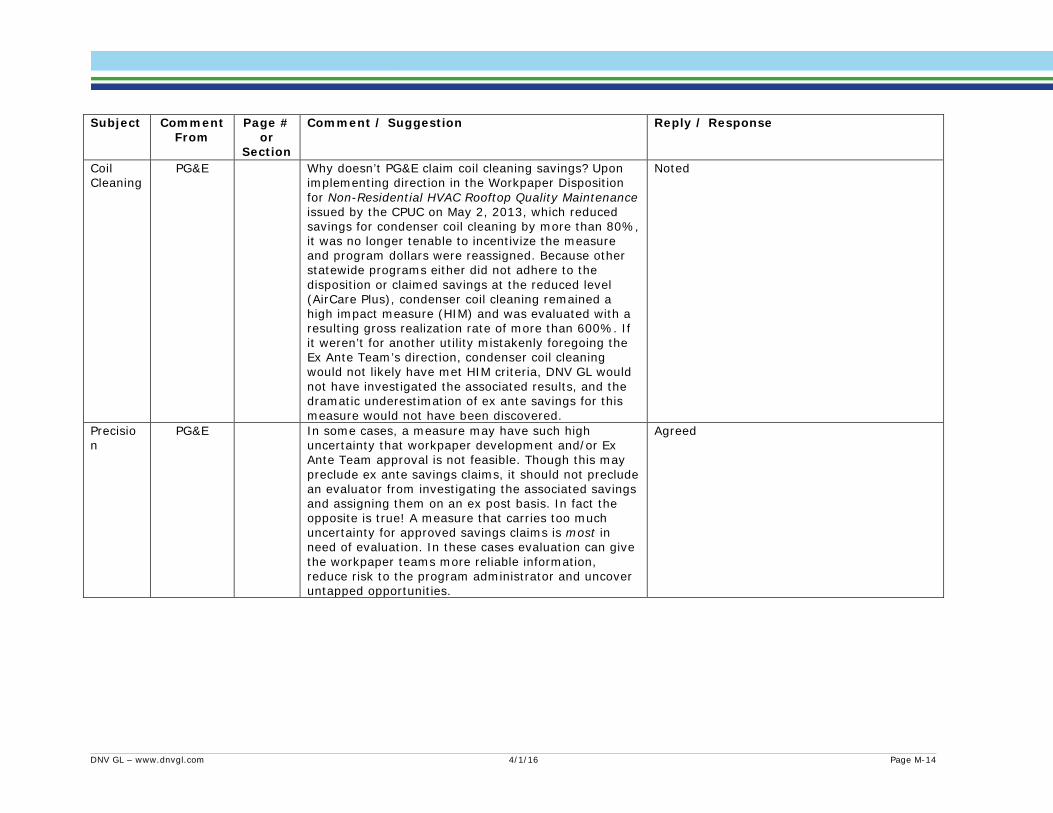
Subject Comment
From Page #
or Section
Comment / Suggestion Reply / Response
Coil Cleaning
PG&E Why doesn’t PG&E claim coil cleaning savings? Upon implementing direction in the Workpaper Disposition for Non-Residential HVAC Rooftop Quality Maintenance issued by the CPUC on May 2, 2013, which reduced savings for condenser coil cleaning by more than 80%, it was no longer tenable to incentivize the measure and program dollars were reassigned. Because other statewide programs either did not adhere to the disposition or claimed savings at the reduced level (AirCare Plus), condenser coil cleaning remained a high impact measure (HIM) and was evaluated with a resulting gross realization rate of more than 600%. If it weren’t for another utility mistakenly foregoing the Ex Ante Team’s direction, condenser coil cleaning would not likely have met HIM criteria, DNV GL would not have investigated the associated results, and the dramatic underestimation of ex ante savings for this measure would not have been discovered.
Noted
Precision
PG&E In some cases, a measure may have such high uncertainty that workpaper development and/or Ex Ante Team approval is not feasible. Though this may preclude ex ante savings claims, it should not preclude an evaluator from investigating the associated savings and assigning them on an ex post basis. In fact the opposite is true! A measure that carries too much uncertainty for approved savings claims is most in need of evaluation. In these cases evaluation can give the workpaper teams more reliable information, reduce risk to the program administrator and uncover untapped opportunities.
Agreed
DNV GL – www.dnvgl.com 4/1/16 Page M-14
Subject Comment
From Page #
or Section
Comment / Suggestion Reply / Response
Coil Cleaning
PG&E Despite the loss of the ex ante savings opportunity, PG&E CQM contractors cleaned more than 4,500 condenser coils and more than 4,500 evaporator coils in the 2013 – 2014 program cycle in compliance with program requirements. In each instance, Honeywell kept detailed records, which were submitted to DNV-GL as part of the larger HVAC3 data request. In fact, DNV-GL completed ride along visits to CQM program participants in PG&E service territory to develop coil cleaning savings parameters, reporting results[1] in Table 11 of the report. Yet the associated savings were not considered due to the lack of corresponding explicit ex ante claims. PG&E is thankful that DNV-GL has voiced openness to including coil cleaning savings for our CQM program and we are hopeful that upon furnishing data that links implementer records to standardized program tracking (completed on March 11), DNV-GL will validate and assign the associated savings in the final draft.
Noted
Evaporator Coil Cleaning
PG&E Similar to coil cleaning, DNV-GL presumably did not consider savings for filter changes for any of the statewide programs due to the lack of explicit claims. Again, per ACCA 180 standards, dirty filters were routinely changed as required by the programs. Changing a dirty filter will render a greater impact from evaporator coil cleaning as it will alleviate airflow restriction before the coil. Therefore, savings for the combination of evaporator coil cleaning and filter change are likely higher than either measure in isolation. Along with evaporator coil cleaning, in PG&E’s CQM program, upon inspection or replacement, filters were initialed and dated by the contractor, leaving a definitive mark that should have been readily observable by evaluation and correlated with implementer data.
Energy Division considers filter change standard practice, while coil cleaning is not. We followed the current definition of standard practice when not considering filter changes in impacts.
DNV GL – www.dnvgl.com 4/1/16 Page M-15
Subject Comment
From Page #
or Section
Comment / Suggestion Reply / Response
Evaporator Coil Cleaning
PG&E One may argue that filter change and certain other ACCA 180 tasks are considered standard maintenance, and PG&E agrees. However, according to recently released research,[2] 31% of non-participating small/medium business customers in California never have their HVAC units serviced,[3] which is a clear indication that baseline standard practice should reflect a significant percentage of dirty filters causing major airflow blockage, along with other standard maintenance tasks left undone. At the March 8 public webinar, John Hill of the CPUC Ex Ante Team mentioned that as part of the HVAC5 laboratory study, several sets of multiple fault situations were investigated. PG&E is hopeful that laboratory data in the report will shed light on the energy efficiency impacts of replacing dirty filters in coincidence with cleaning dirty evaporator coils as well as remedying other common multiple fault scenarios.
Note that field data are for cleaning a coil where a clean filter was installed pre and post. The key limitation to this request is a lack of field data on airflow and performance changes when both a filter is changed and a coil is cleaned.
Coil Cleaning
PG&E In conclusion, where data exists to reasonably verify condenser and evaporator coil cleaning, filter changes and other non-incentivized ACCA 180 tasks, DNV-GL should investigate the validity and impact of those measures as part of the onsite data collection activities and report corresponding savings regardless of coincidental ex ante savings claims. Since much of this analysis was not done, PG&E requests laboratory and existing field data be used to estimate ex post savings for condenser and evaporator coil cleaning including filter change and disqualified thermostat adjustment savings (discussed below).
Lab data may be insufficient to quantify all of these measures in all combinations. See previous response for field data limitations.
Evaporator Coil Cleaning
PG&E 3. Evaporator coil cleaning savings should be based on a clear degradation of sensible energy efficiency ratio as a function of reduced airflow, instead of the apparent unchanging energy efficiency ratio. On page 32 of the HVAC3 report, DNV GL presents the following figure that shows evaporator coil blockage causes no immediate discernable change in EER:
Evaporator coil cleaning data analyzed and included in report. Evaporator coil cleaning savings are now non-zero.
DNV GL – www.dnvgl.com 4/1/16 Page M-16
Subject Comment
From Page #
or Section
Comment / Suggestion Reply / Response
Evaporator Coil Cleaning
PG&E Based on these results, DNV GL assigned no savings for the evaporator coil cleaning measures. However, on page 3 of Appendix I, DNV GL provides the following figure, which shows a significant reduction in both Sensible capacity and Sensible EER as a function of reduced airflow due to evaporator coil blockage.
Evaporator coil cleaning data analyzed and included in report. Evaporator coil cleaning savings are now non-zero.
Evaporator Coil Cleaning
PG&E It is PG&E’s understanding that EER accounts for latent heat changes but that Sensible EER* does not. Since California has a largely dry climate, dehumidification is most often not necessary and thermostats that control HVAC cycling are sensitive to dry bulb temperature. Therefore, Sensible EER is the more appropriate metric to assign savings to evaporator coil cleaning and filter replacement. PG&E requests that DNV GL assign savings for evaporator coil cleaning and elsewhere in the evaluation where needed according to Sensible EER.
Evaporator coil cleaning data analyzed and included in report. Evaporator coil cleaning savings are now non-zero.
Evaporator Coil Cleaning
PG&E Also, filter and evaporator blockage can cause ice formation on the evaporator coils, which can eventually lead to 100% blockage in extreme cases. Therefore a savings determination based only on instantaneous measurements does not account for the catastrophic longer term energy efficiency, safety and equipment functionality effects that evaporator coil cleaning and filter replacement can avoid.
Evaporator coil cleaning data analyzed and included in report. Evaporator coil cleaning savings are now non-zero.
Collaboration
PG&E 4. Throughout the evaluation process, more opportunities for true collaboration would have benefited both the program and the evaluation. Aside from brief updates on sample plans and logistical matters, very little insight was offered into research findings or issues that would have engendered the robust back and forth that could have improved both the evaluation and the programs.
Lack of early feedback noted. This will be addressed in the 2015 cycle work.
DNV GL – www.dnvgl.com 4/1/16 Page M-17

Subject Comment
From Page #
or Section
Comment / Suggestion Reply / Response
Supply Fan Control
PG&E As an example, the low GRR (17%) PG&E received for Supply Fan Control measures resulted primarily from elimination of 80% of claims due to a misclassification of the measure in our standard program tracking data. In these instances, during unoccupied building periods the supply fan control was set to ‘intermittent’ or ‘auto’ both before and after the program intervention. In contrast, to qualify as a Supply Fan Control measure, the initial Supply Fan Control setting was required to be ‘always on.’ In these cases, though not changing the setting, technicians did reprogram the thermostat during unoccupied time periods to setpoints of ≥ 85 °F for cooling and ≤ 60 °F for heating. This action had a significant effect on energy usage as the supply fan and compressor would cycle on much less frequently. While DNV-GL noted a legitimate mischaracterization of this measure, instead of disqualifying savings all together, a realization rate could have been developed that accounted for the savings from changing the heating and cooling setpoints. But even more importantly, despite having regular PCG2 meetings with HVAC_3 updates, DNV-GL never informed PG&E of this issue or requested clarification. Thus we are only now being made aware of a technicality that could have been fixed much earlier and is likely to negatively impact savings and realization rates for all of the corresponding 2015 claims.
The fan savings associated with changing the thermostat setting are taken account of in the thermostat measure.
Supply Fan Control
PG&E In the 80% of cases in which Supply Fan Control measure installation rates were assigned zero savings, PG&E requests that DNV GL investigates the significant savings that did occur due to reprogramming of the thermostats and crediting the ex post results accordingly.
Thermostat savings are treated separately from supply fan savings in this evaluation.
RCA PG&E Similarly, refrigerant charge adjustment measures in PG&E’s AirCare Plus program were assigned a 3% kWh (1% kW) GRR due to confusing data. On page 20 of the draft report, DNV-GL states,
Updated with new data
DNV GL – www.dnvgl.com 4/1/16 Page M-18
Subject Comment
From Page #
or Section
Comment / Suggestion Reply / Response
RCA PG&E “The PGE AirCare Plus implementer data showed the majority of units had no refrigerant adjustment and were test only. Yet, ex ante savings were claimed for adjusting charge on these units. It is not clear which is wrong. We are assuming the implementer data is correct and no savings accrue from these sites.”
Updated with new data
Collaboration
PG&E More than 5,600 AirCare Plus RCA claims and 1.4 GWh of savings were simply eliminated with no follow up or request for clarification from PG&E. In the draft report, what boils down to an important yet honest mistake from a database manager resulted in the nearly complete elimination of more than 20% of the entire program’s savings. While we are sympathetic to DNV-GL’s observation that multiple data requests were required to obtain all the information the evaluation team was seeking, PG&E was not made aware of the AirCare Plus RCA tracking data irregularities until publication of the draft evaluation on March 1. Again, even a short communication could have solved this problem in the early stages of evaluation. Nevertheless, PG&E and CLEAResult have since then fixed the error, repopulated the database with the definitive data and we provided the new database to the CPUC on March 11. We request that DNV GL assigns the savings for these measures in the final report.
Updated with new data
Collaboration
PG&E Finally, as noted in point 2 above, achieved sample sizes were small and standard errors are large. DNV GL notes several instances in which evaluation plans were not met and issues with obtaining reliable data. PG&E has offered, and continues to offer, access to the programs for evaluation purposes as new customers enroll for quality maintenance services. This would ensure timely feedback for the programs, and easier sampling for evaluation.
We appreciate PG&E's willingness to collaborate and hope to take better advantage of the opportunity in the future
DNV GL – www.dnvgl.com 4/1/16 Page M-19

Subject Comment
From Page #
or Section
Comment / Suggestion Reply / Response
Disaggregated Methodology
PG&E 5. A fundamentally different approach to the CQM impact evaluation is needed. The interdependence of filter change and evaporator condenser coil cleaning impacts discussed above in point 2 is a good example of the interactive nature of individual HVAC system components. If one is considered without the other, the evaluation cannot accurately capture savings and will underreport ex post results. In other cases interactive effects may cause an overestimation of savings when each measure is treated independently. For this reason alone a fundamental change is needed in the CQM impact evaluation approach. It is essential that a full unit measurement procedure is developed and enacted in coordination with the programs.
The evaluation methodology was motivated in large part by the format of the ex ante claims which did not include interactive effects. We continue to investigate these effects through the ongoing laboratory work under HVAC-5
Disaggregated Methodology
PG&E Furthermore, in the current approach, the evaluation is delayed up to three years after program treatment. As a result, the assessment cannot reliably replicate post conditions and has no ability to measure pre conditions. New methodology may take the form of billing analysis, metering or more comprehensive measurements that take into account all program actions, not just those few for which savings are explicitly claimed. While none of these approaches are perfect, their challenges need to be weighed against the status quo, which is simply not succeeding.
We will investigate additional evaluation methodologies, and anticipate using a billing analysis to evaluate 2013-2015 residential QM programs.
DNV GL – www.dnvgl.com 4/1/16 Page M-20
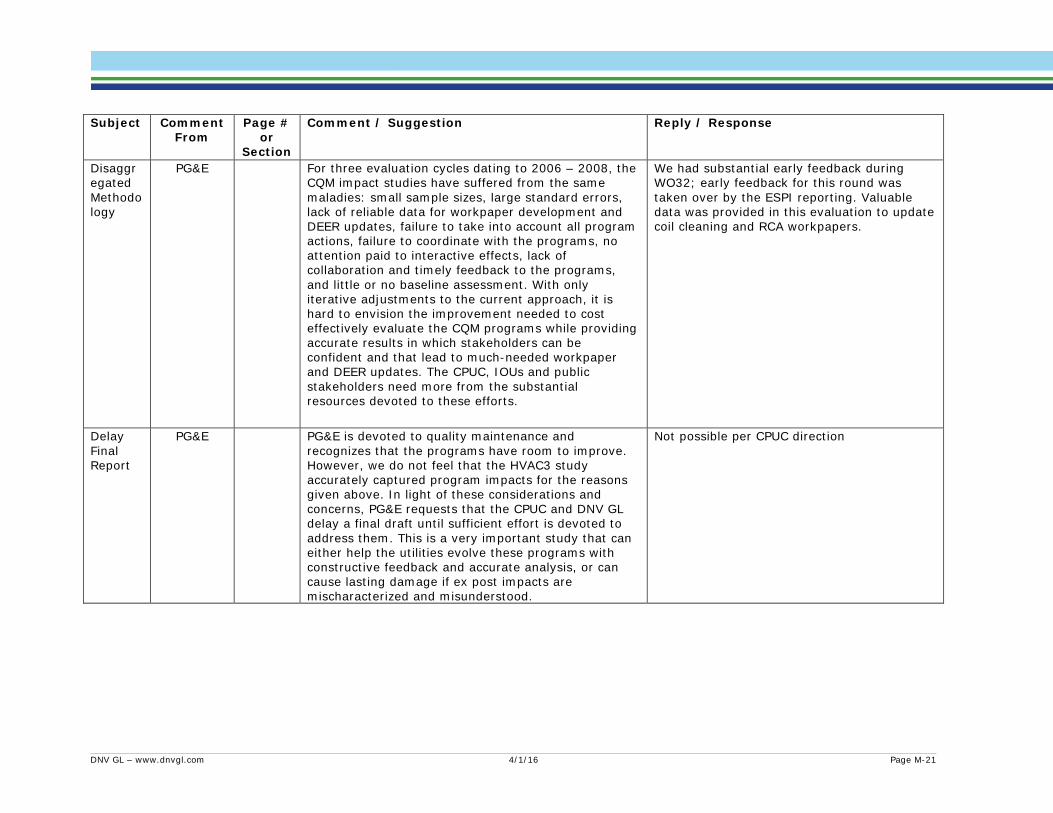
Subject Comment
From Page #
or Section
Comment / Suggestion Reply / Response
Disaggregated Methodology
PG&E For three evaluation cycles dating to 2006 – 2008, the CQM impact studies have suffered from the same maladies: small sample sizes, large standard errors, lack of reliable data for workpaper development and DEER updates, failure to take into account all program actions, failure to coordinate with the programs, no attention paid to interactive effects, lack of collaboration and timely feedback to the programs, and little or no baseline assessment. With only iterative adjustments to the current approach, it is hard to envision the improvement needed to cost effectively evaluate the CQM programs while providing accurate results in which stakeholders can be confident and that lead to much-needed workpaper and DEER updates. The CPUC, IOUs and public stakeholders need more from the substantial resources devoted to these efforts.
We had substantial early feedback during WO32; early feedback for this round was taken over by the ESPI reporting. Valuable data was provided in this evaluation to update coil cleaning and RCA workpapers.
Delay Final Report
PG&E PG&E is devoted to quality maintenance and recognizes that the programs have room to improve. However, we do not feel that the HVAC3 study accurately captured program impacts for the reasons given above. In light of these considerations and concerns, PG&E requests that the CPUC and DNV GL delay a final draft until sufficient effort is devoted to address them. This is a very important study that can either help the utilities evolve these programs with constructive feedback and accurate analysis, or can cause lasting damage if ex post impacts are mischaracterized and misunderstood.
Not possible per CPUC direction
DNV GL – www.dnvgl.com 4/1/16 Page M-21
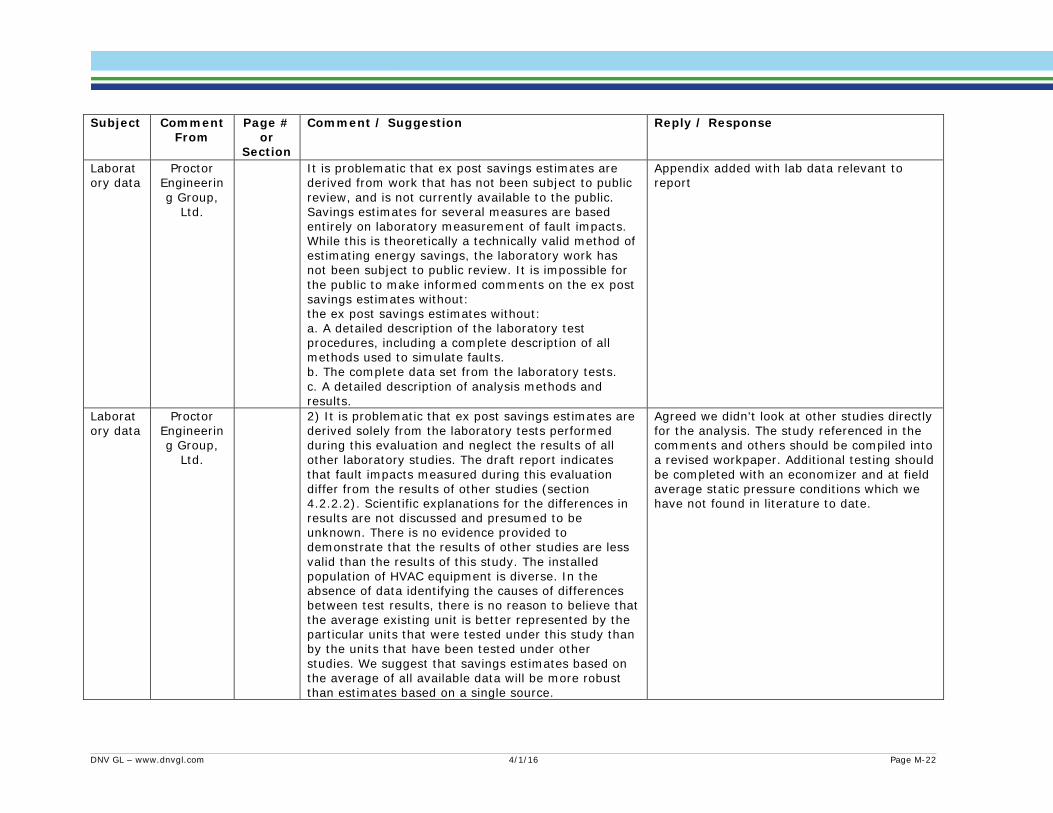
Subject Comment
From Page #
or Section
Comment / Suggestion Reply / Response
Laboratory data
Proctor Engineering Group,
Ltd.
It is problematic that ex post savings estimates are derived from work that has not been subject to public review, and is not currently available to the public. Savings estimates for several measures are based entirely on laboratory measurement of fault impacts. While this is theoretically a technically valid method of estimating energy savings, the laboratory work has not been subject to public review. It is impossible for the public to make informed comments on the ex post savings estimates without: the ex post savings estimates without: a. A detailed description of the laboratory test procedures, including a complete description of all methods used to simulate faults. b. The complete data set from the laboratory tests. c. A detailed description of analysis methods and results.
Appendix added with lab data relevant to report
Laboratory data
Proctor Engineering Group,
Ltd.
2) It is problematic that ex post savings estimates are derived solely from the laboratory tests performed during this evaluation and neglect the results of all other laboratory studies. The draft report indicates that fault impacts measured during this evaluation differ from the results of other studies (section 4.2.2.2). Scientific explanations for the differences in results are not discussed and presumed to be unknown. There is no evidence provided to demonstrate that the results of other studies are less valid than the results of this study. The installed population of HVAC equipment is diverse. In the absence of data identifying the causes of differences between test results, there is no reason to believe that the average existing unit is better represented by the particular units that were tested under this study than by the units that have been tested under other studies. We suggest that savings estimates based on the average of all available data will be more robust than estimates based on a single source.
Agreed we didn't look at other studies directly for the analysis. The study referenced in the comments and others should be compiled into a revised workpaper. Additional testing should be completed with an economizer and at field average static pressure conditions which we have not found in literature to date.
DNV GL – www.dnvgl.com 4/1/16 Page M-22
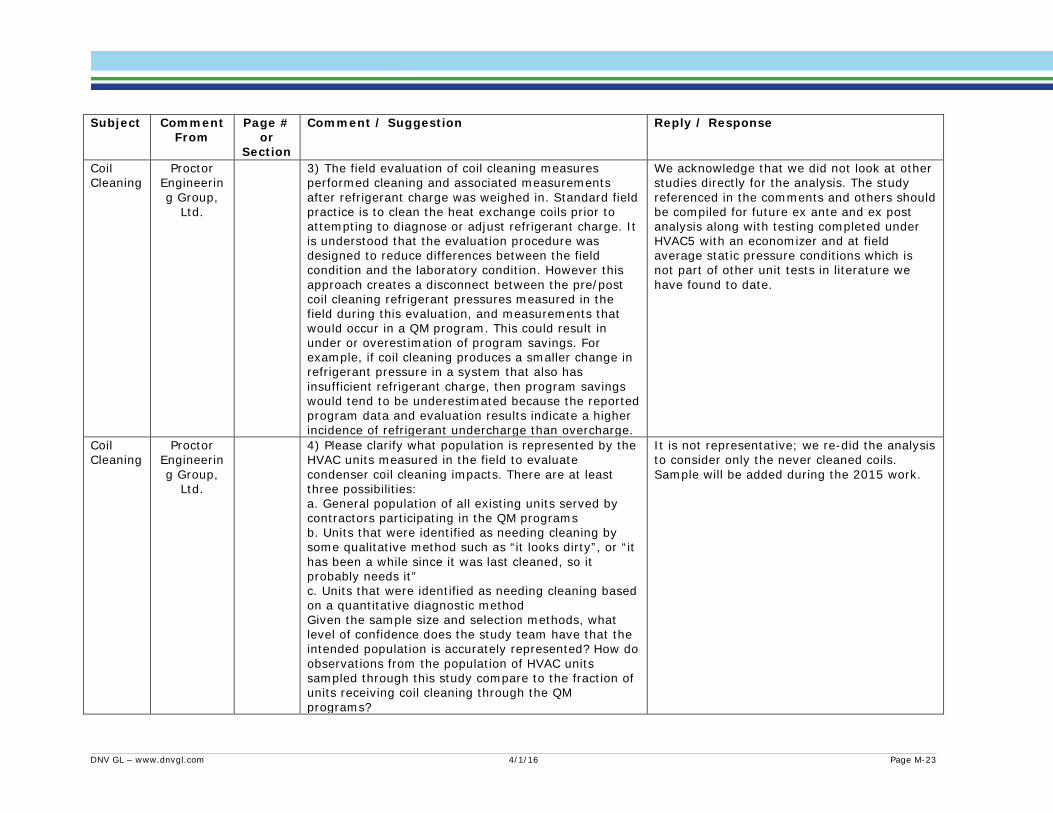
Subject Comment
From Page #
or Section
Comment / Suggestion Reply / Response
Coil Cleaning
Proctor Engineering Group,
Ltd.
3) The field evaluation of coil cleaning measures performed cleaning and associated measurements after refrigerant charge was weighed in. Standard field practice is to clean the heat exchange coils prior to attempting to diagnose or adjust refrigerant charge. It is understood that the evaluation procedure was designed to reduce differences between the field condition and the laboratory condition. However this approach creates a disconnect between the pre/post coil cleaning refrigerant pressures measured in the field during this evaluation, and measurements that would occur in a QM program. This could result in under or overestimation of program savings. For example, if coil cleaning produces a smaller change in refrigerant pressure in a system that also has insufficient refrigerant charge, then program savings would tend to be underestimated because the reported program data and evaluation results indicate a higher incidence of refrigerant undercharge than overcharge.
We acknowledge that we did not look at other studies directly for the analysis. The study referenced in the comments and others should be compiled for future ex ante and ex post analysis along with testing completed under HVAC5 with an economizer and at field average static pressure conditions which is not part of other unit tests in literature we have found to date.
Coil Cleaning
Proctor Engineering Group,
Ltd.
4) Please clarify what population is represented by the HVAC units measured in the field to evaluate condenser coil cleaning impacts. There are at least three possibilities: a. General population of all existing units served by contractors participating in the QM programs b. Units that were identified as needing cleaning by some qualitative method such as “it looks dirty”, or “it has been a while since it was last cleaned, so it probably needs it” c. Units that were identified as needing cleaning based on a quantitative diagnostic method Given the sample size and selection methods, what level of confidence does the study team have that the intended population is accurately represented? How do observations from the population of HVAC units sampled through this study compare to the fraction of units receiving coil cleaning through the QM programs?
It is not representative; we re-did the analysis to consider only the never cleaned coils. Sample will be added during the 2015 work.
DNV GL – www.dnvgl.com 4/1/16 Page M-23
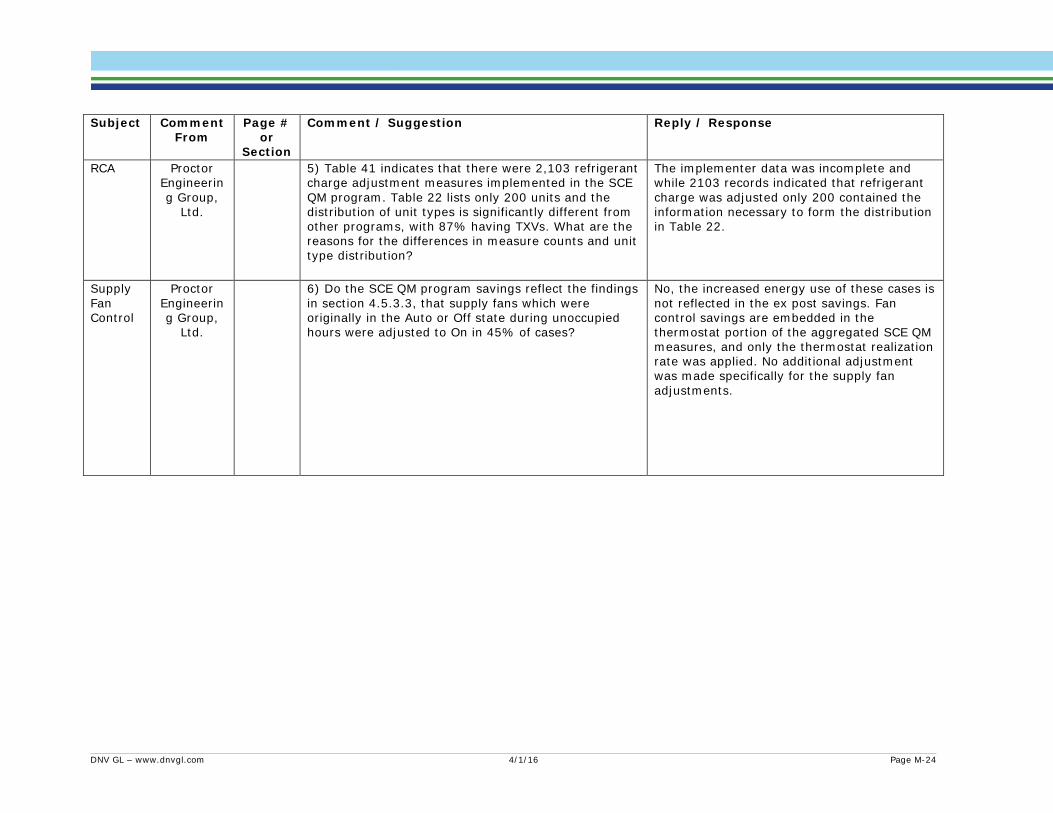
Subject Comment
From Page #
or Section
Comment / Suggestion Reply / Response
RCA Proctor Engineering Group,
Ltd.
5) Table 41 indicates that there were 2,103 refrigerant charge adjustment measures implemented in the SCE QM program. Table 22 lists only 200 units and the distribution of unit types is significantly different from other programs, with 87% having TXVs. What are the reasons for the differences in measure counts and unit type distribution?
The implementer data was incomplete and while 2103 records indicated that refrigerant charge was adjusted only 200 contained the information necessary to form the distribution in Table 22.
Supply Fan Control
Proctor Engineering Group,
Ltd.
6) Do the SCE QM program savings reflect the findings in section 4.5.3.3, that supply fans which were originally in the Auto or Off state during unoccupied hours were adjusted to On in 45% of cases?
No, the increased energy use of these cases is not reflected in the ex post savings. Fan control savings are embedded in the thermostat portion of the aggregated SCE QM measures, and only the thermostat realization rate was applied. No additional adjustment was made specifically for the supply fan adjustments.
DNV GL – www.dnvgl.com 4/1/16 Page M-24
Subject Comment
From Page #
or Section
Comment / Suggestion Reply / Response
eQuest Proctor Engineering Group,
Ltd.
7) Reliance on simulation models that are not proven to produce accurate or reliable results is an ongoing problem. The first table in Appendix 3 illustrates simulation results that don’t make sense. Condenser coil cleaning at a large office building in San Francisco (CZ3) is listed as producing annual savings of 38.3 kWh/ton, while savings for the same measure in Sacramento (CZ12) is listed at 44.9 kWh/ton. This indicates a difference in savings of only 17% between San Francisco and Sacramento, implying a difference in annual cooling energy use of approximately 17%. The Title 24 annual weather files for San Francisco and Sacramento indicate 4,401 base 65 cooling degree hours for San Francisco vs. 40,417 cooling degree hours for Sacramento (difference of 818%). Given the obvious difference in climates, it does not stand to reason that a 10 ton RTU in Sacramento uses only slightly more cooling energy than a 10 ton RTU in San Francisco, yet this is exactly what is implied by the simulation results presented in this study, and by extension the simulation results used in DEER since this study applied the DEER models. What field data exists demonstrating that the energy use and savings estimates produced by these models are representative of reality?
The research plan relied on the DEER models to extrapolate savings for measures.
Program design
John Proctor,
P.E., Independe
nt Consultant
The first problem is that the evaluation does not pinpoint the cause of low energy savings from the programs. These programs are applying criteria that are inappropriate for "Quality Maintenance" which, by definition is different from new installation. The criteria need to be changed to perform only work that will save a significant and measurable amount of energy and peak.
Program design issue we generally agree with.
DNV GL – www.dnvgl.com 4/1/16 Page M-25

Subject Comment
From Page #
or Section
Comment / Suggestion Reply / Response
Laboratory data
John Proctor,
P.E., Independe
nt Consultant
The second problem is that the evaluation depends heavily on "new laboratory tests" without regard to how those tests confirm or call into question existing laboratory test results that have been documented, vetted, and reviewed by other scientists. The "new laboratory tests" are for the most part undisclosed and have not been subject to scrutiny by the scientific HVAC community. This is a huge problem as it can lead the evaluators to incorrect conclusions, which are subject to multiplication in applications across the utility sphere. It is unprofessional to base an evaluation on un-vetted and undisclosed data. It is even worse to totally ignore other research that may call into question or contradict the conclusions drawn from the "new laboratory tests".
Appendix added with lab data relevant to report
Evaporator Coil Cleaning
John Proctor,
P.E., Independe
nt Consultant
Beginning with Problem 2. In some cases it is already clear that these "new laboratory tests" contradict previous laboratory tests. For example it is stated "Even without considering the instrumentation error band, the results showed minimal efficiency and total capacity impacts from reducing evaporator coil blockage. Because of this, we decided that evaporator coil cleaning has savings that are too small to be measured." (Page 31 and Figure 12). Scientifically, the issue is not what percentage of the coil is "blocked" but rather how much the evaporator coil airflow is reduced. This fact pulls together both the program design problem and the evaluation problem (it is flow not % blockage). In Figure 2 of Appendix I (page I-3) there is a graph of efficiency impact due to evaporator coil air flow deficiency (or maybe it is the effect of condenser coil blockage as stated in the text). It shows both total EER and sensible EER effects. Note that only the sensible ERR effect is important for 90+% of California. It appears to support the conclusion on page 31 with respect to total EER (change within measurement error), but indicates an 8% sensible EER loss for a 10% deficiency in airflow. Prior work at numerous labs, including the two below,
This has been updated
DNV GL – www.dnvgl.com 4/1/16 Page M-26

Subject Comment
From Page #
or Section
Comment / Suggestion Reply / Response
show that both total and sensible EERs are lowered by reduced airflow.
Evaporator Coil Cleaning
John Proctor,
P.E., Independe
nt Consultant
The first graph is from work by Heflin and Keller of Carrier Corporation. It plots from right to left, the Total efficiencies (both in cooling and heating) as the airflow across the evaporator coil is reduced. Note that the total efficiency does in fact drop as the flow is reduced. Source: Heflin, C. & F. Keller. 1993. “Steady-State Analysis of Single-Speed Residential Split Systems with Zoning Bypass.” ASHRAE Transactions, Vol. 99, Part 2, Paper number 3693, Pages 40-51. American Society of Heating Refrigeration and Air-Conditioning Engineers. Atlanta GA. Note that in this case the reduced airflow effect was created by a bypass. This is the same phenomenon whether it is caused by a bypass or a restrictive duct system, fouled coil, or whatever. This is evident in the second
Noted
DNV GL – www.dnvgl.com 4/1/16 Page M-27
Subject Comment
From Page #
or Section
Comment / Suggestion Reply / Response
graph, which is strictly reduced airflow.
Evaporator Coil Cleaning
John Proctor,
P.E., Independe
nt Consultant
The second graph is from laboratory tests at Purdue University (Shen, Braun & Groll 2004). This shows the efficiency effect of low airflows outside the range normally published in the manufacturers’ extended data tables. Source: Shen, B., J. Braun, & E. Groll. 2004. “Other Steady-state Tests for ASHRAE Project” in Steady-state Tests1, Section Title: Series V: Change indoor airflow rate under wet condition. Ray W. Herrick Laboratories, The School of Mechanical Engineering, Purdue University. West Lafayette, IN. Note that the range of data being larger that that reported in Appendix I (Mowris 2015) shows the curve of reduced Sensible EER from reduced evaporator coil airflow.
Noted
DNV GL – www.dnvgl.com 4/1/16 Page M-28

Subject Comment
From Page #
or Section
Comment / Suggestion Reply / Response
Evaporator Coil Cleaning
John Proctor,
P.E., Independe
nt Consultant
Note that the Mowris data do not agree with the Shen, Braun, and Groll data for Sensible EER at the 10% evaporator coil deficiency level. The Mowris data suggests 8% sensible EER reduction while the Shen, Braun, and Groll data suggest only 4%. Without the full range of data and confirmation by other researchers where possible, the real problems are hidden. This is part of problem number 1. The programs allow the contractors to make airflow changes that are too small to achieve significant savings. If the savings exist they are lost in the noise. As such they cannot be cost effective for anyone other than the contractors.
Agreed we did not look at other studies directly for the analysis. The study referenced in the comments and others should be compiled into a revised workpaper. Agreed that there should be a guideline for minimum fault level to merit measure installation.
RCA John Proctor,
P.E., Independe
nt Consultant
The evaluation makes a big deal out of whether the manufacturer's charge level as set by weight or checked by another measurement is the correct charge level. The manufacturer sets the charge level by weight to some internal criteria (preserve the compressor, high efficiencies in particular tests, etc.). The amount of refrigerant by weight is the "proper" amount of refrigerant for a new PACKAGE UNIT installed as tested in the lab (evaporator and condenser coil airflows for example). At the same time they recognize that it is impractical for a technician to weigh out the charge as part of normal or even "Quality" maintenance. Therefore they supply other criteria to determine if the amount of refrigerant is "close enough". Their criteria are not designed to find units that require sufficient changes in the refrigerant levels based on available efficiency change of potential energy savings. As such their criteria may not be (and are not) the criteria that should be applied in a utility program. This returns us to problem number 1. The programs allow the contractors to make refrigerant charge changes that are too small to achieve significant savings.
Agreed that small changes should not be made as stated above. FDD diagnostics are still not very accurate as described by HVAC 5 and other researchers.
DNV GL – www.dnvgl.com 4/1/16 Page M-29
Subject Comment
From Page #
or Section
Comment / Suggestion Reply / Response
RCA John Proctor,
P.E., Independe
nt Consultant
The evaluation contends that the proper amount of charge in the unit is the same regardless of whether the airflows are as designed or not. They support this position based on questionable data from prior evaluations by the same evaluators. They maintain that "Laboratory tests published in the last few years showed the diagnostic tests to be unreliable" page 39. It is not true that ALL DIAGNOSTIC TESTS ARE UNRELIABLE. In some cases these investigators misapplied the diagnostic tests and have never addressed these deficiencies. (DNV GL, HVAC Impact Evaluation FINAL Report WO32 HVAC – Volume 1: Report, Jan. 28, 2015. http://www.calmac.org/publications/FINAL_HVAC_Impact_Evaluation_WO32_Report_28Jan2015_Volume1_ReportES.pdf).
The reliability of diagnostic testing is an emerging issue. Agreed, not all tests are unreliable, but still think weighing the charge is the best evaluation methodology.
RCA John Proctor,
P.E., Independe
nt Consultant
It is important that such statements be corrected so as to not spread incorrect or partially incorrect information to policy makers.
Agreed. Reviewed language and removed broad statements about FDD reliability.
DNV GL – www.dnvgl.com 4/1/16 Page M-30

Subject Comment
From Page #
or Section
Comment / Suggestion Reply / Response
RCA John Proctor,
P.E., Independe
nt Consultant
Now to Problem 1. The utility programs have largely implemented the manufacturers' diagnostic tests or other proprietary tests. In the case of split air conditioners these tests are designed to ensure proper installation of the units (although the specifications do not mean the contractors necessarily follow them). In the case of package units the tests are made available to the contractors for rapid checks of the units. In both cases the tolerance limits are too narrow for utility programs that are designed to improve the efficiency, save energy, and reduce peak. The airflow and refrigerant diagnoses acceptance parameters need to be adjusted to: 1) only authorize rebates for adjustments if the original parameter measurement is in the range that an adjustment will achieve significant savings, and 2) That rebates be paid for adjustments that are large enough to achieve sufficient savings. The programs have consistently failed to follow these principles As a result the programs' wasted efforts on minor (or fake) changes in duct leakage, refrigerant charge, evaporator airflow, and condenser coil "cleaning" have doomed the programs to the trash bin. There are available energy savings in all these measures, but they lie with the units that are significantly out specification, not the average unit in California
We generally agree and will investigate further in the next round (2015)
DNV GL – www.dnvgl.com 4/1/16 Page M-31
Subject Comment
From Page #
or Section
Comment / Suggestion Reply / Response
Evaporator Coil Cleaning
Modera, UC Davis
the treatment of maintenance procedures to address blockage of evaporator coils was brought to my attention. On reviewing that section of the report, it seems that the report concludes that blocking evaporator coils has no impact on energy efficiency, and therefore should be assumed to not provide any energy savings. In brief, I do not agree with this conclusion. The reasons for my lack of agreement are as follows: 1. Total EER is generally not the appropriate metric for evaluating energy savings in California, as the sensible heat ratio of cooling loads in California buildings is generally very high (with the exception of a few applications such as indoor swimming pools, gyms and fresh food sections of grocery stores). Thus, the appropriate metric for cooling energy use in California is the Sensible EER. In this very report (on page 141 of 178) it is shown that a 10% decrease in evaporator flow results in a 10% drop in Sensible EER, which is a significant impact (and represents a savings potential associated with cleaning an evaporator coil so as to increase air flow).
Updating the analysis
DNV GL – www.dnvgl.com 4/1/16 Page M-32
Subject Comment
From Page #
or Section
Comment / Suggestion Reply / Response
Evaporator Coil Cleaning
Modera, UC Davis
The data presented on page 38 only look at total EER, and are difficult to compare with published data on the impact of reducing evaporator air flow, or even with the data on page 141. One problem is that the X-axis is “%blocked” rather than “% flow reduction”. “%blocked” is not a precise measure of the parameter of interest which is “% flow reduction”. As an example, 50% blockage will have a very different impact on an undersized coil versus an oversized coil, and the blockage could have no impact on coil flowrate for certain types of indoor fans (e.g. those that speed up to maintain flow independent of pressure). Another way to say this is that the impact of 50% blockage on flow is much smaller if the coil does not represent the predominant flow resistance. This is one example of the second problem, which is that the data presented are not complete enough to draw any reliable conclusions. Another example is that the conditions of the air entering the evaporator are not specified. The reason this is important is that the impact of reducing evaporator coil flow depends upon the conditions under which that area restriction occurs. For example, if you start with dry-coil operation at the design flow rate, reducing flow will at some point result in wet-coil operation, at which point the sensible capacity will be reduced in favor of latent heat removal, which is in many cases not required in California. The main point is that the appropriateness of the data presented (and therefore the conclusions drawn) is impossible to verify without more complete information. This is a key tenant of the scientific method, which is presumably the standard by which this report should be judged.
Updating the analysis
DNV GL – www.dnvgl.com 4/1/16 Page M-33
Subject Comment
From Page #
or Section
Comment / Suggestion Reply / Response
Disaggregated Methodology
Shayne Holderby, Honeywell
Section 1.1 States that the evaluation team addressed high impact measure groups. Our understanding of this is DNV-GL only monitored the specific measure for savings as opposed to the system. HSGS and other groups including the WHPA, ASHRAE, ACCA and all of the IOU’s have all commented on earlier evaluations that in order to determine actual savings you must consider the impact of all measures performed on the savings of the unit. We think it is necessary to determine the impact on all measures on the overall efficiency improvement of a unit in order to accurately determine savings. In each case where this issue is discussed with DNV-GL they continue to claim that they can estimate actual savings by a combination of lab testing and field testing. We feel this approach has not worked on multiple reviews for the following reasons: a. In each evaluation DNV-GL has not been able to achieve the statistically insignificant number of units claimed to be needed to perform an assessment and has instead used statistical calculations to try and estimate the impact of not performing the required field inspections. b. Lab studies conducted in a controlled environment by DNV-GLs own comments have provided inconsistent measurement of savings. If the savings cannot be determined with repeatable accuracy in the lab, how accurate can they be in determining the conditions in the field? c. Since the method chosen by DNV-GL requires so many variables in the lab environment and then compared to field measurements they have limited the number of tests to what are claimed to be the 5 most “relevant” measures. Without consideration as to the impact of the other 17 measures (non-incentivized) performed in the field they cannot possibly accurately predict actual energy savings of either the measures tested or the overall efficiency improvements created by the other measures.
We could only evaluate aggregated measures for the only program that claimed such measures: SCE. Because of the way PGE claimed savings it made the most sense to evaluate them on a measure basis.
DNV GL – www.dnvgl.com 4/1/16 Page M-34
Subject Comment
From Page #
or Section
Comment / Suggestion Reply / Response
Coil Cleaning
Shayne Holderby, Honeywell
Table 1 does not provide a realization rate for Coil Cleaning, maybe because PG&E was no longer claiming the incentive, however all the data for this activity was recorded and available to DNV-GL during their evaluation period? a. In all testing performed by DNV-GL the IOU and the implementers have informed the evaluator that all data for testing is contained in the implementers data record. In every study DNV-GL has claimed to not be able to locate the information but at no time has DNV-GL made any inquiries to any party to help find the relevant data.
We provided ex post savings based on new data from PG&E for coil cleaning.
RCA Shayne Holderby, Honeywell
1.3.2 1.3.2 “A random sample of 25 single-compressor and 11 dual-compressor packaged rooftop air conditioners from project year 2013 was used for the assessment.” Based on the size of the actual installed based (over 9000 units) this is well below a statistically significant number of evaluated units. a. Since DNV-GL has continually provided fewer units than they claimed would be required to determine energy savings and efficiency improvements; how are they able to make recommendations on actual energy savings without a significantly large margin for error?
The precision for the RCA measure is 47% at 90% confidence. This is statistically significant.
Economizers
Shayne Holderby, Honeywell
1.3.3 1.3.3 “DNV GL developed installation rates based upon the results of field inspections of a random sample of 123 units at 45 sites” That is for all three utilities to test Economizer savings. Again far below a statistically significant threshold. a. Comments made during the report review indicated that they inspected a significant number of Analog Economizers to determine functionality and savings estimates. In at least the PG&E CQM program replaced economizers must be DIGITAL (ADEC), if they were inspecting units with analog units they were only checking on repaired systems vs replaced systems (assuming the units checked were even enrolled in an IOU program).
We investigated multiple measures within the economizer measure group. Our investigation included economizer repair and economizer replacement measures as well as controls repair and controls replacement.
DNV GL – www.dnvgl.com 4/1/16 Page M-35

Subject Comment
From Page #
or Section
Comment / Suggestion Reply / Response
Thermostat
Shayne Holderby, Honeywell
1.3.4 1.3.4 “DNV GL developed installation rates based upon the results of field inspections of a random sample of 56 units at 11 sites.” Testing for T-Stat installations, again way below a statistically significant number and also not providing IOU specific data so no idea if they were actually inspecting units where t-stats had been reprogrammed, replaced or not changed.
The thermostats that we inspected had been reprogrammed or replaced through the program.
Specify sampled units
Shayne Holderby, Honeywell
2.1 2.1 “Robert Mowris & Associates, Inc. (RMA) and two independent subcontractors helped DNV GL achieve these objectives by reviewing program data and collecting new primary data that support defensible ex post savings estimates.” a. In previous reports from these evaluators we requested significantly more data on what was checked and where the systems were checked. Instead of providing more data to help IOUs evaluate the claimed results the latest report includes virtually no field specific information to allow for review of results. b. Based on previous claims of units where incentives were claimed for repairs and equipment was not functioning (WO32 report), followed up by our Quality Control staff inspections it was determined that several units inspected for specific measures did not have those measures performed or where statements were made about non-functionality it was clear from pictures provided that the ADEC actually showed test passed (functional). No such documentation has been provided with the most recent evaluation limiting our ability to verify results.
Data provided as Appendix
Coil Cleaning
Shayne Holderby, Honeywell
3.1 3.1 “Condenser and evaporator coil cleaning data is non-existent for the QM programs, but cleaning data is available for the tune up programs.” The preceding statement is false. All data for Condenser and evaporator data is present in the contractor portal for every unit brought to baseline.
PGE CQM coil cleaning claims have been located.
DNV GL – www.dnvgl.com 4/1/16 Page M-36
Subject Comment
From Page #
or Section
Comment / Suggestion Reply / Response
Economizers
Shayne Holderby, Honeywell
3.1 3.1 “Economizer: The economizer information was inconsistently populated across the programs, and was not useful to the measure evaluation. In particular, the pre-implementation and post implementation changeover set point data was unpopulated and could not be used to validate the assumptions in the models used to develop ex ante savings”. Obviously incorrect as the question must be answered for the incentive for this measure to even populate in the Implementers portal. An example is provided below of the required questions and responses.
There may have been a problem with the data that we were provided
Thermostat
Shayne Holderby, Honeywell
Table 4 Table 4 Target Sample indicates a total of 15 sites out of a potential 800 were selected to represent the entire program for PG&E C-QM. Further on in the documentation it becomes clear that DNV-GL actually used only 3 sites to make the determination for all units enrolled in the program.
There were eleven sites overall completed in the sample from PGE's CQM program: 8 Economizer and 3 RCA. As stated in the research plan, results for all programs were combined for the RCA measure.
DNV GL – www.dnvgl.com 4/1/16 Page M-37
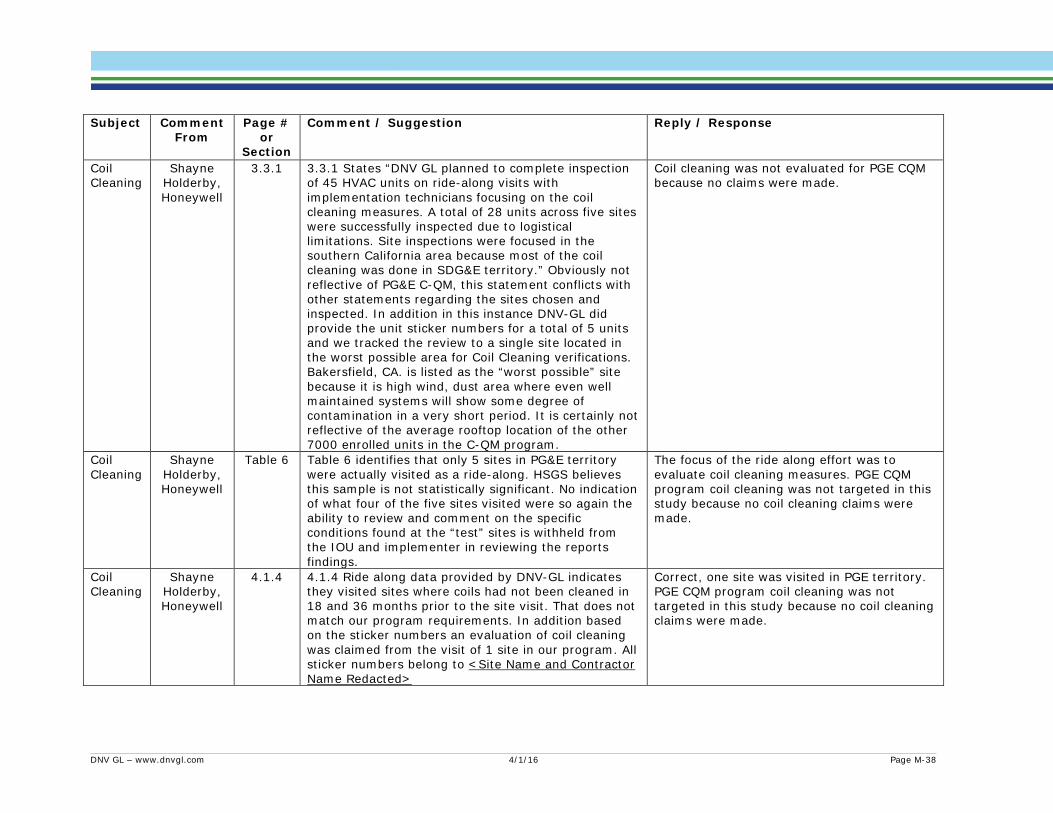
Subject Comment
From Page #
or Section
Comment / Suggestion Reply / Response
Coil Cleaning
Shayne Holderby, Honeywell
3.3.1 3.3.1 States “DNV GL planned to complete inspection of 45 HVAC units on ride-along visits with implementation technicians focusing on the coil cleaning measures. A total of 28 units across five sites were successfully inspected due to logistical limitations. Site inspections were focused in the southern California area because most of the coil cleaning was done in SDG&E territory.” Obviously not reflective of PG&E C-QM, this statement conflicts with other statements regarding the sites chosen and inspected. In addition in this instance DNV-GL did provide the unit sticker numbers for a total of 5 units and we tracked the review to a single site located in the worst possible area for Coil Cleaning verifications. Bakersfield, CA. is listed as the “worst possible” site because it is high wind, dust area where even well maintained systems will show some degree of contamination in a very short period. It is certainly not reflective of the average rooftop location of the other 7000 enrolled units in the C-QM program.
Coil cleaning was not evaluated for PGE CQM because no claims were made.
Coil Cleaning
Shayne Holderby, Honeywell
Table 6 Table 6 identifies that only 5 sites in PG&E territory were actually visited as a ride-along. HSGS believes this sample is not statistically significant. No indication of what four of the five sites visited were so again the ability to review and comment on the specific conditions found at the “test” sites is withheld from the IOU and implementer in reviewing the reports findings.
The focus of the ride along effort was to evaluate coil cleaning measures. PGE CQM program coil cleaning was not targeted in this study because no coil cleaning claims were made.
Coil Cleaning
Shayne Holderby, Honeywell
4.1.4 4.1.4 Ride along data provided by DNV-GL indicates they visited sites where coils had not been cleaned in 18 and 36 months prior to the site visit. That does not match our program requirements. In addition based on the sticker numbers an evaluation of coil cleaning was claimed from the visit of 1 site in our program. All sticker numbers belong to <Site Name and Contractor Name Redacted>
Correct, one site was visited in PGE territory. PGE CQM program coil cleaning was not targeted in this study because no coil cleaning claims were made.
DNV GL – www.dnvgl.com 4/1/16 Page M-38
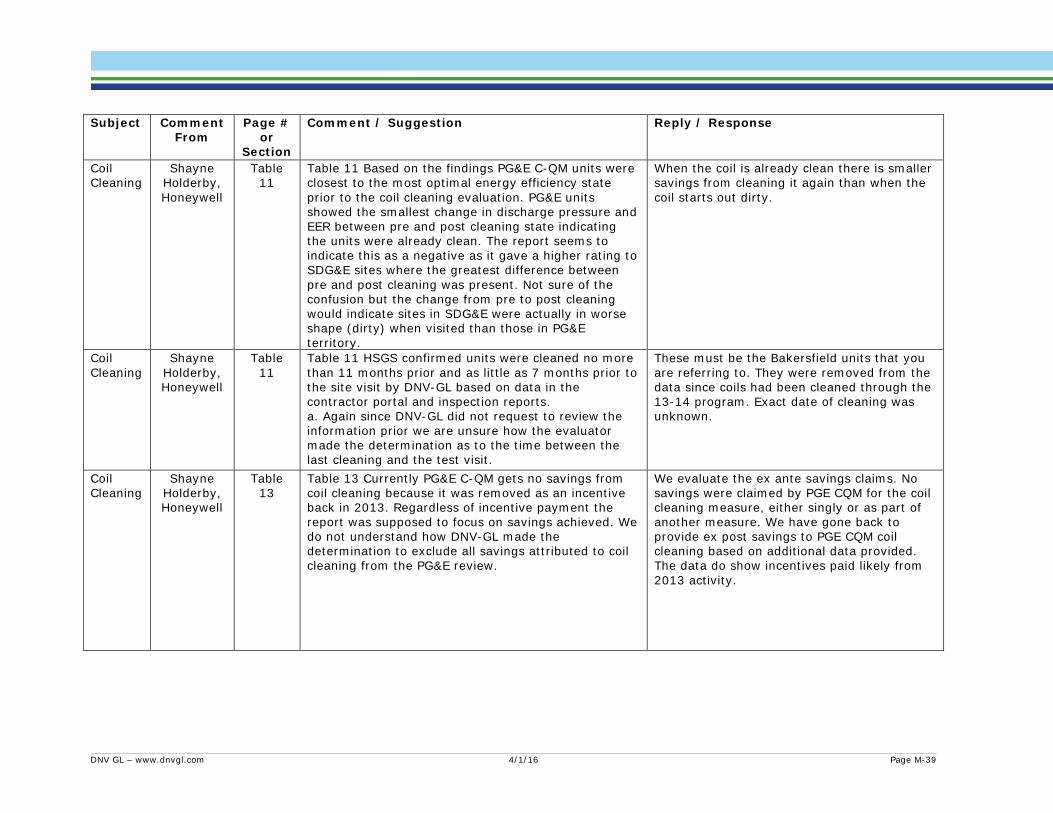
Subject Comment
From Page #
or Section
Comment / Suggestion Reply / Response
Coil Cleaning
Shayne Holderby, Honeywell
Table 11
Table 11 Based on the findings PG&E C-QM units were closest to the most optimal energy efficiency state prior to the coil cleaning evaluation. PG&E units showed the smallest change in discharge pressure and EER between pre and post cleaning state indicating the units were already clean. The report seems to indicate this as a negative as it gave a higher rating to SDG&E sites where the greatest difference between pre and post cleaning was present. Not sure of the confusion but the change from pre to post cleaning would indicate sites in SDG&E were actually in worse shape (dirty) when visited than those in PG&E territory.
When the coil is already clean there is smaller savings from cleaning it again than when the coil starts out dirty.
Coil Cleaning
Shayne Holderby, Honeywell
Table 11
Table 11 HSGS confirmed units were cleaned no more than 11 months prior and as little as 7 months prior to the site visit by DNV-GL based on data in the contractor portal and inspection reports. a. Again since DNV-GL did not request to review the information prior we are unsure how the evaluator made the determination as to the time between the last cleaning and the test visit.
These must be the Bakersfield units that you are referring to. They were removed from the data since coils had been cleaned through the 13-14 program. Exact date of cleaning was unknown.
Coil Cleaning
Shayne Holderby, Honeywell
Table 13
Table 13 Currently PG&E C-QM gets no savings from coil cleaning because it was removed as an incentive back in 2013. Regardless of incentive payment the report was supposed to focus on savings achieved. We do not understand how DNV-GL made the determination to exclude all savings attributed to coil cleaning from the PG&E review.
We evaluate the ex ante savings claims. No savings were claimed by PGE CQM for the coil cleaning measure, either singly or as part of another measure. We have gone back to provide ex post savings to PGE CQM coil cleaning based on additional data provided. The data do show incentives paid likely from 2013 activity.
DNV GL – www.dnvgl.com 4/1/16 Page M-39
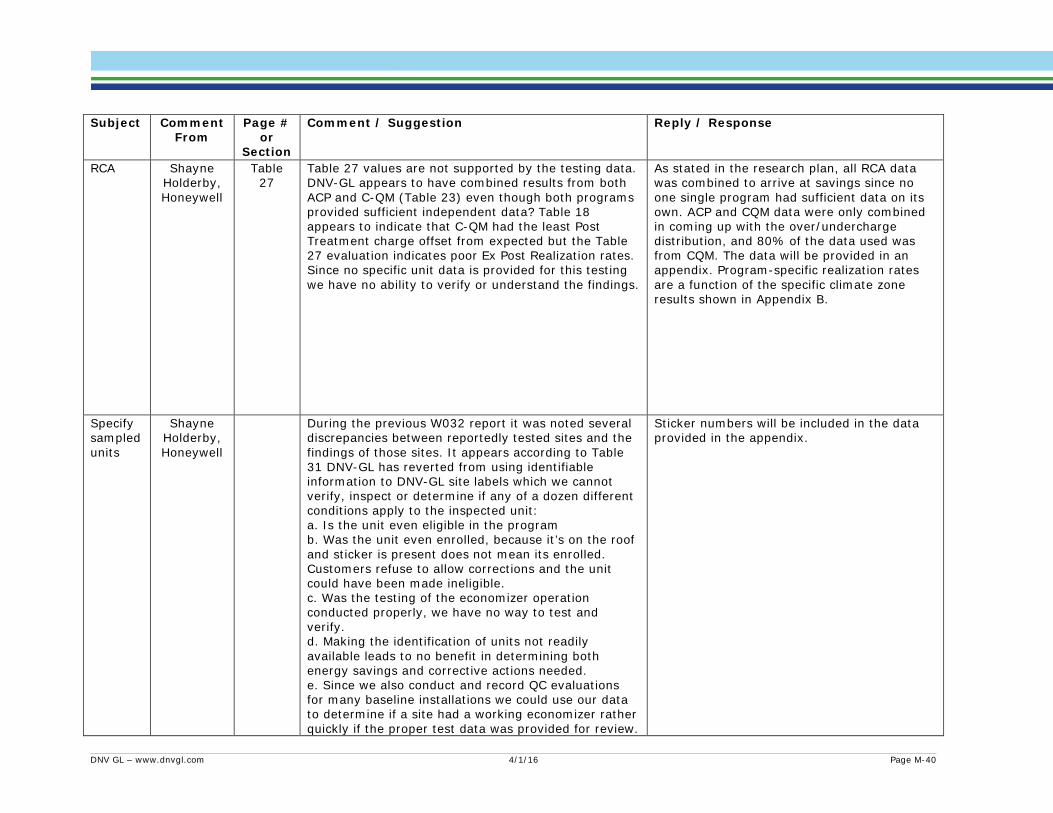
Subject Comment
From Page #
or Section
Comment / Suggestion Reply / Response
RCA Shayne Holderby, Honeywell
Table 27
Table 27 values are not supported by the testing data. DNV-GL appears to have combined results from both ACP and C-QM (Table 23) even though both programs provided sufficient independent data? Table 18 appears to indicate that C-QM had the least Post Treatment charge offset from expected but the Table 27 evaluation indicates poor Ex Post Realization rates. Since no specific unit data is provided for this testing we have no ability to verify or understand the findings.
As stated in the research plan, all RCA data was combined to arrive at savings since no one single program had sufficient data on its own. ACP and CQM data were only combined in coming up with the over/undercharge distribution, and 80% of the data used was from CQM. The data will be provided in an appendix. Program-specific realization rates are a function of the specific climate zone results shown in Appendix B.
Specify sampled units
Shayne Holderby, Honeywell
During the previous W032 report it was noted several discrepancies between reportedly tested sites and the findings of those sites. It appears according to Table 31 DNV-GL has reverted from using identifiable information to DNV-GL site labels which we cannot verify, inspect or determine if any of a dozen different conditions apply to the inspected unit: a. Is the unit even eligible in the program b. Was the unit even enrolled, because it’s on the roof and sticker is present does not mean its enrolled. Customers refuse to allow corrections and the unit could have been made ineligible. c. Was the testing of the economizer operation conducted properly, we have no way to test and verify. d. Making the identification of units not readily available leads to no benefit in determining both energy savings and corrective actions needed. e. Since we also conduct and record QC evaluations for many baseline installations we could use our data to determine if a site had a working economizer rather quickly if the proper test data was provided for review.
Sticker numbers will be included in the data provided in the appendix.
DNV GL – www.dnvgl.com 4/1/16 Page M-40
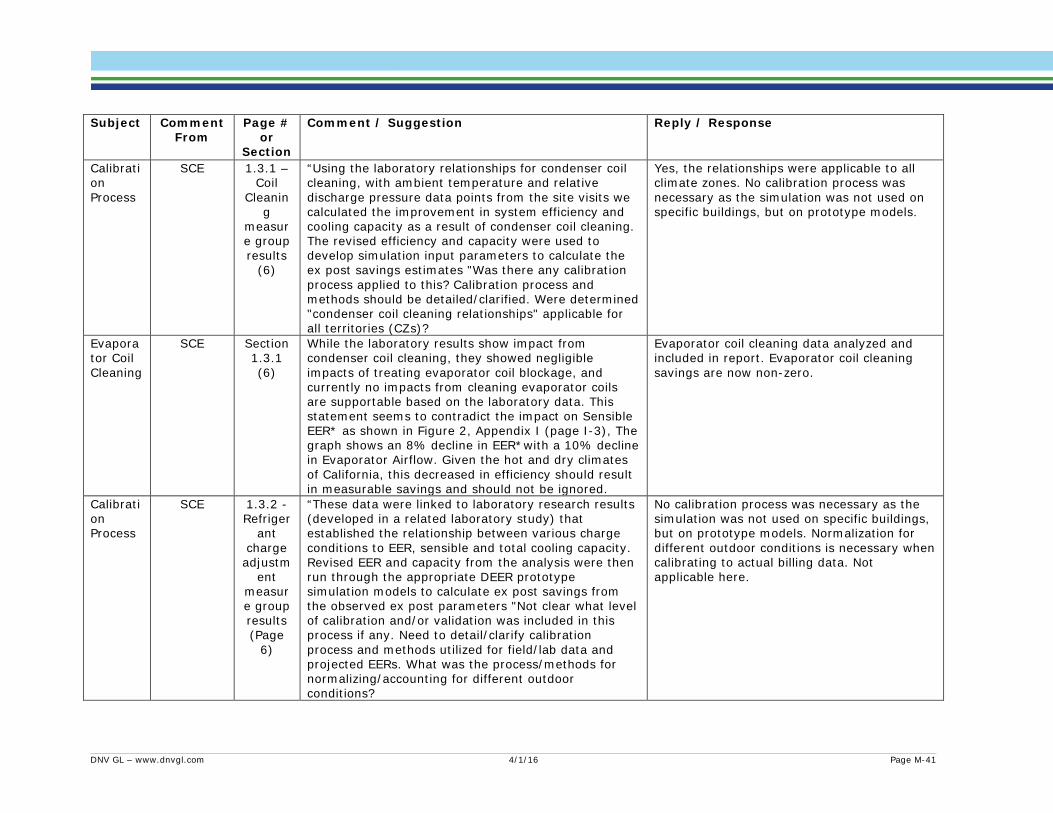
Subject Comment
From Page #
or Section
Comment / Suggestion Reply / Response
Calibration Process
SCE 1.3.1 – Coil
Cleaning
measure group results
(6)
“Using the laboratory relationships for condenser coil cleaning, with ambient temperature and relative discharge pressure data points from the site visits we calculated the improvement in system efficiency and cooling capacity as a result of condenser coil cleaning. The revised efficiency and capacity were used to develop simulation input parameters to calculate the ex post savings estimates "Was there any calibration process applied to this? Calibration process and methods should be detailed/clarified. Were determined "condenser coil cleaning relationships" applicable for all territories (CZs)?
Yes, the relationships were applicable to all climate zones. No calibration process was necessary as the simulation was not used on specific buildings, but on prototype models.
Evaporator Coil Cleaning
SCE Section 1.3.1 (6)
While the laboratory results show impact from condenser coil cleaning, they showed negligible impacts of treating evaporator coil blockage, and currently no impacts from cleaning evaporator coils are supportable based on the laboratory data. This statement seems to contradict the impact on Sensible EER* as shown in Figure 2, Appendix I (page I-3), The graph shows an 8% decline in EER*with a 10% decline in Evaporator Airflow. Given the hot and dry climates of California, this decreased in efficiency should result in measurable savings and should not be ignored.
Evaporator coil cleaning data analyzed and included in report. Evaporator coil cleaning savings are now non-zero.
Calibration Process
SCE 1.3.2 - Refriger
ant charge adjustm
ent measure group results (Page
6)
“These data were linked to laboratory research results (developed in a related laboratory study) that established the relationship between various charge conditions to EER, sensible and total cooling capacity. Revised EER and capacity from the analysis were then run through the appropriate DEER prototype simulation models to calculate ex post savings from the observed ex post parameters "Not clear what level of calibration and/or validation was included in this process if any. Need to detail/clarify calibration process and methods utilized for field/lab data and projected EERs. What was the process/methods for normalizing/accounting for different outdoor conditions?
No calibration process was necessary as the simulation was not used on specific buildings, but on prototype models. Normalization for different outdoor conditions is necessary when calibrating to actual billing data. Not applicable here.
DNV GL – www.dnvgl.com 4/1/16 Page M-41
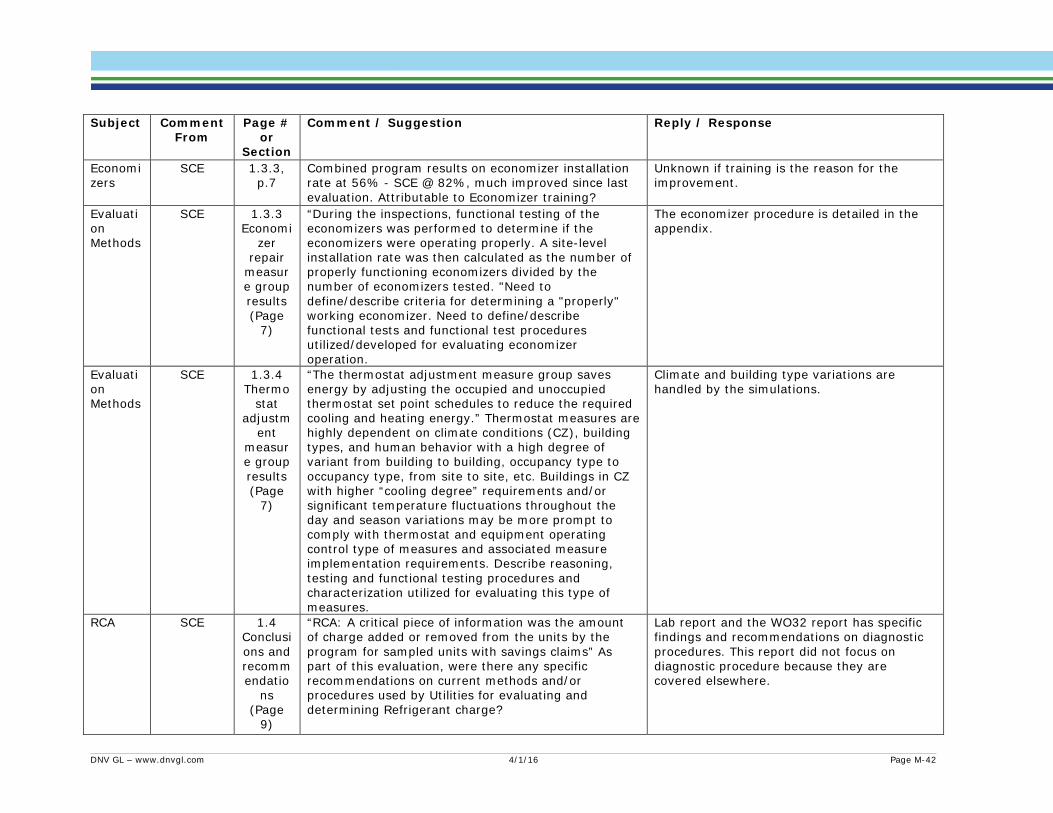
Subject Comment
From Page #
or Section
Comment / Suggestion Reply / Response
Economizers
SCE 1.3.3, p.7
Combined program results on economizer installation rate at 56% - SCE @ 82%, much improved since last evaluation. Attributable to Economizer training?
Unknown if training is the reason for the improvement.
Evaluation Methods
SCE 1.3.3 Economi
zer repair
measure group results (Page
7)
“During the inspections, functional testing of the economizers was performed to determine if the economizers were operating properly. A site-level installation rate was then calculated as the number of properly functioning economizers divided by the number of economizers tested. "Need to define/describe criteria for determining a "properly" working economizer. Need to define/describe functional tests and functional test procedures utilized/developed for evaluating economizer operation.
The economizer procedure is detailed in the appendix.
Evaluation Methods
SCE 1.3.4 Thermo
stat adjustm
ent measure group results (Page
7)
“The thermostat adjustment measure group saves energy by adjusting the occupied and unoccupied thermostat set point schedules to reduce the required cooling and heating energy.” Thermostat measures are highly dependent on climate conditions (CZ), building types, and human behavior with a high degree of variant from building to building, occupancy type to occupancy type, from site to site, etc. Buildings in CZ with higher “cooling degree” requirements and/or significant temperature fluctuations throughout the day and season variations may be more prompt to comply with thermostat and equipment operating control type of measures and associated measure implementation requirements. Describe reasoning, testing and functional testing procedures and characterization utilized for evaluating this type of measures.
Climate and building type variations are handled by the simulations.
RCA SCE 1.4 Conclusions and recommendatio
ns (Page
9)
“RCA: A critical piece of information was the amount of charge added or removed from the units by the program for sampled units with savings claims” As part of this evaluation, were there any specific recommendations on current methods and/or procedures used by Utilities for evaluating and determining Refrigerant charge?
Lab report and the WO32 report has specific findings and recommendations on diagnostic procedures. This report did not focus on diagnostic procedure because they are covered elsewhere.
DNV GL – www.dnvgl.com 4/1/16 Page M-42

Subject Comment
From Page #
or Section
Comment / Suggestion Reply / Response
Record Review and Recommendations
SCE 1.4 / 8-9
Many of the recommendations from the records review are already implemented within the SCE CQM program:-Collect discharge pressure and outdoor temperature before and after coil cleaning.-'Collect both the existing (“test-in”) and modified (“test-out”) economizer changeover set point. The program additionally collects information around each and every component in the economizer section, asking the technician to specifically address each component’s status and to enter recommendations for repair, replacement, cleaning, or adjustment of each of these components.-Collect existing (“test-in”) and modified (“test-out”) thermostat set point.-Collect existing (“test-in”) and modified (“test-out”) supply fan control fan state.
In some cases these data fields were sparsely populated. We recommend additional QC of the data.
Record Review and Recommendations
SCE 1.4 / 9 “Requiring the implementers to submit a photograph of the economizer open and closed for each claimed economizer would necessitate the implementer putting the economizer through its paces after installing the measure and increase the number of economizers left in working order.”SCE CQM already collects alternate documentation in the form of written technician verification which highlights economizer component condition before and after any repairs are performed. Photos alone would not provide such clear verification nor would they augment verification due to realistic issues with complex rooftop lighting conditions and unit identification (do the dampers
SCE economizers performed quite a bit better than those in other programs. The strategies seem effective.
Economizers
SCE 1.4, p. 9
“Repaired” economizers that did not operate – for SCE at 82%, were inoperable systems primarily analog or digital? Economizer training had not previously been required for the program unless participant was applying for an ADEC incentive – gap has been addressed. Economizer training is now mandatory for technicians performing work in CQM. It includes: analog, digital, dcv/vfd.
The operational rate for the SCE economizers was 82%, which means that 18% were non-operational. We are investigating the breakdown of analog vs digital controllers in our economizer sample and the breakdown for failed vs working units.
DNV GL – www.dnvgl.com 4/1/16 Page M-43

Subject Comment
From Page #
or Section
Comment / Suggestion Reply / Response
Participation Records Key Findings
SCE 3.1 / 20 “Only the PGE Commercial QM and SDG&E Direct Install program implementers recorded pre and post-implementation thermostat set point temperatures.” (p.20)The SCE CQM program does collect pre and post-implementation thermostat set point temperatures and fan setting.
Those fields were poorly populated in the SCE data.
Feedback/ recommendations on measure implementation methods – Economizer Repair
SCE 1.4 Conclusions and recommendatio
ns (Page
9)
“Economizer repair: We found many economizers “repaired” through the programs that did not operate”As part of this evaluation, were there any specific comments and/or recommendations on functional and/or functional test procedures that IOUs shall include to improve evaluation of this measure?
The specific procedures can be found in the appendix. Furthermore, the WHPA is releasing an economizer document that addresses these issues.
Evaluation Methods – Interactive effects
SCE 2.4 Field M&V
approach (Page
18)
“Thus, data were collected on observed operational parameters and conditions such as the amount of refrigerant, pressures, temperatures, and set points. We collected data on the settings, quantities, and other parameters that go into savings calculations, which allowed the team to use either an engineering model, a prototypical building simulation model or a combination of the two to generate total savings…”Where interactive effects among measures evaluated? Describe reasoning and/or basis for excluding interactive effects? If evaluated, for which measures are interactive effects expected to significantly affect measure impacts? Similarly, for which measures are interactive effects expected NOT to significantly affect
The measure level analysis was motivated in part because of how measures were tracked by other IOUs. There are limitation of the measure approach (interactive effects not considered), but unit pre/post kWh analysis was very difficult last round and needed an extremely large sample because of large CV.
DNV GL – www.dnvgl.com 4/1/16 Page M-44
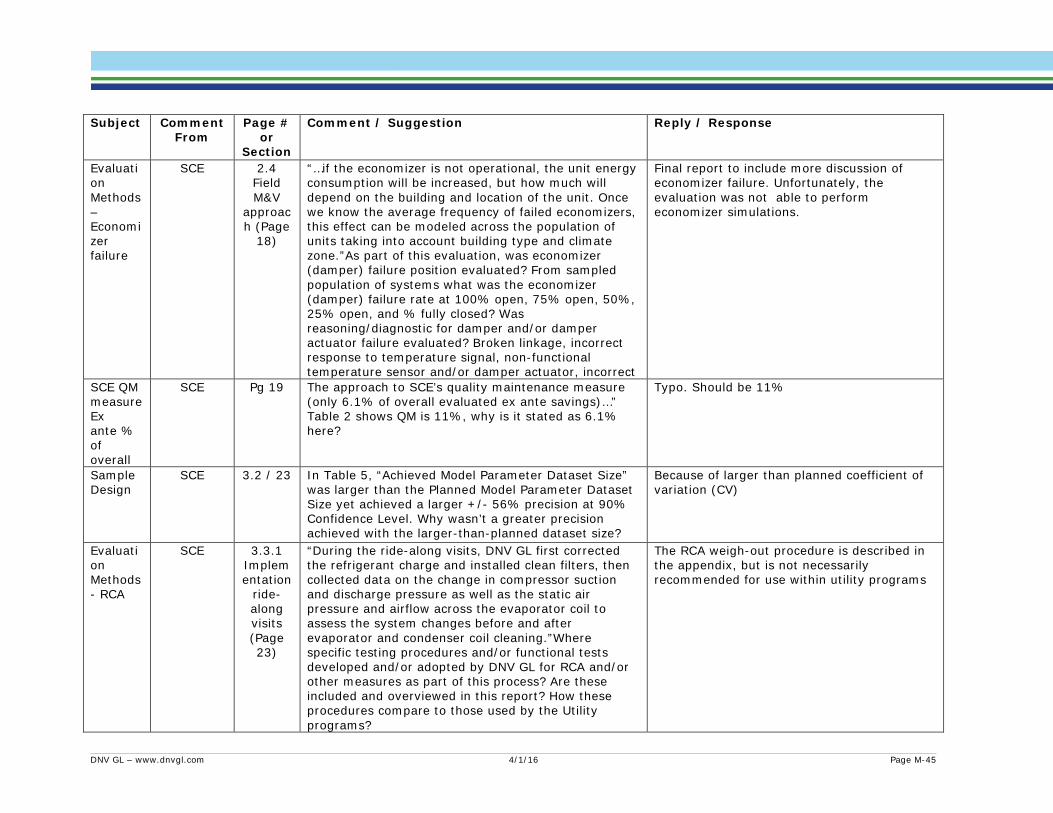
Subject Comment
From Page #
or Section
Comment / Suggestion Reply / Response
Evaluation Methods – Economizer failure
SCE 2.4 Field M&V
approach (Page
18)
“…if the economizer is not operational, the unit energy consumption will be increased, but how much will depend on the building and location of the unit. Once we know the average frequency of failed economizers, this effect can be modeled across the population of units taking into account building type and climate zone.”As part of this evaluation, was economizer (damper) failure position evaluated? From sampled population of systems what was the economizer (damper) failure rate at 100% open, 75% open, 50%, 25% open, and % fully closed? Was reasoning/diagnostic for damper and/or damper actuator failure evaluated? Broken linkage, incorrect response to temperature signal, non-functional temperature sensor and/or damper actuator, incorrect
Final report to include more discussion of economizer failure. Unfortunately, the evaluation was not able to perform economizer simulations.
SCE QM measure Ex ante % of overall
SCE Pg 19 The approach to SCE’s quality maintenance measure (only 6.1% of overall evaluated ex ante savings)…” Table 2 shows QM is 11%, why is it stated as 6.1% here?
Typo. Should be 11%
Sample Design
SCE 3.2 / 23 In Table 5, “Achieved Model Parameter Dataset Size” was larger than the Planned Model Parameter Dataset Size yet achieved a larger +/- 56% precision at 90% Confidence Level. Why wasn’t a greater precision achieved with the larger-than-planned dataset size?
Because of larger than planned coefficient of variation (CV)
Evaluation Methods - RCA
SCE 3.3.1 Implementation
ride-along visits (Page 23)
“During the ride-along visits, DNV GL first corrected the refrigerant charge and installed clean filters, then collected data on the change in compressor suction and discharge pressure as well as the static air pressure and airflow across the evaporator coil to assess the system changes before and after evaporator and condenser coil cleaning.”Where specific testing procedures and/or functional tests developed and/or adopted by DNV GL for RCA and/or other measures as part of this process? Are these included and overviewed in this report? How these procedures compare to those used by the Utility programs?
The RCA weigh-out procedure is described in the appendix, but is not necessarily recommended for use within utility programs
DNV GL – www.dnvgl.com 4/1/16 Page M-45

Subject Comment
From Page #
or Section
Comment / Suggestion Reply / Response
Implementation ride-along visits
SCE 3.3.1 / 24
Why did none of the five planned SCE CQM ride-along visits occur indicated by Table 6?
Delays in some aspects of the study caused a timing issue and the remaining ride alongs were not fielded in favor of completing the ex-post site visits
Economizers
SCE 3.3.2 Post-
performance site
visits (Page 24)
“Determining the economizer functionality, control sequence, and changeover set point”Where functional test procedures developed and/or adopted by DNV GL for economizer measures as part of this process? Are these included and overviewed in this report? How these compare to those used by the utility programs?
The specific procedures can be found in the appendix. Furthermore, the WHPA is releasing an economizer document that addresses these issues.
Laboratory data
SCE Pg 29-30
• Were the relative discharge pressure increases done with psia or psig?• What relative discharge pressure increases would have caused tripping of high pressure switches for each HVAC system?• Were cardboard blockages applied to multiple condenser faces?• Were there observations of airflow direction changes with high condenser blockages?
Relative discharge pressure increases were done with psig. Unknown what pressure would have tripped high pressure switch. Yes, cardboard blockage was applied to multiple condenser faces. No observation of airflow direction change noted.
Coil Cleaning
SCE Pg 30-31
Why were the equation fits for coil blockages done using only data from non-txv systems?
All the field data were from Non-TXV systems
DNV GL – www.dnvgl.com 4/1/16 Page M-46
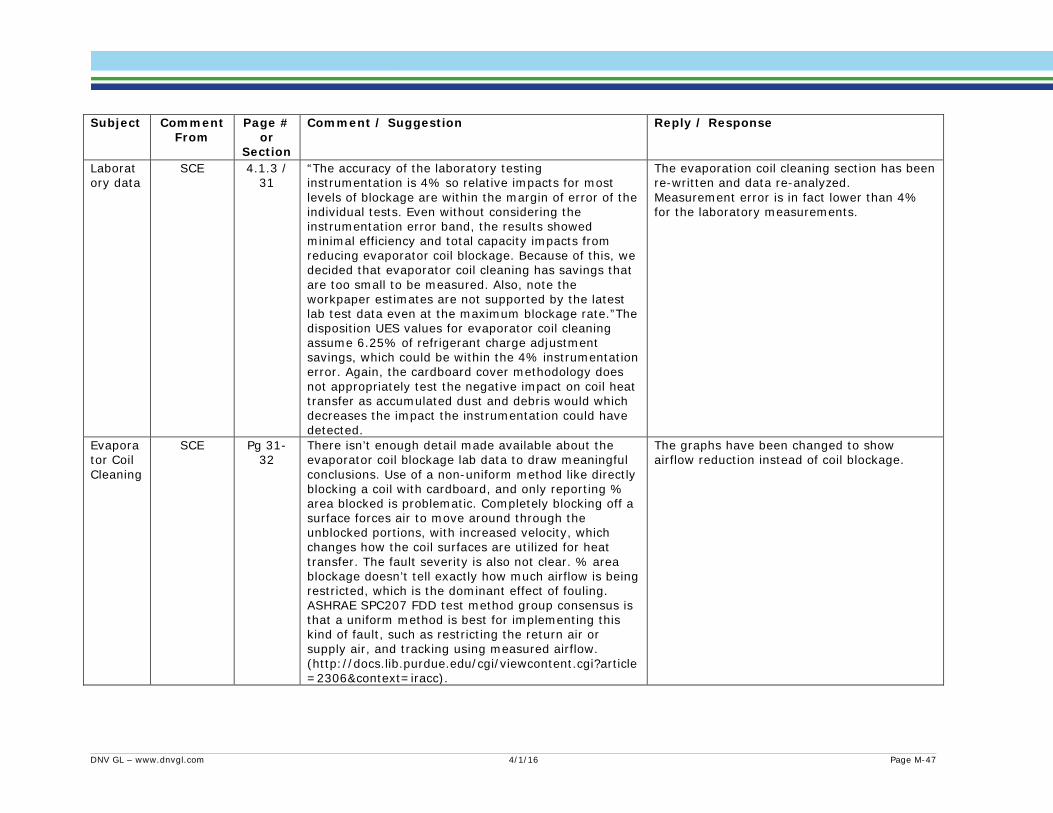
Subject Comment
From Page #
or Section
Comment / Suggestion Reply / Response
Laboratory data
SCE 4.1.3 / 31
“The accuracy of the laboratory testing instrumentation is 4% so relative impacts for most levels of blockage are within the margin of error of the individual tests. Even without considering the instrumentation error band, the results showed minimal efficiency and total capacity impacts from reducing evaporator coil blockage. Because of this, we decided that evaporator coil cleaning has savings that are too small to be measured. Also, note the workpaper estimates are not supported by the latest lab test data even at the maximum blockage rate.”The disposition UES values for evaporator coil cleaning assume 6.25% of refrigerant charge adjustment savings, which could be within the 4% instrumentation error. Again, the cardboard cover methodology does not appropriately test the negative impact on coil heat transfer as accumulated dust and debris would which decreases the impact the instrumentation could have detected.
The evaporation coil cleaning section has been re-written and data re-analyzed. Measurement error is in fact lower than 4% for the laboratory measurements.
Evaporator Coil Cleaning
SCE Pg 31-32
There isn’t enough detail made available about the evaporator coil blockage lab data to draw meaningful conclusions. Use of a non-uniform method like directly blocking a coil with cardboard, and only reporting % area blocked is problematic. Completely blocking off a surface forces air to move around through the unblocked portions, with increased velocity, which changes how the coil surfaces are utilized for heat transfer. The fault severity is also not clear. % area blockage doesn’t tell exactly how much airflow is being restricted, which is the dominant effect of fouling. ASHRAE SPC207 FDD test method group consensus is that a uniform method is best for implementing this kind of fault, such as restricting the return air or supply air, and tracking using measured airflow. (http://docs.lib.purdue.edu/cgi/viewcontent.cgi?article=2306&context=iracc).
The graphs have been changed to show airflow reduction instead of coil blockage.
DNV GL – www.dnvgl.com 4/1/16 Page M-47
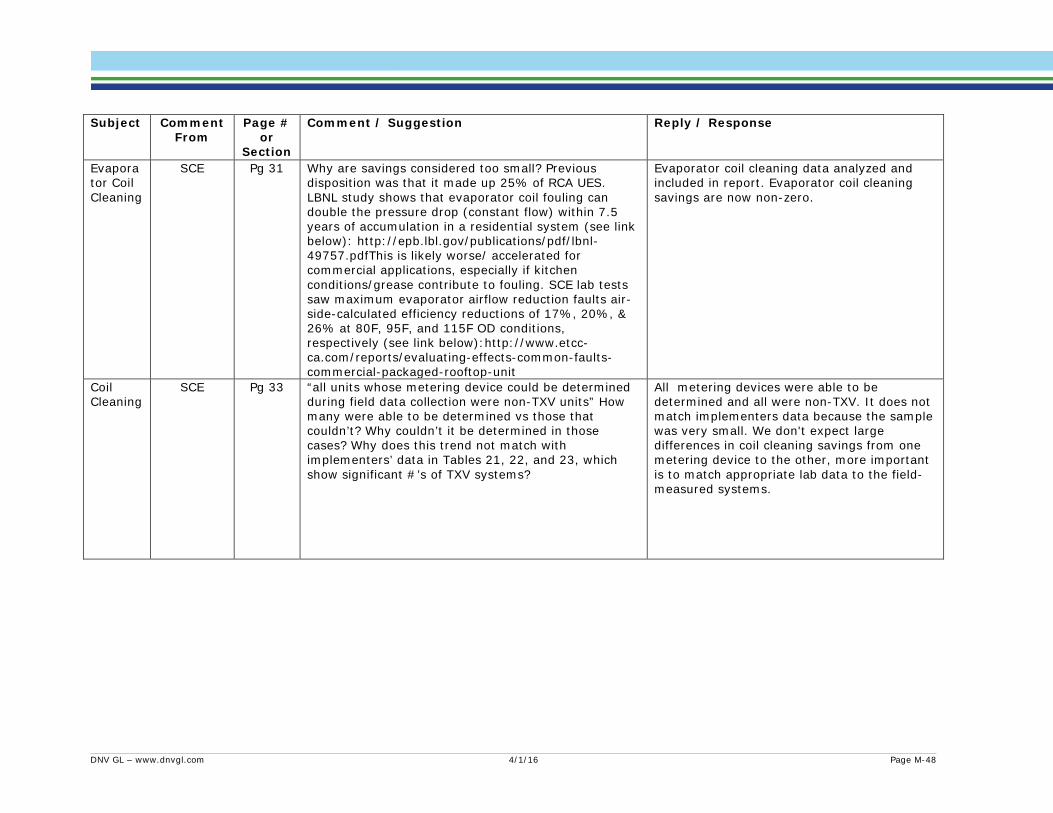
Subject Comment
From Page #
or Section
Comment / Suggestion Reply / Response
Evaporator Coil Cleaning
SCE Pg 31 Why are savings considered too small? Previous disposition was that it made up 25% of RCA UES. LBNL study shows that evaporator coil fouling can double the pressure drop (constant flow) within 7.5 years of accumulation in a residential system (see link below): http://epb.lbl.gov/publications/pdf/lbnl-49757.pdfThis is likely worse/ accelerated for commercial applications, especially if kitchen conditions/grease contribute to fouling. SCE lab tests saw maximum evaporator airflow reduction faults air-side-calculated efficiency reductions of 17%, 20%, & 26% at 80F, 95F, and 115F OD conditions, respectively (see link below):http://www.etcc-ca.com/reports/evaluating-effects-common-faults-commercial-packaged-rooftop-unit
Evaporator coil cleaning data analyzed and included in report. Evaporator coil cleaning savings are now non-zero.
Coil Cleaning
SCE Pg 33 “all units whose metering device could be determined during field data collection were non-TXV units” How many were able to be determined vs those that couldn’t? Why couldn’t it be determined in those cases? Why does this trend not match with implementers’ data in Tables 21, 22, and 23, which show significant #’s of TXV systems?
All metering devices were able to be determined and all were non-TXV. It does not match implementers data because the sample was very small. We don't expect large differences in coil cleaning savings from one metering device to the other, more important is to match appropriate lab data to the field-measured systems.
DNV GL – www.dnvgl.com 4/1/16 Page M-48

Subject Comment
From Page #
or Section
Comment / Suggestion Reply / Response
Laboratory data
SCE 4.1.3 / 27
The laboratory test conditions do not seem to reflect a realistic standard for preventative maintenance – cardboard blocking of condenser coils does not accurately recreate the roof top design conditions where all of the condenser fins are coated with dirt/grime/grease as the heat transfer gradually declines. The same applies to the evaporator coil lab testing, which could have benefited from a testing methodology that appropriately affected heat transfer degradation.
We agree that the area blockage procedure does not fully replicate real world coil fouling conditions in a laboratory. Report edited to acknowledge this limitation and that other studies have yet to develop a procedure to replicate dirty coils or to quantify typical level of dirtiness/change in heat transfer. That said, for condensers the field measured change in compressor discharge pressure captures all the effects and when replicated in the lab should produce reasonable impacts on compressor power with some uncaptured effects on capacity. For the evaporator coil because the field measurements show small changes in airflow and those measurements do not include the heat transfer impacts of the dirty evaporator coil in the field.
Thermostat
SCE 4.4.3 / 62
Regarding Table 35 “Thermostat field verification results”:Why weren’t all of units claimed to have the measure installed at the sites inspected? There were reasons given why only 11 of the 15 sites could be visited but no reasoning provided for why not all the units on the site were inspected (ex: “Quality Maintenance” claimed 70 units in the ex ante tracking, only 17 units were inspected, 3 found to properly install the measure).
IPMVP within-site sampling techniques were used to determine how many units were inspected at each site. It is not cost-effective to inspect each unit at a site.
DNV GL – www.dnvgl.com 4/1/16 Page M-49
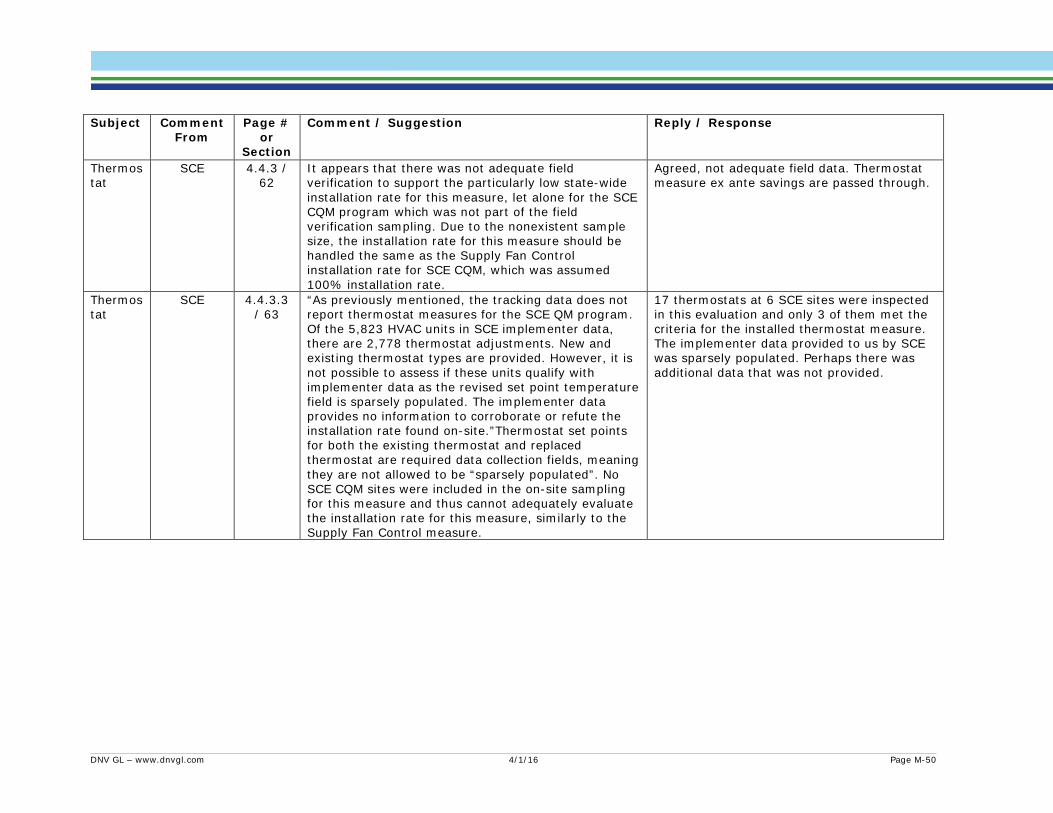
Subject Comment
From Page #
or Section
Comment / Suggestion Reply / Response
Thermostat
SCE 4.4.3 / 62
It appears that there was not adequate field verification to support the particularly low state-wide installation rate for this measure, let alone for the SCE CQM program which was not part of the field verification sampling. Due to the nonexistent sample size, the installation rate for this measure should be handled the same as the Supply Fan Control installation rate for SCE CQM, which was assumed 100% installation rate.
Agreed, not adequate field data. Thermostat measure ex ante savings are passed through.
Thermostat
SCE 4.4.3.3 / 63
“As previously mentioned, the tracking data does not report thermostat measures for the SCE QM program. Of the 5,823 HVAC units in SCE implementer data, there are 2,778 thermostat adjustments. New and existing thermostat types are provided. However, it is not possible to assess if these units qualify with implementer data as the revised set point temperature field is sparsely populated. The implementer data provides no information to corroborate or refute the installation rate found on-site.”Thermostat set points for both the existing thermostat and replaced thermostat are required data collection fields, meaning they are not allowed to be “sparsely populated”. No SCE CQM sites were included in the on-site sampling for this measure and thus cannot adequately evaluate the installation rate for this measure, similarly to the Supply Fan Control measure.
17 thermostats at 6 SCE sites were inspected in this evaluation and only 3 of them met the criteria for the installed thermostat measure. The implementer data provided to us by SCE was sparsely populated. Perhaps there was additional data that was not provided.
DNV GL – www.dnvgl.com 4/1/16 Page M-50
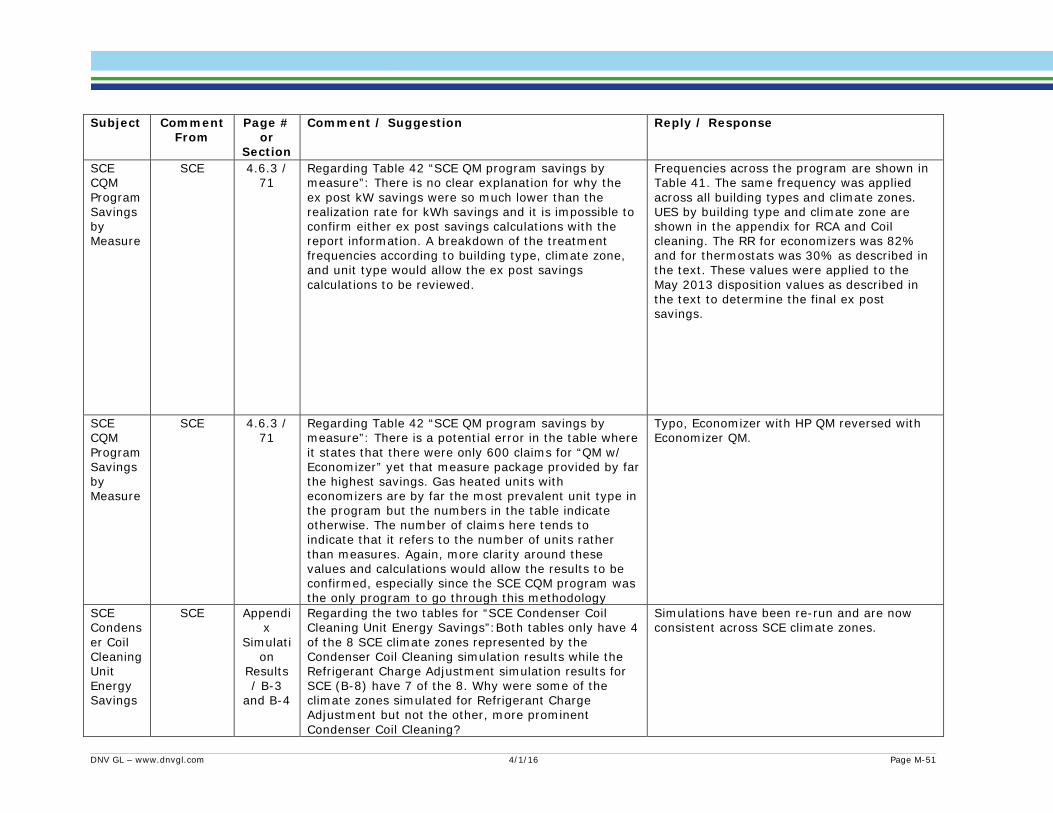
Subject Comment
From Page #
or Section
Comment / Suggestion Reply / Response
SCE CQM Program Savings by Measure
SCE 4.6.3 / 71
Regarding Table 42 “SCE QM program savings by measure”: There is no clear explanation for why the ex post kW savings were so much lower than the realization rate for kWh savings and it is impossible to confirm either ex post savings calculations with the report information. A breakdown of the treatment frequencies according to building type, climate zone, and unit type would allow the ex post savings calculations to be reviewed.
Frequencies across the program are shown in Table 41. The same frequency was applied across all building types and climate zones. UES by building type and climate zone are shown in the appendix for RCA and Coil cleaning. The RR for economizers was 82% and for thermostats was 30% as described in the text. These values were applied to the May 2013 disposition values as described in the text to determine the final ex post savings.
SCE CQM Program Savings by Measure
SCE 4.6.3 / 71
Regarding Table 42 “SCE QM program savings by measure”: There is a potential error in the table where it states that there were only 600 claims for “QM w/ Economizer” yet that measure package provided by far the highest savings. Gas heated units with economizers are by far the most prevalent unit type in the program but the numbers in the table indicate otherwise. The number of claims here tends to indicate that it refers to the number of units rather than measures. Again, more clarity around these values and calculations would allow the results to be confirmed, especially since the SCE CQM program was the only program to go through this methodology
Typo, Economizer with HP QM reversed with Economizer QM.
SCE Condenser Coil Cleaning Unit Energy Savings
SCE Appendix
Simulation
Results / B-3
and B-4
Regarding the two tables for “SCE Condenser Coil Cleaning Unit Energy Savings”:Both tables only have 4 of the 8 SCE climate zones represented by the Condenser Coil Cleaning simulation results while the Refrigerant Charge Adjustment simulation results for SCE (B-8) have 7 of the 8. Why were some of the climate zones simulated for Refrigerant Charge Adjustment but not the other, more prominent Condenser Coil Cleaning?
Simulations have been re-run and are now consistent across SCE climate zones.
DNV GL – www.dnvgl.com 4/1/16 Page M-51
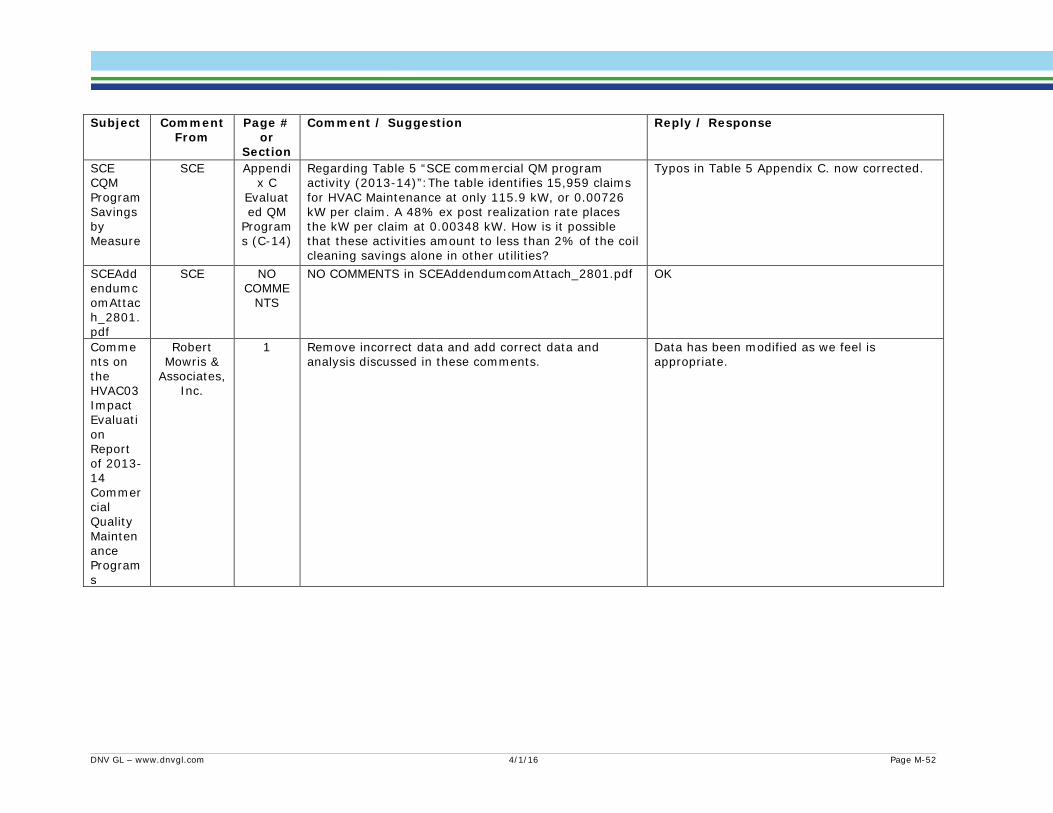
Subject Comment
From Page #
or Section
Comment / Suggestion Reply / Response
SCE CQM Program Savings by Measure
SCE Appendix C
Evaluated QM
Programs (C-14)
Regarding Table 5 “SCE commercial QM program activity (2013-14)”:The table identifies 15,959 claims for HVAC Maintenance at only 115.9 kW, or 0.00726 kW per claim. A 48% ex post realization rate places the kW per claim at 0.00348 kW. How is it possible that these activities amount to less than 2% of the coil cleaning savings alone in other utilities?
Typos in Table 5 Appendix C. now corrected.
SCEAddendumcomAttach_2801.pdf
SCE NO COMME
NTS
NO COMMENTS in SCEAddendumcomAttach_2801.pdf OK
Comments on the HVAC03 Impact Evaluation Report of 2013-14 Commercial Quality Maintenance Programs
Robert Mowris &
Associates, Inc.
1 Remove incorrect data and add correct data and analysis discussed in these comments.
Data has been modified as we feel is appropriate.
DNV GL – www.dnvgl.com 4/1/16 Page M-52

Subject Comment
From Page #
or Section
Comment / Suggestion Reply / Response
Comments on the HVAC03 Impact Evaluation Report of 2013-14 Commercial Quality Maintenance Programs
Robert Mowris &
Associates, Inc.
1 Add field measurements of evaporator airflow before and after replacing dirty filters and cleaning coils on 4 units (3 in PG&E and 1 in SDG&E) and airflow measurements for 24 units with clean filters before and after only cleaning dirty evaporator coils.
Evaporator coil cleaning data analyzed and included in report.
Comments on the HVAC03 Impact Evaluation Report of 2013-14 Commercial Quality Maintenance Programs
Robert Mowris &
Associates, Inc.
1 Add corrected analysis of HVAC maintenance measures using the application sensible energy efficiency ratio (EER*s) based on laboratory test data. All figures providing total capacity or total EER (or EIR) and analyses based on these metrics (including DOE-2 simulations) should be removed from the HVAC03 report since these data provide misleading or incorrect results.
The data in the report represents what we think is the most accurate and best representation of the laboratory and field data gathered through HVAC-3 and HVAC-5 efforts.
DNV GL – www.dnvgl.com 4/1/16 Page M-53
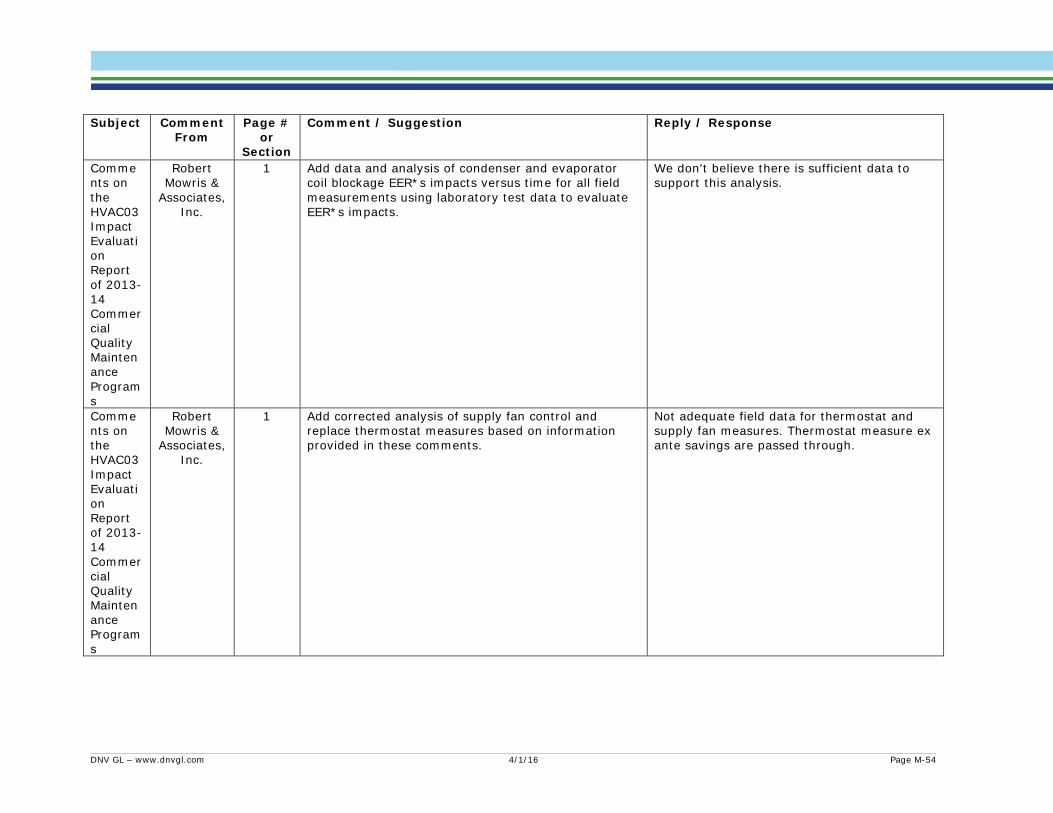
Subject Comment
From Page #
or Section
Comment / Suggestion Reply / Response
Comments on the HVAC03 Impact Evaluation Report of 2013-14 Commercial Quality Maintenance Programs
Robert Mowris &
Associates, Inc.
1 Add data and analysis of condenser and evaporator coil blockage EER*s impacts versus time for all field measurements using laboratory test data to evaluate EER*s impacts.
We don't believe there is sufficient data to support this analysis.
Comments on the HVAC03 Impact Evaluation Report of 2013-14 Commercial Quality Maintenance Programs
Robert Mowris &
Associates, Inc.
1 Add corrected analysis of supply fan control and replace thermostat measures based on information provided in these comments.
Not adequate field data for thermostat and supply fan measures. Thermostat measure ex ante savings are passed through.
DNV GL – www.dnvgl.com 4/1/16 Page M-54

Subject Comment
From Page #
or Section
Comment / Suggestion Reply / Response
Comments on the HVAC03 Impact Evaluation Report of 2013-14 Commercial Quality Maintenance Programs
Robert Mowris &
Associates, Inc.
1 If the HVAC03 report is corrected satisfactorily, please remove Appendix I based on one site visit in PG&E and replace with the partially completed RMA HVAC03 pilot study report based on 4 site visits in SDG&E and 1 site visit in PG&E including 35 refrigerant recoveries, 28 coil blockage, 24 economizer, and 15 replace thermostat measures.
We did not make all changes recommended by RMA. The RMA work on the pilot work of this project remains part of this document.
Comments on the HVAC03 Impact Evaluation Report of 2013-14 Commercial Quality Maintenance Programs
Robert Mowris &
Associates, Inc.
1 In the future, require complete program databases prior to preparing research plans.
Noted
DNV GL – www.dnvgl.com 4/1/16 Page M-55
Subject Comment
From Page #
or Section
Comment / Suggestion Reply / Response
Comments on the HVAC03 Impact Evaluation Report of 2013-14 Commercial Quality Maintenance Programs
Robert Mowris &
Associates, Inc.
1 Require deliverables of all reports for pilot studies prior to initiating field observations.
This recommendation will be taken going forward
Comments on the HVAC03 Impact Evaluation Report of 2013-14 Commercial Quality Maintenance Programs
Robert Mowris &
Associates, Inc.
1 Require all EM&V studies to adhere to the AEA guidelines for data-based systematic inquiry, competence, integrity, respect, and responsibility for all stakeholders.
Noted
DNV GL – www.dnvgl.com 4/1/16 Page M-56

Subject Comment
From Page #
or Section
Comment / Suggestion Reply / Response
Comments on the HVAC03 Impact Evaluation Report of 2013-14 Commercial Quality Maintenance Programs
Robert Mowris &
Associates, Inc.
1 Require higher quality data, analysis, and reports with greater transparency, oversight and accountability (i.e., field and laboratory test measurements must be available for review).
This recommendation will be taken going forward
Comments on the HVAC03 Impact Evaluation Report of 2013-14 Commercial Quality Maintenance Programs
Robert Mowris &
Associates, Inc.
1 Field measurements must be initiated during program implementation and analytical methods need to be as simple as possible and no simpler.
Noted
DNV GL – www.dnvgl.com 4/1/16 Page M-57

Subject Comment
From Page #
or Section
Comment / Suggestion Reply / Response
Comments on the HVAC03 Impact Evaluation Report of 2013-14 Commercial Quality Maintenance Programs
Robert Mowris &
Associates, Inc.
1 Conflicting errors and omissions in the HVAC03 report and previous WO32 EM&V report combined with misunderstanding how to use laboratory test data for evaluations indicate problems with laboratory tests being managed by CPUC EM&V contractors.
Laboratory test data informing prototype simulations for use by ex ante and ex post evaluation has always been the objective of ED and it is why ED approved funding of laboratory testing.
Comments on the HVAC03 Impact Evaluation Report of 2013-14 Commercial Quality Maintenance Programs
Robert Mowris &
Associates, Inc.
1 The most important failures appear to be the EM&V studies and not HVAC maintenance programs which have received “false alarms” of unacceptably poor load impact evaluations for many years based on erroneous EM&V studies
Issues with past charge adjustment programs have been proven by recent laboratory testing on fault diagnostics. The programs then evolved and challenges remain to estimate impacts on an ex ante and ex post basis. ED is encouraging new approaches to these programs and their evaluation under new policy directives. Therefore the programs and the evaluation of them is likely to undergo another major change.
DNV GL – www.dnvgl.com 4/1/16 Page M-58
Subject Comment
From Page #
or Section
Comment / Suggestion Reply / Response
Comments on the HVAC03 Impact Evaluation Report of 2013-14 Commercial Quality Maintenance Programs
Robert Mowris &
Associates, Inc.
1 For the sake of the customers, we recommend master HVAC technicians revisit 118 units where used refrigerant was put back into systems and recover the refrigerant, evacuate to 500 microns, and recharge with new refrigerant. We also recommend master HVAC technicians revisit all economizers tampered with by non-master technicians to check operation and ensure economizers are functional.
Not necessary. Our teams performed all work in a professional manner.
Laboratory data
Robert Mowris &
Associates, Inc.
3 Correct laboratory testing instrumentation accuracy to 1%. Add the average uncertainty for laboratory tests of sensible capacity to 0.6% and EER*s to 0.8%.
Noted
Evaporator Coil Cleaning
Robert Mowris &
Associates, Inc.
8 All coil blockage figures or tables should be replaced with figures showing airflow since coil blockage cannot be measured in the field. The HVAC03 report should include field measurements of evaporator blockage for 28 units and provide laboratory data for sensible capacity and EER*s. The load impact analysis should focus on the 4 units where airflow was measured before and after replacing dirty filters and cleaning dirty coils. The realization rate for evaporator coil cleaning should be 47% based on the EER*s impact of 3.3%.
Evaporator coil cleaning data analyzed and included in report. Evaporator coil cleaning savings are now non-zero.
DNV GL – www.dnvgl.com 4/1/16 Page M-59

Subject Comment
From Page #
or Section
Comment / Suggestion Reply / Response
Coil Cleaning
Robert Mowris &
Associates, Inc.
11 Figure 11 should be replaced with a figure showing discharge pressure since coil blockage cannot be measured in the field and total capacity and EER should be replaced with sensible capacity and EER*s. The realization rate for condenser coil cleaning should be 16.2%. The savings are based on an EER*s impact of 2.1%.
Figure 11 already shows relative discharge pressure increase on the x-axis.
RCA Robert Mowris &
Associates, Inc.
15 The RCA realization rate should be 98.9% for all HVAC maintenance programs based on the 35 units with correct refrigerant recovery data. Used refrigerant was put back into 118 units without obtaining the owner’s permission based on full disclosure of potential problems caused by putting used and contaminated refrigerant back into systems. For the sake of the customers, we recommend master HVAC technicians revisit these units to recover used refrigerant, evacuate to 500 microns, hold at or below 1000 microns, and recharge with new refrigerant.
We had permission to refill systems with old refrigerant
Field Measurements of Economizer Repair and Controller Performance
Robert Mowris &
Associates, Inc.
16 Revise the economizer realization rates to 91.7% for all programs. Remove all discussion of other economizer observations and DOE-2 simulations which are irrelevant. Removing wires and changing minimum damper positions can cause economizer failure and is not a recommended test method. For the sake of the customers, we recommend master HVAC technicians revisit these units to check economizer operation and ensure the economizers are functional.
We believe our staff were competent and the methodology sound.
Thermostat
Robert Mowris &
Associates, Inc.
17 Based on the 100% installation rate found by master HVAC technicians, the HVAC03 report installation rate appears unrealistically too low. Therefore, we recommend master HVAC technicians revisit these sites to ensure new thermostats were installed. If this cannot be double-checked, then we recommend an installation rate of 100% for replace thermostats.
We are confident in the ex post findings even though they are inconsistent with pilot findings.
DNV GL – www.dnvgl.com 4/1/16 Page M-60

Subject Comment
From Page #
or Section
Comment / Suggestion Reply / Response
Supply Fan Control
Robert Mowris &
Associates, Inc.
18 Provide 100% realization rate for supply fan control based on insufficient statistical evidence to support realization rates less than 100%.
Agreed, not adequate field data. Supply Fan Control measure ex ante savings are passed through.
Field Measurements of Outdoor Air Fractions
Robert Mowris &
Associates, Inc.
18 Remove any mention of OAF being measured at OAT less then 20F. The OAF measurements are not relevant to the report since no program claimed economizer perimeter sealing (EPS) savings or optimizing damper positions to reduce OAF. The discussion of OAF appears to be related to DOE-2 simulations which are opaque meaningless to the evaluation which focused on installation realization rates. Remove all discussions of irrelevant DOE-2 simulation modeling and results. Correct figures showing power measurements of units since no power measurements were performed under HVAC03.
Outside air fractions were not measured in the field.
American Evaluation Association (AEA) Guidelines
Robert Mowris &
Associates, Inc.
20 If the HVAC03 report is not corrected satisfactorily, then please remove Appendix I from the report and any mention of master HVAC technicians and Robert Mowris & Associates, Inc. If the report is corrected satisfactorily, then please remove Appendix I based on 1 site visit in PG&E and replace with the partially completed RMA HVAC03 pilot study report based on 4 site visits in SDG&E and 1 site visit in PG&E including 35 refrigerant recoveries, 28 coil blockage, 24 economizer, and 15 replace thermostat measures.
We did not make all changes recommended by RMA. The RMA work on the pilot work of this project remains part of this document.
DNV GL – www.dnvgl.com 4/1/16 Page M-61

ABOUT DNV GL Driven by our purpose of safeguarding life, property and the environment, DNV GL enables organizations to advance the safety and sustainability of their business. We provide classification and technical assurance along with software and independent expert advisory services to the maritime, oil and gas, and energy industries. We also provide certification services to customers across a wide range of industries. Operating in more than 100 countries, our 16,000 professionals are dedicated to helping our customers make the world safer, smarter and greener.
DNV GL – www.dnvgl.com 4/1/16