Embed Size (px)
Citation preview

REVISED DRAFT (01/11/99)
Impact Evaluation: A Note onConcepts and Methods
by
Kene EzemenariAnders Rudqvist
K. Subbarao
PRMPOPoverty Reduction and Economic Management Network
The World BankJanuary 1999

Contents
1. Introduction..................................................................................................................1
2. The basic evaluation problem—disentangling project effects from interveningfactors...........................................................................................................................2
3. Methods for dealing with endogeneity........................................................................4
4. Data sources and collection methods.........................................................................12
5. Combining quantitative and qualitative approaches in impact evaluation................18
6. Incorporating evaluation into the project cycle..........................................................24
7. Conclusion.................................................................................................................28
References..........................................................................................................................29
Appendix Note 1 ................................................................................................................30

Impact Evaluation: A Note on Concepts and Methods1
by
Kene EzemenariAnders Rudqvist
K. Subbarao
1. Introduction
The basic organizing principle for any good evaluation of an intervention is to ask the
question: what would have happened in the absence of the intervention? What would have been
the welfare levels of particular communities, groups, households and individuals without the
intervention? Evaluation involves an analysis of cause and effect in order to identify impacts that
can be traced back to interventions.
Evaluation differs from Monitoring. Monitoring involves “… the continuous assessment
of project implementation in relation to agreed schedules, and of the use of inputs, infrastructure,
and services by project beneficiaries. …” (OED, 1994). The key difference is that evaluation is
concerned with tracing causes to outcomes whereas monitoring is concerned with tracking the
progress of implementation and processes (especially inputs and outputs) to ensure that agreed
targets are met. An impact evaluation assesses the extent to which a program has caused desired
changes in the intended audience. It is concerned with the net impact of an intervention on
households and institutions, attributable only and exclusively to that intervention. Thus, impact
1 We are grateful for comments on a preliminary version from Judy Baker, Deepa Narayan, Giovanna Prennushi,Martin Ravallion and Michael Walton. The authors also benefited from the discussion in a meeting of the PovertyReduction Board held on December 16, 1998. This note will be a part (section 2) of a position paper on ImpactEvaluation under preparation. It will also feed into the Handbook on Impact Evaluation under preparation, jointlywith LACPR. This is a draft and we appreciate your comments and suggestions. A glossary is under preparation tofacilitate easy reading of some of the technical portions of the paper.

2
evaluation consists of assessing outcomes and, thus, the short or medium-term developmental
change resulting from an intervention.
This note reviews the key concepts and tools available to do sound impact evaluation. It
begins with a brief statement of the evaluation problem (Section 2). Section 3 outlines the
methods of dealing with endogeneity. Data sources are discussed in Section 4. Some issues in
combining quantitative and qualitative methods are reviewed in Section 5. Section 6 outlines the
ways in which evaluation can be incorporated with the project cycle. The last section presents a
brief concluding statement.
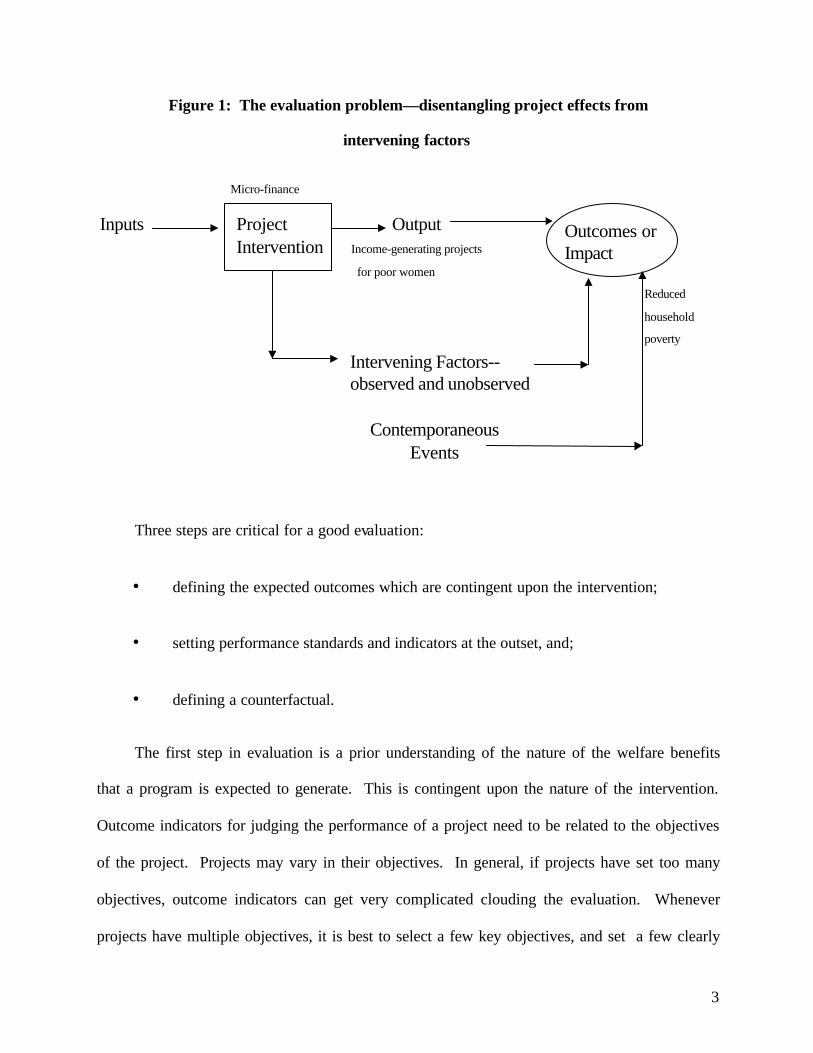
2. The basic evaluation problem—disentangling project effects from intervening factors
Figure 1 is a diagrammatic representation of the evaluation problem. Inputs into a project
lead to direct outcomes or impacts through produced output, or through the impact on other
variables which then impact on outcomes. There may be intervening factors on which the project
has an effect that are either observed or not observed which also contribute to outcomes. In
addition, there may also be other factors or events that are correlated with the outcomes, but
which are not caused by the project. Accurate and successful evaluations are those which are
able to control for these effects. This task of “netting out” the effect of the interventions from
other factors is facilitated if control groups are introduced. “Control groups” consist of a
comparator group of individuals who did not receive the intervention, but have similar
characteristics as those receiving the intervention, called the “treatment groups”. Defining these
groups correctly is a key to identifying what would have occurred in the absence of the
intervention.
3
Figure 1: The evaluation problem—disentangling project effects from
intervening factors
Three steps are critical for a good evaluation:
• defining the expected outcomes which are contingent upon the intervention;
• setting performance standards and indicators at the outset, and;
• defining a counterfactual.
The first step in evaluation is a prior understanding of the nature of the welfare benefits
that a program is expected to generate. This is contingent upon the nature of the intervention.
Outcome indicators for judging the performance of a project need to be related to the objectives
of the project. Projects may vary in their objectives. In general, if projects have set too many
objectives, outcome indicators can get very complicated clouding the evaluation. Whenever
projects have multiple objectives, it is best to select a few key objectives, and set a few clearly
Inputs ProjectIntervention
Output Outcomes orImpact
Intervening Factors--observed and unobserved
ContemporaneousEvents
Micro-finance
Income-generating projects
for poor women
Reduced
household
poverty

4
defined outcome indicators. It is also very important to be clear about the time frame within
which outcomes are to be expected. Thus, for some projects such as public employment
projects, the benefits (outcomes) are consumption gains and the timeframe is almost immediate.
For others such as a nutrition intervention, the outcomes (improvement in the nutritional status of
children) is medium term (4 to 6 years)—see Table 1. Some projects may have only longer-term
goals. In such instances, a few short-term indicators still need to be identified to facilitate
evaluation.
Table 1: Example of projects and related timeframe for benefitsIntervention Nature of benefits/outcomes Timeframe Remarks on control
group/counterfactual
Public works project Consumption gains Immediate Need a control group to assessthe net benefits from theprogram. Even when there isno baseline “matchingmethod” can be employed tocreate controls.
Nutrition intervention Improved nutritional status ofchildren
4-6 years Though control groups arehelpful, techniques exist thatenable judgements on impactwith cross-sectional data
Early childhooddevelopment
Improved health, nutrition andcognitive development of youngchildren
Medium- andlong-term
Gains are usually long-termand outcomes too diffused andhence difficult to assess.
Important to identify a fewshort-term indicators to assessimmediate impact.
3. Methods for dealing with endogeneity
Endogeneity arises if there are other factors that affect the intervention and outcome
simultaneously making it difficult to disentangle the pure effect of the intervention.
5
The key to disentangling project effects from any intervening effects is determining what
would have occurred in the absence of the program (at the same point in time). When one
establishes a functional relationship between treatment (inputs) and outcomes in a regression
equation, endogeneity manifests itself when there is a non-zero correlation between the
treatment, and the error term in the outcome regression. The problem is to identify and deal with
the main source of endogeneity relevant to each intervention.
If one could observe the same individual at the same point in time, with and without the
program, this would effectively account for any observed or unobserved intervening factors or
contemporaneous events and the problem of endogeneity does not arise. Since this is not doable
in practice, something similar is done by identifying non-participating comparator groups—
identical in every way to the group that receives the intervention, except that comparator groups
do not receive the intervention. There are two means of achieving this: experimental or quasi-
experimental methods; and non-experimental methods.
Although both experimental and non-experimental methods are grounded in quantitative
approach to evaluation, incorporating qualitative methods enriches the quality of the evaluation
results. In particular, qualitative methods not only provide qualitative measures of impact, but
also aid in the deeper interpretation of results obtained from a quantitative approach by shedding
light on the processes and causal relationships. Related to qualitative methods are participatory
methods which overlap with qualitative methods, and can also be employed in conjunction with
quantitative methods. Participatory methods require the active involvement of stakeholders,
particularly at the local level, in determining the objective of the evaluation, indicators, and
methods of evaluation. Further discussion of these approaches as well as an overview of how to

6
combine them are detailed in Section 5 of this paper. The rest of this section discusses various
means of establishing controls.
a. Experimental or control groups
Establishing control groups is the most straightforward means of assessing the
counterfactual. Determining what is a “counterfactual” is not straightforward. Typically, the
task manager and/or the analyst has some priors regarding the counterfactual. However, the
counterfactual from the participant’s point of view may differ from that posited by the analyst.
The best approach appears to be to promote the notion that the best counterfactual is the one that
is arrived at by the interaction of the analyst’s prior with the perceptions of participants.2
Creating a control group is one important way to get a sense of the variation in
participation and thus a sense of the counterfactual. Once the program is in place, different
individuals may have participated in it, but to varying degrees. It is this variation in participation
that can be critical for identifying the impact. Control groups can be determined at different
levels: regional, village, community, household or intra-household. The more disaggregated one
moves down in the level, the more information-intensive the evaluation becomes. Collecting
intra-household information, for example, is extremely time-consuming and expensive.
The issues that arise in defining the control group include coverage of the program,
maintaining the integrity of the control, and accounting for contemporaneous events. First, a
project or a policy change that is broad enough in scope (adopted throughout the country) leaves
little room for establishing appropriate control groups. The Bank’s adjustment loans, or a
country’s trade/price liberalization policy change, fall in this category. It is also true of projects
2 These perceptions are obtained by participatory assessments prior to the formulation of the project.

7
that target specific groups throughout the country: TB or AIDS patients, for example. If the
target includes all cases in any such category, there is no scope for a control group.
Second, control groups are often contaminated or may disappear altogether: one typical
example is that governments often extend a program into a control area (e.g., Bangladesh
education project). Another form of contamination is the movement of people into and out of
control areas: a regionally targeted employment or food stamp program might induce migration
from a neighboring control region, compromising the integrity of controls.
Third, contemporaneous events need to be accounted for in establishing actual program
impact. For example, the initial situation in a control area—i.e. no access highway—may change
with the coming of an access highway thereby compromising the comparison of outcomes
between project and control areas.
Methods for establishing controls. Some of the above problems can be resolved by
appropriate methods (see Box 1): randomized or experimental controls; quasi-experimental
controls which consist of constructed (or matched), and reflexive controls; and non-experimental
controls, which include statistical, generic, and shadow controls. Experimental and quasi-
experimental controls, when successfully applied, automatically deal with problems of selection
bias. Selection bias arises when participation in the program by individuals is related to
unmeasured characteristics that are themselves related to the program outcome under study.
Randomly placing individuals in treatment and non-treatment groups (based on similar pre-
intervention characteristics) ensures that on average any differences in outcomes of the two
groups after the intervention can be attributed to the intervention. In the case of non-
experimental methods such as statistical control, selection bias is treated as an omitted variable
bias. This is discussed further in the next section.
8
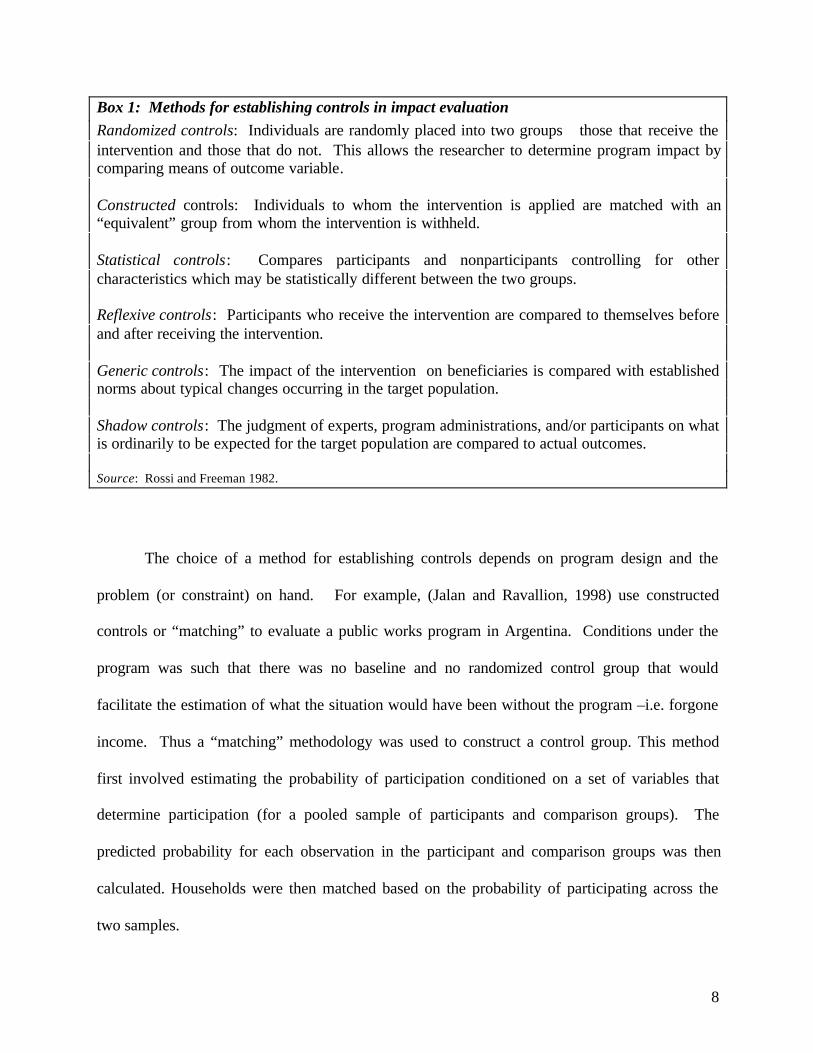
Box 1: Methods for establishing controls in impact evaluation Randomized controls: Individuals are randomly placed into two groupsthose that receive theintervention and those that do not. This allows the researcher to determine program impact bycomparing means of outcome variable. Constructed controls: Individuals to whom the intervention is applied are matched with an“equivalent” group from whom the intervention is withheld. Statistical controls: Compares participants and nonparticipants controlling for othercharacteristics which may be statistically different between the two groups. Reflexive controls: Participants who receive the intervention are compared to themselves beforeand after receiving the intervention. Generic controls: The impact of the intervention on beneficiaries is compared with establishednorms about typical changes occurring in the target population. Shadow controls: The judgment of experts, program administrations, and/or participants on whatis ordinarily to be expected for the target population are compared to actual outcomes. Source: Rossi and Freeman 1982.
The choice of a method for establishing controls depends on program design and the
problem (or constraint) on hand. For example, (Jalan and Ravallion, 1998) use constructed
controls or “matching” to evaluate a public works program in Argentina. Conditions under the
program was such that there was no baseline and no randomized control group that would
facilitate the estimation of what the situation would have been without the program –i.e. forgone
income. Thus a “matching” methodology was used to construct a control group. This method
first involved estimating the probability of participation conditioned on a set of variables that
determine participation (for a pooled sample of participants and comparison groups). The
predicted probability for each observation in the participant and comparison groups was then
calculated. Households were then matched based on the probability of participating across the
two samples.
9
The Trabajar project was particularly amenable to matching because: a) it was possible
to assure that the same questionnaire was administered to both participants and non-participants,
and both groups were from the same environment (this was greatly facilitated by piggy backing
on a national survey that was already in progress); b) micro-data were available such that it was
possible to ensure that participants are matched with non-participants over a common region of
the matching variables. Any bias therefore, would be attributed to the distribution of
unobserved characteristics. Since the design of the program is such that rationing is based on
observable characteristics, this was not a problem.
Another example refers to programs with total coverage; by design it is not possible to
identify a group that is not receiving the intervention. The best alternative is to implement
reflexive controls or before-and-after comparisons. In contrast, interventions that are tested on a
demonstration basis ordinarily will not be delivered to all of the target population. This
facilitates the adoption of randomization. Even if a program provides full coverage, in the start-
up phase, new programs may only be partially covered, again facilitating the use of
randomization. Sometimes, when programs are of full coverage, there could still be enough
variation and non-uniformity across time and localities to permit the use of randomization. At
other times, the program may be modified allowing for some randomization, e.g., when a
universal food subsidy is modified into a targeted food subsidy. However, the efficiency of
randomization can be compromised in practice by reliance on volunteers and attrition. Also, in
practice it can be both unethical and politically difficult to adopt randomization for programs that
are targeted to poor groups.

10
b. Non-experimental methods for controlling selection bias
Two forms of non-experimental methods can be used for evaluation: multivariate analysis
and instrumental variable techniques.
Multivariate analysis. Selection bias is similar to an omitted variable bias in regression
analysis. Thus, if it is possible to control for all possible reasons why outcomes might differ,
then this method is valid. For example, consider the following equation where the effect of
treatment (T) on outcome (Y) is measured by parameter b:
Y = a + bT + cX + e
The vector X contains variables which also determine program outcome. The parameter estimate
b will be biased (or misestimated) if there are any variables which determine outcome, but which
have not been accounted for in X. Selectivity bias can differ across specific groups or regions.
Where there are influences determining program outcomes that are known to the
participant, but not easily observed, and therefore cannot be measured by the researcher, the
evaluation generally fails.
Instrumental variables. This approach can also be used to control for selection bias. If
there are variables that directly affect program participation, without directly affecting outcomes,
then simple regression analysis will not correctly account for program impact. In order to
correctly account for program impact, it would be necessary to compare the outcomes of
individuals that are more likely to participate to those that are less likely to participate based on
the value of the instrumental variables. Often, one can use geographic variation in program
availability as an instrument. For example, one source of bias refers to endogeneous program
11
placement. This problem arises if the criteria for placing programs in certain areas is related to
program outcomes. If a health status improvement program is well targeted by placing it in a
poor area, in the absence of perfect measurement of the health environment the program will
appear to be less effective than it actually is. For example, consider the following equation
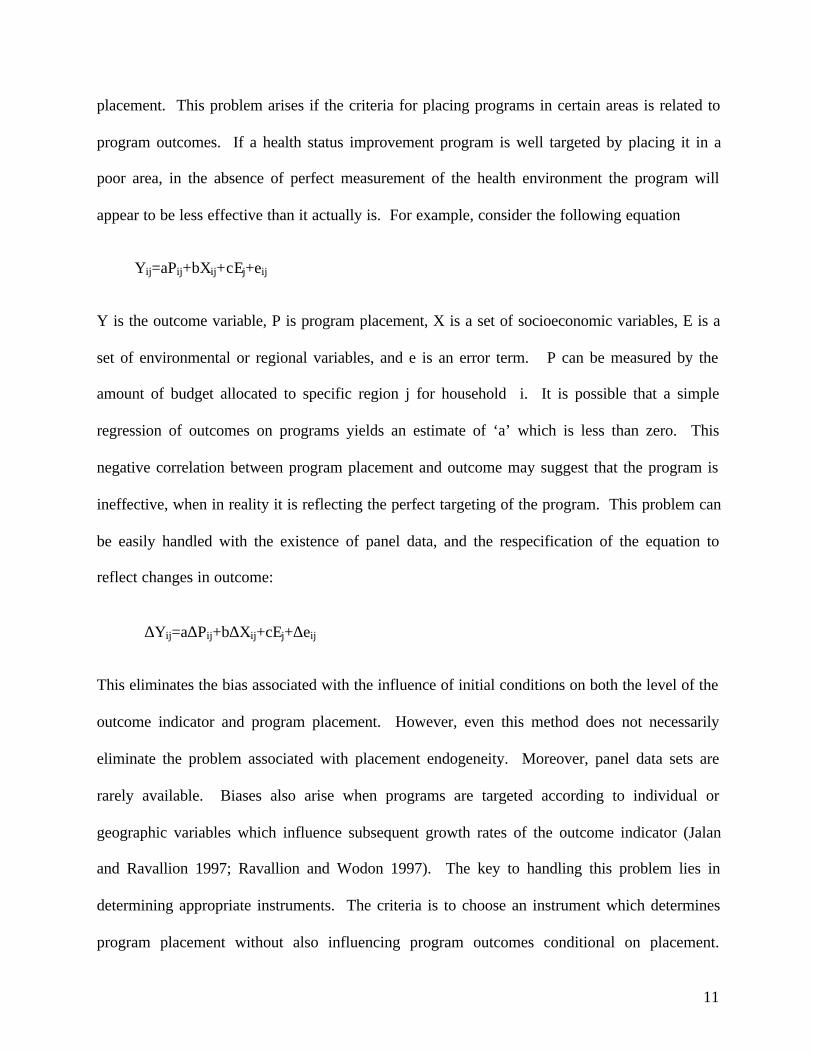
Yij=aPij+bXij+cEj+eij
Y is the outcome variable, P is program placement, X is a set of socioeconomic variables, E is a
set of environmental or regional variables, and e is an error term. P can be measured by the
amount of budget allocated to specific region j for household i. It is possible that a simple
regression of outcomes on programs yields an estimate of ‘a’ which is less than zero. This
negative correlation between program placement and outcome may suggest that the program is
ineffective, when in reality it is reflecting the perfect targeting of the program. This problem can
be easily handled with the existence of panel data, and the respecification of the equation to
reflect changes in outcome:
∆Yij=a∆Pij+b∆Xij+cEj+∆eij
This eliminates the bias associated with the influence of initial conditions on both the level of the
outcome indicator and program placement. However, even this method does not necessarily
eliminate the problem associated with placement endogeneity. Moreover, panel data sets are
rarely available. Biases also arise when programs are targeted according to individual or
geographic variables which influence subsequent growth rates of the outcome indicator (Jalan
and Ravallion 1997; Ravallion and Wodon 1997). The key to handling this problem lies in
determining appropriate instruments. The criteria is to choose an instrument which determines
program placement without also influencing program outcomes conditional on placement.

12
).1
(1
∑=
=N
iijj P
NP
Often, a good understanding of the administrative procedure for program placement informs the
choice of instruments. For example, Besley and Case (1994) use state-level political variables as
instruments for identifying impacts of workers’ compensation on earnings in the U.S. The
indication is that political affiliation of the governor will influence the level of benefits of the
program but not the level of wages controlled for compensation benefits. Ravallion and Wodon
(1997) exploit the decentralized nature of government decision making with regard to program
placement for identifying the micro-level impact of Bangladesh’s Food for Education (FFE)
program. In this program, budget allocation is first determined at the center or federal level
across geographic areas. This leaves local government and non-governmental organizations in
each geographic area to determine allocation across individuals. Thus, using a single cross-
section survey they are able to employ the average allocation to a particular area by the federal
government as an instrument for the allocation to a particular household in a given area—i.e.
4. Data sources and collection methods
Information constraints can be formidable in conducting impact evaluation. Data sources
can consist of longitudinal, cross-section, baseline with follow-up, and time series. In principle,
any of these types of data can be collected using quantitative or qualitative methods.
Longitudinal (panel) designs employ at least two observations in timeone made before
the intervention (baseline) and another afterwards. Panel data sets are best suited for program
evaluation. However, generating a panel data set is difficult in practice and can be expensive.
Many poor countries have serious capacity constraints in generating panel data sets.

13
The most commonly used sources are cross-sectional surveys: one time sample surveys of
target populations, some of whom have not received treatment. In this case, project outcomes on
subjects who receive the treatment are compared with those who do not. Various statistical
techniques are adopted to control for differences between the two groups. Cross-sectional data is
the least expensive means to examine impact; however, it is only rarely one is able to do a
rigorous evaluation with a cross section survey. For example, as already noted, Jalan and
Ravallion 1998 were able to use a single cross-section with a “matching” method to compensate
for the lack of a baseline and randomization, in the evaluation of Trabajar public works program
in Argentina. This was possible because the evaluation design was able to take advantage of
certain project specific conditions. For example, data collection for the project coincided with a
nationwide census, which allowed for statistical matching based on observed characteristics.
Thus, methods can substitute for data, but only up to a point.
Before- and -after (or baseline with follow-up) surveys are amenable for evaluation of
programs with either full or partial coverage. The main problem with before- and -after studies
are the existence of confounding factors that may obscure program impact: a problem that is
tractable with panel data sets.
Time-series data are probably the only means for impact assessment for programs with full
(national) coverage. Examples of programs include national AIDS or TB prevention program,
Malaria control program, etc. Time series data allow the examination of trends that would have
occurred before the program with those that occurred after the program. The greatest limitation
is that many pre-intervention time series data points are required for rigorous analysis of the pre-
intervention trend.

14
Where no preintervention measures (or information) exist, and no reflexive controls can be
established because everyone is covered by the program and the coverage is uniform over place
and time (thus virtually ruling out both randomized and constructed controls), the only way to
generate information is by adopting generic controls or shadow controls. Generic controls
involve comparing program outcomes to estimates based on related studies. The validity of the
estimated outcomes rely heavily on the quality of controls. Shadow controls consist of the
judgment of experts, program administrators or participants. Since generic and shadow controls
are often the only controls available for full-coverage programs that are uniform over time and
space, it must be used with great caution. Estimates of what would occur in the absence of the
program in such situations are largely speculative.
Methods of data collection—qualitative and quantitative approaches.3 Measures to
ensure the validity and reliability of data depend on the approach used in collecting the data.
With the quantitative approach, validity and reliability depend on the precision with which the
key variables of interest are collected. The level of skill and training of the individuals who will
be responsible for administering a quantitative survey is important to determining the reliability
of the data. In addition, to ensure precision using the quantitative approach, a large enough
sample of the population of interest is taken to ensure that the estimates are precise to a specific
degree, a certain percentage of the time. Thus, with quantitative methods, appropriate selection
of the sample (along with establishment of controls) is key to providing estimates which are
precise.
3 The epistemological roots and the philosophical underpinnings of quantitative and qualitative methods areexplored in the Appendix Note.

15
The validity and reliability of qualitative data depend a great deal on the methodological
skill, sensitivity, and training of the qualitative evaluator. In practice, observation and
interviewing are fully integrated activities. The skilled interviewer is also a skilled observer
because every face-to-face interview also involves observation. The interviewer must be
sensitive to nonverbal messages, the interview setting, and the interviewee’s background
characteristics. Qualitative methods rely less on statistical precision to ensure validity because
often, the sample size is such that statistical tests are not possible. Thus, triangulation is often
used to ensure data validity and reliability. Triangulation involves the systematic use and
comparison of data collected with independent methods. There are various means of
triangulation based on comparing the data sources, investigators, data collection methods, and
theory (see Box 2).
The objective in triangulation is to assess potential biases in particular methods of data
collection and other independent methods that are likely to offset these biases. For example, in
the case of data method triangulation, estimates of household income obtained from direct
questions may tend to underestimate income either because respondents do not wish to admit
illegal sources of income, or because the respondent may forget to report certain sources. Direct
observation in the house, or family diaries, or more intense contact with families through
participant observation could reveal the source of the basis and yield a more precise estimate of
household income. The precision of the sample could be further improved by carefully selecting
a small, but random sample of households.

16
Box 2: Methods of triangulation The literature on qualitative methods of data collection identifies four basic types oftriangulation: (1) data triangulation - the use of a variety of data sources in a study. For example, interviewingpeople in different occupations, status positions or belonging to different political parties on oneor a series of issues. (2) investigator triangulation - the use of several different evaluators or social scientists. (3) method triangulation - the use of multiple methods to study a single problem or program,such as interviews, observations, questionnaires or written secondary sources. (4) theory triangulation - the use of multiple perspectives to interpret a single set of data.
Observations on interviews and interviewing. Data collection based on interviews or
questionnaires can be viewed along a continuum ranging from unstructured or non-standardized
to structured and standardized techniques. Qualitative methods are generally associated with the
former and quantitative methods with the latter of these extremes.
The most commonly used form to obtain standardization is the schedule standardized
interview in which the wording and sequence of questions are determined in advance and the
questions on the schedule are posed to all respondents in exactly the same way. The interviewer
reads the questions and records the answers on the schedule either verbatim or in precoded
spaces. The questions are generally closed or “fixed-alternative” i.e., the responses are limited to
certain alternatives. This form of interview is used when the same information is to be collected
from each respondent and generally for purposes that involve the quantification of data
What we here call the non-standardized or less structured interview, has been given
confusingly many different names; nondirective, research, intensive, qualitative, in-depth, semi-

17
structured interviews, etc. These interviews are generally using open-ended questions and
flexible designs. There are, however, differences in degree in this category with respect to both
open-endedness and flexibility i.e. the extent to which design and questions are determined and
standardized before the interview occurs. Below, three approaches to less structured open-ended
interviews are distinguished.
1. The informal conversational interview relies primarily on the spontaneous generation of
questions in the natural flow of an interaction or when the interviewer wants to maintain
maximum flexibility to be able to pursue information in whatever direction appears to be
appropriate, depending on the information that emerges from observing a particular setting, or
from talking to one or more individuals in that setting. The strength of this approach is that the
interviewer is flexible and highly responsive to individual differences, situational changes and
emerging new information. The weakness is that it may generate less systematic data that is
difficult and time consuming to classify and analyze.
2. The interview guide approach is based on the preparation of an interview guide listing the
questions or issues that are to be explored in the course of an interview. The guide is prepared in
order to make sure that basically the same information is obtained from a number of people by
covering a pre-determined set of issues or questions. The guideline provides a framework within
which the interviewer may decide to pursue certain questions in greater depth. The advantage of
the interview guide approach is that it makes interviewing of a number of different persons more
systematic and comprehensive by delimiting the issues to be taken up in the interview. Logical
gaps in data can be anticipated and closed, and the interviews remain fairly conversational and
situational. The weakness of this approach is that important topics may be inadvertently omitted.
18
Interviewer flexibility in wording (and sequencing) questions can result in substantially different
responses from different persons, thus reducing comparability.
3. The standardized open-ended interview consists of a set of questions carefully worded and
arranged with the intention of taking the respondent through the same sequence and asking each
respondent the same questions with essentially the same words. The interview questions are
formulated in advance exactly the way they are to be asked during the interview. The basic
strength of the standardized open-ended interview is that the respondents answer the same
questions, thus increasing comparability of responses. The weakness of this approach is that it
does not permit the interviewer to pursue topics or issues that were not anticipated when the
interview instrument was elaborated.
5. Combining quantitative and qualitative approaches in impact evaluation
The typical quantitative approach to evaluation can be viewed as ideally consisting of the
following elements or phrases: 1) an experimental or quasi-experimental design; 2) quantitative
data collection; and 3) statistical analysis of data.
The consistently qualitative approach, in contrast, includes 1) inductive or “naturalistic”
open-ended inquiry; 2) qualitative data collection; and 3) content analysis. Content analysis
consists of describing, interpreting and analyzing patterns observed in qualitative data, as well as
the accompanying processes and causal relationship that these data generate.
These two “pure” approaches can be combined in various ways for enriching the analysis
of program impacts. For example:
1) experimental design, qualitative data collection, and content analysis;

19
2) experimental design, qualitative data, and statistical analysis;
3) inductive/naturalistic inquiry, qualitative data collection, and statistical analysis;
4) inductive/naturalistic inquiry, quantitative measurement, and statistical analysis.
It should be emphasized here that the examples of combinations presented above are far
from exhaustive. In practice, a particular evaluation can include different types of design, data
and forms of analysis.
Participatory approaches tend to overlap more with qualitative than with quantitative
methods. However, not all qualitative methods are participatory, and inversely, many
participatory techniques can be quantified (see Appendix Note 1). To fulfill the requirements of
participatory monitoring and evaluation, stakeholders, particularly at the local level, should be
actively involved in various or all stages of the monitoring and evaluation. This involves:
determining the objectives of monitoring or evaluation, identifying indicators to be employed, as
well as participating in data collection and analysis. Participatory monitoring is a continuous
process of accumulative learning and involvement on the part of the stakeholders. Participatory
monitoring generates the basis for participatory evaluation i.e., evaluation which reflects
perceptions, perspectives and priorities of all stakeholders; it constitutes an important input, and
an additional perspective, for impact evaluation.
Thus, a good evaluation necessitates the combining of both qualitative and quantitative
approaches to data collection and analysis. Combining both approaches provides quantified
results of program impacts as well as explanations of the processes and intervening factors that
yielded these outcomes. Combined approaches enrich interpretation or explanation (causality) of
outcomes measured by the evaluation.
20
Quantitative (measurable) indicators on inputs, outputs, and outcomes are an essential part
of the information base through out both during project implementation and after completion.
For this purpose, the typical information gathering strategy is a sample survey on participants
and non-participants. Ideally, a panel data set is most desirable for properly establishing
causality on the determinants of outcomes (impact). Prior to framing a questionnaire, informal
discussions with clients using qualitative or participatory techniques and unstructured interviews
will be extremely helpful not only for asking the right questions, but also for developing
appropriate hypotheses.
Once baseline and follow-up survey data are available, quantitative techniques can be
adopted to derive an empirical estimate of the impact of an intervention on the targeted group.
The quantitative approach to evaluation relies on predetermined hypotheses and assumes that the
relevant variables can be identified in advance and measured.
In many instances, however, it is difficult to know in advance the various factors
impinging on outcomesand in the absence of that knowledge, one cannot empirically isolate
the role of the intervention relative to other (extraneous) factors. In this context, information on
processes, institutions, and on perspectives of participants (and non-participants) themselves can
be very helpful. Qualitative methods are best suited for gathering this information.
Participatory methods are flexible and open-ended, and are not always restricted to a
predetermined set of variables, outcomes or questions. This approach is holistic, attempting to
take into account as broad as possible a range of factors and relationships. This facilitates
discovery of unanticipated consequences of an intervention, such as 'second-round', unforeseen,
positive or negative effects. A more direct and personal relationship established between
interviewer and informant promotes trust and facilitates in-depth inquiry into sensitive topics

21
which may be difficult to approach through survey research. Further, participatory approaches
reflect more directly the perceptions, values and perspectives of the individuals and groups that
are being investigated. These approaches are also well suited to explain in-depth the reasons for,
and character of, critical incidents and events, and the dynamics or causality of such events when
they are linked into sequences or processes. Good participatory research gives rapid feedback on
conclusions and recommendations, allowing the analyst to modify or validate the results
obtained from a quantitative analysis.
Participatory methods have been used to learn about local-level conditions and local
people’s perspectives and their priorities largely for determining the components of (Bank)
project interventions. But one can go further, and use participatory methods not only at project
formulation stage, but throughout the duration of the project, and especially for evaluating how
the poor perceived the benefits from the project.
Survey-based, structured methods, participatory and qualitative methods of information
gathering complement one another. Researchers formulate evaluation objectives, hypotheses,
and research methodology from observation and knowledge of local circumstances using
qualitative or participatory methods. A survey questionnaire is developed after due pre-testing.
Quantitative techniques with random assignment experiments are then adopted to test the
hypotheses. Even after such a procedure, anomalous and otherwise curious results from baseline
surveys may require a follow-up intensive qualitative investigation, especially while translating
from the general to the specific e.g. scheduled castes in India are generally worse off (a general
valid observation). Why are scheduled castes in India’s Uttar Pradesh so much worse off in their
access to public services than scheduled castes in Kerala in the same country?a very specific
question).

22
The integration of quantitative methods with participatory and qualitative methods can be
achieved as follows:
• qualitative methods can be used to determine the design of the quantitative survey
questionnaire (e.g., piloting key concepts and problematic issues or questions)this
enables incorporation of the perceptions of poor people themselves;
• qualitative methods can also be used to determine the stratification of the quantitative
sample.
• quantitative survey interview can be used to design the interview guide for the
qualitative data collection; and
• quantitative survey can be used to determine the generality, ‘volume’ or extent (in a
given area or society) of findings or phenomena identified through qualitative
methods in more limited areas or samples.

23
Table 2: Linking alternative evaluation methods to data requirements and the use of qualitative methodsMethod Data requirement How to incorporate qualitative and participatory methods
Minimal IdealRandomized controls Single project cross-section
with and without beneficiariesBaseline and follow-up surveys onboth beneficiaries and non-beneficiaries. Allows for control ofcontemporaneous events, in additionto providing control for measuringimpact. (This allows for a differencein difference estimation)
• Inform design of survey instrument
• Identify indicators
• Use to inform identification and maintenance ofintegrity of controls
Non-randomized controlsa) Constructed controls or
“matching)Large surveycensus, nationalbudget or LSMS typesurveythat over samplesbeneficiaries
Large survey, and smaller project-based household survey, both withtwo points in time to control forcontemporaneous events.
• Inform design of survey instrument
• Identify indicators
• Use to inform identification of variables to be used inmatching
b) Reflexive Baseline and follow-up onbeneficiaries
Time series or panel onbeneficiaries and comparable non-beneficiaries
• Inform design of survey instrument
• Identify indicators
c) Statistical control orinstrumental variable method
Cross-section datarepresentative of beneficiarypopulation with correspondinginstrumental variables
• Inform design of survey instrument
• Identify indicators
• Use to identify appropriate instruments
d) Generic controls Cross-section data onbeneficiaries
Cross-section data on beneficiariesalong with estimates of effect ofintervention on similar population
• Inform design of survey instrument
• Identify indicators
• Use to identify benchmarks for impact indicators
e) Shadow controls Cross-section data onbeneficiaries
• Inform design of survey instrument
• Identify indicators
• Use to summarize expert opinion regarding level ofimpact of intervention

24
6. Incorporating evaluation into the project cycle
Incorporating good evaluation into the project cycle is best accomplished through
combining qualitative and quantitative approaches as outlined in the previous section.
Under the traditional project cycle employed by the Bank (see Figure 1), each step in the
project cycle includes a monitoring and evaluation related task.
Table 3 summarizes the tasks that are necessary to incorporate sound evaluation
into the project cycle and the desired approaches at each stage of the project cycle 4.
Setting up baseline, controls, and time-frame for evaluation should form part of project
identification/preparation. During this phase, both qualitative and quantitative methods
may be required to identify needs of beneficiaries, and assess their perceptions, or design
questionnaire to be used in surveying. By the time the project is ready for appraisal, the
relevant indicators have been identified and discussed with the relevant counter-parts and
beneficiaries (if applicable). Participatory and/or qualitative methods such as client
feedback, rapid appraisals, etc. can be used at this stage. During implementation, both
qualitative and quantitative methods can be used to ensure that identified indicators are
reaching established targets. In addition, before/after surveys, or baselines and follow-
ups surveys can be used to examine the intermediate effects on outcomes. The major task
during project completion should be the implementation of a follow-up survey to be used
in assessing the inter-meditate impact of the project. This would require both qualitative
and quantitative methods. Finally, post-completion would require the actual estimation
4 This table illustrates only the evaluation of outcomes; not monitoring. For a distinction betweenmonitoring and evaluation, see page 1, para 2 of this Note.

25
of impact, ideally using both qualitative and quantitative methods to cross check and
verify results while providing a holistic explanation of outcomes and impact.
Table 3: Incorporating evaluation into the project cycleTraditional project cycle Evaluation - related tasks Approaches and methods
Identification/Preparation Establish baselines and controls;set time-frame for follow-upsurvey
Participatory needs assessment, theresults of which can be later used todesign survey questionnaire and forrandomization.
Appraisal/Negotiation Identify output, outcome andimpact indicators
Client feedback.
Implementation/Supervision Use indicators identified duringappraisal to monitorimplementation
Rapid appraisal, attitude surveys, usepanel or before/after surveys toperform mid-stream evaluation ofoutcomes and impacts.Beneficiaries assessment.
Completion Implement follow-up survey Rapid appraisal. Beneficiariesassessment.
Post- completion Evaluate outcome and impactindicators of project
Comparison of means (forrandomization), econometric methodsto be combined with client feedbackfrom qualitative methods.
The issue of incorporating evaluation into the project cycle is particularly
important because of the new adaptable lending instruments the Bank has developed to
facilitate the greater piloting to large-scale investment operations: Learning Innovation
Loans (LILs) and Adaptable Program Loans (APLs).5 The objective of these loans are to
5 LILs are applicable where experimentation and piloting are needed to determine the base course of actionand to assess borrower capacity before project implementation on a large scale. LILs are used when : 1)institutional capacities need to be built up in preparation for a large-scale program; 2) the environment inwhich the project is to take place is promising but uncharted; 3) to pilot a potentially good developmenteffort when the time is right and the ground has already been laid through a local initiative, socialassessment, other participatory exercise or another partner’s efforts; 4) in some combination of theseconditions.
APLs are primarily sectoral (or inter-sectoral) based. The basic premise of an APL is that somedevelopment processes require many years to resolve and are generational. In addition, specific activities

26
adapt “… existing instruments to permit more open-ended lending based on specific
objectives and a long-term development strategy, and to permit piloting and innovation
over a relatively short timeframe.”6 The result is greater flexibility in adapting project
design and financing during the project cycle. To be effective, it is necessary that these
new investment instruments have a strong monitoring and evaluation component. In the
case of LILs, monitoring and evaluation (M&E) are an explicit part of the loan, and rapid
feedback from M&E is essential to success. In the case of APLs, M&E is essential for
the borrower and the Bank to gauge the achievement of objectives and critical milestones,
to facilitate the adjustment of the program if necessary, and to complete appraisal of the
next phase.
Figure 1 illustrates the project cycle for the new adaptable lending instruments
and underscores the importance of evaluation in the successful implementation of these
kinds of projects.
may vary over time for various reasons (i.e. changing interests, priorities and capacity of borrowercountries, the Bank and the donor community) The criteria for APLs are: 1) agreement on the long-termdevelopment objective of the program; 2) demonstrable cost-benefits and program justification based onbroadly acknowledged economic and other parameters for the program; 3) a viable financing plan and ageneral description of the required investments and activities which would be defined in due course; 4) asthe program is implemented, a logical sequence of activities and phasing of these activities with definedmilestones, performance indicators, policy requirements, and explicit linkages to development objective.Adaptable Lending New Investment Instruments, World Bank, August 1997.6 Adaptable Lending New Investment Instruments, World Bank, August 1997.

27
Figure 1: Project cycle for the new adaptable lending instruments
Identification
Appraisal
Implementation
Completion
Evaluate Pilot:Post-Completion
Appraisal ofnext phase
Implementation
Completion
Evaluate next phase:Post-Completion
Appraisal of following phases
Piloting Phase
Follow-up Phase

28
7. Conclusion
This note has outlined the factors critical for evaluating the impacts of projects and
programs. Three conclusions emerge:
1. Identification of the counterfactual is the organizing principle of a good impact
evaluation. In order to determine the effects of the intervention, it is necessary to
identify what would have happened without the intervention.
2. Further to identifying the counterfactual, it is necessary to (a) clearly define control
groups; and (b) identify all variables which will impact on program outcomes.
Ideally all variables which will impact on program outcomes will be readily
observable and therefore measurable. However, this is not always the case; at times
some variables which will impact the program outcomes are not directly measurable.
It is necessary to be aware of these variables and to identify methods (whether
qualitative/participatory, or quantitative/statistical) that will facilitate the estimation
of a proxy variable to capture these effects.
3. Both quantitative and qualitative methods are necessary for a good evaluation. The
two approaches strongly complement each other. This note has outlined various ways
in which such an integration of methods, in the context of evaluation, can be
accomplished.
29
References
Besley, Timothy and A. Case. 1994. Unnatural Experiments? Estimating the Incidence
of Endogeneous Policies. NBER Working Paper 4956.
Jalan, J. and M. Ravallion. 1998. Transfer Benefits from Welfare: A Matching Estimate
for Argentina. Washington, D.C.: World Bank. (Mimeo).
Operations Evaluation Department. 1994. Designing Project Monitoring and Evaluation.
Lessons and Practices. No. 4, December.
Ravallion, M. and Q. Wodon. 1997. Evaluating Endogeneous Social Programs When
Placement is Decentralized. Washington, D.C.: World Bank. (Mimeo).
Rossi, Peter H. and H. E. Freeman. 1982. Evaluation: A Systematic Approach. Second
Edition. California: SAGE Publications, Inc.

30
Appendix Note 1
Qualitative and quantitative methods– roots and differences7
Epistemological roots
Qualitative evaluation methods are derived most directly from the field study
traditions of anthropology and sociology. The philosophical perspectives that underlie
qualitative methods include phenomenology, grounded theory and symbolic
interactionism. Common to these and related perspectives is the notion that the social
sciences and social science knowledge are fundamentally different from the natural
sciences.
This position stands in contrast to the foremost tenet of logical positivism, the main
philosophical and methodological perspective guiding quantitative evaluation
approaches. Logical positivism holds that the methods and procedures of the natural
sciences are appropriate to the social sciences and also maintains (the ontological
position) that there is one objective reality independent of the observer.
Methodologically, positivism is associated with the hypothetico-deductive method.
Ideally, deduction begins with theory (laws or law-like premises), moves through the use
of logical rules and reasoning to hypotheses derived from the theory, and then tests
hypotheses via prediction and observation. In evaluation, hypotheses or key variables and
aspects are translated into measurable quantitative indicators (e.g., performance
indicators) through a process of operationalization. The findings obtained through this
7 This note is written by Anders Rudqvist.

31
approach, and particularly in evaluation, are empirical generalizations and relationships
between variables. The logical positivist approach in evaluation requires as a point of
departure a systematic and standardized conceptual framework and design, which allows
operationalization and measurement (with associated advantages in terms of sample
sizes, coverage, etc.). However, it also inevitably implies reductionism and rigidity.
Concepts, design and research issues are, to a certain degree, predetermined and “reality”,
in a sense, is determined by operationalization and confined to what is quantitatively
measurable.
The methodological schools that inspire qualitative methods argue the existence of
“multiple realities” depending on the interpretations and perspectives of the observers.
Qualitative research is also frequently carried out in an inductive rather than deductive
way. Induction begins from particular observations from which empirical generalizations
are made. For example, the “grounded theory” approach, develops theoretical ideas from
observations of the data themselves, by constructing ‘sensitizing’ concepts from
observation, drawing out comparisons with other linked areas and sample theoretically,
e.g., by sampling critical cases. This approach is more open-ended, flexible and less
predetermined than the quantitative approach. At the same time, it is more limited in
terms of sample sizes and coverage.
The difference between qualitative and participatory methods
It may be useful to clarify the distinction between quantitative and participatory
approaches to evaluation since this distinction has important implications for the
conception and design of evaluations. While in practice participatory approaches tend to

32
overlap more with qualitative than with quantitative methods, not all qualitative
approaches are participatory. Also, many participatory techniques can be quantified.
The Bank distinguishes different levels of participation: information dissemination
(one-way flow of information); consultation (two-way flow of information);
collaboration (shared control over decision making); empowerment (transfer of control
over decisions and resources). Of these, the two former are viewed as prerequisites for
the authentic participation inherent in the latter two levels. To simplify and give an
example, the participatory monitoring and evaluation approach can be contrasted in the
following way to more conventional (quantitative or qualitative) approaches to
monitoring and evaluation.
Conventional M&E Participatory M&E
Definition of objectives Agencies, project staff,managers, experts
Primary and otherstakeholders at local level,project staff, managersoften helped by a facilitator
Role of primarystakeholders
Provide information only Design and adaptmethodology, collect andanalyze data, share findingslinking them to action
Measurement Externally selected andoperationalized, mainlyquantitative, indicators
Internally selected anddefined indicators,frequently qualitative
Approach Predetermined,standardized, systematic
Inductive, adaptive, open-ended
Participatory monitoring and evaluation aims to include a broad range of
stakeholders, emphasizing inclusion of groups at the grassroots level that have generally
had a very limited role in conventional evaluation. It requires the involvement of different
categories of stakeholders in a process of construction, interpretation and consensus with
33
reference to key questions, concepts, indicators and procedures for evaluation. One of the
main objectives is to establish ownership and accountability among stakeholders, and
rapid feedback mechanisms that lead to corrective action or dissemination of best
practice.
PM&E is a learning process, where stakeholders learn, on the one hand, to develop
and adjust methods and techniques for evaluation, negotiation, consensus-building or
conflict resolution and, on the other, to assess and compare their own perceptions of
substantive project progress or problems.
So, even if the principles and general outlook of the conventional and the
participatory approach to monitoring and evaluation are clearly different, they are still
complementary, PM&E providing an “insider” process-oriented perspective, and the
conventional evaluation approach a more detached “outsider” perspective.
N:\public\subba\impact\impact3.doc