Embed Size (px)
Citation preview

Impact Chains and a Multi-Criteria Decision Tool to Support Electricity Power Planning
Fernando Ribeiro
Paula Ferreira
Madalena Araújo
Report 01/2012
PTDC/SEN-ENR/099578/2008

Impact Chains and a Multi-Criteria Decision Analysis Tool toSupport Electricity Planning
Fernando Ribeiro a, Paula Ferreira b, Madalena Araujo c
aDepartment of Production and Systems, University of Minho, Guimaraes, Portugal,[email protected]
bDepartment of Production and Systems, University of Minho, Guimaraes, Portugal, [email protected] of Production and Systems, University of Minho, Guimaraes, Portugal,
Abstract: The topic Sustainable Development has brought a wide discussion across a numberof sectors in our society, namely in Power Systems. Given the need to address other concernsthan the economic ones, decision makers must take into account the rationale that lies beneathstrategic choices, such as investing in generation technologies using renewable energy or ratherdoing business as usual and installing fossil fuel power plants. In this research, firstly, logicmodels were used as a decision-aid supporting tool, with the aim of contributing to explain theconnection between building a given power plant and assessing its possible impacts in terms ofsustainable development. All the electricity generation technologies were grouped in thermal,renewable energy sources (RES) and nuclear. The results of the literature review and of aset of interviews with experts, based on the diagrams, allowed to conclude that the use ofRES have wider positive social impacts on the long run, despite their short-term higher costscompared to the traditional groups (nuclear and thermal). Secondly, a Multi-Criteria DecisionAnalysis (MCDA) tool was designed to support the evaluation of different electricity productionscenarios. The MCDA tool is implemented in Excel worksheet and uses information obtainedfrom a mixed integer optimization model, to produce a set of optimal schemes under differentassumptions. Given the input, the MCDA allowed ranking different scenarios relying on theirperformance on 13 criteria covering economic, job market, quality of life of local populations,technical and environmental issues. The criteria were weighted using both direct weights andtrade-off analysis. This research also presents scenarios for the Portuguese power generationsystem in 2020, as well as the results of the evaluation using the MCDA tool, relying in the inputsfrom a group of academics with background in economics, engineering and environment.
Keywords: Energy decision making, electricity generation, logic models, MCDA.
1. IntroductionAmong the strategies envisioned by the European Union, two of them concern especially power sys-tems: the 20-20-20 and the European Union Sustainable Development Strategy (EUSDS).
1. The EUSDS aims the building of a European Union respecting the inter-generational principle,while achieving full employment through a competitive social market economy and balanced eco-nomic growth, among other objectives [1].
2. The 20-20-20, with a horizon of 2020, points to a reduction of 20% of primary energy consumptionwith the improvement of energy efficiency, a minimum share of renewables energy of 20% and thereduction of greenhouse gases to 20% below the 1990 values.
The authors addressed in past works social issues in power systems planning [2] [3]. From the lit-erature reviewed related to electricity generation they concluded that the methodologies explicitlyexpressing economic, social and environmental criteria, fall mostly on Multi-Criteria Decision Aid
Corresponding author: Paula Ferreira, Email: [email protected]

(MCDA). It is clear in the literature that ultimately the economic and environmental criteria stillprevail, given the ”soft” aspects of the social issues. Additionally, given the inter-relation betweendifferent groups of criteria (and the expression ”socio-economic” proves it) situations exist wheresome short term non-optimal cost choices can be supported under the perspective of inducing virtuouscycles of social welfare and long-run economic return, as it is advocated, generally, by many whosupport investment on renewables.
In these terms becomes necessary to organize the rationale behind the support of the strategic impor-tance tat different groups of electricity generation technologies assume. This research aims to give acontribution to this issue, by exploring the construction of diagrams for allowing the visualization ofimpact chains associated with different technologies. Section 2 addresses this topic. Three logic mod-els (one for each group of electricity generation technology: thermal, nuclear and renewables) wereconstructed from interviews with experts in power systems and also from document review (consultantreports and government strategy documents).
The research is complemented in section 3, with a Multi-Criteria Decision Analysis tool, created to beused in the evaluation of different electricity generation scenarios. When using multi-criteria decisionmethodologies, one has to have in mind that best solutions are not universal best solutions, sinceresults are made upon personal judgement of different criteria. In the present work a panel of expertson energy systems was invited to map the diversity of opinions and the outcomes of the use of theMCDA tool, which was demonstrated for the evaluation of possible scenarios drawn for Portugal in2020.
The criteria used in the MCDA cover not only social, cost and environmental issues, but rather in-corporate them in the wider goal of choosing a technically feasible solution. The criteria were drawnfrom both interviews described in Section 2 and from the literature.
Figure 1 summarizes the methodology used for Section 3. The two main blocks of the methodologyare Scenario Generation and Scenario Evaluation (MCDA Tool). Sections 3.1 and 3.2 are dedicatedto each one of them. The remainder of this section overviews power generation in Portugal.
Figure 1: Evaluation of scenarios for electricity production, with MCDA evaluation

1.1. Power Generation in Portugal
Electricity in Portugal is mainly generated from large hydro, thermal and wind power, as can be seenin Figure 2. Thermal power is mostly provided with coal and CCGT (combined cycle gas turbines)power plants. Special Regime Production include all the technologies benefiting from feed-in tariffs,which are in Figure 2 divided in Wind power and ”Other SRP”.
Figure 2: Installed power in Portugal, 2010. Own elaboration from www.ren.pt data. ”Other SRP”include non-renewable and renewable cogeneration, biomass, small hydro, photovoltaics and wavepower.
The Portuguese electricity system is strongly influenced by the rainfall characteristics. Although thelarge hydro power installed capacity remained almost unchanged between 2006 and 2010, in fact thehydro production suffered strong variations.1
In 2007, the Portuguese state launched a new plan for installing more hydro power, known as PNBEPH(Plano Nacional de Barragens de Elevado Potencial Hidroelectrico)[4]. It aims to reduce the unusedhydro power potential from 54% to 33% until 2020, installing new 2059 MW. This is expected tobe achieved by two means: increasing installed power of already existing facilities (909 MW), andbuilding ten new hydro power plants totaling 1150 MW of installed power. Among these projects,some include pumping capacity. The use of pumping allows more wind power to be installed: giventhat wind farms produce more in off-peak hours when electricity prices are lower, this energy can beused to pump water back to dams, so that hydro power can be generated during the hours of higherconsumption and higher electricity prices. In 2007 the PNBEPH forecasted that in 2010 there wouldbe 5100 MW of installed wind power, which contrasted with the 3751 MW achieved in reality. Asa result, the completion of these plans are constrained by political and other factors (such as the fallof electricity consumption in 2010 and 2011). The future of the Portuguese power system remainsuncertain, and in section 3.1 we explore some possible scenarios for 2020.
2. Impact Assessment and Logic ModelsImpact Assessment aims at structuring and supporting the development of policies [5]. Accordingto [6], ”impact” is often associated at the level of welfare of households and individuals. Impactevaluation presupposes there is both an institutional intervention (”impact of what?”) that producesresults (”impact on what?”). These authors recognize that currently there is a shift in evaluation
1The yearly variation of hydro power production is reflected in the so-called ”hydraulicity factor”.

Figure 3: Electricity generation in Portugal, 2010. Own elaboration from www.ren.pt data. In orderto present the numbers for a typical rainfall year, the numbers for hydro power were divided by thehidraulicity factor, which in 2010 was 1.31. The exceeding energy was assumed to be covered equallyby coal and natural gas.
from small programs such as irrigation in a given district, to more complex intervention, induced byinternational treaties, such as the Kyoto Protocol [6].
Electricity production in the EU has become liberalized in the last decades. The role of the gov-ernment as a central planner tends to be reduced and mostly previously state-owned companies andfacilities tend to be privatized. Although under liberalization the government no longer oversees theentire planning process, the electricity sector decisions are still strongly driven by central authorities,addressing issues such as GHG emission limits, RES shares, external energy dependency or universalaccess to electricity. As a result, the market is not absolutely free and tends to be guided. So, to thequestions ”impact of what?” and ”impact in what?”, we may answer ”impact of energy policy uponthe standards of living of the population, having in the background the contribution of power systemsto sustainable development”.
Impact Assessment has been used widely within the EU and, in 2002, the single-sector assessmentwas replaced by a new integrated approach, capable of assessing economic, environmental and socialeffects [7]. This new approach allows Logic Models to be used when providing stakeholders with avisual map or narrative description of how specific program components are related to the program’sdesired results [8]. The literature related to logic models shows they have been applied both in avast array of purposes, such as the monitoring of national R&D programs [9] [10], or educationprograms [11] [12] among others. For an overview of applications see the already mentioned [6].
The objective of this research is to organize the perceived short, medium and long-term impacts ofelectricity generation technologies, with the ultimate goal of assessing the sustainability of the Por-tuguese power system and supporting future strategic decisions in the electricity sector. For thatpurpose, logic models are built with the aid of both literature review and of interviews with a groupof experts, as explained in the remainder of this section.

2.1. Methodology
MacLaughin et al. [13] dedicated an article to the use of Logic Models for program performanceevaluation, and described a five stages process to achieve the Logic Model. The present work wasconducted upon their instructions adapted to the topic under research:
1 - Collecting the relevant information: emphasizing the team work needed for building a LogicModel, along with the evidence that multiple perceptions about power planning exist,experts in powersystems, with varied positions on key questions such as markets in general and the renewable en-ergy sources’ role were invited to enter the process. Documents used to build preliminary inferencediagrams, were consulted, namely [14] and [15].
2 - Clearly defining the problem and its context: Here the assumption is that a problem, the powergeneration planning, is to be solved under resource constraints and framed on the European energypolicies, as well as a globalized competitive market. Therefore, the power planning has to allow theelectricity demand to be met using three groups of solutions (thermal, renewable and nuclear), whileaddressing economic, environmental and social issues.
3 - Defining the elements of the logic model: Starting with three tables (one for each Logic Model)with Resources, Activities, Outputs and Outcomes, the interviewees were induced to speak aboutimplications brought by the building of each type of power plants, and fill the table, while seeking todescribe short, medium and long term outcomes.
4 - Drawing the Logic Models: Considering the literature review and results of the interviews, thelogic models were built for each technology. The results are presented further in the next section.
5 - Verifying the Logic Models with stakeholders: The logic models were presented to all participantsin interviews to validate the results.
2.1.1. Conducting the interviews
The interviews lasted an average 45 minutes. The interviewees were firstly presented an example ofa logic model to become familiarized with the goals of the interview. The chosen example was anEuropean strategy to help reduce poverty, in order to avoid biases about sustainable development andenergy; then the participants were invited to talk about economic, environmental and social impactsassociated to each group of technologies, starting from the long-term perspective (example: how doyou think that environment will get better if these technologies are used?) and progressing fromthere to more immediate impacts (which impacts does the construction of this type of power plantsimmediately cause?) While the interviewee was talking, the interviewer was filling the table withshort, medium and long-term impacts and would then present it to the interviewee. The interviewerprepared, before the final results, a simple logic diagram and tables, aiming to discuss them furtherwith the interviewee and possibly fill more impacts and connections that have arisen in the process.
2.2. Impact Chains
Based on the literature review and the interviews conducted with experts, three logic models weredrawn (Figures 4, 5 and 6), presenting the impacts of electricity generation technologies.

Figure 4: The Renewable Energy impact chain

Figure 5: The Thermal Power impact chain

Figure 6: The Nuclear Energy impact chain

2.3. Discussion
Decision-makers with different political points of view will tend to favour different political aspects ofstrategies about energy. The most visible example is the position towards market prices in short-term.As electricity costs affect a wide number of commodities, it can be argued that it is essential for acountry to provide cheap electricity. Otherwise the country will lose competitiveness, and eventuallyimpoverish by losing industry and other economic sectors. This argument tends to transform the per-spective on sustainability concerns (for example, poorer countries have traditionally been committedto fewer goals of emissions than developed ones). On the other hand there is the external energyindependency factor, which can be achieved in the long run, and would be difficult to achieve yetin a free-market environment, given the high initial costs of exploiting the renewables. This dualityis of extreme importance, and reflects what was said above: cost issues tend to prevail over socialor environmental ones. The remainder of the discussion will reflect topics that have arisen in theinterviews.
2.3.1. Renewables
One thing that became obvious during the process was that the renewables’ logic model would defi-nitely be more complex than thermal or nuclear power ones. Put simply, coal, natural gas and nuclearwould be rational choices from a cost short and medium term perspective, while the renewables, beingperceived as more expensive for now, have means to induce welfare in the long run.The new infrastructures built around power plants were not seen as very important, given the fact thatwhen they refer to roads, are normally away from large populated areas, therefore not resulting veryuseful. Other example of infrastructures built as a consequence of a dam is new housing due to pop-ulation displacement, and this generally causes displease. However, one of the interviewees referredthat new housing ends up causing more employment. Additionally, new infrastructures associatedto renewables frequently disturb areas that used to be isolated, often spoiling landscape and causingvisual intromission.General agreement was achieved on the connection between knowledge (R&D), industrial clustersand energetic / economic independence. Interviewees agree over the misuse of the term ”cluster” asit is frequently assigned to wind power today. According to the general view, all the patents and mostengineering aspects are imported. Instead a wider ”national” value-chain should be favoured whichwould definitely induce a more durable economic development.Although general agreement is that employment creation favours renewables, some interviewees em-phasized that job quality and duration have to be addressed, and that renewables’ projects are oftencreating low duration and low qualification jobs. Even the creation of jobs was seen by one intervie-wee as a critical point, since he argued that job creation in renewables is still artificial and destroysjobs in more productive sectors of industry, given the still high costs these technologies represent.Biomass is not believed to occupy a central place in the near future energy landscape (and only as-suming the form of cogeneration), although it can help to manage the forest in a better way.It is widely agreed that renewables, due to their intermittency, oblige the existence of traditional units(reserve/back-up). This contributes to turning RES electricity even more expensive as a whole. Oneinterviewee mentioned the fact that the existence of wind power capacity installed in Portugal alreadyproduces excessive energy in off-peak hours, resulting frequently in energy exported for free in thosehours.Although there is an agreement that the increment of renewables’ use induces less exposition to fuelfossil prices, this strategy can be discussed in the terms given above: is it worth to invest now or later?If later, when? How long will the natural gas and coal remain cheap?

Construction of transmission lines is a very important requisite to the construction of renewable energyfacilities. RES development implies the decentralization of the grid, resulting therefore in a greaternumber of associated infrastructures, namely substations and transmission lines.
About the topic ”quality of life improvement”, it can be two-folded: general population improvementor more local improvement. It is agreed that renewables offer more local positive impacts; given thelow density of installed power, many wind farms are equivalent to one gas power plant, for example;therefore, many rents will come from land use probably in different regions in the case of wind farms,benefiting more people. On the other hand, the rising prices of numerous commodities, given theirrelation to electricity prices, can be seen as negative.
2.3.2. Thermal Power
These technologies represent the status quo of power production, therefore contribute to keep lowelectricity prices at the cost of foreign dependency and vulnerability to finite resources price volatility.On the other hand, they represent tested and reliable forms of producing power. Coal is seen as anatural polluter in the long run, whereas natural gas is seen as cleaner from this point of view (a noblefossil fuel, in the opinion of two interviewees, which should not be burnt to produce electricity). Theprices of natural gas depend very much on the regulatory framework and how will the Portugueseand Spanish markets evolve in the future and on decisive strategic investments in this area. Also, theability of natural gas combined cycle power plants to contribute to lower electricity prices was statedto depend on the ability to integrate those with wind power. If natural gas power plants play a minorrole, their production will cover only the few peak (expensive) hours. This can lead to the misuseof these power plants, turning hard to justify such large investments. Therefore, no linear or clearrelation exists between the power plant and low output price, but it rather depends on how the powerplant is used.
2.3.3. Nuclear Power
To what concerns nuclear power plants, it is agreed that only a large (in relation to the scale of Portu-gal) power plant is feasible, what would not only imply a redesign of the transmission grid, but alsoinduce market power problems that would have to be carefully studied by regulators. The vulnerabilityto resource prices is not seen as dangerous as in the cases of coal or natural gas, given the historicalstability of prices and its low value. This contrasts with the main problem: the high initial costs.Additionally, no know-how about nuclear power exists in Portugal, therefore knowledge and capitalrequirements have to account in the importations balance. Solid waste and opposition to power plantsare very important matters yet, only expected to disappear if mankind manages to develop nuclearfusion technology and replace the traditional nuclear power plants.
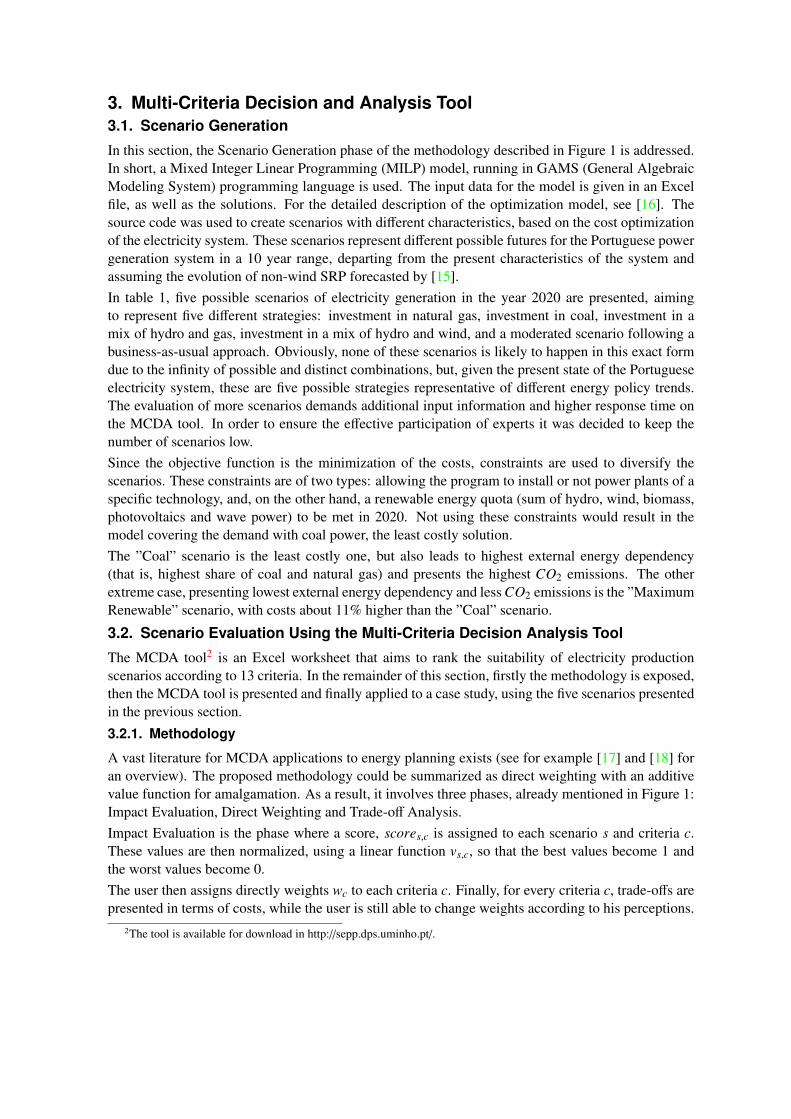
3. Multi-Criteria Decision and Analysis Tool3.1. Scenario Generation
In this section, the Scenario Generation phase of the methodology described in Figure 1 is addressed.In short, a Mixed Integer Linear Programming (MILP) model, running in GAMS (General AlgebraicModeling System) programming language is used. The input data for the model is given in an Excelfile, as well as the solutions. For the detailed description of the optimization model, see [16]. Thesource code was used to create scenarios with different characteristics, based on the cost optimizationof the electricity system. These scenarios represent different possible futures for the Portuguese powergeneration system in a 10 year range, departing from the present characteristics of the system andassuming the evolution of non-wind SRP forecasted by [15].In table 1, five possible scenarios of electricity generation in the year 2020 are presented, aimingto represent five different strategies: investment in natural gas, investment in coal, investment in amix of hydro and gas, investment in a mix of hydro and wind, and a moderated scenario following abusiness-as-usual approach. Obviously, none of these scenarios is likely to happen in this exact formdue to the infinity of possible and distinct combinations, but, given the present state of the Portugueseelectricity system, these are five possible strategies representative of different energy policy trends.The evaluation of more scenarios demands additional input information and higher response time onthe MCDA tool. In order to ensure the effective participation of experts it was decided to keep thenumber of scenarios low.Since the objective function is the minimization of the costs, constraints are used to diversify thescenarios. These constraints are of two types: allowing the program to install or not power plants of aspecific technology, and, on the other hand, a renewable energy quota (sum of hydro, wind, biomass,photovoltaics and wave power) to be met in 2020. Not using these constraints would result in themodel covering the demand with coal power, the least costly solution.The ”Coal” scenario is the least costly one, but also leads to highest external energy dependency(that is, highest share of coal and natural gas) and presents the highest CO2 emissions. The otherextreme case, presenting lowest external energy dependency and less CO2 emissions is the ”MaximumRenewable” scenario, with costs about 11% higher than the ”Coal” scenario.
3.2. Scenario Evaluation Using the Multi-Criteria Decision Analysis Tool
The MCDA tool2 is an Excel worksheet that aims to rank the suitability of electricity productionscenarios according to 13 criteria. In the remainder of this section, firstly the methodology is exposed,then the MCDA tool is presented and finally applied to a case study, using the five scenarios presentedin the previous section.
3.2.1. Methodology
A vast literature for MCDA applications to energy planning exists (see for example [17] and [18] foran overview). The proposed methodology could be summarized as direct weighting with an additivevalue function for amalgamation. As a result, it involves three phases, already mentioned in Figure 1:Impact Evaluation, Direct Weighting and Trade-off Analysis.Impact Evaluation is the phase where a score, scores,c is assigned to each scenario s and criteria c.These values are then normalized, using a linear function vs,c, so that the best values become 1 andthe worst values become 0.The user then assigns directly weights wc to each criteria c. Finally, for every criteria c, trade-offs arepresented in terms of costs, while the user is still able to change weights according to his perceptions.
2The tool is available for download in http://sepp.dps.uminho.pt/.

Table 1: Characterization of scenarios
Constraints ResultsScenario Minimum
RenewableQuota
New in-stalledtechnolo-gies
New installed power Cost(europerMWh)
Emissions(CO2 tonper GWh)
Externalenergy Depen-dency
Base 45% All tech-nologiesallowed
700MW coal, 1000MWhydro, 4400MW wind,1180MW other SRP(all SRP excludingwind power)
25.69 262 30%
NaturalGas
Turned off OnlyCCGTallowed
2350MW natural gas,1180MW other SRP
25.24 294 53%
Coal Turned off Turned off 2550MW coal,1180MW other SRP
23.75 360 55%
Hydro-Gas 45% OnlyCCGTand hydropowerallowed
2050MW naturalgas, 2000MW hydro,1180MW other SRP
25.96 286 45%
MaximumRenewable
70% No coalor CCGTallowed
2000MW hydro,4400MW wind,1180MW other SRP
26.37 250 28%
The final value for the scenario s is calculated according to the Additive Value Function (AVF), asfollows:
AVFs =∑
wci × vs,ci (1)
where the higher the value, the better the solution is.
A brief example is now presented to illustrate the calculation of a trade-off: consider, from the abovescenarios, that the user is weighting only two criteria: costs and external dependency. Taking intoaccount that ”Coal” presents least cost and highest energy dependency, the opposite case of ”Max-imum Renewable”, the normalization of these criteria would consist in vcoal,cost=1, vmax renew,cost=0,vcoal,dependency=0, vmax renew,dependency=1.
As can be seen in Table 2, if only two criteria are weighted and the user gives the same importanceto the costs and the energy dependency, he assumes implicitly that it is for him indifferent to choosescenario ”Coal” or ”Maximum Renewable”. Here the notion of trade-off appears: for the user, theenergy dependency of the ”Maximum Renewable” scenario is worth 2,62 euro/MWh, which is thedifference in cost between the scenario ”Maximum Renewable” and ”Coal” (26,37 minus 23,75). Thecalculation of the trade-off Ts,c is performed according to the following equation:
Ts,c =wc
wcost× scores,c × (26, 37 − 23, 75) (2)
Since Ts,c is already multiplied by the range of the price (the parcel on the right), its value is given ineuro/MWh. The user is always given the % of the costs that this increment represents in relation ofthe coal solution cost: in the case of the example where costs and dependency have the same weight,T=2,62 euro/MWh and 2,62/23,75 equals 11,01%.

It is worthy observing that when the weight of the cost is equal to the weight of the external energydependency, the scenario with best performance is the ”Base”, with AVF=94,79.
Table 2: Calculation of additive value function (AVF) by weighting two criteria
Scenario sCriteria c Base Natural Gas Coal Hydro-Gas Maximum Renewablescores,cost 25,69 25,24 23,75 25,96 26,37
vs,cost 0,26 0,43 1 0,15 0scores,dependency 30% 53% 55% 47% 28%
vs,edependency 0,93 0,07 0 0,3 1
wcost=wdependency=80AVFs 94,79 40,47 80 36,09 80
wcost=100, wdependency=50AVFs 72,19 46,88 100 30,30 50
wcost=40, wdependency=80AVFs 84,43 23,20 40 29,90 80
In case the user gives the costs a weight twice the external energy dependency, he would value theenergy dependency in 1,31 euro/MWh (or 5,5%) and in this case the ”Coal” scenario performs betterthan any other.
3.2.2. The MCDA tool
The proposed MCDA tool is presented in an Excel Workbook with five Sheets, as follows:
1. General Instructions The purpose of the tool is presented, as well as a summary of each of thefollowing pages.
2. Scenarios The scenarios are presented graphically, detailing installed power and produced elec-tricity for each technology. Energy dependency ratio, CO2 emissions and annualized costs arealso displayed graphically.
3. Instructions Instructions for the following sheet are presented, along with an example.
4. Impact Evaluation and Weighting Here the user is presented with the 13 criteria, along withexplanations of every one of them. The user then fills the required cells, according to what hepercepts will be the impacts of each scenario. Trade-offs are presented.
5. Results Results are printed: both ranking of scenarios and contribution of each criterion is given.
In the remainder of this section the information presented and required from the user on the sheetImpact Evaluation and Weighting is introduced.The criteria, Ci, and their description, are given as follows in Table 3. Since not all the impacts can beeasily agreed upon, it was decided that the user might play a role on valuing them, as detailed in thecolumn ”Scenario score is,c”.Information of investment, operation & maintenance of the whole group of power plants is includedin a single cost criterion. Positive impacts in industry, job creation and dependency on foreign fossilfuels have been an international concern for sustainable energy decisions [18] [17] with implicationsat national level [15]. Diversification of the electricity mix is also seen as important for sustainabilitygoals [19] contributing to the security of supply. Local income, visual and noise impacts, as well

as land use and public health were identified as important issues for local populations’ standards ofliving, by the authors [3]. It is sometimes argued that the intermittency of the renewables implythey are overrated in levelized costs [20]: therefore, a criteria which accounts for the dispatchablerate of power on each solution was included. According to [21], the transmission system expansionrequirements may be larger when renewable energy shares are higher; as the scenarios vary respectingto that aspect, the criteria was proposed to be evaluated. Given the importance that CO2 emissionsplay in the economy nowadays, this criterion was also included.
Table 3: Description of the criteria used in the MCDA
Ci Name Description Scenario score is,c
C1 Costs Sum of fixed and variablecosts, divided by the totalelectricity produced duringthe planning period. Thefixed costs are related withthe investment cost appliedto the new power plants andalso with all fixed O&Mcosts. The variable costs in-clude fuel and variable O&Mcosts for new and previouslyinstalled power plants.
Values in e/MWh, obtained from theMILP model. User can not change val-ues.
C2 National Industry Impact of the scenario on thedynamics of the national in-dustry.
Score in ordinal scale, ranging from 1(worst) to 5 (best). Requires user toattribute values according to own per-ception.
C3 Energy Depen-dency
Rate of dependency on for-eign sources in year 2020,calculated as the sum ofenergy produced in thermalpower plants (coal, naturalgas and non-renewable co-generation) divided by the to-tal energy amount produced.
Values in %, obtained from the MILPmodel. User can not change values.
C4 Employment Employment created by theconstruction, operation andmaintenance of the powerplants.
Values are number of jobs. Obtainedfrom the MILP model, based on [22].Although values are given, the usermay attribute different values accord-ing to own perception.
C5 Visual Impact Impact caused by the con-struction of new power plantsupon the sightseeing.
Score in ordinal scale, ranging from 1(worst) to 5 (best). Requires user toattribute values according to own per-ception.

C6 Noise Noise impact caused inneighbor areas by the newinfra-structures.
Score in ordinal scale, ranging from1 (worst) to 5 (best), based on [23].Although values are given, user mayattribute values different according toown perception.
C7 Local Income Rents originated by land use,for both public and privatesectors.
Score in ordinal scale, ranging from 1(worst) to 5 (best). Requires user toattribute values according to own per-ception.
C8 Diversity of Mix Diversity of installed power,calculated according to theShannon-Wiener Index.
Higher values are better. Obtainedfrom the MILP model, based on [24].User can not change values.
C9 Rate of Dispatch-able Power
Ratio between the sum of in-stalled power of coal, CCGT,dam hydro power plants, andall the installed power.
Score is given in %. Obtained from theMILP model. User does not changevalues.
C10 Investment inTransmissionNetwork
Additional investments re-quired by the scenario. It wasassumed that wind power hasthe worst impact, followedby hydro power, and no addi-tional investment is requiredby natural gas and coal powerplants.
Score in ordinal scale, ranging from 1(worst) to 5 (best). Although the val-ues are given, the user may attributedifferent values according to own per-ception.
C11 CO2 Emissions Ratio between CO2 emis-sions and the total electricitygenerated in the overall plan-ning period.
Values are given in tons of CO2 perGWh of electricity produced in theplanning period. Obtained from theMILP model. User can not change val-ues.
C12 Land Use Amount of land which be-comes unusable by the sce-nario.
Values are given in 1000 km2, basedon [22]. Obtained from the MILPmodel. User can not change values.
C13 Public Health Contamination of air, water,and general impact on publichealth.
Score is based on [23]. Obtained fromthe MILP model. User can not changevalues.
Figure 7 presents an example of the user’s views of the MCDA tool for the C2 criterion (Na-tional Industry). The scale for this criterion ranges from 1 (Low dynamics in industry) to5 (Leadership of industry, resulting in capacity for exporting), and the user has assigned thefollowing impacts for Is,c: Ibase,national industry=4, Inatural gas,national industry=2, Icoal,national industry=2,Ihydro−gas,national industry=3, Imaximum renewable,national industry=5. The blue cell is the weight of the cri-terion, assigned as 20 in the example. The information displayed in the plot indicates that the useraccepts to increase the costs in 2.20%, in order to increase the national industry dynamics from score2 to score 5. In other words, the user wishes to increase dynamics national industry from ”coal” or

”national gas” levels, to the ”maximum renewable” levels, and is willing to pay additional costs of2.2% for that change. It is also implicit that the user is willing to pay more 1.47% to increase fromscore 2 to 4, and 0.73% to increase from 2 to 3.
Figure 7: MCDA tool environment (Excel Sheet 4): Impacts and Criteria Weighting
Figure 8: MCDA tool environment (Excel Sheet 5): Results. Here the user can validate his percep-tions.
Finally, the Results sheet contains two plots, as can be seen on Figure 8: the one on the left, showingthe overall ranking for the scenarios, and the one on the right showing the contribution of each crite-rion. The ranking is scaled so that the best scenario is scored by 100. On the given example, ”coal”scenario is the most rated, while the ”Cost” criterion is assigned as the most important.
3.3. Results
In this section the results are presented. The collaboration with academics took place in two phases.In the first place, the issues that should be included in power planning decision-making were collectedwith semi-structured interviews constructed over questions raised in the literature. The results of this
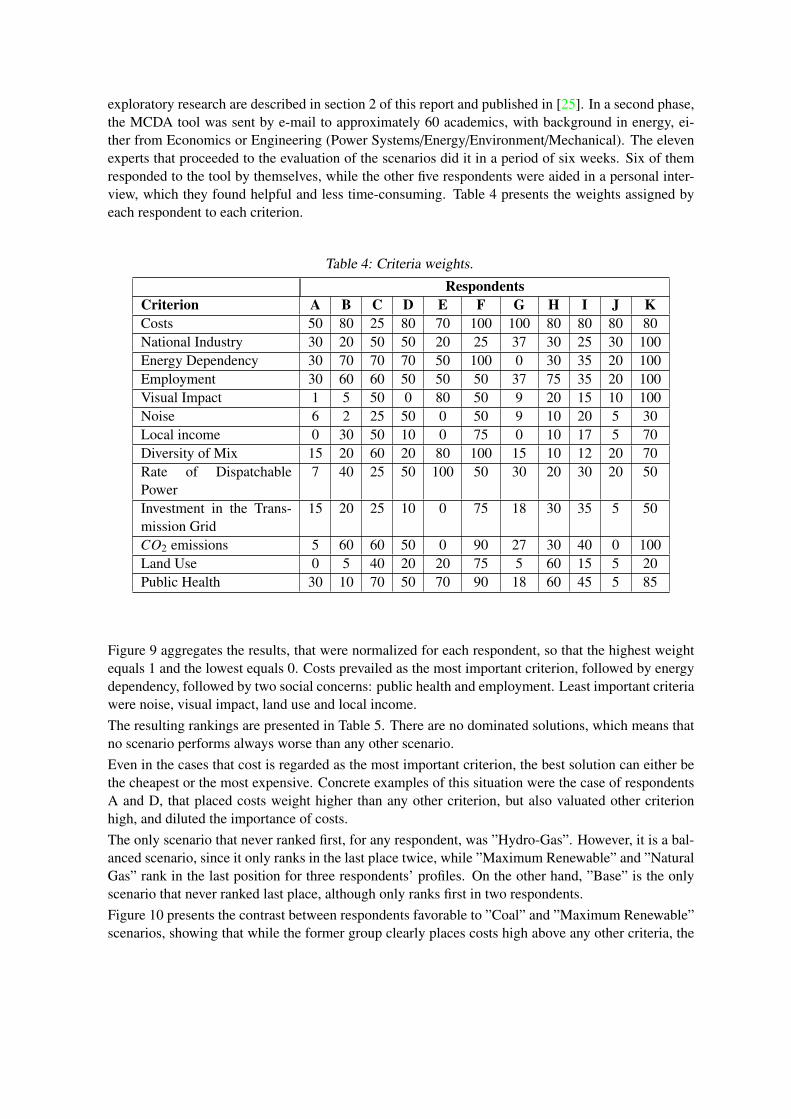
exploratory research are described in section 2 of this report and published in [25]. In a second phase,the MCDA tool was sent by e-mail to approximately 60 academics, with background in energy, ei-ther from Economics or Engineering (Power Systems/Energy/Environment/Mechanical). The elevenexperts that proceeded to the evaluation of the scenarios did it in a period of six weeks. Six of themresponded to the tool by themselves, while the other five respondents were aided in a personal inter-view, which they found helpful and less time-consuming. Table 4 presents the weights assigned byeach respondent to each criterion.
Table 4: Criteria weights.
RespondentsCriterion A B C D E F G H I J KCosts 50 80 25 80 70 100 100 80 80 80 80National Industry 30 20 50 50 20 25 37 30 25 30 100Energy Dependency 30 70 70 70 50 100 0 30 35 20 100Employment 30 60 60 50 50 50 37 75 35 20 100Visual Impact 1 5 50 0 80 50 9 20 15 10 100Noise 6 2 25 50 0 50 9 10 20 5 30Local income 0 30 50 10 0 75 0 10 17 5 70Diversity of Mix 15 20 60 20 80 100 15 10 12 20 70Rate of DispatchablePower
7 40 25 50 100 50 30 20 30 20 50
Investment in the Trans-mission Grid
15 20 25 10 0 75 18 30 35 5 50
CO2 emissions 5 60 60 50 0 90 27 30 40 0 100Land Use 0 5 40 20 20 75 5 60 15 5 20Public Health 30 10 70 50 70 90 18 60 45 5 85
Figure 9 aggregates the results, that were normalized for each respondent, so that the highest weightequals 1 and the lowest equals 0. Costs prevailed as the most important criterion, followed by energydependency, followed by two social concerns: public health and employment. Least important criteriawere noise, visual impact, land use and local income.The resulting rankings are presented in Table 5. There are no dominated solutions, which means thatno scenario performs always worse than any other scenario.Even in the cases that cost is regarded as the most important criterion, the best solution can either bethe cheapest or the most expensive. Concrete examples of this situation were the case of respondentsA and D, that placed costs weight higher than any other criterion, but also valuated other criterionhigh, and diluted the importance of costs.The only scenario that never ranked first, for any respondent, was ”Hydro-Gas”. However, it is a bal-anced scenario, since it only ranks in the last place twice, while ”Maximum Renewable” and ”NaturalGas” rank in the last position for three respondents’ profiles. On the other hand, ”Base” is the onlyscenario that never ranked last place, although only ranks first in two respondents.Figure 10 presents the contrast between respondents favorable to ”Coal” and ”Maximum Renewable”scenarios, showing that while the former group clearly places costs high above any other criteria, the

Figure 9: Aggregation of results
latter have five similarly valuated criteria: costs, public health, energy independency, national industryand employment.
Figure 10: Average profile of respondents that chose either ”Coal” or ”Maximum Renewable” aspreferred scenarios.
The resulting rankings are presented in Table 5. Coal and Maximum Renewable were the scenariosthat ranked first more times (4 times each). Our results confirm that costs are the main obstacle forthe incorporation of more renewable energy in electricity systems. Like the case of [26], our scenarioranking was also very sensitive to the input of costs weight.
What these results have shown is, in first place, that respondents felt it is important to trade-off costswith other criteria, hence the utility of multi-criteria methodologies. Only on rare occasions did arespondent assign zero to the weight of one criterion, but was free to do it in any criterion he wishedto (if he assigned zero to all criteria besides costs, obviously the Coal scenario would be the first in theranking, since it is the cheapest solution). Secondly, it is the magnitude of the trade-off that induces thedivergence in the final rankings. For example, for the second most rated criterion, energy dependency,one respondent suggested that more information should be given when valuating this criterion (”in theworst case for fuel cost projections, how much would the cost of the solution increase?”), otherwise itbecomes difficult to state how much would he be willing to see the solution costs increased. However,using more information would significantly increase the response time.

Table 5: Scenario Ranking.
RespondentsScenario A B C D E F G H I J K
Base 2 1 3 2 4 2 3 1 4 2 2Natural Gas 5 5 4 5 3 4 2 4 1 4 5
Coal 3 3 5 4 1 1 1 3 2 1 4Hydro-Gas 4 4 2 3 2 5 4 5 3 3 3
Maximum Renewable 1 2 1 1 5 3 5 2 5 5 1
4. ConclusionsIn section 2, a wide array of impacts was constructed from literature review and interviews with ex-perts in power systems, and assumed the form of comprehensive impact chains or logic diagrams.These can aid decision-making in sustainability issues and evaluation applied to power systems. Acontradiction still exists: between needed short term economic competitiveness and long term sustain-ability. This means that trade-offs must be considered for the definition of electricity strategies for thefuture. Although this is an assumption accepted in general, political factors tend to influence signifi-cantly the decisions, even surpassing the power systems expertise. This work was applied specificallyto the Portuguese situation, but with minor changes may also be representative of other countries.
Given that the traditional sources are not limitless, RES will eventually have to play an important rolein the future, when fossil fuels become more expensive. This will turn RES automatically attractiveunder an economic perspective. Before that time comes, RES are still expensive, but can foster knowl-edge, new industries and eventually economic growth, especially for countries like Portugal, whichrelies mainly on foreign resources.
Since the expert interviews show some scepticism about the RES job creation potential and evenabout the RES ability to improve locals quality of living, it turns essential to proceed to the secondphase of the research, to talk with local stakeholders, in order to recognize their perceived negativeand positive impacts. As for thermal power plants, the importance of local impacts does not seemto be as significant. The general view of experts clearly favours that national level impacts are themost important ones, turning the local impact assessment studies a less important requirement forthe verification of the logic models. In fact, most of the impacts related to CO2 emissions, cost orvolatility of fossil fuel prices may be evaluated resourcing to mathematical models such as Pereira etal [16].
In section 3, a tool to evaluate scenarios for electricity production was proposed. The tool uses multi-criteria decision analysis, and comprises a set of thirteen criteria, ranging from economic concerns,to environmental and social as well as technical issues. The methodology combines an additive valuefunction that aggregates results from direct weighting and trade-off analysis. The proposed tool wasused on the particular case of Portugal, based on a set of scenarios for the electric system in 2020.A group of experts from academia, Engineers, Economists related to the energy sector, participatedin the evaluation of these scenarios. From the results obtained, most respondents would be willingto increase the costs of power generation if other issues than the economical ones were to be takeninto account. This fact alone proves the utility of MCDA. The evaluated scenarios were ranked dif-ferently by respondents with different perspectives, what is not unexpected when using multi-criteriamethodologies: like [27] pointed out, MCDA is useful in mapping different views without forcinginitial consensus and may facilitate future negotiation. Only one of the scenarios, ”Hydro-Gas”, wasnot chosen to be the preferred by any of the eleven respondents.

Aggregating the results, cost was considered the most important criterion, even for most respondentswhose preferred scenario was ”Maximum Renewable”. Other also important criteria were the rate ofdependency on fuel sources, the employment and the public health issues. Depending on the weightassigned to these criteria, the cost loses relative importance and most expensive solutions may rankfirst.
In future work more results will be collected. The public acceptance of different technologies willalso be evaluated.
5. AcknowledgementsThis work was financed by: the QREN Operational Programme for Competitiveness Factors, theEuropean Union - European Regional Development Fund and National Funds - Portuguese Founda-tion for Science and Technology, under Project FCOMP-01-0124-FEDER-011377 and Project Pest-OE/EME/UI0252/2011. Authors wish to thank all the academics that collaborated in the interviews.
References[1] European Comission. 2011 monitoring report of the eu sustainable development strategy, 2011.
European Comission.
[2] Paula Ferreira; Madalena Araujo and MEJ OKelly. The integration of social concerns intoelectricity power planning: A combined Delphi and AHP approach, pages 323–364. Handbookof Power Systems. 1st edition, 2010.
[3] Fernando Ribeiro, Paula Ferreira, and Madalena Araujo. The inclusion of social aspects in powerplanning. Renewable and Sustainable Energy Reviews, 15(9):4361 – 4369, 2011.
[4] INAG. Plano nacional de barragens com elevado potencial hidroelectrico.http://pnbeph.inag.pt/np4/np4/?newsId=4&fileName=pnbeph memoria.pdf, 2007. Instituto daAgua, in Portuguese.
[5] European Commission. Impact assessment, 2011. European Commission.
[6] F. Leeuw and J. Vaessen. Impact evaluations and development: Nonie guidance on impactevaluation, 2009.
[7] ECORSYS Nederland BV. Assessing the employment and social impacts of selected strategiccommission policies. final report. dg employment, social affairs and equal opportunities of theeuropean commission, 2009. ECORSYS Nederland BV.
[8] R. Renger and A. Titcomb. A three-step approach to teach logic models. American Journal ofEvaluation, 23(4), 2002.
[9] Y. Sung et al. M. Kim. A performance and monitoring evaluation system & its applicationsfor national r&d programs: A case of industrial application technology in korea. In PICMETProceedings, Cape Town, July 27-31, pages 386–394, 2008.
[10] H. Doan et al C. Oros. Portfolio review expert panel process: a tool for accountability andstrategic planning to meet research goals. Research Evaluation, 16(3):157–167, 2007.
[11] C. Hollis et al. D. Helitzer. Evaluation for community-based programs: The integration of logicmodels and factor analysis. Evaluation and Program Planning, 33:223–233, 2010.

[12] S. Buktus L. Medeiros. A logic model framework for community nutrition education. Journalof Nutrition Education and Behavior, 37(4):197–202, 2005.
[13] G. Jordan J. McLaughin. Logic models: a tool for telling your program’s performance story.Evaluation and Program Planning, 22:65–72, 1999.
[14] APREN & Deloitte. Impacto macroeconomico do sector das energias renovaveis, 2009.
[15] Republica Portuguesa. Plano nacional de acCAo para as energias renovAveis ao abrigo dadirectiva 2009/28/ce, 2009. Republica Portuguesa.
[16] Sergio Pereira, Paula Ferreira, and A. Ismael Vaz. Strategic electricity planning decisions. InProceedings of the Dubrovnik Conference on Sustainable Development of Energy, Water andEnvironment Systems, Dubrovnik, Croatia, 25-29 September 2011., page 590, 2011.
[17] Benjamin Hobbs and Peter Meier. Energy decisions and the environment: a guide to the useof multicriteria methods. International series in operations research & management science.Kluwer Academic Publishers, 2000.
[18] Jiang-Jiang Wang, You-Yin Jing, Chun-Fa Zhang, and Jun-Hong Zhao. Review on multi-criteriadecision analysis aid in sustainable energy decision-making. Renewable and Sustainable EnergyReviews, 13(9):2263 – 2278, 2009.
[19] Justin D.K. Bishop, Gehan A.J. Amaratunga, and Cuauhtemoc Rodriguez. Using strong sustain-ability to optimize electricity generation fuel mixes. Energy Policy, 36(3):971 – 980, 2008.
[20] Paul Joskow. Apples and oranges: Dont compare levelized cost of renewables. The ElectricityJournal, 23(10):3 – 5, 2010.
[21] Andrew Mills, Ryan Wiser, and Kevin Porter. The cost of transmission for wind energy in theunited states: A review of transmission planning studies. Renewable and Sustainable EnergyReviews, 16(1):1 – 19, 2012.
[22] Athanasios I. Chatzimouratidis and Petros A. Pilavachi. Multicriteria evaluation of power plantsimpact on the living standard using the analytic hierarchy process. Energy Policy, 36(3):1074 –1089, 2008.
[23] European Commission. External costs: Research results on socio-environmental damages dueto electricity and transport, 2003. European Comission.
[24] Boris Krey. Scope of electricity efficiency improvement in switzerland until 2035, 2008.
[25] Fernando Ribeiro, Paula Ferreira, and Madalena Araujo. A methodology to address social con-cerns in electricity planning. In Proceedings of the Dubrovnik Conference on Sustainable De-velopment of Energy, Water and Environment Systems, Dubrovnik, Croatia, 25-29 September2011., page 321, 2011.
[26] G. Heinrich, L. Basson, B. Cohen, M. Howells, and J. Petrie. Ranking and selection of powerexpansion alternatives for multiple objectives under uncertainty. Energy, 32(12):2350 – 2369,2007.
[27] Lauro J. Martinez, James H. Lambert, and Christopher W. Karvetski. Scenario-informed mul-tiple criteria analysis for prioritizing investments in electricity capacity expansion. ReliabilityEngineering & System Safety, 96(8):883 – 891, 2011.


![TAT-902S [1 650] TAT- 1 600 102S F] TAT-312V TAT-322V ...TAT-902S [1 650] TAT- 1 600 102S F] TAT-312V TAT-322V TAT-332S 1/2 1/2 1/2 1/2 1/2 1/2 I OOOX420 IOOOX500 1200X500 TAT-1 52S](https://img.pdfslide.us/doc/110x75/6125a0cefb88a6479b4afa46/tat-902s-1-650-tat-1-600-102s-f-tat-312v-tat-322v-tat-902s-1-650-tat-.jpg)