Embed Size (px)
Citation preview
1
Report of an Independent External Review – June 2019
Impact assessment of WHO Prequalification and Systems Supporting Activities
June 2019
Report of an Independent External Review
2
Report of an Independent External Review – June 2019
DISCLAIMER:
▪ The contents of this document reflect a consolidation of views gathered through numerous interviews, but not the views of the World Health Organization.
▪ Confidential elements provided by interviewees for the purposes of the study and personal data have been redacted.
▪ Elements in the study may not have been verified or confirmed by the World Health Organization and no responsibly is accepted for any reliance made on the basis of this document. Similarly, recommendations made in this study do not necessarily reflect the views or intentions of the World Health Organization.
▪ The content of this document may be reproduced and quoted provided the source is acknowledged.
3
Report of an Independent External Review – June 2019
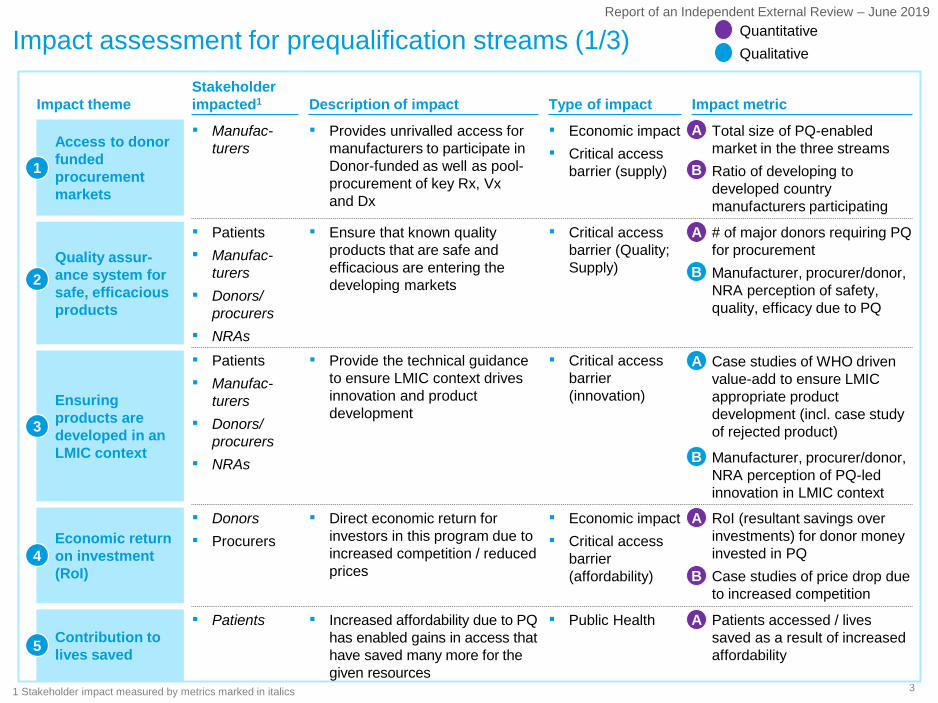
Impact assessment for prequalification streams (1/3)
Impact theme Impact metricStakeholder impacted1 Description of impact Type of impact
Access to donor funded procurement markets
▪ Total size of PQ-enabled market in the three streams
▪ Ratio of developing to developed country manufacturers participating
A
B
▪ Manufac-turers
▪ Provides unrivalled access for manufacturers to participate in Donor-funded as well as pool-procurement of key Rx, Vx and Dx
▪ Economic impact▪ Critical access
barrier (supply)1
Quality assur-ance system for safe, efficacious products
▪ # of major donors requiring PQ for procurement
▪ Manufacturer, procurer/donor, NRA perception of safety, quality, efficacy due to PQ
A
B
▪ Patients▪ Manufac-
turers▪ Donors/
procurers▪ NRAs
▪ Ensure that known quality products that are safe and efficacious are entering the developing markets
▪ Critical access barrier (Quality; Supply)
2
Economic return on investment (RoI)
▪ RoI (resultant savings over investments) for donor money invested in PQ
▪ Case studies of price drop due to increased competition
A
B
▪ Donors▪ Procurers
▪ Direct economic return for investors in this program due to increased competition / reduced prices
▪ Economic impact▪ Critical access
barrier (affordability)
4
Contribution to lives saved
▪ Patients accessed / lives saved as a result of increased affordability
A▪ Patients ▪ Increased affordability due to PQ has enabled gains in access that have saved many more for the given resources
▪ Public Health
5
Ensuring products are developed in an LMIC context
▪ Patients▪ Manufac-
turers▪ Donors/
procurers▪ NRAs
▪ Provide the technical guidance to ensure LMIC context drives innovation and product development
▪ Critical access barrier (innovation)
▪ Case studies of WHO driven value-add to ensure LMIC appropriate product development (incl. case study of rejected product)
A
▪ Manufacturer, procurer/donor, NRA perception of PQ-led innovation in LMIC context
B
3
1 Stakeholder impact measured by metrics marked in italics
▪ Quantitative▪ Qualitative

4
Report of an Independent External Review – June 2019
Impact theme Impact metricStakeholder impacted1 Description of impact Type of impact
Impact assessment for prequalification streams (2/3)
Faster access to prequalified products
6
▪ Setup mechanisms that speed up decisions from NRAs thereby providing patients faster access to products
▪ Critical access barrier (Availability)
▪ Patients▪ Manufac-
turers▪ NRAs▪ Donors/
procurers
▪ % of products that have obtained NRA approval through collaborative procedure in <90 days
▪ Manufacturer, procurer/donor, NRA perception of value add on streamlining downstream approvals
A
B
Raising overall standards of manufacturing
7
▪ Manufac-turers
▪ NRAs▪ Donors/
procurers
▪ Through PQ reviews and by participating in systems upgrade to meet PQ requirements, manufacturers adopt standards that improve quality for other domestic products as well
▪ Critical access barrier (Quality)
▪ # of developing country manufacturers that have PQ but no SRA products
▪ Manufacturer, procurer/donor, NRA perception on improvements of overall standards of manufacturing
A
B
1 Stakeholder impact measured by metrics marked in italics
▪ Quantitative▪ Qualitative
5
Report of an Independent External Review – June 2019
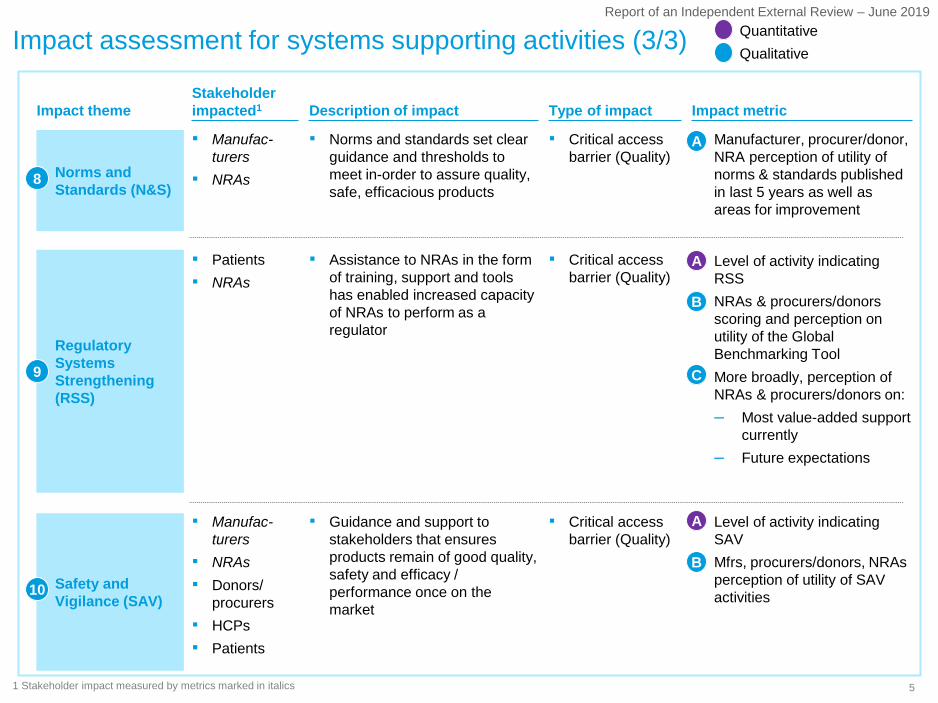
Impact assessment for systems supporting activities (3/3)
Impact theme Impact metricStakeholder impacted1 Description of impact Type of impact
Safety and Vigilance (SAV)
▪ Guidance and support to stakeholders that ensures products remain of good quality, safety and efficacy / performance once on the market
▪ Critical access barrier (Quality)
▪ Manufac-turers
▪ NRAs▪ Donors/
procurers▪ HCPs▪ Patients
▪ Level of activity indicating SAV
▪ Mfrs, procurers/donors, NRAs perception of utility of SAV activities
A
B
Regulatory Systems Strengthening (RSS)
▪ Patients▪ NRAs
▪ Assistance to NRAs in the form of training, support and tools has enabled increased capacity of NRAs to perform as a regulator
▪ Critical access barrier (Quality)
▪ Level of activity indicating RSS
▪ NRAs & procurers/donors scoring and perception on utility of the Global Benchmarking Tool
▪ More broadly, perception of NRAs & procurers/donors on:– Most value-added support
currently– Future expectations
A
B
C
Norms and Standards (N&S)
▪ Manufac-turers
▪ NRAs
▪ Norms and standards set clear guidance and thresholds to meet in-order to assure quality, safe, efficacious products
▪ Critical access barrier (Quality)
▪ Manufacturer, procurer/donor, NRA perception of utility of norms & standards published in last 5 years as well as areas for improvement
A
9
▪ Quantitative▪ Qualitative
1 Stakeholder impact measured by metrics marked in italics
8
10

6
Report of an Independent External Review – June 2019
PQ enables a core market of ~$3.5 billion with the majority coming from vaccines
SOURCE: Market sizing based on: GPRM, Global Fund Price & Quality Reporting database; RH Interchange database; Unitaid market landscape reports; Unitaid vaccine supply, demand, and pricing data; WHO World Malaria Report
Sales of PQ products (PQ-enabled sales)1, US$ M, 2016 (est.)
~$2,143M3
~$341M4
~$1,031M2
1 Includes PQ or SRA+PQ products 2 Estimation based on average 2014-2016 increase in procurement by largest 1-2 donors in HIV, Malaria, TB, RH 3 Based on 2014 vs 2016 vaccine procurement value of UNICEF and assuming fixed PAHO supply of $500 million 4 Based on 2016 donor market size for HIV, Malaria size estimated
based on HIV vs Malaria sales ratio in 2014 5 Refers only to Low and Lower Middle Income Markets
National markets5
(based on LMIC market estimation for each disease area and manufacturer perspective on access enabled by PQ)
Private market5
Minimal benefit of PQ approval on private -markets (except Rx-Malaria)
Large donors and procurers (based on detailed PQ market sizing by each disease area and procurer)Sales: ~$ 3,515M
Vaccines
Medicine Diagnostics
1A
7
Report of an Independent External Review – June 2019
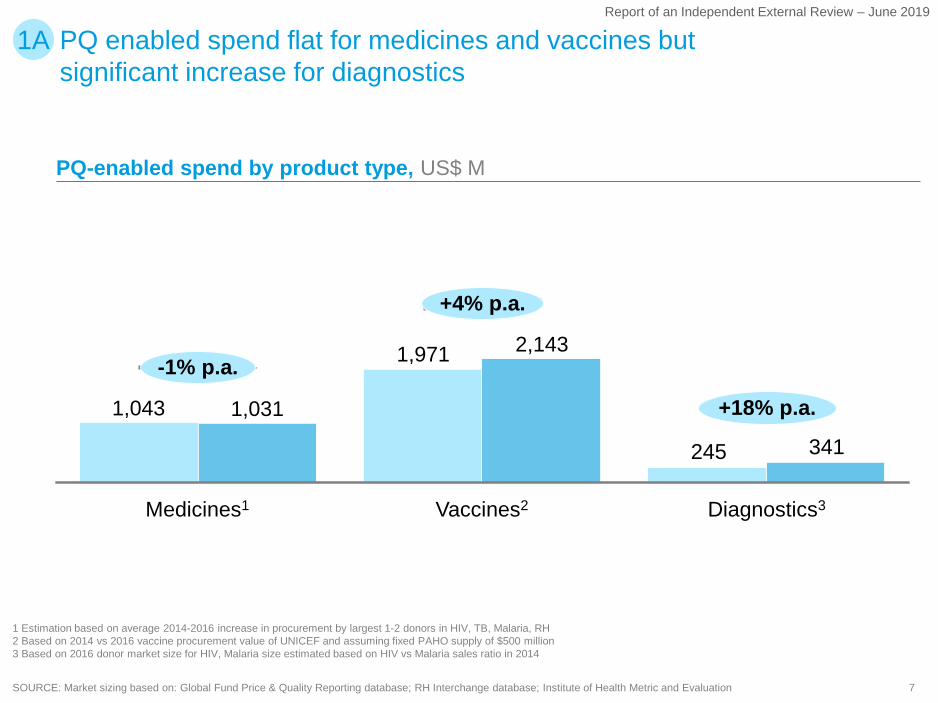
PQ enabled spend flat for medicines and vaccines but significant increase for diagnostics
SOURCE: Market sizing based on: Global Fund Price & Quality Reporting database; RH Interchange database; Institute of Health Metric and Evaluation
1 Estimation based on average 2014-2016 increase in procurement by largest 1-2 donors in HIV, TB, Malaria, RH 2 Based on 2014 vs 2016 vaccine procurement value of UNICEF and assuming fixed PAHO supply of $500 million 3 Based on 2016 donor market size for HIV, Malaria size estimated based on HIV vs Malaria sales ratio in 2014
PQ-enabled spend by product type, US$ M
245 341
+18% p.a.
+4% p.a.
-1% p.a.
1,043 1,031
Diagnostics3Vaccines2
2,143
Medicines1
1,971
1A
8
Report of an Independent External Review – June 2019
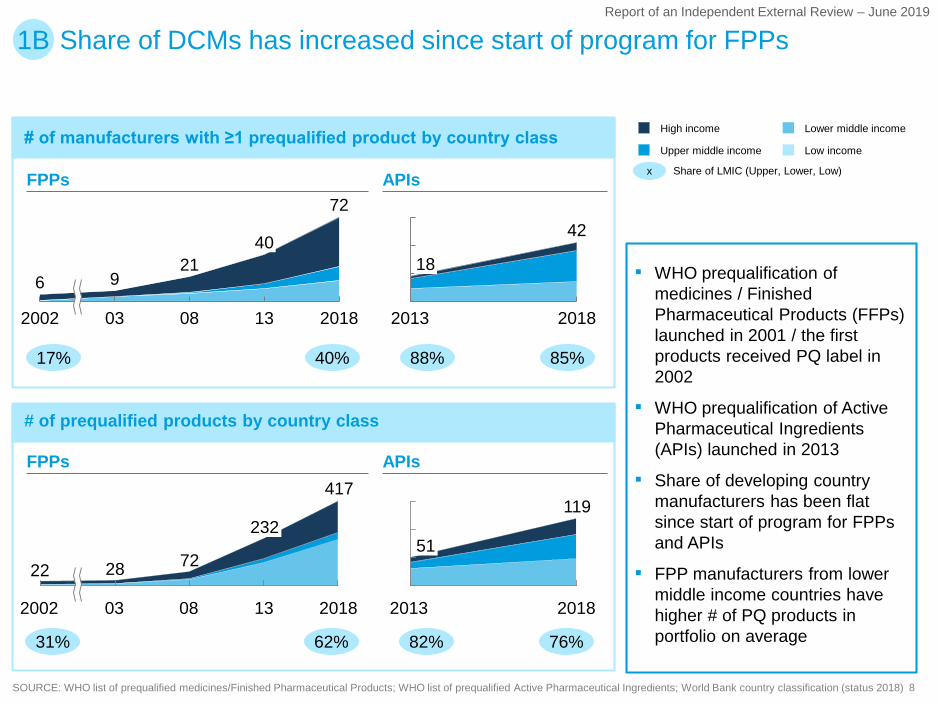
# of manufacturers with ≥1 prequalified product by country class
# of prequalified products by country class
Share of DCMs has increased since start of program for FPPs1B
▪ WHO prequalification of medicines / Finished Pharmaceutical Products (FFPs) launched in 2001 / the first products received PQ label in 2002
▪ WHO prequalification of Active Pharmaceutical Ingredients (APIs) launched in 2013
▪ Share of developing country manufacturers has been flat since start of program for FPPs and APIs
▪ FPP manufacturers from lower middle income countries have higher # of PQ products in portfolio on average
SOURCE: WHO list of prequalified medicines/Finished Pharmaceutical Products; WHO list of prequalified Active Pharmaceutical Ingredients; World Bank country classification (status 2018)
FPPs APIs
2002 1303 08 2018
6 921
40
7242
2013 2018
18
FPPs APIs
2002 2018
232
0803 13
417
22 28 72
119
2013 2018
51
17% 40% 88% 85%
x
High income
Upper middle income
Lower middle income
Low income
Share of LMIC (Upper, Lower, Low)
31% 62% 82% 76%
9
Report of an Independent External Review – June 2019
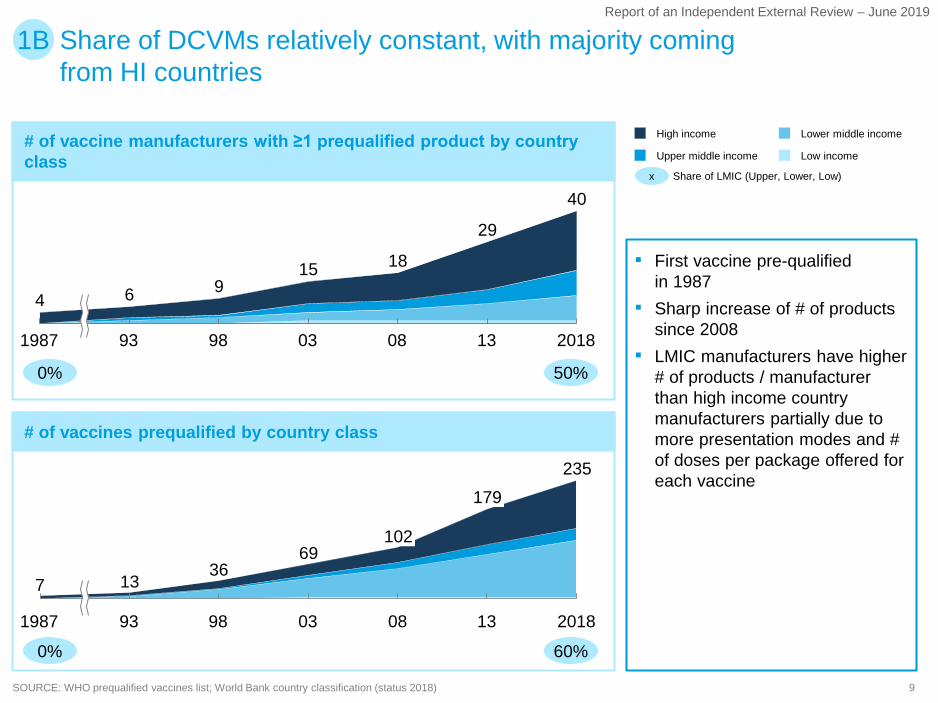
Share of DCVMs relatively constant, with majority coming from HI countries
# of vaccine manufacturers with ≥1 prequalified product by country class
# of vaccines prequalified by country class
1B
▪ First vaccine pre-qualifiedin 1987
▪ Sharp increase of # of products since 2008
▪ LMIC manufacturers have higher # of products / manufacturer than high income country manufacturers partially due to more presentation modes and # of doses per package offered for each vaccine
SOURCE: WHO prequalified vaccines list; World Bank country classification (status 2018)
1987 039893 08 201813
4 6
40
915 18
29
69
131987 93 080398
235
2018
367 13
102
179
x Share of LMIC (Upper, Lower, Low)
Lower middle incomeHigh income
Upper middle income Low income
0% 50%
0% 60%
10
Report of an Independent External Review – June 2019
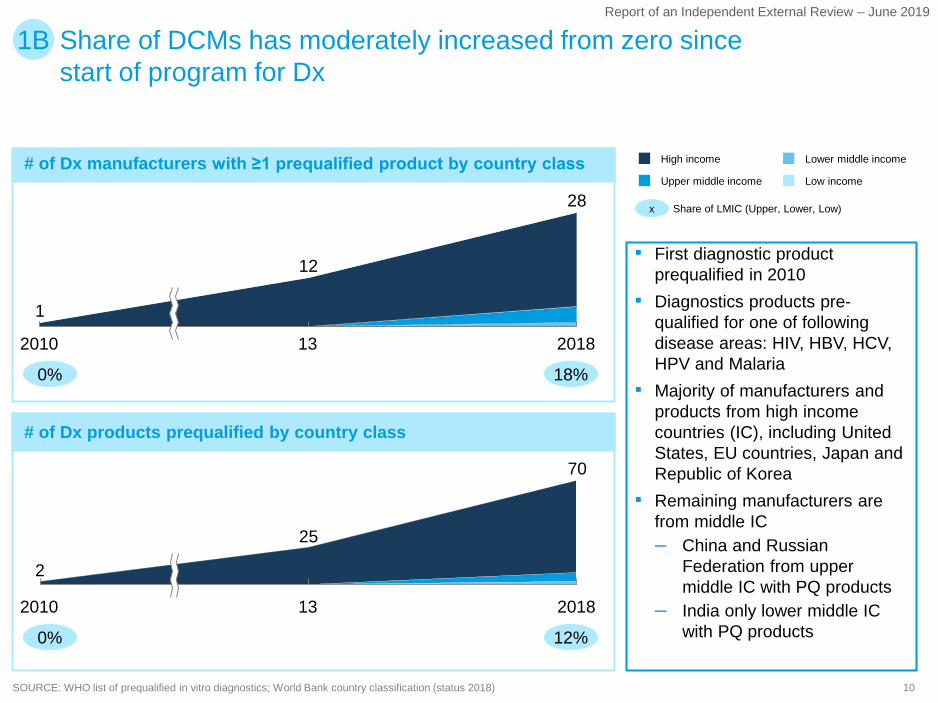
Share of DCMs has moderately increased from zero since start of program for Dx
1B
SOURCE: WHO list of prequalified in vitro diagnostics; World Bank country classification (status 2018)
# of Dx manufacturers with ≥1 prequalified product by country class
# of Dx products prequalified by country class
▪ First diagnostic product prequalified in 2010
▪ Diagnostics products pre-qualified for one of following disease areas: HIV, HBV, HCV, HPV and Malaria
▪ Majority of manufacturers and products from high income countries (IC), including United States, EU countries, Japan and Republic of Korea
▪ Remaining manufacturers are from middle IC– China and Russian
Federation from upper middle IC with PQ products
– India only lower middle IC with PQ products
132010
1
2018
12
28
13
2
2010 2018
25
70
x Share of LMIC (Upper, Lower, Low)
High income
Upper middle income Low income
Lower middle income
0% 18%
0% 12%

11
Report of an Independent External Review – June 2019
Most donors and procurers view PQ approval as equivalent to SRA approval for medicines
MEDICINES
2A
Organization
Donor/ procurer perspective on PQ
MALARIATB RHHIV/AIDSContingency approval process
-
UNFPA ERP
ERP
ERP
ERP
ERP
-
UNFPA ERP2 (for RH only)
tFDA1
(NDA/ANDA)
-
PQ or SRA approval
PQ or SRA approval
PQ or SRA approval
-
-
tFDA (NDA/ANDA)
-
-
PQ or SRA approval
PQ or SRA approval
PQ or SRA approval
PQ or SRA approval
-
-
-
-
PQ or SRA approval
PQ or SRA approval
PQ or SRA approval
-
PQ or SRA approval
PQ or SRA approval
-
PQ or SRA approval
PQ or SRA approval
PQ or SRA approval
-
-
-
PQ or SRA approval
1 Tentative FDA2 Expert Review Panel
SOURCE: Donor/procurer publications; web search; expert interviews
12
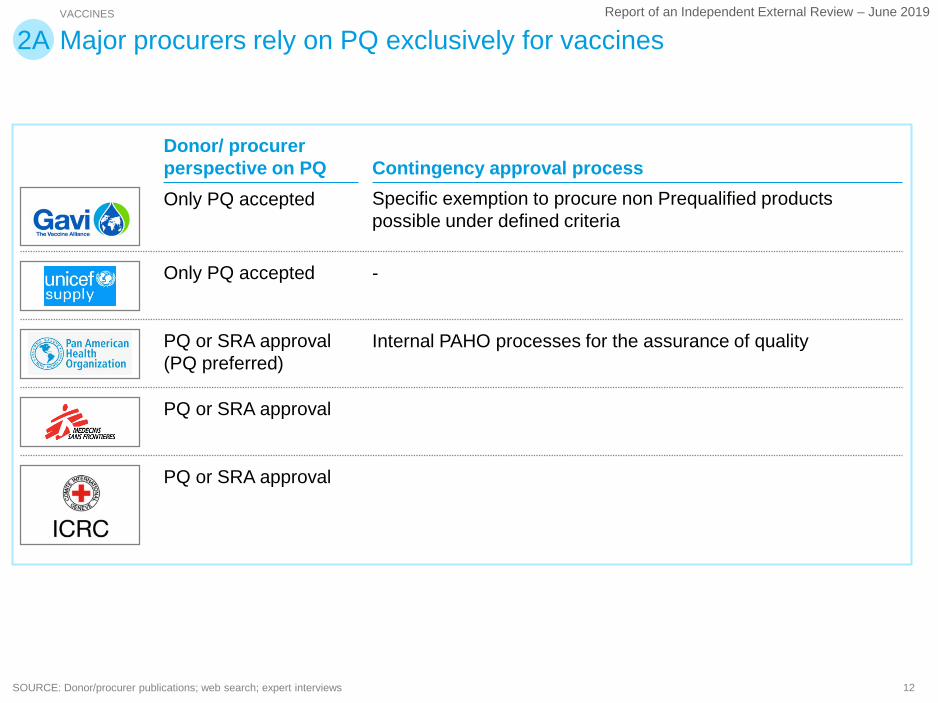
Report of an Independent External Review – June 2019VACCINES
2A
Donor/ procurer perspective on PQ Contingency approval process
Specific exemption to procure non Prequalified products possible under defined criteria
-
Internal PAHO processes for the assurance of quality
Only PQ accepted
Only PQ accepted
PQ or SRA approval (PQ preferred)
PQ or SRA approval
PQ or SRA approval
Major procurers rely on PQ exclusively for vaccines
SOURCE: Donor/procurer publications; web search; expert interviews

13
Report of an Independent External Review – June 2019
Similarly to Rx, most implementing partners view PQ approval as equivalent to SRA approval for diagnostics
DIAGNOSTICS
2A
Organization
Donor/ procurer perspective on PQ
HIV/AIDS
PQ or SRA approvalOnly PQ accepted
-
PQ or SRA approvalPQ or SRA approvalPQ or SRA approvalPQ or SRA approval
MALARIA
PQ or SRA approval-
PQ or other USAID/ CDC approval3
PQ or SRA approvalPQ or SRA approvalOnly PQ accepted
-
RH
-
-
-
PQ or SRA approvalPQ or SRA approvalOnly PQ accepted
-
Contingency approval process
-
ERP2
PEPFAR Formal review process-
MSF's own qualification schemeERP
ERP
ERP
TB4
Only PQ accepted Only PQ accepted PQ or SRA approval
-
WHO endorsement -
-
-
WHO endorsement -
-
1
5
1 For projects with Unitaid and CHAI, SRA approval or ERP are also used 2 Expert Review Panel3 PQ is accepted, but other products based on USAID/CDC requirements can be accepted too. CDC will soon start malaria RDT performance evaluations for PQ4 Dx TB is not covered by PQ but by TB WHO guidelines (and associated standards) on tuberculosis 5 PQ is preferred, but SRA approval is also accepted
SOURCE: Donor/procurer publications; web search; expert interviews
14
Report of an Independent External Review – June 2019
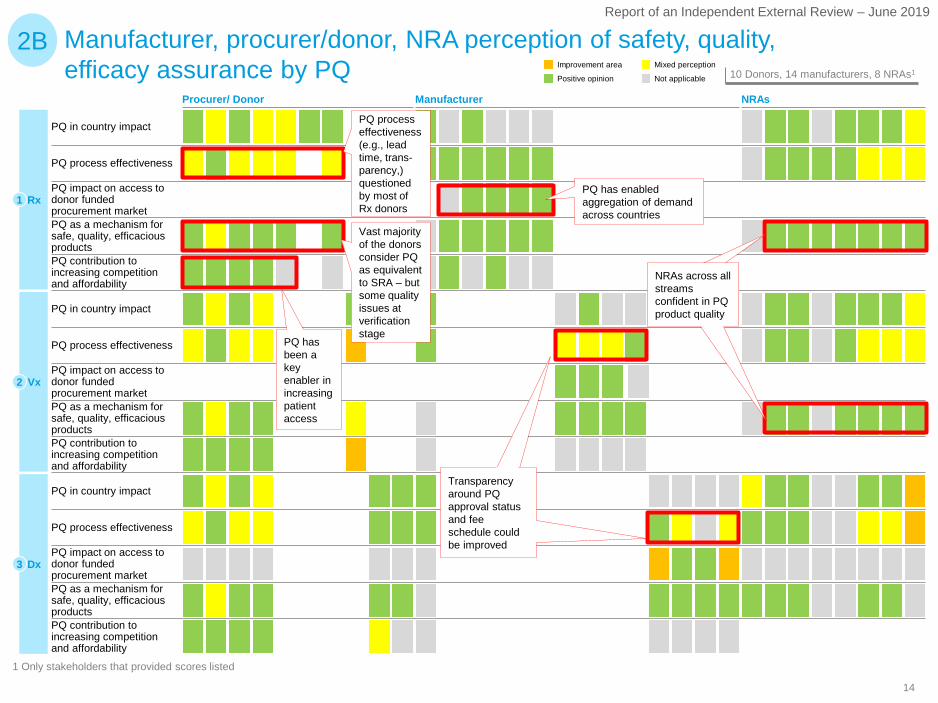
Manufacturer, procurer/donor, NRA perception of safety, quality, efficacy assurance by PQ
2BNot applicable
Mixed perception
Positive opinion
Improvement area10 Donors, 14 manufacturers, 8 NRAs1
1 Only stakeholders that provided scores listed
Dx
Vx
Rx1
2
3
PQ impact on access to donor funded procurement market
PQ contribution to increasing competition and affordability
PQ in country impact
PQ impact on access to donor funded procurement market PQ as a mechanism for safe, quality, efficacious products PQ contribution to increasing competition and affordability
PQ in country impact
PQ process effectiveness
PQ in country impact
PQ contribution to increasing competition and affordability
PQ impact on access to donor funded procurement market PQ as a mechanism for safe, quality, efficacious products
PQ process effectiveness
PQ process effectiveness
PQ as a mechanism for safe, quality, efficacious products
ManufacturerProcurer/ Donor NRAs
PQ has enabled aggregation of demand across countries
Vast majority of the donors consider PQ as equivalent to SRA – but some quality issues at verification stage
PQ has been a key enabler in increasing patient access
Transparency around PQ approval status and fee schedule could be improved
NRAs across all streams confident in PQ product quality
PQ process effectiveness (e.g., lead time, trans-parency,) questioned by most of Rx donors

15
Report of an Independent External Review – June 2019
Manufacturer, procurer/donor, NRA perception of PQ-enabled innovation in LMIC context
1 Only stakeholders that provided scores listed.
3B
PQ impact on innovation and product development
PQ impact on innovation and product development
PQ impact on innovation and product development Rx1
Vx2
Dx3 Low awareness on existence and benefits of technical assistance, desire for strengthened support by DCMs
Lack of communication around WHO’s role in innovation
Not applicable
Mixed perception
Positive opinion
Improvement area10 Donors, 14 manufacturers, 8 NRAs1
Procurer/ Donor Manufacturer NRAs
16
Report of an Independent External Review – June 2019
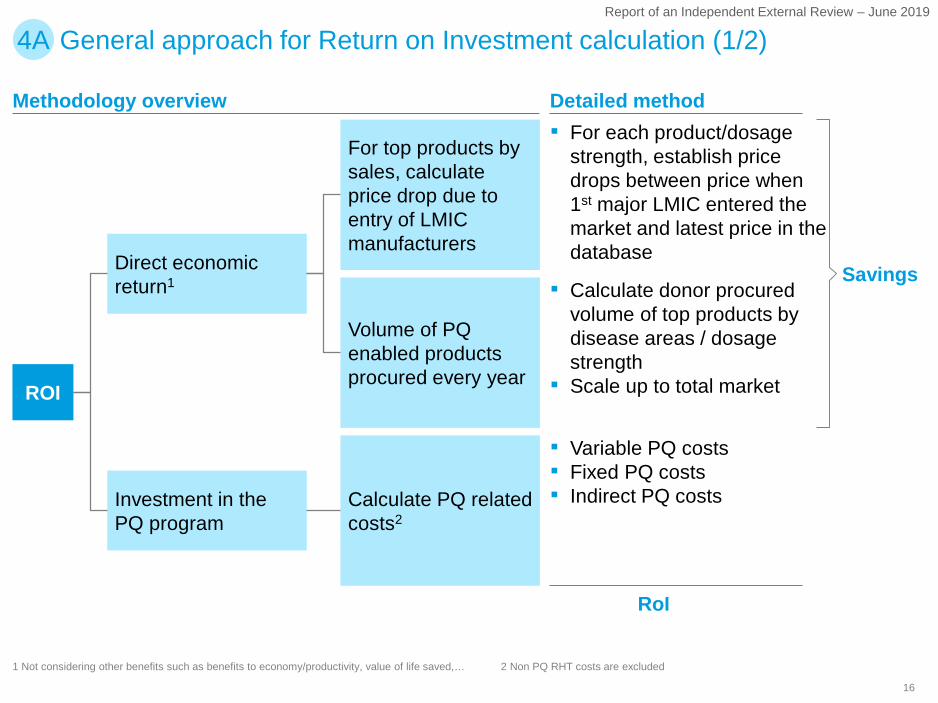
1 Not considering other benefits such as benefits to economy/productivity, value of life saved,… 2 Non PQ RHT costs are excluded
Methodology overview Detailed method▪ For each product/dosage
strength, establish price drops between price when 1st major LMIC entered the market and latest price in the database
▪ Calculate donor procured volume of top products by disease areas / dosage strength
▪ Scale up to total market
▪ Variable PQ costs▪ Fixed PQ costs▪ Indirect PQ costsCalculate PQ related
costs2
Direct economic return1
Investment in the PQ program
Volume of PQ enabled products procured every year
For top products by sales, calculate price drop due to entry of LMIC manufacturers
ROI
Savings
RoI
General approach for Return on Investment calculation (1/2)4A
17
Report of an Independent External Review – June 2019
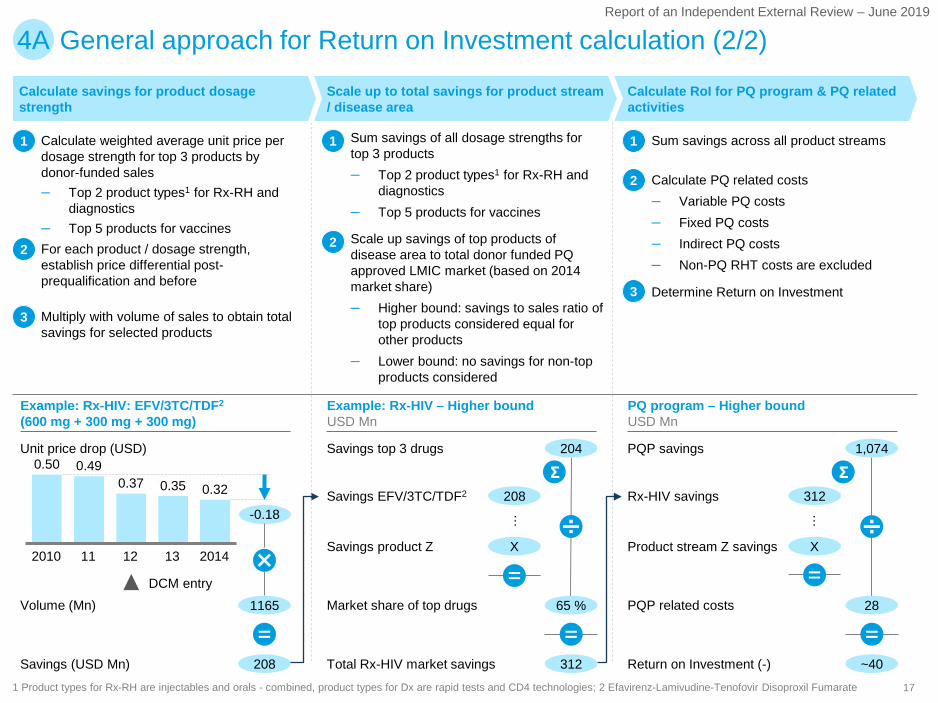
General approach for Return on Investment calculation (2/2)4A
0.50 0.490.37 0.35 0.32
132010 11 12 2014
-0.18
Scale up to total savings for product stream / disease area
Calculate savings for product dosage strength
Calculate RoI for PQ program & PQ related activities
65 % 28
1,074
~40
Savings EFV/3TC/TDF2 Rx-HIV savings
Savings product Z Product stream Z savings
204Savings top 3 drugs PQP savings
Market share of top drugs PQP related costs
312Total Rx-HIV market savings Return on Investment (-)
▪ Calculate weighted average unit price per dosage strength for top 3 products by donor-funded sales– Top 2 product types1 for Rx-RH and
diagnostics– Top 5 products for vaccines
▪ Sum savings of all dosage strengths for top 3 products– Top 2 product types1 for Rx-RH and
diagnostics– Top 5 products for vaccines
11
▪ For each product / dosage strength, establish price differential post-prequalification and before
▪ Scale up savings of top products of disease area to total donor funded PQ approved LMIC market (based on 2014 market share)– Higher bound: savings to sales ratio of
top products considered equal for other products
– Lower bound: no savings for non-top products considered
2
▪ Calculate PQ related costs– Variable PQ costs– Fixed PQ costs– Indirect PQ costs– Non-PQ RHT costs are excluded
2
2
▪ Multiply with volume of sales to obtain total savings for selected products
▪ Determine Return on Investment3
3
208
X
…
312
X
…
Σ Σ
Example: Rx-HIV: EFV/3TC/TDF2
(600 mg + 300 mg + 300 mg) Example: Rx-HIV – Higher boundUSD Mn
PQ program – Higher boundUSD Mn
1 Product types for Rx-RH are injectables and orals - combined, product types for Dx are rapid tests and CD4 technologies; 2 Efavirenz-Lamivudine-Tenofovir Disoproxil Fumarate
▪ Sum savings across all product streams1
1165Volume (Mn)
208Savings (USD Mn)
Unit price drop (USD)
DCM entry
18
Report of an Independent External Review – June 2019
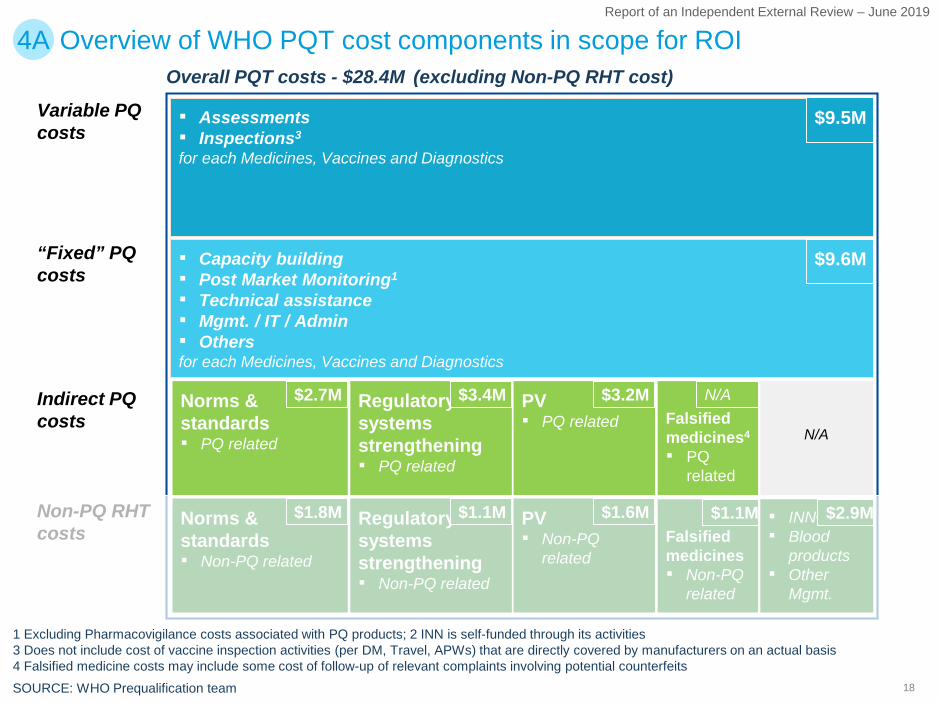
Overview of WHO PQT cost components in scope for ROI4A
▪ Assessments▪ Inspections3
for each Medicines, Vaccines and Diagnostics
Norms & standards▪ PQ related
Regulatory systems strengthening▪ PQ related
1 Excluding Pharmacovigilance costs associated with PQ products; 2 INN is self-funded through its activities3 Does not include cost of vaccine inspection activities (per DM, Travel, APWs) that are directly covered by manufacturers on an actual basis4 Falsified medicine costs may include some cost of follow-up of relevant complaints involving potential counterfeitsSOURCE: WHO Prequalification team
Indirect PQ costs
Overall PQT costs - $28.4M (excluding Non-PQ RHT cost)
PV▪ PQ related
▪ Capacity building▪ Post Market Monitoring1
▪ Technical assistance▪ Mgmt. / IT / Admin▪ Othersfor each Medicines, Vaccines and Diagnostics
Variable PQ costs
“Fixed” PQ costs
Falsified medicines▪ Non-PQ
related
▪ INN2
▪ Blood products
▪ Other Mgmt.
$9.5M
$9.6M
$2.7M $3.4M $3.2M $1.1M
$2.9MNorms & standards▪ Non-PQ related
$1.8M Regulatory systems strengthening▪ Non-PQ related
PV▪ Non-PQ
related
$1.1M $1.6MNon-PQ RHTcosts
Falsified medicines4
▪ PQ related
N/A
$1.1M
N/A
19
Report of an Independent External Review – June 2019
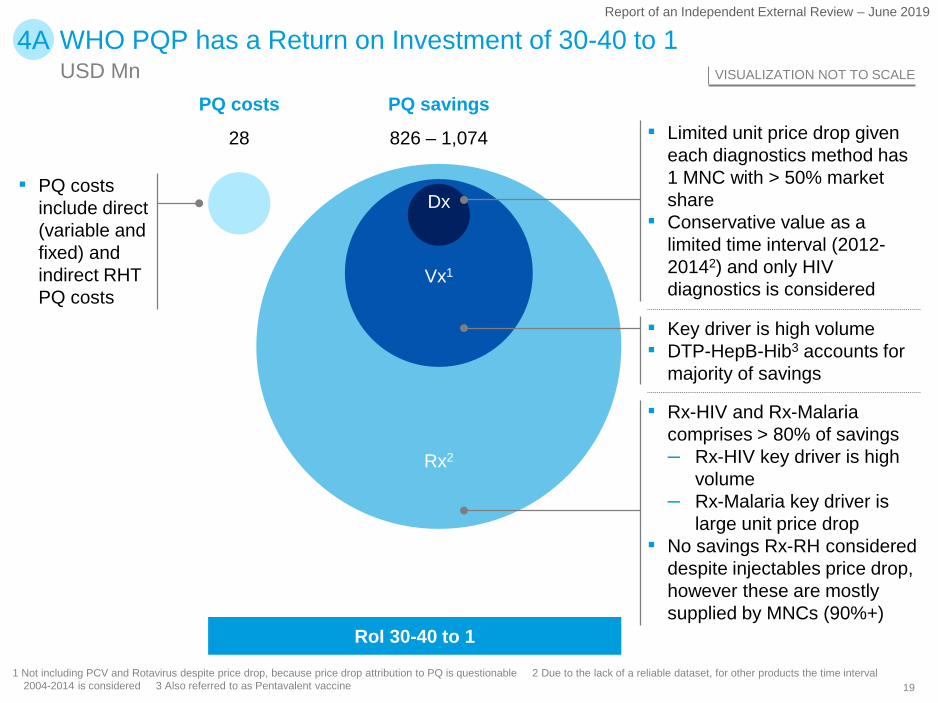
4A WHO PQP has a Return on Investment of 30-40 to 1USD Mn VISUALIZATION NOT TO SCALE
1 Not including PCV and Rotavirus despite price drop, because price drop attribution to PQ is questionable 2 Due to the lack of a reliable dataset, for other products the time interval 2004-2014 is considered 3 Also referred to as Pentavalent vaccine
▪ PQ costs include direct (variable and fixed) and indirect RHT PQ costs
PQ costs PQ savings
Dx
Vx1
Rx2
▪ Limited unit price drop given each diagnostics method has 1 MNC with > 50% market share
▪ Conservative value as a limited time interval (2012-20142) and only HIV diagnostics is considered
▪ Key driver is high volume▪ DTP-HepB-Hib3 accounts for
majority of savings
▪ Rx-HIV and Rx-Malaria comprises > 80% of savings– Rx-HIV key driver is high
volume– Rx-Malaria key driver is
large unit price drop▪ No savings Rx-RH considered
despite injectables price drop, however these are mostly supplied by MNCs (90%+)
RoI 30-40 to 1
826 – 1,07428
20
Report of an Independent External Review – June 2019
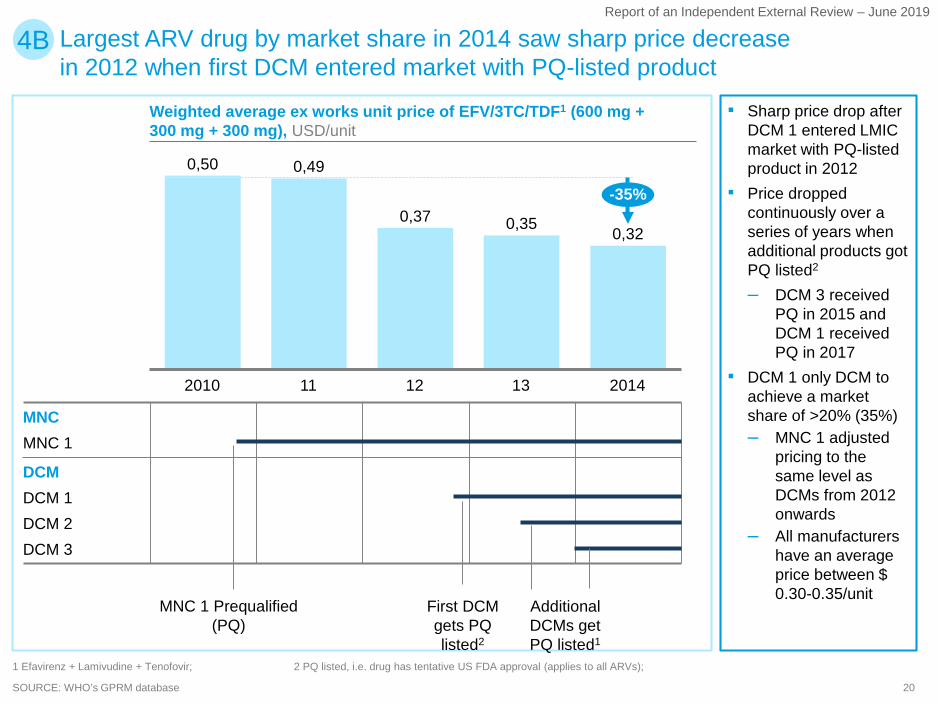
SOURCE: WHO’s GPRM database
0,37
11 132010 12 2014
0,50 0,49
0,35 0,32
-35%
MNC 1 MNC
DCMDCM 1DCM 2DCM 3
Weighted average ex works unit price of EFV/3TC/TDF1 (600 mg + 300 mg + 300 mg), USD/unit
MNC 1 Prequalified (PQ)
First DCM gets PQ listed2
Additional DCMs get PQ listed1
1 Efavirenz + Lamivudine + Tenofovir; 2 PQ listed, i.e. drug has tentative US FDA approval (applies to all ARVs);
Largest ARV drug by market share in 2014 saw sharp price decrease in 2012 when first DCM entered market with PQ-listed product
4B
▪ Sharp price drop after DCM 1 entered LMIC market with PQ-listed product in 2012
▪ Price dropped continuously over a series of years when additional products got PQ listed2
– DCM 3 received PQ in 2015 and DCM 1 received PQ in 2017
▪ DCM 1 only DCM to achieve a market share of >20% (35%) – MNC 1 adjusted
pricing to the same level as DCMs from 2012 onwards
– All manufacturers have an average price between $ 0.30-0.35/unit
21
Report of an Independent External Review – June 2019
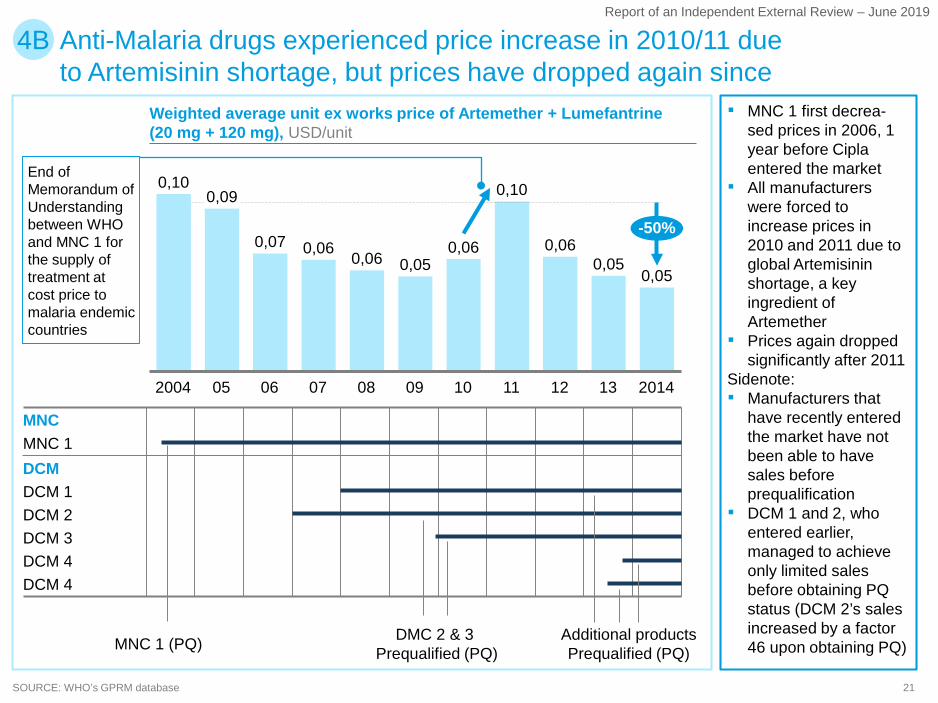
Weighted average unit ex works price of Artemether + Lumefantrine (20 mg + 120 mg), USD/unit
SOURCE: WHO’s GPRM database
08
0,06
052004 1110
0,07
07 09
0,05
06
0,06
12
0,06
201413
0,05
0,100,09 0,10
0,050,06
-50%
Anti-Malaria drugs experienced price increase in 2010/11 due to Artemisinin shortage, but prices have dropped again since
MNCMNC 1
DCM 2
DCMDCM 1
DCM 3DCM 4DCM 4
MNC 1 (PQ) Additional productsPrequalified (PQ)
DMC 2 & 3Prequalified (PQ)
4B
▪ MNC 1 first decrea-sed prices in 2006, 1 year before Cipla entered the market
▪ All manufacturers were forced to increase prices in 2010 and 2011 due to global Artemisinin shortage, a key ingredient of Artemether
▪ Prices again dropped significantly after 2011
Sidenote:▪ Manufacturers that
have recently entered the market have not been able to have sales before prequalification
▪ DCM 1 and 2, who entered earlier, managed to achieve only limited sales before obtaining PQ status (DCM 2’s sales increased by a factor 46 upon obtaining PQ)
End of Memorandum of Understanding between WHO and MNC 1 for the supply of treatment at cost price to malaria endemic countries
22
Report of an Independent External Review – June 2019
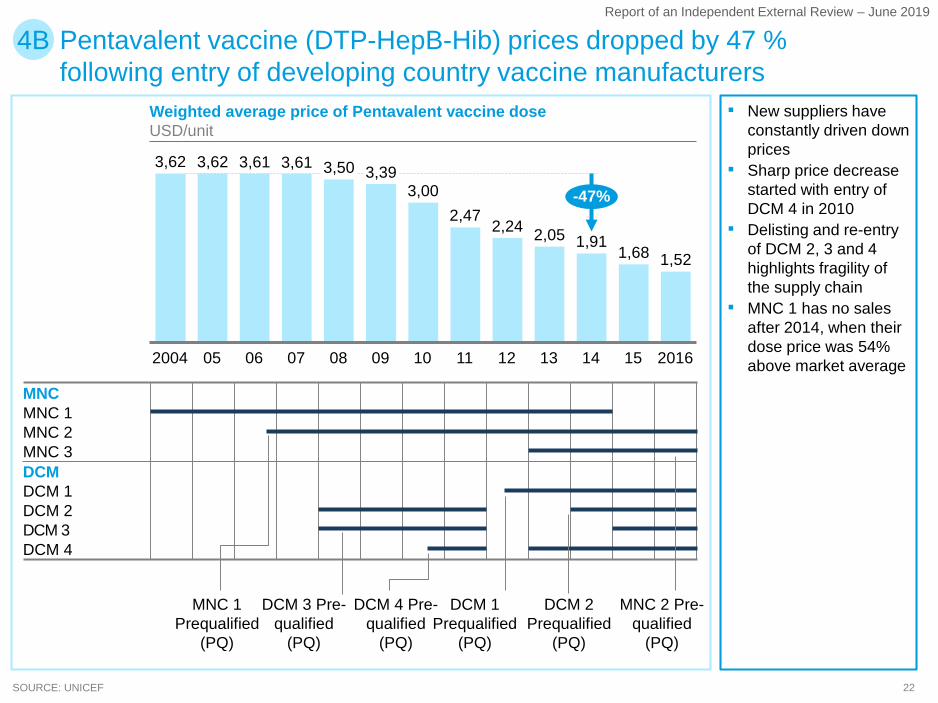
Weighted average price of Pentavalent vaccine doseUSD/unit
SOURCE: UNICEF
11
2,05
07 082004
1,68
0905 1506
3,61
10 12 13 14
2,24
2016
3,00
3,62 3,62 3,61 3,50 3,39
2,471,91
1,52
-47%
Pentavalent vaccine (DTP-HepB-Hib) prices dropped by 47 % following entry of developing country vaccine manufacturers
MNC 2
MNCMNC 1
DCMMNC 3
DCM 1DCM 2DCM 3DCM 4
4B
▪ New suppliers have constantly driven down prices
▪ Sharp price decrease started with entry of DCM 4 in 2010
▪ Delisting and re-entry of DCM 2, 3 and 4 highlights fragility of the supply chain
▪ MNC 1 has no sales after 2014, when their dose price was 54% above market average
MNC 1Prequalified
(PQ)
DCM 3 Pre-qualified
(PQ)
DCM 1 Prequalified
(PQ)
DCM 4 Pre-qualified
(PQ)
DCM 2 Prequalified
(PQ)
MNC 2 Pre-qualified
(PQ)
23
Report of an Independent External Review – June 2019
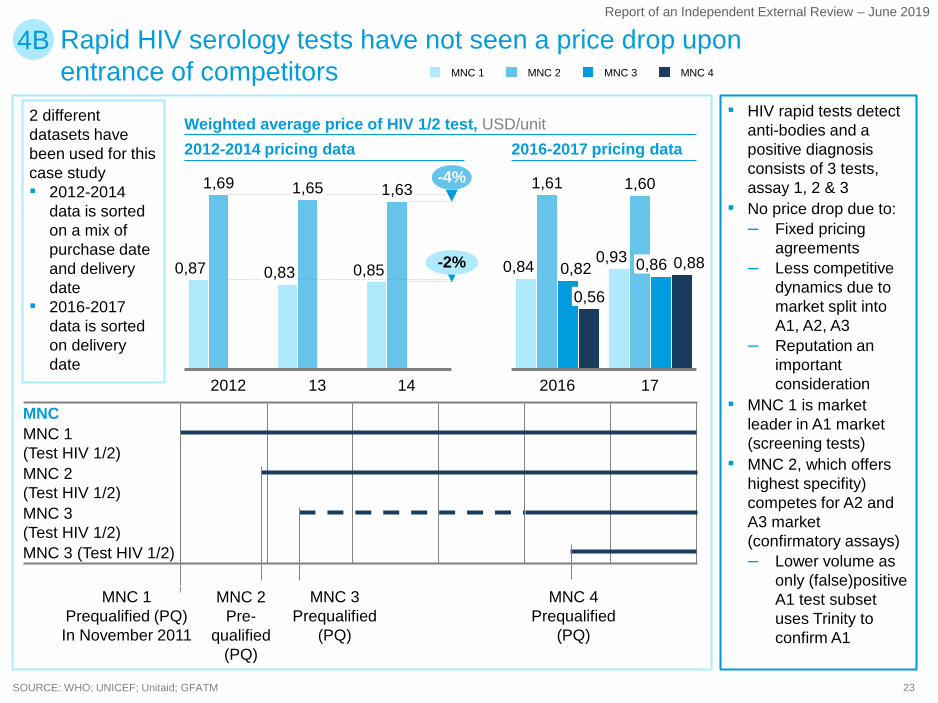
Weighted average price of HIV 1/2 test, USD/unit
SOURCE: WHO; UNICEF; Unitaid; GFATM
132012 14
0,87
1,69
0,83
1,65
0,85
1,63-4%
-2%
MNC
MNC 2(Test HIV 1/2)MNC 3(Test HIV 1/2)
MNC 1(Test HIV 1/2)
MNC 3 (Test HIV 1/2)
MNC 1 MNC 3 MNC 4MNC 2
4B
0,82
2016
0,56
0,84
17
0,93
1,61 1,60
0,86 0,88
MNC 4Prequalified
(PQ)
MNC 1Prequalified (PQ) In November 2011
MNC 2Pre-
qualified (PQ)
MNC 3Prequalified
(PQ)
2012-2014 pricing data 2016-2017 pricing data
2 different datasets have been used for this case study▪ 2012-2014
data is sorted on a mix of purchase date and delivery date
▪ 2016-2017 data is sorted on delivery date
▪ HIV rapid tests detect anti-bodies and a positive diagnosis consists of 3 tests, assay 1, 2 & 3
▪ No price drop due to:– Fixed pricing
agreements – Less competitive
dynamics due to market split into A1, A2, A3
– Reputation an important consideration
▪ MNC 1 is market leader in A1 market (screening tests)
▪ MNC 2, which offers highest specifity) competes for A2 and A3 market (confirmatory assays)– Lower volume as
only (false)positive A1 test subset uses Trinity to confirm A1
Rapid HIV serology tests have not seen a price drop upon entrance of competitors
24
Report of an Independent External Review – June 2019
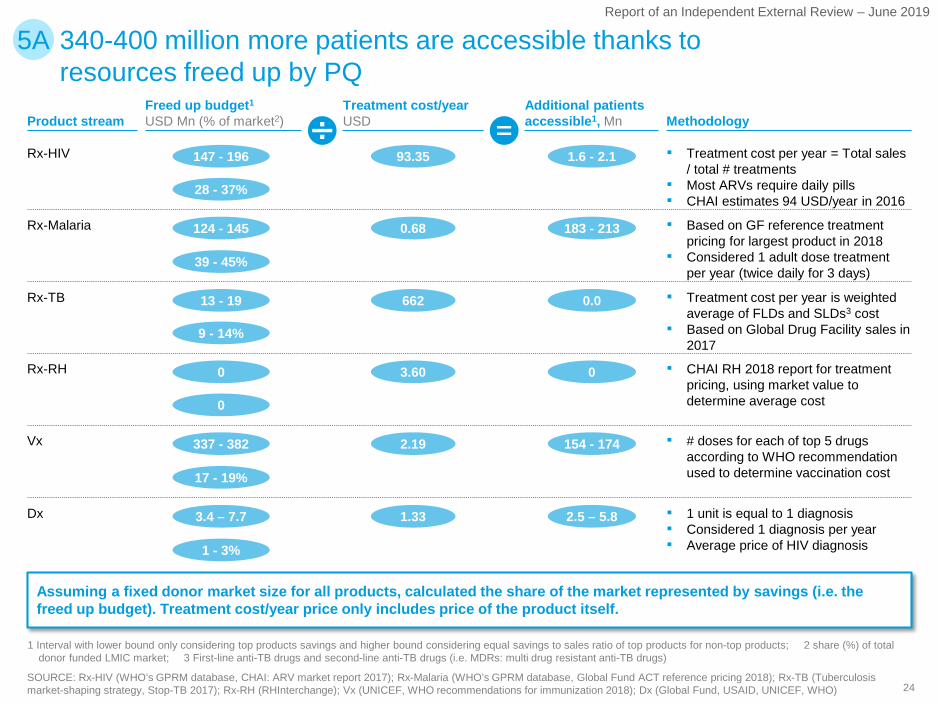
340-400 million more patients are accessible thanks to resources freed up by PQ
5A
Product stream
Rx-HIV
Rx-Malaria
Rx-TB
Rx-RH
Vx
Dx
Treatment cost/yearUSD
93.35
0.68
662
3.60
2.19
1.33
Additional patients accessible1, Mn
1.6 - 2.1
183 - 213
0.0
0
154 - 174
2.5 – 5.8
Methodology
▪ Treatment cost per year = Total sales / total # treatments
▪ Most ARVs require daily pills▪ CHAI estimates 94 USD/year in 2016
▪ Based on GF reference treatment pricing for largest product in 2018
▪ Considered 1 adult dose treatment per year (twice daily for 3 days)
▪ Treatment cost per year is weighted average of FLDs and SLDs3 cost
▪ Based on Global Drug Facility sales in 2017
▪ # doses for each of top 5 drugs according to WHO recommendation used to determine vaccination cost
▪ 1 unit is equal to 1 diagnosis ▪ Considered 1 diagnosis per year▪ Average price of HIV diagnosis
Freed up budget1
USD Mn (% of market2)
147 - 196
28 - 37%
124 - 145
39 - 45%
13 - 19
9 - 14%
0
0
337 - 382
17 - 19%
3.4 – 7.7
1 - 3%
Assuming a fixed donor market size for all products, calculated the share of the market represented by savings (i.e. the freed up budget). Treatment cost/year price only includes price of the product itself.
▪ CHAI RH 2018 report for treatment pricing, using market value to determine average cost
1 Interval with lower bound only considering top products savings and higher bound considering equal savings to sales ratio of top products for non-top products; 2 share (%) of total donor funded LMIC market; 3 First-line anti-TB drugs and second-line anti-TB drugs (i.e. MDRs: multi drug resistant anti-TB drugs)
SOURCE: Rx-HIV (WHO’s GPRM database, CHAI: ARV market report 2017); Rx-Malaria (WHO’s GPRM database, Global Fund ACT reference pricing 2018); Rx-TB (Tuberculosis market-shaping strategy, Stop-TB 2017); Rx-RH (RHInterchange); Vx (UNICEF, WHO recommendations for immunization 2018); Dx (Global Fund, USAID, UNICEF, WHO)
25
Report of an Independent External Review – June 2019
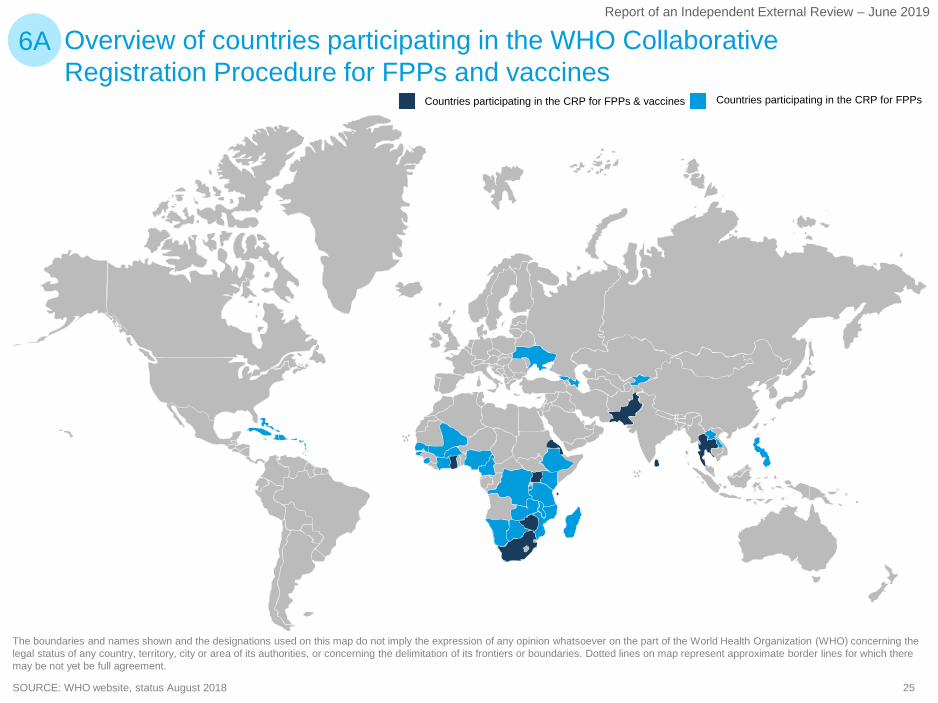
The boundaries and names shown and the designations used on this map do not imply the expression of any opinion whatsoever on the part of the World Health Organization (WHO) concerning the legal status of any country, territory, city or area of its authorities, or concerning the delimitation of its frontiers or boundaries. Dotted lines on map represent approximate border lines for which there may be not yet be full agreement.
Overview of countries participating in the WHO Collaborative Registration Procedure for FPPs and vaccines
6A
SOURCE: WHO website, status August 2018
Countries participating in the CRP for FPPsCountries participating in the CRP for FPPs & vaccines
26
Report of an Independent External Review – June 2019
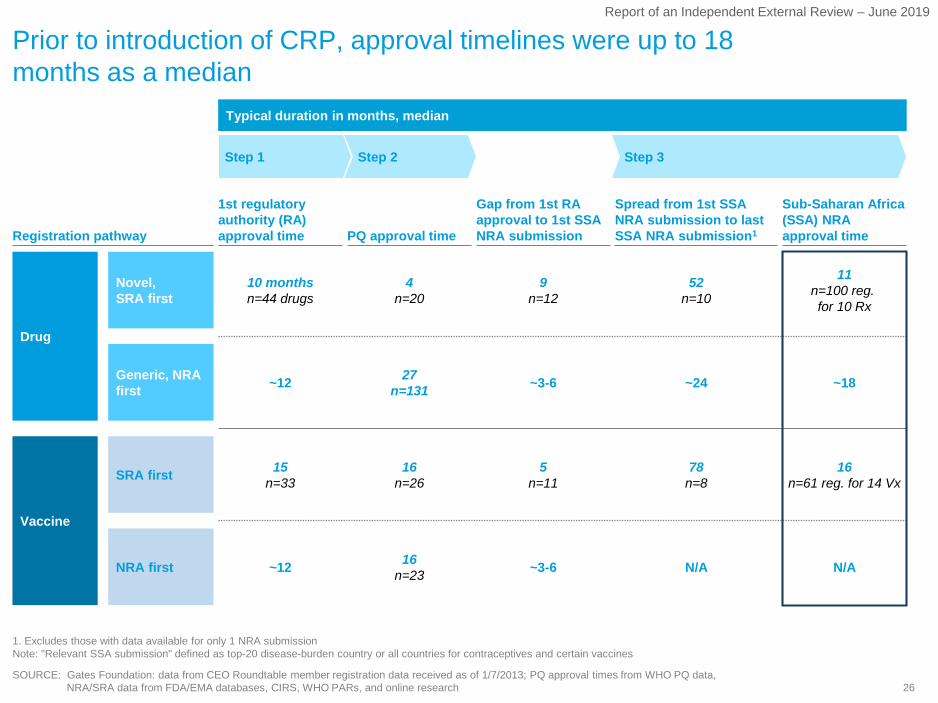
Prior to introduction of CRP, approval timelines were up to 18 months as a median
1. Excludes those with data available for only 1 NRA submissionNote: "Relevant SSA submission" defined as top-20 disease-burden country or all countries for contraceptives and certain vaccines
Registration pathway PQ approval time
Gap from 1st RA approval to 1st SSA NRA submission
Spread from 1st SSA NRA submission to last SSA NRA submission1
1st regulatory authority (RA) approval time
Sub-Saharan Africa (SSA) NRAapproval time
Drug
Vaccine
~12 16n=23 ~3-6 N/A N/ANRA first
SRA first 15n=33
16n=26
5n=11
78n=8
16n=61 reg. for 14 Vx
~12 27n=131 ~3-6 ~24 ~18Generic, NRA
first
Novel,SRA first
10 monthsn=44 drugs
4n=20
9n=12
52n=10
11n=100 reg. for 10 Rx
Step 1 Step 2 Step 3
Typical duration in months, median
SOURCE: Gates Foundation: data from CEO Roundtable member registration data received as of 1/7/2013; PQ approval times from WHO PQ data, NRA/SRA data from FDA/EMA databases, CIRS, WHO PARs, and online research
27
Report of an Independent External Review – June 2019
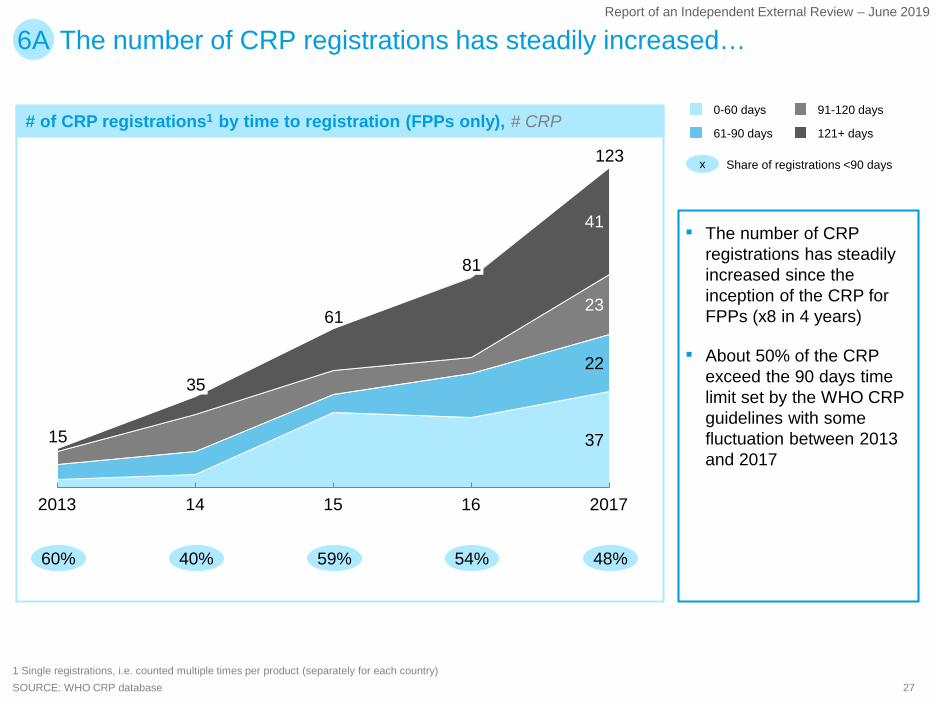
# of CRP registrations1 by time to registration (FPPs only), # CRP
The number of CRP registrations has steadily increased…6A
▪ The number of CRP registrations has steadily increased since the inception of the CRP for FPPs (x8 in 4 years)
▪ About 50% of the CRP exceed the 90 days time limit set by the WHO CRP guidelines with some fluctuation between 2013 and 2017
37
22
23
41
123
2013 14 15
35
201716
15
61
81
0-60 days
61-90 days 121+ days
91-120 days
SOURCE: WHO CRP database1 Single registrations, i.e. counted multiple times per product (separately for each country)
60%
x Share of registrations <90 days
40% 59% 54% 48%
28
Report of an Independent External Review – June 2019
Prior to introduction of CRP...
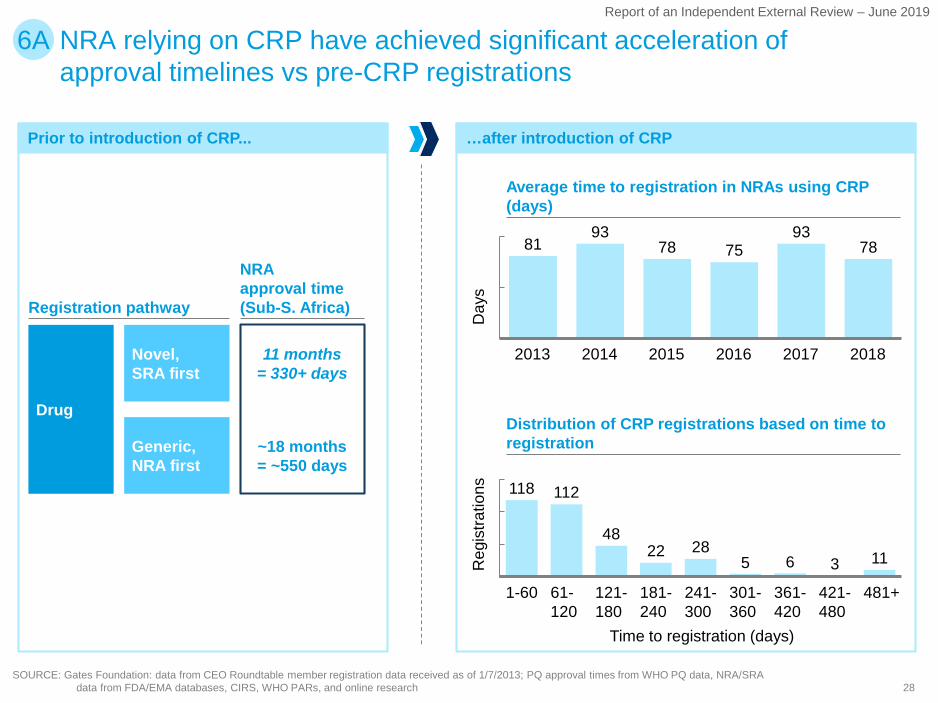
NRA relying on CRP have achieved significant acceleration of approval timelines vs pre-CRP registrations
6A
SOURCE: Gates Foundation: data from CEO Roundtable member registration data received as of 1/7/2013; PQ approval times from WHO PQ data, NRA/SRA data from FDA/EMA databases, CIRS, WHO PARs, and online research
Registration pathway
NRAapproval time (Sub-S. Africa)
Drug
~18 months= ~550 days
Generic, NRA first
Novel,SRA first
11 months= 330+ days
118 112
4822 28
5 6 3 11
61-120
1-60 301-360
121-180
181-240
241-300
361-420
481+421-480
8193
78 7593
78
2013 20172014 2015 2016 2018
Average time to registration in NRAs using CRP (days)
Distribution of CRP registrations based on time to registration
Day
sR
egis
tratio
ns
Time to registration (days)
…after introduction of CRP

29
Report of an Independent External Review – June 2019
# of CRP registration by time to registration per country from 2013 to 2017 (cumulative), % of CRP per registration time per country
…but there are high variations in terms of speed to approval across countries
6A
100 100
20 2645 42
2440
5643 43 47 50 50 53
87
8
25 11
5 1128
10 14 19 1633 33
40
93
13
85
55
32 10 521
1021
29
89 80
32 40 4228
40 4421
1037
17 17
0
00 00
7
7
BA
15
0 80
C
11
P
07
7
E0F G OH I TJ
0L
3
M N S
13 0
0
0
K
03
Q
7
R
0
D
0
0
0
100% =2 12 9 15 20 1919
20
0
29 10 9 14 21 6 6 30 1519
SOURCE: WHO PQ team, CRP database1 Single registrations, i.e. counted multiple times per product (separately for each country)
0-60 days
61-90 days
91-120 days
121+ days
▪ High variation in terms of speed of approval across LMIC
▪ Some countries extensively use the CRP and stay below 90-day limit (e.g., CARICOM, Philippines, Malawi), others use the CRP less frequently and do not meet their 90-day commitment (e.g., DRC, Burundi)
30
Report of an Independent External Review – June 2019
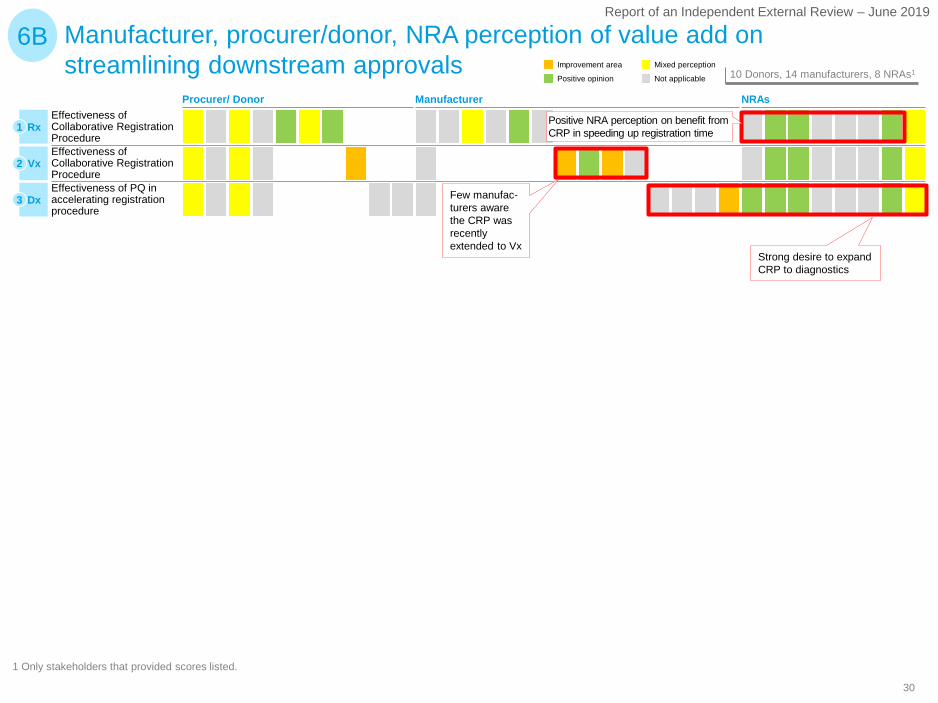
Manufacturer, procurer/donor, NRA perception of value add on streamlining downstream approvals
1 Only stakeholders that provided scores listed.
6B
Effectiveness of Collaborative Registration Procedure Effectiveness of PQ in accelerating registration procedure
Effectiveness of Collaborative Registration Procedure
Rx1
Vx2
Dx3
Not applicable
Mixed perception
Positive opinion
Improvement area10 Donors, 14 manufacturers, 8 NRAs1
Positive NRA perception on benefit from CRP in speeding up registration time
Few manufac-turers aware the CRP was recently extended to Vx
Strong desire to expand CRP to diagnostics
Procurer/ Donor Manufacturer NRAs

31
Report of an Independent External Review – June 2019
PQ has enabled some medicines manufacturers from LMIC1
obtain SRA approval 7A
SOURCE: WHO PQ lists for FPPs, APIs, Vaccines and IVDs (as of 2018)
14
NB: FDA approval (Rx/Vx) or CE-mark (Dx) used as proxy for SRA
FPPs APIs
Dx
Vx
19
8
10
1
▪ PQ has helped some DCMs manufacturers obtain SRA approvals
▪ PQ has enabled at least 11 FFP DCMs to enter donor funded market
▪ Only 1 DCM managed to have PQ products
▪ 9 DCMs had products withdrawn or rejected by PQ
▪ For Diagnostics, CE-mark often easier to obtain than PQ (unlike SRA approval for Rx / Vx)
▪ PQ has enabled 10 DCVMs to enter donor funded market
▪ None of the DCVMs has products with SRAapproval
RxDCMs with PQ product(s) DCMs with SRA approvals for PQ products
8
1 Only considering DCMs from low income and lower middle income countries according to World Bank classification
32
Report of an Independent External Review – June 2019
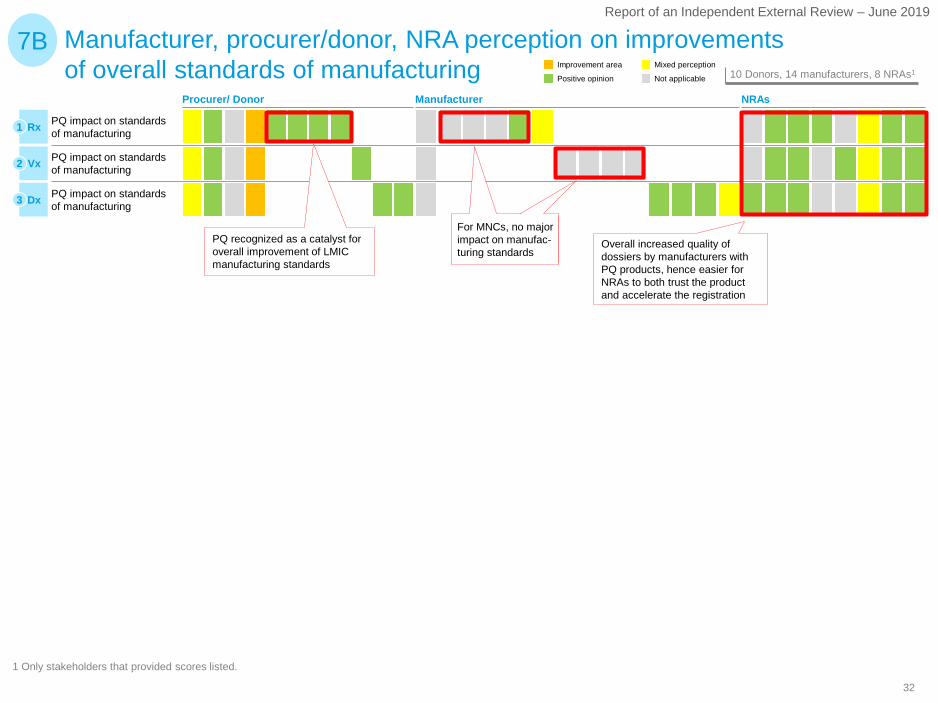
Manufacturer, procurer/donor, NRA perception on improvements of overall standards of manufacturing
1 Only stakeholders that provided scores listed.
7B
PQ impact on standards of manufacturing
PQ impact on standards of manufacturing
PQ impact on standards of manufacturing
PQ recognized as a catalyst for overall improvement of LMICmanufacturing standards
For MNCs, no major impact on manufac-turing standards
Overall increased quality of dossiers by manufacturers with PQ products, hence easier for NRAs to both trust the product and accelerate the registration
Rx1
Vx2
Dx3
Not applicable
Mixed perception
Positive opinion
Improvement area10 Donors, 14 manufacturers, 8 NRAs1
Procurer/ Donor Manufacturer NRAs
33
Report of an Independent External Review – June 2019
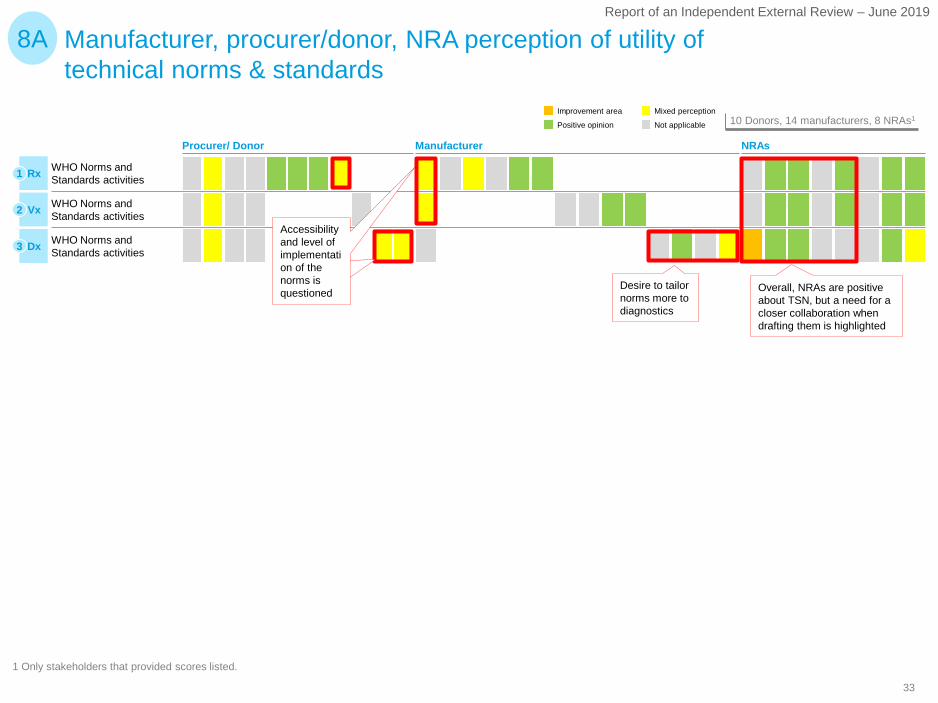
Manufacturer, procurer/donor, NRA perception of utility of technical norms & standards
1 Only stakeholders that provided scores listed.
8A
WHO Norms and Standards activities
WHO Norms and Standards activities
WHO Norms and Standards activitiesRx1
Vx2
Dx3
Not applicable
Mixed perception
Positive opinion
Improvement area10 Donors, 14 manufacturers, 8 NRAs1
Desire to tailor norms more to diagnostics
Overall, NRAs are positive about TSN, but a need for a closer collaboration when drafting them is highlighted
Accessibility and level of implementation of the norms is questioned
Procurer/ Donor Manufacturer NRAs
34
Report of an Independent External Review – June 2019
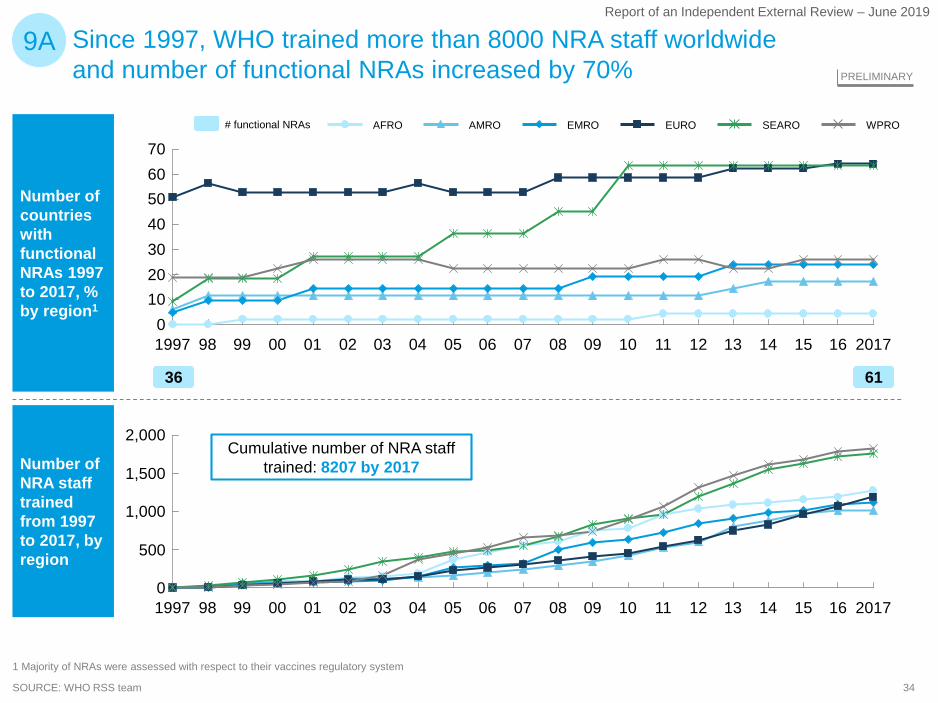
Number of countries with functional NRAs 1997 to 2017, % by region1
Number of NRA staff trained from 1997 to 2017, by region
SOURCE: WHO RSS team
9A
1,000
500
0
2,000
1,500
99 06 2017140798 110801 02 09 16151210050300 13041997
AMRO EMRO SEAROAFRO WPROEURO
Cumulative number of NRA staff trained: 8207 by 2017
50
30
10
70
40
0
60
20
1997 98 0501 07040299 00 0603 1412 13111009 1608 201715
36 61
# functional NRAs
PRELIMINARY
Since 1997, WHO trained more than 8000 NRA staff worldwide and number of functional NRAs increased by 70%
1 Majority of NRAs were assessed with respect to their vaccines regulatory system
35
Report of an Independent External Review – June 2019
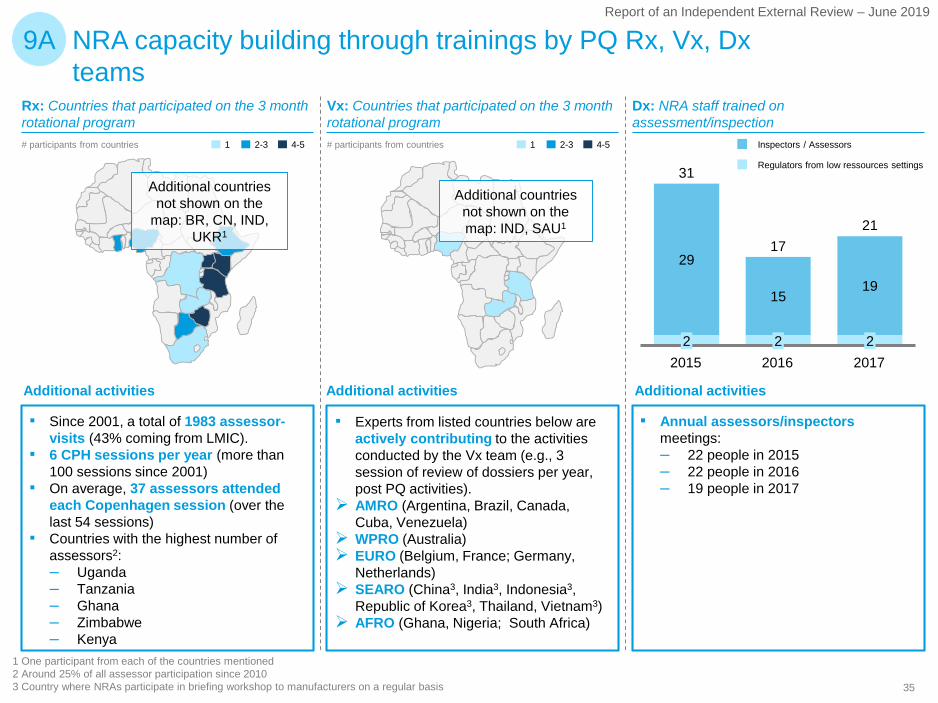
NRA capacity building through trainings by PQ Rx, Vx, Dx teams
9A
1 One participant from each of the countries mentioned2 Around 25% of all assessor participation since 20103 Country where NRAs participate in briefing workshop to manufacturers on a regular basis
29
1519
31
201622
20152
2017
2117
Inspectors / Assessors
Regulators from low ressources settings
1 2-3 4-5# participants from countries 1 2-3 4-5# participants from countries
Rx: Countries that participated on the 3 month rotational program
▪ Since 2001, a total of 1983 assessor-visits (43% coming from LMIC).
▪ 6 CPH sessions per year (more than 100 sessions since 2001)
▪ On average, 37 assessors attended each Copenhagen session (over the last 54 sessions)
▪ Countries with the highest number of assessors2:– Uganda– Tanzania– Ghana– Zimbabwe– Kenya
Vx: Countries that participated on the 3 month rotational program
▪ Experts from listed countries below are actively contributing to the activities conducted by the Vx team (e.g., 3 session of review of dossiers per year, post PQ activities).
AMRO (Argentina, Brazil, Canada, Cuba, Venezuela)
WPRO (Australia) EURO (Belgium, France; Germany,
Netherlands) SEARO (China3, India3, Indonesia3,
Republic of Korea3, Thailand, Vietnam3) AFRO (Ghana, Nigeria; South Africa)
Dx: NRA staff trained on assessment/inspection
▪ Annual assessors/inspectorsmeetings:– 22 people in 2015– 22 people in 2016– 19 people in 2017
Additional countries not shown on the
map: BR, CN, IND, UKR1
Additional countries not shown on the map: IND, SAU1
Additional activities Additional activities Additional activities
36
Report of an Independent External Review – June 2019
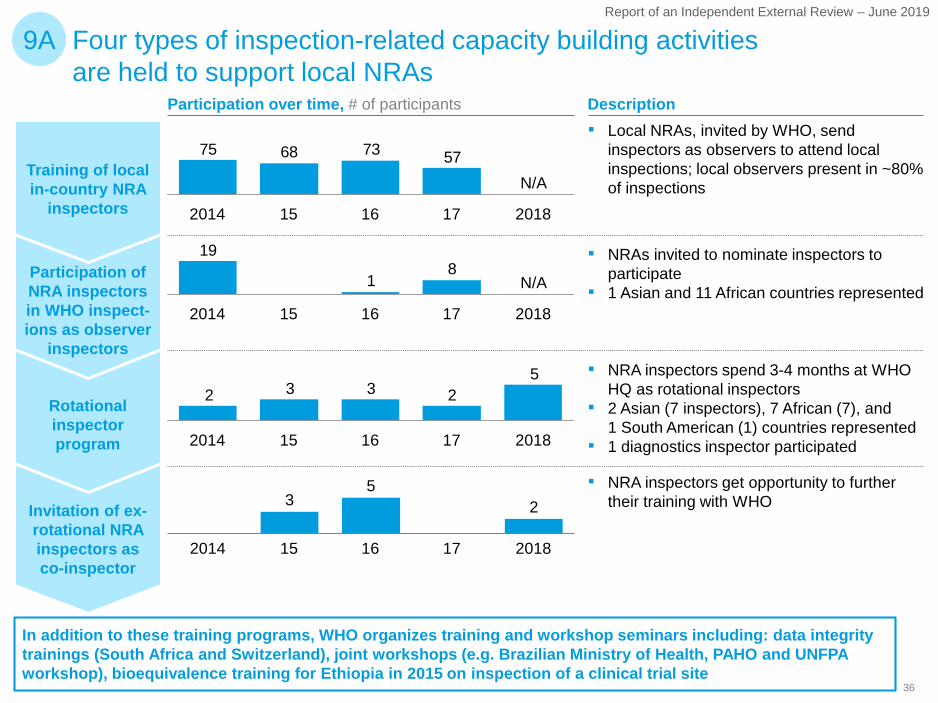
Four types of inspection-related capacity building activities are held to support local NRAs
Training of local in-country NRA
inspectors
Participation of NRA inspectors in WHO inspect-ions as observer
inspectors
Rotational inspector program
Invitation of ex-rotational NRA inspectors as co-inspector
52332
162014 15 201817
35
2
2014 15 201816 17
81
19
N/A
172014 1615 2018
57736875
N/A
2014 1615 201817
9A
Participation over time, # of participants▪ Local NRAs, invited by WHO, send
inspectors as observers to attend local inspections; local observers present in ~80% of inspections
▪ NRAs invited to nominate inspectors to participate
▪ 1 Asian and 11 African countries represented
▪ NRA inspectors spend 3-4 months at WHO HQ as rotational inspectors
▪ 2 Asian (7 inspectors), 7 African (7), and 1 South American (1) countries represented
▪ 1 diagnostics inspector participated
▪ NRA inspectors get opportunity to further their training with WHO
Description
In addition to these training programs, WHO organizes training and workshop seminars including: data integrity trainings (South Africa and Switzerland), joint workshops (e.g. Brazilian Ministry of Health, PAHO and UNFPA workshop), bioequivalence training for Ethiopia in 2015 on inspection of a clinical trial site
37
Report of an Independent External Review – June 2019
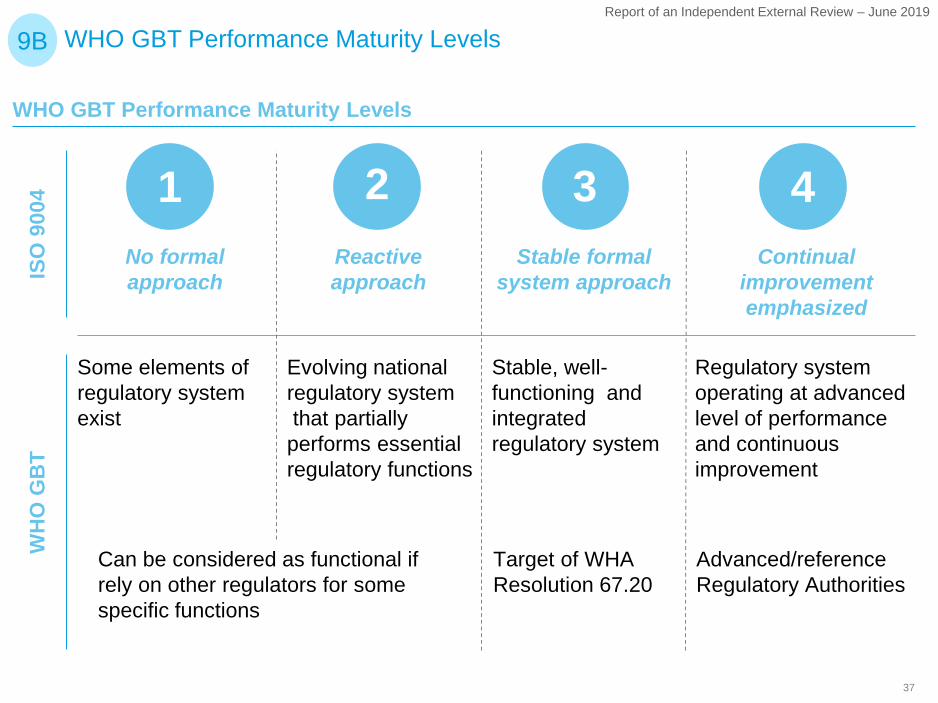
WHO GBT Performance Maturity Levels9B
WHO GBT Performance Maturity Levels
No formal approach
Reactive approach
Stable formal system approach
Continual improvement emphasized
1 2 3 4
ISO
900
4
Regulatory system operating at advanced level of performance and continuous improvement
Evolving national regulatory systemthat partially performs essential regulatory functions
Stable, well-functioning and integrated regulatory system
Some elements of regulatory system exist
Can be considered as functional if rely on other regulators for some specific functions
Target of WHA Resolution 67.20
Advanced/referenceRegulatory Authorities
WH
O G
BT
38
Report of an Independent External Review – June 2019
Procurer/ Donor NRAs
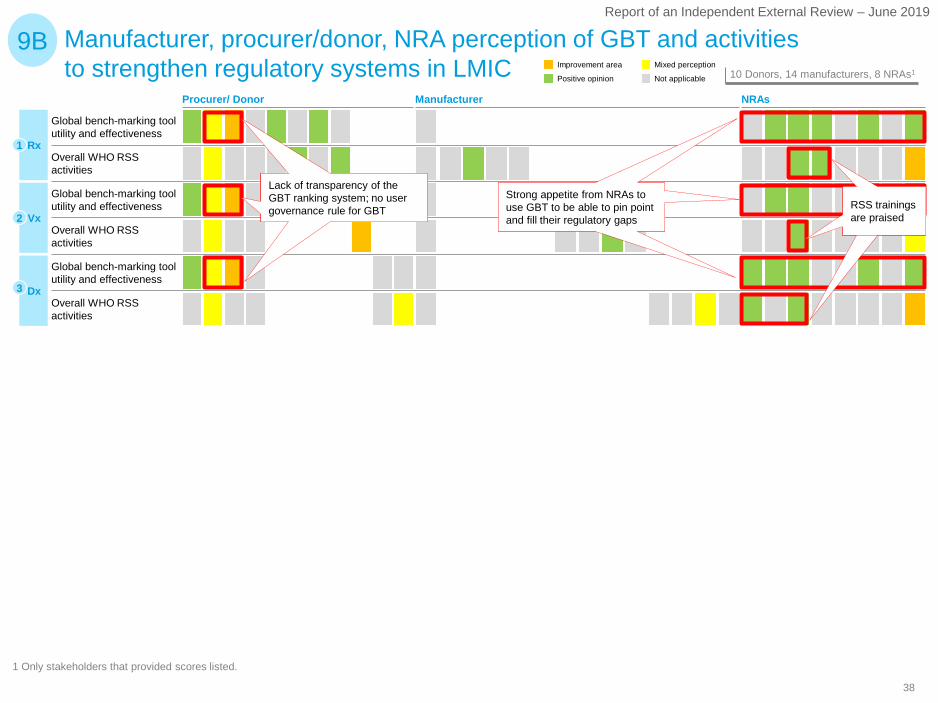
Manufacturer, procurer/donor, NRA perception of GBT and activities to strengthen regulatory systems in LMIC
1 Only stakeholders that provided scores listed.
9B
Overall WHO RSS activities
Global bench-marking tool utility and effectiveness
Global bench-marking tool utility and effectiveness
Rx1
Vx2
Dx3
Global bench-marking tool utility and effectiveness
Overall WHO RSS activities
Overall WHO RSS activities
Lack of transparency of the GBT ranking system; no user governance rule for GBT
Strong appetite from NRAs to use GBT to be able to pin point and fill their regulatory gaps
RSS trainings are praised
Not applicable
Mixed perception
Positive opinion
Improvement area10 Donors, 14 manufacturers, 8 NRAs1
Manufacturer
39
Report of an Independent External Review – June 2019
200
500
1.200
300
700
1.100
1.500
1.800
1.400
800
100
900
400
600
0
1.600
1.300
1.700
1.000
40
60
20
0
260
220
200
160
140
320
300
100
80
280
180
120
240
201720122011 2013 20152014 2016
SEARO WPROAMROEUROEMROAFRO
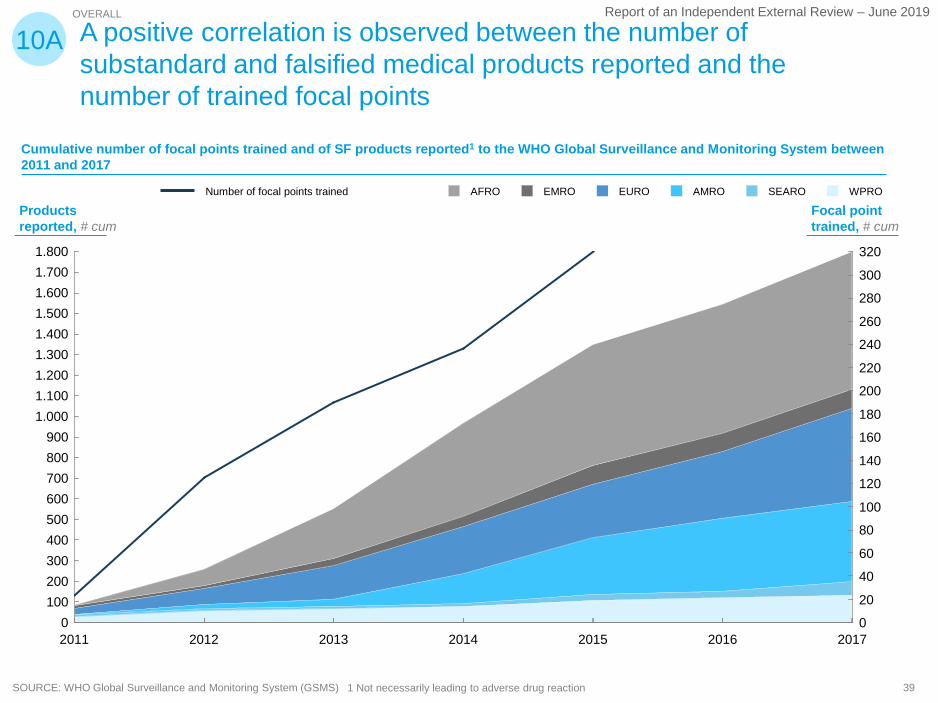
OVERALL
A positive correlation is observed between the number of substandard and falsified medical products reported and the number of trained focal points
10A
Number of focal points trained
Cumulative number of focal points trained and of SF products reported1 to the WHO Global Surveillance and Monitoring System between 2011 and 2017
1 Not necessarily leading to adverse drug reactionSOURCE: WHO Global Surveillance and Monitoring System (GSMS)
Focal point trained, # cum
Products reported, # cum
40
Report of an Independent External Review – June 2019
SOURCE: WHO global database of ICSRs (VigiBase)
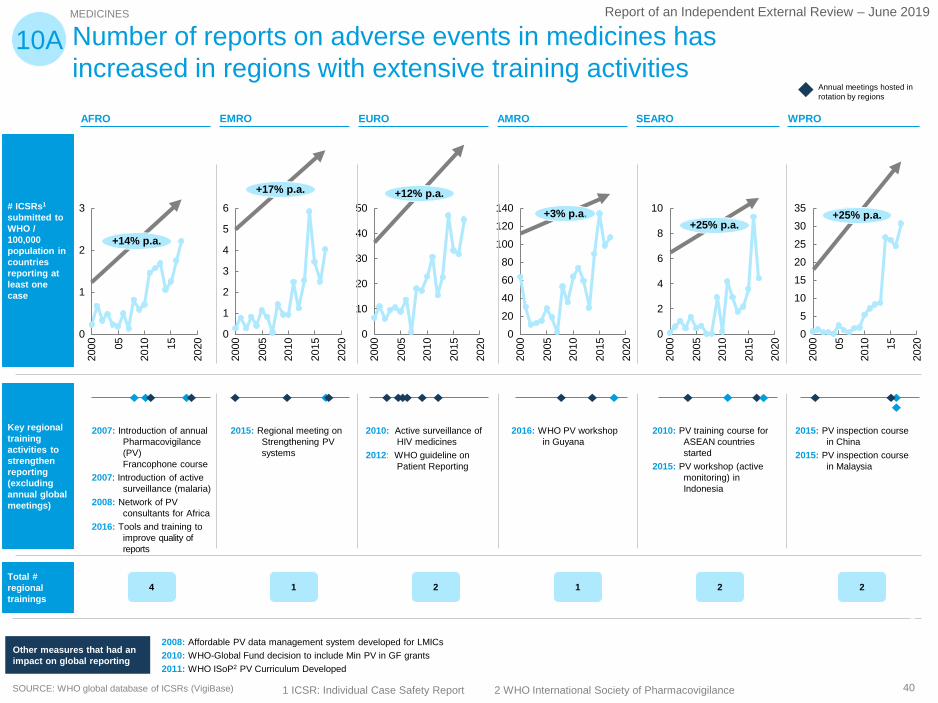
MEDICINES
Number of reports on adverse events in medicines has increased in regions with extensive training activities
2000
2010
3
0
1
2
05 15
2020
+14% p.a.
Annual meetings hosted in rotation by regions
10A
2000
220
10
0
1
6
3
4
5
2005
2015
2020
+17% p.a.
2015
2000
20
2010
40
2005
0
10
30
50
2020
+12% p.a.
2000
120
2010
40
140
0
100
20
6080
2005
2015
2020
+3% p.a.
2000
2010
2
0
4
6
8
10
2005
2015
2020
+25% p.a.
2000
0
2010
51015
35
202530
05 15
2020
+25% p.a.
2007: Introduction of annual Pharmacovigilance (PV)Francophone course
2007: Introduction of active surveillance (malaria)
2008: Network of PV consultants for Africa
2016: Tools and training to improve quality of reports
2015: Regional meeting on Strengthening PV systems
2016: WHO PV workshop in Guyana
2010: PV training course for ASEAN countries started
2015: PV workshop (active monitoring) in Indonesia
2015: PV inspection course in China
2015: PV inspection course in Malaysia
2010: Active surveillance of HIV medicines
2012: WHO guideline on Patient Reporting
2008: Affordable PV data management system developed for LMICs2010: WHO-Global Fund decision to include Min PV in GF grants 2011: WHO ISoP2 PV Curriculum Developed
Other measures that had an impact on global reporting
SEAROEMRO EURO AMROAFRO WPRO
# ICSRs1
submitted to WHO / 100,000 population in countries reporting at least one case
Key regional training activities to strengthen reporting (excluding annual global meetings)
Total # regional trainings
4 1 2 1 2 2
1 ICSR: Individual Case Safety Report 2 WHO International Society of Pharmacovigilance
41
Report of an Independent External Review – June 2019
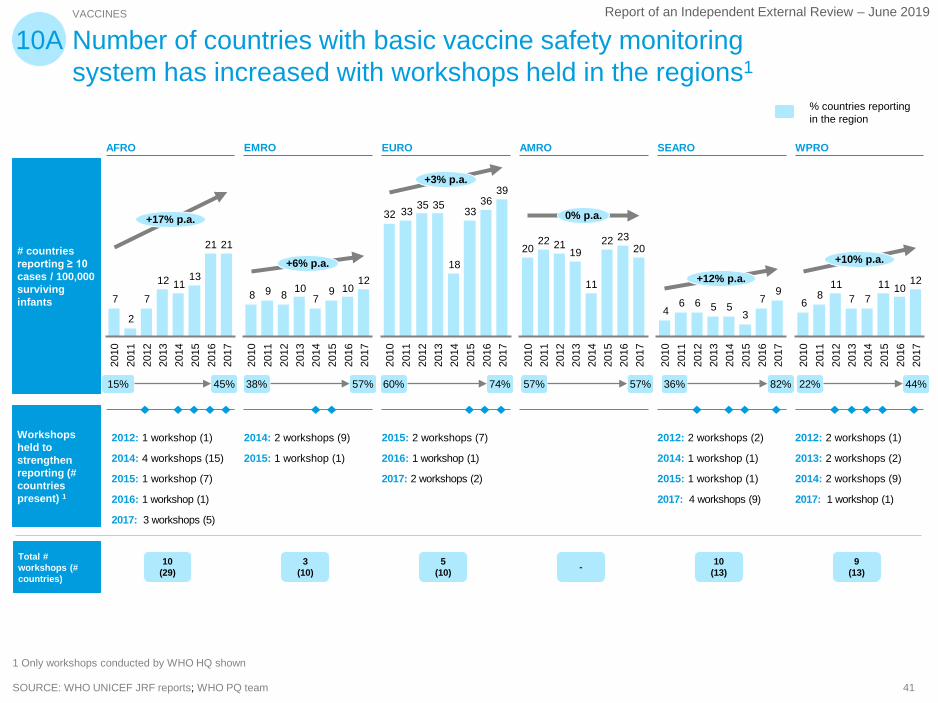
SOURCE: WHO UNICEF JRF reports; WHO PQ team
# countries reporting ≥ 10 cases / 100,000 surviving infants
Workshops held to strengthen reporting (# countries present) 1
2121
131112
7
2
7
2017
2011
2016
2013
2014
2010
2015
2012
+17% p.a.
12109
710898
2014
2017
2016
2015
2013
2012
2011
2010
+6% p.a.
3936
33
18
35353332
2015
2017
2013
2016
2011
2010
2012
2014
+3% p.a.
202322
11
192122
20
2013
2017
2012
2016
2014
2010
2011
2015
0% p.a.
97
35566
4
2015
2017
2012
2014
2011
2010
2016
2013
+12% p.a. 121011
7711
86
2013
2012
2014
2015
2016
2010
2011
+10% p.a.
2017
VACCINES
Number of countries with basic vaccine safety monitoring system has increased with workshops held in the regions1
10A
EMRO EURO AMRO SEAROAFRO WPRO
2012: 1 workshop (1)
2014: 4 workshops (15)
2015: 1 workshop (7)
2016: 1 workshop (1)
2017: 3 workshops (5)
2014: 2 workshops (9)
2015: 1 workshop (1)
2015: 2 workshops (7)
2016: 1 workshop (1)
2017: 2 workshops (2)
2012: 2 workshops (2)
2014: 1 workshop (1)
2015: 1 workshop (1)
2017: 4 workshops (9)
2012: 2 workshops (1)
2013: 2 workshops (2)
2014: 2 workshops (9)
2017: 1 workshop (1)
1 Only workshops conducted by WHO HQ shown
45%15% 57%38% 74%60% 57%57% 82%36% 44%22%
% countries reporting in the region
Total # workshops (# countries)
10 (29)
3 (10)
5(10) - 10
(13)9
(13)
42
Report of an Independent External Review – June 2019
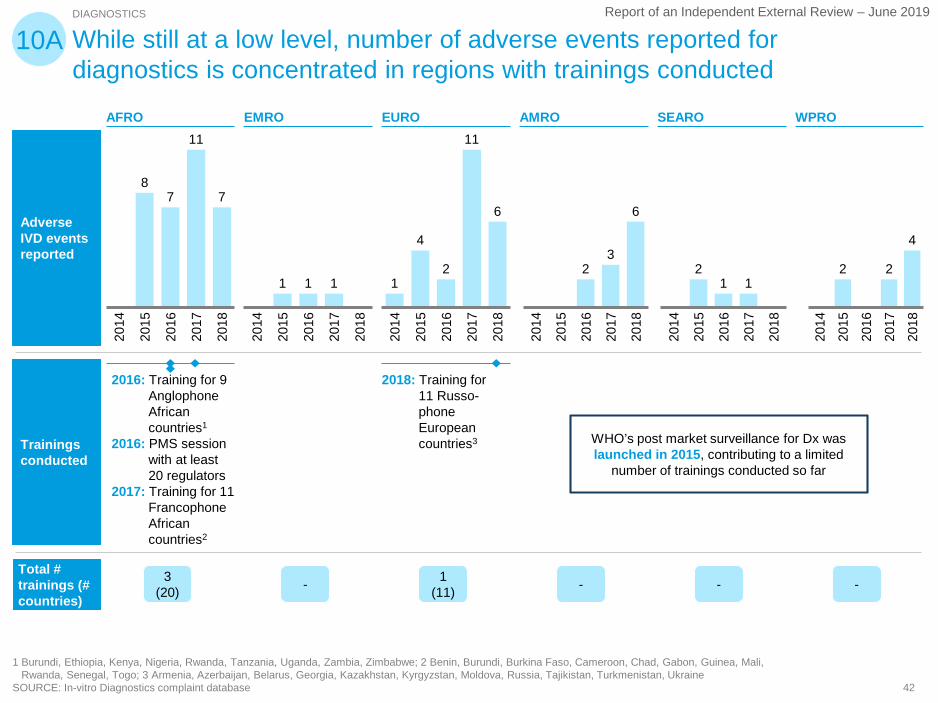
While still at a low level, number of adverse events reported for diagnostics is concentrated in regions with trainings conducted
Adverse IVD events reported
Trainings conducted
87
11
7
2014
2016
2015
2017
2018
1 1 1
2017
2016
2015
2014
2018
1
4
2
11
6
2014
2017
2015
2016
2018
23
6
2015
2014
2016
2017
2018
21 1
2018
2014
2015
2016
2017
2 2
4
2017
2014
2015
2016
2018
DIAGNOSTICS
1 Burundi, Ethiopia, Kenya, Nigeria, Rwanda, Tanzania, Uganda, Zambia, Zimbabwe; 2 Benin, Burundi, Burkina Faso, Cameroon, Chad, Gabon, Guinea, Mali,Rwanda, Senegal, Togo; 3 Armenia, Azerbaijan, Belarus, Georgia, Kazakhstan, Kyrgyzstan, Moldova, Russia, Tajikistan, Turkmenistan, Ukraine
SOURCE: In-vitro Diagnostics complaint database
10A
EMRO EURO AMRO SEAROAFRO WPRO
2016: Training for 9 Anglophone African countries1
2016: PMS session with at least 20 regulators
2017: Training for 11 Francophone African countries2
2018: Training for 11 Russo-phone European countries3
Total # trainings (# countries)
3 (20) - 1
(11) - - -
WHO’s post market surveillance for Dx was launched in 2015, contributing to a limited
number of trainings conducted so far

43
Report of an Independent External Review – June 2019
Manufacturer, procurer, NRA perception of utility of SAV activities
1 Only stakeholders that provided scores listed.
10B
WHO Safety and Vigilance activities
WHO Safety and Vigilance activities
WHO Safety and Vigilance activitiesRx1
Vx2
Dx3
Not applicable
Mixed perception
Positive opinion
Improvement area10 Donors, 14 manufacturers, 8 NRAs1
Limited post market surveillance due to lack of awareness and capabilities in countries; need for strengthened SAV training activities
Positive perception on quality of trainings
ManufacturerProcurer/ Donor NRAs
Slow response to adverse events limiting possibility to quickly modify products
Desire for more active pharmaco-vigilance
44
Report of an Independent External Review – June 2019
Report of an Independent External Review – June 2019