Embed Size (px)
Citation preview

1
Title: Impact Assessment of Proposed Ecodesign Requirements for Electric Motors and Variable Speed Drives, and Electrical Mains-operated Welding Equipment RPC Reference No: RPC-4447(1)-BEIS Lead department or agency: BEIS Other departments or agencies: DEFRA
Impact Assessment (IA)
Date: 30/09/2020 Stage: Consultation Source of intervention: Domestic Type of measure: Secondary legislation Contact for enquiries: Policy Lead: Lucy Birt ([email protected]) Analyst Lead: Chris Nash ([email protected])
Summary: Intervention and Options
RPC Opinion: Not applicable
Cost of Preferred (or more likely) Option (in 2016 prices, 2017 present value year)
Total Net Present Social Value
Business Net Present Value
Net cost to business per year
Business Impact Target Status Qualifying provision
£830m £673m -£35m
What is the problem under consideration? Why is government intervention necessary? Electric motors and variable speed drives (electric motors), and electrical mains-operated welding equipment (welding equipment) have a substantial environmental impact and show significant potential for improvement in terms of energy performance as large numbers are placed on the market annually. In January 2019 the UK, as a Member State, voted in favour of new and updated ecodesign requirements for these products. These requirements will not automatically apply in the Great Britain after the transition period ends on 31 December 2020. However, the measures carry significant benefits in relation to realising the Government’s Carbon Budget and Net Zero targets and implementing them in GB law means that we can reap these benefits after the end of the Transition Period. Therefore, separate GB legislation is required for the energy savings of these requirements to be realised. The costs and benefits of the proposed GB ecodesign requirements for the two products have been analysed separately but are included here in the same impact assessment. What are the policy objectives and the intended effects? Ecodesign legislation requires manufacturers of energy-related products to meet minimum requirements that result in the improvement of energy efficiency and environmental impacts of their products. This helps to achieve the UK’s objectives of reducing energy bills for businesses and consumers, reducing Carbon Dioxide (CO2) emissions, minimising the adverse environmental impacts of products and ensuring effective regulation for businesses and consumers. Updating existing ecodesign requirements for electric motors and introducing new requirements for welding equipment is projected to further increase energy efficiency savings and reduce the UK carbon footprint.
What policy options have been considered, including any alternatives to regulation? Please justify preferred option (further details in Evidence Base) The preferred option (Option 2) has been assessed against a Do Nothing option. Option 1 - Do Nothing. There is significant potential for efficiency improvements for electric motors and welding equipment due to the numbers of both products (c. 6m) sold each year in the UK. By not legislating, the UK would miss out on energy and carbon emission savings. Option 2 - Update ecodesign requirements for the products to reflect what the UK agreed at EU level as a Member State in January 2019. This would make it possible for the UK to realise the full energy and carbon emission savings from electric motors and welding equipment, contribute to the Governments Carbon Budget and Net Zero targets, and maintain high environmental product standards. Self-regulation was considered, however during the consultation the Government held with stakeholders before agreeing the EU regulations on electric motors and welding equipment, industry did not propose any self-regulations, nor expressed an interest in doing so. This option has therefore been discarded.

2
Will the policy be reviewed? It will be reviewed. If applicable, set review date: 5 years from application of the draft electric motors regulations, and 6 years from application of the draft welding equipment regulations.
Does implementation go beyond minimum EU requirements? No
Is this measure likely to impact on international trade and investment? No
Are any of these organisations in scope? Micro Yes
SmallYes
MediumYes
LargeYes
What is the CO2 equivalent change in greenhouse gas emissions? (Million tonnes CO2 equivalent)
Traded: -1.55
Non-traded: 0
I have read the Impact Assessment and I am satisfied that, given the available evidence, it represents a reasonable view of the likely costs, benefits and impact of the leading options.
Signed by the responsible Minister: Rt Hon Kwasi Kwarteng MP Date: 05/02/2020

3
Description: Update ecodesign requirements for electric motors and welding equipment FULL ECONOMIC ASSESSMENT
Price
PV
Time
Net Benefit (Present Value (PV)) (£m) 2021 2021 30 Low (-20%):
689 High (+20%): 1,406
Best Estimate: 1,047
COSTS (£m) Total Transition
(Constant Price)Years
Average Annual (excl. Transition) (Constant
P i )
Total Cost (Present Value)
Low (-20%) -
- 298 High (+20%) - - 447
Best Estimate
- 18 373 Description and scale of key monetised costs by ‘main affected groups’ Manufacturing costs, along with the estimated additional costs for manufacturers to meet the increased energy performance requirements, make up 100% of all monetised costs which are based on UK sales figures for electric motors and welding equipment. These additional costs are assumed to be passed onto consumers through the supply chain but are offset by lower energy bills.
Other key non-monetised costs by ‘main affected groups’ All non-monetised costs are assumed to be negligible compared with the manufacturing costs outlined above. Considered in this assessment are the following: transitional/familiarisation costs of understanding the requirements; distributional impacts (although lower energy costs will offset the increased price of products); resource efficiency (considered disproportionate for both motors and welding equipment - energy savings were modest); and enforcement and compliance costs (enforcement action would be undertaken by the Office for Product Safety and Standards (OPSS) which is already responsible for the implementation and enforcement of ecodesign regulations in the UK).
BENEFITS (£m)
Total Transition (Constant Price)Years
Average Annual (excl. Transition) (Constant
P i )
Total Benefit (Present Value)
Low (-20%) -
- 1,135 High (+20%) - - 1,704
Best Estimate
- 85 1,420 Description and scale of key monetised benefits by ‘main affected groups’ Net energy savings are expected to account for 86% of all monetised benefits leading to reduced energy bills for consumers (commercial and domestic). Reduction in CO2e and improved air quality levels account for the remaining monetised benefits.
Other key non-monetised benefits by ‘main affected groups’ A key non-monetised benefit is that requirements for electric motors and welding equipment will be consistent with those in the EU, creating open and fair competition. Additional benefits include a likely increase in innovation due to UK manufacturers having to make substantive improvements to their products. Key assumptions/sensitivities/risks Di t t (%)
3.5%

4
Most quantified costs and benefits have been provided by the Energy Using Products Policy model (described in Annexes 2 & 3). Sensitivities in the key input variables include product costs, sales/stock, use (hours/year), energy use and lifespan. The model assumes all costs appear at the point of purchase and are independent of sales. Non-monetised costs and benefits as well as modelling assumptions are considered to, collectively, have a positive effect on NPV.
BUSINESS ASSESSMENT (Option 2) Direct impact on business (Equivalent Annual) £m:
Score for Business Impact Target (qualifying provisions only) £m:
Costs: 20
Benefits: 64
Net: -44
-223

5
Contents
1 Problem under consideration and the rationale for intervention
7
2 Policy objective 9
3 Options considered 10
4 Overview of costs and benefits 17
4.1 Option 1: Do Nothing 18
4.2 Summary of costs and benefits of Option 2 22
4.3 Non monetised costs and benefits 25
4.3.1 Transitional Impacts 25
4.3.2 Enforcement and Compliance Costs 26
4.3.3 Distributional Impacts 28
4.3.4 Further Impacts 29
4.3.5 Trade Impacts 29
4.3.6 Further Impacts 31
4.4 Sensitivity analysis 31
4.5 Risks 34
4.6 Impact on UK businesses 35
4.6.1 Direct Costs and Benefits to UK Businesses 35
4.6.2 Other costs and benefits to business 36
4.6.3 Total costs and benefits to business 37
5 Electric motors 38
5.1 Electric motors: Overview 38
5.2 Electric motors: Costs and benefits of Option 2 42
5.2.1 Electric motors: Non-monetised costs and benefits 46
5.3 Electric motors: Sensitivity analysis 47
5.4 Electric motors: Risks 49
5.5 Electric motors: Impact on UK businesses 50
6 Welding Equipment 51
6.1 Welding equipment: Overview 51
6.2 Welding Equipment: Costs and benefits of Option 2 53
6.3 Welding equipment: Non-monetised costs and benefits 57
6.4 Welding equipment: Sensitivity analysis 57
6.5 Welding equipment: Risks 59

6
6.6 Welding equipment: Impact on UK businesses 60
7 Small and micro business assessment 61
8 Wider impacts 63
9 Summary and Implementation Plan 64
9.1 Summary 64
9.2 Implementation and Delivery Plan for Option 2 66
Annex 1 General modelling approach and key assumptions 68
A1.1 The model 68
A1.2 Input variables 69
A1.3 Lifespan (years) 70
A1.4 Costs (£) 70
A1.5 Modelling assumptions 71
A1.6 Modelling example 71
Annex 2 Specific modelling for electric motors 73
Annex 3 Specific Modelling for Welding Equipment 79
Annex 4 Competition Assessment 83
Annex 5 Wider Environmental Impacts Assessment 83
Annex 6 Definitions 84
Annex 7 Glossary of Terms 89

7
1 Problem under consideration and the rationale for intervention
1. The ecodesign framework sets minimum energy performance standards (MEPS)
and other environmental requirements that energy-related products (ERPs) must
meet to be placed on the market. This pushes industry to improve the energy
efficiency and reduce the environmental impact of products and thereby removes
the worst performing products from the market. Ecodesign requirements are
currently in place for 28 energy-related product groups including domestic
products such as washing machines and TVs, and commercial ones like
professional refrigeration and power transformers.
2. Ecodesign requirements have historically been set at an European Union (EU)
level through the Ecodesign legislative framework1. In January 2019, the UK, as
a Member State, agreed and voted in favour of updated ecodesign requirements
for electric motors and variable speed drives (‘electric motors’)2 and new
ecodesign requirements for electrical mains-operated welding equipment
(‘welding equipment’)3. The electric motor directive is a revised regulation4 and
welding equipment has no current ecodesign regulation. The UK Government
consulted stakeholders and carried out an internal cost-benefit analysis (CBA) for
both products prior to agreeing and voting in favour of these requirements which
showed the substantial environmental impact within the UK and the potential for
improvement in terms of energy performance and resource efficiency.
3. As the new EU regulations will apply from 1 July 2021 for electric motors and
from 1 January 2021 for welding equipment, they will not automatically apply in
Great Britain after the transition period ends on 31st December 2020.
1 Directive 2009/125/EC of the European Parliament and of the Council of 21 October 2009 establishing a framework for the setting of ecodesign requirements for energy-related products. Available at: https://eur-lex.europa.eu/legal-content/EN/TXT/?uri=CELEX:32009L0125. 2 Laying down ecodesign requirements for electric motors and variable speed drives pursuant to Directive 2009/125/EC of the European Parliament and of the Council, amending Regulation (EC) No 641/2009 with regard to ecodesign requirements for glandless standalone circulators and glandless circulators integrated in products and repealing Commission Regulation (EC) No 640/2009. Available at: https://ec.europa.eu/transparency/regcomitology/index.cfm?do=search.documentdetail&Dos_ID=17081&DS_ID=60021&Version=2 3 Laying down ecodesign requirements for welding equipment pursuant to Directive 2009/125/EC of the European Parliament and of the Council. Available at: https://ec.europa.eu/transparency/regcomitology/index.cfm?do=search.documentdetail&Dos_ID=17258&DS_ID=60644&Version=2

8
4. Whilst EU requirements on ecodesign for welding equipment and electric motors
will not apply in the Great Britain after the transition period ends, the proposed
GB regulations reflect what the UK agreed and supported at EU level.
5. The UK always taken a leading role in pushing for both ambitious and realistic
product requirements, and these new ecodesign and energy labelling regulations
reflect this. The UK voted in favour of the new EU requirements as a Member
State following a UK specific cost benefit analysis and informal consultation with
stakeholders. Furthermore, the measures carry significant benefits in relation to
realising the Government’s Carbon Budget and Net Zero targets and
implementing them in GB law means that we can reap these benefits after the
end of the Transition Period. This approach also reflects the commitment made
in the Clean Growth Strategy to maintain common high standards or go further
where it is in the UK’s interests.
6. This Impact Assessment examines the proposal to make product specific
regulations, to be in place after the transition period, using powers set out in the
Ecodesign for Energy-Related Products Regulations 2010, as amended by the
Ecodesign for Energy-Related Products and Energy Information (Amendment)
(EU Exit) Regulations 20194.
7. The proposed product specific regulations (referred to in this document as the
draft regulations) reflect what the UK agreed and supported as a Member State
at EU level in January 2019.
8. This is consistent with the Government’s intention to uphold common high
product standards wherever possible and appropriate, or even exceed them
where it is in the UK’s interests to do so, following the end of the transition period
9. The draft Regulations will apply in Great Britain only. In accordance with the
Northern Ireland Protocol (“NI protocol”), EU Ecodesign and Energy Labelling
Regulations will continue to apply in Northern Ireland post-transition period. The
costs and benefits in this Impact Assessment are currently calculated on a UK
basis. The effect of the NI protocol will be included in the final version of this
impact assessment following consultation.
4 The Ecodesign for Energy-Related Products and Energy Information (Amendment) (EU Exit) Regulations 2019 No. 539. Available at: http://www.legislation.gov.uk/uksi/2019/539/contents/made

9
2 Policy objective
10. Ecodesign requirements help to reduce the energy and resource consumption of
energy-related products by setting minimum mandatory requirements on energy
efficiency and resource efficiency. This removes poor performing products from
the market and drives the market towards more energy and resource efficient
products, thereby promoting a sustainable environment through regulation.
11. This policy represents a cost-effective way to reduce energy bills and carbon
emissions. Current estimates from the Department for Business, Energy &
Industrial Strategy (BEIS) show that existing ecodesign requirements will lead to
savings of 8 million tonnes of CO2 in 2020.
12. Updating ecodesign requirements for electric motors and setting ecodesign
requirements for welding equipment are key to making the UK more energy
efficient and supporting innovation, contributing in particular to the objectives set
out in the Clean Growth Strategy5 (‘accelerating clean growth’ and ‘helping
business become more productive’) and the Secretary of State’s priorities for
BEIS. Doing so will in particular:
• minimise energy bills for businesses;
• reduce greenhouse gas emissions;
• reduce the adverse environmental impacts of products;
• ensure effective regulation for industry; and
• drive innovation and support the transition to a low carbon economy.
13. The EU carried out a review from November 2014 to September 2017 on the
performance of the current requirements for electric motors as set out in
regulation (EC) No. 640/2009 and estimated significant energy savings would still
be achieved by the current regulation6. However, while the existing electric motor
regulation provided significant estimated energy savings, these requirements no
longer captured the energy savings potential due to improved performance linked
to technological progress. Further, requirements in countries such as the United
5 Clean Growth Strategy available at: https://assets.publishing.service.gov.uk/government/uploads/system/uploads/attachment_data/file/700496/clean-growth-strategy-correction-april-2018.pdf 6 Estimated 57TWh savings by 2020 at EU level. See: https://ec.europa.eu/transparency/regcomitology/index.cfm?do=search.documentdetail&Dos_ID=17081&DS_ID=60981&Version=1

10
States of America (USA)7 have become more stringent in recent years which
indicates there is potential to secure further energy savings. The requirements
proposed in these draft regulations are more ambitious than those in place in the
USA.
14. There are currently no ecodesign measures for welding equipment. In the
absence of regulation, there is no market competition to place on the market
energy efficient products. The volume of sales of welding equipment in the UK
annually is approximately 15,000 units8, and it has been estimated that through
improvements to design, welding equipment would present significant potential
for energy savings and improvements to resource efficiency. A preparatory study
was conducted at EU level prior to drafting the new regulations which explored
policy options, markets, users, technologies, the environment, economics, and
product design. Here it was found that ecodesign measures for welding
equipment could reduce electricity consumption by approximately 18% by 20309.
3 Options considered
15. For the purpose of this consultation stage Impact Assessment, two policy options
have been considered:– (1) Do Nothing and (2) set requirements to reflect what
the UK agreed at EU level as a Member State in January 2019. The preferred
option of (2) setting requirements which reflect what the UK agreed at EU level
as a Member State has been assessed against the Do Nothing option.
3.1 Rejected Options
16. Under the Ecodesign for Energy-Related Products Regulations 2010, as
amended by the Ecodesign for Energy-Related Products and Energy Information
(Amendment) (EU Exit) Regulations 2019, the Secretary of State must not
regulate an energy-related product that is the subject of self-regulation. For a
product to be the subject of self-regulation it must meet certain non-exhaustive
7 https://www.ecfr.gov/cgi-bin/text-idx?SID=1d4a3e47894c42e30b45a27277fbdf5d&mc=true&node=sp10.3.431.b&rgn=div6 8 Estimate based on PRODCOM trade data - average trade sales from 1998-2016. See Assumptions log (Annex 3) for further detail. 9 EuP Netzwerk Machine Tools Preparatory Studies. Available from: https://www.eup-network.de/product-groups/preparatory-studies/completed/ (see ENTR Lot 5)

11
criteria which evaluate the effectiveness of such self-regulation. Industry
representation for both products have, to date, not proposed any self-regulation
or voluntary scheme that meets these criteria.
17. No desire for self-regulation from the electric motors and welding equipment
sectors was expressed during the EU’s consultation process prior to the approval
of both of the EU regulations in 2019. For the welding equipment sector,
regulation of a wider machine tools package, which included welding equipment,
was considered at EU level in 2014. During consultation on the proposed EU
regulation for a machine tools package, an industry representative proposed a
framework for self-regulation for metalworking machine tools in particular10. This
proposal at EU level was ultimately unsuccessful due to insufficient market
coverage11. The complexities of the machine tools package, which included 9
different machine tool classifications, led to the scope of the regulation being
reassessed. This reassessment found that welding equipment was suitable for
ecodesign regulation, where clarity of requirements for both manufacturers and
end users was the main driver for regulation. Welding equipment industry
stakeholders agreed with this regulatory approach, citing legal certainty as the
reason11. Additionally, electric motors have been regulated in the UK through
ecodesign since 2009, and continuing this approach provides clarity and
continuity for UK businesses12.
18. Further, research suggests that voluntary agreements around energy efficiency
are best considered for products which are not regulated in other economies, or
where regulation is not practical13. Since mandatory requirements are practical
and indeed already exist in the USA and EU for electric motors and will be
introduced in the EU for welding equipment, we have ruled out self-regulation in
GB as a possible option.
10 CECIMO Self-Regulation Measure for Metalworking Machine Tools, Draft 4. Available from: https://www.eceee.org/static/media/uploads/site-2/ecodesign/products/machine-tools/annex-d-cecimo-srm-methodology-draft-4-20140409.pdf 11 IMPACT ASSESSMENT Accompanying the document Commission Regulation laying down ecodesign requirements for welding equipment pursuant to Directive 2009/125/EC of the European Parliament and of the Council. Available from: https://ec.europa.eu/info/law/better-regulation/initiatives/ares-2018-1092570_en 12 Commission Regulation (EC) No 640/2009 of 22 July 2009 implementing Directive 2005/32/EC of the European Parliament and of the Council with regard to ecodesign requirements for electric motors, https://eur-lex.europa.eu/legal-content/EN/TXT/?uri=CELEX%3A32009R0640 13 “Effectiveness of Energy Efficiency Voluntary Agreements”, The Policy Partners and SQ Consult, 2017. Available at: https://www.iea-4e.org/document/408/effectiveness-of-energy-efficiency-voluntary-agreements

12
19. We are not proposing at this point in time to exceed the ecodesign requirements
which reflect what the UK agreed at EU level as a Member State for electric
motors or welding equipment as we have yet to determine the technical potential
for going further and the associated carbon and bill savings to be gained. To do
so, we would need to engage extensively with stakeholders to gather the
evidence required and ensure more ambitious requirements offer a significant
additional net benefit to the UK. Given the new EU requirements apply from 1
January 2021 and from 1 July 2021 for welding equipment and electric motors
respectively we have ruled out, at this point, setting more ambitious GB
requirements, and our priority is to provide clarity and legal certainty to
stakeholders and to realise the associated energy and carbon savings these
requirements would bring. We are actively exploring setting better ecodesign and
energy labelling regulations in GB in the future, including where it would be
beneficial to exceed EU standards.
20. The draft regulations include review provisions for electric motors and welding
equipment of no later than 5 years and 6 years respectively from the application
dates of the draft regulations. This will allow the Government to consider more
ambitious requirements considering technological progress while also allowing
sufficient time for all provisions to be implemented and to understand market
penetration.
21. However, a Call for Evidence published in June 202014 explores the possibility of
raising ecodesign requirements for certain products categories in the UK which
could yield greater energy, resource, and carbon savings in the UK. Electric
motors are included in this Call for Evidence, alongside other products covered
by Ecodesign regulation. This will allow us to gather more UK-specific evidence
to support the potential raising of ecodesign standards in the future. This is
consistent with the Government’s intention to uphold common high product
standards wherever possible and appropriate, or even exceed them where it is in
the UK’s interests to do so, following the transition period.
14 Energy-related products: call for evidence. Available at: https://www.gov.uk/government/consultations/energy-related-products-call-for-evidence

13
22. In any case, we are satisfied that our preferred option will be the most ambitious
global standards to date for welding equipment and will introduce requirements in
the highest internationally recognised efficiency category (IE4) for some electric
motors.
23. The option of introducing energy labelling alongside ecodesign requirements has
been considered but ruled out as a possible option for both welding equipment
and electric motors. Energy labels, which display technical information and rate
the energy efficiency of products in classes (typically from A to G), are primarily
designed to provide technical information to non-technical consumers and help
guide their purchasing decisions.
24. As the market for professional welding equipment is almost completely business
to business, where buyers have specialist industry expertise in a niche market,
an energy label for welding equipment is expected to provide no additional
information for the professional end user which technical documents and a
product fiche could not. As well as this, while sufficient data is available to
determine ecodesign requirements for welding equipment, a more
comprehensive dataset detailing the efficiencies of welding equipment on the
market over the course of several years, is currently not available. This dataset
would be required to determine the efficiency range of the energy classes, and
so the introduction of an energy label is not possible at this time.
25. For electric motors, the option of energy labelling has been ruled out because in
most cases, they are purchased by Original Equipment Manufacturers (OEMs)
and integrated into a final product such as a washing machine, pump or
ventilation fan which is then purchased by retailers. OEMs may not always
choose the most efficient electric motor: this is rarely due to lack of information or
understanding. An energy label for electric motors would therefore create an
administrative burden while offering little, if any, possible gain. The draft
regulations for electric motors also cover variable speed drives (VSDs), which
are devices that can vary the speed of a motor. For VSDs, labelling may help to
highlight the benefits of new technologies, however these technologies are not
yet well-developed or used and so the option of energy labelling has been ruled

14
out for this regulation. The Energy Technology List (ETL) is already a source
OEMs can use to find the best performing (top 10%) electric motors15.
26. For electric motors, use of critical raw materials are minimal as products in scope
are AC induction motors which do not contain permanent magnets. Metal content
is generally very high, therefore achieving high recycling rates is unproblematic.
In addition, the reparability of electric motors is good, therefore it does not seem
proportionate to consider additional measures in support of Circular Economy
objectives or other environmental aspects for this product group16.
3.2 Options 1 & 2
27. The policy options under consideration are, therefore:
• Option 1 – Do Nothing: no update would be made to the existing
ecodesign requirements for electric motors and no ecodesign requirements
would be introduced for welding equipment in GB.
• Option 2 – Update existing ecodesign requirements for electric motors and
welding equipment that will apply from July 2021 for electric motors and as
soon as practicable after January 2021 for welding equipment, reflecting
what the UK agreed at EU level as a Member State in January 2019.
28. These draft regulations would apply from July 2021 for electric motors and as
soon as practicable after January 2021 for welding equipment. Manufacturers will
have to ensure that products placed on the GB market from these dates need to
comply with the draft regulations
29. Our intention has been to implement the draft regulations for welding equipment
in the UK in a way that minimises uncertainty for stakeholders. We are consulting
with stakeholders to get their views and intend to publish a Government
response to that consultation later in 2020, which we hope will provide clarity to
stakeholders about GB’s position ahead of the welding equipment regulations
taking effect in the EU. The legislation will follow in early 2021.
15 ETL, https://www.carbontrust.com/ETL/purchasers/?kw=energy-technology-list-Exact&gclid=CjwKCAiAx_DwBRAfEiwA3vwZYmMVjxacIiaT5JJl-u8T-I_b2ZzkVGqJK2IdYeRpbeM_7PU4wKFeEhoCDsYQAvD_BwE 16 COMMISSION REGULATION (EU) - laying down ecodesign requirements for electric motors and variable speed drives pursuant to Directive 2009/125/EC of the European Parliament and of the Council and repealing Commission Regulation (EC) No 640/2009 Available at: https://ec.europa.eu/transparency/regdoc/rep/10102/2019/EN/SWD-2019-343-F1-EN-MAIN-PART-1.PDF

15
30. Electric motors on the GB market by July 2021, when the draft applications begin
to apply, that already comply with the existing regulation (regulation (EC) No.
640/2009) can continue being sold. Electric motors placed on the market before
1st July 2029 as substitutes for identical electric motors integrated in products
placed on the market before 1st July 2022 can also continue be sold.
31. Welding equipment already placed on the GB market after the draft regulation
begin to apply that do not meet the new requirements can continue to be sold.
32. Option 2 consists of updating existing ecodesign requirements for electric motors
and introducing ecodesign requirements for welding equipment, reflecting what
the UK agreed at EU level as a Member state in January 2019, and is our
preferred option. The UK agreed and supported the new ecodesign requirements
at EU level at the end of a lengthy consultative process. The process for both
products included:
• a preparatory study17 – at an EU level – which explored policy options,
markets, users, technologies, the environment, economics, and product
design. This process involved several public EU wide stakeholder
meetings in which the UK participated.
• an initial ecodesign working draft regulation shared with Member States
and relevant stakeholders, (including UK stakeholders), for review prior to
the Consultation Forum.
• a Consultation Forum, attended by Member State Officials, key
manufacturers and Non-governmental Organisations (including from the
UK)
• notification18 of the draft regulation to the World Trade Organisation
(WTO) for a period of 60 days.
17 EuP Netzwerk Preparatory Studies. Available from: https://www.eup-network.de/product-groups/preparatory-studies/completed/ (see Lot 30 for electric motors and ENTR Lot 5 for welding equipment). 18 Electric Motors WTO notification. Available at: https://ec.europa.eu/growth/tools-databases/tbt/en/search/?tbtaction=search.detail&Country_ID=EU&num=614&dspLang=en&basdatedeb=21/10/2018&basdatefin=02/11/2018&baspays=&basnotifnum=&basnotifnum2=&bastypepays=ANY&baskeywords= Welding equipment WTO notification. Available at: https://ec.europa.eu/growth/tools-databases/tbt/en/search/?tbtaction=search.detail&Country_ID=EU&num=622&dspLang=en&basdatedeb=01/11/2018&basdatefin=03/12/2018&baspays=&basnotifnum=&basnotifnum2=&bastypepays=ANY&baskeywords=

16
• publication of the draft regulation for the relevant product on European
Commission’s feedback mechanism portal19.
• a Regulatory Committee where the EU regulation was discussed and
voted on by Member State Officials (including the UK)3.
33. Although the requirements were agreed at EU level, the UK Government
consulted with UK stakeholders and carrier out an internal Cost Benefit Analysis
prior to voting in favour of the EU regulations. The volume of expertise feeding
into the studies, along with a substantive EU consultation, reduces the risk of
these draft regulations being disproportionate or unrealistic.
34. We are proposing to implement these requirements in GB law after the end of the
transition period as they carry significant benefits in relation to realising the
Governments Carbon Budget and Net Zero targets. This approach also reflects
the commitment made in the Clean Growth Strategy to maintain existing high
standards or go further where it is in the UK’s interests.
35. The Do Nothing option has also been considered and the impacts assessed.
Under this scenario, the current EU regulation for electric motors will be
incorporated into GB law at the end of the transition period and there would
continue to be no regulation for welding equipment. The updated requirements
agreed by the UK as a Member State at EU level in January 2019 would not
automatically apply if GB after the end of the transition period. The impacts of GB
and the EU having different ecodesign requirements have been taken into
account when assessing the Do Nothing option.
19 European Commission feedback mechanism for electric motors. Available at: https://ec.europa.eu/info/law/better-regulation/initiatives/ares-2018-5354258_en European Commission feedback mechanism for welding equipment. Available at: https://ec.europa.eu/info/law/better-regulation/initiatives/ares-2018-1092570_en

17
4 Overview of costs and benefits
36. This section outlines the costs and benefits examined in this Impact Assessment,
including the costs to businesses. High-level figures are provided, along with
general arguments as to the costs and benefits considered (and not considered).
More specific information is provided in section 5 (electric motors) and section 6
(welding equipment).
37. The draft Regulations will apply in Great Britain only. In accordance with the NI
Protocol, EU Ecodesign and Energy Labelling Regulations will continue to apply
in Northern Ireland post-transition period. The costs and benefits in this Impact
Assessment are currently calculated on a UK basis. The effect of the NI protocol
will be included in the final version of this impact assessment following
consultation.
38. A 30-year appraisal period (2021/22 to 2050/51) was chosen considering the
average lifespans for electric motors and welding equipment. Data suggest that a
typical lifetime for welding equipment is 13 years and around 14 years for electric
motors (see Table 19 in Annex 3 and Table 18 in Annex 2). Therefore, 30 years
broadly represents a timeframe over which most of the existing stock of both
products will be replaced with models that are compliant under the new
requirements, and the full energy savings realised over their lifetime.
39. At present, we assume additionality of 50% for this Impact Assessment.
Additionality reflects the adjustment we make to the overall costs and benefits of
the policy intervention to reflect the fact that a proportion of these would occur in
the counterfactual (in this case due to the fact that the regulations will be in force
in the EU/US regardless of whether we implement them or not, and the
concerned markets are global ones). Therefore, we estimate that half of the total
costs and benefits to business and consumers would be realised. We will
assume this estimate until further evidence is gathered at the consultation stage.
An example of such evidence that would help to inform our current estimate
would be information around the current number of UK manufacturers of electric
motors, and manufacturers of welding equipment. This estimate may then be
revised based on feedback from UK stakeholders and any further evidence

18
provided, including on the impact of the NI protocol, that is able to inform further
analysis.
40. A change in additionality factor causes the NPV to either decrease or increase
proportionally, but it cannot result in the NPV becoming negative. For example,
25% additionality would reduce the NPV by four, relative to the 100%
additionality scenario.
4.1 Option 1: Do Nothing
41. The ‘Do Nothing’ option represents no regulatory change for electric motors and
no implementation of regulation for welding equipment. The existing regulation
would continue to apply to certain classes of electric motors, and there would
continue to be no ecodesign regulation for welding equipment, and any electric
motors currently not covered by the existing regulation. This option would,
therefore, have no direct impact on manufacturers although there would be an
indirect impact from not maintaining consistency with respect to these particular
products – potentially impacting on competitiveness and innovation. For those
that sell solely in the GB market, the current regulation (regulation (EC) No.
640/2009) for electric motors would continue to apply in GB in the same way as
before EU exit. UK manufacturers that export either product to the EU, could face
trade complications given that GB’s requirements would not align with the EU’s.
42. For welding equipment, the main reason why this option has not been pursued
further is that, without regulation, manufacturing decisions and consumer
behaviour would likely be dictated by performance and cost rather than energy
efficiency or resource efficiency. Several market failures show this to be the case
and the associated negative externalities are described below.
• Firstly, without standardised information on energy and resource efficiency
being provided through product information fiches, buyers cannot compare
products and make better and more informed purchasing decisions20.
Since there is no standardisation, manufacturers tend to choose the
20 IMPACT ASSESSMENT Accompanying the document Commission Regulation laying down ecodesign requirements for welding equipment pursuant to Directive 2009/125/EC of the European Parliament and of the Council. Available from: https://ec.europa.eu/info/law/better-regulation/initiatives/ares-2018-1092570_en

19
equipment tests which lets them show their own products in the best
possible light20. This makes completely accurate and unbiased
comparisons extremely difficult for end-users, when making purchase
decisions.
• Secondly, the majority of users often prioritise performance and low
purchasing cost over reducing energy costs or increasing environmental
savings during the use phase14. A lack of interest from a majority of
customers can perpetuate a lack of functional information20. Together,
these factors result in an environment that does not stimulate investments
and efforts towards designing more efficient products.
• Thirdly, split incentives between owners of welding equipment and clients,
who cover energy costs, mean buyers have little concern about energy
efficiency. Without clear, up to date energy efficiency requirements
including information provision, the evidence that the products will be cost-
effective over their lifetime is lost.
43. Low efficiency welding equipment from Asia, particularly China, are increasingly
present in the UK market20. In 2012 China introduced energy efficiency standards
for welding equipment, and as low efficiency welding equipment is phased out of
the Chinese market, these low efficient products may be dumped into the GB
market as an alternative in a Do Nothing scenario.
44. Although welding equipment has a modest carbon footprint, estimated 0.3 million
tonnes of CO2 equivalent21 (in the UK), compared to some other products under
ecodesign regulation, the European Commission’s preparatory study17 showed
welding equipment to have the potential for greater energy and resource
efficiency, using available technology.
45. Welding equipment is often designed with permanently fixed components, joints
and complex fastening techniques, that make disassembly for repair, reuse, and
recycle by the end user difficult. In a Do Nothing scenario, the market will not be
21 Estimate based on 2012 values in Preparatory Study Task 4 – Table 4-85. Scale factor of 0.15 (UK proportion of total EU GDP) used to calculate UK carbon footprint value using Eurostat table https://ec.europa.eu/eurostat/tgm/refreshTableAction.do;jsessionid=XL5lWrHc6qvWmGaYpgwiSnulfA6wWUpegid78mwSMtGB4hSCNK3Z!-1987023697?tab=table&plugin=1&pcode=tec00001&language=en

20
incentivised to design welding equipment in a manner that improves resource
efficiency.
46. Similar market failures to those outlined in paragraph 34 apply to the electric
motor industry, creating the same negative externalities within the industry.
Firstly, it is common practice for an OEM to have fixed budgets for operational
and capital costs. Therefore, the electric motor with the lowest purchase price is
usually chosen, as there is little to no regard for the running costs, which may be
high22. Secondly, OEMs tend to postpone the replacement of expired equipment,
often far beyond its duty life22, creating a situation where less efficient products
are in use for extended periods of time. Thirdly, many, particularly smaller,
electric motors are manufactured with the intention to be incorporated into
intermediate goods which are sold further down the supply chain. In these
instances, the manufacturer of the equipment usually has no incentive to
purchase energy-efficient electric motors as they will not benefit from reduced
running costs22.
47. A major concern shared by industry stakeholders during BEIS consultation is that
a marked difference in ecodesign regulation of electric motors between the EU
and GB, such as would be created if GB did not implement the proposed
regulations, would create substantial barriers to trade, as UK exporters of electric
motors or welding equipment would not be able to sell products in the EU market.
This would not be addressed in a Do Nothing scenario.
48. UK manufacturers that export products to the EU or globally, may face trade
complications given that GB’s requirements would not align with the EU’s or
always align globally. If GB lags behind, the competition in the EU or globally
may change focus from innovation and quality to price. For UK manufacturers
who export, the use of the current standard in ecodesign and energy labelling
would result in double testing of the products (according to the GB standard and
the EU/global standard), in which case UK manufacturers would be able to
compete but at an increased cost (due to increased testing). Alternatively, it will
22 COMMISSION REGULATION (EU) - laying down ecodesign requirements for electric motors and variable speed drives pursuant to Directive 2009/125/EC of the European Parliament and of the Council and repealing Commission Regulation (EC) No 640/2009 Available at: https://ec.europa.eu/transparency/regdoc/rep/10102/2019/EN/SWD-2019-343-F1-EN-MAIN-PART-1.PDF

21
result in testing of the products according to the current standard only, in which
case they would not be able to compete on the EU/global market.
49. In a Do Nothing scenario, there may be scope to assume that UK manufacturers
who do not export may be less motivated to innovate and produce products that
comply with global requirements, as focus is likely to be shifted to price
competition over increasing energy efficiency. Hence, the market and regulatory
failures would persist, harmonised information on energy consumption would not
be systematically generated and consumers would not be able to differentiate
between high-efficient and low-/average-efficient appliances. So the potential
carbon emission and energy bill savings (see Section 4.2) would not be realised.
50. Under the Do Nothing option, there also may be scope for assuming that UK
manufacturers would comply with the new EU requirements once they come into
force due to economies of scale and the potential ease of meeting the
requirements and/or because energy consumption is viewed as an important
factor for such products. This would have the effect of GB having the same
requirements as the EU without regulation. If this were to occur, broadly the
same costs would still apply as under Option 2 (since enforcement and
compliance costs are negligible compared with overall costs). We consider the
risk of businesses not complying with EU requirements, however.
51. Additionally, another reason why this option has not been pursued further is the
assumed UK proportion of electric motors or welding equipment that are
imported. Currently, BEIS desk-based research suggests that the UK imports
almost all electric motor products and welding equipment products. For non-UK
manufacturers who either choose not to plan or fail to plan and adjust to the new
EU regulations, there may be an excess supply of products that do not comply
with the new EU regulations. Thus, temporarily those products may reach the GB
market and have carbon and energy bill savings impacts. However, we expect
this to be minimal as it would be a short-term effect but will seek stakeholders’
views on this as part of our consultation.
4.2 Summary of costs and benefits of Option 2
52. Table 1 outlines the key costs and benefits that have been identified as relevant.
The final column indicates how these have been considered in this Impact
Assessment.

22
53. The draft regulations will impose a real cost (see Table 1) on electric motors
manufacturers, and welding equipment manufacturers. For the purposes of this
Impact Assessment, we assume that manufacturers operate in competitive
markets and increased costs are passed on to the end consumers. This may be
achieved through a marginal increase in the price of all products that are
impacted, or through a more substantial increase to a sub-set of products that
the manufacturer produces. If markets are not competitive, manufacturers may
choose to absorb the increase in cost through reduced profits. However, we
have no evidence that this will occur and therefore do not assume this is the case
when undertaking our analysis.
Table 1: Summary costs and benefits of updating the ecodesign requirements for electric motors and welding equipment (Option 2)
Group Type of cost / benefit Included in CBA or described qualitatively?
Business/ industry
Costs Transitional (one-off) costs of
implementing the policy, including familiarisation costs of understanding the requirements. These are likely to be minimal, however, as requirements for electric motors already exist, and the updated requirements for electric motors will align with the IE3 efficiency standard. Welding equipment meeting the new requirements are already on the market and investments in R&D already exist.
Described Qualitatively (although assumed to be passed on to consumers and therefore accounted for in the CBA).

23
Group Type of cost / benefit Included in CBA or described qualitatively?
Increased manufacturing costs including any such transitional costs. These are assumed to be passed onto consumers - any increase in costs however would be offset by energy savings.
Included in CBA.
Benefits Product requirements facilitating
trade Described Qualitatively.
Possible increased innovation leading to longer lasting, more efficient products in order to compete in the global market.
Described Qualitatively.
Environmental benefits of improved resource efficiency (for welding equipment only), for example, improved recyclability and repairability.
Described Qualitatively.
Consumers (including businesses who purchase products)
Costs Higher price of products at the
point of purchase (although offset by lower energy bills).
Included in CBA.
Reduction in consumer choice (if some product types are removed from the market) yet this is balanced against the benefit above of innovation, leading to new products on the market.
Described Qualitatively.
Benefits Lower energy bills over the lifetime
of the product due to increased energy efficiency performance.
Included in CBA.
Wider society
Costs Enforcement costs of imposing
requirements. Costs are assumed to be negligible compared with the costs of products especially since efficiency requirements already exist for electric motors.
Described Qualitatively.
Benefits
Lower electricity system costs – due to a reduction in energy use of the products.
Included in CBA.

24
Group Type of cost / benefit Included in CBA or described qualitatively?
Carbon savings/reduction in greenhouse gas emissions.
Included in CBA.
Air quality improvements. Included in CBA. Possible creation of new jobs
driven by the need to innovate and improve.
Described Qualitatively.
54. Table 2 provides the high-level cost and benefit estimates of Policy Option 2
according to the costs and benefits outlined above for electric motors and
welding equipment. Option 2 (costed against the Do Nothing option) shows a Net
Present Value (NPV) of £1,047m with a benefit-cost ratio of around 4:1. Electrical
energy savings are expected to be around 22,000 GWh over the appraisal period
(2021/22-2050/51) amounting to 1.5 million tonnes of Carbon Dioxide equivalent
(CO2e). More detail is provided in the sections which follow.
Table 2: Estimated Costs and Benefits of Policy Option 2, 2021/22 to 2050/51
Costs/benefits, £m Electric motors Welding equipment Total
Costs to manufacturers (assumed to be passed onto consumers) 371 2 373
Total Costs (A) 371 2 373
Value of energy savings (net) 1,210 12 1,223
Value of reduction in CO2e emissions 105 1 106
Net benefits of air quality improvements 90 1 91
Total Benefits (B) 1,405 14.2 1,420
Net Present Value (B–A) 1,034 13 1,047
Benefit Cost Ratio (B/A) 4 7 4
Data in the main body of this Impact Assessment are presented in 2021 prices and present value (and, therefore differ from those on the front page which are 2016 prices and 2017 present values). Total figures may appear to not add up due to rounding.
55. All calculations were sourced from the BEIS Energy Using Products Policy
(EUPP) Model which takes into consideration the costs and benefits associated
with updating existing ecodesign requirements for each product separately.

25
56. The modelling takes into consideration different sub-technologies, using:
• forecasted sales/stock figures;
• estimates for additional costs arising from producing products compliant
with the draft regulations under Option 2 compared with Option 1;
• forecasted level of usage (in hours/year);
• estimates for the energy usage (in kWh), again for products compliant with
the draft regulations under Option 2 compared with Option 1; and
• the expected lifespan of products (before a replacement is required).
57. High-level descriptions of the modelling approach are outlined in the following
sections along with the outputs. More detailed descriptions are provided in Annex
1 to Annex 3, along with the key modelling assumptions.
4.3 Non monetised costs and benefits
58. This section examines the additional costs and benefits that, for proportionality
reasons, have not been monetised. To indirectly take these into account in the
CBA, sensitivity analysis has been undertaken (in Section 4.4).
4.3.1 Transitional Impacts
59. Generally, transitional (one-off) costs of implementing the policy, include
familiarisation costs of understanding the requirements, and are inclusive of
training staff and setting up IT.
60. For both products, we expect that a rise in transition costs would be offset by
increases in product prices, and these are implicitly included within these
increases in prices.
61. For electric motors, given that the draft regulation would be a revision of existing
regulation, transitional costs are expected to be minimal as the general
processes are already established. Manufacturers are already required to
provide technical details and the above information would be readily available to
them. The EU’s additional assessment of their review study into regulations for

26
electric motors23 concluded that additional costs such as approbation, changes in
packaging, marking etc would be negligible.
62. For welding equipment, there is currently “no legislation at EU level or in EU
Member States that would foster energy or resource efficiency regarding welding
equipment”24. This makes it difficult to qualitatively assess the potential
transitional costs for welding equipment manufacturers resulting from policy
Option 2. The EU expects transitional costs to be moderate, particularly for small
and micro sized businesses (SMBs), given the increasing difficulty that
manufacturers face in accessing new technologies and efficient components in
the highly competitive market, for which prices are increasing24. Based on this,
we assume that UK SMBs are involved in the same market, so we expect their
transition costs to be moderate too.
4.3.2 Resource Efficiency
63. Ecodesign requirements for resource efficiency are being introduced for the first
time for ERPs through these draft regulations for welding equipment. These
resource efficiency requirements should not conflict with the energy efficiency
requirements.
64. Resource efficiency covers requirements such as those to ensure that welding
equipment are designed in such a way as to facilitate reuse, repair and recycling
of the product. Resource efficiency also includes information requirements where
specific information is required in instruction manuals and on free to access
websites. This includes the manufacturers name and product type, parameters
related to energy efficiency, and information on expected utilisation rates of
shielding gas and welding wire or filler. Resource efficiency is an important
aspect as these measures can increase the lifespan of the product and reduce a
products end of life environmental impact. Information requirements can also
23 COMMISSION REGULATION (EU) - laying down ecodesign requirements for electric motors and variable speed drives pursuant to Directive 2009/125/EC of the European Parliament and of the Council and repealing Commission Regulation (EC) No 640/2009 Available at: https://ec.europa.eu/transparency/regdoc/rep/10102/2019/EN/SWD-2019-343-F1-EN-MAIN-PART-1.PDF 24 IMPACT ASSESSMENT Accompanying the document Commission Regulation laying down ecodesign requirements for welding equipment pursuant to Directive 2009/125/EC of the European Parliament and of the Council, 2019. Available at: https://ec.europa.eu/info/law/better-regulation/initiatives/ares-2018-1092570_en

27
fundamentally affect the consumption rate of welding wire and shielding gas
which can be expensive to produce.
65. The overall savings of resource efficiency requirements however were not
quantified. These savings were assessed qualitatively and predicted to be
modest in comparison to the energy efficiency savings. Several uncertainties
around these requirements have also been identified (see paragraphs 57-59),
which make the resource efficiency measures unable to be accurately quantified.
66. Resource efficiency requirements require welding equipment to be designed in
such a way that spare parts can be accessed and removed with commonly
available tools. This is regarded as a simple measure and the cost of compliance
is presumed to be very low because it requires little production adaptation. How
much exactly this change in design will change manufacturing cost however is
uncertain, as well as the extent of design change for different types of welding
equipment.
67. The information requirements are intended to make repair easier by providing
repair instructions. It is uncertain how many welding equipment owners will be
aware of the requirements regarding availability of spare parts and access to
repair and maintenance information, and thus how many will take advantage of
the requirements. The requirements should make repairing welding equipment
easier, but it is uncertain how much the repair of welding equipment will increase
and subsequently how many welding equipment will see their lifespan increased.
68. There is also uncertainty over the cost of repairing a piece of welding equipment
compared to the cost of replacing one. The additional costs when repairing
include labour costs (a professional repairer is required) and cost of delivering
spare parts. There are also carbon costs associated with the manufacturing of
these spare parts and their delivery, as well as travel for professional repairers.
The draft regulations state that: ‘Manufacturers, authorised representatives or
importers may charge reasonable and proportionate fees for access to the repair
and maintenance information or for receiving regular updates.’ The charge which
manufacturers could put in place is unknown and therefore could not be
quantified. Additionally, spare parts must be delivered within 15 days so some
welding equipment owners may choose to replace their equipment rather than
wait for repair if their need for the welding equipment is urgent.

28
69. The resource efficiency requirements require indicative shielding gas, welding
wire or filler material utilisation to be provided. While we expect material
consumption to drop due to this measure, the extent to which it will is uncertain,
as material consumption is dependent upon the skill of the welder as well as the
weld type itself24.
70. Additionally, the measures do not prevent manufacturers from recovering costs
through higher prices for their welding equipment, as they can argue for
increased lifespan of the product as well as reduced energy costs.
71. Resource efficiency was considered for electric motors and discounted, primarily
because the recyclability of electric motors is already high and the use of critical
raw materials is minimal.
72. For the reasons discussed above, the costs associated with resource efficiency
are expected to be small in relation to overall costs and benefits of the policy
option. Monetising such costs is, therefore, considered disproportionate.
However, any such costs may fall disproportionately on to smaller businesses
and are therefore considered in the Small and Micro Business Assessment
(SAMBA).
4.3.3 Enforcement and Compliance Costs
73. Enforcement and compliance costs are not easily quantified. Enforcement action
would be undertaken where the market surveillance authority (MSA) believed
there was sufficient risk-based justification to do so, in line with their enforcement
policy25. Additional costs are, however, considered minimal given that
requirements already exist for electric motors and would continue to apply under
the Do Nothing Option.
74. As suggested in HM Government’s OIOO (One-In, One-Out) Methodology26, the
cost and benefits calculated have assumed 100% compliance since we have no
evidence to suggest it would be otherwise. Lack of compliance would, however,
impact on both costs and savings. Given the uncertainty, and the scale of the
25 OPSS enforcement policy, May 2018. Available at: https://assets.publishing.service.gov.uk/government/uploads/system/uploads/attachment_data/file/712141/safety-and-standards-enforcement-enforcement-policy.pdf. 26 HM Government’s OIOU (One-In, One-Out) Methodology, July 2011. Available at: http://ec.europa.eu/smart-regulation/refit/admin_burden/best_practice_report/docs/5.pdf.

29
impact, differing levels of compliance are implicitly investigated through the
Sensitivity Analysis (see Section 4.4 and the corresponding sections for electric
motors and welding equipment specifically).
4.3.4 Distributional Impacts
75. In setting ecodesign requirements, the European Commission took distributional
impacts into account. A key constraint in setting requirements is that those
should have no significant negative impact on consumers as regards to the
affordability and the life cycle cost of the product1. Although more efficient
products may have marginally higher up-front cost, businesses will see savings
from their energy bills.
4.3.1 Trade Impacts
76. In terms of impact on UK trade with the EU, the proposed Ecodesign
requirements are expected to facilitate UK-EU trade of industrial products27. For
electric motors, in terms of estimated total import and export quantity (tons), the
UK imports 62% from the EU and exports 74% to the EU. But in terms of
estimated monetary value (£), 64% of the UK’s total imports are imported from
the EU, and 40% of the UK’s total exports are exported to the EU. The remaining
majority of UK imports and exports of electric motors (for both quantity and value)
are largely comprised of UK-Asia trade.
77. For welding equipment, in terms of estimated total import and export quantity
(tons), the UK imports 54% from the EU and exports 42% to the EU27. But in
terms of estimated monetary value (£), 64% of the UK’s total imports are
imported from the EU, and 38% of the UK’s total exports are exported to the
EU27. The remaining majority of UK imports and exports of welding equipment
(for both quantity and value) are largely comprised of UK-Asia trade.
78. Therefore, the UK imports and exports large quantities of industrial goods from
and to the EU, and the value of trade with the EU is very high, given over half of
UK imports and just over a third of UK exports are attributed to trade with the EU.
27 All trade data was sourced from the International Trade Centre (ITC) Trade Map using the following 6-digit level HS codes: [Electric Motors - 850120; 850121; 850140; 850151; 850152; 850153; 850300] [Welding Equipment – 846880; 851531; 851539]. For both quantity and value, a 2017-2019 average total was taken. ITC Trade Map available at: https://www.trademap.org/

30
Since the EU will be committing to the proposed Ecodesign requirements, UK
imports of industrial products in terms of both quantity and value, will likely not
change significantly, given that prices are not expected to rise significantly20,35.
For similar reasons, UK exports too are likely to not change significantly, as it
would most likely not be in UK businesses’ best interest to forego nearly three
quarters of the sector’s export value, unless there was certainty that this value of
trade could be achieved elsewhere.
79. The effect on UK-USA trade of industrial products will also likely not change
significantly, even though Ecodesign requirements will differ. This is because for
electric motors, the UK only imports and exports (in terms of total quantity) an
estimated 2% and 8% respectively, amounting to 10% of total UK import value
and 15% of total UK export value for electric motors27. Likewise, for welding
equipment, the UK only imports and exports (in terms of total quantity) an
estimated 2% and 13% respectively, amounting to 4% of total UK import value
and 23% of total UK export value for welding equipment27.
80. UK imports of industrial products from USA could decline slightly, given that
lower energy efficiency standard industrial products from the USA would not be
able to be sold in the UK market. But because imports in terms of both quantity
and value are minute compared to UK-EU imports for example, this is unlikely to
change UK-USA trade significantly. Similarly, UK exports to the USA are
expected to remain unaffected, as these will meet USA Ecodesign requirements,
and prices should broadly remain unchanged.
81. However, it is not possible to ascertain from the data who exactly imports and
exports white goods, so the individual impacts on trade, e.g. for manufacturers,
cannot be commented on at this stage. We will seek to understand these impacts
however, through consultation with stakeholders.
4.3.6 Further Impacts
82. We have not attempted to monetise the direct costs, under Option 2, of the
potential effect that the UK’s increasing requirements for electric motors and
welding equipment could have on innovation. Requiring UK manufacturers to
improve efficiency would create considerable opportunities to innovate, which
has possible benefits such as improved consumer choice, investment in industry,
and knowledge spill-over. However, it was considered disproportionate to

31
quantify this given the complexity and the uncertainty in the level of innovation
that might be achieved.
83. For the same reasons, it was considered disproportionate to attempt to quantify
the additional benefit of Option 2 in maintaining consistency with respect to these
particular products with EU manufacturers (in particular for ease of trade with the
EU) or, similarly, the costs of Option 1 in manufacturers having different
requirements to comply with.
4.4 Sensitivity analysis
84. Annex 1 provides an overview of the model used for the CBA and, as expected,
several considered modelling assumptions have been made which carry varying
levels of uncertainty. These are explained in detail for each product in Table 18
and Table 19.
85. Table 3 below indicates the relative sensitivity of a variable and how this affects
the overall costs/benefits. A variable with a ‘high’ risk rating has 1.5 times the
percentage uncertainty of a ‘medium’ risk rating variable, and a ‘low’ risk rating
variable has half of the uncertainty of a medium risk variable. Variables used in
the modelling are proportional to the NPV, therefore those with a higher risk
rating are more sensitive to variations in modelling.

32
Table 3: Outline of the sensitivity of the model by variable
A change of ±10% in the variables is used as the base uncertainty which is then multiplied by the risk factor (1.5 for high; 1 for medium; 0.5 for low risk) to obtain the percentage impact change.
Variable Risk rating Impact on Costs
Impact on benefits
Comment
Cost (£) Medium The cost value could change by up to ±10%, resulting in a ±10% change to overall costs.
None. The model assumes Costs and Stock/Sales figures are independent, therefore, a change in the cost of products has no impact on the volume of products sold/in stock. Benefits therefore remain unaffected.
Sales/Stock
Medium The sales/stock value could change by up to ±10%, resulting in a ±10% change to overall costs.
The sales/stock value could change by up to ±10%, resulting in a ±10% change to overall benefits.
Overall costs and benefits are directly proportional to the size of the Sales/Stock.
Use (hours/year)
Medium None. The use value could change by up to ±10%, resulting in a ±10% change to overall benefits.
The number of hours in a year a product is used has no effect on costs (since use does not affect the lifetime in the model nor on sales/stocks) but is directly proportionate to the overall energy use, and hence benefits.
Energy Use (kW)
Medium None. The energy use value could change by up to ±10%, resulting in a ±10% change to overall benefits.
The power used by a product has no effect on costs (to buy the product) but is directly proportionate to the overall energy use, and hence benefits.

33
86. A range of costs and benefits were considered to model potential divergence in
the actual input variables from those estimated by the model. These consider
both divergence in future values from those estimated as well as un-monetised
costs and benefits, including compliance.
28 The variation in our additionality estimate will primarily depend on the extent to which the ecodesign requirements under Option 2, and the effect of the NI protocol, prevent less energy efficient products reaching the UK.
Lifespan Low Related. Related. The products’ lifespan in the model affects both the costs and benefits but not proportionately. The shorter the lifespan, the greater the costs and benefits (due to the older stock being replaced more quickly).
Additionality
High Directly related. Directly related. A change in the additionality assumption has a proportional effect on the costs and benefits, and therefore NPV. We consider it possible that additionality of each product could vary by +/-25%28.

34
4.5 Risks
87. In the following sections, we consider the specific risks associated with the
models behind electric motors and welding equipment. In general, however:
• Figures assume all costs will be incurred by UK consumers. Some costs may be
absorbed by non-UK businesses (manufacturers and/or retailers in the supply
chain) which will reduce the costs to the UK.
• Future sales figures are, perhaps, the most uncertain of the input variables.
However, as described in Annex 1, these affect both costs and benefits in the
same proportion. While any such changes may well affect the scale of the NPV,
they alone should not result in the NPV becoming negative.
• Similarly, lower than 100% compliance figures would likely affect costs as well as
benefits. Although some consumers may still end up buying products which do
not meet the requirements, they are likely to do so at a lower cost.
• The costs included in Table 3 do not include those incurred by businesses
potentially adhering to multiple requirements (under Option 1) or the additional
benefits that ease of trade with the EU under this option would bring. Further,
there are additional benefits of Option 1 with respect to innovation and increasing
competitiveness, in line with the UK’s Industrial Strategy. While hard to monetise,
their impact (of increasing the NPV for Option 2) cannot be ignored when
considering these scenarios.
• The energy consumption modelled under Option 1 does not consider a potential
increase in stock of less efficient products entering the UK market under this
scenario. The realised benefits of Option 2 are, therefore, likely to be an
underestimate.
• Although future energy costs are uncertain, changes would affect both options
considered in the CBA.
• The model does not account for the link between costs and sales. However, if the
manufacturing costs were higher than expected, the possible corresponding
reduction in sales would constrain the scale of the impact on the overall costs.
• Resource efficiency is only considered qualitatively, as the overall savings are
disproportionate compared to energy savings, and there was difficulty in
quantifying all resource efficiency measures.
88. For those reasons, we consider a reduction in the NPV for either product unlikely.

35
4.6 Impact on UK businesses
4.6.1 Direct Costs and Benefits to UK Businesses
89. This section considers the costs and benefits of the proposal to UK businesses. It
is restricted to UK-based manufacturers and UK business purchases of electric
motors and welding equipment. The proposed requirements have no impact on
products manufactured in the UK and exported since manufacturers are only
obliged to meet the requirements of the country they are exporting to.
90. As per the guidance from BEIS29, we consider only the direct costs to businesses
here. These include manufacturing costs which, elsewhere, are assumed to be
passed onto consumers.
91. During the consultation process, we will seek views on the proportion of each
respective product that are imported into the UK. Currently, we are able to
identify information that provides evidence of the existence of few UK
manufacturers involved in the welding equipment sector, but we do not currently
have sufficient evidence that could provide a more definitive figure. In Table 4
below, we present the direct costs for the range 90% to 100%. All three
scenarios show a positive Business NPV within the range £149m to £195m.
Analysis suggests that the crossover to a negative NPV occurs when the
percentage of imports is around 58%. Given that 95% is currently considered a
conservative estimate, we are confident that the true proportion is not lower than
58% and that the impact on businesses is, therefore, positive overall.
92. For UK-based manufacturers selling within the UK, the direct costs determined to
be in scope are the:
• Ongoing costs of producing policy-compliant products. These include
the increased variable costs of, for example, more expensive component
parts and/or more advanced/expensive manufacturing processes.
• Short-term, transitional costs of changing manufacturing processes and becoming familiar with the draft regulations. Manufacturers will
have to invest resources (staff costs) into understanding how this affects
29 Business Impact Target: statutory guidance, 2019. Available at: https://assets.publishing.service.gov.uk/government/uploads/system/uploads/attachment_data/file/776507/Busines__Impact_Target_Statutory__Guidance_January_2019.pdf

36
them as well as the physical resources required to adhere to the draft
regulations, including testing equipment and new IT/software purchases.
As per Section 4.3, these costs are not monetised here as they are
considered negligible in this case.
93. Given both electric motors and welding equipment are non-domestic products,
we also consider all purchase costs to be direct business costs since the
requirements will increase the cost of their purchases. However, business
consumers that are the end-users of these products will also see reduced energy
costs. Since these energy savings would be automatic through use of their
compliant purchases – and not from a change in behaviour – we also consider
these to be direct. When considering business purchases from UK
manufacturers, we need only consider either the manufacturing or purchase
costs to avoid double-counting.
94. Reduction in greenhouse gas emissions and improvement in air-quality are
assumed to be benefits for the wider society and have, therefore, not been
considered for businesses.
4.6.2 Other costs and benefits to business
95. Other benefits of Option 2 to manufacturers (see Section 4.3) include maintaining
consistency with respect to these products with manufacturers outside the UK
and a likely increase in innovation, raising competitiveness. Since these are
indirect costs, they have not been considered here.

37
4.6.3 Total costs and benefits to business
96. Table 4 below shows the overall direct costs and benefits to UK businesses.
Sections 5.5 and 6.6 provide greater detail for electric motors and welding
equipment respectively.
Table 4: Summary of costs and benefits to businesses (under the 100% import scenario, 2021 prices).
Costs/benefits, £m Overall costs
Direct Business Costs (£m)
Electric motors
Welding equipment
Total
Costs to manufacturers/business purchasers
373 371 2 373
Total Costs (A) 373 371 2 373
Value energy savings (net) 1,223 1,210 12 1,223
Value of reduction in CO2e emissions 106 0 0 0
Net benefits of air quality improvements 91 0 0 0
Total Benefits (B) 1,421 1,210 12 1,223
Net Present Value (B–A) 1,048 839 11 850
Note that totals may not appear to add up due to rounding.

38
97. Table 5 below shows the related Business Net Present Value and Business
Impact Target Score.
Table 5: Equivalent Annualised Net Direct Cost to Business (EANDCB) and Business Net Present Value for Option 2 (under the 100% import scenario).
Total [2021 Prices, 2021 present value (£m)]
Electric motors Welding equipment
Business Net Present Value 850 839 10.8
EANDCB30 -45 -44 -0.6
Score for Business Impact Target (BIT) -223 -220 -2.8
5 Electric motors
98. Section 4 provided an overview of the costs and benefits of Option 2. This
section examines those specifically for electric motors. It begins with a detailed
description of the product itself and the proposed requirements.
5.1 Electric motors: Overview
99. Electric motors convert electrical energy into mechanical energy. Most electric
motors operate through the interaction between the motor’s magnetic field and
electrical current in a wire winding to generating force in the form of rotation of a
shaft. The draft regulations also cover VSDs, which are devices that can vary the
speed of a motor. The electric motors in scope are globally traded goods, based
on International Electrotechnical Commission (IEC) standards.
100. The scope of the draft regulations covers products which:
• are induction electric motors without brushes, commutators, slip rings or
electrical connections to the rotor, rated for operation on a 50 Hz, 60 Hz or
50/60 Hz sinusoidal voltage, that:
30 The Equivalent Annual Cost is calculated by dividing the net present value through an annuity rate. This rate can be calculated using the formula: a = (1+r)/r * [1- 1/(1+r)^ t], where r is the interest rate (3.5%) and t is the number of years over which the NPV has been calculated (31).

39
o have two, four, six or eight poles;
o have a rated voltage UN above 50 V up to and including 1000 V;
o have a rated power output PN from 0.12 kW up to and
including1000 kW;
o are rated on the basis of continuous duty operation; and
o are rated for direct on-line operation.
101. The draft regulations also cover VSDs with 3 phases input which:
• are rated for operating with an electric motor within the 0.12 kW - 1000 kW
motor rated output range;
• have a rated voltage above 100 V and up to and including 1000 V AC; and
• have only one alternating current (AC) voltage output.
102. The following products are excluded from the draft regulations:
• motors with an integrated brake which forms an integral part of the inner
motor construction and can neither be removed nor powered by a
separate power source during the testing of the motor efficiency;
• electric motors specified to operate exclusively:
o at altitudes exceeding 4000 metres above sea-level;
o where ambient air temperatures exceed 60°C;
o in maximum operating temperature above 400°C;
o where ambient air temperatures are less than −30°C; or
o where the water coolant temperature at the inlet to a product is below
0°C or above 32°C.
• electric motors designed and specified to operate wholly immersed in a
liquid;
• electric motors specifically qualified for the safety of nuclear installations,
as defined in Article 3 of Council Directive 2009/71/EURATOM31;
• electric motors in cordless or battery-operated equipment;
• electric motors in hand-held equipment whose weight is supported by
hand during operation;
31Council Directive 2009/71/Euratom of 25 June 2009 establishing a Community framework for the nuclear safety of nuclear installations (OJ L 172, 2.7.2009, p. 18).

40
• electric motors in hand-guided mobile equipment moved while in
operation;
• electric motors with mechanical commutators;
• Totally Enclosed Non-Ventilated (TENV) motors;
• electric motors placed on the market not later than 1 July 2029 as
substitutes for identical motors integrated in products and placed on the
market no later than 1 July 2022;
• multi-speed electric motors, i.e. motors with multiple windings or with a
switchable winding, providing a different number of poles and speeds;
• motors designed specifically for the traction of electric vehicles;
• electric motors with an integrated variable speed drive (compact drives)
whose energy performance cannot be tested independently from the
variable speed drive; and
• electric motors completely integrated into a product (for example into a
gear, pump, fan or compressor) and whose energy performance cannot
be tested independently from the product, even with the provision of a
temporary end-shield and drive-end bearing. The motor must share
common components (apart from connectors such as bolts) with the
driven unit (for example, a shaft or housing) and shall not be designed in
such a way that the motor can be separated in its entirety from the driven
unit and operate independently. For a motor to be exempt from
performance requirements, the process of separation must render it
inoperative
103. The following VSDs are exempt from the efficiency requirements of the draft
regulations, but must meet the product information requirements:
• VSDs integrated into a product and whose energy performance cannot be
tested independently from the product;
• VSDs qualified specifically for the safety of nuclear installations, as
defined Article 3 of Directive 2009/71/EURATOM; and
• regenerative drives; and
• drives with sinusoidal input current.
104. The draft regulations also make a seven year exemption for electric motors
supplied as spare parts. As energy efficient motors have different characteristics

41
than standard motors – often they are heavier, larger and have higher inertia – it
is not always practical to replace an existing electric motor with a more energy
efficient model. This would often require some re-engineering which sometimes
proves uneconomical and the old product is instead replaced, which is not an
optimal solution for resource efficiency. This seven year exemption is a
pragmatic solution that may slow down the replacement of inefficient motors,
however it favours the repairability of products into which the electric motors are
integrated.
105. Around 6 million electric motors are sold in the UK annually. Annual sales
outputs were extracted based on data from a 2003 BSRIA study, the Carbon
Trust Technology guide 2011 and the 2014 preparatory study for Lot 30 and the
(Table 18, Annex 2), under the assumption that stock remains constant over
time. The breakdown of sales in 2018 is as follows:
• 0.12-0.75kW single phase motors – 75% of market.
• 0.12-0.75kW multi-phase motors – 13% of the market.
• 0.75-11kW – 12% of the market.
• 15-132kW - <1% of the market.
106. The ratio of quantity of electric motor imports to exports in 2018 was around
5:1, with half of the imports originating from China32. The traded value of the total
imports and exports was €74m and €85m respectively, demonstrating that the
value of electric motors exported by the UK is almost 6 times as much per kg as
those imported. This indicates that the UK exports a relatively small number of
high value electric motors, whilst importing a comparatively large number of low
value electric motors.
107. The European Commission’s most recent preparatory study on electric motors
concluded that even though the existing regulation has had a positive impact on
the environment, due to technological change and more stringent requirements
internationally the existing regulation needed updating to secure further energy
savings. It also concluded that large savings can be made on products currently
excluded from the regulation. The energy efficiency potential lies in both the
32 http://epp.eurostat.ec.europa.eu/newxtweb/

42
significant quantities of small electric motors traded each year and the more
significant per-product savings that can be made in large electric motors.
5.2 Electric motors: Costs and benefits of Option 2
108. The Energy Using Products (EUP) CBA model was split into seven separate
sub-models based on motor size, each examining the impact of the regulatory
changes. The sub-models are split based on the following size ranges: 0.12 – 0.7
kW; 0.75 – 2 kW; 3 – 4 kW; 5 – 11 kW; 15 – 30 kW; and 37 – 120 kW.
109. Electric motors in the 0.12 – 0.7 kW sub-model are further split between single-
and multi-phase as the granularity of the data allowed it. The remaining sub-
models all concern multi-phase electric motors exclusively. Single-phase, single-
speed electric motors in the power range above 0.75 kW were not considered as
they have a relatively low performance compared with 3-phase equivalents,
hence have a declining market share33.
110. Each model uses the following inputs which are generated from raw data:
• forecasted sales/stocks figures;
• forecasted levels of usage (in hours/year);
• average load factor;
• average power demand (in kW);
• technology (“Tech”) demand values;
• expected electric motor lifespan (before a replacement is required);
• cost of new products for each efficiency class.
• Forecasted sales/stocks figures are split between fixed-speed motors and
variable-speed motors. Further, the figures are split between electric
motor efficiency classes. A more detailed description is provided in Annex
2.
111. The numbers below in Table 6 and Table 7 show the effects of the proposed
ecodesign requirements for electric motors compared with Option 1 (Do Nothing).
Low and high scenarios of ±10% have been presented as indicative variances
from the central estimate due to unknown uncertainty. Based on more in-depth
33 EuP Netzwerk Preparatory Studies. Available from: https://www.eup-network.de/product-groups/preparatory-studies/completed/ (see Lot 30 for electric motors)

43
sensitivity analysis provided in Section 4.4 which considers the sensitivity of each
variable used in the modelling, ±10% is the maximum range for which costs and
benefits could vary. Figure 1 and Figure 2 show the cumulative costs/benefits
and energy savings respectively for the central estimate.
Table 6: Discounted costs summary for electric motors (2021 prices)
£m Low
(-10%) Central
High (+10%)
Costs to manufacturers (assumed to be passed onto consumers)
334 371 408
Total costs of increase in non-traded CO2e emissions 0 0 0
TOTAL 334 371 408
Table 7: Discounted benefits summary for electric motors (2021 prices)
£m Low (-10%)
Central High
(+10%)
Value of energy savings 1,089 1,210 1,331
Value of reduction in CO2e emissions 95 105 116
Net benefits of air quality improvements 81 90 99
TOTAL 1,265 1,405 1,546 Figures have been rounded so may not appear to sum correctly.

44
Figure 1: Estimated energy use under Options 1 (Do Nothing) 34and 2 (updating ecodesign requirements) for electric motors and the cumulative energy savings of implementing Option 2.
34 Note that for Option 1 (Do Nothing), energy savings (GWh) also occur as we assume that some consumers of electric motors will take into account energy efficiency when purchasing, given that they will be utilised for long periods of a day. The savings, however, are less than the energy savings that we forecast to occur under the preferred option, Option 2.
Cumulative savings(right axis)
Option 2: New requirements
Option 1: Do nothing
118,000
119,000
120,000
121,000
122,000
123,000
124,000
125,000
126,000
127,000
128,000
20/2
121
/22
22/2
323
/24
24/2
525
/26
26/2
727
/28
28/2
929
/30
30/3
131
/32
32/3
333
/34
34/3
535
/36
36/3
737
/38
38/3
939
/40
40/4
141
/42
42/4
343
/44
44/4
545
/46
46/4
747
/48
48/4
949
/50
50/5
1
-
5,000
10,000
15,000
20,000
25,000
GWh/yr GWh

45
Figure 2: Cumulative costs and benefits of Option 2 for electric motors (2021 prices).
Note that the modelling includes cost-scaling whereby, towards the end of the appraisal period, costs reduce year-on-year. This considers products whose costs would be incurred but benefits only partially realised during the appraisal period. 112. The draft regulations for electric motors delivers an estimated NPV of £1,034m
and is expected to save around 21,725 GWh of electrical energy and 1.5 million
tonnes of CO2e over the appraisal period (2021/22 to 2050/51). Annual energy
savings amount to around 1,000 GWh a year by the end of the appraisal period.
113. Annual energy savings (the difference between the estimated energy use of
the two options) increase year-on-year at the start of the appraisal period (Figure
1) as the non-compliant stock gradually gets replaced by electric motors which
meet the requirements under Option 2. Once the stock has largely been replaced
(by around 2034/35, annual energy savings remain broadly static. Additional
costs under Option 2 occur at the point of purchase only, whereas the energy
saving benefits are accrued over the lifetime of the product. This results in
Costs
Benefits
0
200
400
600
800
1,000
1,200
1,400
1,600
20/2
121
/22
22/2
323
/24
24/2
525
/26
26/2
727
/28
28/2
929
/30
30/3
131
/32
32/3
333
/34
34/3
535
/36
36/3
737
/38
38/3
939
/40
40/4
141
/42
42/4
343
/44
44/4
545
/46
46/4
747
/48
48/4
949
/50
50/5
1
£m

46
cumulative costs exceeding benefits (Figure 2) during the early part of the
appraisal period, only providing a positive NPV (where benefits exceed costs)
from 2027 onwards. It is also the reason why the modelling scales down costs
towards the end of the appraisal period (as shown in Figure 2). Not scaling would
result in all the costs, yet only part of the benefits, being considered for products
purchased towards the end of the appraisal period, negatively affecting the NPV.
5.2.1 Electric motors: Non-monetised costs and benefits
114. This section examines the additional costs and benefits that, for proportionality
reasons, have not been monetised. To indirectly take these into account in the
CBA, sensitivity analysis has been undertaken in Section 5.3.
115. Specifically, for electric motors, there would be costs associated with the
requirements to declare in the technical documentation the:
• rated efficiency at the full, 75% an 50% rated load and voltage;
• efficiency level: ‘IE2’, ‘IE3’ or ‘IE4’;
• manufacturer’s name or trade mark, commercial registration number and
address;
• product’s model identifier;
• number of poles of the motor;
• the rated power output(s) or range of rated power outputs (kW);
• the rated input frequency(s) of the motor (Hz);
• the rated voltage(s) or range of rated voltages (V);
• the rated speed(s) or range of rated speed (rpm);
• whether single-phase or three-phase;
• information on the range of operating conditions for which the electric
motor is designed:
o altitudes above sea-level;
o minimum and maximum ambient air temperatures, including for
electric motors with air cooling;
o water coolant temperature at the inlet to the product, where
applicable;
o maximum operating temperature; and
o potentially explosive atmospheres.

47
• if the motor is considered exempt from the efficiency requirement, the
reason why it is exempt; and
• from July 2022, the power losses expressed in percentage of the rated
power output at the different operating points for speed versus torque:
(25;25) (25;100) (50;25) (50;50) (50;100) (90;50) (90;100) determined
based on 25°C ambient reference temperature, rounded to one decimal
place. If the electric motor is not suitable for operation at any of these
operating points, then ‘N.A’ or ‘Not Applicable’ should be indicated.
116. Manufacturers are already required to provide technical details and the above
information would be readily available to them. Industry stakeholders have stated
that changing production from IE2 to IE3 does not require new assembly or
production plants. Only one-off redesign is required in the implementation of
Option 2 which also necessitates reinvestment to replace older tools35.
117. Although the draft regulations would be a revision of existing regulation,
transitional costs are not expected to be minimal despite the general processes
being already established.
118. However, these costs will be small in relation to overall costs and benefits of
the policy option. Monetising such costs is therefore considered disproportionate.
However, any such costs may fall disproportionately on to smaller businesses
and are therefore considered in the Small and Micro Business Assessment
(SAMBA) in Section 7.
119. Further, compliance and distributional costs were considered negligible as
outlined in Section 4.3. Similarly, additional benefits of innovation due to UK
manufacturers being required to improve efficiency and in maintaining
consistency for these particular products with non-UK manufacturers (particularly
for ease of trade with the EU) were not considered.
5.3 Electric motors: Sensitivity analysis
120. Figure 3 below indicates the impact on the NPV over the appraisal years with
up to 30% adjustments from the central costs and benefit estimates. Note that
35 IMPACT ASSESSMENT Accompanying the document Commission Regulation laying down ecodesign requirements for electric motors and variable speed drives pursuant to Directive 2009/125/EC of the European Parliament and of the Council. Available from: https://ec.europa.eu/info/law/better-regulation/initiative/1962/publication/5779759/attachment/090166e5c7e0a011_en

48
the extremities of the bands constitute a 10/20/30% increase (decrease) in costs
along with a 10/20/30% decrease (increase) in benefits.
121. The 20% scenario is the highest variation in the costs and benefits, and
therefore NPV, that is considered possible. Higher variation than this is
considered unrealistic based on the assumptions used in the modelling but is
represented by the 30% increase/decrease scenario. See section 4.4 for further
detail.
Figure 3: Chart showing the range of the NPV over the appraisal period with up to 30% adjustments from the central cost and benefit estimates (2021 prices).
The green area shows the range of NPV where costs/benefits vary up to 10% from the central estimates, orange within 20% and red, 30%.
122. Table 8 below provides more detailed costs for the +/- 20% scenario (the
orange areas in Figure 3) compared with the central estimates.
Table 8: Costs, benefits and NPV for electric motors under high (+20%) and low (-20%) scenarios over the entire appraisal period (2021/22 to 2050/51).
All values are in 2021 prices, £m Electric motors
-150
50
250
450
650
850
1,050
1,250
1,450
1,650
-100
100
300
500
700
900
1,100
1,300
1,500
1,700
20/21 25/26 30/31 35/36 40/41 45/46 50/51
NPV, £m

49
Low (-20%) costs 297
Central Costs 371
High (+20%) costs 445
Low (-20%) benefits 1,124
Central Benefits 1,405
High (+20%) benefits 1,687
Low NPV (high costs, low benefits) 679
Central NPV 1,034
High NPV (low costs, high benefits) 1,390
123. Under the high costs (+20%) and low benefits (-20%) scenario (Low NPV),
there would be an estimated NPV of £679M over the appraisal period (2021/22 to
2050/51) compared with £1,034M under the expected scenario. This would arise
from, say, a 20% increase in costs of the products under Option 2 compared with
the Do Nothing, along with a combined 20% decrease in the expected energy
savings from the legislation (due to, for example, a 20% reduction in the
expected annual energy use). A reduction in costs by 20% and a similar
proportional increase in energy savings would, however, deliver an NPV of
around £1,390M.
124. An increase in costs of around 60%, together with a 60% decrease in benefits,
represents the tipping point at which the NPV becomes negative. The next
section examines the likelihood of such a divergence.
5.4 Electric motors: Risks
125. This section outlines the potential risks associated with the costs and benefits
of the policy along with possible mitigations. The main risks identified with the
analysis in this Impact Assessment relate to the cost and benefit estimates,
particularly whether the costs identified could be higher and/or benefits lower
than expected, resulting in the NPV becoming negative.
126. The risks around each variable have been considered in Table 18 of Annex 2
through the assumptions log along with mitigations where relevant. The following
high-level results can be drawn from the log:

50
• 4 medium risk assumptions have been identified: load factor, usage,
lifespan and price/cost estimates.
• 2 high risk assumptions have been identified: Power demand and
stock/sales. Stock and sales figures, however, affect both costs and
benefits proportionately and, given the sensitivity analysis above, we
consider it highly unlikely that these risks, if realised, will cause the net
benefit of the policy to be negative.
5.5 Electric motors: Impact on UK businesses
127. Table 9 below splits out the total costs and benefits into those which fall directly
to businesses. A 100% import scenario has been assumed in the modelling.
Table 9 Summary of costs and benefits to businesses – electric motors (2021 prices).
Costs/benefits, £m Option 2 Of which direct business costs
Costs to manufacturers/business purchasers 371 371
Total Costs (A) 371 371
Value energy savings (net) 1210 1210
Value of reduction in CO2e emissions 105 0
Net benefits of air quality improvements 90 0
Total Benefits (B) 1405 1210
Net Present Value (B–A) 1034 839 Note that totals may not appear to add up due to rounding. 128. Using the BEIS Impact Assessment Calculator, the provisional EANDCB of the
preferred policy option (Option 2) is set out in Table 10 below, alongside the
Business NPV and Business Impact Target Score.
Table 10: EANDCB and Business Net Present Value for Option 2 – electric motors (under the 100% imported scenario)

51
2021 Prices, 2021 present value (£m)
Business Net Present Value 839
EANDCB36 -44
Score for BIT -220
6 Welding Equipment
129. Section 4 provided an overview of the costs and benefits of Option 2. This
section examines those specifically for welding equipment. It begins with a
detailed description of the product itself and the proposed requirements.
6.1 Welding equipment: Overview
130. Welding equipment are products that deliver energy in the form of electricity to
join or cut two or more metals by heating (often >6,000°C), with or without the
use of ancillary materials such as filler sticks, wire, or gases that shield the
welding area from the surrounding air. Welding equipment uses electricity, to
produce an ‘arc’ to melt, join, braze, solder and cut materials.
131. Welding equipment in scope can be stationary or transportable, and consists of
linked parts or components, at least one of which moves and which are joined
together to produce coalescence of metals by heating them to the welding
temperature (with or without the application of pressure) or by the application of
pressure alone, with or without the use of filler metal, and with or without the use
of shielding gas(es), using appropriate tools and techniques, resulting in a
product of defined geometry.
132. Welding equipment products within the scope of the draft regulations are
professional business-to-business products used in industry. Light duty welding
units (business-to-consumer products) are excluded from the scope of the
proposed measures. Four specific technology types of professional welding units
are also excluded, due to their niche applications. These are:
36 The Equivalent Annual Cost is calculated by dividing the net present value through an annuity rate. This rate can be calculated using the formula: a = (1+r)/r * [1- 1/(1+r)^ t], where r is the interest rate (3.5%) and t is the number of years over which the NPV has been calculated (31).

52
• submerged arc welding;
• limited-duty arc welding;
• resistance welding; and
• stud welding devices.
133. Around 15,000 welding equipment units are sold in the UK annually37. Welding
equipment collectively consume a significant amount of energy. Export values for
UK varied from €3.4m to €29.7m and import varied from €7.3m to 35.0m in the
last 20 years. Additionally, the price of an average product varied from €111 to
€4,24138.
134. The European Commission’s preparatory study39 states that on average, a
typical arc welding unit has a primary continuous power consumption of 6.2 kVA
(arc-on), equalling at 75% efficiency at 200 A and output power of 4.65 kW
(23.25 V). It was found that most of these units are used in 1-shift-operations and
a realistic arc-on-time (i.e. operating factor) is 25%. This operating factor might
be much lower in smaller repair shops or in the construction sector, where the
welding equipment is used only occasionally and higher in industrial production,
where a similar welding unit might be used at high load in an automated
production line. It is estimated that welding equipment use 307 GWh per year
(2020/21) in the UK (see Figure 4).
135. The European Commission’s most recent preparatory study on welding
equipment concluded that by 2030, there is potential for significant energy
savings by introducing ecodesign regulations to welding equipment39. There is
scope for improvements in the energy efficiency of welding equipment which
would be in line with technological developments. There is also the potential to
use fewer resources and contribute to the circular economy through improved
repairability and recyclability by introducing resource efficiency requirements. In
addition to these points, it is expected that introducing requirements for energy
37 Estimate based on PRODCOM trade data - average trade sales from 1998-2016. See Assumptions log (Annex 3) for further detail. 38 UK trade data sourced from: https://madb.europa.eu/madb/statistical_form.htm using HS code for welding equipment ‘HS 851539’ 39 EuP Netzwerk Machine Tools Preparatory Studies. Available from: https://www.eup-network.de/product-groups/preparatory-studies/completed/ (see ENTR Lot 5)

53
and resource efficiency could boost UK manufacturers’ competitiveness on the
global market.
136. Internationally only China has legislation which regulates the energy efficiency
of arc welding equipment, regulation/standard GB 28736-2012 (entitled ‘Minimum
allowable values of energy efficiency and energy efficiency grades for arc
welding machines’)40, which has been in place since 2012. This standard applies
to professional arc welding equipment which enter the Chinese market and
includes both mandatory and voluntary requirements.
137. Introducing requirements in GB as set out in Option 2 will require
manufacturers to:
• ensure that the minimum power source efficiency of welding equipment
should not be lower than the values set out in the draft GB regulations;
• ensure that the maximum idle state power consumption of welding
equipment should not exceed the values set out in the draft GB
regulations;
• meet certain resource efficiency obligations such as regards the
availability of and access to spare parts and maintenance information to
facilitate repairs;
• indicate the use of welding wire or filler material in grams per minute or
equivalent standardised units of measurement where a display is provided
for welding equipment;
• ensure that welding equipment are designed in such a way that certain
materials and components, as set out in the draft regulations, can be
removed with the use of commonly available tools;
• provide in their instruction manuals for users and on free to access
websites the information set out in the draft regulations;
• state the year of manufacture on the rating plate of welding equipment.
40 GB 28736-2012 Minimum allowable values of energy efficiency grades for arc welding machines from https://www.chinesestandard.net/PDF/English.aspx/GB28736-2012

54
6.2 Welding Equipment: Costs and benefits of Option 2
138. The CBA was based on one model (see Annex 3), examining the impact of the
regulatory changes on welding equipment.
139. The numbers below in Table 11 and Table 12 show the effects of the proposed
ecodesign requirements for welding equipment compared with Option 1 (Do
Nothing). Low and high scenarios of ±10% have been presented as indicative
variances from the central estimate due to unknown uncertainty. Based on more
in-depth sensitivity analysis provided in Section 4.4 which considers the
sensitivity of each variable used in the modelling, ±10% is the maximum range
for which costs and benefits could vary. Figure 4 and Figure 5 show the
cumulative costs/benefits and energy savings respectively for the central
estimate.
Table 11: Discounted costs summary for welding equipment (2021 prices)
£m Low (-10%)
Central High (+10%)
Costs to manufacturers (assumed to be passed onto consumers)
1.3 1.5 1.6
TOTAL 1.3 1.5 1.6 .
Table 12: Discounted benefits summary for welding equipment (2021 prices)
£m Low (-10%)
Central High (+10%)
Value of energy savings 11.0 12.2 13.4
Value of reduction in CO2e emissions 1.0 1.1 1.3
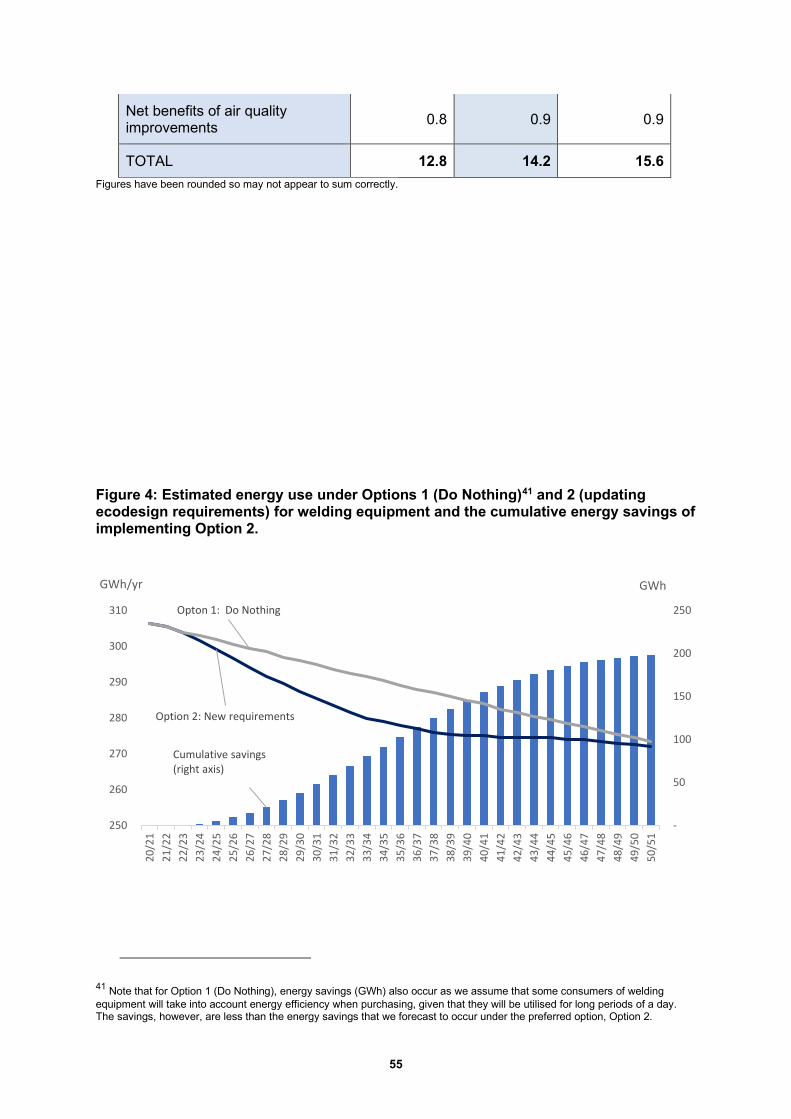
55
Net benefits of air quality improvements 0.8 0.9 0.9
TOTAL 12.8 14.2 15.6 Figures have been rounded so may not appear to sum correctly.
Figure 4: Estimated energy use under Options 1 (Do Nothing)41 and 2 (updating ecodesign requirements) for welding equipment and the cumulative energy savings of implementing Option 2.
41 Note that for Option 1 (Do Nothing), energy savings (GWh) also occur as we assume that some consumers of welding equipment will take into account energy efficiency when purchasing, given that they will be utilised for long periods of a day. The savings, however, are less than the energy savings that we forecast to occur under the preferred option, Option 2.
Cumulative savings(right axis)
Option 2: New requirements
Opton 1: Do Nothing
250
260
270
280
290
300
310
20/2
121
/22
22/2
323
/24
24/2
525
/26
26/2
727
/28
28/2
929
/30
30/3
131
/32
32/3
333
/34
34/3
535
/36
36/3
737
/38
38/3
939
/40
40/4
141
/42
42/4
343
/44
44/4
545
/46
46/4
747
/48
48/4
949
/50
50/5
1
-
50
100
150
200
250
GWh/yr GWh

56
Figure 5: Cumulative costs and benefits of Option 2 for welding equipment (2021 prices).
Note that the modelling includes cost-scaling whereby, towards the end of the appraisal period, costs reduce year-on-year. This considers products whose costs would be incurred but benefits only partially realised during the appraisal period. 140. The draft regulations for welding equipment deliver an estimated NPV of
£12.8M and is expected to save around 200 GWh of electrical energy and 17,000
tonnes of CO2e over the appraisal period (2021/22 to 2050/51). Annual energy
savings amount to around 2 GWh a year by the end of the appraisal period.
141. Annual energy savings (the difference between the estimated energy use of
the two options) increase year-on-year at the start of the appraisal period (Figure
4) as the non-compliant stock gradually gets replaced by welding equipment
which meet the requirements under Option 2. Once the stock has largely been
replaced (by around 2034/35), annual energy savings remain broadly static.
Additional costs under Option 2 occur at the point of purchase only, whereas the
energy saving benefits are accrued over the lifetime of the product. This results
in cumulative costs exceeding benefits (Figure 5) during the early part of the
appraisal period, only providing a positive NPV (where benefits exceed costs)
from 2024 onwards (2024 difference not visible in Figure 5). It is also the reason
why the modelling scales down the additional costs towards the end of the
appraisal period (as shown in Figure 5). Not scaling would result in all the costs,
yet only part of the benefits, being considered for products purchased towards
the end of the appraisal period, negatively affecting the NPV.
CostsBenefits
0
2
4
6
8
10
12
14
16
20/2
121
/22
22/2
323
/24
24/2
525
/26
26/2
727
/28
28/2
929
/30
30/3
131
/32
32/3
333
/34
34/3
535
/36
36/3
737
/38
38/3
939
/40
40/4
141
/42
42/4
343
/44
44/4
545
/46
46/4
747
/48
48/4
949
/50
50/5
1
£m

57
6.3 Welding equipment: Non-monetised costs and benefits
142. This section examines the additional costs and benefits that, for proportionality
reasons, have not been monetised. To indirectly take these into account in the
CBA, sensitivity analysis has been undertaken in Section 6.4.
143. Specifically, for welding equipment, there would be costs associated with the
requirements to provide, on websites and instruction manuals, the following:
• the product type;
• the manufacturer’s name, registered trade name and registered address
at which they can be contacted;
• the product model identifier;
• the power source efficiency (in %);
• the idle state power consumption (in watts);
• a list of equivalent models;
• information relevant to recycling and disposal at end-of-life;
• a list of critical raw materials present in indicative amounts higher than 1
gram at component level, if any, and an indication of the component(s) in
which these critical raw materials are present;
• indicative shielding gas utilisation for representative welding schedules
and programmes; and
• indicative welding wire or filler material utilisation for representative
welding schedules and programmes.
144. Manufacturers would have to provide on the rating plate of welding equipment
the following:
• the year of manufacture.
145. The overall savings of resource efficiency measures are considered modest in
comparison to the energy savings. Moreover, it is not possible to quantify all
resource efficiency measures.
6.4 Welding equipment: Sensitivity analysis
146. Figure 6 below indicates the impact on the NPV over the appraisal years with
up to 30% adjustments from the central costs and benefit estimates. Note that
the extremities of the bands constitute a 10/20/30% increase (decrease) in costs
along with a 10/20/30% decrease (increase) in benefits.

58
147. The 20% scenario is the highest variation in the costs and benefits, and
therefore NPV, that is considered possible. Higher variation than this is
considered unrealistic based on the assumptions used in the modelling but is
represented by the 30% increase/decrease scenario. See Section 4.4 for further
detail.
Figure 6: Chart showing the range of the NPV over the appraisal period with up to 30% adjustments from the central cost and benefit estimates (2021 prices).
The green area shows the range of NPV where costs/benefits vary up to 10% from the central estimates, orange within 20% and red, 30%.
148. Table 13 below provides more detailed costs for the +/- 20% scenario (the
orange areas in Figure 8) compared with the central estimates.
Table 13: Costs, benefits and NPV for welding equipment under high (+20%) and low (-20%) scenarios over the entire appraisal period (2021/22 to 2050/51).
All values are in 2021 prices, £m Welding equipment
Low (-20%) costs 1.2
Central Costs 1.5
High (+20%) costs 1.8
Low (-20%) benefits 11.4
Central Benefits 14.2
-2
3
8
13
18
-2 - 2 4 6 8
10 12 14 16 18 20
20/21 25/26 30/31 35/36 40/41 45/46 50/51
NPV, £m

59
High (+20%) benefits 17.1
Low NPV (high costs, low benefits) 9.6
Central NPV 12.8
High NPV (low costs, high benefits) 15.9
149. Under the high costs (+20%) and low benefits (-20%) scenario (Low NPV),
there would be an estimated NPV of £9.6m over the appraisal period (2021/22 to
2050/51) compared with £12.8m under the expected scenario. This would arise
from, say, a 20% increase in costs of the products under Option 2 compared with
the Do Nothing, along with a combined 20% decrease in the expected energy
savings from the legislation (due to, for example, a 20% reduction in the
expected annual energy use). A reduction in costs by 20% and a similar
proportional increase in energy savings would, however, deliver an NPV of
around £15.9M.
150. An increase in costs of around 80%, together with an 80% decrease in
benefits, represents the tipping point at which the NPV becomes negative. The
next section examines the likelihood of such a divergence.
6.5 Welding equipment: Risks
151. This section outlines the potential risks associated with the costs and benefits
of the policy along with possible mitigations. The main risks identified with the
analysis in this Impact Assessment relate to the cost and benefit estimates,
particularly whether the costs identified could be higher and/or benefits lower
than expected, resulting in the NPV becoming negative.
152. The risks around each variable have been considered in Table 19 of Annex 3
through the assumptions log along with mitigations where relevant. The following
high-level results can be drawn from the log:
• 2 low risk assumptions have been identified: market and usage.
• 3 medium risk assumptions have been identified: sales, lifespan, cost.
• 2 high risk assumptions have been identified: Energy consumption and
efficiency. However, given the sensitivity analysis above, we consider it
highly unlikely that these risks will affect the overall net benefit of the policy.

60
6.6 Welding equipment: Impact on UK businesses
153. Table 14 below splits out the total costs and benefits into those which fall
directly to businesses. A 100% import scenario has been assumed in the
modelling.
Table 14 Summary of costs and those directly impacting on UK businesses – welding equipment (2021 prices).
Costs/benefits, £m Total (£m) (Option 2)
Direct Business Cost (£m)
Costs to manufacturers/business purchasers 1.5 1.5
Total Costs (A) 1.5 1.5
Value energy savings (net) 12.2 12.2
Value of reduction in CO2e emissions 1.1 0.0
Net benefits of air quality improvements
0.9 0.0
Total Benefits (B) 14.2 12.2
Net Present Value (B–A) 12.8 10.8 Note that totals may not appear to add up due to rounding. 154. Using the BEIS Impact Assessment Calculator, the provisional EANDCB of the
preferred policy option (Option 2) is set out in Table 15 below, alongside the
Business NPV and Business Impact Target Score.
Table 15: EANDCB and Business Net Present Value for Option 2 – welding equipment (under the 100% imported scenario)
2021 Prices, 2021 present value (£m)
Business Net Present Value 10.8
EANDCB42 -0.6
Score for BIT -2.8
42 The Equivalent Annual Cost is calculated by dividing the net present value through an annuity rate. This rate can be calculated using the formula: a = (1+r)/r * [1- 1/(1+r)^ t], where r is the interest rate (3.5%) and t is the number of years over which the NPV has been calculated (31).

61
155. We will actively look to address the uncertainty around the scale of UK imports
during the consultation process since this significantly affects the EANDCB and
BIT score above.
7 Small and micro business assessment
156. The UK market is dominated by SMBs (defined as having up to 49 Full Time
Equivalent (FTE) and 10 FTE employees respectively43), making up 99% of
businesses at the start of 201944.
157. Such businesses are likely to be disproportionately affected by the transitional
costs associated with Option 2, particularly around testing and, where possible,
amending their products to make them compliant. There are also likely to be
fewer alternative products for them to market or recoup losses if a product fell
outside of the acceptable efficiency range. Similarly, they may also be
disproportionately affected by Option 1 (Do Nothing) as smaller businesses might
find it harder to capitalise on the lower levels of regulation in the UK compared
with elsewhere, for example, through scaling-up production or bargaining with
suppliers.
158. Although the electric motor production market is dominated by larger
companies, there is potential for SMB producers of electric motors to be
negatively affected by the changes in production associated with Option 2.
However, those that are the end-users of electric motors will benefit from the new
regulation through reduced costs over the lifetime of the products. SMB re-
sellers/importers, as well as those that install and service electric motors, will
benefit from the new regulation through increased business revenue45.
159. Most SMBs in the welding equipment sector are active in manufacturing,
importing, reselling, installing and/or servicing. Their testing and production costs
will increase but their revenues will also increase, due to selling more high value
43 BEIS Better Regulation Framework Manual, February 2018. Available at: https://www.gov.uk/government/publications/better-regulation-framework. 44 Business Population Estimates for the UK and the Regions 2019. Available at: https://www.gov.uk/government/statistics/business-population-estimates-2019 45 IMPACT ASSESSMENT Accompanying the document Commission Regulation laying down ecodesign requirements for electric motors and variable speed drives pursuant to Directive 2009/125/EC of the European Parliament and of the Council. Available from: https://ec.europa.eu/info/law/better-regulation/initiative/1962/publication/5779759/attachment/090166e5c7e0a011_en

62
energy efficient equipment. SMB end-users of welding equipment will benefit
from reduced costs over the lifetime of the equipment.
160. The welding equipment ecodesign requirements under Option 2 are more
challenging for SMBs however, due to lower R&D capacity and access to
financing to fund the required designError! Bookmark not defined.. But the
proposals of such ecodesign requirements have not led to concerns about extra
costs, as these costs would expect to be repaid by the extra revenue
gainedError! Bookmark not defined.. 161. Further, the EU Impact Assessment on welding equipment consulted SMB
stakeholders and found that industry SMBs would especially support the
development of EU ecodesign regulations that fosters energy efficiency
investments in the sectorError! Bookmark not defined.. 162. While the exact number of such businesses affected by the draft regulations is
uncertain, Table 16 below shows the breakdown for manufacturing and for those
specifically related to electric motors and “other electrical equipment”. (equivalent
data was not specifically available for welding equipment).
Table 16: Number and proportion of manufacturing businesses (local units, VAT traders and/or PAYE employers) in the UK that are small and micro-sized, 201946
Micro (<10 employees)
Small (10-49 employees)
Total
All manufacturing 62,235 (76%) 15,105 (18%) 86,110
Of which … Manufacture of electric motors; generators and transformers
150 (52%) 85 (29%) 290
Of which … Manufacture of other electrical equipment
505 (73%) 150 (22%) 695
163. Given the above figures, it could be estimated that over 80% of businesses
affected by the regulatory changes in general would be small or micro in size.
46 ONS: UK business: activity, size and location 2018. Available at: https://www.ons.gov.uk/businessindustryandtrade/business/activitysizeandlocation/datasets/ukbusinessactivitysizeandlocationConsidered UK Local Units in VAT and/or PAYE based Enterprises. All manufacturing includes SIC codes 10-32. Manufacture of electric motors; generators and transformers includes SIC code 27.1. Manufacture of other electrical equipment includes SIC code 27.9.

63
164. To mitigate the impact on small and micro businesses, possible options could
be considered including:
• phasing the transition period; or
• providing an exemption.
165. However, existing regulation relates to products and not manufacturers. An
exemption, or a phasing of the regulation, would mean that products would have
a 2-tier structure: those manufactured by medium and large manufacturers (250+
employees), and those by smaller businesses. Such an approach would make
enforcement activities harder as businesses, as well as products, would have to
be investigated. Further, if smaller businesses were exempt, such an approach
could have the perverse incentive of stifling growth.
166. The EU’s proposed legislation applies regardless of the manufacturer’s size
and that will continue to be the case in the EU under their regulations. If an
exemption or phase-in period were in place for UK-manufacturers, they would be
unable to export their products to the EU market, affecting their competitiveness.
167. While we cannot completely rule-out small or micro UK businesses being
affected, for the reasons outlined above, we have decided not to mitigate.
168. The consultation process will aim to gather views from stakeholders to better
aid the understanding around the impact the policy – as well as the Do Nothing
Option – would have on all types of businesses.
8 Wider impacts
169. Table 17 below summarises the wider social and environmental costs and
benefits, some of which have, while others have not, been considered in this
assessment.
Table 17: Impacts considered and included in our assessment
Does your policy option/proposal have an impact on…? Assessed? Section
Statutory equality duties
Statutory Equality Duties Impact Test guidance No -
Economic impacts
Competition Assessment Impact Test guidance
Yes Annex 4

64
Small and Micro Business Assessment Yes Section 7
Environmental impacts
Greenhouse Gas Assessment Impact Test guidance
No -
Wider Environmental Issues Impact Test guidance Yes Annex 5
Social impacts
Health and Well-being Impact Test guidance
No -
Human Rights Impact Test guidance No -
Justice Impact Test guidance No -
Rural Proofing Impact Test guidance No -
Sustainable development
Sustainable Development Impact Test guidance No -
170. Of the above assessments, only three have been identified as worth exploring
further:
• Competition Assessment Impact Test guidance;
• Small and Micro Business Assessment (SAMBA); and
• Wider Environmental Issues Impact Test guidance.
171. Of the remaining seven additional assessments, no additional analysis has
been conducted for the following reasons:
• Environmental impacts have already been costed and included in our CBA.
• Sustainable development has also been considered qualitatively. This policy is
directly related to energy efficiency and resource efficiency, and warrants
more in-depth consideration.
• Regulating ERPs has no direct or indirect effect on statutory equality duties.
172. Of the social impact tests available, none are directly related to the regulation
of energy-related products and do not appear relevant to this assessment.
9 Summary and Implementation Plan
9.1 Summary
173. In a Do Nothing scenario, welding equipment will not be regulated and electric
motors would have outdated requirements. OEMs and professional buyers are

65
likely to disregard energy and resource efficiency when making purchasing
decisions. Instead, these decisions are based on reliability, performance and the
specific needs of the buyer.
174. Policy Option 2 addresses these market failures by revising ecodesign
requirements for electric motors and introducing ecodesign requirements for
welding equipment to reflect those agreed by the UK as a Member State at EU
level in January 2019. Option 2 also introduces resource efficiency requirements
for welding equipment that make it more re-useable, repairable and recyclable,
contributing to a circular economy. Information requirements for welding
equipment are also introduced.
175. The main analysis used is taken from the EUPP model (see Annex 2 and 3)
176. The benefits identified are:
• reduced energy costs47 due to improved energy efficiency;
• consistency between GB and EU requirements;
• likely increase in innovation due to manufacturers having to produce more
efficient products;
• carbon savings / reduction in greenhouse gas emissions47;
• improved air quality47; and
• increased repairability and recyclability for welding equipment.
177. The costs identified are:
• increased manufacturing costs47 to produce more efficient products are
expected. This is inclusive of transitional costs and assumed to be passed
onto consumers through the supply chain resulting in increased prices47;
• transitional (one-off) costs of implementing the policy, including
familiarisation costs of understanding the requirements;
• possible reduction in consumer choice if some product types are removed
from the market, however, these are likely to be replaced by new, more
efficient products;
• distributional impacts should be expected; and
47 This cost/benefit was quantified.

66
• enforcement costs of imposing requirements are also considered but have
a net zero cost.
178. Quantified costs and benefits give a NPV of £1,047M over the appraisal period
(2021/22 to 2050/51).
9.2 Implementation and Delivery Plan for Option 2
179. The Office for Product Safety and Standards (OPSS) within BEIS is the
appointed MSA responsible for the implementation and enforcement of
ecodesign regulations in the UK, and as such is tasked to ensure manufacturers
and their authorised representatives, or importers comply with the revised
ecodesign requirements for electric motors and the new welding equipment
regulation. They will do so through applying their enforcement policy25 which is to
undertake risk-based enforcement activities, including supporting legitimate and
well-intentioned businesses through the provision of advice and guidance as well
as employing sanctions where considered proportionate. This regime will ensure
the estimated energy bill and carbon emissions savings are realised.
180. This activity forms part of business as usual activity for the OPSS, and while it
is expected there will be minimal opportunity cost as staff familiarise themselves
with the new guidance, it is not anticipated there will be further additional costs
associated with enforcement of these regulations.
181. The revised ecodesign requirements for electric motors and the new welding
equipment regulation are proposed to apply from July 2021 and as soon as
practicable after January 2021 respectively. The Government is carrying out a
consultation whereby manufacturers and other stakeholders can comment on the
Government’s proposals. We are also working with trade bodies to ensure our
intention to regulate is communicated to their members.
182. Once the draft regulations are made, OPSS will issue a notice informing
manufacturers and importers of the new regulations. As the proposed ecodesign
requirements reflect what the UK, as a member state, agreed at EU level in
January 2019, where the requirements were already consulted on, we anticipate
a good level of awareness among manufacturers.
183. Considering technological progress for both electric motors and welding
equipment, the Government will review both draft regulations no later than 5
years and 6 years respectively from the application dates of the regulations. This

67
is to allow sufficient time for all provisions to be implemented and to understand
market penetration. The different review dates reflect the rate of technological
progress for both products
184. As set out in the Ecodesign for Energy-Related Products Regulations 2010, as
amended by the Ecodesign for Energy-Related Products and Energy Information
(Amendment) 2019, the proposed requirements will be brought forward using
secondary legislation.
185. We consider a proportionate Post Implementation Review (PIR), conducted
no later than set out in the draft regulations review dates, suitable in this instance.
It would be based on a qualitative assessment of the impacts of the draft
regulations. As net energy savings are relatively low in the context of the UK’s
total energy use, we predict that measuring direct energy savings from improved
ecodesign requirements for electric motors and welding equipment would be
difficult in the context of the UK energy market.
186. The PIR should aim to assess if the regulation has effectively achieved its
objectives of phasing out lower energy efficiency electric motors and welding
equipment and improving the resource efficiency of welding equipment, and use
this to inform future policy development. We anticipate that the PIR will be based
on market observations – breaches, for example – and consultation with industry.
We expect the review will focus on whether the regulations have resulted in only
electric motors and welding equipment that comply with the requirements being
placed on the market, rather than attempting to quantify the energy savings of
their use. In addition, we expect the review to consider whether, as a result of
technological advances, further savings could be made by raising the minimum
energy efficiency requirements. To achieve this, data on the contemporary stock
of electric motors and welding equipment would need to be collected, making
sure that the information includes energy efficiency of the products.
187. Further, an assessment on the development of global regulatory standards,
particularly in the USA and EU, may help to inform GB policy and whether GB
legislation requires updating, for example by increasing the stringency of the
requirements, broadening the scope of the requirements or introducing circular
economy principles. This will help to establish if the objectives of the regulation
remain appropriate and are still required.

68
Annex 1 General modelling approach and key assumptions
188. This annex sets out the modelling approach used in this Impact Assessment,
the detail of the costs and benefits analysed in the CBA as well as the key
assumptions made.
A1.1 The model 189. For 20 years, the UK has been developing end-use energy models to examine
the likely impact from policy measures addressing energy consumption of Energy
Using Products (EUP) such as lighting and household appliances. The model
used in this Impact Assessment has gone through various iterations including via
the Government’s Market Transformation Programme (MTP) and, currently, the
EUPP.
190. In 2012, the model was extensively peer-reviewed which has led to further
improvements and was awarded a rating of over 90% by BEIS’s independent
Modelling Integrity Team in June 2018 – the level required for all business-critical
models.
191. The main purpose of the model is to assess the impact of policies around
EUPs. Its outputs include the likely costs (in particular, higher costs resulting
from the purchase of new products); and benefits (primarily in the form of energy
and carbon savings from using more energy-efficient products).
192. The model uses a “bottom-up” approach, allowing detailed scenarios to be
modelled for specific products such as the setting of minimum energy
performance standards (MEPS). Each product and scenario require specific
inputs to be calculated/estimated, including:
• Stocks and/or sales of EUP being modelled (including breakdown by
technology type);
• The lifespan of the EUP;
• The energy consumption of EUP (including by mode type and mode
such as “on” or “standby”);
• The level of usage of EUP (hours/year); and
• The price and value estimates, to calculate costs and benefits.
193. Comparing the outputs of the model under different scenarios, the model
quantifies the:

69
• Additional purchase/production costs associated with new products
(typically incurred by the consumer, and/or other groups such as industry
or government);
• Benefits of energy savings over the lifetime of the products from
switching to more energy efficient products;
• Costs and benefits of non-monetary factors such as improved air
quality and a reduction in emissions; and
• Costs of the additional heating requirements due to the heat
replacement effect. This is the extra heating required in the colder months
to replace the reduced waste heat loss from more efficient products. It is
only considered for domestic products since, for non-domestic use, it is
considered to be cancelled out by reduced cooling costs in the warmer
months.
A1.2 Input variables Stocks and/or sales
194. The stock of EUPs refers to the number of products, along with their technical
characteristics, owned by consumers and businesses during a given year. Flows
into the stock include new purchases (sales) and flow out of the stock arise from
disposals. Stock/sales figures are independent of other inputs, such as costs.
195. The composition of the stock in terms of its energy efficiency and the level of
usage of the products is also required to determine energy use from a class of
EUPs. The average energy efficiency of the stock evolves according to the rate
at which EUPs at one level of energy efficiency are replaced by EUPs of another
level of energy efficiency.
196. In the context of EUPs, the rate of increase in energy efficiency over time
depends on the rate at which older, less energy-efficient products are replaced
by newer, more energy-efficient products which, in turn, may be affected by the
policy being assessed.
197. If the data on the stock of EUPs from year to year are more complete than the
data on new purchases (sales), then stock data and projections are used as an
input to the model and sales in each year are calculated according to the rate of
disposal and end-of-year stocks. This is called a “sales from stock” model.
Alternatively, if the sales data are more complete than the stock data, then these

70
figures are used as inputs and the stock is calculated as the sum of sales and
disposals. This is called a “stock from sales” model.
A1.3 Lifespan (years) 198. The lifespan of a cohort of EUPs is modelled according to a normal distribution.
Each cohort has a mean lifespan (the age at which half of the cohort is disposed
of) and a corresponding standard deviation indicating the level of variance in that
lifespan. The model considers the technical/economic lifespan, accounting for
products being replaced before they are irreparable (for example, a mobile phone
being replaced at the end of a fixed-term contract).
A1.4 Costs (£) 199. The following prices are considered in the model:
• the purchase costs of new products represent the per-unit cost of inflows to
the EUP stock;
• energy prices which are applied to the energy savings relative to the counter-
factual case;
• carbon prices to monetise the benefits of lower emissions as a result of the
energy savings;
• the value of improved air quality from the energy savings; and
• real prices are used as at the baseline year for the model and are discounted,
as per Green Book guidance, at the social time preference rate of 3.5%48.
Level of usage (hours/year)
200. The number of hours that each product is in use per year is estimated.
Energy consumption (kW)
201. In each year, energy demand is given by annual usage (hours/year) multiplied
by the average efficiency of the stock. The annual usage figures can be
differentiated by technology and operating mode (e.g. “on” versus “standby”) and
may also differ over time. Estimates of greenhouse gas emissions are calculated
from the energy demand figures by applying emissions factors to the series from
48 The Green Book: Central Government Guidance on Appraisal and Evaluation, March 2019. Available at: https://www.gov.uk/government/publications/the-green-book-appraisal-and-evaluation-in-central-governent.

71
the Green Book supplementary guidance: valuation of energy use and
greenhouse gas emissions for appraisal49.
A1.5 Modelling assumptions 202. The model does not link Costs and Stocks/Sales, i.e. if the cost of a product
increases in the model, stocks/sales figures are unaffected and vice-versa.
Similarly, the model assumes that a change in the price of energy will only lead
to a change in the value of energy savings (and not the effective lifespan of
products).
203. The model does not address decisions about whether to replace a product
before the end of its life, if it becomes cost effective to do so, or which of the
candidate technology types is the preferred replacement choice.
204. All manufacturing costs are assumed to be passed on to consumers through
the price of the product.
A1.6 Modelling example 205. This section includes an example of how the model calculates the costs and
benefits. 2023 has been used as the example year. (All figures have been
rounded.)
Costs
206. As an example, let us assume that 20 million products were purchased in
2023. Due to the regulatory changes, the additional costs of buying a product
(over those under Option 1 where there are no regulatory changes) are
estimated, on average, to be £0.25 (2017 prices). This gives, Total cost (2017 prices) = 20.0m units * £0.25 = £5.0m.
207. Converting to 2021 prices, however, gives, Total cost (2021 prices) = £5.0m * 1.0750 = £5.3m.
49 Green Book supplementary guidance: valuation of energy use and greenhouse gas emissions for appraisal, January 2018. Available at: https://www.gov.uk/government/publications/valuation-of-energy-use-and-greenhouse-gas-emissions-for-appraisal. 50 Table 19 (2021 price scaling factor, compared with 2017), Green book supplementary guidance, 2018.

72
208. Since, in the main body of this assessment, costs have been provided with a
present value year of 2021, these prices must be discounted at an annual rate of
3.5%51 giving Discounted cost = £5.3m * (1/1.035)2 = £5.0m
209. Costs in other years are calculated in the same way, taking into consideration
the estimated number of sales and discounting the costs accordingly.
Benefits:
210. Average annual energy consumption is estimated to be, on average, 1.50
kWh/yr less under the draft regulations. Therefore, Energy savings (in 2023 for those products purchased in 2023) = 1.50 kWh/yr * 20.0m units = 30m kWh/yr
211. Using the Green Book supplementary guidance: Value of energy savings (discounted) = 30m kWh * 1.08 £/kWh52 * 1.0353 * (1/1.035)^2 = £3.2 Value of reduction in CO2e emissions (discounted) = 30m kWh * 0.255/1000 tCO2e/kWh54 * 34.0 £/tCO255 * 1.0353 * (1/1.035)^2 = £0.3m Net benefits of air quality improvements (discounted) = 30m kWh * 0.005256 £/kWh * 1.0353 * (1/1.035)^2 = £0.2m Total benefits (of 2023 cohort in 2023, discounted) = £3.2m + £0.3m + £0.2m = £3.7
212. Energy savings for this cohort (products purchased in 2023) are then applied in
subsequent years reduced by the number of products which were estimated to
have reached the end of their lifetime. This is calculated using a normal
distribution with an associated mean and standard deviation. After the mean
51 As per Green Book guidance: Discounting is used to compare costs and benefits occurring over different periods of time – it converts costs and benefits into present values. It is based on the concept of time preference, that generally people prefer to receive goods and services now rather than later. 52 Table 9 (Long-run variable cost, Central Estimate, Domestic, 2023), Green book supplementary guidance50. 53 Prices in the Green book are expressed in 2018 prices which then have to be converted to 2021 prices using Table 19 (2021 price scaling factor, compared with 2018), Green book supplementary guidance, 201850. 54 Table 1 (Long-run marginal, Domestic, 2023), Green book supplementary guidance, 201850. 55 Table 3 (Traded, Central estimate, 2023), Green book supplementary guidance, 201850. 56 Table 15 (electricity, National average. 2023), Green book supplementary guidance, 201850.

73
number of years, it is assumed that the annual energy savings will apply to only
half of the 20.0M units and, after the mean added to two standard deviations,
only 2%.
213. Note that, although these benefits are lower than the costs, total benefits from
2023 will include those cohorts of products purchased in earlier years and,
correspondingly, benefits from the 2023 cohort will be realised in subsequent
years.
Annex 2 Specific modelling for electric motors
214. In this section, specific details are provided for the modelling of electric motors.
215. The proposed ecodesign requirements for electric motors set minimum energy
performance standards.
216. Additionally, the proposal includes requirements regarding information provided
by manufacturers, their authorised representatives and importers. This
information is intended for use by professional buyers.
217. There are three main categories of electric motors for which separate minimum
energy performance standards exist, as well as VSDs. These categories are not
disputed by industry and are consistent with the United States Department of
Energy electric motors regulation (2016):
• 0.75-7.5kW motors,
• 7.5-375kW motors,
• 375-1000kW motors, and
• VSDs rated for operating with a motor in the 0.75kW-1000kW power range,
have a rated voltage between 100V and 1000V AC and have only one voltage
output.
218. The model was split into seven sub-models separated by motor capacity.
Electric motors in the 0.12 – 0.7 kW range were split again into a single-phase
model and a multi-phase model. For motors with capacity larger than 0.75 kW,
only multi-phase models were considered.
219. As the modelling focuses on the biggest segments of the UK electric motors
market and those products with the greatest potential for energy savings, the
largest electric motors have been excluded from the modelling as they are a

74
small proportion of the market (i.e. electric motors sized 150 – 400 kW
compromise <0.01% of the installed stock57).
220. The models are stock-based, developed using a variety of sources outlined
Table 18. The energy demand values were calculated by taking average
efficiency found in each efficiency class and dividing by the midpoint of the rated
output range for each electric motor size. This resulted in an estimate of the input
energy required to operate an electric motor. This was the same approach taken
in the previous iteration of the electric motors modelling.
221. The following table shows the high-level inputs into the model along with the
sources behind the values.
57 BSRIA Motors Market Survey (2003)

75
Table 18: Overview of the key inputs into the CBA for electric motors as well as risks of assumptions and any mitigation actions
Variable Source(s) Motor Size Values/assumptions Stocks/sales (Same under both options)
[1] 2014 preparatory study for Lot 30
[2] 2003 BSRIA motors market survey
[3] Carbon Trust Technology guide, 2011
All For absolute stock numbers and absolute sales numbers, data source is relevant extracts from [1]. For stock numbers, use stock value from [2], and assume that it remains constant over time for both reference and policy sections. Use assumption from [3] of a 50/50 split in stock between fixed-speed and variable-speed motors applications. Model is stock-based rather than sales-based. Risk: High due to impact that stock/sales figures have on the outputs. However, as per Table 3, stock/sales figures affect both costs and benefits so impact will be limited.
Efficiency class splits (same under both options)
[1] IEA 4E Energy efficiency roadmap for electric motors and motor systems (2015), Dr Conrad Butler
0.12 – 0.7 kW (single-phase and three-phase)
Use efficiency class (IE) values from [1] for period 1995 – 2015 (final year provided). Project back by applying 1995 - 1996 year on year on trend for each efficiency class. Project forward by applying 2014 – 2015 year on year on trend for each efficiency class:
• For IE4, keep at zero since no data was found for it • For IE3, trend is projected to 2050 • For IE0, project as declining to zero • For IE1, project this declining trend until IE0 becomes zero, then calculate it as
100% minus the sum of IE2, IE3 and IE4 • For IE2, project the trend until IE1 becomes zero, then calculate it as 100%
minus IE3. Risk: High as this is a key determinant of impact outputs. However, although data is calculated using trends, source is directly from regulation so of good quality with expert assumptions.

76
0.75 – 2 kW (three-phase) & 3 – 4kW
Use values from [1] for period 1995-2010 (the final year before ecodesign requirements in 640/2009 came into effect) Project back by applying 1995 – 1996 year on trend for each efficiency class. Projecting forward from 2011, the following must be considered:
• There is no data for IE4 • Stock of IE1 declines to zero one lifetime (thirteen years) after 2010. This is
due to 640/2009 preventing sales of IE0 and IE1 from 2011 • For IE2: In 2017, 640/2009 ecodesign requirements came into force for motors
in size range 0.75 to 7.5 kW to prevent sale of IE2 without a variable speed drive.
Risk: same as above
5 – 11 kW, 15 – 30 kW, & 37 – 132 kW
Same as for 0.75 – 2 kW (three-phase) & 3 – 4kW, with the following exception for fixed-speed motor applications: since a variable speed drive for an IE2 5-11kW motor costs more to buy than a fixed-speed IE3 5-11kW motor, and a variable-speed IE2 motor application has a higher average energy demand than a fixed speed IE3 motor application, we assume that there is insufficient (if any) benefit to purchasing a VSD rather than an IE3 motor from 2017 onwards. Risk: same as above
Level of usage in hours/years (same under both options)
[1] EC "Improving the Penetration of Energy-Efficient Motors and Drives" (2000)
[2] EUP Prep Study; Lot 11, Motors (2008)
[3] Market Transformation Programme Briefing Note (2009, updated 2010)
All Number of motors by power range and average operating hours in each sector taken from [1]. Reported usage value of 2,250 hrs/yr for 1.1kW base-case from [2]. No distinction drawn between sectors. Reported value of 2,120 hrs/yr for all power ranges from [3]. Again, no distinction drawn between sectors. Assumed that usage remains constant over time and is the same for reference and policy scenarios. Risk: Medium as usage is key determinant of impact of regulation. Data is from Prep Study so of good quality.
Cost of product (different under both options)
[1] Pricing data collected from ABB, Siemens and WEG for the
All Raw data obtained from [1]. No data for EEF3 motor class (equivalent to IE0), so a discount was applied to the IE1 prices equal to the proportional difference between the IE1 and IE2 prices. IE4 prices were not recalculated since ecodesign

77
2009 modelling exercise in the Market Transformation Programme Briefing
requirements do not push the adoption of IE4 and since the ratio of IE3 price to IE2 price for the 0.75 – 2kW size range is very close to the average across all size ranges. Assumed that the price remains constant for a given efficiency class over time and is the same for both reference and policy scenarios. Risk: Medium. New costs for IE0 were estimated using the same price difference between the IE1 and IE2 motors, so it is unknown how robust they are. The remaining prices used the same price information from suppliers, except for IE4 which were assumptions. However, because there weren't costs from shifting from IE0 to IE1 and IE3 to IE4, the assumptions used to develop these prices are not expected to raise risk levels, hence the 'medium' rating.
Energy consumption in kWh/year (different under each option)
[1] 2014 preparatory study for Lot 30
[2] 2000 study for the European Commission SAVE II programme "Improving the penetration of energy-efficient motors and drives"
[3] 2009 modelling exercise for the Market Transformation Programme Briefing
All Average efficiency from [1]. Average power calculated from [2]. Motor rating values from [3]. Neither the Prep Study nor the source 2000 study provide a breakdown of average efficiency values by efficiency class within the required size ranges, as the model requires, or the stock numbers necessary to calculate weighted averages of motor ratings within those efficiency classes. The 2009 MTP data consists of weighted average rated power values and weighted average efficiency values for motors, fixed speed and variable speed, in each of four efficiency classes, and background calculations to obtain them, taking account of motor stock numbers and size ranges. Hence the 2009 MTP data are used as model inputs. Risk: High as power demand has considerable effect on the impact of options. Some mitigation as changing variables such as Load Factor will affect consumption in all scenarios equally.
Lifespan (same under both options)
[1] 2015 report by the IEA 4E programme "Energy efficiency roadmap for electric
All Lifespans are taken from the lifetime expectancy lines in Figure 6 in [1].

78
motors and motor systems"
Where the model size range straddles two life expectancy lines, the value from the higher life expectancy line has been used as this results in a slower stock turnover (which is conservative). It is assumed that lifespan is the same for reference and policy scenarios Risk: Medium. Source is reliable and the assumptions are straightforward.

79
Annex 3 Specific Modelling for Welding Equipment
222. In this section, specific details are provided for the modelling of welding
equipment.
223. The proposed ecodesign requirements for welding equipment set
MEPS requirements and resource efficiency requirements.
224. The proposal includes resource efficiency requirements and requirements
regarding information provided by manufacturers, their authorised
representatives and importers. This information is intended for use by
professional buyers.
225. There is no existing ecodesign regulation for welding equipment. Therefore, the
model is structured to account for the different minimum energy efficiency
standards by establishing a single representative arc welding technology, with
input power consumption in ‘on-mode’ and ‘idle-mode’ being taken from the
European Commission’s preparatory study.
226. The granularity of the modelling matched the data available. A single
representative arc welding technology formed the basis of the modelling due to a
lack of more granular data.
227. A weighted average efficiency was used for the single representative arc
welding technology modelled. This was because of a lack of available data to
split out sales values by size and type for the various types of arc welding
equipment.
228. Overall, the lack of more granular data is because the preparatory study
focused on machine tools in general, rather than specifically on welding
equipment.

80
Table 19: Overview of the key inputs into the CBA for welding equipment.
Variable Source(s) Values/Assumptions
Stocks/sales (Same under both options)
Eurostat PRODCOM [1]
Expert Assumptions [2]
Based on UK production, imports and exports over the period 1998-2016, average per year market value were estimated [1]. Average between low and high estimate of sales quantity were informedly assumed to be constant [2] over the whole considered period (1998-2050). Low estimate for sales quantity calculated by dividing the average balance of production, import and export balance by higher average unit price (UK); highest estimate of sales quantity divided by lower average unit price (UK).
Annual sales estimates in the modelling were also based on PRODCOM [1] data and were estimated at around 15,000 units per year based on an average of trade data from 1998-2016.
Risk: Low-medium. Sales could change over time since the market can fluctuate. Data inputs were pulled from a period of 19 years to account for yearly market fluctuations and the constant sales assumption was validated by expert consultation.
Lifespan in years Expert Assumptions [1]
EuP preparatory study Task 4, 2012 [2]
The average lifespan of welding equipment is highly variable, with most welding equipment lasting 10-20 years [1]. Figure 7 shows the assumed distribution with the median lifespan assumed to be 13 years, with a standard deviation of 4 years. Data was based on the preparatory study [2] and expert insight [1].
Figure 7: Distribution of lifespan (yrs) for welding equipment

81
Risk: Medium. Median lifespan could be higher or lower as can the standard deviation. But the assumption considers information from multiple sources (preparatory study, expert consultation, and the lifespan for similar products).
Cost of product (Different under each option)
Eurostat PRODCOM [1]
EuP preparatory study Task 4, 2012 [2]
Unit prices were based on PRODCOM data [1] with the respective sense check being based on the preparatory study [2]. The costs were considered incremental, relative to an average product on the market. The reference price was considered £0 with the policy price showing the additional costs arising from improved efficiency. 2023 ecodesign requirements were expected to be met with a 2% premium (increase) in machine costs.
Risk: Medium. Premium for compliance can be higher or lower and the reference scenario catch up time can be longer or shorter.
Assumptions are pulled from reliable sources and sense checked.
0%
2%
4%
6%
8%
10%
12%
1 3 5 7 9 11 13 15 17 19 21 23 25 27 29 31Lifespan (years)

82
Level of usage in hours/years (Same under both options)
EuP preparatory study Task 4, 2012 [1]
The level of usage was considered in hours per year and considered constant from 1998-2050. The use of the product is distinguished (in hours per year) between two states – ‘on’ and ‘idle’. Equipment was considered to be in use for 25% of one shift operation for 250 days a year based on the EU preparatory study [1].
Risk: Low. On/idle time can be higher or lower but the on/idle time assumptions were based on preparatory studies and validated by expert consultation.
Energy consumption in kWh/year (Different under each option)
EuP preparatory study Task 4, 2012 [1]
A Business-As-Usual scenario was estimated, showing the estimated energy usage. This was based on the efficiency improvement of the progression between the average suggested ecodesign values [1]. We considered a 0.3% continuous annual improvement (for do nothing), using a weighted average of various types of welding equipment to calculate average efficiency. This was compared against the preferred option, where we assumed a single jump in energy efficiency and idle consumption, reflecting the introduction of the ecodesign requirement. Best practices are assumed to be developed at reference rate, so the average increases once the do nothing scenario catches up with the preferred scenario. Risk: High. Efficiency could improve more or less than 0.3% in the Reference Scenario, which means that it would take less or more time for it to catch up with the Policy Scenario. However, efficiency improvement was estimated based on progression between the average in Prep Study and suggested ecodesign values.

83
Annex 4 Competition Assessment
229. Considered in this assessment are the effects on competition from our
preferred policy option (Option 2). The following questions were considered as to
whether the option:
1. Directly limits the number or range of manufacturers;
2. Indirectly limits the number or range of manufacturers;
3. Limits the ability of manufacturers to compete; and 4. Reduces manufacturers' incentives to compete vigorously.
230. It has been concluded that there are no adverse effects on competition from
our policy option as none of the above conditions are satisfied.
Annex 5 Wider Environmental Impacts Assessment
231. Considered in this assessment are the effects on the wider environment from
our preferred policy option. Each of the following questions were considered:
1. Will the policy option be vulnerable to the predicted effects of climate
change?
2. Will the policy option lead to a change in the financial costs or the
environmental and health impacts of waste management?
3. Will the policy option impact significantly on air quality?
4. Will the policy option involve any material change to the appearance of the
landscape or townscape?
5. Will the proposal change 1) the degree of water pollution, 2) levels of
abstraction of water or 3) exposure to flood risk?
6. Will the policy option change 1) the amount or variety of living species, 2)
the amount, variety or quality of ecosystems?
7. Will the policy option affect the number of people exposed to noise or the
levels to which they're exposed?

84
232. The policy in question has direct benefits accruing from environmental savings.
Relevant impacts have been explicitly included in the CBA. Others have not been
included (such as the appearance of the landscape and the amount or variety of
living species) as they are not in-scope for this policy. It has been concluded that
the extent to which environmental impacts are considered in the main body of
this assessment is proportionate.
Annex 6 Definitions
Welding equipment means a product that provides all or any of manual,
automated or semi-automated welding, brazing,
soldering or cutting, via arc welding and allied
processes. Welding equipment is stationary or
transportable, and consists of linked parts or
components, at least one of which moves, and which
are joined together to produce coalescence of arbitrary
materials by heating them to the welding temperature,
with or without the application of pressure or by the
application of pressure alone, and with or without the
use of filler metal, and with or without the use of
shielding gas or gases, using appropriate tools and
technologies, resulting in a product of defined
geometry
Manual metal arc
welding
means an arc-welding process welding with a coated
electrode where the operator’s hand controls the travel
speed of the welding operation and the rate at which
the electrode is fed into the electric arc
Shielded metal arc
welding
means an arc-welding process whereby coalescence
is produced by heating with an electric arc between a
covered metal electrode and the workpiece and work
area. Shielding is obtained from decomposition of the

85
electrode covering. Pressure is not used and filler
metal is obtained from the electrode
Self-shielded flux-
cored welding
is a wire welding process in which a continuous hollow
wire electrode is fed through the welding gun into the
weld joint without the need for the use of an external
shielding gas to protect the weld pool from
contamination. Instead of an external shielding gas, a
flux compound contained within the hollow wire reacts
with the welding arc to form a gas that protects the
weld pool. Flux cored arc welding utilises composite
tubular filler metal electrodes consisting of a metal
sheath and a core of various powdered materials,
producing an extensive slag cover on the face of a
weld bead. The use of external shield gas(es) may or
may not be required
Metal inert gas (MIG)/
metal active gas
(MAG) welding
means types of gas metal arc welding whereby
coalescence is produced by heating with an arc
between a continuous filler metal (consumable)
electrode and the workpiece area. Shielding is
obtained entirely from an externally supplied gas, or
gas mixture, which is inert (MIG) or active (MAG)
Tungsten inert gas
welding
means an arc welding process whereby coalescence is
produced by heating with an arc between a single
tungsten (non-consumable) electrode and the
workpiece area. Shielding is obtained from a gas or
gas mixture. Pressure may or may not be used and
filler metal may or may not be used
Plasma arc cutting means an arc cutting process that uses a constricted
arc and removes the molten metal in a high velocity jet
of ionized gas (plasma gas) issuing from the

86
constricting orifice. Plasma arc cutting is a direct
current electrode negative process
Plasma gas means a gas directed into the torch to surround the
electrode, which becomes ionized by the arc to form a
plasma and issues from the torch nozzle as the plasma
jet, and is also sometimes referred to as orifice gas or
cutting gas
Laser-arc welding means a welding process where welding is carried out
by a pulsed laser or constant wave laser. The use of
external shield gas(es) may or may not be required
Laser-arc hybrid
welding
means a welding process where welding is carried out
by a pulsed laser or constant wave laser together with
the use of an electric arc. Coalescence between the
workpiece area and the filler metal (consumable)
electrode is produced by heat from both the arc and
the laser energy sources. The use of external shield
gas(es) may or may not be required
Shielding gas (also
referred to as
secondary gas)
means a gas that does not pass through the orifice of
the nozzle, but instead passes around the nozzle and
forms a shield around the electric arc
Submerged arc
welding equipment (arc
exceeding 600 A)
means an arc welding process that uses an arc or arcs
between a bare metal electrode or electrodes and the
weld pool. The arc and molten metal are shielded by a
blanket of granular flux on the workpieces. The
process is used without pressure and also utilises filler
metal from the electrode and sometimes from a
supplemental source such as a welding rod, flux, or
metal granules

87
Limited duty arc
welding equipment
means products for arc welding and allied processes
that are not designed for industrial and professional
use, as defined in IEC 60974-6, Arc-welding
equipment – Part 6: Limited duty equipment. According
to IEC 60974-6, limited duty arc welding equipment
excludes powers sources that require for operation: arc
striking and stabilizing devices, liquid cooling systems,
gas consoles, or three-phase input supply, and which
are intended for professional and industrial use only.
Limited duty arc welding equipment excludes also
mechanically guided applications, submerged arc
welding, plasma gouging, and plasma welding
processes
Resistance welding
equipment
means a thermo-electric process in which heat is
generated at the interface of the parts to be joined by
passing an electrical current through the parts for a
precisely controlled time and under a controlled
pressure. No consumables such as welding rods or
shielding gases are required
Stud welding
equipment
means a form of arc welding where capacitive
discharge occurs across the consumable calibrated tip
of a welding rod. When the negatively-charged tip of
the welding rod is in contact with the positively-charged
object, the tip explodes and the atmosphere between
the rod and object ionizes, causing the material of the
rod and object to melt
Machine tool means a mechanical device which is fixed and
immobile, powered typically by mains electricity,
compressed air pneumatic and hydraulic systems, and
is used to produce workpieces by selective removal or

88
addition of material, or by mechanical deformation of
materials. The operation of a machine tool, such as
those designed for processes such as, but not limited
to, milling, drilling or perforating, grinding, cutting,
turning, laser-operated operations, and multi-functional
machining centres combining any or all of the above
functions, may be controlled by mechanical or
electronic sources
Electric motor means a device that converts electrical input power
into mechanical output power in the form of a rotation
with a rotational speed and torque that depends on
factors including the frequency of the supply voltage
and number of poles of the motor
Variable speed drive means an electronic power converter that continuously
adapts the electrical power supplied to a single motor
to control the motor’s mechanical power output
according to the torque-speed characteristic of the load
driven by the motor, by adjusting the power supply to a
variable frequency and voltage supplied to the motor. It
includes all electronics connected between the mains
and the motor including extensions such as protection
devices, transformers and auxiliaries
pole means a north or a south pole produced by the rotating
magnetic field of the motor, whose total number of
poles determines its base speed
Brake motor means a motor equipped with an electromechanical
brake unit operating directly on the motor shaft without
couplings

89
Annex 7 Glossary of Terms
AC Alternating Current
BEIS Department for Business, Energy and Industrial Strategy
BIT Business Impact Score
CBA Cost-Benefit Analysis
EANDCB Equivalent Annual Net Direct Cost to Business
ERP Energy-Related Products
EU European Union
EUP(P) Energy Using Products (Programme/Policy)
FTE Full Time Equivalent
IA Impact Assessment
IEC International Electrotechnical Commission
MSA Market Surveillance Authority
NPV Net Present Value
MAG Metal Active Gas
MEPS Minimum Energy Performance Standards
MIG Metal Inert Gas
MTP Market Transformation Programme
OEM Original Equipment Manufacturer
OIOO One-In, One-Out
OPSS Office for Product Safety and Standards
PIR Post Implementation Review
SMB Small and Micro Sized Businesses
TENV Totally Enclosed Non-Ventilated
TEAO Totally Enclosed Air Over
WTO World Trade Organisation

90
USA United States of America
VSD Variable Speed Drive