Embed Size (px)
Citation preview
AUA Working Paper Series No. 2016-1 May 2016
Impact assessment of agricultural and fiscal policy in Greece on
business-oriented arable farms Stamatis Mantziaris Postgraduate Program MBA in Agribusiness, Agricultural University of Athens [email protected] Stelios Rozakis Environmental Engineering Department, Technical University of Crete [email protected] This series contains preliminary manuscripts which are not (yet) published in professional journals
Agricultural University of Athens · Department of Agricultural Economics & Rural Development · http://www.aoa.aua.gr
1
Impact assessment of agricultural and fiscal policy in Greece on business-oriented arable farms
Stamatis Mantziaris ([email protected])
Postgraduate Program MBA in Agribusiness, Agricultural University of Athens
Stelios Rozakis ([email protected])
Environmental Engineering Department, Technical University of Crete
ABSTRACT
This paper examines the impacts of the national implementation of the CAP reform
2014-20 and the fiscal policy derived from the Third Memorandum on the crop-mix
decisions and the viability of business oriented Greek arable farming. A mathematical
programming model is specified maximizing farmers' utility subject to agronomic,
institutional and resource constraints. According to CAP reform scenario, reduction
for cotton and durum wheat and on the other hand increase mainly for set aside and
secondary for alfalfa cultivation areas is observed. Similar crop-mix is cultivated for
the combined scenario of CAP and fiscal reform. Although gross margin decreases in
both scenarios, almost all farms remain viable because 64% of their gross revenue is
derived from the market. Consequently, farms are not sensitive enough in reform
concerning reduction of subsidies but the combination with tax measures decrease the
levels of viability significantly.
Key words: Utility function, mathematical programming, policy analysis, arable
farming, Thessaly
2
JEl codes: C61, Q12, Q18
1. Introduction
On 26 June of 2013, the European Commission , the European Council and the
European Parliament came to political agreement concerning Common Agricultural
Policy(CAP) reform 2014-20. Major aims of new CAP scheme is the redistribution of
direct payments among EU members and among regions of each EU member.
Additionally, the CAP reform aims to improve environmental performance of
agriculture. The Greek government opted for the partial convergence of single farm
payment in progress since 2015-2016 cultivating period and fully implemented in the
horizon of 2019. Moreover, Greek farmers are faced with the Third memorandum
fiscal measures, namely an increase of tax rate and the abolishment of tax allowance
for diesel oil.
A significant number of various studies has been undertaken, concerning the impact
assessment of CAP reform 2014-20 (Cimino et al.,2015; Donati et al., 2015 ; Solazoo
et al., 2014) . Concerning analytical tools, a very common methodology for policy
analysis in agriculture is the use of variants of mathematical programming. Focusing
on Greek agriculture, a variety of mathematical programming sector models has been
used in order to be assessed the impacts of CAP reform 2003, mainly for tobacco and
cotton sector. An indicative list of sector mathematical programming models contains
linear programming (Mattas et al., 2006) ,positive models incorporating downward
sloping demand (Rozakis et al., 2008), multi-criteria methods with non-interactive
elicitation of the utility function (Manos et al. 2009) or increasing cost functions by
3
means of Positive Mathematical Programming (PMP) in Petsakos & Rozakis (2015)
and Rozakis (2011) .
.
In this paper, we assess the impacts of the latest CAP reform , namely the impacts of
decoupled payments partial convergence in combination with greening requirements
for the purpose of crop diversification, and the Third Memorandum tax measures in a
sample of arable farms of Karditsa Prefecture. The sample farms are considered
business oriented for Greek standards since they characterized by relatively large
economic size and almost the 64% of their gross revenue is derived from market. For
the purpose of policy analysis we use multi-criteria mathematical programming with
individual utility function elicited from observed decisions at the farm level. The
decision criteria are gross magin maximization , family labor maximization and
working capital minimization. A significant addition , is that model taking in
consideration the agri –environmental payments and constraints in the context of
second pillar of CAP .
Then, we modify the parameters and constraints according to new CAP scheme and
Third Memorandum tax measures in order to assess the impacts in crop mix and
viability of farms. We consider that the results of analysis can be useful , since could
be representative to some degree , for similar business oriented arable farms of
Thessaly ,Central Greece, and Central Macedonia.
This paper is organized in five sections , namely section two describes the model
specification of baseline and the theoretical framework of multi-criteria mathematical
programming methodology , section three contains the 1)sample description , 2) the
validation of model which is intended for policy analysis and 3) the model
specification of scenarios .Section four analyses the impacts of CAP and taxation
4
reform in crop mix and viability of farms. In section five are articulated some
conclusions.
2.Methodology
2.1 Model specification -Baseline (CAP 2007-13)
A bottom-up staircase model based on individual farm data is specified for arable
agriculture to simulate supply. A modular structure allows for taking into account the
diversity of the arable farm system and production technology at a large extent
independent of time-series data thus appropriate for policy analysis in cases of
substantial policy reforms (Rozakis and Sourie, 2001). Each sub model consists of
multiple objective functions and a number of resource, institutional and agronomic
constraints. More specifically, different objective functions correspond to different
goals of farmers. The first goal is the gross margin maximization, considering that a
business-oriented farm attempt to optimize its economic result.
Although the business-oriented type of farms, family labor covers almost 30% of total
labor requirements. Thus, we assume that farmers attempt to maximize family labor
through their crop mix decision. As third goal, we consider the working capital
minimization, assuming that farmers attempt to minimize their variable expenses
since they can receive decoupled payment by keeping arable land (set-aside included)
equal to land entitlements. At this point, it must be underlined that in literature review
an additional criterion which corresponds to the minimization of risk is observed
(Petsakos et al., 2009; Amador et al., 1998). However, the specific criterion is not
studied in this paper because assuming that the expectations of the Greek farms about
unknown values of parameters (e.g. prices of non-contracted crops, crop yields) are
5
based in the most recent experience. More specifically, in case of non-contracted
crops(e.g. cotton, maize, alfalfa, durum wheat) the value of expected price is
considered the received price of t-1 period. Concerning crop yields , farmers consider
that generally are not observed significant deviations , thus the data yields of a few
previous years ,could be used to calculate a representative expected yield .
Constraints are enrolled in three different categories, namely in resources constraints,
First Pillar policy constraints and Second Pillar policy constraints. Resources
constraints correspond to total land, irrigated land, family labor and working capital
availability of each farm. First Pillar policy constraints include the land entitlements
activation in order to be received the decoupled payment. Concerning cross
compliance obligations (20% cultivation of land entitlements with legumes or
cultivation of three different crops), are ignored by farmers.
The above two categories of constraints are included in all sub-models .Second Pillar
policy constraints include the optional obligations of agri-environmental measures,
namely nitrogen pollution reduction program (A or B methodology) and organic
farming, in order to be received the agri-environmental subsidy.
2.2 Initial set of goals & model constraints
All crops cultivated in a sample are treated as alternative activities for every farm in
the sample.For crops not present in a production plan, are used the average data of
sample concerning yield and family labor. As regards the crop cost prediction, in case
of agricultural inputs(e.g. fertilizers) and labor cost is used the average cost of the
sample and in case of mechanical operations costs , is taken into consideration the
machinery level of farm in order to estimate the possible rent rate of machinery and
fuel costs with precision.
.The goals and constraints used in this analysis and their mathematical expressions are given
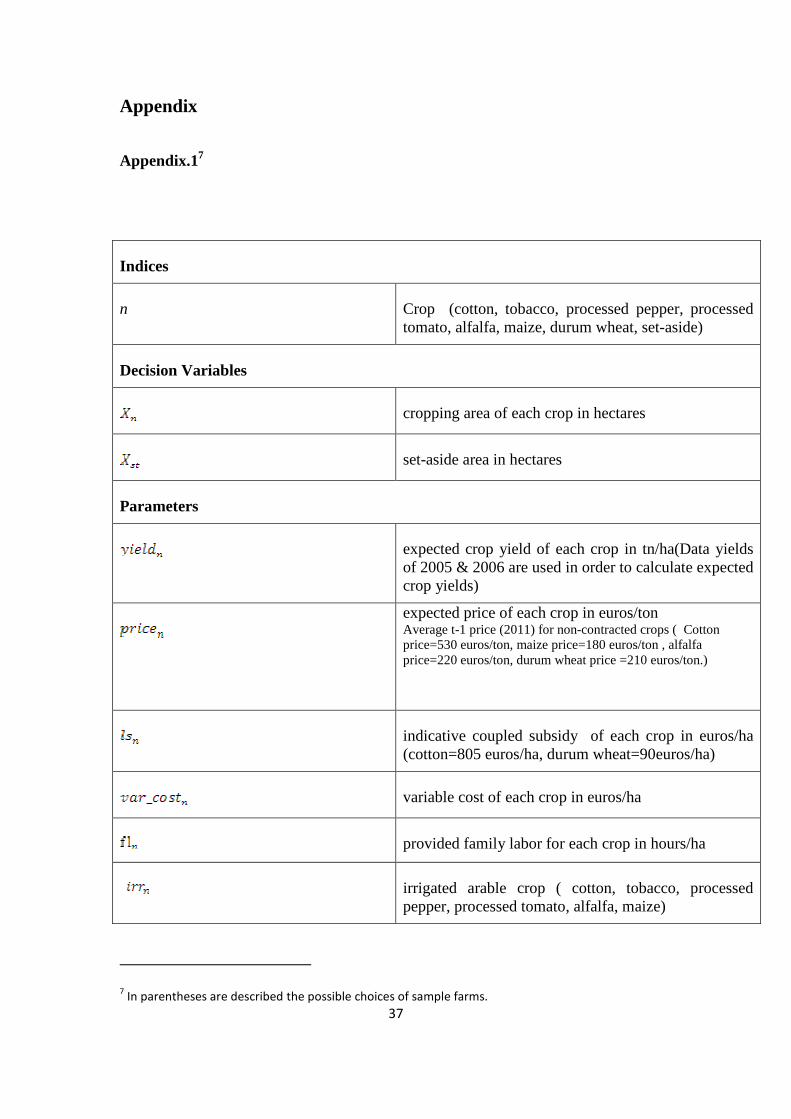
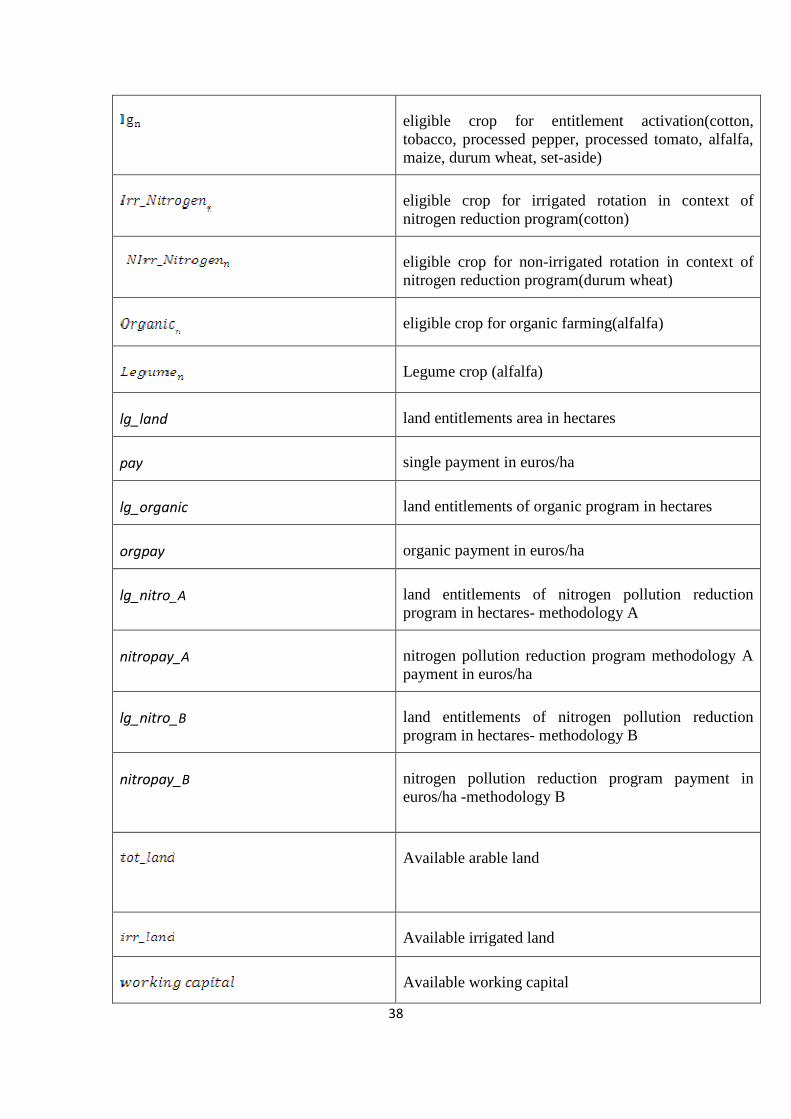
below (see the appendix 1 for the indices, parameters and decision variables)
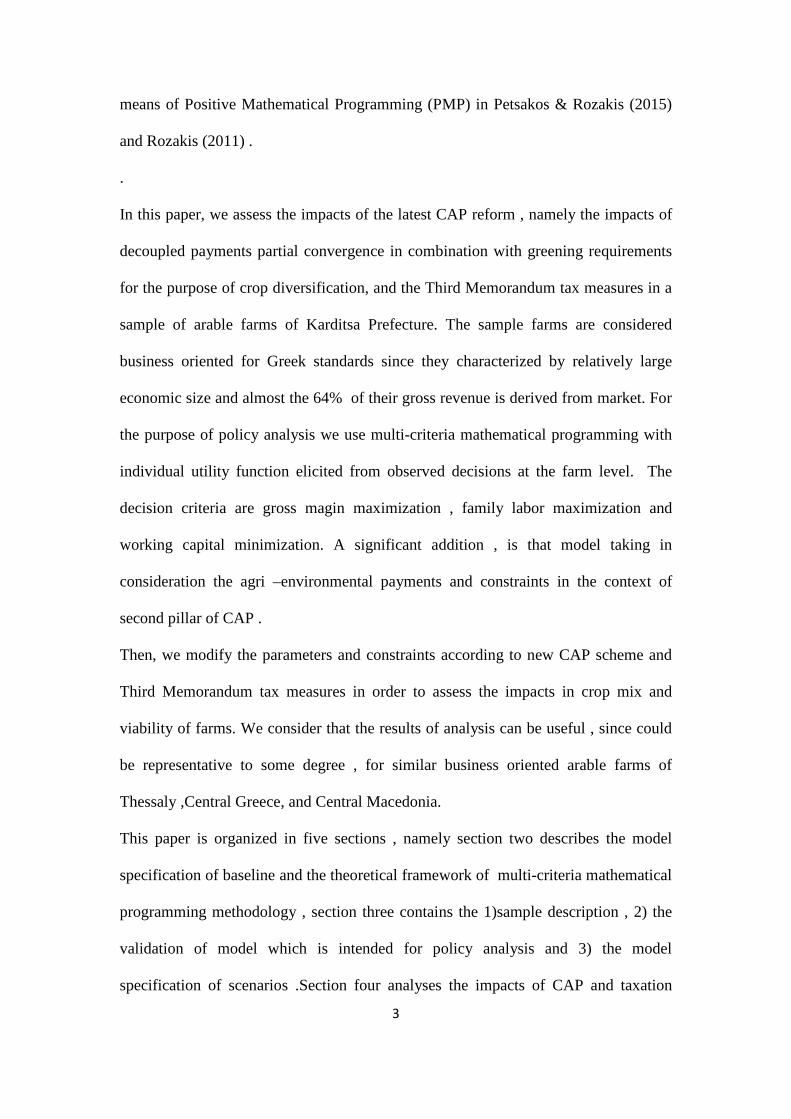
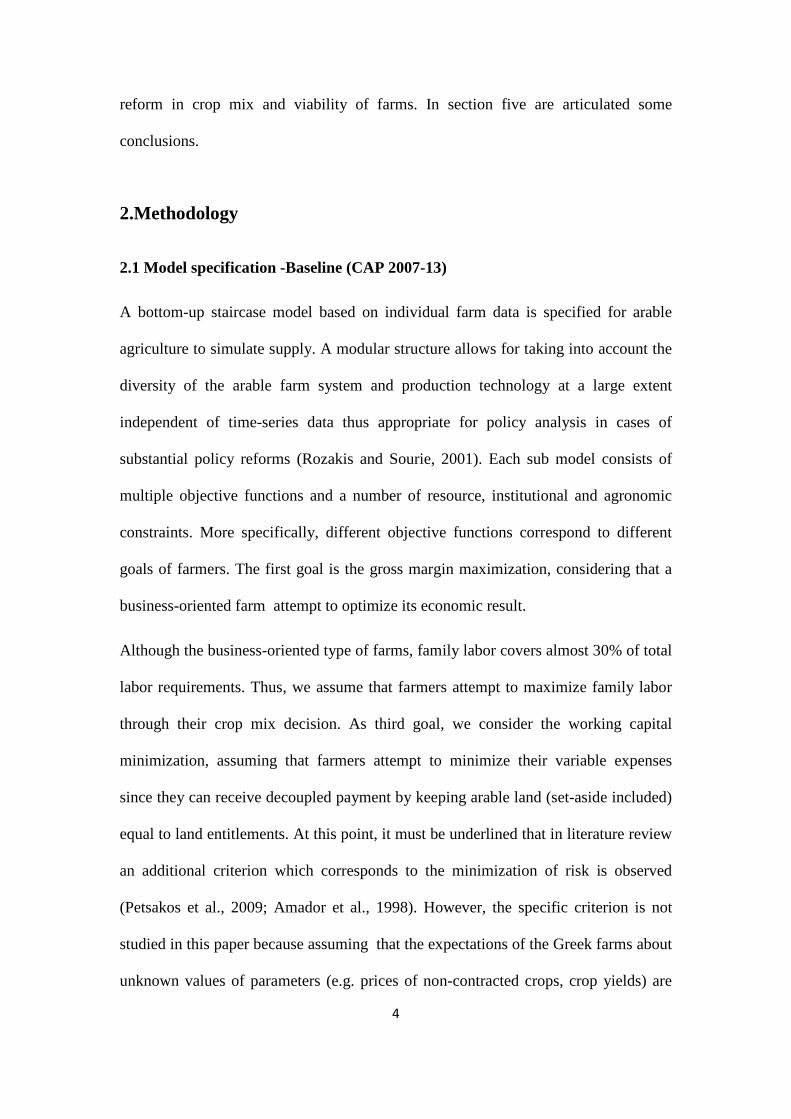
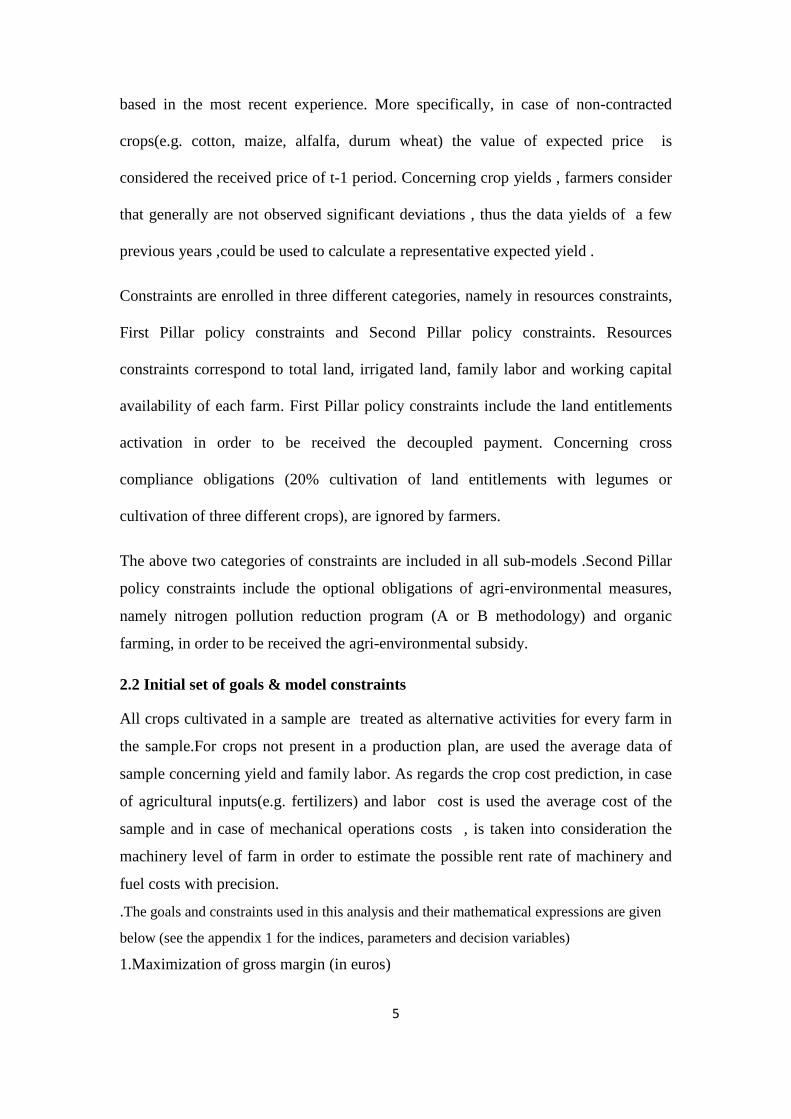
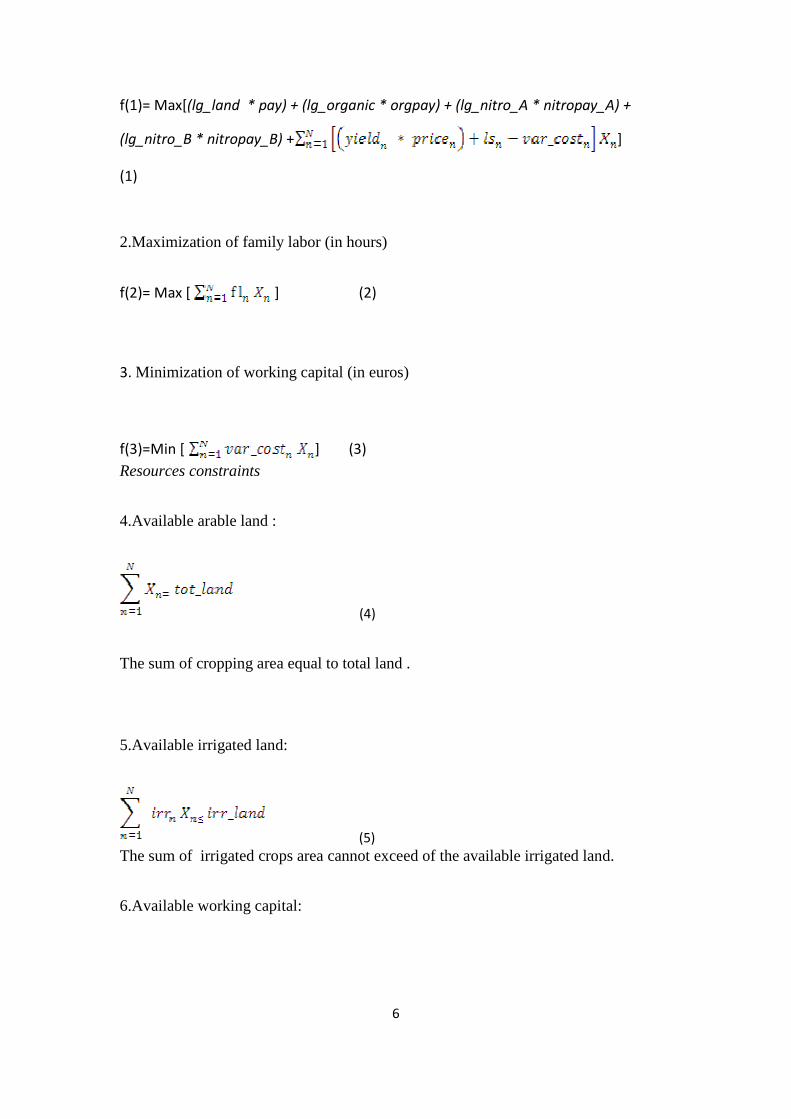
1.Maximization of gross margin (in euros)
6
f(1)= Max[(lg_land * pay) + (lg_organic * orgpay) + (lg_nitro_A * nitropay_A) +
(lg_nitro_B * nitropay_B) + ]
(1)
2.Maximization of family labor (in hours)
f(2)= Max [ ] (2)
3. Minimization of working capital (in euros)
f(3)=Min [ ] (3) Resources constraints
4.Available arable land :
(4)
The sum of cropping area equal to total land .
5.Available irrigated land:
(5) The sum of irrigated crops area cannot exceed of the available irrigated land.
6.Available working capital:
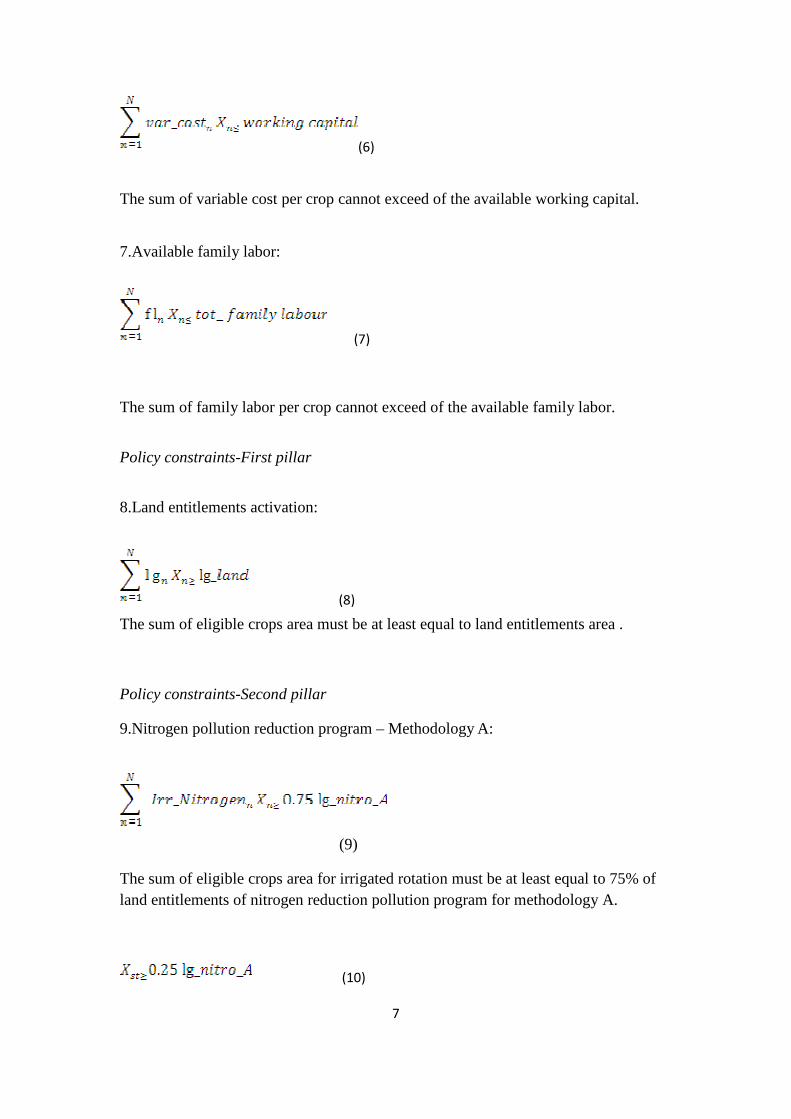
7
(6)
The sum of variable cost per crop cannot exceed of the available working capital.
7.Available family labor:
(7)
The sum of family labor per crop cannot exceed of the available family labor.
Policy constraints-First pillar
8.Land entitlements activation:
(8)
The sum of eligible crops area must be at least equal to land entitlements area .
Policy constraints-Second pillar
9.Nitrogen pollution reduction program – Methodology A:
(9)
The sum of eligible crops area for irrigated rotation must be at least equal to 75% of land entitlements of nitrogen reduction pollution program for methodology A.
(10)
8
The set aside area must be at least equal to 25% of land entitlements of nitrogen reduction pollution program for methodology A.
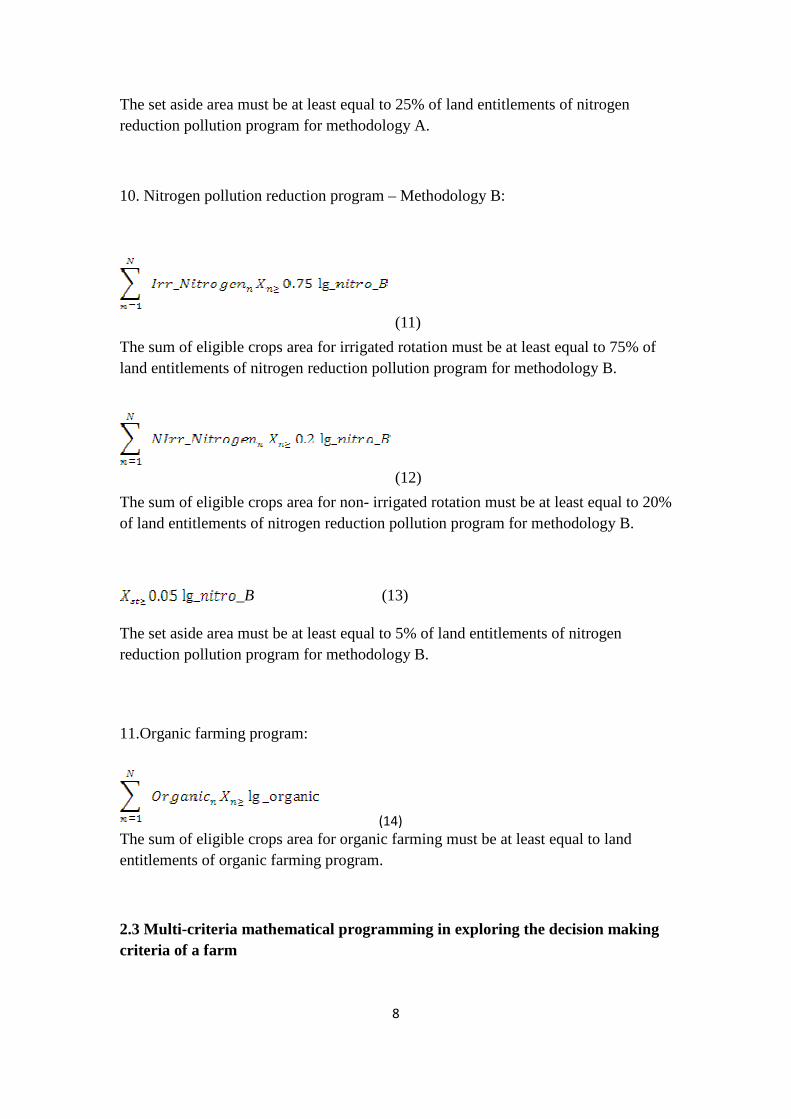
10. Nitrogen pollution reduction program – Methodology B:
(11)
The sum of eligible crops area for irrigated rotation must be at least equal to 75% of land entitlements of nitrogen reduction pollution program for methodology B.
(12)
The sum of eligible crops area for non- irrigated rotation must be at least equal to 20% of land entitlements of nitrogen reduction pollution program for methodology B.
_B (13)
The set aside area must be at least equal to 5% of land entitlements of nitrogen reduction pollution program for methodology B.
11.Organic farming program:
(14) The sum of eligible crops area for organic farming must be at least equal to land entitlements of organic farming program.
2.3 Multi-criteria mathematical programming in exploring the decision making criteria of a farm
9
The traditionally used decision making criterion in farm-based mathematical
programming models corresponds to maximization of gross margin, assuming that
farmers allocate available area to the various cropsso that to optimize the economic
objective. Though there is evidence that farmers take into consideration more than
one decision criteria when they are plan the crop mix of following year , giving a
different weight to each criterion .
In order to elicit the weights of decision making criteria, we apply a non-interactive
method that is based on weighted goal programming and has been used for the utility
function assessment of large farms in Spain (Amador et al.,1998). In case of Greek
farming, this methodology has been applied for evaluating alternatives of tobacco
cultivation under the EU common agricultural policy (Manos et al., 2009) ,for
estimating milk supply from sheep farms (Sintori et al., 2010) and for the elicitation
of tree farmers’ goals(Karanikolas et al.,2013). In order to present the steps of
methodology, we use the description below that has been used in Karanikolas et al.
(2013).
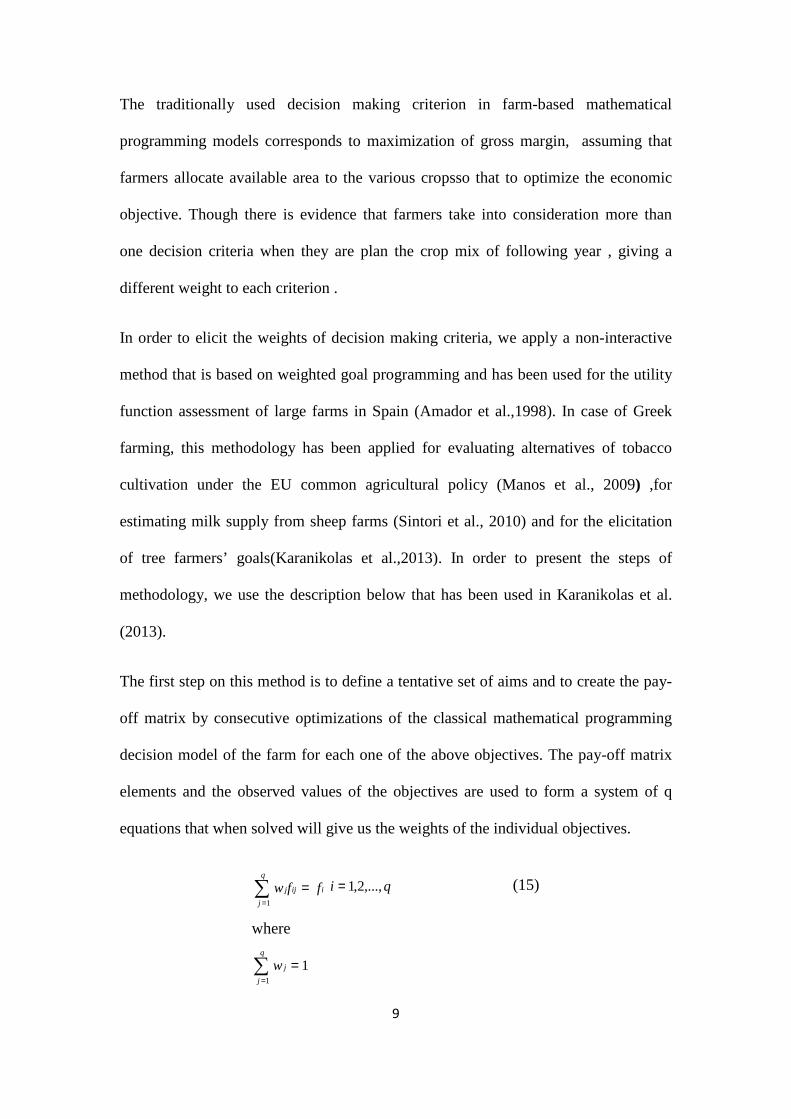
The first step on this method is to define a tentative set of aims and to create the pay-
off matrix by consecutive optimizations of the classical mathematical programming
decision model of the farm for each one of the above objectives. The pay-off matrix
elements and the observed values of the objectives are used to form a system of q
equations that when solved will give us the weights of the individual objectives.
∑=
=q
j
iijj ffw1
qi ,...,2,1= (15)
where
11
=∑=
q
j
jw
10
where jw the weight measuring the relative importance attached to the i-th objective,
ijf the value achieved by the i-th objective when the j-th objective is optimized and if
the observed value achieved by the i-th objective.
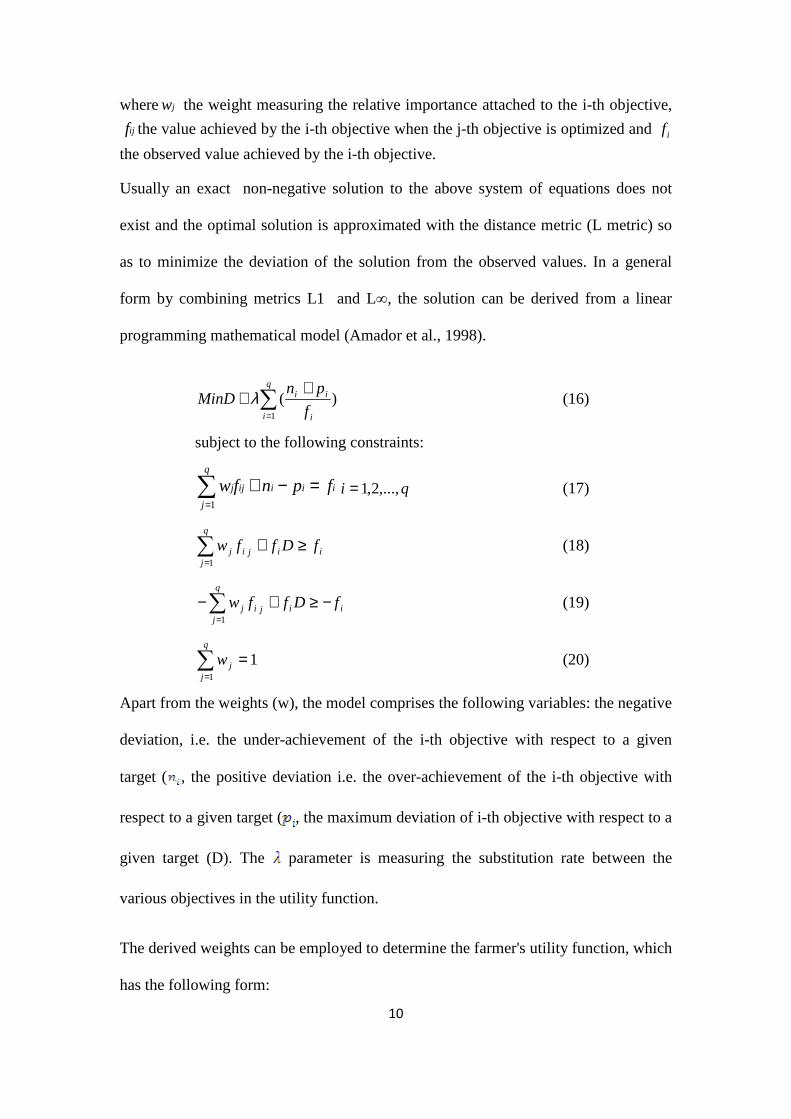
Usually an exact non-negative solution to the above system of equations does not
exist and the optimal solution is approximated with the distance metric (L metric) so
as to minimize the deviation of the solution from the observed values. In a general
form by combining metrics L1 and L∞, the solution can be derived from a linear
programming mathematical model (Amador et al., 1998).
)(1∑
=
++
q
i i
ii
f
pnMinD λ (16)
subject to the following constraints:
∑=
=−+q
j
iiiijj fpnfw1
qi ,...,2,1= (17)
∑=
≥+q
jiijij fDffw
1
(18)
∑=
−≥+−q
jiijij fDffw
1 (19)
∑=
=q
jjw
1
1 (20)
Apart from the weights (w), the model comprises the following variables: the negative
deviation, i.e. the under-achievement of the i-th objective with respect to a given
target ( , the positive deviation i.e. the over-achievement of the i-th objective with
respect to a given target (, the maximum deviation of i-th objective with respect to a
given target (D). The parameter is measuring the substitution rate between the
various objectives in the utility function.
The derived weights can be employed to determine the farmer's utility function, which
has the following form:
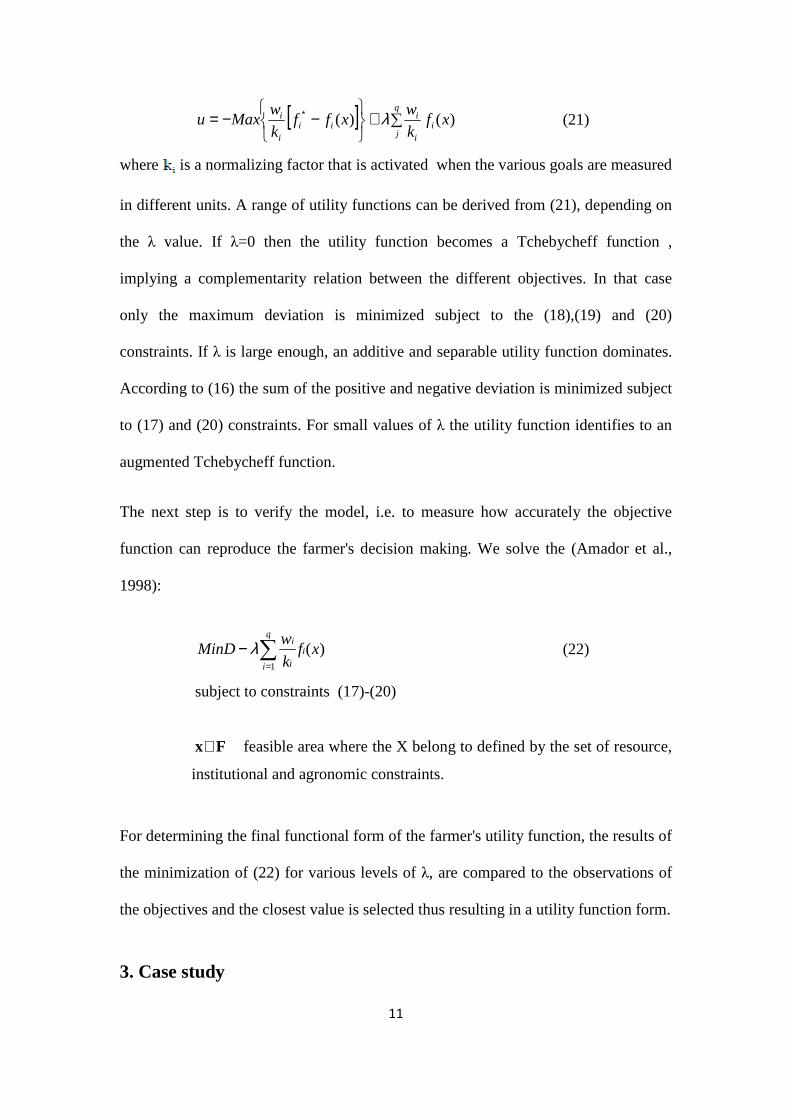
11
[ ] ∑+
−−= ∗q
ji
i
iii
i
i xfk
wxff
k
wMaxu )()( λ (21)
where is a normalizing factor that is activated when the various goals are measured
in different units. A range of utility functions can be derived from (21), depending on
the λ value. If λ=0 then the utility function becomes a Tchebycheff function ,
implying a complementarity relation between the different objectives. In that case
only the maximum deviation is minimized subject to the (18),(19) and (20)
constraints. If λ is large enough, an additive and separable utility function dominates.
According to (16) the sum of the positive and negative deviation is minimized subject
to (17) and (20) constraints. For small values of λ the utility function identifies to an
augmented Tchebycheff function.
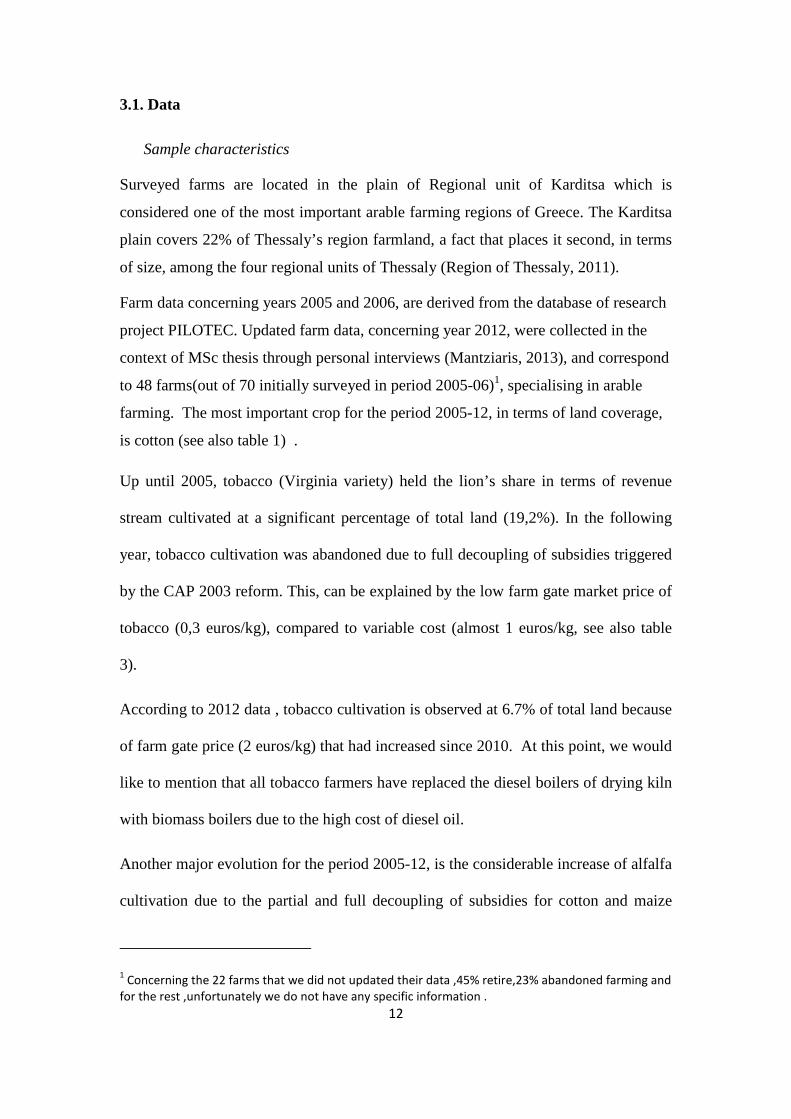
The next step is to verify the model, i.e. to measure how accurately the objective
function can reproduce the farmer's decision making. We solve the (Amador et al.,
1998):
)(1
xfk
wMinD i
q
i i
i
∑=
− λ
(22)
subject to constraints (17)-(20)
x∈F feasible area where the X belong to defined by the set of resource,
institutional and agronomic constraints.
For determining the final functional form of the farmer's utility function, the results of
the minimization of (22) for various levels of λ, are compared to the observations of
the objectives and the closest value is selected thus resulting in a utility function form.
3. Case study
12
3.1. Data
Sample characteristics
Surveyed farms are located in the plain of Regional unit of Karditsa which is
considered one of the most important arable farming regions of Greece. The Karditsa
plain covers 22% of Thessaly’s region farmland, a fact that places it second, in terms
of size, among the four regional units of Thessaly (Region of Thessaly, 2011).
Farm data concerning years 2005 and 2006, are derived from the database of research
project PILOTEC. Updated farm data, concerning year 2012, were collected in the
context of MSc thesis through personal interviews (Mantziaris, 2013), and correspond
to 48 farms(out of 70 initially surveyed in period 2005-06)1, specialising in arable
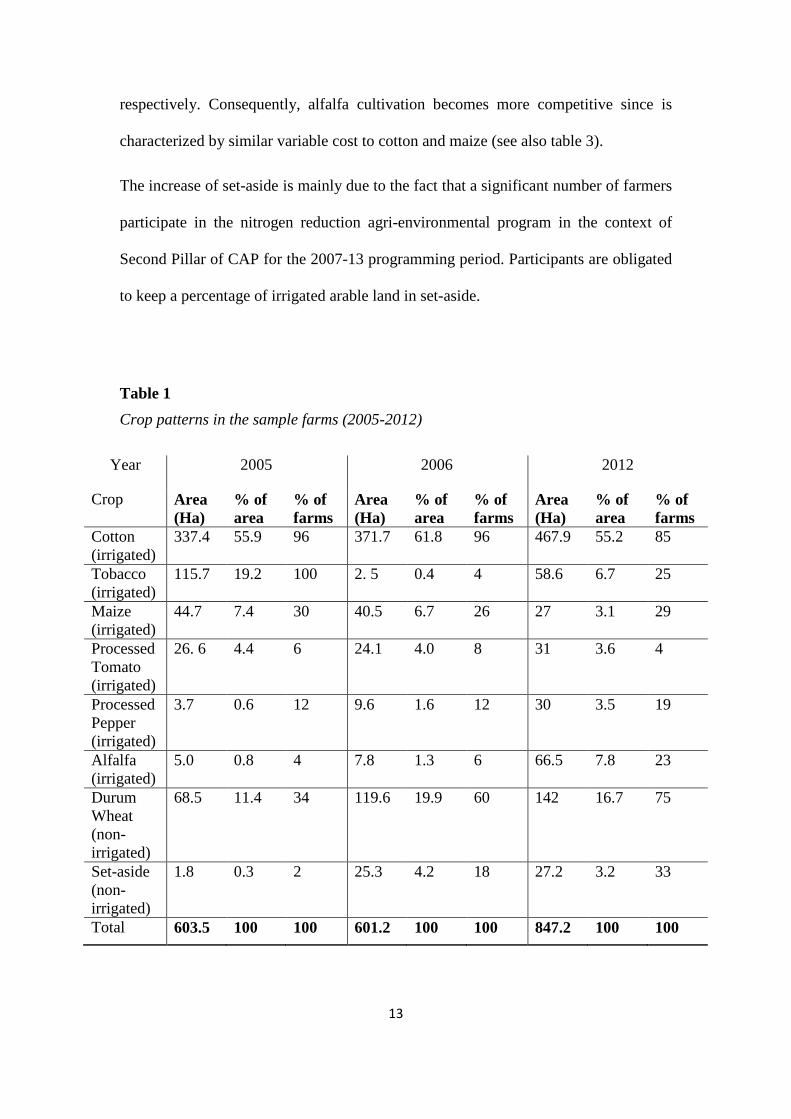
farming. The most important crop for the period 2005-12, in terms of land coverage,
is cotton (see also table 1) .
Up until 2005, tobacco (Virginia variety) held the lion’s share in terms of revenue
stream cultivated at a significant percentage of total land (19,2%). In the following
year, tobacco cultivation was abandoned due to full decoupling of subsidies triggered
by the CAP 2003 reform. This, can be explained by the low farm gate market price of
tobacco (0,3 euros/kg), compared to variable cost (almost 1 euros/kg, see also table
3).
According to 2012 data , tobacco cultivation is observed at 6.7% of total land because
of farm gate price (2 euros/kg) that had increased since 2010. At this point, we would
like to mention that all tobacco farmers have replaced the diesel boilers of drying kiln
with biomass boilers due to the high cost of diesel oil.
Another major evolution for the period 2005-12, is the considerable increase of alfalfa
cultivation due to the partial and full decoupling of subsidies for cotton and maize
1 Concerning the 22 farms that we did not updated their data ,45% retire,23% abandoned farming and
for the rest ,unfortunately we do not have any specific information .
13
respectively. Consequently, alfalfa cultivation becomes more competitive since is
characterized by similar variable cost to cotton and maize (see also table 3).
Τhe increase of set-aside is mainly due to the fact that a significant number of farmers
participate in the nitrogen reduction agri-environmental program in the context of
Second Pillar of CAP for the 2007-13 programming period. Participants are obligated
to keep a percentage of irrigated arable land in set-aside.
Table 1
Crop patterns in the sample farms (2005-2012)
Year 2005 2006 2012
Crop Area (Ha)
% of area
% of farms
Area (Ha)
% of area
% of farms
Area (Ha)
% of area
% of farms
Cotton (irrigated)
337.4 55.9 96 371.7 61.8 96 467.9 55.2 85
Tobacco (irrigated)
115.7 19.2 100 2. 5 0.4 4 58.6 6.7 25
Maize (irrigated)
44.7 7.4 30 40.5 6.7 26 27 3.1 29
Processed Tomato (irrigated)
26. 6 4.4 6 24.1 4.0 8 31 3.6 4
Processed Pepper (irrigated)
3.7 0.6 12 9.6 1.6 12 30 3.5 19
Alfalfa (irrigated)
5.0 0.8 4 7.8 1.3 6 66.5 7.8 23
Durum Wheat (non-irrigated)
68.5 11.4 34 119.6 19.9 60 142 16.7 75
Set-aside (non-irrigated)
1.8 0.3 2 25.3 4.2 18 27.2 3.2 33
Total 603.5 100 100 601.2 100 100 847.2 100 100
14
Focusing on the most recent data (2012) , the irrigated land covers approximately
80% of total land a relatively high percentage, considering that lower than 50% of
agricultural fields are irrigated at the country level. The average farm in the sample
cultivates 17.65 ha an area almost double in size compared to 7.2 ha of the average
farm in Greece and also when considering that 89% of the farms in Greece are, in
utilised agricultural areas (UAA) terms, equal or smaller than 10 ha (European
Commission, 2015) (see also table 2) Apparently, the sample farms can be considered
as adaptable and viable in the context of CAP 2003 reform, since their total land has
been enlarged significantly for the period 2005-12 . Taking into consideration that the
initial total land of sample was almost 810 hectares, we assume that the active farms
for 2012, enlarge their size from 603,5 hectares to 847, mainly because they
incorporate the abandoned land of the farms that we could not update data because
they went out of business for reasons described above. Additionally, the specific
farms cultivated mainly cotton and durum wheat . According to active sample
farmers, farms with specialization in cotton and durum wheat consider that were not
viable and abandon farming activity. Consequently, the active sample farms rented or
purchased the abandonment hectareage.
In terms of economic size, 64,75% farms in the survey achieve more than 16
Economic Size Units (ESU), since almost 84,7 % of the farms, at the country level,
have been classified in the "small farms" category (European Commission, 2015) (see
also table 2). The Economic Size Unit (ESU) represents the theoretical level of profit
that can be expected by a farm. The economic size of the agricultural holding is
calculated as the sum of the standard gross margins of the different agricultural
activities on the holding (European Commission, 2012). The 64% of gross revenue of
sample farms is derived from the market and almost 33% is derived from Single
15
payment. The average single payment value of the sample farms corresponds to
1780 euros and is relatively large ,since the average single payment, at the country
level , corresponds to 657 euros/ha(Agrenda,2013) Also , 61% of total land
corresponds to land entitlements. More than 90% of farms own the machinery for all
operations except of harvesting. Concerning the owners of harvesting equipment ,
22% of cotton farmers own that, 100% of processed tomato farmers and 45% of
alfalfa farmers .The 70% of total land is rented .Although farms surveyed are
presumably business-oriented, observed family labor use covers more than 30% of
total labor needs.
The 30% of the sample farms participate in optional agri-environmental measures of
Second Pillar. More specifically 23% of farms participate in nitrogen pollution
reduction program- methodology B, 4% in nitrogen reduction program- methodology
A and 4% in organic farming.
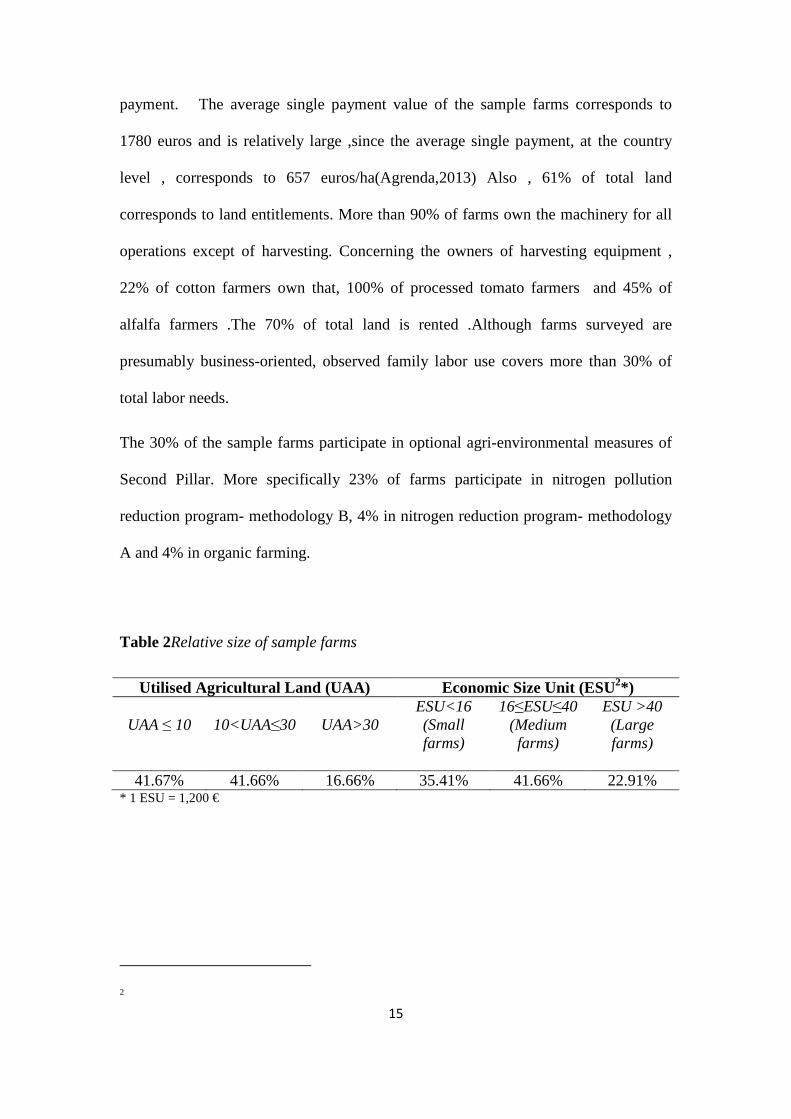
Table 2Relative size of sample farms
Utilised Agricultural Land (UAA) Economic Size Unit (ESU2*)
UAA ≤ 10
10<UAA≤30
UAA>30 ESU<16 (Small farms)
16≤ESU≤40 (Medium farms)
ESU >40 (Large farms)
41.67% 41.66% 16.66% 35.41% 41.66% 22.91%
* 1 ESU = 1,200 €
2
16
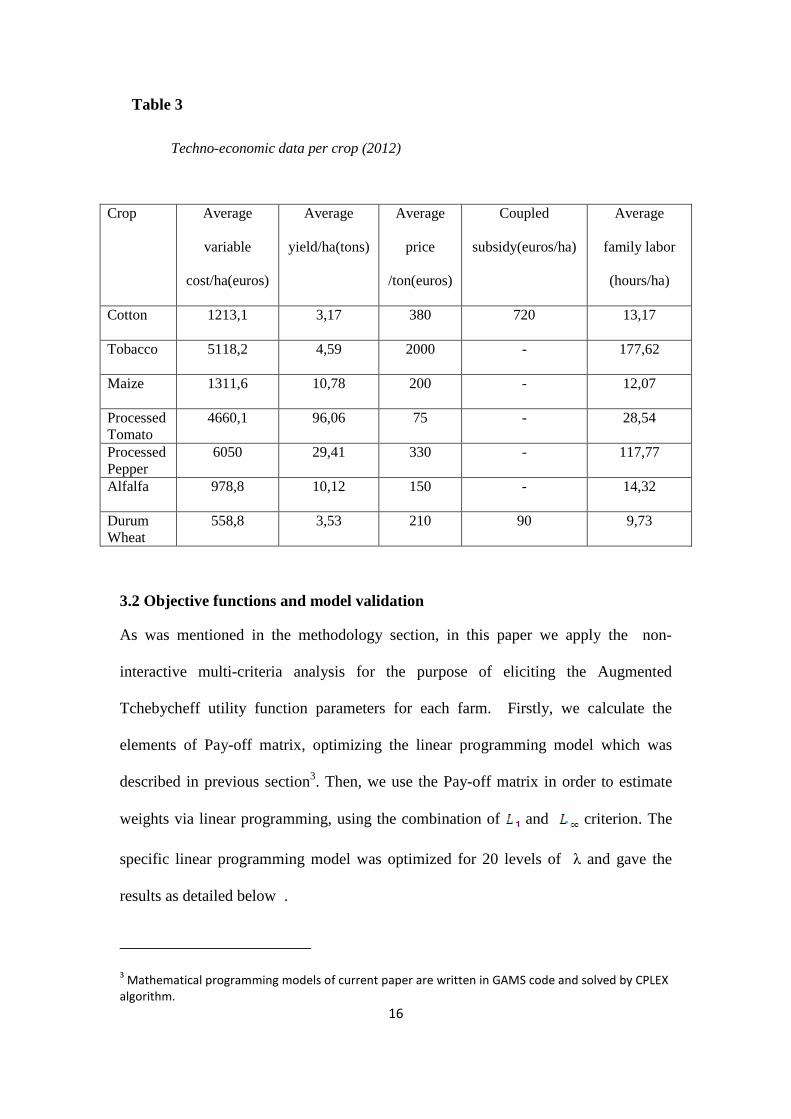
Table 3
Techno-economic data per crop (2012)
3.2 Objective functions and model validation
As was mentioned in the methodology section, in this paper we apply the non-
interactive multi-criteria analysis for the purpose of eliciting the Augmented
Tchebycheff utility function parameters for each farm. Firstly, we calculate the
elements of Pay-off matrix, optimizing the linear programming model which was
described in previous section3. Then, we use the Pay-off matrix in order to estimate
weights via linear programming, using the combination of and criterion. The
specific linear programming model was optimized for 20 levels of λ and gave the
results as detailed below .
3 Mathematical programming models of current paper are written in GAMS code and solved by CPLEX
algorithm.
Crop Average
variable
cost/ha(euros)
Average
yield/ha(tons)
Average
price
/ton(euros)
Coupled
subsidy(euros/ha)
Average
family labor
(hours/ha)
Cotton 1213,1 3,17 380 720 13,17
Tobacco 5118,2 4,59 2000 - 177,62
Maize 1311,6 10,78 200 - 12,07
Processed Tomato
4660,1 96,06 75 - 28,54
Processed Pepper
6050 29,41 330 - 117,77
Alfalfa 978,8 10,12 150 - 14,32
Durum Wheat
558,8 3,53 210 90 9,73
17
For 69% of farms, only one criterion is important, no weight is allocated to the rest of
the criteria. More specifically 50% of farms maximize the gross margin and 19% the
family labor criterion (see also appendix). Thus, these farms are represented by a
single criterion objective function.
For 27% of farms, two sets of weights occur, the first one with marginal distribution
among criteria and a second one with the selection of one criterion only. In order to
choose the suitable utility function, we will validate and compare the two different
function types for any farm. For the rest 4% , one set of weights with marginal
distribution among criteria occurs, so these farms will be represented by a unique
utility function.
In general, the model allocates major importance to gross margin maximization
criterion (see also appendix). This is due to the fact that most of farms are
characterized as business-oriented for Greek standards, thus, they attempt to
maximize their economic result.
A farm-based mathematical programming model is characterized useful for policy
analysis since it can reproduce base year crop mix adequately. In order to measure the
predictive capacity of model we use two different distance measures, namely relative
distance index (Kazakci et al.,2009) and Finger-Kreinin index (Finger &
Kreinin,1979). In case of relative distance index , the lowest rate correspond to highest
efficiency of model and the opposite stands in case of Finger-Kreinin index4 . For the
purpose of measuring predictive capacity in terms of farms, we apply the Finger-
4 When the observed and optimal crop mix are identical
the FK index becomes 100%.
18
Kreinin index . In case of measuring predictive capacity in terms of area, we apply
both indices.
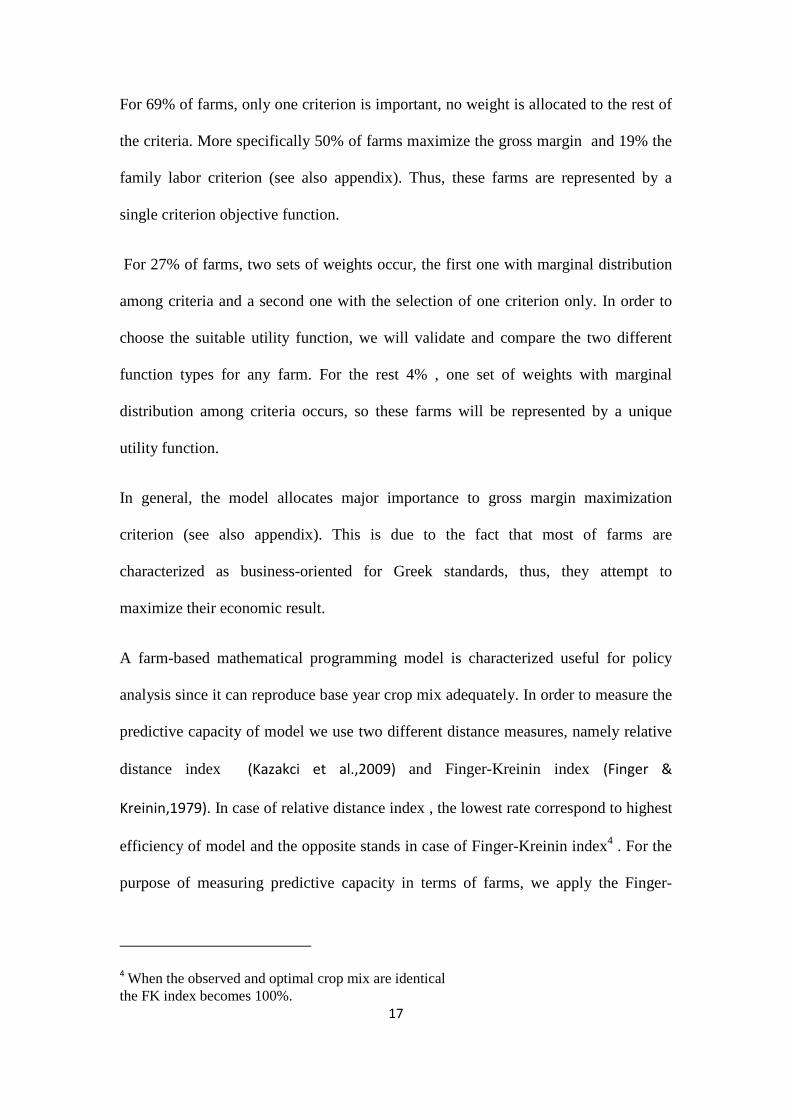
The mathematical formulation of indices as follows:
(23)
(24)
and correspond to optimal and observed crop mix respectively .
and correspond to optimal and observed total land respectively.
Considering total land constraint, the model does not provide the chance for total land
variation . Consequently = .
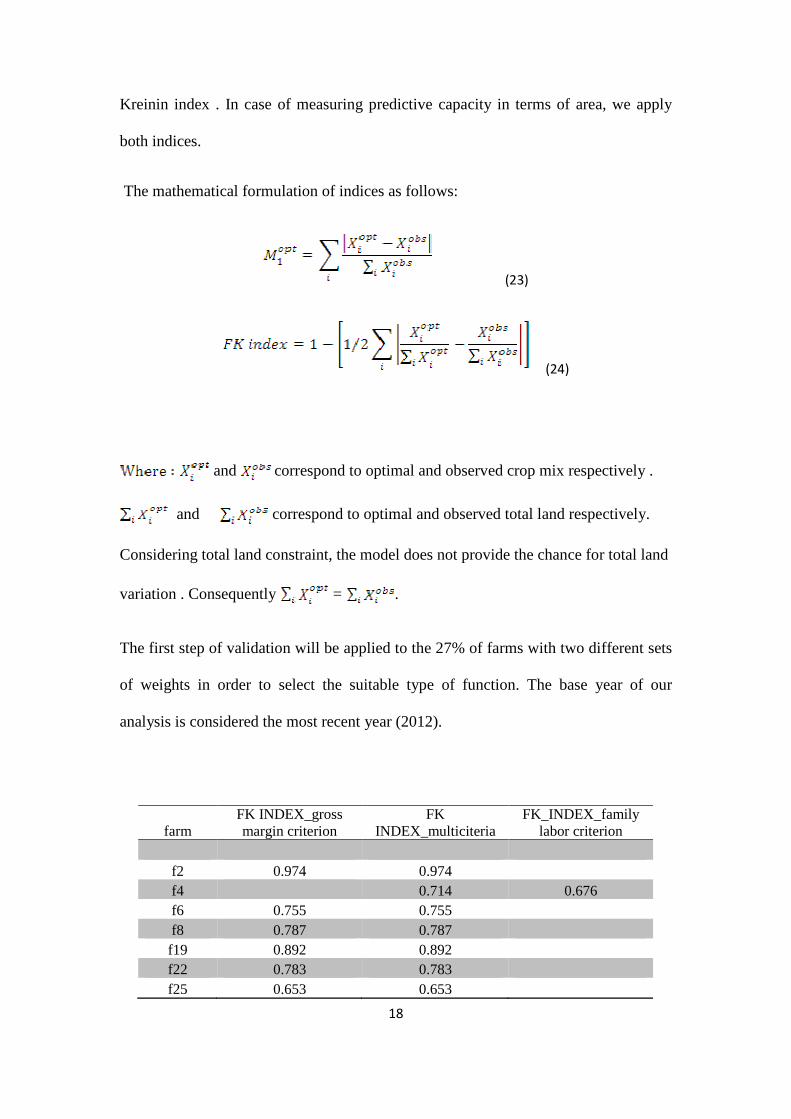
The first step of validation will be applied to the 27% of farms with two different sets
of weights in order to select the suitable type of function. The base year of our
analysis is considered the most recent year (2012).
farm FK INDEX_gross margin criterion
FK INDEX_multiciteria
FK_INDEX_family labor criterion
f2 0.974 0.974
f4 0.714 0.676 f6 0.755 0.755
f8 0.787 0.787
f19 0.892 0.892
f22 0.783 0.783
f25 0.653 0.653
19
Table 4 FK-Index results of farms with two set of criteria weights.
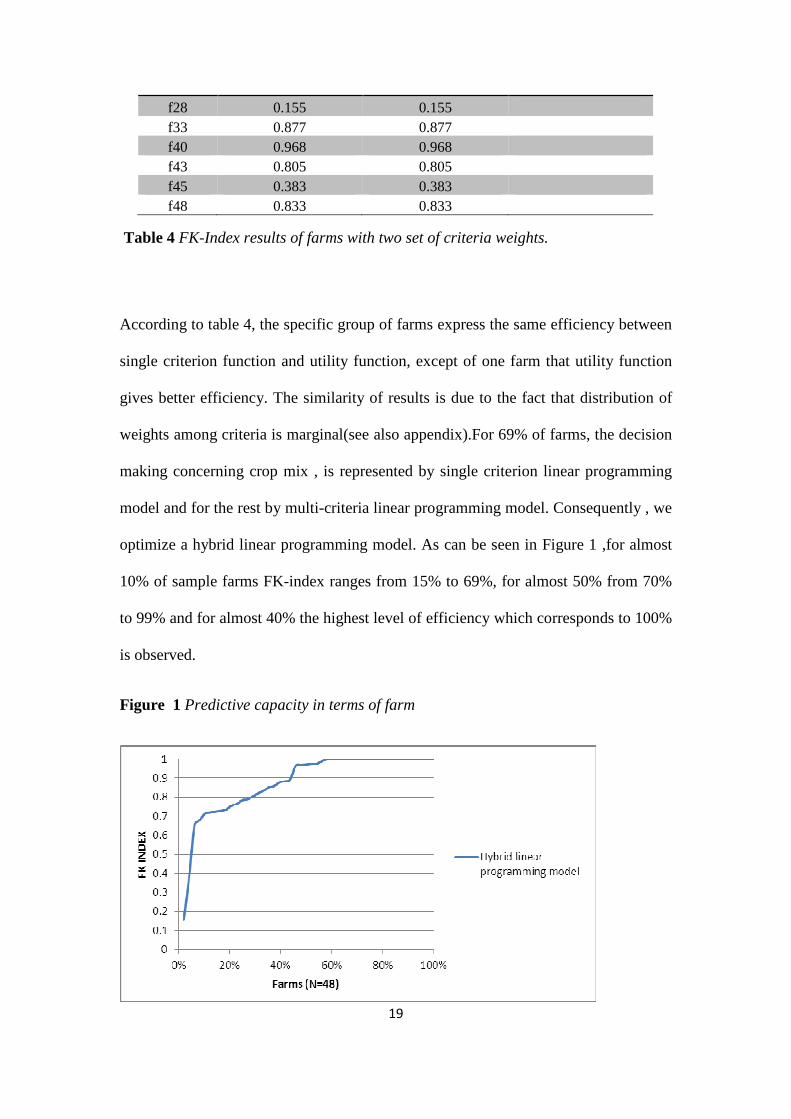
According to table 4, the specific group of farms express the same efficiency between
single criterion function and utility function, except of one farm that utility function
gives better efficiency. The similarity of results is due to the fact that distribution of
weights among criteria is marginal(see also appendix).For 69% of farms, the decision
making concerning crop mix , is represented by single criterion linear programming
model and for the rest by multi-criteria linear programming model. Consequently , we
optimize a hybrid linear programming model. As can be seen in Figure 1 ,for almost
10% of sample farms FK-index ranges from 15% to 69%, for almost 50% from 70%
to 99% and for almost 40% the highest level of efficiency which corresponds to 100%
is observed.
Figure 1 Predictive capacity in terms of farm
f28 0.155 0.155
f33 0.877 0.877
f40 0.968 0.968
f43 0.805 0.805
f45 0.383 0.383
f48 0.833 0.833
20
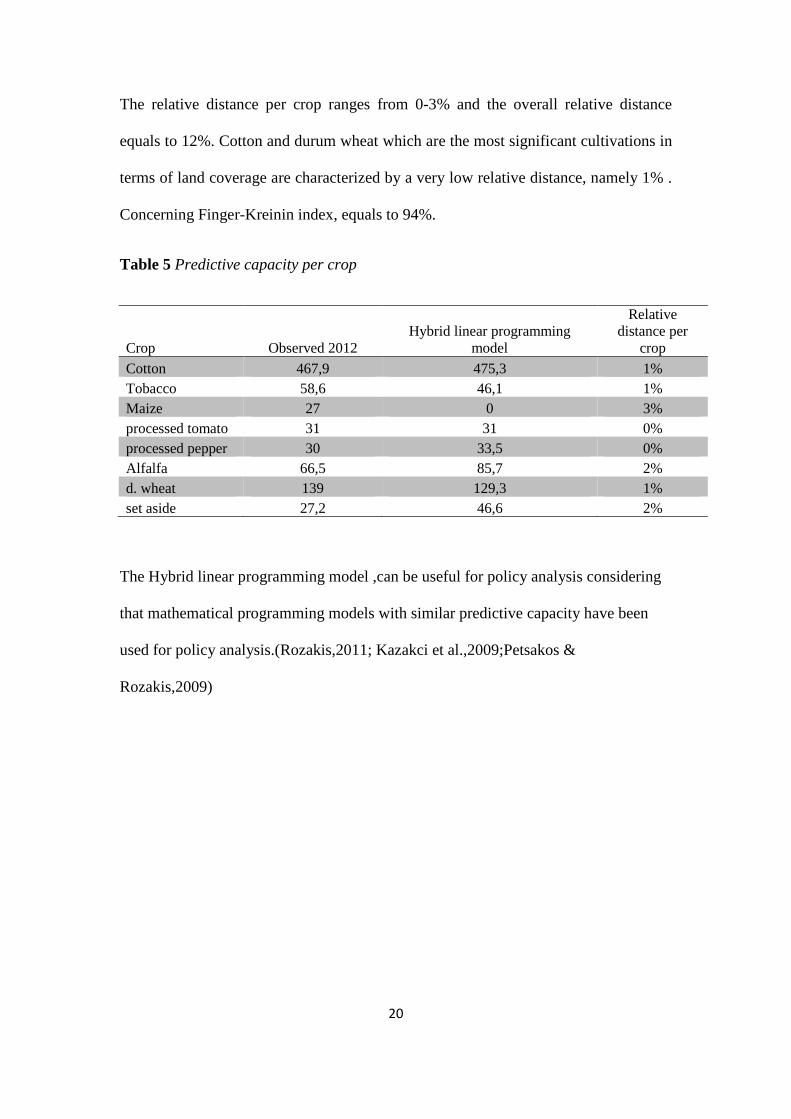
The relative distance per crop ranges from 0-3% and the overall relative distance
equals to 12%. Cotton and durum wheat which are the most significant cultivations in
terms of land coverage are characterized by a very low relative distance, namely 1% .
Concerning Finger-Kreinin index, equals to 94%.
Table 5 Predictive capacity per crop
Crop Observed 2012 Hybrid linear programming
model
Relative distance per
crop
Cotton 467,9 475,3 1% Tobacco 58,6 46,1 1% Maize 27 0 3% processed tomato 31 31 0% processed pepper 30 33,5 0% Alfalfa 66,5 85,7 2% d. wheat 139 129,3 1% set aside 27,2 46,6 2%
The Hybrid linear programming model ,can be useful for policy analysis considering
that mathematical programming models with similar predictive capacity have been
used for policy analysis.(Rozakis,2011; Kazakci et al.,2009;Petsakos &
Rozakis,2009)
21
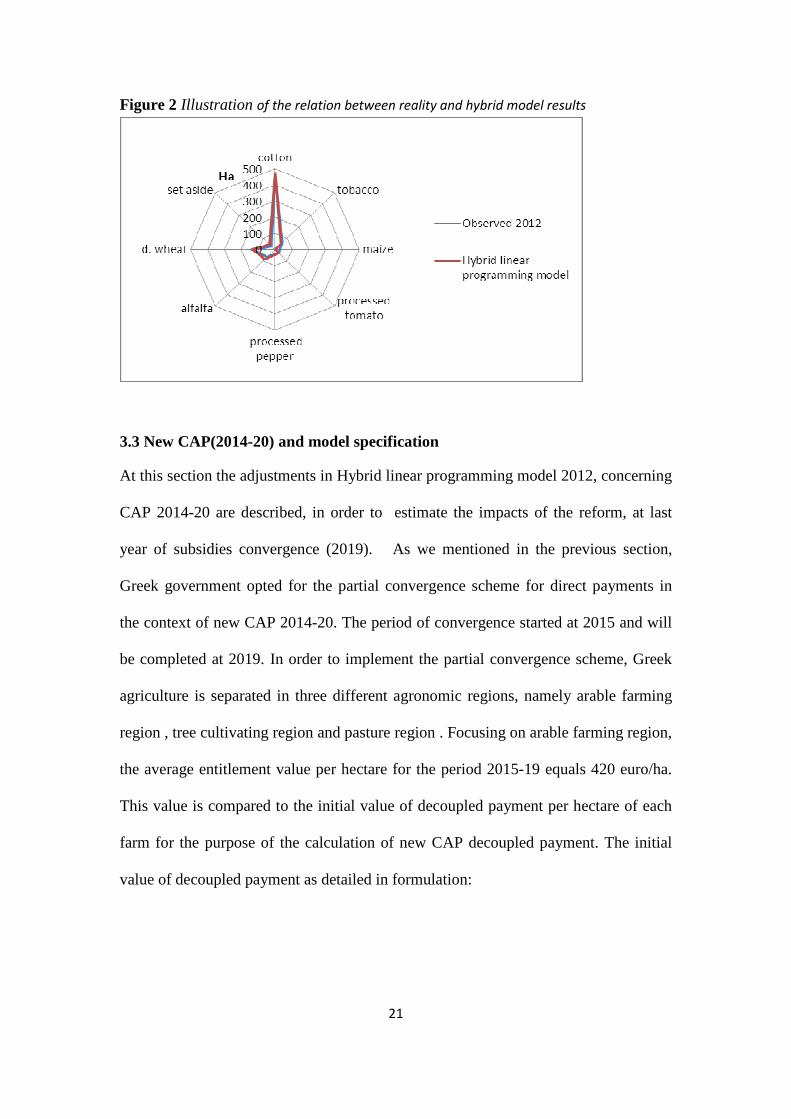
Figure 2 Illustration of the relation between reality and hybrid model results
3.3 New CAP(2014-20) and model specification
At this section the adjustments in Hybrid linear programming model 2012, concerning
CAP 2014-20 are described, in order to estimate the impacts of the reform, at last
year of subsidies convergence (2019). As we mentioned in the previous section,
Greek government opted for the partial convergence scheme for direct payments in
the context of new CAP 2014-20. The period of convergence started at 2015 and will
be completed at 2019. In order to implement the partial convergence scheme, Greek
agriculture is separated in three different agronomic regions, namely arable farming
region , tree cultivating region and pasture region . Focusing on arable farming region,
the average entitlement value per hectare for the period 2015-19 equals 420 euro/ha.
This value is compared to the initial value of decoupled payment per hectare of each
farm for the purpose of the calculation of new CAP decoupled payment. The initial
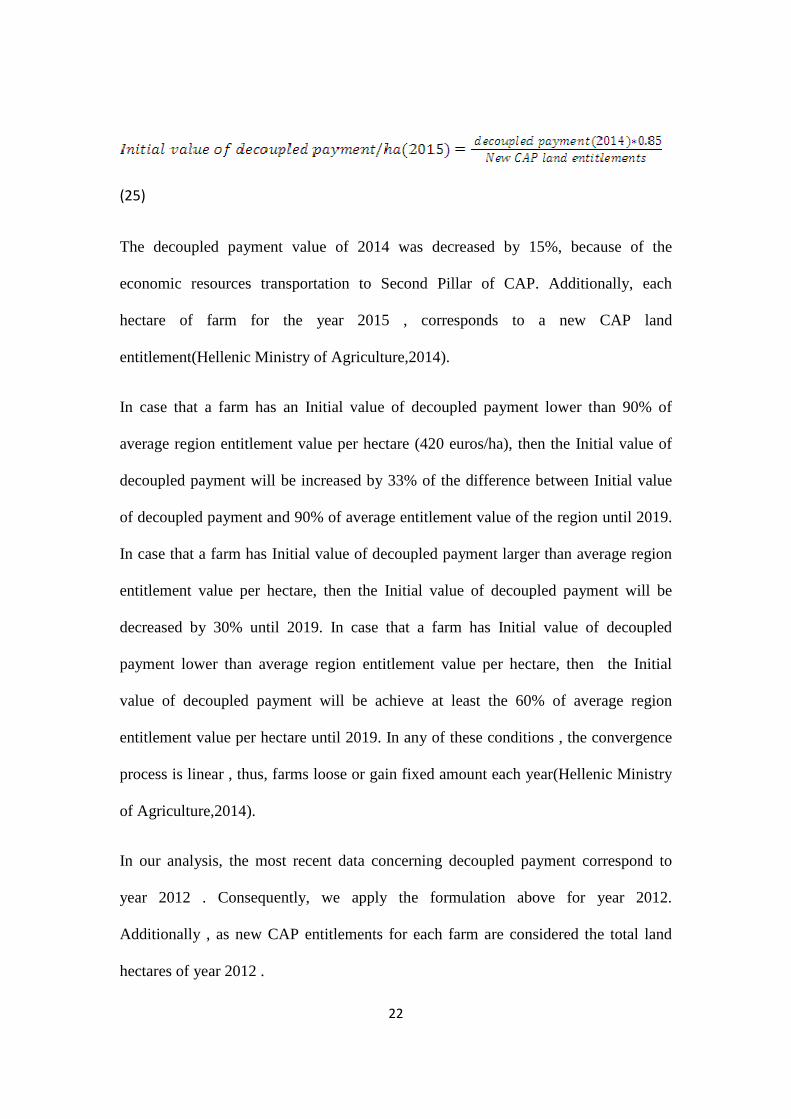
value of decoupled payment as detailed in formulation:
22
(25)
The decoupled payment value of 2014 was decreased by 15%, because of the
economic resources transportation to Second Pillar of CAP. Additionally, each
hectare of farm for the year 2015 , corresponds to a new CAP land
entitlement(Hellenic Ministry of Agriculture,2014).
In case that a farm has an Initial value of decoupled payment lower than 90% of
average region entitlement value per hectare (420 euros/ha), then the Initial value of
decoupled payment will be increased by 33% of the difference between Initial value
of decoupled payment and 90% of average entitlement value of the region until 2019.
In case that a farm has Initial value of decoupled payment larger than average region
entitlement value per hectare, then the Initial value of decoupled payment will be
decreased by 30% until 2019. In case that a farm has Initial value of decoupled
payment lower than average region entitlement value per hectare, then the Ιnitial
value of decoupled payment will be achieve at least the 60% of average region
entitlement value per hectare until 2019. In any of these conditions , the convergence
process is linear , thus, farms loose or gain fixed amount each year(Hellenic Ministry
of Agriculture,2014).
In our analysis, the most recent data concerning decoupled payment correspond to
year 2012 . Consequently, we apply the formulation above for year 2012.
Additionally , as new CAP entitlements for each farm are considered the total land
hectares of year 2012 .
23
After calculating new CAP decoupled payment per hectare for each farm that will be
stands at 2019, we adjusted accordingly the parameters of decoupled payment per
hectare and land entitlements of Hybrid linear programming model 2012 . Also, we
added three constraints to represent the obligations of farms, in order to be received
whole new CAP decoupled payment (Greek Ministry of Agriculture,2014) (see also
appendix for more information). Policy constraints-First pillar
1. Entitlements activation:
(26)
Set aside area cannot exceed 50% of the land entitlements area.
2. Crop diversification obligation for farms with land entitlements area > 10 hectares:
, n=1,2,3….N (27)
Cropping area of each crop cannot exceed 75% of the land entitlements area.
3. Ecologic focus area obligation for farms with land entitlements area > 15 hectares:
(28)
The 70% of sum of legume crops area plus set aside area must be at least equal to 5%
of land entitlements area.
At this point, we would like to refer that farms with land entitlements area larger than
15 hectares are also obligated to apply the constraint 2.
24
Except of the decoupled payment adjustment and the inclusion of new policy
constraints, we also modified the availability of resources, namely the working
capital. According to 2012 data, 63% of farms intent the decoupled payment for
covering working capital requirements. Thus, we tried to predict the working capital
levels at last year of convergence (2019), according to formulations below. For farms
with working capital larger than decoupled payment stands the formulation 1, and the
formulation 2 stands for farms with the opposite relation. Consequently , we adjusted
accordingly the parameter that concerns working capital . For the rest of farms (37%)
, working capital was assumed invariable at 2012 levels.
1. Projected working capital_2019= working capital (2012) +added value (or removal) of
projected decoupled subsidy_2019 (29)
2.
(30)
Another significant modification of the model concerns the land subsidies that stand
for year 2019 . More specifically , for cotton equals 750 euros/ha, for durum wheat
equals 55 euros/ha to ,for alfalfa equals 167 and for processed tomato equals 402
euros/ha. The rest of parameters and constraints that stand for Hybrid linear
programming model 2012, were assumed invariable at 2012 levels.
3.4 Third Memorandum taxation measures and model specification
In August 2015, Third Memorandum was enshrined in Greek Law. The new taxation
measures contain the agricultural sector and may affect the viability of Greek farms.
The measures that will be applied concern the agricultural inputs and the profit tax.
25
More specifically, at the ends of 2016 will be abolished the tax allowance of diesel
oil(Agronews,2015) . Concerning profit tax , rate will be increased from 13% at 2015
to 26% at 2017 and the rate of prepaid profit tax will be increased from 75% at 2015
to 100% at 2016.(Niforopoulos & Papadimitriou,2016). In order to estimate the
impacts of new taxation measures in combination with new CAP , we calculated the
new diesel oil cost which is increased by 38,7% , then we adjusted the parameter of
crop variable cost of new CAP model . Additionally, we adjusted the new profit tax in
projected gross margin of 2019 5 , compared to gross margin of Hybrid linear
programming model 2012 in which has been applied tax coefficient equals to 13%.
Accordingly , we examined one more scenario, that combine these two important
institutional interventions(CAP reform, Third Memorandum).
4.Results
The Hybrid linear programming model 2012 will be used to evaluate the impacts of
new CAP and Third Memorandum taxation measures , focusing at last year of
decoupled payments convergence, namely at 2019. The model has been modified
accordingly for each of two scenarios, namely New CAP 2019 scenario and New
CAP and Tax Measures 2019. The scenario impact analysis corresponds to
comparative static analysis, since the model does not provide the chance for total land
variability. Before we analyze the impacts of scenarios in crop mix and viability of
farms, we would like to present the impacts on model parameters that affected by
each scenario.
5 We take into consideration the non-taxable limit that stands for subsidies up to 12.000 euros. The
estimation does not include depreciations and prepaid tax .
26
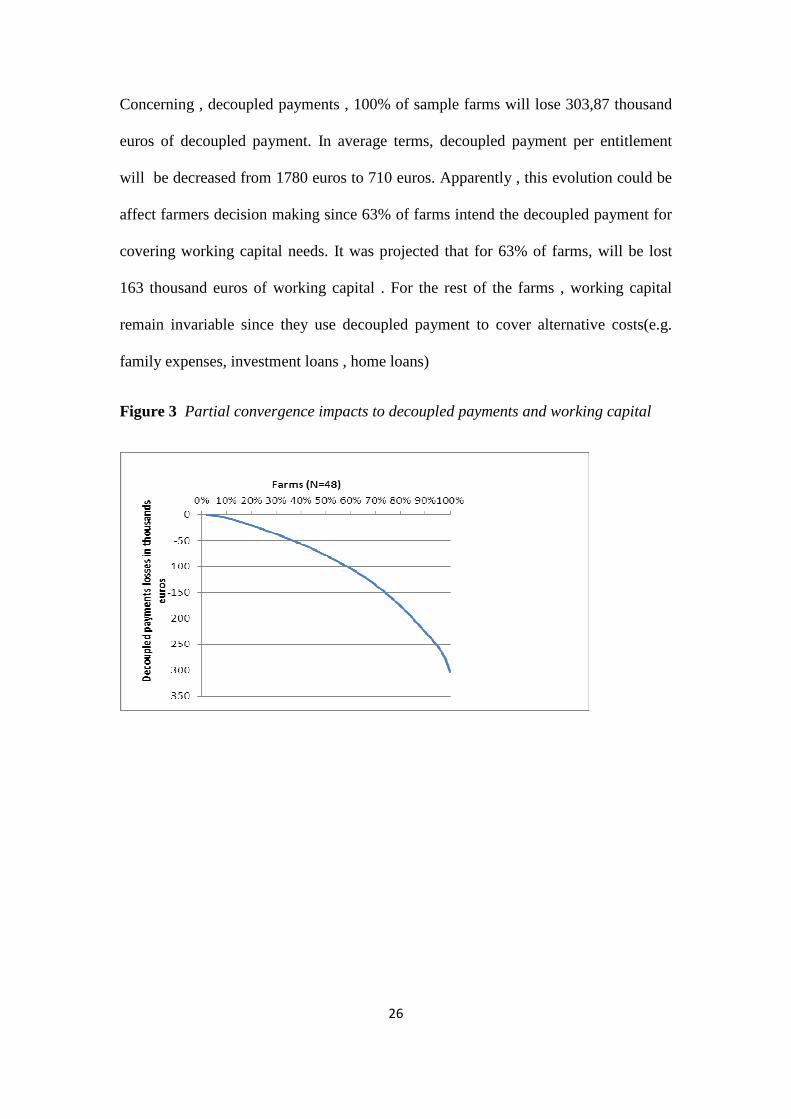
Concerning , decoupled payments , 100% of sample farms will lose 303,87 thousand
euros of decoupled payment. In average terms, decoupled payment per entitlement
will be decreased from 1780 euros to 710 euros. Apparently , this evolution could be
affect farmers decision making since 63% of farms intend the decoupled payment for
covering working capital needs. It was projected that for 63% of farms, will be lost
163 thousand euros of working capital . For the rest of the farms , working capital
remain invariable since they use decoupled payment to cover alternative costs(e.g.
family expenses, investment loans , home loans)
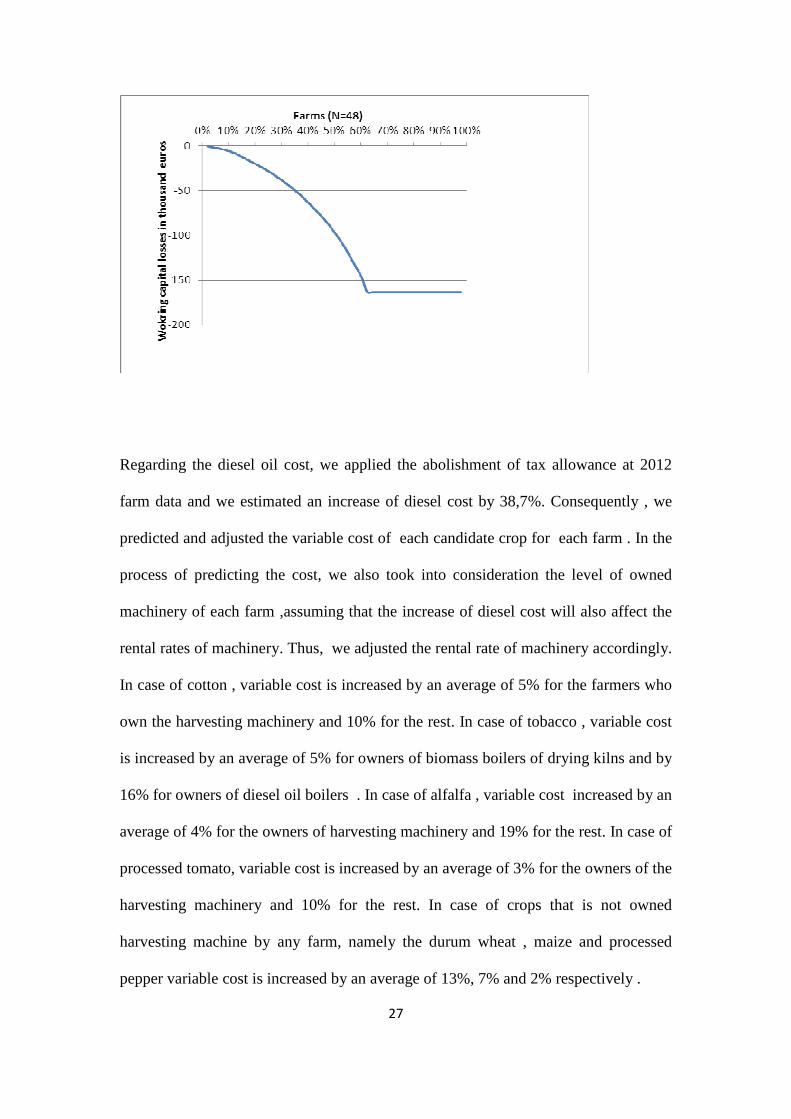
Figure 3 Partial convergence impacts to decoupled payments and working capital
27
Regarding the diesel oil cost, we applied the abolishment of tax allowance at 2012
farm data and we estimated an increase of diesel cost by 38,7%. Consequently , we
predicted and adjusted the variable cost of each candidate crop for each farm . In the
process of predicting the cost, we also took into consideration the level of owned
machinery of each farm ,assuming that the increase of diesel cost will also affect the
rental rates of machinery. Thus, we adjusted the rental rate of machinery accordingly.
In case of cotton , variable cost is increased by an average of 5% for the farmers who
own the harvesting machinery and 10% for the rest. In case of tobacco , variable cost
is increased by an average of 5% for owners of biomass boilers of drying kilns and by
16% for owners of diesel oil boilers . In case of alfalfa , variable cost increased by an
average of 4% for the owners of harvesting machinery and 19% for the rest. In case of
processed tomato, variable cost is increased by an average of 3% for the owners of the
harvesting machinery and 10% for the rest. In case of crops that is not owned
harvesting machine by any farm, namely the durum wheat , maize and processed
pepper variable cost is increased by an average of 13%, 7% and 2% respectively .
28
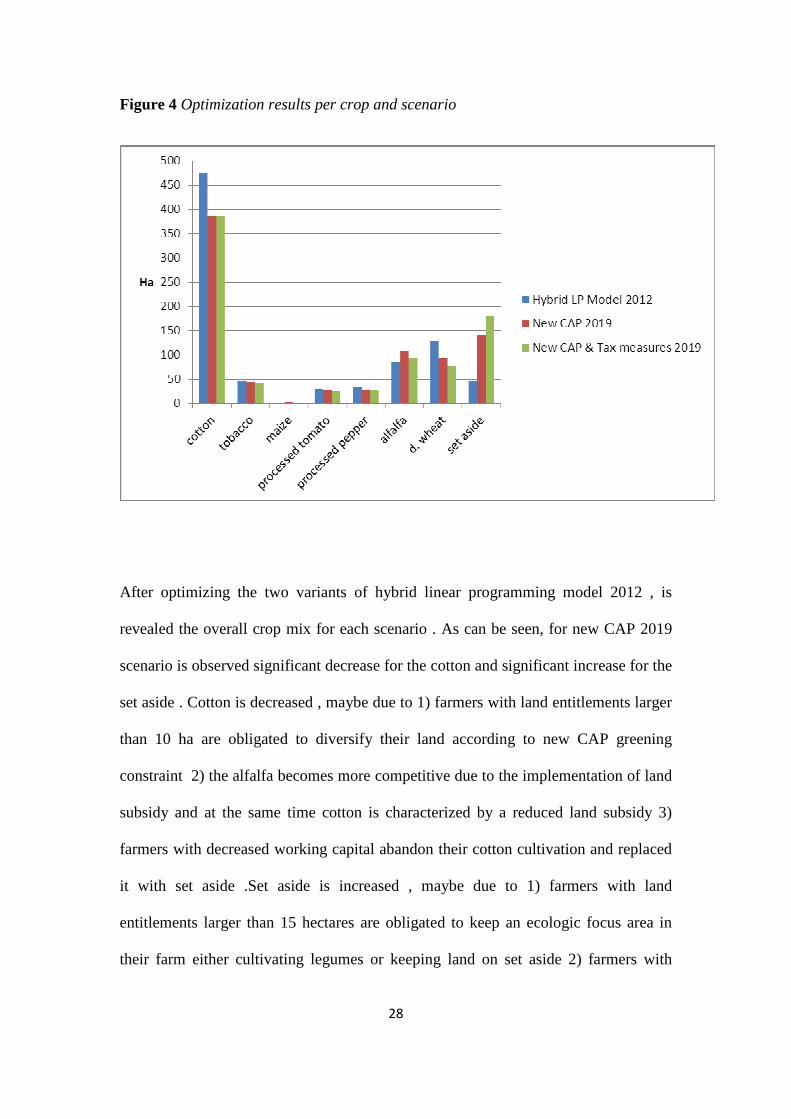
Figure 4 Optimization results per crop and scenario
After optimizing the two variants of hybrid linear programming model 2012 , is
revealed the overall crop mix for each scenario . As can be seen, for new CAP 2019
scenario is observed significant decrease for the cotton and significant increase for the
set aside . Cotton is decreased , maybe due to 1) farmers with land entitlements larger
than 10 ha are obligated to diversify their land according to new CAP greening
constraint 2) the alfalfa becomes more competitive due to the implementation of land
subsidy and at the same time cotton is characterized by a reduced land subsidy 3)
farmers with decreased working capital abandon their cotton cultivation and replaced
it with set aside .Set aside is increased , maybe due to 1) farmers with land
entitlements larger than 15 hectares are obligated to keep an ecologic focus area in
their farm either cultivating legumes or keeping land on set aside 2) farmers with
29
decreased working capital abandon cotton or/and durum wheat and replaced them
with set aside and at the same time they activate their land entitlements in line with
the requirement that set aside does not exceed the 50% of land entitlements.
As regard the New CAP and Tax measures 2019 scenario, generally are not observed
significant variations compared to New CAP 2019 . As important variation ,could be
characterized the additional increase of set aside , maybe ,because of considerable
increase of cost for durum wheat and alfalfa . Both scenarios reveal a major decrease
of irrigated land. This variation could be characterized positive under circumstances
,taking into consideration that water resources of Greek arable farming are considered
quite lumbered.
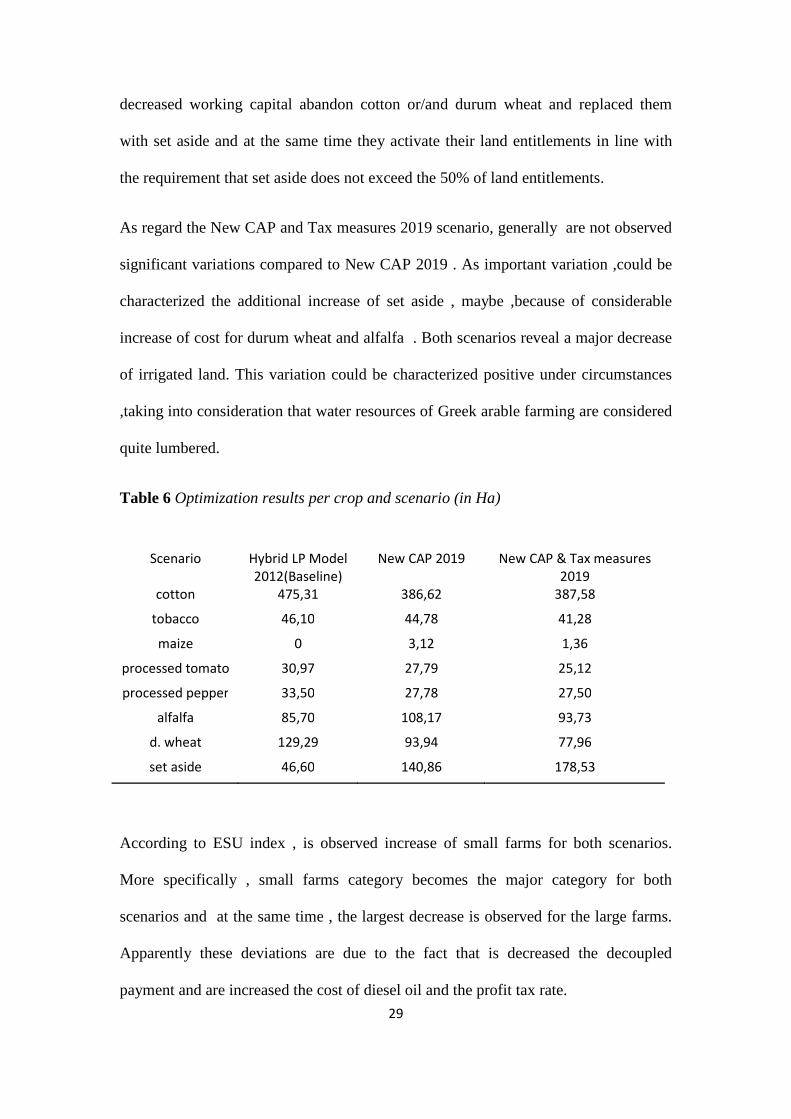
Table 6 Optimization results per crop and scenario (in Ha)
According to ESU index , is observed increase of small farms for both scenarios.
More specifically , small farms category becomes the major category for both
scenarios and at the same time , the largest decrease is observed for the large farms.
Apparently these deviations are due to the fact that is decreased the decoupled
payment and are increased the cost of diesel oil and the profit tax rate.
Scenario Hybrid LP Model
2012(Baseline)
New CAP 2019 New CAP & Tax measures
2019
cotton 475,31 386,62 387,58
tobacco 46,10 44,78 41,28
maize 0 3,12 1,36
processed tomato 30,97 27,79 25,12
processed pepper 33,50 27,78 27,50
alfalfa 85,70 108,17 93,73
d. wheat 129,29 93,94 77,96
set aside 46,60 140,86 178,53
30
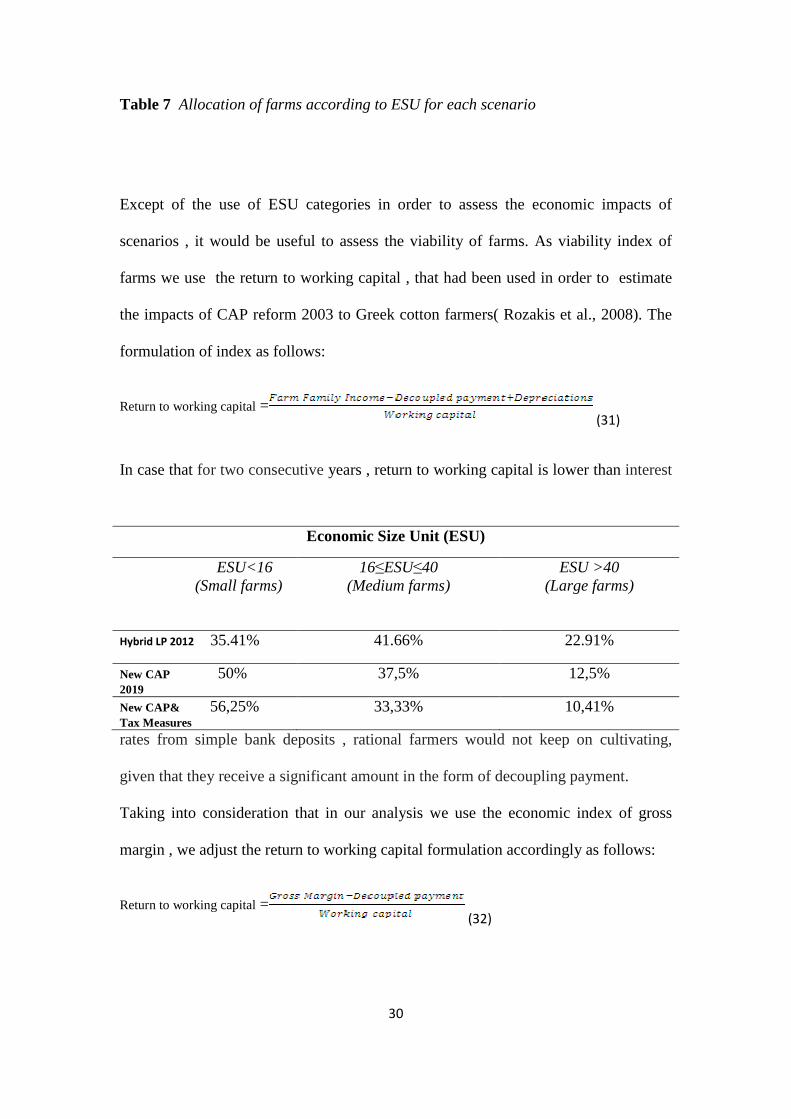
Table 7 Allocation of farms according to ESU for each scenario
Except of the use of ESU categories in order to assess the economic impacts of
scenarios , it would be useful to assess the viability of farms. As viability index of
farms we use the return to working capital , that had been used in order to estimate
the impacts of CAP reform 2003 to Greek cotton farmers( Rozakis et al., 2008). The
formulation of index as follows:
Return to working capital = (31)
In case that for two consecutive years , return to working capital is lower than interest
rates from simple bank deposits , rational farmers would not keep on cultivating,
given that they receive a significant amount in the form of decoupling payment.
Taking into consideration that in our analysis we use the economic index of gross
margin , we adjust the return to working capital formulation accordingly as follows:
Return to working capital = (32)
Economic Size Unit (ESU)
ESU<16 (Small farms)
16≤ESU≤40 (Medium farms)
ESU >40 (Large farms)
Hybrid LP 2012 35.41% 41.66% 22.91%
New CAP 50% 2019
37,5% 12,5%
New CAP& 56,25% Tax Measures
33,33% 10,41%
31
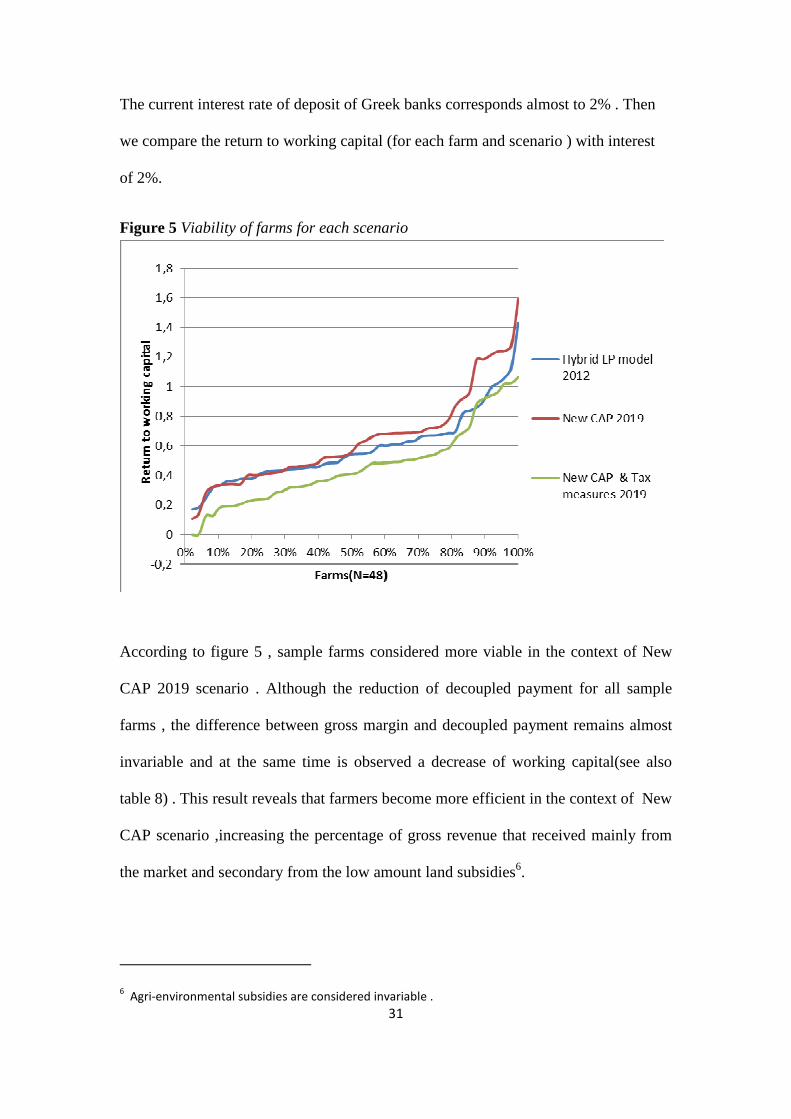
The current interest rate of deposit of Greek banks corresponds almost to 2% . Then
we compare the return to working capital (for each farm and scenario ) with interest
of 2%.
Figure 5 Viability of farms for each scenario
According to figure 5 , sample farms considered more viable in the context of New
CAP 2019 scenario . Although the reduction of decoupled payment for all sample
farms , the difference between gross margin and decoupled payment remains almost
invariable and at the same time is observed a decrease of working capital(see also
table 8) . This result reveals that farmers become more efficient in the context of New
CAP scenario ,increasing the percentage of gross revenue that received mainly from
the market and secondary from the low amount land subsidies6.
6 Agri-environmental subsidies are considered invariable .
32
In case of New CAP & Tax measures 2019 scenario ,the sample farms are less viable
compared to baseline and New CAP 2019 scenario, because of the increase of tax
profit rate from 13% to 26% and the increase of diesel oil cost by 38,7% in the
context of abolishment of tax allowance. Additionally, it is observed a 4% of non-
viable farms for the specific scenario. In general, sample farms could be characterized
as viable due to they receive 64% of their gross revenue from the market.
Consequently, they are not affected enough by CAP reforms that may reduce their
subsidies levels. The combination of CAP reform and taxation measures of Third
Memorandum could reduce their viability significantly ,but even if that scenario 96%
of farms remain viable.
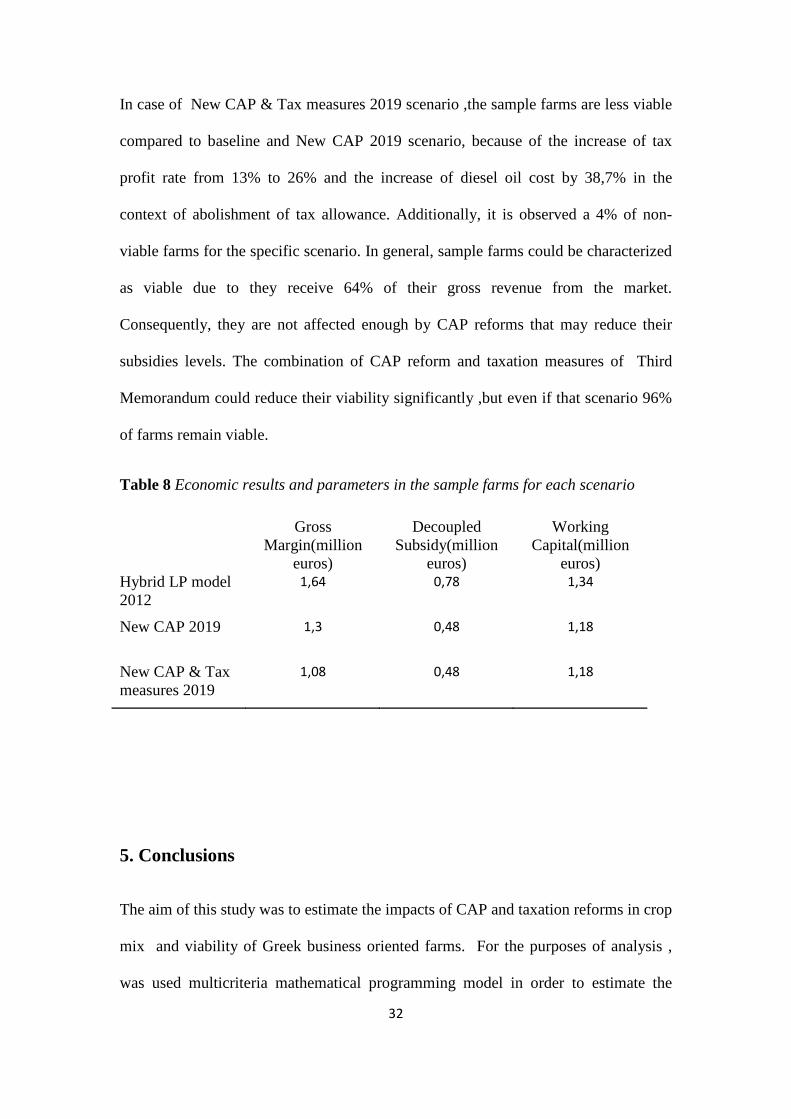
Table 8 Economic results and parameters in the sample farms for each scenario
5. Conclusions
The aim of this study was to estimate the impacts of CAP and taxation reforms in crop
mix and viability of Greek business oriented farms. For the purposes of analysis ,
was used multicriteria mathematical programming model in order to estimate the
Gross Margin(million
euros)
Decoupled Subsidy(million
euros)
Working Capital(million
euros) Hybrid LP model 2012
1,64 0,78 1,34
New CAP 2019 1,3 0,48 1,18
New CAP & Tax measures 2019
1,08 0,48 1,18
33
utility functions that represent the crop mix decision making of a sample farms
located in regional unit of Karditsa . The validation results of model confirm that most
of business oriented farms are willing to optimize their economic results ,namely the
gross margin . Although, the business oriented type of farms , model results reveals
that almost 20% of farms still contain the element of family labor in the process of
crop mix decision making . Generally , the sample farms are almost concentrated in
one goal when plan the crop mix of the following year . Regarding the impacts of
CAP reform in crop mix , is observed reduction for cotton and durum wheat ,and on
the other hand set aside and alfalfa are increased . From the environmental point of
view , we could say that CAP reform could reduce the degradation of water
resources that is observed in Greek regions of intensive agriculture like
Thessaly,Central Greece and Central Macedonia . Concerning the viability of farms,
are not affected negatively . In case of combined scenario (CAP & tax reform) , crop
mix remains almost the same but the viability is decreased significantly . Even if that
scenario , 96% of farms remain viable since 64% of gross revenue is derived from
market.
Concerning analytical tools, further research could be undertaken , in order to
estimate the impacts of policy via a sequential mathematical programming model
which takes into consideration the changes of farms behavior in the mid-term period,
providing more realistic results
References
34
Agrenda,2013.Common Agricultural Policy 2015(in Greek)Agrenda newspapers.
Available at:http://www.agronews.gr/?pid=143&pdfID=1600&la=0
Agronews,2015.Tripling of diesel oil tax rate and reduction of tax return by 50%
for 2016(in Greek). Available at:
http://www.agronews.gr/?pid=190&aid=133555&la=1
Amador F., Sumpsi J.M. and Romero C., 1998. A non-interactive methodology to
assess farmers΄ utility functions: An application to large farms in Andalusia, Spain.
European Review of Agricultural Economics, 25: 92-109.
Solazzo R., Donati M., Arfini F. and Petriccione G.,2014. A PMP model for the
impact assessment of the Common Agricultural Policy reform 2014-2020 on the
Italian tomato sector. New Medit, 13(2): 9-19. Available at :
http://www.iamb.it/share/img_new_medit_articoli/976_9solazzo.pdf
Cimino O., Henke R. and Vanni F.,2015. The effects of CAP greening on
specialised arable farms in Italy.New Medit, 14(2):22-31.
Donati M., Menozzi D. and Fioravzanzi M.,2015. Understanding farmers’
responses to CAP reform. New Medit, 14(3):23-39. Available at :
http://www.iamb.it/share/img_new_medit_articoli/1027_29donati.pdf
European Commission, 2015. Member States Factsheets – Greece. Available at:
http://ec.europa.eu/agriculture/statistics/factsheets/pdf/el_en.pdf
European Commission, 2012b. Generational renewal in EU agriculture: Statistical
background.EU Agricultural Economic Briefs, Brief N° 6 – June 2012 . Available at:
http://ec.europa.eu/agriculture/rural-area-economics/briefs/pdf/06_en.pdf
Finger J.M. and Kreinin M.E. (1979). A measure of ‘Export similarity’ and its
possible uses. Economic Journal ,89: 905-912.
Hellenic Ministry of Agriculture, 2014. The context of Common Agricultural
Policy after 2015-First Pillar: Direct Payments (in Greek). Available at:
http://www.minagric.gr/images/stories/agropol/Greek/Agro_pol/KAP/Parousiasi_gia_
site_short_FINAL.pdf
35
Karanikolas P., Rozakis S. and Kremmydas,D., 2013. The multiplicity of goals in
tree-cultivating farms in Greece. Working Papers 2013-2, Agricultural University of
Athens, Department Of Agricultural Economics. Available at:
http://aoatools.aua.gr/RePEc/aua/wpaper/files/2013-2_karanikolas_multiplicity.pdf
Kazakci A., Rozakis S. and Sourie J-C.,2009. Min-max regret versus gross margin
maximization in arable sector modeling. Agricultural University of Athens,
Department Of Agricultural Economics .Working Papers , 1-33. Available at:
http://aoatools.aua.gr/RePEc/aua/wpaper/files/2009-1_ILPpaper_090224.pdf
Manos B., Bournaris T., Papathanasiou J. and Chatzinikolaou P., (2009)
Evaluation of tobacco cultivation alternatives under the EU CAP. Journal of Policy
Modeling, 31:225–238.
Mantziaris, S., 2013. Verification of the predictive capacity of arable farm-based
mathematical programming model in regional unit of Karditsa for the period 2005-
12. MSc Thesis, Agricultural University of Athens, Dept. of Agricultural Economics
and Rural Development, Greece (in Greek)
Mattas K., Loizou E., Rozakis S., Tzouvelekas E.,2006. Agricultural modelling: an
input-output approach,. F. Ferretti (ed.), Leaves and Cigarettes : Modelling the
tobacco industry, with application to Italy and Greece, Milano: Francoangeli
Publisher.
.Niforopoulos K. and Papadimitriou G.,2016. Taxation of agricultural
sector.Issues and concerns (in Greek). Available at:
http://www.agrotechniki.gr/NewsFiles/1_%CE%A6%CE%9F%CE%A1%CE%9F
%CE%9B%CE%9F%CE%93%CE%99%CE%91%20%CE%91%CE%93%CE%A1
%CE%9F%CE%A4%CE%A9%CE%9D_%CE%98%CE%95%CE%A3_29-1-
16_%CE%A4%CE%95%CE%9B.pdf
Petsakos A. and Rozakis S., 2009. Critical Review and State-of-the-Art of PMP
Models: An Application to Greek Arable Agriculture, Research Topics in
Agricultural and Applied Economics, Bentham Science Publishers 1:36-63.
36
Petsakos A. and Rozakis S.,2015. Calibration of agricultural risk programming
models.European Journal of Operational Research ,242: 536-545.
Petsakos A., Rozakis S. and Tsiboukas K., 2009. Risk optimal farm plans in the
context of decoupled subsidy payments: the case of cotton production in Thessaly,
Journal of Farm Management ,13(7): 467-483.
Region of Thessaly, 2011. Operational plan: Agricultural products of Thessaly (in
Greek). Available at: http://www.pthes.gov.gr/data/anakoin/2012/an138a.pdf
Rozakis S., Tsiboukas K. and Korasidis M.,2008. CAP Reform Impacts To Greek
Cotton Farmers: A Mathematical Programming Approach. Journal of Agricultural
and Food Economics, 3(1-2): 95-116 .
Rozakis S., 2011. Impacts of flatter rates and environmental top-ups in Greece: A
novel mathematical modeling approach, Agricultural Economics Review ,12 (2 ): 30-
39. http://www.eng.auth.gr/mattas/12_2_3.pdf
Sintori A., Rozakis S. and Tsiboukas C.,2010. Utility-derived supply function of
sheep milk: The case of Etoloakarnania, Greece, Food Economics - ActaAgricultura
Scandinavia C, 7 (2-4): 87-99.
Sourie J-C. and Rozakis S., 2001. Bio-fuel production system in France: An
Economic Analysis. Biomass and Bio-energy, 20(6) :483-489.
37
Appendix
Appendix.17
7 In parentheses are described the possible choices of sample farms.
Indices
n Crop (cotton, tobacco, processed pepper, processed tomato, alfalfa, maize, durum wheat, set-aside)
Decision Variables
cropping area of each crop in hectares
set-aside area in hectares
Parameters
expected crop yield of each crop in tn/ha(Data yields of 2005 & 2006 are used in order to calculate expected crop yields)
expected price of each crop in euros/ton Average t-1 price (2011) for non-contracted crops ( Cotton price=530 euros/ton, maize price=180 euros/ton , alfalfa price=220 euros/ton, durum wheat price =210 euros/ton.)
indicative coupled subsidy of each crop in euros/ha (cotton=805 euros/ha, durum wheat=90euros/ha)
variable cost of each crop in euros/ha
provided family labor for each crop in hours/ha
irrigated arable crop ( cotton, tobacco, processed pepper, processed tomato, alfalfa, maize)
38
eligible crop for entitlement activation(cotton, tobacco, processed pepper, processed tomato, alfalfa, maize, durum wheat, set-aside)
eligible crop for irrigated rotation in context of nitrogen reduction program(cotton)
eligible crop for non-irrigated rotation in context of nitrogen reduction program(durum wheat)
eligible crop for organic farming(alfalfa)
Legume crop (alfalfa)
lg_land land entitlements area in hectares
pay single payment in euros/ha
lg_organic land entitlements of organic program in hectares
orgpay organic payment in euros/ha
lg_nitro_A land entitlements of nitrogen pollution reduction program in hectares- methodology A
nitropay_A nitrogen pollution reduction program methodology A payment in euros/ha
lg_nitro_B land entitlements of nitrogen pollution reduction program in hectares- methodology B
nitropay_B
nitrogen pollution reduction program payment in euros/ha -methodology B
Available arable land
Available irrigated land
Available working capital
39
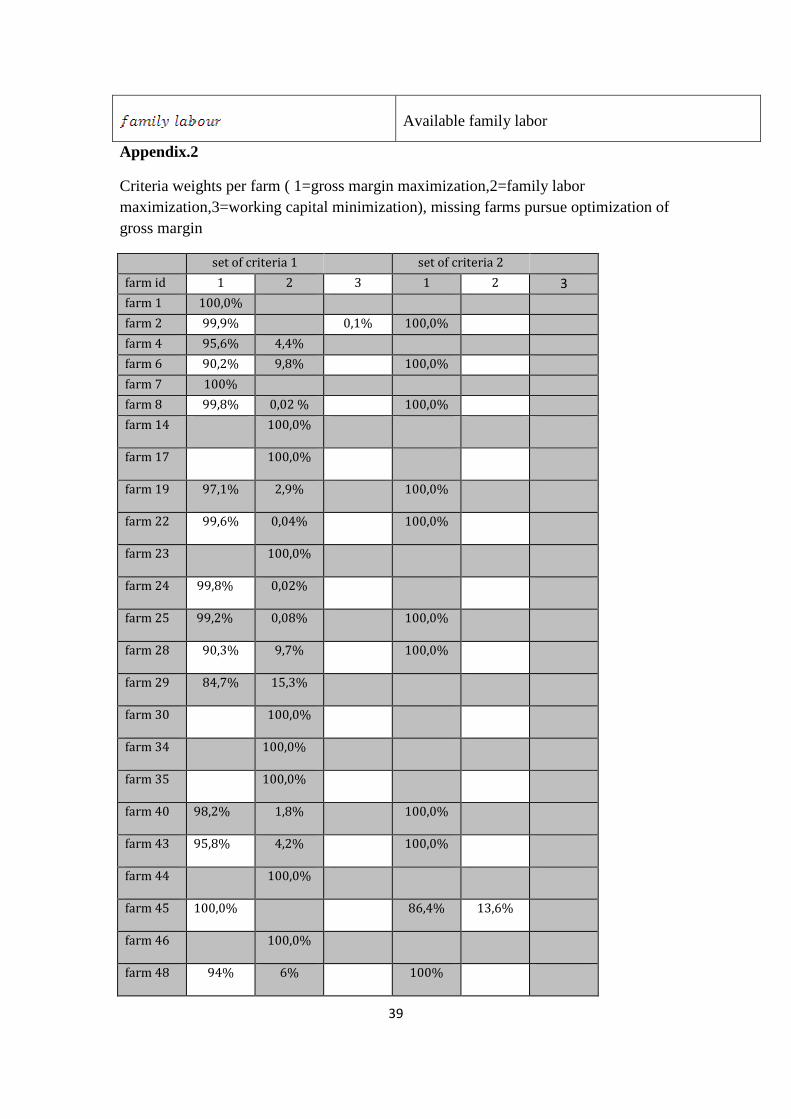
Appendix.2
Criteria weights per farm ( 1=gross margin maximization,2=family labor maximization,3=working capital minimization), missing farms pursue optimization of gross margin
set of criteria 1 set of criteria 2
farm id 1 2 3 1 2 3
farm 1 100,0%
farm 2 99,9% 0,1% 100,0%
farm 4 95,6% 4,4%
farm 6 90,2% 9,8% 100,0%
farm 7 100%
farm 8 99,8% 0,02 % 100,0%
farm 14 100,0%
farm 17 100,0%
farm 19 97,1% 2,9% 100,0%
farm 22 99,6% 0,04% 100,0%
farm 23 100,0%
farm 24 99,8% 0,02%
farm 25 99,2% 0,08% 100,0%
farm 28 90,3% 9,7% 100,0%
farm 29 84,7% 15,3%
farm 30 100,0%
farm 34 100,0%
farm 35 100,0%
farm 40 98,2% 1,8% 100,0%
farm 43 95,8% 4,2% 100,0%
farm 44 100,0%
farm 45 100,0% 86,4% 13,6%
farm 46 100,0%
farm 48 94% 6% 100%
Available family labor

40