Embed Size (px)
Citation preview
Impact Assessment Monitoring & Evaluation for e-Government
ProjectsSubhash Bhatnagar
As part of the Capacity Building Workshop under the Joint Economic Research Program (JERP)
This session will focus on the need for assessing impact of e-government projects and will described a methodology of how such an assessment can be carried out. Results of an impact assessment study sponsored b the World Bank will be discussed in detail illustrating the methodology and the value that could be derived from such assessments. Some of the pitfalls that should be avoided in making assessment will be described.

Presentation Structure
• Why assess impact? • Learning from past work on assessment• Proposed Methodology• Results from a Bank Study of 8 projects
– Study objectives– Projects covered in the study– Analysis of Results
• Are investments in eGovernment worthwhile?• Lessons for assessment work

Why Impact Assessment?
• To ensure that funds deployed in eGovernment provide commensurate value.
• To create a bench mark for future projects to target• To identify successful projects for replication and
scaling up• To sharpen goals and targeted benefits for each
project under implementation• To make mid course correction for projects under
implementation• To learn key determinants of economic,
organizational, and social impact from successful and failed projects

Evaluation of Impact: Key Issues
• Macro versus Micro Approach- unit of analysis• Assessment from whose perspective?• Dimensions on which impact can be assessed for
different stakeholders• Can all costs and benefits be monetized?• How to isolate the effect of ICT use from
different interventions ?• Degree of quantification versus qualitative
assessment• Measurement issues: sampling, questionnaire
design, analysis of internal data, triangulation

Learning from Past Assessments
• Variety of approaches have been used-client satisfaction surveys, expert opinion, ethnographic studies
• Client satisfaction survey results can vary over time as bench mark changes - need for counterfactuals
• Often studies have been done by agencies that may be seen as being interested in showing positive outcome
• Lack of credibility of results-different studies of the same project show very different outcomes
• Lack of rigor in sampling-results can not be easily generalized• Lack of rigor in controlling for external influence-need for
counterfactuals ignored.• Lack of a standard methodology-making it difficult to compare
projects• Hardly any projects do a benchmark survey

Critique of Existing Frameworks• Biased towards quantification of short term direct
cost savings- quality of service, governance and wider impacts on society not studied.
• Conceptual in nature-hardly any frameworks have been applied to assess impact of real projects
• Variety in delivery models has not been recognized. Impact is a function of the delivery model and the nature of clients being served
• Practical issues of paucity of data have not been taken into account-particularly in a developing country context where baseline surveys are not done and M&E systems are weak
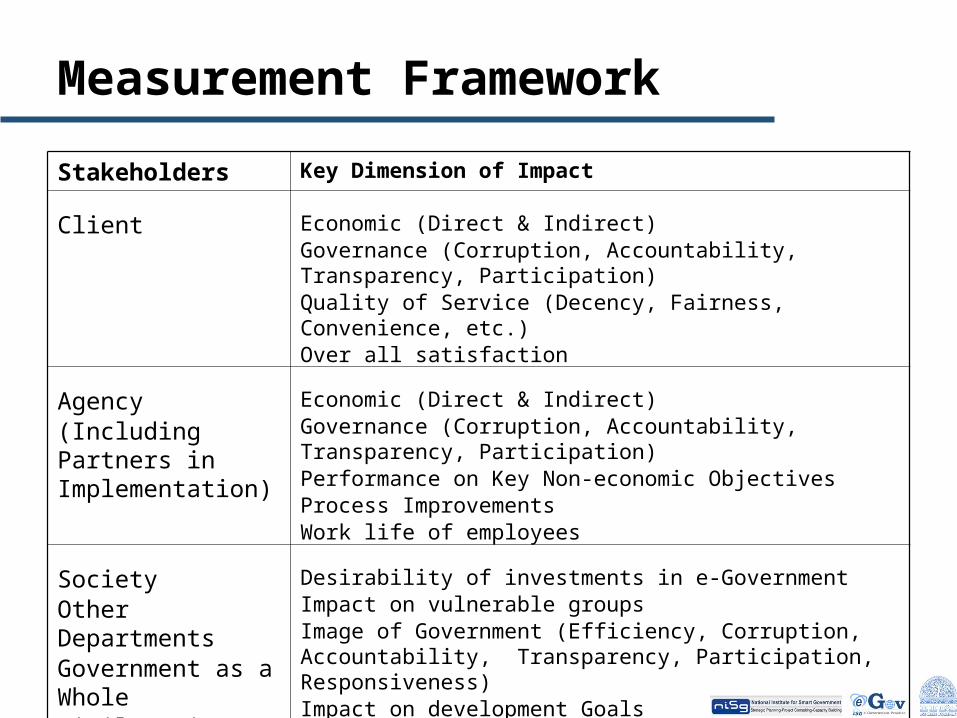
Measurement Framework
Stakeholders Key Dimension of Impact
Client Economic (Direct & Indirect)Governance (Corruption, Accountability, Transparency, Participation)Quality of Service (Decency, Fairness, Convenience, etc.)Over all satisfaction
Agency(Including Partners in Implementation)
Economic (Direct & Indirect)Governance (Corruption, Accountability, Transparency, Participation) Performance on Key Non-economic Objectives Process ImprovementsWork life of employees
SocietyOther DepartmentsGovernment as a WholeCivil Society
Desirability of investments in e-GovernmentImpact on vulnerable groupsImage of Government (Efficiency, Corruption, Accountability, Transparency, Participation, Responsiveness)Impact on development Goals

Proposed Framework
• Focuses on retrospective assessment of e-delivery systems(B2C and B2B)
• Balanced approach between case study and quantitative analysis
• Recognizes that some part of the value to different stakeholders can not be monetized
• Understand how inputs lead to outputs and outcomes in different project contexts
• A practical methodology that can be used for designing bench mark surveys, M&E systems and prospective evaluation of projects in countries with various delivery models and paucity of data

Methodology for Assessment
• Select mature, wide scope and scale projects of e-delivery of services.• Collect data through structured survey from clients, employees,
supervisors using counterfactuals ( for old non computerized delivery and new e-delivery system)
• Customize survey instrument to each project, adapt in local language• Data can be collected through Internet survey, face to face interviews and
focus groups• Use professional market research agencies with trained investigators for
face to face int• Determine sample frame and size so that results can be extrapolated to the
entire population (often 300 clients may be sufficient). Select respondents randomly from locations stratified by activity levels and remoteness
• Collect data on investments, operating costs, activity levels, revenues, employee strength from agencies.
• Develop a case study-organizational context, process reform, change management.

A study sponsored by World Bank Done by Indıan Instıtute of Management Ahmedabad
andLondon School of Economıcs
Preliminary Resultsfrom Projects in India

Study Team
• Study Coordinator: Subhash Bhatnagar• Indian Institute of Management, Ahmedabad
(IIMA)– Subhash Bhatnagar, Rama Rao, Nupur Singh,
Ranjan Vaidya, Mousumi Mandal
• London School of Economics– Shirin Madon, Matthew Smith
• ISG e-Gov Practice Group– Deepak Bhatia, Jiro Tominaga
• Sponsors– World Bank,IIMA, Department of IT

Projects of e-delivery of Services
• Issue of land titles in Karnataka (Bhoomi): 180 Kiosks, Launched February 2001 (2-01)
• Property registration in Karnataka (Kaveri): 230 offices (3-03)
• Computerized Treasury (Khajane): 240 locations (11-02)• Property Registration in Andhra Pradesh: AP 400 offices.
(11-98)• eSeva center in Andhra Pradesh: 250 locations in 190
towns, Used monthly by 3.5 million citizens (8-01) • e-Procurement in Andhra Pradesh (1-03)• Ahmedabad Municipal Corporation (AMC): 16 Civic
Service Centers (9-02)• Inter State Check Posts in Gujarat: 10 locations (3-2000)• e-Procurement in Chile (Comprasnet)• Income Tax on-line in Chile

Dimensions to be Studied to Evaluate Impact• Project context: basic information on the project and its context• Inputs (technology, human capital, financial resources);• Process outcome (reengineered processes, shortened cycle time,
improved access to data and analysis, flexibility in reports);• Customer results (service coverage, timeliness and
responsiveness, service quality and convenience of access);• Agency outcomes (transparency and accountability, less
corruption, administrative efficiency, revenue growth and cost reduction) and
• Strategic outcomes (economic growth, poverty reduction and achievement of MDGs).
• Organizational processes: institutional arrangements, organizational structure, and other reform initiatives of the Government that might have influenced the outcome for the ICT project.

Profile of Respondents Bhoomi Card e-Seva AMC Kaveri Number of respondents 242 232 253 239 237 Nature of clients Farmer Property
owner Urban dweller
Urban dweller
Property owner
Percentage Break up: Education Illiterate 36.78 9.91 3.95 2.09 27.00 Schooled 52.07 58.62 57.71 63.18 55.70 Graduate 11.16 31.47 38.34 34.73 17.30 Profession Workers 90.91 38.79 33.99 17.15 69.20 Business 4.13 34.91 27.27 45.19 12.24 White collar 1.65 10.34 22.53 17.15 6.75 Supervisor 3.31 15.95 16.21 20.50 11.81 Average Income <5000 92.15 43.10 40.71 22.18 71.73 5000-10000 5.79 44.40 42.69 60.25 19.83 >10000 2.07 12.50 16.60 17.57 8.44 Urban / Rural Urban 28.93 70.26 100.00 100.0 32.49 Rural 71.07 29.74 0.00 0.00 67.51

Improvement Over Manual System
AMC CARD Check Post
E-Proc E-Seva
Kaveri
Bhoomi
Total Travel Cost per transactıon (Rs.)
21.07 67.71 3430.60
7.40 89.22 0.15
Number of trips 0.65 1.38 5.16 0.28 1.18 0.47
Wage Loss (Rs.) 36.84 28.46 15.63 120.55
(39.22)
Waiting Time (Minutes)
14.69 97.00 8.94 114.95 18.50 61.81 33.97
Governance Quality - 5 point scale
1.08 1.01 0.25
Percentage paying bribes
2.51 4.31 6.25 11.77 0.40 12.71 18.83
Service Quality- 5 point scale
0.52 0.40 0.58 0.24 0.76 0.27 0.85
Error Rate 0.42 0.86 1.58 3.80 0.03
Preference for Computerization (%)
97.49 96.98 91.25 83.71 96.84 98.31 79.34
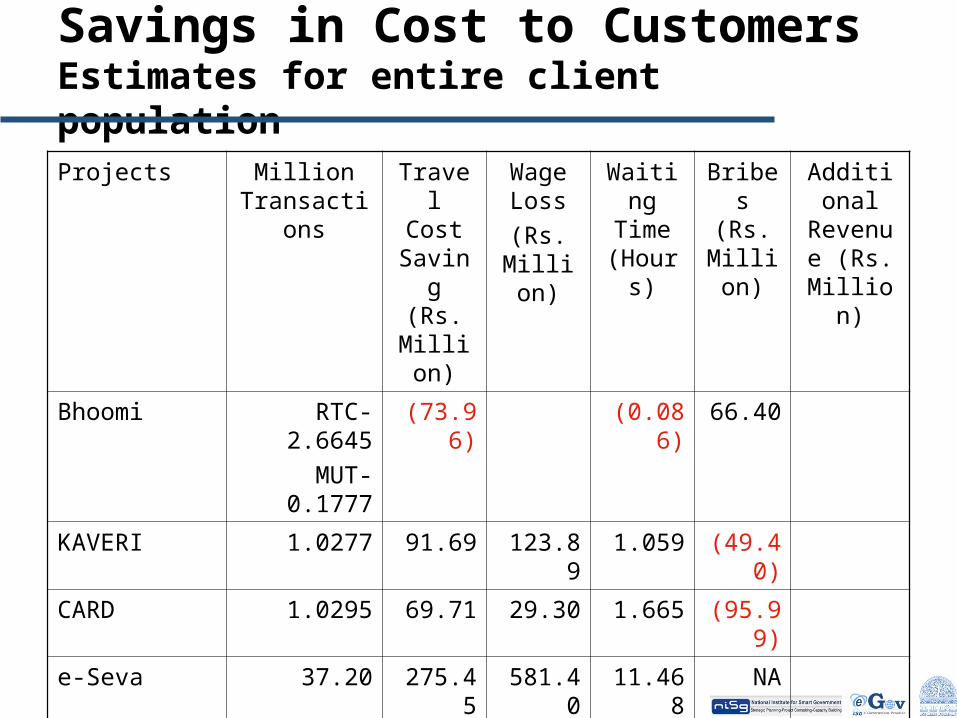
Savings in Cost to CustomersEstimates for entire client population
Projects Million Transactio
ns
Travel Cost
Saving (Rs.
Million)
Wage Loss(Rs.
Million)
Waiting Time (Hours
)
Bribes (Rs.
Million)
Additional
Revenue (Rs.
Million)
Bhoomi RTC-2.6645
MUT-0.1777
(73.96)
(0.086)
66.40
KAVERI 1.0277 91.69 123.89 1.059 (49.40)
CARD 1.0295 69.71 29.30 1.665 (95.99)
e-Seva 37.20 275.45 581.40 11.468 NA
e-Procurement
.0264 90.73 0.0507 3.38
AMC 0.6171 13.43 22.70 0.151 0.15
Check Post 16.4075 2.444 270.37
1613.00
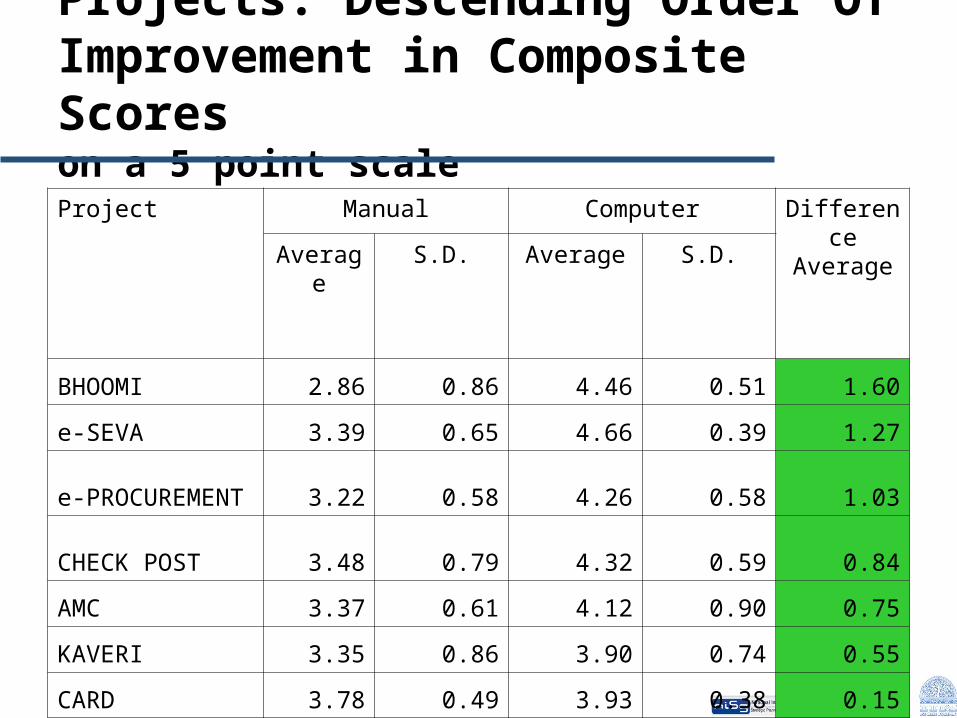
Projects: Descending Order Of Improvement in Composite Scoreson a 5 point scaleProject Manual Computer Differenc
e Average
Average
S.D. Average S.D.
BHOOMI 2.86 0.86 4.46 0.51 1.60
e-SEVA 3.39 0.65 4.66 0.39 1.27
e-PROCUREMENT 3.22 0.58 4.26 0.58 1.03
CHECK POST 3.48 0.79 4.32 0.59 0.84
AMC 3.37 0.61 4.12 0.90 0.75
KAVERI 3.35 0.86 3.90 0.74 0.55
CARD 3.78 0.49 3.93 0.38 0.15

Descending Order Of Post Computerization Composite Scoreon a 5 point scaleProject Manual Computer Differen
ce AverageAverage S.D. Average S.D.
e-Seva 3.39 0.65 4.66 0.39 1.27
Bhoomi 2.86 0.86 4.46 0.51 1.60
Check Post 3.48 0.79 4.32 0.59 0.84
e-Procurement 3.22 0.58 4.26 0.58 1.03
AMC 3.37 0.61 4.12 0.90 0.75
CARD 3.78 0.49 3.93 0.38 0.15
KAVERI 3.35 0.86 3.90 0.74 0.55
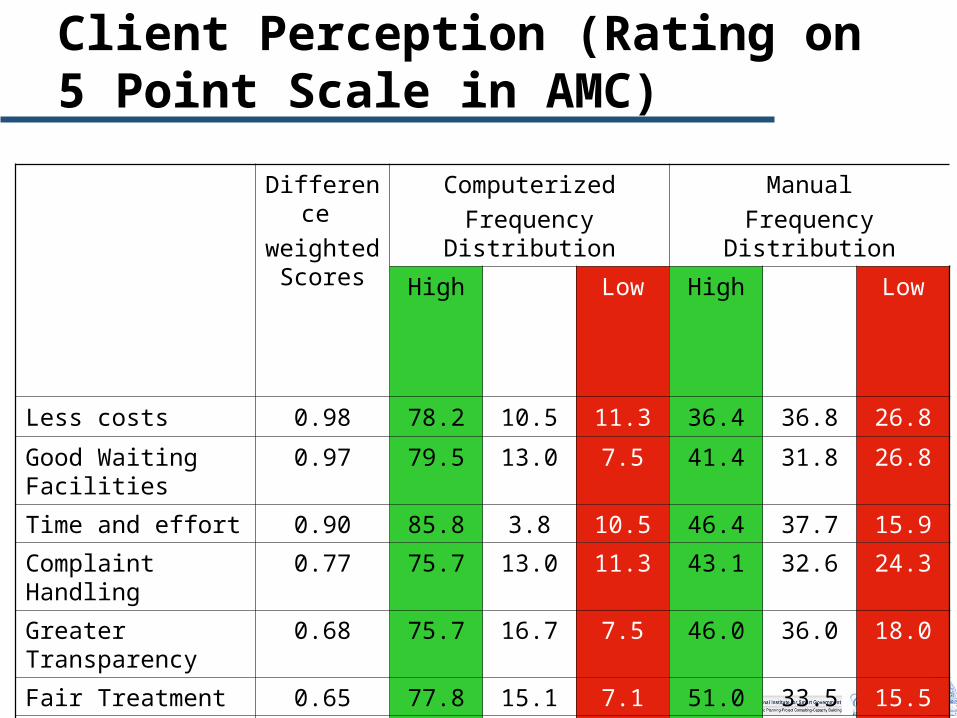
Client Perception (Rating on 5 Point Scale in AMC)
Difference
weighted Scores
ComputerizedFrequency Distribution
ManualFrequency Distribution
High Low High Low
Less costs 0.98 78.2 10.5 11.3 36.4 36.8 26.8
Good Waiting Facilities
0.97 79.5 13.0 7.5 41.4 31.8 26.8
Time and effort 0.90 85.8 3.8 10.5 46.4 37.7 15.9
Complaint Handling
0.77 75.7 13.0 11.3 43.1 32.6 24.3
Greater Transparency
0.68 75.7 16.7 7.5 46.0 36.0 18.0
Fair Treatment 0.65 77.8 15.1 7.1 51.0 33.5 15.5
No need for Agents
0.52 71.5 23.4 5.0 57.3 25.9 16.7
Equal Opportunity 0.47 74.5 15.5 10.0 55.2 29.3 15.5

Top Four Attributes Desired in the Application
AMC Less time and effort required
Less corruption
Greater transparency
Good complaint handling system
CARD Less time and effort required
Less waiting time
Less corruption
Fair Treatment
e-Procurement
Less corruption
Easy access Equal opportunity to all
Transparent system of tender valuation
e-Seva Less time and effort required
Less waiting time
Convenient time schedule
Fair Treatment
Check Post
No Delay in transactions
Error FreePayment receipts
Error-free transactions
Fair Treatment
Bhoomi Error free transaction
No delay in transaction
Less time and effort required
Less waiting time
KAVERI Less Corruption
Greater transparency
Error free transaction
Less waiting time

Impact on Agency AMC Civic
Center
CARD
e-Seva
Bhoomi
KAVERI Check
post
eProcureme
nt
Khajane
Total Project Investment (Rs. million)
250.00 300.00
537.00
330.00 185.00
3.5050.4
338.00
Operating Expenses 168.9 52.7 24.3 64.9
Annual Transactions (million)
0.71 1.03 37.20 2.84 2.47 16.73
0.03 15.69
Clients Served (million) 0.29 0.33 1.89 1.67 1.33 6.12 0.00
Tax Revenue in 2005-06 for Computerized (Rs. million)
1974.2 17282
19245 3109.4
Tax Revenue in Last Year of Manual (Rs. million)
42.05
9033 702.68
Growth Rate in Tax Revenue for Computerized
31.95 50.17
17.00 15.10
Transaction Fees in 2005-06 Computerized (Rs. million)
53.32 1130.8
203.59
274.19 2626.9 0
Transaction Fees in Last Year of Manual (Rs. million)
2.53 1890.46
Growth Rate in Transaction Fees for Computerized
12.86 50.90
83.51 22.76 16.71 113.06
8.06

Agency: Growth of Tax and Transaction Fee
Tax Revenue, Transaction Fee
0
5000
10000
15000
20000
25000
1996-97 1997-98 1998-99 1999-00 2000-01 2001-02 2002-03 2003-04 2004-05 2005-06
Year
Am
ount
( (
Rs.
milli
on))
AMC Tax Revenue CARD Tax Revenue KAVERI Tax Revenue
AMC Transaction Fee CARD Transaction Fee e-Seva Transaction Fee
Bhoomi Transaction Fee KAVERI Transaction Fee Checkpost Transaction Fee

Economic Viability of ProjectsAgency Perspective
Yearly Operating Expense per Transaction
Investment per Cumulative
Transactions for 4 years
AMC Civic Center
109.42
CARD 95.94
e-Seva 4.56 6.57
Bhoomi 18.54 9.48
KAVERI
Checkpost 2.76
eProcurement 918.85 43.70
Khajane 4.14 5.48

Attitude to e-Government
The Knowledge Society Mean SDE gov makes an impact on the knowledge of society 4.03 0.73E gov makes an impact on the literacy level of society 3.97 0.82Improvement in GovernanceEnhances citizens convinence in availing govet services 4.14 0.73Reduces corruption in delivery of public services 3.98 0.89Increases accountability & transprency of govet 4.03 0.79E gov has helped to improve the image of govt 4.12 0.80More investment in e-GovernanceGovernment should make more investment on E gov 4.12 0.82More govt department/ public agencies should be computerised 4.13 0.83Computerisation of govt deprtments is a waste of resources 3.85 0.96Investments in Development Schemes vesus eGovernmentMoney spent in e gov should be used for other govt activities 2.96 1.17Building schools, roads, dispensaries is more useful than E gov projects 3.22 1.14Digital InclusionE gov services puts the poor at disadvantage 3.73 0.92E gov services benefits only the rich and influential 3.74 0.98E gov services benefits only the urban people 3.50 1.01Rural citizens benefit greatly from e-Government services 3.30 1.20Rural and urban poverty level have changed 3.22 1.08

Preliminary Observations• Overall Impact
– Significant positive impact on cost of accessing service– Variability across different service centers of a project – Strong endorsement of e-Government but indirect preference for private participation
• Reduced corruption-outcome is mixed and can be fragile– Any type of system break down leads to corruption– Agents play a key role in promoting corruption– Private operators also exhibit rent seeking behavior given an opportunity– Systematizing queues by appointments helps prevent break down
• Small improvements in efficiency can trigger major positive change in perception about quality of governance.
• Challenges– No established reporting standards for public agencies- In case of treasuries, the AG office
has more information on outcome.– What is the bench mark for evaluation-improvement over manual system, rating of
computerized system (moving target), or potential?– Measuring what we purport to measure: design of questions, training, pre test, field checks,
triangulation– Public agencies are wary of evaluation-difficult to gather data

Questionnaire Design and Survey
• Design of analytical reports prior to survey. Often key variables can be missed if the nature of analysis in not thought through prior to the study.
• Pre code as many items in the questionnaire as possible.• Consistent coding for scales -representing high versus low or positive versus
negative perceptions.• Differently worded questions to measure some key items/ perceptions.• Wording of questions should be appropriate to skill level of interviewer and
educational level of respondent.• Local level translation using colloquial terms.• Feedback from pre-testing of questionnaire should be discussed between study
team and investigators. The feedback may include: the length of questionnaire, interpretation of each question and degree of difficulty in collecting sensitive data.
• Quality of supervision by MR agency is often much worse than specified in the proposal. Assessing the quality of investigators is a good idea.
• Involvement of study team during the training of investigators.• Physical supervision by study team of the survey process is a good idea, even if it
is done selectively

Establishing Data Validity
• Check extreme values in data files for each item and unacceptable values for coded items.
• Cross check the data recorded for extreme values in the questionnaire.
• Check for abnormally high values of Standard Deviation.• Even though a code is provided for missing values, there can
be confusion in missing values and a legitimate value of zero.• Look for logical connections between variables such as travel
mode and travel time; bribe paid and corruption.• Poor data quality can often be traced to specific investigators
or locations.• Random check for data entry problems by comparing data
from questionnaires with print out of data files.• Complete data validity checks before embarking on analysis