Embed Size (px)
Citation preview
DRAFT
1
Title:
Committed Clean Air Zone Impact Assessment
IA No: Defra2062
Lead department or agency: Department for Environment, Food and Rural Affairs
Other departments or agencies: DfT, BEIS
Impact Assessment (IA)
Date: 26th May 2016
Stage: Consultation
Source of intervention: EU measure
Type of measure: Statutory Instrument
Contact for enquiries:
Summary: Intervention and Options
RPC Opinion: GREEN
Cost of Preferred (or more likely) Option Total Net Present Value
Business Net Present Value
Net cost to business per year (EANDCB in 2014 price)
One-In, Three-Out
Business Impact Target Status
£555.99m -£950.95m £92.8 No Non-qualified regulatory provision
What is the problem under consideration? Why is government intervention necessary?
Air quality affects public health, economic performance and the natural environment. The latest evidence suggests that exposure to nitrogen dioxide (NO2) is having a significantly greater adverse impact on human health than had previously been understood. These costs are not fully reflected in individuals’ decisions for example either when purchasing or using a vehicle. Therefore government intervention is necessary to protect this natural clean air avoiding the negative impacts of air pollution.
What are the policy objectives and the intended effects?
The primary objective is to bring down the ambient NO2 concentrations to improve public health and, along with wider measures, deliver compliance with legal limit values. A targeted approach is recommended by establishing charging Clear Air Zones controlling for the most polluting vehicles in areas where the legal obligations will otherwise be exceeded and where the risk to public health is most significant. The framework is open to all areas but Birmingham, Leeds, Southampton, Nottingham and Derby will be mandated while London has committed to take forward equivalent measures.
What policy options have been considered, including any alternatives to regulation? Please justify preferred option (further details in Evidence Base)
Option 0: Baseline scenario – do nothing
Option 1: Preferred - Five mandatory charging Clean Air Zones
Option 2: Non-mandatory charging Clean Air Zones
Option 3: Five mandatory charging Clean Air Zones with lower vehicle requirements Preferred option is Option 1 as only this option, along with wider measures, should deliver compliance with our legal obligations.
Will the policy be reviewed? Certain elements will be subject to further development over time. If applicable, set review date:2021
Does implementation go beyond minimum EU legal requirements? No
Are any of these organisations in scope? Micro Yes
Small Yes
Medium Yes
Large Yes
What is the CO2 equivalent change in greenhouse gas emissions? (Million tonnes CO2 equivalent)
Traded:
Non-traded: 0.213
I have read the Impact Assessment and I am satisfied that, given the available evidence, it represents a reasonable view of the likely costs, benefits and impact of the leading options.
Signed by the responsible SELECT SIGNATORY:
Date:

2
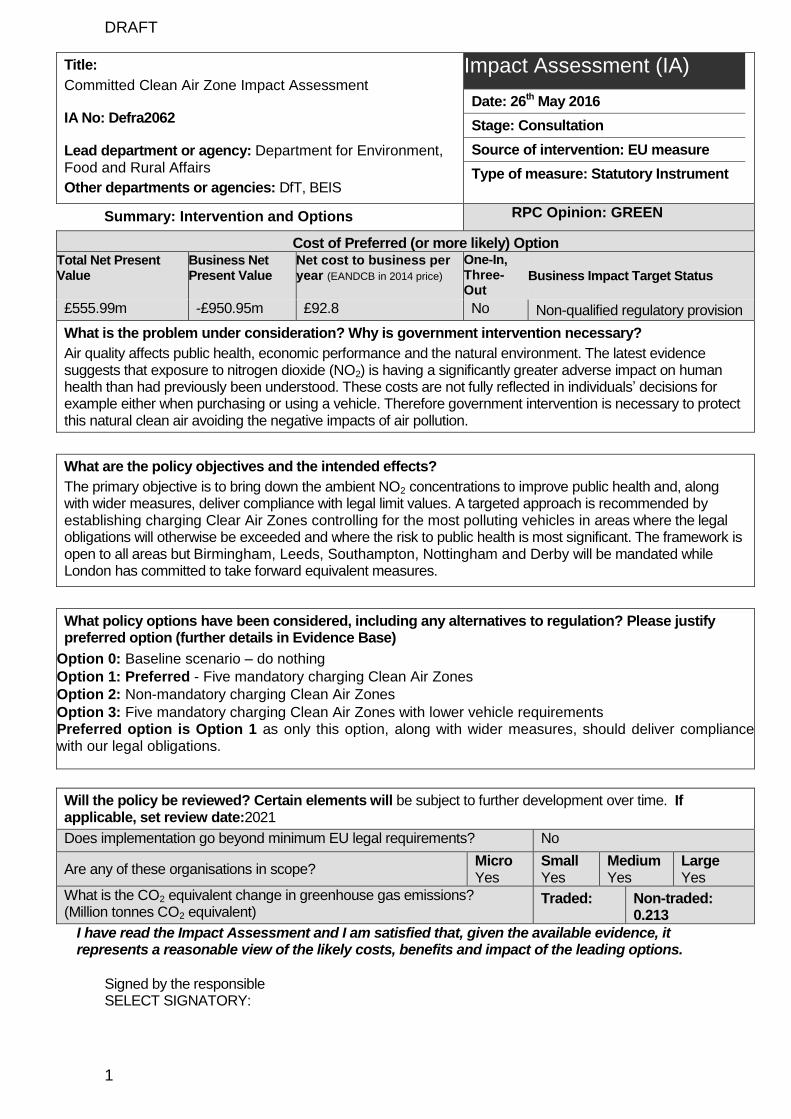
Summary: Analysis & Evidence: Policy Option 1 Description: London action plus five mandatory Clean Air Zones (petrol Euro 4, diesel Euro 6/VI)
FULL ECONOMIC ASSESSMENT
Price Base Year 2014
PV Base Year 2015
Time Period Years 10
Net Benefit (Present Value (PV)) (£m)
Low: -538.68 High: 1592.61 Best Estimate: 555.99
COSTS (£m) Total Transition (Constant Price) Years
Average Annual (excl.
Transition) (Constant Price) Total Cost
(Present Value)
Low 225.3
20
80.8 850.8
High 360.4 127.5 1350.8
Best Estimate
292.9 102.5 1090.2
Description and scale of key monetised costs by ‘main affected groups’
Vehicle owners that choose to upgrade to cleaner vehicles face the largest cost at £644m over the period. This move towards cleaner vehicles will also result in the disposal of the dirtiest vehicles with an estimate cost of £232m. A small proportion of people will forego and avoid journeys and therefore incur a loss of access valued at £50m and £63m respectively . Finally there are costs for the infrastructure and running cost required to implement the Clean Air Zones of £101m.
Other key non-monetised costs by ‘main affected groups’
By requiring the use of cleaner vehicles within urban areas there is a potential that users of older, dirtier vehicles would be placed at a competitive disadvantage, with a negative distributional impact.
BENEFITS (£m) Total Transition (Constant Price) Years
Average Annual (excl.
Transition) (Constant Price) Total Benefit (Present Value)
Low 0.0
20
101.7 812.2
High 0.0 305.6 2443.5
Best Estimate
0.0 205.9 1646.2
Description and scale of key monetised benefits by ‘main affected groups’
The key monetised benefit is the improvement in public health as a result of lower exposure to NO2. These benefits will be focused primarily on the population within each of the Clean Air Zones which is valued at £1.6bn. However, as some existing clean vehicles are reallocated to these areas some dirtier vehicles will move outside the zones which imposes a health cost of £243m. Therefore overall the net health benefit is £1.3bn. There will also be additional benefits from traffic flow improvements (£306m) and reductions in greenhouse gas (GHG) emissions (£12m).
Other key non-monetised benefits by ‘main affected groups’
As part of the air quality plan this option enables the UK to reach compliance with legal air quality limits by 2020 outside London and by 2025 within London. In addition to the mortality benefits there are also likely to be a range of morbidity health benefits. Evidence on these impacts is however less developed and so has not been included. Controls on these emissions will also have wider benefits on public amenity and sensitive ecosystems.
Key assumptions/sensitivities/risks Discount rate (%)
3.5%
- The performance of future emissions standards and specifically real world driving tests. - The link between mortality and exposure to NO2 - Number of vehicles affected by the different Clean Air Zones.
BUSINESS ASSESSMENT (Option 1)
Direct impact on business (Equivalent Annual) £m: Score for Business Impact Target (qualifying provisions only) £m: Costs: 92.8 Benefits: 0 Net: -92.8
NA
3
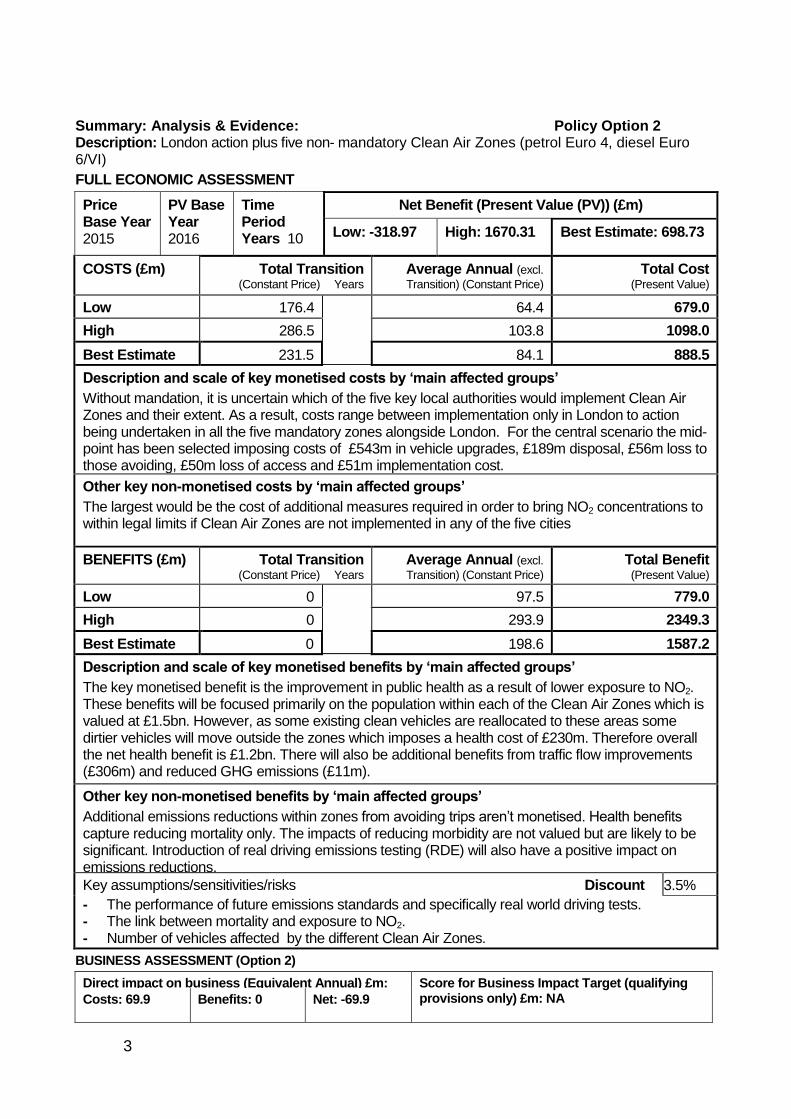
Summary: Analysis & Evidence: Policy Option 2 Description: London action plus five non- mandatory Clean Air Zones (petrol Euro 4, diesel Euro 6/VI)
FULL ECONOMIC ASSESSMENT
Price Base Year 2015
PV Base Year 2016
Time Period Years 10
Net Benefit (Present Value (PV)) (£m)
Low: -318.97 High: 1670.31 Best Estimate: 698.73
COSTS (£m) Total Transition (Constant Price) Years
Average Annual (excl.
Transition) (Constant Price) Total Cost
(Present Value)
Low 176.4
64.4 679.0
High 286.5 103.8 1098.0
Best Estimate
231.5 84.1 888.5
Description and scale of key monetised costs by ‘main affected groups’
Without mandation, it is uncertain which of the five key local authorities would implement Clean Air Zones and their extent. As a result, costs range between implementation only in London to action being undertaken in all the five mandatory zones alongside London. For the central scenario the mid-point has been selected imposing costs of £543m in vehicle upgrades, £189m disposal, £56m loss to those avoiding, £50m loss of access and £51m implementation cost.
Other key non-monetised costs by ‘main affected groups’
The largest would be the cost of additional measures required in order to bring NO2 concentrations to within legal limits if Clean Air Zones are not implemented in any of the five cities
BENEFITS (£m) Total Transition (Constant Price) Years
Average Annual (excl.
Transition) (Constant Price) Total Benefit (Present Value)
Low 0
97.5 779.0
High 0 293.9 2349.3
Best Estimate
0 198.6 1587.2
Description and scale of key monetised benefits by ‘main affected groups’
The key monetised benefit is the improvement in public health as a result of lower exposure to NO2. These benefits will be focused primarily on the population within each of the Clean Air Zones which is valued at £1.5bn. However, as some existing clean vehicles are reallocated to these areas some dirtier vehicles will move outside the zones which imposes a health cost of £230m. Therefore overall the net health benefit is £1.2bn. There will also be additional benefits from traffic flow improvements (£306m) and reduced GHG emissions (£11m).
Other key non-monetised benefits by ‘main affected groups’
Additional emissions reductions within zones from avoiding trips aren’t monetised. Health benefits capture reducing mortality only. The impacts of reducing morbidity are not valued but are likely to be significant. Introduction of real driving emissions testing (RDE) will also have a positive impact on emissions reductions.
Key assumptions/sensitivities/risks Discount rate (%)
3.5%
- The performance of future emissions standards and specifically real world driving tests. - The link between mortality and exposure to NO2. - Number of vehicles affected by the different Clean Air Zones.
BUSINESS ASSESSMENT (Option 2)
Direct impact on business (Equivalent Annual) £m: Score for Business Impact Target (qualifying provisions only) £m: NA Costs: 69.9 Benefits: 0 Net: -69.9
4
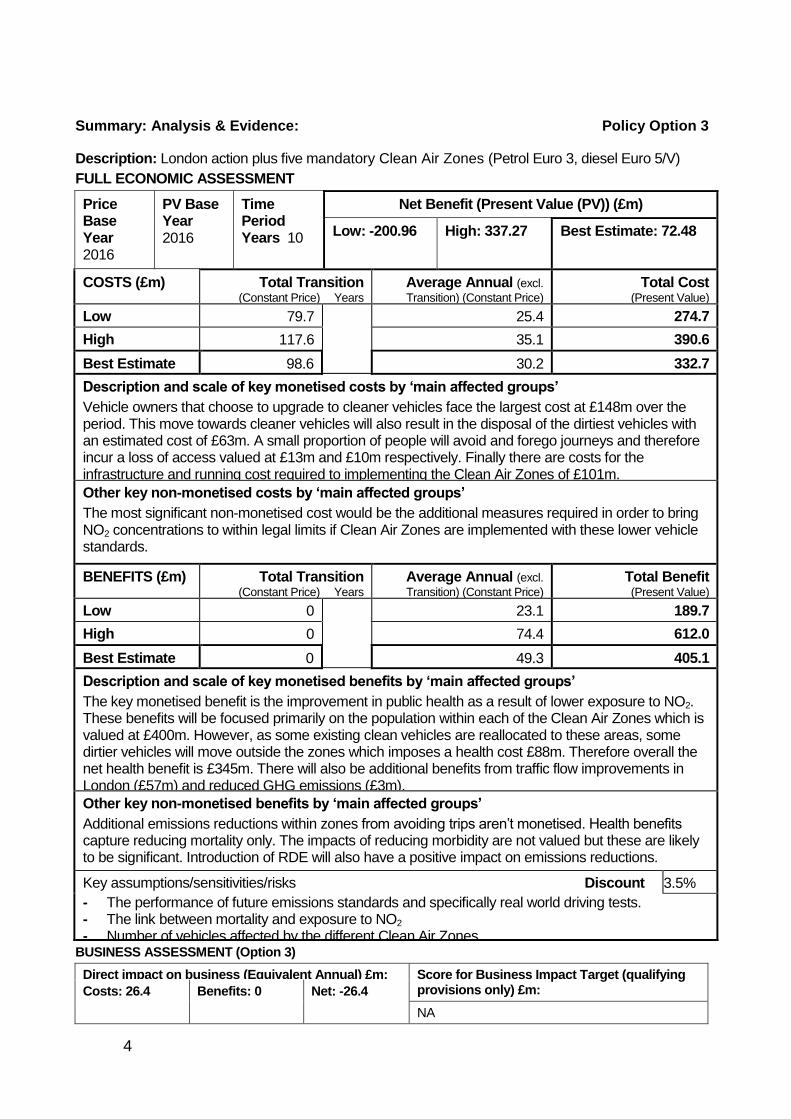
Summary: Analysis & Evidence: Policy Option 3
Description: London action plus five mandatory Clean Air Zones (Petrol Euro 3, diesel Euro 5/V)
FULL ECONOMIC ASSESSMENT
Price Base Year 2016
PV Base Year 2016
Time Period Years 10
Net Benefit (Present Value (PV)) (£m)
Low: -200.96 High: 337.27 Best Estimate: 72.48
COSTS (£m) Total Transition (Constant Price) Years
Average Annual (excl.
Transition) (Constant Price) Total Cost
(Present Value)
Low 79.7
25.4 274.7
High 117.6 35.1 390.6
Best Estimate
98.6 30.2 332.7
Description and scale of key monetised costs by ‘main affected groups’
Vehicle owners that choose to upgrade to cleaner vehicles face the largest cost at £148m over the period. This move towards cleaner vehicles will also result in the disposal of the dirtiest vehicles with an estimated cost of £63m. A small proportion of people will avoid and forego journeys and therefore incur a loss of access valued at £13m and £10m respectively. Finally there are costs for the infrastructure and running cost required to implementing the Clean Air Zones of £101m.
Other key non-monetised costs by ‘main affected groups’
The most significant non-monetised cost would be the additional measures required in order to bring NO2 concentrations to within legal limits if Clean Air Zones are implemented with these lower vehicle standards.
BENEFITS (£m) Total Transition
(Constant Price) Years
Average Annual (excl.
Transition) (Constant Price) Total Benefit (Present Value)
Low 0
23.1 189.7
High 0 74.4 612.0
Best Estimate
0 49.3 405.1
Description and scale of key monetised benefits by ‘main affected groups’
The key monetised benefit is the improvement in public health as a result of lower exposure to NO2. These benefits will be focused primarily on the population within each of the Clean Air Zones which is valued at £400m. However, as some existing clean vehicles are reallocated to these areas, some dirtier vehicles will move outside the zones which imposes a health cost £88m. Therefore overall the net health benefit is £345m. There will also be additional benefits from traffic flow improvements in London (£57m) and reduced GHG emissions (£3m).
Other key non-monetised benefits by ‘main affected groups’
Additional emissions reductions within zones from avoiding trips aren’t monetised. Health benefits capture reducing mortality only. The impacts of reducing morbidity are not valued but these are likely to be significant. Introduction of RDE will also have a positive impact on emissions reductions.
Key assumptions/sensitivities/risks Discount rate (%)
3.5%
- The performance of future emissions standards and specifically real world driving tests. - The link between mortality and exposure to NO2 - Number of vehicles affected by the different Clean Air Zones. BUSINESS ASSESSMENT (Option 3)
Direct impact on business (Equivalent Annual) £m: Score for Business Impact Target (qualifying provisions only) £m: Costs: 26.4 Benefits: 0 Net: -26.4
NA
5
Contents
Executive summary ....................................................................................... 6
1. Rationale for Intervention ................................................................... 12
2. Background ......................................................................................... 13
3. Options................................................................................................. 24
4. Methodology ........................................................................................ 34
5. Monetised and Non-Monetised Impacts ............................................ 49
6. Sensitivities and Uncertainties .......................................................... 60
7. Business Impacts ................................................................................ 67
8. Distributional Impacts on households and individuals ................... 75
9. Summary and Conclusion .................................................................. 77
Annex A: The Fleet Adjustment Model ....................................................... 79
Annex B: Summary of PCM Model ............................................................. 85
Annex C: ITS Leeds Paper on Valuation of Welfare Loss ........................ 87
Annex D: Evidence review – profile of transport users ............................ 96
6
Executive summary
Technical note: On 30th September 2016 new vehicle emission factors were released by the European Research for Mobile Emission Sources (ERMES). These factors will affect the impact of this policy, strengthening the need for action. Given when this data was released, it was not possible to update the analysis prior to this publication. We are considering this new evidence and will respond in due course.
Air pollution damages public health, natural capital and economic output. The latest evidence suggests that exposure to nitrogen dioxide (NO2) is having a significantly greater adverse impact on human health than had previously been understood. Our latest estimates suggest that it could be causing the equivalent of 23,000 deaths annually imposing a social cost of over £13 billion per year. In addition it imposes a wide range of other effects including damage to ecosystems and economic output. One example is that it can reduce crop production by an estimated 9% in bad years. These costs are not fully reflected in individuals’ decision making1, for example in choosing which vehicle they purchase or which trips they undertake. In such circumstances, there is a clear role for Government intervention to manage these wider costs by controlling the sources of pollution.
The Government is committed to improving the UK’s air quality, reducing health impacts, and fulfilling our legal obligations. Its air quality action plan was set out in the document “Improving air quality in the UK: Tackling nitrogen dioxide in our towns and cities” (hereafter referred to as the ‘NO2 plan’)2 published in December 2015.
The NO2 plan identified that in general policy terms the most cost effective and efficient way to improve air quality and protect public health was to control the emissions from the oldest vehicles in areas of high population density. The plan requires the implementation of Clean Air Zones to deliver these targeted improvements in the most polluted areas and help achieve compliance with the legal emission limits for NO2 in the shortest possible time. Clean Air Zones are areas where dirtier vehicles are restricted (through the use of vehicle emission standards) and action is focused to improve air quality. They are geographically defined areas allowing a range of actions and resources to be targeted to deliver the greatest health benefits.
Clean Air Zones are a key part of the Government’s strategy to enable the UK to achieve its primary objective of improving public health and continuing to protect the natural environment. It will also enable the UK to achieve the legal UK emission limits.. These changes will also deliver a range of wider societal benefits including improving traffic flow and reducing greenhouse gas emissions.
1 This is what economists refer to as a negative externality.
2 https://www.gov.uk/government/publications/air-quality-in-the-uk-plan-to-reduce-nitrogen-dioxide-emissions
7
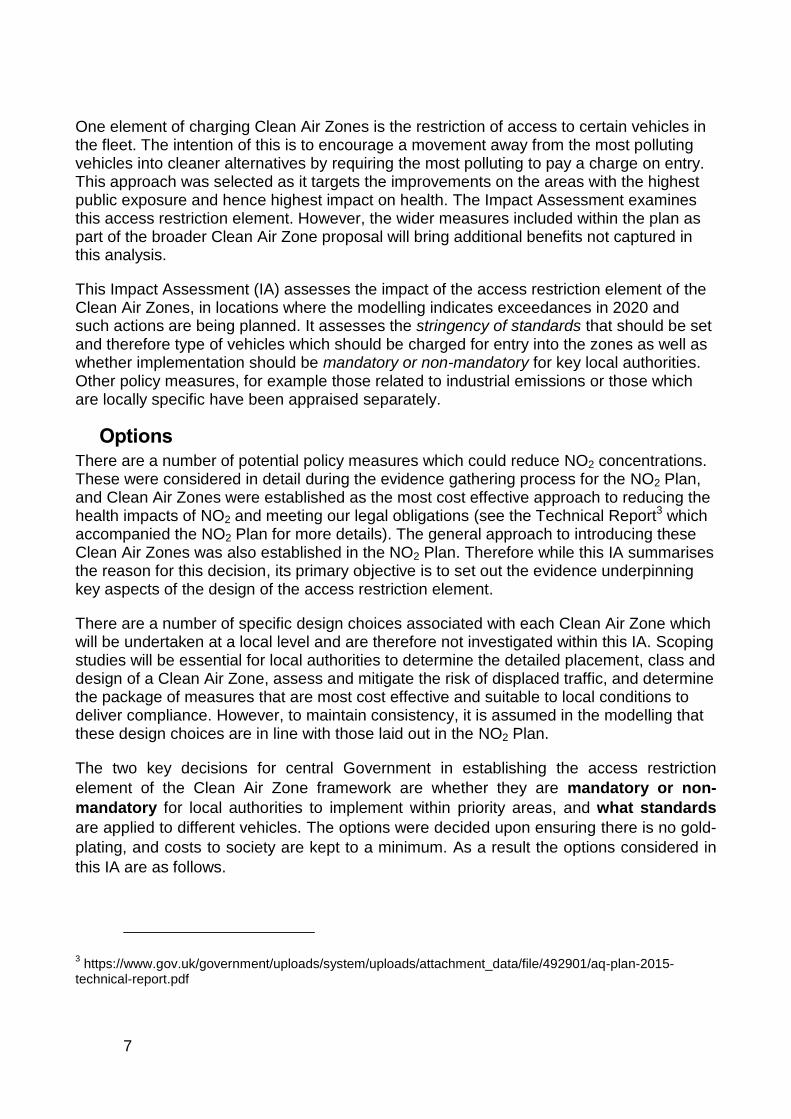
One element of charging Clean Air Zones is the restriction of access to certain vehicles in the fleet. The intention of this is to encourage a movement away from the most polluting vehicles into cleaner alternatives by requiring the most polluting to pay a charge on entry. This approach was selected as it targets the improvements on the areas with the highest public exposure and hence highest impact on health. The Impact Assessment examines this access restriction element. However, the wider measures included within the plan as part of the broader Clean Air Zone proposal will bring additional benefits not captured in this analysis.
This Impact Assessment (IA) assesses the impact of the access restriction element of the Clean Air Zones, in locations where the modelling indicates exceedances in 2020 and such actions are being planned. It assesses the stringency of standards that should be set and therefore type of vehicles which should be charged for entry into the zones as well as whether implementation should be mandatory or non-mandatory for key local authorities. Other policy measures, for example those related to industrial emissions or those which are locally specific have been appraised separately.
Options There are a number of potential policy measures which could reduce NO2 concentrations. These were considered in detail during the evidence gathering process for the NO2 Plan, and Clean Air Zones were established as the most cost effective approach to reducing the health impacts of NO2 and meeting our legal obligations (see the Technical Report3 which accompanied the NO2 Plan for more details). The general approach to introducing these Clean Air Zones was also established in the NO2 Plan. Therefore while this IA summarises the reason for this decision, its primary objective is to set out the evidence underpinning key aspects of the design of the access restriction element.
There are a number of specific design choices associated with each Clean Air Zone which will be undertaken at a local level and are therefore not investigated within this IA. Scoping studies will be essential for local authorities to determine the detailed placement, class and design of a Clean Air Zone, assess and mitigate the risk of displaced traffic, and determine the package of measures that are most cost effective and suitable to local conditions to deliver compliance. However, to maintain consistency, it is assumed in the modelling that these design choices are in line with those laid out in the NO2 Plan.
The two key decisions for central Government in establishing the access restriction
element of the Clean Air Zone framework are whether they are mandatory or non-
mandatory for local authorities to implement within priority areas, and what standards
are applied to different vehicles. The options were decided upon ensuring there is no gold-
plating, and costs to society are kept to a minimum. As a result the options considered in
this IA are as follows.
3 https://www.gov.uk/government/uploads/system/uploads/attachment_data/file/492901/aq-plan-2015-
technical-report.pdf
8
Option 0: Baseline scenario – no action is taken by local authorities. Costs and
benefits of this option are zero. Other options are benchmarked against this option.
Option 1: Implementation of Ultra Low Emission Zone (ULEZ) and tightening of
Low Emission Zone (LEZ) standards in London; mandatory Clean Air Zones within
five local authorities with emission standards of petrol Euro 4, diesel Euro 6/VI
Option 2: Implementation of ULEZ and tightening of LEZ standards in London; non-
mandatory Clean Air Zones within five local authorities with emission standards,
petrol Euro 4, diesel Euro 6/VI
Option 3: Implementation of ULEZ and tightening of LEZ standards in London;
mandatory Clean Air Zones within five local authorities with lower emission
standards, petrol Euro 3, diesel Euro 5/V
Modelling Approach In designing the framework the key trade-off is between improving public health and the cost of moving to a cleaner fleet. Owners of vehicles below the required Euro standard will have to change their behaviour when entering a Clean Air Zone. This will have implications for costs and benefits.
Vehicle owners will have a range of options available to them, which have various implications for air quality and welfare:
Continue into Clean Air Zone and pay charge - No change in air quality results from this choice. However individuals will incur an extra cost and Government an additional benefit (the charges count as a transfer).
Avoid driving into Clean Air Zone – This will lead to reductions in emissions but increase in costs for businesses and individuals.
Divert journey to avoid the Clean Air Zone – This will result in reductions in emissions inside the zone but increases outside the zone. It will incur extra costs to drivers.
Upgrade to an exempt vehicle – this will have air quality benefits but lead to additional costs to consumers and businesses.
Redeploy vehicle – this option is available to vehicle owners with a fleet of vehicles, who redeploy dirtier vehicles onto routes which avoid the zone and cleaner ones into the zone. It would incur minimal cost. However, data on this behaviour change was not available in a consistent way with other behaviour change assumptions, and so this has not been modelled.
Impacts quantified as a consequence of the intervention in this economic assessment are listed below.
9
Benefits
The key benefits delivered by the preferred option are:
Air quality impacts – primarily relating to premature mortality from NOx exposure. These are assessed via the damage cost approach, with the link between NO2 and mortality based on the Committee on the Medical Effects of Air Pollutants (COMEAP)’s interim recommendation4.
Greenhouse gas (GHG) reductions – newer vehicles will use less fuel therefore will reduce GHG emissions. This impact is assessed alongside benefits from some journeys being cancelled.
Traffic flow improvements – Less vehicles on particular road links will have traffic flow improvements, shortening journey times for those who still travel. This is assessed in line with Department for Transport (DfT)’s WebTAG appraisal guidance on the value of time.
Costs
Costs to drivers are estimated based on identifying the different reactions by individuals travelling into the zones and the cost to undertake those actions.
“Welfare loss” – the loss incurred by non-compliant vehicle owners who move from their current vehicle to a compliant alternative.
Lost value of asset – accelerated fleet turnover will reduce value of older vehicles.
Cost of avoided trips – some drivers will incur costs from changing route, not making a journey or shifting mode.
Implementation costs– including infrastructure, running costs and scoping studies.
The IA does not quantify behaviour change from redeployment. Including this behaviour change option will reduce costs, as fleet owners will be able to avoid costs by shifting compliant vehicles into zones and non-compliant vehicles outside.
The IA also considers the likelihood of reaching compliance with legal limit values for NO2 through implementation of the different options considered. The quantitative analysis is unable to factor in the costs of non-compliance. Such a situation would have a range of impacts such as on reputation.
Key assumptions and Uncertainties The IA measures impacts of Clean Air Zones, both voluntary and mandatory. This builds on the modelling done for the NO2 Plan, which identified 6 cities that would be non-compliant in 2020.
4 https://www.gov.uk/government/uploads/system/uploads/attachment_data/file/460401/air-quality-
econanalysis-nitrogen-interim-guidance.pdf
10
London is currently considering voluntarily taking forward a Clean Air Zone, in the form of an ULEZ and other measures. However as these measures are not currently firmly developed they are not included in our baseline modelling. These measures are required to deliver national compliance so they are therefore expected in both the voluntary and mandatory options. This reflects the importance of the Clean Air Zone framework in supporting the action in London.
Policy measures therefore model the 5 Clean Air Zones, and the London ULEZ and a Clean Air Zone in the wider London area, against a baseline of none of these measures.
There are a number of sensitivities associated with the modelling undertaken in this Impact Assessment. Three of the largest sensitivities have been quantified. These are as follows:
Performance of car vehicle emissions standards – On 21 April 2016 DfT published its vehicle emissions testing conclusions5. The sensitivity of impact calculations to a range of revised emissions factors for Euro 6 diesel cars have been explored. This is only relevant to implementation in London given this is the only location in this modelling where cars are subject to the access restriction charge.
Magnitude of health impacts – COMEAP have released an interim statement on the valuation of health impacts of NO2; however, there are uncertainties relating to the magnitude of such impacts. COMEAP have recommended a range which has been tested.
Number of vehicles impacted - The number of unique vehicles affected by the implementation of the Clean Air Zones has been estimated by combining Trafficmaster data, which tracks the journeys of a sample of vehicles, with Automatic Number Plate Recognition (ANPR) data from London, identifying the number of unique vehicles entering London in a year. The number of unique vehicles within the total network of Clean Air Zones is then based on uprating London vehicles by the relative number of vehicles estimated to enter the whole network. Given this is a sample of vehicles there is uncertainty on the actual number of vehicles impacts.
Infrastructure costs are taken from information from similar schemes, and at this stage are relatively simplistic estimates of possible infrastructure costs. These have been uprated to incorporate optimism bias. During the consultation stage more data will be collected on the latest infrastructure cost elements to refine cost estimates.
5 https://www.gov.uk/government/publications/vehicle-emissions-testing-programme-conclusions
11
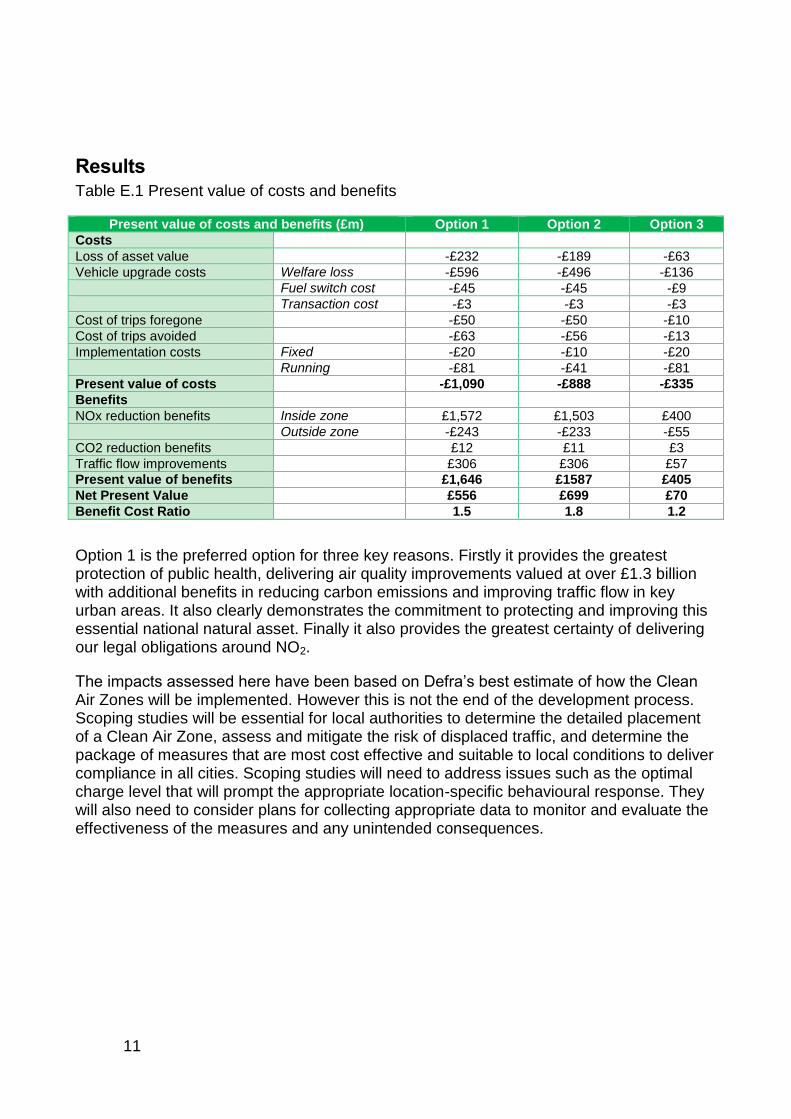
Results Table E.1 Present value of costs and benefits
Present value of costs and benefits (£m) Option 1 Option 2 Option 3
Costs
Loss of asset value -£232 -£189 -£63
Vehicle upgrade costs Welfare loss -£596 -£496 -£136
Fuel switch cost -£45 -£45 -£9
Transaction cost -£3 -£3 -£3
Cost of trips foregone -£50 -£50 -£10
Cost of trips avoided -£63 -£56 -£13
Implementation costs Fixed -£20 -£10 -£20
Running -£81 -£41 -£81
Present value of costs -£1,090 -£888 -£335
Benefits
NOx reduction benefits Inside zone £1,572 £1,503 £400
Outside zone -£243 -£233 -£55
CO2 reduction benefits £12 £11 £3
Traffic flow improvements £306 £306 £57
Present value of benefits £1,646 £1587 £405
Net Present Value £556 £699 £70
Benefit Cost Ratio 1.5 1.8 1.2
Option 1 is the preferred option for three key reasons. Firstly it provides the greatest protection of public health, delivering air quality improvements valued at over £1.3 billion with additional benefits in reducing carbon emissions and improving traffic flow in key urban areas. It also clearly demonstrates the commitment to protecting and improving this essential national natural asset. Finally it also provides the greatest certainty of delivering our legal obligations around NO2.
The impacts assessed here have been based on Defra’s best estimate of how the Clean Air Zones will be implemented. However this is not the end of the development process. Scoping studies will be essential for local authorities to determine the detailed placement of a Clean Air Zone, assess and mitigate the risk of displaced traffic, and determine the package of measures that are most cost effective and suitable to local conditions to deliver compliance in all cities. Scoping studies will need to address issues such as the optimal charge level that will prompt the appropriate location-specific behavioural response. They will also need to consider plans for collecting appropriate data to monitor and evaluate the effectiveness of the measures and any unintended consequences.
12
1. Rationale for Intervention 1. Air pollution imposes significant damage to public health, the natural environment
and economic output. Defra has estimated that the combined impact of exposure to NO2 and PM2.5 results in up to 50,000 deaths annually. This imposes an annual social cost of up to £27.5 billion.
2. The fact that these costs to others are not fully reflected in individual’s decision making means that they are what economists term a negative externality. In such circumstances, it has been proven that the free market is not able to deliver the optimal outcome.
3. This is because the societal cost of consuming a polluting activity is greater than the private cost incurred. Therefore the public will choose to consume these goods beyond the point where the social cost equals the social benefit.
4. This creates a need for government intervention. The primary approach to address this problem has been to place limits on specific sources of pollution such as road transport vehicles and industrial plants which reflect both the social cost of the pollution and the ability to reduce emissions. However, evidence on the social costs of air pollution has increased dramatically in recent years, with the identification of a robust direct link between nitrogen dioxide (NO2) and mortality. At the same time the costs of action to mitigate emissions of such pollutants have changed as new technologies have been developed and existing technologies refined.
5. It is well recognized that policies must be targeted appropriately. Setting national emission limits on different activities is not sufficient to provide adequate protection from the detrimental health impacts for the UK population. Two specific concerns on relying on national emission standards are:
Equity – Air pollution is not evenly distributed across the UK and therefore the burden does not fall equally on all parts of society. Exposures are greater in urban areas and those groups that are more likely to live in these areas will be disproportionately impacted.
Efficiency – The impacts of emissions are location specific. The link from emissions to concentrations depends on other conditions such as the background level of pollution within an area and meteorology. This means that a single national control may not be effective in some locations.
6. Assessing the impacts of air quality is complex and inherently uncertain. Relying only on emission standards creates a notable risk to public health as the evidence develops. This is particularly pertinent in the case of NO2 given the recent developments in health evidence which suggest the impacts may be more severe than previously believed. As a result, the UK is implementing a wide range of measures, with the aim to bring UK concentrations of NO2 below 40 µg/m3 across the UK in the shortest possible time. Clean Air Zones are one such measure which is central to achieving this outcome. This Impact Assessment considers the access restriction element of Clean Air Zones, which implements a charge for the most polluting vehicles.
13
2. Background
2.1. The causes of air pollution 7. Air pollution is primarily caused by the combustion of fossil fuels, for example, in
power generation, industrial processes, domestic heating and road vehicles. These can give rise to a number of pollutants including nitrogen oxides (NOx)
6, sulphur dioxide (SO2) and particulate matter (PM). Chemical reactions in the atmosphere can also lead to the generation of other pollutants. Ozone is produced by the effect of sunlight on nitrogen oxides and volatile organic compounds (also produced by industry), while NOx and sulphur oxides can also contribute to the formation of particulate matter.
8. Most combustion processes where fossil fuels are burnt produce air-borne oxides of nitrogen. The combustion process causes nitrogen to react with oxygen (oxidation) forming either nitric oxide (NO) or nitrogen dioxide (NO2). These oxides of nitrogen are collectively known as NOx (i.e. NOx is NO + NO2).
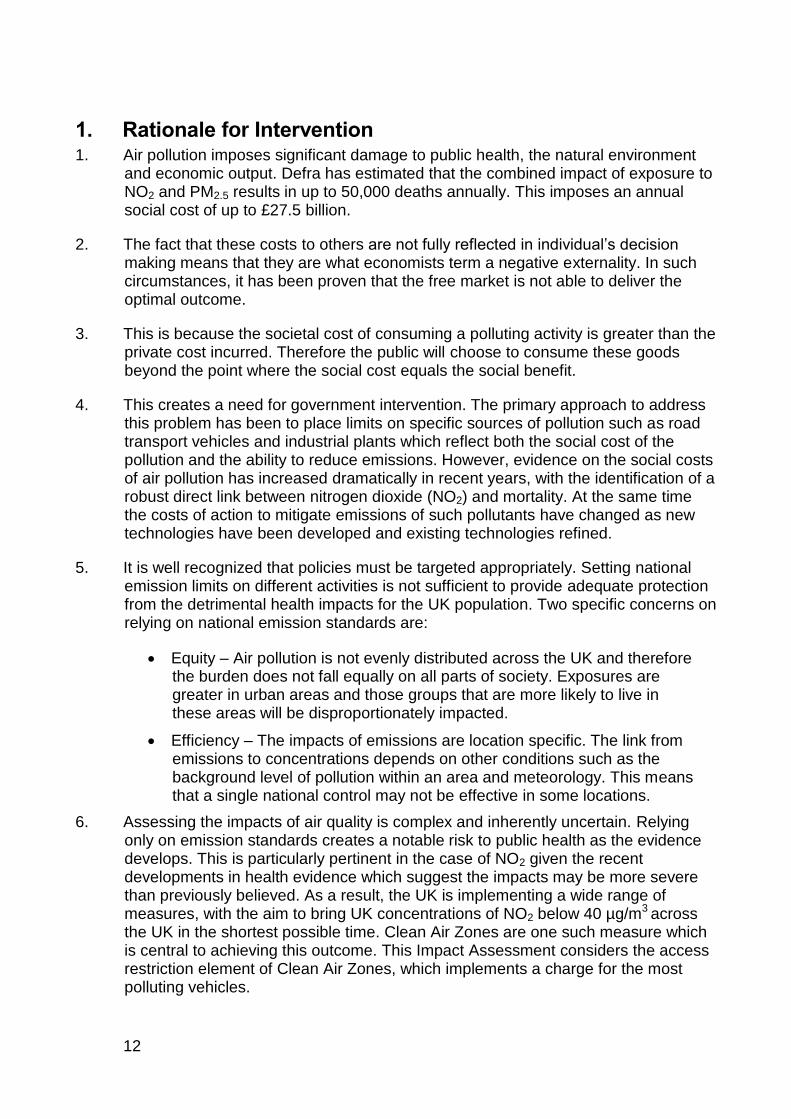
9. Particulates can be primary (emitted directly to the atmosphere) or secondary (formed by the chemical reaction of other pollutants in the air such as SO2 or NO2). The main source is combustion, e.g. vehicles and power stations. Other man-made sources include quarrying and mining, industrial processes and tyre and brake wear. Natural sources include wind-blown dust, sea salt, pollens and soil particles. Figure 2.1 shows the total emissions of PM2.5 between 1990 and 2014. Emissions have roughly halved over this period.
6 Nitrogen oxides (NOX) is the term used to describe the sum of nitrogen dioxide (NO2) and nitric
oxide (NO). Ambient NO2 concentrations include contributions from both directly emitted primary NO2 and secondary NO2 formed in the atmosphere by the oxidation of NO.
14
Figure 2.1: Historical UK PM2.5 Emissions (1990- 2014)
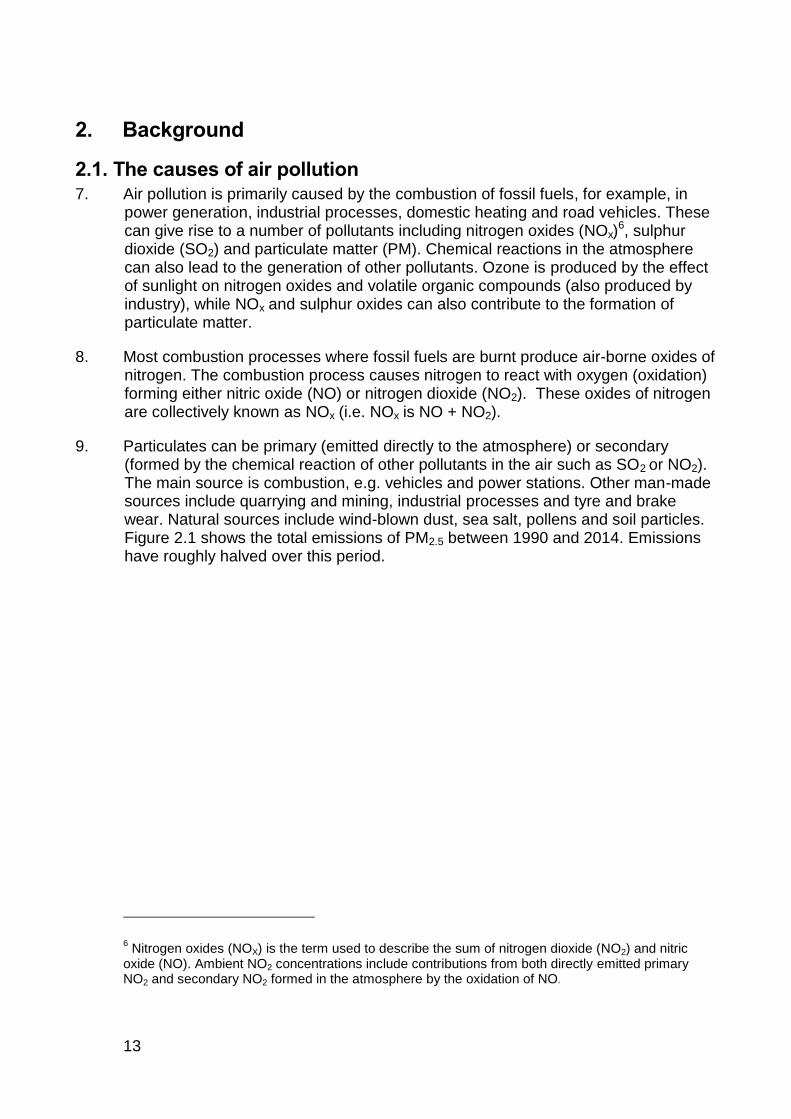
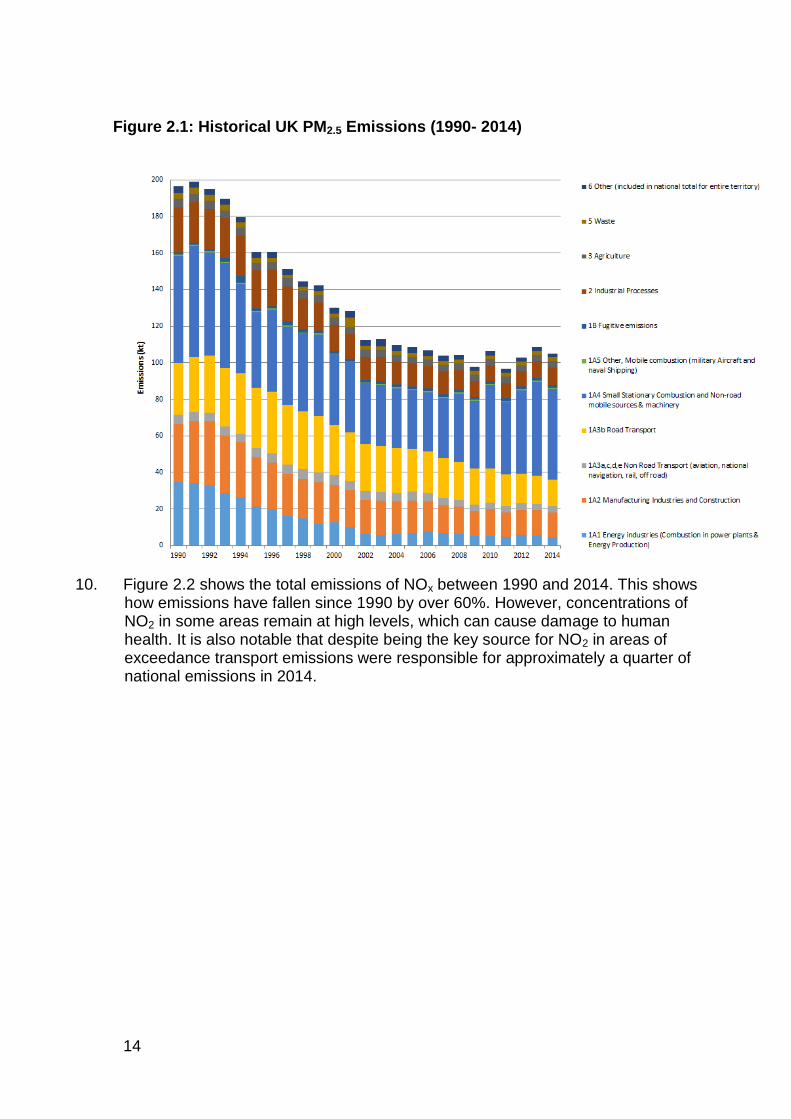
10. Figure 2.2 shows the total emissions of NOx between 1990 and 2014. This shows
how emissions have fallen since 1990 by over 60%. However, concentrations of NO2 in some areas remain at high levels, which can cause damage to human health. It is also notable that despite being the key source for NO2 in areas of exceedance transport emissions were responsible for approximately a quarter of national emissions in 2014.
15
Figure 2.2: Historical UK NOx Emissions (1990-2014)7
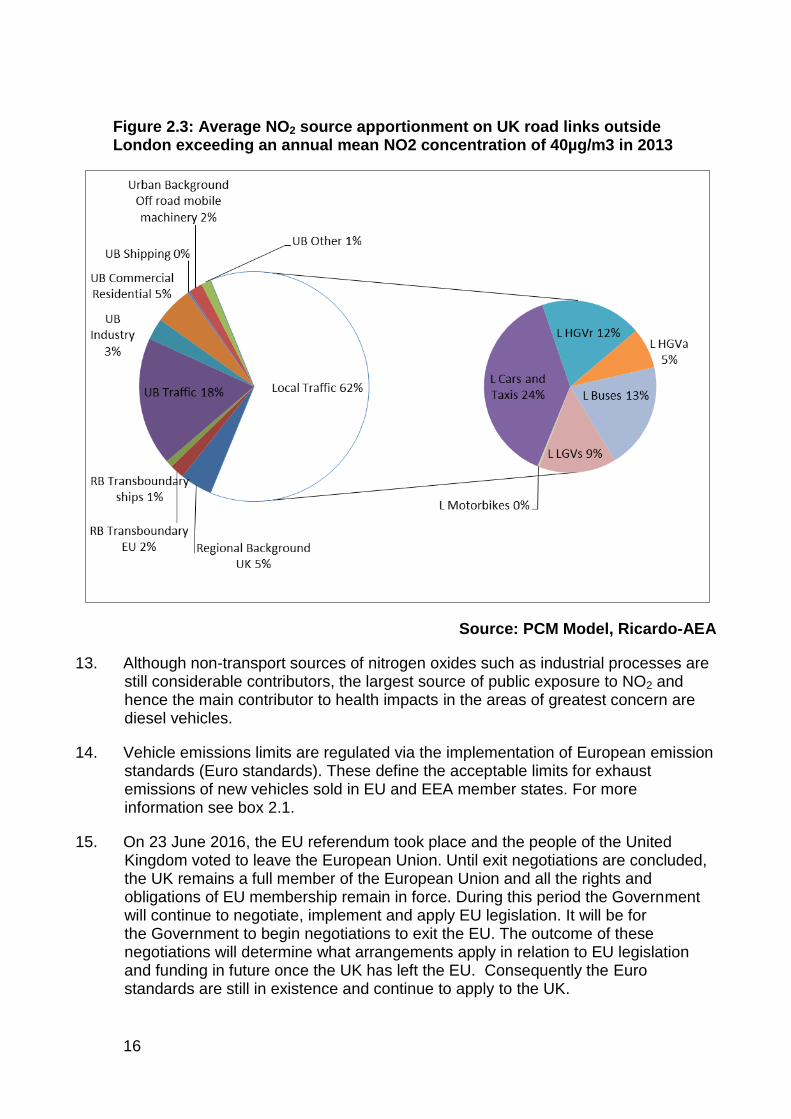
11. To assess the effectiveness of potential abatement measures the first consideration is to review the contribution of different sources of emissions at the areas of concern. Figure 2.3 provides a detailed disaggregation of NOx at the roadside outside London. It is important to note at this point it is not possible to provide a similar breakdown for NO2 as it is both released directly and formed from emissions of other oxides of nitrogen.
12. The diagram shows transport emissions create around 80% of roadside NOx. Transport also makes a significant contribution to PM. The majority of transport NOx comes from diesel vehicles, while other sources such as industrial and domestic emissions are not a significant contributor of emissions in the non-compliant areas under consideration.
7 https://uk-air.defra.gov.uk/assets/documents/reports/cat07/1603150959_GB_IIR_2016_Final.pdf
16
Figure 2.3: Average NO2 source apportionment on UK road links outside London exceeding an annual mean NO2 concentration of 40µg/m3 in 2013
Source: PCM Model, Ricardo-AEA
13. Although non-transport sources of nitrogen oxides such as industrial processes are still considerable contributors, the largest source of public exposure to NO2 and hence the main contributor to health impacts in the areas of greatest concern are diesel vehicles.
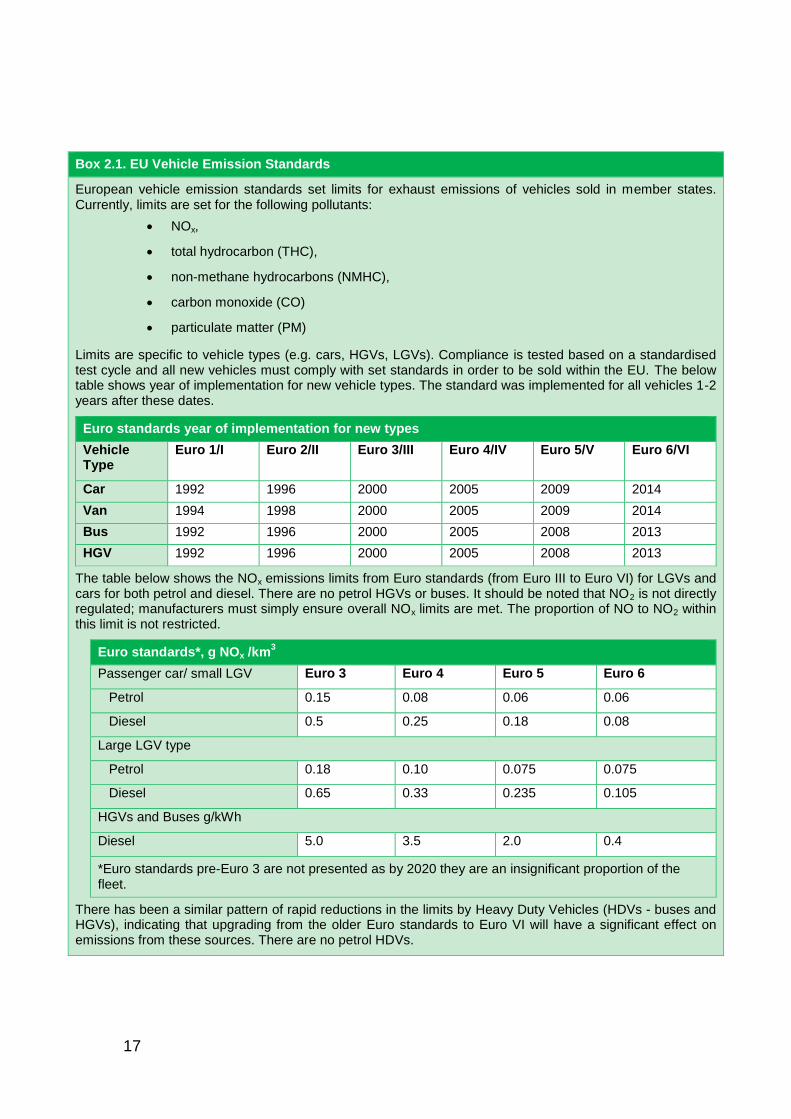
14. Vehicle emissions limits are regulated via the implementation of European emission standards (Euro standards). These define the acceptable limits for exhaust emissions of new vehicles sold in EU and EEA member states. For more information see box 2.1.
15. On 23 June 2016, the EU referendum took place and the people of the United Kingdom voted to leave the European Union. Until exit negotiations are concluded, the UK remains a full member of the European Union and all the rights and obligations of EU membership remain in force. During this period the Government will continue to negotiate, implement and apply EU legislation. It will be for the Government to begin negotiations to exit the EU. The outcome of these negotiations will determine what arrangements apply in relation to EU legislation and funding in future once the UK has left the EU. Consequently the Euro standards are still in existence and continue to apply to the UK.
17
Box 2.1. EU Vehicle Emission Standards
European vehicle emission standards set limits for exhaust emissions of vehicles sold in member states. Currently, limits are set for the following pollutants:
NOx,
total hydrocarbon (THC),
non-methane hydrocarbons (NMHC),
carbon monoxide (CO)
particulate matter (PM)
Limits are specific to vehicle types (e.g. cars, HGVs, LGVs). Compliance is tested based on a standardised test cycle and all new vehicles must comply with set standards in order to be sold within the EU. The below table shows year of implementation for new vehicle types. The standard was implemented for all vehicles 1-2 years after these dates.
Euro standards year of implementation for new types
Vehicle Type
Euro 1/I Euro 2/II Euro 3/III Euro 4/IV Euro 5/V Euro 6/VI
Car 1992 1996 2000 2005 2009 2014
Van 1994 1998 2000 2005 2009 2014
Bus 1992 1996 2000 2005 2008 2013
HGV 1992 1996 2000 2005 2008 2013
The table below shows the NOx emissions limits from Euro standards (from Euro III to Euro VI) for LGVs and cars for both petrol and diesel. There are no petrol HGVs or buses. It should be noted that NO2 is not directly regulated; manufacturers must simply ensure overall NOx limits are met. The proportion of NO to NO2 within this limit is not restricted.
Euro standards*, g NOx /km3
Passenger car/ small LGV Euro 3 Euro 4 Euro 5 Euro 6
Petrol 0.15 0.08 0.06 0.06
Diesel 0.5 0.25 0.18 0.08
Large LGV type
Petrol 0.18 0.10 0.075 0.075
Diesel 0.65 0.33 0.235 0.105
HGVs and Buses g/kWh
Diesel 5.0 3.5 2.0 0.4
*Euro standards pre-Euro 3 are not presented as by 2020 they are an insignificant proportion of the fleet.
There has been a similar pattern of rapid reductions in the limits by Heavy Duty Vehicles (HDVs - buses and HGVs), indicating that upgrading from the older Euro standards to Euro VI will have a significant effect on emissions from these sources. There are no petrol HDVs.
18
16. The introduction of increasingly stringent Euro standards has not delivered the expected NOx emission reductions from diesel vehicles in real world use. As a result road transport is still by far the largest contributor to NO2 pollution in areas where the UK is exceeding NO2 legal obligations.
17. Addressing road transport therefore presents the most significant opportunity to improve air quality. By the careful choice of appropriate and proportionate measures that recognise the economic and social impacts and value, we can deliver broader benefits.
18. The opportunities however are not limited to transport. A significant proportion of background emissions still come from non-transport sources and (as set out in Figure 2.2 below) Government is also taking action to tackle emissions from industrial, domestic and other sources.
2.2. Impact on health and the environment 19. Improving air quality can improve health in the short and in the long-term. Better air
quality will have particular benefits for people with heart or lung conditions or breathing problems.
20. The Committee on the Medical Effects of Air Pollution (COMEAP) has identified that the evidence associating exposure to NO2 with health effects has strengthened substantially in recent years8. An estimate of an effect on mortality equivalent to 23,500 deaths annually in the UK has been made on the basis of NO2 concentrations9. Many of the sources of NOx are also sources of particulate matter (PM). The impact of long-term exposure to small particulate matter pollution (PM2.5)
is estimated to have an effect on mortality equivalent to nearly 29,000 deaths in the UK10. There is likely to be overlap between these two estimates of mortality, but the combined impact of these two pollutants is a significant challenge to public health. Recommended limits for exposure have been set taking account of guidelines by the World Health Organisation.
21. Defra has estimated that the combined impact of exposure to NO2 and PM2.5 may impose an annual social cost of up to £29.7 billion on society. This is an upper bound, as a degree of uncertainty exists regarding benefits of reducing NO2 versus also reducing other co-varying pollutants.
8 Statement on the evidence for the effects of nitrogen dioxide on health https://www.gov.uk/government/publications/nitrogen-dioxide-
health-effects-of-exposure
9 Defra analysis using interim recommendations from COMEAP’s working group on NO2. The working group made an interim
recommendation for a coefficient to reflect the possible relationship between mortality and NO2 concentrations (per µg/m3). COMEAP
has not yet made any estimates of the effects of NO2 on mortality. Any analysis will be subject to change following further analysis by the working group and consultation with the full committee.
10 COMEAP (2009) The Mortality Effects of Long-Term Exposure to Particulate Air Pollution in the United Kingdom
https://www.gov.uk/government/uploads/system/uploads/attachment_data/file/304641/COMEAP_mortality_effects_of_long_term_exposure.pdf
19
22. Developments in the health evidence surrounding NO2 mean Defra estimates the health benefit of reducing NO2 concentrations by 10µg/m3 at £740m per annum, within the upper range of £300m – £1.2billion. This figure only includes the benefits of reduced mortality; there are also additional benefits in terms of morbidity improvements but these have not been quantified.
23. At a local level the potential impact of poor air quality on health is captured in the Public Health Outcomes Framework11, which sets out the desired outcomes for public health in England and provides a means for driving improvement within and across authorities. The Public Health Outcomes Framework includes an air pollution indicator: the percentage of mortality attributable to particulate matter (PM2.5) pollution. This indicator is intended to raise awareness of the impact of air pollution on public health. It allows Directors of Public Health to prioritise action on air quality in their local area to help reduce the health burden from air pollution. Public Health England has also published estimates of the mortality burden attributable to particulate matter pollution in local authority areas in the UK12. Although these estimates are based on studies of the health effects associated with particulate matter pollution, many of the measures and the drivers behind improvements will have wider benefits, including reducing NOx emissions and NO2 concentrations.
24. In addition to the health impacts, high levels of NOx can have an adverse effect on vegetation; including leaf or needle damage and reduced growth. Deposition of pollutants derived from NOx emissions contribute to acidification and/or eutrophication of sensitive habitats, which in turn can lead to loss of biodiversity, often at locations far removed from the original source of emissions.
25. NOx can form secondary PM and also contributes to the formation of ground-level ozone (O3), the prevailing concentrations of which are estimated to reduce crop production by 9% in bad years13.
26. In 2011, across the UK, 47% of sensitive habitats exceeded their critical loads for acidity and 65% for nitrogen deposition. The level of exceedances varies significantly across the UK; for nitrogen deposition it is 97% in England, 92% in Wales, 45% in Scotland and 89% in Northern Ireland14.
11 https://www.gov.uk/government/publications/healthy-lives-healthy-people-improving-outcomes-and-supporting-transparency
12 https://www.gov.uk/government/publications/estimating-local-mortality-burdens-associated-with-particulate-air-pollution
13 http://icpvegetation.ceh.ac.uk/publications/documents/OzoneandcropsintheUK-published-November2011.pdf
14 http://randd.defra.gov.uk/Default.aspx?Menu=Menu&Module=More&Location=None&Completed=0&ProjectID=18593
20
2.3. Air Quality Legislation
2.3.1. UK legislation
27. The legislative requirements for action are set out in the Air Quality Standards Regulations 2010. This sets certain limits and information requirements for a number of pollutants including nitrogen dioxide (NO2), taking account of guidelines from the World Health Organisation to help address the harmful effects of pollution.
28. Assessment of compliance is done on the basis of air quality data from a network of monitoring sites across the UK (called the Automatic Urban and Rural Network or AURN), supplemented by modelling of pollutants using a GIS-based Pollution Climate Mapping model (PCM) which is underpinned by data from the National Atmospheric Emissions Inventory and ambient monitoring data from national monitoring networks.
29. The UK assesses compliance on a zone-by-zone basis. For the purpose of assessment, the UK is split into 43 zones and agglomerations. There are 28 agglomerations (contiguous urban areas with a population greater than 250,000) and 15 other zones.
30. For NO2 there are two limit values15 for the protection of human health. These require that:
annual mean concentration levels of NO2 do not exceed 40μg/m3; and
hourly mean concentration levels of NO2 do not exceed 200μg/m3 more than 18 times a calendar year.
31. The UK assesses air quality data on an annual basis. In 2013 five zones met the limit value for annual mean NO2 concentrations16. 31 zones had measured or modelled NO2 levels over the limit and had no time extension.
15 Limit values are expressed in terms of μg/m
3 (micrograms per cubic metre). This may also be written as μgm
-3
16 Where a time extension applies the UK is required to provide the Commission with data indicating that the annual mean
NO2 concentrations in these Zones have remained at or below the annual limit value plus the maximum margin of tolerance to
60 μg/m3
21
32. In December 2015, the UK published the NO2 plan17. This demonstrated how the UK will achieve the legal limits as soon as possible. It was accompanied by a Technical Report18 which provided the economic and scientific assessment of the impacts of the Plan. Ahead of the production of this report, a wide range of policy options were considered and assessed to identify the most efficient and cost effective manner in which to reduce NO2 concentrations and reach compliance in the shortest possible time. Clean Air Zones were identified as a central measure to contribute towards this objective.
17 https://www.gov.uk/government/publications/air-quality-in-the-uk-plan-to-reduce-nitrogen-dioxide-emissions
18 https://www.gov.uk/government/uploads/system/uploads/attachment_data/file/492901/aq-plan-2015-technical-report.pdf
22
2.4. Clean Air Zones 33. A primary new measure in the NO2 plan is the introduction of Clean Air Zones.
These are areas where action is focused to improve air quality and only the cleanest vehicles are encouraged (through the use of vehicle emission standards). They are geographically defined areas allowing action and resources to be targeted to deliver the greatest health benefits. Clean Air Zones can be implemented by any local authority to tackle air quality problems in their area. Although detailed design will rest with local authorities, to ensure a consistent approach the Government is producing a framework for the implementation of the zones setting out key features.
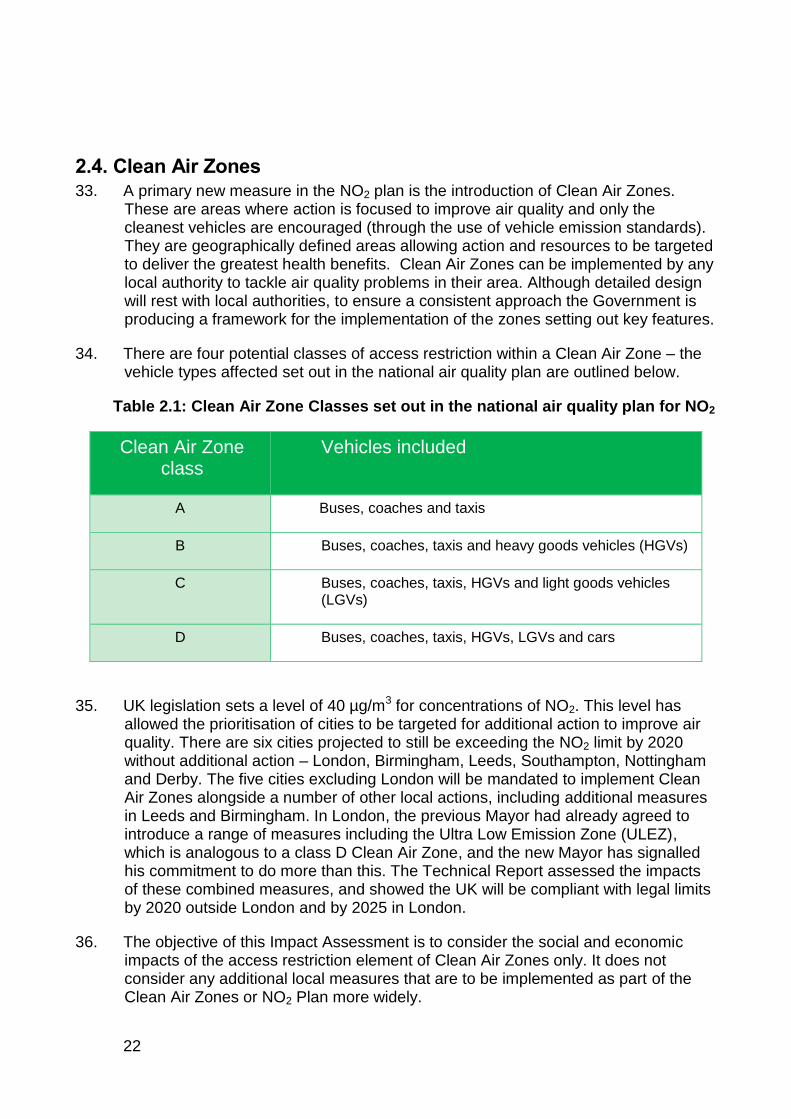
34. There are four potential classes of access restriction within a Clean Air Zone – the vehicle types affected set out in the national air quality plan are outlined below.
Table 2.1: Clean Air Zone Classes set out in the national air quality plan for NO2
Clean Air Zone class
Vehicles included
A Buses, coaches and taxis
B Buses, coaches, taxis and heavy goods vehicles (HGVs)
C Buses, coaches, taxis, HGVs and light goods vehicles (LGVs)
D Buses, coaches, taxis, HGVs, LGVs and cars
35. UK legislation sets a level of 40 µg/m3 for concentrations of NO2. This level has allowed the prioritisation of cities to be targeted for additional action to improve air quality. There are six cities projected to still be exceeding the NO2 limit by 2020 without additional action – London, Birmingham, Leeds, Southampton, Nottingham and Derby. The five cities excluding London will be mandated to implement Clean Air Zones alongside a number of other local actions, including additional measures in Leeds and Birmingham. In London, the previous Mayor had already agreed to introduce a range of measures including the Ultra Low Emission Zone (ULEZ), which is analogous to a class D Clean Air Zone, and the new Mayor has signalled his commitment to do more than this. The Technical Report assessed the impacts of these combined measures, and showed the UK will be compliant with legal limits by 2020 outside London and by 2025 in London.
36. The objective of this Impact Assessment is to consider the social and economic impacts of the access restriction element of Clean Air Zones only. It does not consider any additional local measures that are to be implemented as part of the Clean Air Zones or NO2 Plan more widely.
23
37. Feasibility studies are underway in the five cities to determine the detailed design of each individual Clean Air Zone. The studies will assess options and provide a recommendation for a final scheme proposal for a Clean Air Zone that delivers compliance with legal limit values for nitrogen dioxide (NO2).
38. Alongside delivering the required reductions in pollution, important considerations in designing a scheme are: value for money (implementation and operational), cost-effective innovation and futureproofing, deliverability, as well as considering the impact on stakeholders. There are several stages of the feasibility studies to identify a final scheme proposal. These are underway and they are not due to be completed until next calendar year. As such they cannot be included as part of the Impact Assessment and will not form part of the public consultation on the draft Clean Air Zone Framework and draft secondary legislation.
39. The schemes, that require local authorities to make use of their powers under Part III of the Transport Act 2000, will be subject to consultation locally. When local authorities submit draft schemes to the Secretary of State for final approval, they will be required to confirm that appropriate public consultation has been completed.
24
3. Options 40. Air pollution is caused by a wide variety of activities including transportation, energy
production, industrial processes and domestic heating. For each of these sources a number of different abatement measures also exist.
41. During the production of the NO2 Plans, Defra commissioned research on the effectiveness of different potential measures to improve air quality.19 In light of this research Defra undertook an in-depth prioritisation exercise to identify the most appropriate measures to take forward. This section provides a brief summary of the approach taken to prioritise and shortlist the potential measures.
3.1. Measure prioritisation 42. Given the diverse range of measures available to reduce emissions of NOx and
concentrations of NO2, it was necessary to undertake a prioritisation exercise. This was based on two criteria:
Effectiveness: Does the source/policy have a significant impact on emissions of NO2?
Efficiency: Do technologies exist to apply measures in a cost effective manner?
3.1.1. Assessing effectiveness
43. To assess the effectiveness of potential abatement measures the first consideration is to review the contribution of different sources of emissions at the areas of concern. As noted in section 2.1, road transport is responsible for approximately 80% of roadside NOx. Transport also makes a significant contribution to PM. The majority of transport NOx comes from diesel vehicles, while other sources such as industrial and domestic emissions are not a significant contributor of emissions in the non-compliant areas under consideration.
44. Given this, in order for policy to be effective in targeting emissions in the areas forecast not to be compliant with limit values by 2020, the measures considered focused on lowering the contribution made by road transport vehicles.
3.1.2. Assessing efficiency
45. As identified previously, road transport is both the largest source of concentrations in areas of exceedance, and transport emissions disproportionately drive exceedances, which means each tonne of emission savings from transport drives greater concentration reductions than emission reductions from other sources. 80% of NOx emissions in areas of exceedance are from road transport (see Figure 2.3); however, transport is only responsible for 23% of emissions nationally. Based on a
19 https://uk-air.defra.gov.uk/library/reports?report_id=901
25
review of the source apportionment data it was decided that abatement from road transport should be prioritised for additional in-depth modelling. The source apportionment data shows that industrial sources contribute only around 3% of total NOx emissions in the areas of exceedance. Therefore taking action to reduce industrial emissions would have minimal impact on reducing concentrations.
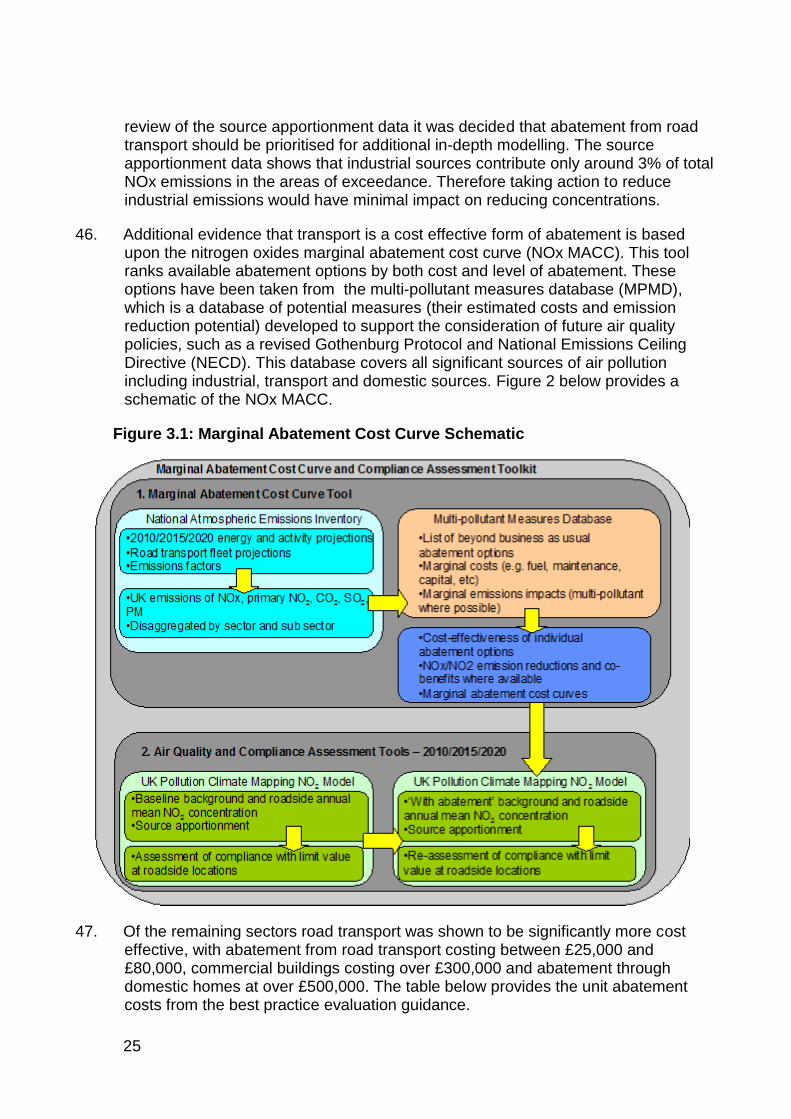
46. Additional evidence that transport is a cost effective form of abatement is based upon the nitrogen oxides marginal abatement cost curve (NOx MACC). This tool ranks available abatement options by both cost and level of abatement. These options have been taken from the multi-pollutant measures database (MPMD), which is a database of potential measures (their estimated costs and emission reduction potential) developed to support the consideration of future air quality policies, such as a revised Gothenburg Protocol and National Emissions Ceiling Directive (NECD). This database covers all significant sources of air pollution including industrial, transport and domestic sources. Figure 2 below provides a schematic of the NOx MACC.
Figure 3.1: Marginal Abatement Cost Curve Schematic
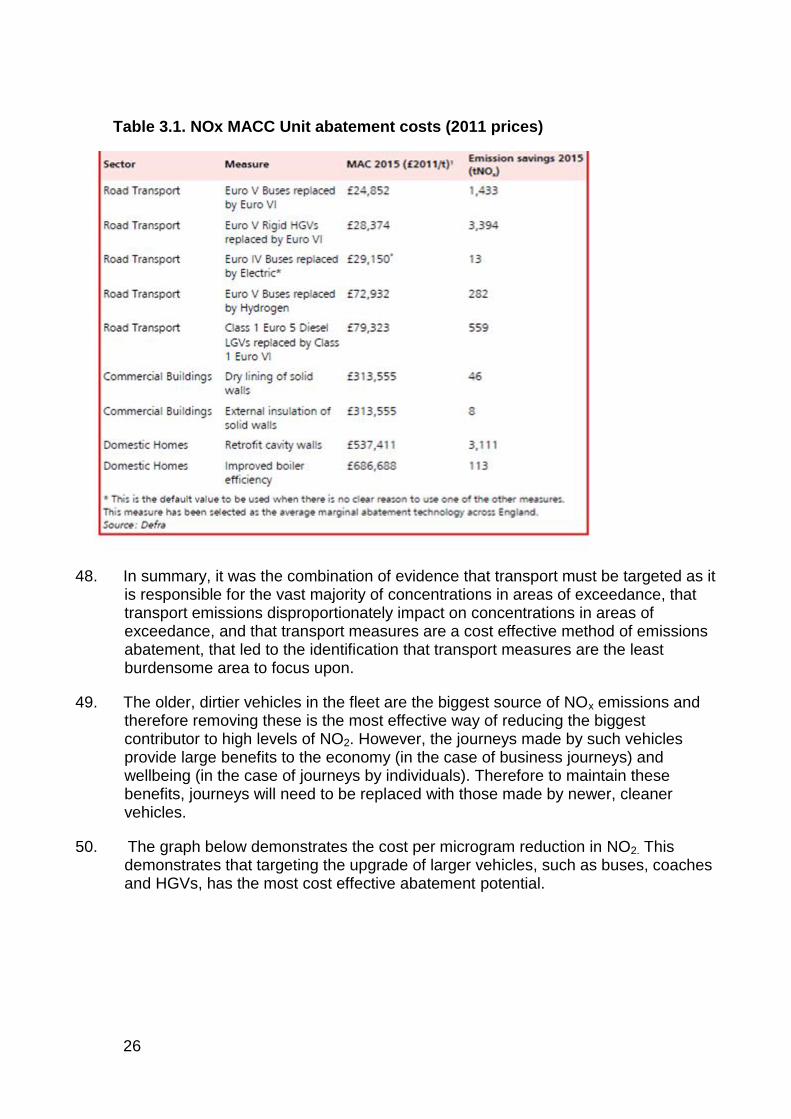
47. Of the remaining sectors road transport was shown to be significantly more cost effective, with abatement from road transport costing between £25,000 and £80,000, commercial buildings costing over £300,000 and abatement through domestic homes at over £500,000. The table below provides the unit abatement costs from the best practice evaluation guidance.
26
Table 3.1. NOx MACC Unit abatement costs (2011 prices)
48. In summary, it was the combination of evidence that transport must be targeted as it is responsible for the vast majority of concentrations in areas of exceedance, that transport emissions disproportionately impact on concentrations in areas of exceedance, and that transport measures are a cost effective method of emissions abatement, that led to the identification that transport measures are the least burdensome area to focus upon.
49. The older, dirtier vehicles in the fleet are the biggest source of NOx emissions and therefore removing these is the most effective way of reducing the biggest contributor to high levels of NO2. However, the journeys made by such vehicles provide large benefits to the economy (in the case of business journeys) and wellbeing (in the case of journeys by individuals). Therefore to maintain these benefits, journeys will need to be replaced with those made by newer, cleaner vehicles.
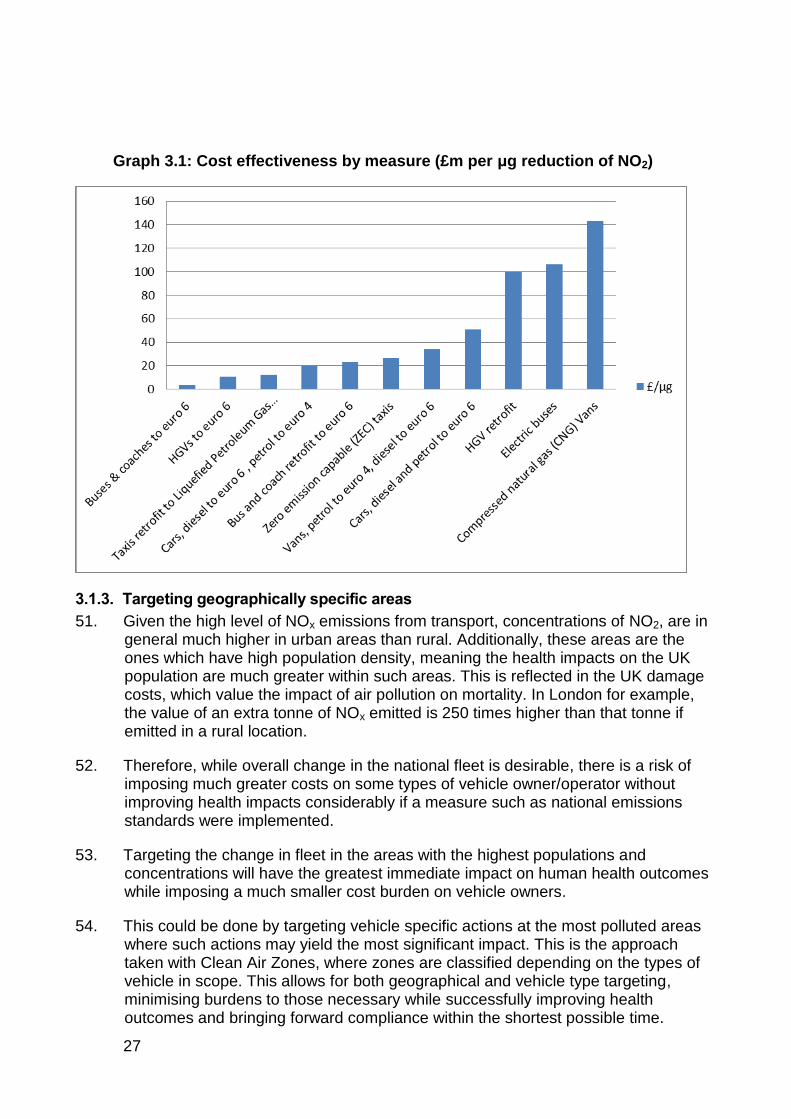
50. The graph below demonstrates the cost per microgram reduction in NO2. This demonstrates that targeting the upgrade of larger vehicles, such as buses, coaches and HGVs, has the most cost effective abatement potential.
27
Graph 3.1: Cost effectiveness by measure (£m per μg reduction of NO2)
3.1.3. Targeting geographically specific areas
51. Given the high level of NOx emissions from transport, concentrations of NO2, are in general much higher in urban areas than rural. Additionally, these areas are the ones which have high population density, meaning the health impacts on the UK population are much greater within such areas. This is reflected in the UK damage costs, which value the impact of air pollution on mortality. In London for example, the value of an extra tonne of NOx emitted is 250 times higher than that tonne if emitted in a rural location.
52. Therefore, while overall change in the national fleet is desirable, there is a risk of imposing much greater costs on some types of vehicle owner/operator without improving health impacts considerably if a measure such as national emissions standards were implemented.
53. Targeting the change in fleet in the areas with the highest populations and concentrations will have the greatest immediate impact on human health outcomes while imposing a much smaller cost burden on vehicle owners.
54. This could be done by targeting vehicle specific actions at the most polluted areas where such actions may yield the most significant impact. This is the approach taken with Clean Air Zones, where zones are classified depending on the types of vehicle in scope. This allows for both geographical and vehicle type targeting, minimising burdens to those necessary while successfully improving health outcomes and bringing forward compliance within the shortest possible time.
28
55. Local authorities assess what action can be taken at a local level in all the areas with high concentrations for which they are responsible. It is likely that many can be addressed via measures specifically tailored to the area in question. However, Clean Air Zones are likely to achieve the largest reductions, and are therefore central to the Air Quality Plans in the areas with the largest problems.
56. Other measures will also be implemented in these areas but it is impossible to model all the various measures that can be pursued given that these can vary greatly depending on the specific local conditions and manner of implementation. As a result, this Impact Assessment will assess the impact of the introduction of vehicle emissions standards on a local scale through the implementation of certain classes of Clean Air Zones.
57. As outlined in section 2.3, in order to comply with legal limits, the UK needs to reduce concentrations of nitrogen dioxide to 40 µg/m3 or below. Six cities are forecast to exceed this in 2020 – London, Birmingham, Leeds, Southampton, Nottingham and Derby - and these are where action should be prioritised.
3.2. Specific Options 58. From considering the points noted above along with wider policy considerations,
charging Clean Air Zones were selected as the most effective and efficient approach to reduce emissions of NOx and thereby improve public health in the six cites identified in the Plan. Therefore the focus of this Impact Assessment is around the design choices in establishing the access restriction element of Clean Air Zones (or equivalent in London) in these cities. This section provides an overview of the baseline and the assessed options in addition to providing a detailed breakdown of the design of each option.
59. The largest air quality problem is in London. Given the special powers granted to GLA, this issue is managed separately, with the planned introduction of the Ultra Low Emission Zone (ULEZ) and tightening of existing Low Emission Zone (LEZ). There is a degree of uncertainty over what exact measures will be implemented in the wider London area. However, given the equivalence of the ULEZ and LEZ to Clean Air Zone access restrictions, inclusion of London is necessary for compliance, and the fact that a large number of the vehicles affected in London will also be affected in the other five cities according to the Trafficmaster data, it is appropriate for these London measures to be included in the analysis in this Impact Assessment.
29
Box 3.1: London’s Ultra Low Emission Zone
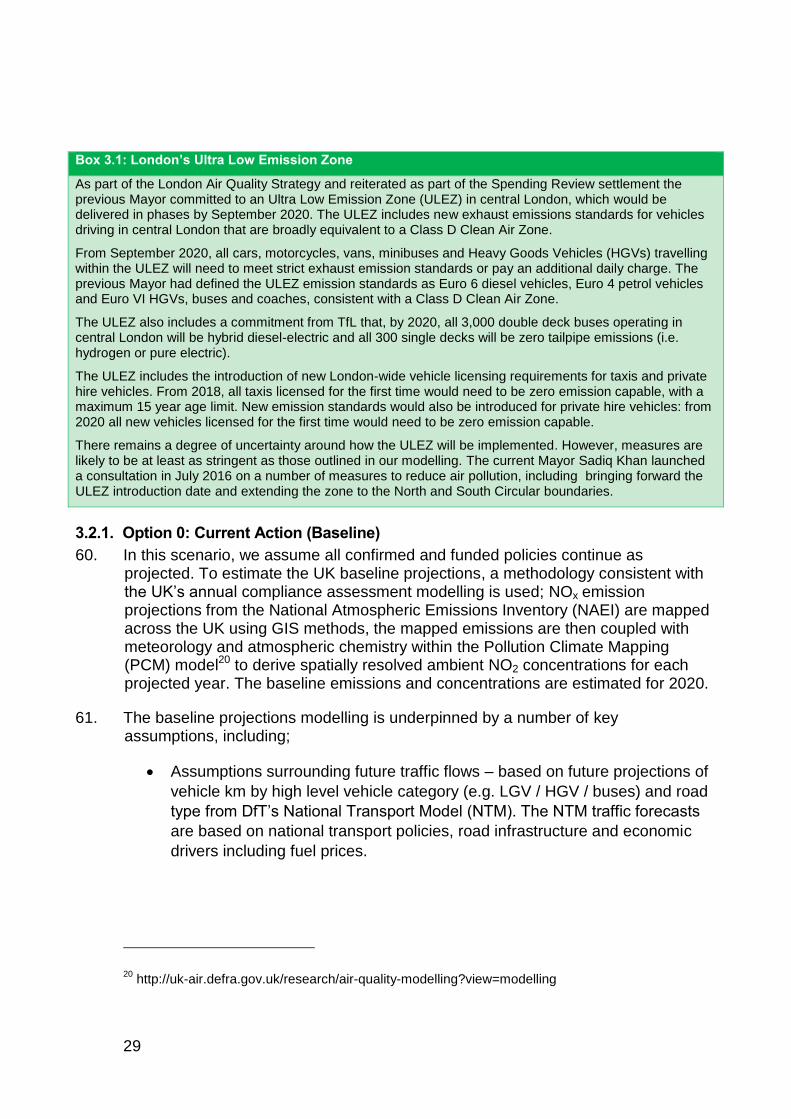
As part of the London Air Quality Strategy and reiterated as part of the Spending Review settlement the previous Mayor committed to an Ultra Low Emission Zone (ULEZ) in central London, which would be delivered in phases by September 2020. The ULEZ includes new exhaust emissions standards for vehicles driving in central London that are broadly equivalent to a Class D Clean Air Zone.
From September 2020, all cars, motorcycles, vans, minibuses and Heavy Goods Vehicles (HGVs) travelling within the ULEZ will need to meet strict exhaust emission standards or pay an additional daily charge. The previous Mayor had defined the ULEZ emission standards as Euro 6 diesel vehicles, Euro 4 petrol vehicles and Euro VI HGVs, buses and coaches, consistent with a Class D Clean Air Zone.
The ULEZ also includes a commitment from TfL that, by 2020, all 3,000 double deck buses operating in central London will be hybrid diesel-electric and all 300 single decks will be zero tailpipe emissions (i.e. hydrogen or pure electric).
The ULEZ includes the introduction of new London-wide vehicle licensing requirements for taxis and private hire vehicles. From 2018, all taxis licensed for the first time would need to be zero emission capable, with a maximum 15 year age limit. New emission standards would also be introduced for private hire vehicles: from 2020 all new vehicles licensed for the first time would need to be zero emission capable.
There remains a degree of uncertainty around how the ULEZ will be implemented. However, measures are likely to be at least as stringent as those outlined in our modelling. The current Mayor Sadiq Khan launched a consultation in July 2016 on a number of measures to reduce air pollution, including bringing forward the ULEZ introduction date and extending the zone to the North and South Circular boundaries.
3.2.1. Option 0: Current Action (Baseline)
60. In this scenario, we assume all confirmed and funded policies continue as projected. To estimate the UK baseline projections, a methodology consistent with the UK’s annual compliance assessment modelling is used; NOx emission projections from the National Atmospheric Emissions Inventory (NAEI) are mapped across the UK using GIS methods, the mapped emissions are then coupled with meteorology and atmospheric chemistry within the Pollution Climate Mapping (PCM) model20 to derive spatially resolved ambient NO2 concentrations for each projected year. The baseline emissions and concentrations are estimated for 2020.
61. The baseline projections modelling is underpinned by a number of key assumptions, including;
Assumptions surrounding future traffic flows – based on future projections of
vehicle km by high level vehicle category (e.g. LGV / HGV / buses) and road
type from DfT’s National Transport Model (NTM). The NTM traffic forecasts
are based on national transport policies, road infrastructure and economic
drivers including fuel prices.
20 http://uk-air.defra.gov.uk/research/air-quality-modelling?view=modelling
30
Assumptions around future traffic composition – the NAEI uses a fleet
turnover model to calculate the composition of the future fleet in terms of
Euro standard mix and share of vehicle kilometres driven by petrol, diesel
and light electric vehicles (LEVs). This is based on future vehicle sales
forecasts provided by DfT.
Vehicle emission factors for NOx – the vehicle emission factors are based on
the latest published values from COPERT (Computer Programme to
calculate Emissions from Road Transport) – COPERT 4.11, which was
published in 2014. COPERT 4.11 includes estimated emission factors for
Euro 5, Euro 6 and Euro 6c (from 2017 onwards) diesel vehicles, based on
the best available internationally recognised data. Real world drive cycle
tests for stage 2 Euro 6 vehicles (known as Euro 6d) will be introduced in
2017, however assumptions regarding this were not incorporated in the
baseline projections modelling.
The UK’s future energy usage (this is based on UEP 48 energy projection
from the Department for Energy and Climate Change (DECC)).
Meteorology for future years – the PCM model assumes that for future years
the meteorology is the same as for the base year (in this case 2013).
62. This is not a feasible option to implement given that the Government would not fulfil its commitment to improve air quality and meet legal requirements to reduce concentrations of nitrogen dioxide below the 40 µg/m3 annual mean limit value within the shortest possible time.
63. However, the modelling and assumptions behind this scenario are important as it is the baseline scenario against which all other options are benchmarked to understand the impacts.
3.2.2. Option 1: Implementation of ULEZ and tightening of LEZ standards in London; mandatory Clean Air Zones within five local authorities, Petrol Euro 4, Diesel Euro 6/VI
64. This approach would focus measures in the priority areas where the exposure of the population to the pollutants is the greatest. These areas have been identified as areas of exceedance of current legal obligations. Specifically, this measure would require local authorities to implement charging Clean Air Zones where vehicles below an established emission standard would face a charge.
65. In this option, restrictions will be applied to areas which are currently in exceedance and which are projected to have concentrations above 40µg/m3 in 202021.
21 The year 2020 has been selected as the compliance modelling provides projections in five year
periods; 2020 is the next date for which concentration estimates are available.
31
66. In applying these measures it is necessary to set a specific standard for each type of vehicle. As Euro standards currently perform this function across the EU we have used these in setting the framework.
67. Given that historically petrol vehicles have had lower NOx emissions than their diesel equivalents, implementing the same Euro standards for petrol and diesel vehicles will yield minor improvements at much greater cost to drivers. Therefore, the Euro standards required for the different vehicle types are based on their emissions limits. The proposed Euro standard requirements for each vehicle type are set out in table 3.1. The Euro standards chosen in this option are the most stringent currently available across different fuel types.
32
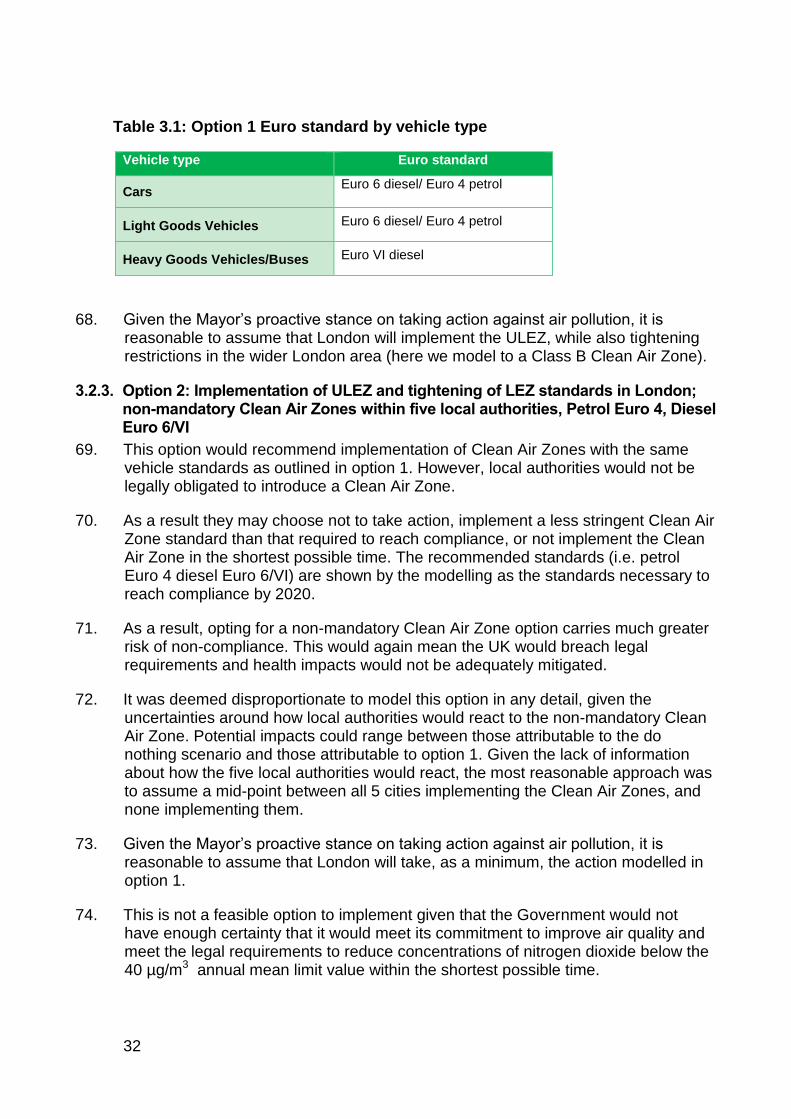
Table 3.1: Option 1 Euro standard by vehicle type
Vehicle type Euro standard
Cars Euro 6 diesel/ Euro 4 petrol
Light Goods Vehicles Euro 6 diesel/ Euro 4 petrol
Heavy Goods Vehicles/Buses Euro VI diesel
68. Given the Mayor’s proactive stance on taking action against air pollution, it is reasonable to assume that London will implement the ULEZ, while also tightening restrictions in the wider London area (here we model to a Class B Clean Air Zone).
3.2.3. Option 2: Implementation of ULEZ and tightening of LEZ standards in London; non-mandatory Clean Air Zones within five local authorities, Petrol Euro 4, Diesel Euro 6/VI
69. This option would recommend implementation of Clean Air Zones with the same vehicle standards as outlined in option 1. However, local authorities would not be legally obligated to introduce a Clean Air Zone.
70. As a result they may choose not to take action, implement a less stringent Clean Air Zone standard than that required to reach compliance, or not implement the Clean Air Zone in the shortest possible time. The recommended standards (i.e. petrol Euro 4 diesel Euro 6/VI) are shown by the modelling as the standards necessary to reach compliance by 2020.
71. As a result, opting for a non-mandatory Clean Air Zone option carries much greater risk of non-compliance. This would again mean the UK would breach legal requirements and health impacts would not be adequately mitigated.
72. It was deemed disproportionate to model this option in any detail, given the uncertainties around how local authorities would react to the non-mandatory Clean Air Zone. Potential impacts could range between those attributable to the do nothing scenario and those attributable to option 1. Given the lack of information about how the five local authorities would react, the most reasonable approach was to assume a mid-point between all 5 cities implementing the Clean Air Zones, and none implementing them.
73. Given the Mayor’s proactive stance on taking action against air pollution, it is reasonable to assume that London will take, as a minimum, the action modelled in option 1.
74. This is not a feasible option to implement given that the Government would not have enough certainty that it would meet its commitment to improve air quality and meet the legal requirements to reduce concentrations of nitrogen dioxide below the 40 µg/m3 annual mean limit value within the shortest possible time.
33
3.2.4. Option 3: Implementation of ULEZ and tightening of LEZ standards in London; mandatory Clean Air Zones within five local authorities with lower emission standards, Petrol Euro 3, Diesel Euro 5
75. This approach would follow the same process and cover the same five zones as described in option 1. Again, this measure would only allow nationally agreed standards of vehicles to drive in the five city zones free of charge. The zones would be mandatory for the local authorities to implement.
76. This option tests whether a less stringent Euro standard would be sufficient to help the UK towards its goal of reaching compliance within the shortest possible time as part of the wider package of measures as outlined in the UK national plan.
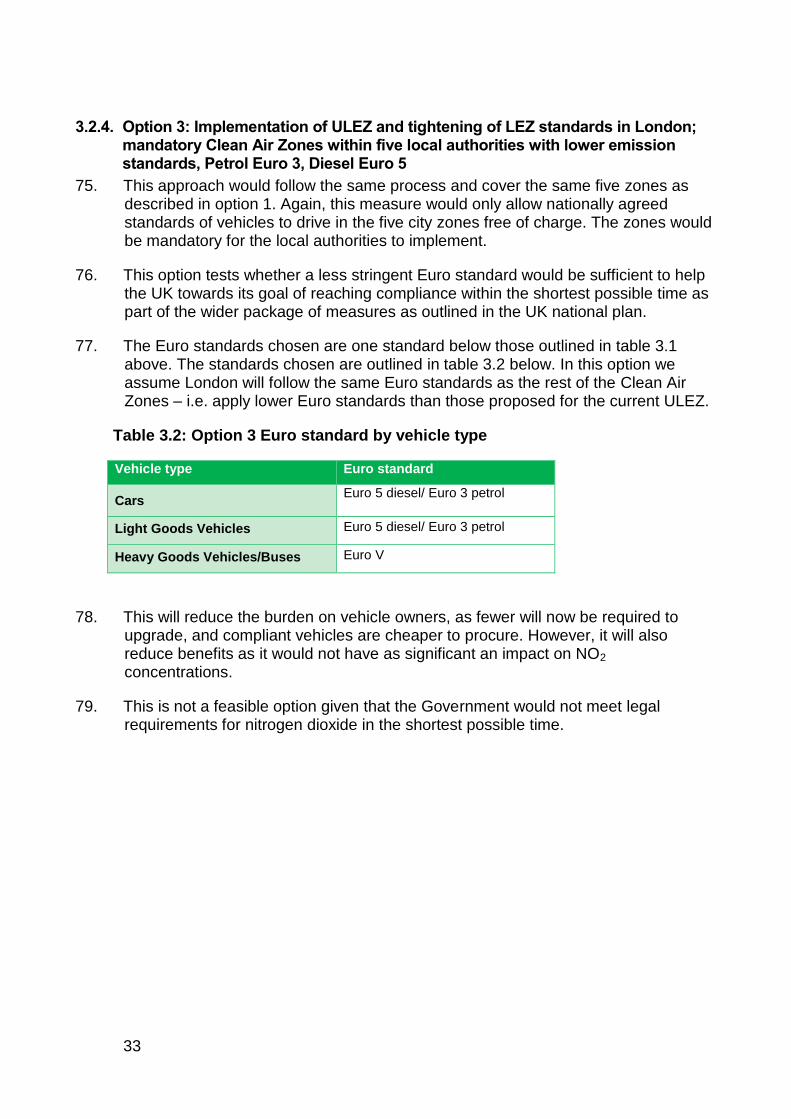
77. The Euro standards chosen are one standard below those outlined in table 3.1 above. The standards chosen are outlined in table 3.2 below. In this option we assume London will follow the same Euro standards as the rest of the Clean Air Zones – i.e. apply lower Euro standards than those proposed for the current ULEZ.
Table 3.2: Option 3 Euro standard by vehicle type
Vehicle type Euro standard
Cars Euro 5 diesel/ Euro 3 petrol
Light Goods Vehicles Euro 5 diesel/ Euro 3 petrol
Heavy Goods Vehicles/Buses Euro V
78. This will reduce the burden on vehicle owners, as fewer will now be required to upgrade, and compliant vehicles are cheaper to procure. However, it will also reduce benefits as it would not have as significant an impact on NO2 concentrations.
79. This is not a feasible option given that the Government would not meet legal requirements for nitrogen dioxide in the shortest possible time.
34
4. Methodology 80. This section outlines the methodology used to calculate the impacts and appraise
the economic costs and benefits to the UK of the policy options. In addition to reducing NOx emissions, the measures taken will have a range of other impacts. The economic assessment looks to reflect these impacts through cost-benefit analysis.
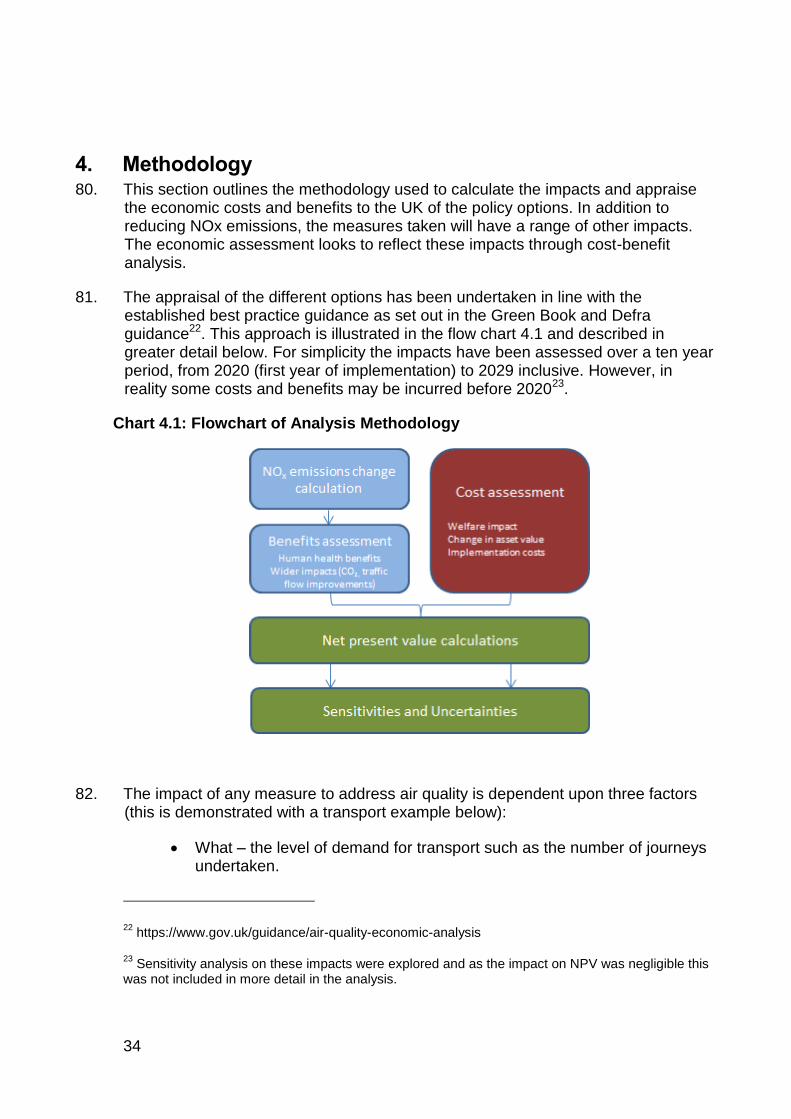
81. The appraisal of the different options has been undertaken in line with the established best practice guidance as set out in the Green Book and Defra guidance22. This approach is illustrated in the flow chart 4.1 and described in greater detail below. For simplicity the impacts have been assessed over a ten year period, from 2020 (first year of implementation) to 2029 inclusive. However, in reality some costs and benefits may be incurred before 202023.
Chart 4.1: Flowchart of Analysis Methodology
82. The impact of any measure to address air quality is dependent upon three factors (this is demonstrated with a transport example below):
What – the level of demand for transport such as the number of journeys undertaken.
22 https://www.gov.uk/guidance/air-quality-economic-analysis
23 Sensitivity analysis on these impacts were explored and as the impact on NPV was negligible this
was not included in more detail in the analysis.
35
How – what technologies are used to service the demand including the vehicle type and technology.
Where – location of the activity, for the higher the population density in which emissions occur, the higher the exposure.
83. A detailed modelling exercise has been undertaken in order to assess the impacts of the different options. The first stage of the modelling is to establish a baseline (our option 0). The baseline aims to reflect what would happen if the proposed air quality measures were not implemented. Within the baseline, a range of existing measures and assumptions about future activity and emissions have been incorporated as set out in section 3.2.1.
84. How these factors change in response to the option implemented has been estimated and the impacts quantified. The measures noted in the options are assumed to prompt a behavioural response, as follows:
Continue and pay charge
Avoid driving into the Clean Air Zone (by diverting around the zone, shifting mode or not making the trip)
Redeploy vehicles subject to the charge outside the Clean Air Zone
Upgrade to a vehicle that is exempt of charge
85. This could alter any or all of the three factors (what, how, where) as set out above. As noted previously it has not been possible to incorporate redeployment of vehicles for the consultation stage IA.
86. As far as is practical, impacts have been quantified and valued in monetary terms in order to facilitate their comparison. Where impacts are spread over time the values have been converted to present values based on the recommended Green Book guidance24.
87. Impacts quantified as a consequence of the intervention in this economic assessment are:
Benefits
Air quality impacts – primarily relating to premature mortality from NOx exposure.
Greenhouse gas reductions – newer vehicles and vehicle journeys not taken will lead to less fuel use therefore will reduce GHG emissions.
24 https://www.gov.uk/government/publications/the-green-book-appraisal-and-evaluation-in-central-
governent
36
Traffic flow improvements – Less vehicles on particular road links will have wider impacts on traffic flow.
Costs
Welfare loss – incurred by moving users from their preferred outcome to an alternative.
Lost value of asset – accelerated fleet turnover will reduce value of older vehicles.
Cost of foregone trips – some drivers will not make journeys or shift mode and incur a loss (as they prefer travelling with their original vehicle to this alternative).
Cost of avoiding the zone – some drivers will drive around the zone and incur a loss, due to taking a longer journey.
Implementation costs– including infrastructure, running costs and scoping studies.
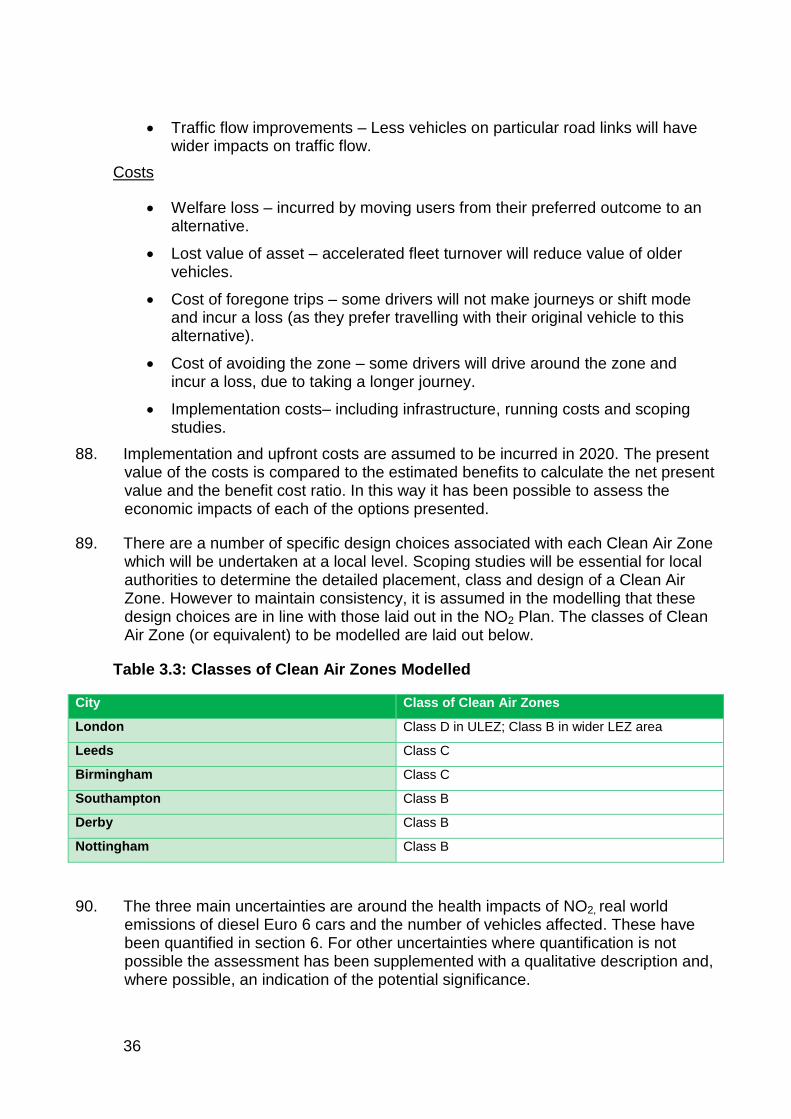
88. Implementation and upfront costs are assumed to be incurred in 2020. The present value of the costs is compared to the estimated benefits to calculate the net present value and the benefit cost ratio. In this way it has been possible to assess the economic impacts of each of the options presented.
89. There are a number of specific design choices associated with each Clean Air Zone which will be undertaken at a local level. Scoping studies will be essential for local authorities to determine the detailed placement, class and design of a Clean Air Zone. However to maintain consistency, it is assumed in the modelling that these design choices are in line with those laid out in the NO2 Plan. The classes of Clean Air Zone (or equivalent) to be modelled are laid out below.
Table 3.3: Classes of Clean Air Zones Modelled
City Class of Clean Air Zones
London Class D in ULEZ; Class B in wider LEZ area
Leeds Class C
Birmingham Class C
Southampton Class B
Derby Class B
Nottingham Class B
90. The three main uncertainties are around the health impacts of NO2, real world emissions of diesel Euro 6 cars and the number of vehicles affected. These have been quantified in section 6. For other uncertainties where quantification is not possible the assessment has been supplemented with a qualitative description and, where possible, an indication of the potential significance.
37
4.1. Modelling Air Quality Impacts
4.1.1. PCM and Fleet Adjustment Model
91. The assessment of the impacts of the policy options on emissions inside the proposed Clean Air Zones is based on a combination of measurements from the UK national monitoring networks and the results of modelling assessments, carried out using the Pollution Climate Mapping (PCM) model. This model was also used in the identification of NO2 concentrations and the necessary Clean Air Zone standards needed to achieve compliance, and is discussed in length in the National Air Quality Plan Technical Report25. The main features are summarised in Annex A.
92. The modelling of air quality impacts outside of the Clean Air Zones, the quantification of other impacts and the valuation of all impacts were undertaken using a separate model, called the Fleet Adjustment Model (FAM). For more details on this model, please see Annex A.
25 https://www.gov.uk/government/publications/air-quality-in-the-uk-plan-to-reduce-nitrogen-dioxide-
emissions
38
4.1.2. Understanding baseline emissions and vehicles impacted by Euro standard
93. To model the impacts of policies requires data on the number of vehicles that enter the network of Clean Air Zones in the baseline and the distance they travel – as emissions values are estimated on a g/km basis.
94. The number of unique vehicles affected by the implementation of the Clean Air Zones has been calculated using a combination of London ANPR data and Trafficmaster data. Trafficmaster data tracks the journeys of a sample of around 160,000 vehicles – covering cars, vans, HGVs, coaches and buses. The sample of Trafficmaster vehicles is used to identify the relative number of vehicles that enter each of the Clean Air Zones each year, accounting for vehicles which travel into more than one zone, in order to identify unique vehicles. This provides information on the relative number of vehicles entering the network of Clean Air Zones, versus the number in London. London ANPR data is used to accurately identify the number of individual vehicles that enter London over a year. The total number of vehicles entering the network is then estimated by uprating the London vehicles by the relative number of vehicles which enter the total Clean Air Zone network.
95. The split of vehicles by Euro standard for each mode is an input to the PCM, and have been provided by Ricardo-EE as an input to the FAM. These inputs specify the proportion of vehicles in each year that make up each Euro standard.
96. Total vehicle kilometres (vkms) of vehicles entering the Clean Air Zones were estimated by multiplying the vkms of vehicles entering the network by the average vkms of each vehicle, based on DfT statistics. Ricardo-EE then identified the percentage of time these vehicles spent within the network using the PCM inputs (to ensure consistency with the PCM results), which are based on DfT traffic flow statistics. This provides the vehicle kilometres of each mode within the network.
97. The split of vkms by Euro standard for each mode is an input to the PCM, and have been provided by Ricardo-EE as an input to the FAM. Note, the percentage of vkms by new vehicles (e.g. Euro 6) is higher than the percentage of new vehicles, as newer vehicles travel further than older vehicles on average.
4.1.3. Measuring change in emissions
98. To calculate the change in emissions within the zones in question, indicative zone perimeters were mapped. These ensured inclusion of all road links in exceedance of the 40 µg/m3 limit in 2020, and following realistic and easily identifiable existing boundaries. It is important to note that the actual perimeters of the zones will be decided via in-depth scoping studies and those chosen for this assessment are indicative only.
99. Emissions within these perimeters will be affected depending on the behavioural change of owners in response to the Clean Air Zone. There will also be a number of knock-on impacts on emissions outside the zone which are considered.
39
100. The total change in emissions is calculated based on the following elements:
Emissions reduction within zone from changing behaviour
Emissions increase outside zone from changing behaviour
National emission reductions from scrappage of oldest vehicles
4.1.4. Impacts on emissions from changing behaviour
101. The potential behavioural responses of non-compliant vehicle owners to the implementation of a Clean Air Zone access restriction charge have potential impacts on vehicle kilometres (and correspondingly, emissions) as follows:
Upgrade to an exempt vehicle: This response will have the largest impact on emissions within the zones. The most frequent travellers to the zone will upgrade vehicles, as this will be cheaper than paying the charge every time they travel in. This will result in a large shift from non-compliant vehicle kilometres to compliant vehicle kilometres within the zone. However, there will be an increase in non-compliant vehicle kilometres outside the zone. This will not be as large as the in-zone reduction, given the impacts of scrappage as described below.
Avoid driving into the Clean Air Zone: Vehicle owners may choose to drive around the zone, change mode or not make the journey. For those who take a diverted route to avoid the Clean Air Zone, there will be reduction in distance and emissions within zone and an increase outside the zone. The outside zone emissions have been assumed to be offset by reduced emissions inside the zone. It is assumed that for businesses which choose to not make journeys rather than upgrade vehicle, an equivalent business with a compliant vehicle will enter the zone to replace it (e.g. a plumber who cannot afford to upgrade chooses not to take a job in the zone and is replaced by another plumber who using a compliant vehicle). Therefore this option will replace non-compliant vehicle kilometres with compliant, though there will be no change in overall distance travelled. Private car journeys not taken in London are assumed not be replaced. There will be a resulting reduction in vehicle kilometres within the zone as a result. While this may lead to increased use of other modes of transport, this is likely to have a negligible impact on emissions. Local authority feasibility studies will explore this impact in more detail.
Continue and pay charge: There will be no impact on kilometres travelled for the vehicles which choose to continue. Drivers who continue into the zone are likely to be the more infrequent zone visitors.
Redeploy vehicles subject to the charge outside the Clean Air Zone: The change in emissions from this is modelled in a similar way to upgrading vehicles discussed above.
102. The PCM model is run accounting for the reduction in non-compliant vehicle kilometres, and resultant increases in compliant vehicle kilometres inside the zone
40
(it is assumed total vehicle kilometres travelled within the zone does not change). From this change, the PCM is able to estimate the impact on emissions within the zones due to the upgrade of vehicles.
103. Of the drivers within the zone who are upgrading, the modelling assumes they purchase the cheapest available compliant vehicle, a second hand vehicle, and sell their non-compliant vehicle. This means that a proportion of vehicle owners who do not enter the zone will switch their less polluting vehicle and purchase a more polluting one given the increased demand. This will have an upward impact on total emissions outside the zone.
4.1.5. National emission reductions from scrappage
104. Encouraging the shift towards cleaner vehicles will reduce the value of the most polluting vehicles, therefore resulting in scrappage of some older vehicles. The modelling assumes that the fleet stays the same size. Therefore, the modelling assumes that new vehicles enter the fleet to replace the vehicles that are scrapped.
105. The link between new and old vehicles operates through the ‘chain of substitution’. In this way the introduction of additional new vehicles puts immediate pressure on vehicles that are a year old; this then has a similar effect on vehicles that are two years old and the impact passes down the chain to the oldest vehicles. This ripple effect ultimately reduces the value of the oldest vehicle up to the point that it has no value and is disposed of. This will affect a proportion of the Euro 2 and 3 vehicles remaining in the fleet in 2020.
106. The benefits of emission savings from scrapped vehicles are assumed to occur nationally, and not only within the Clean Air Zone area. Ricardo-EE have provided estimates of total NOx emissions for each mode and Euro standard. The model identifies the proportion of vehicles, and therefore emissions, that are to be scrapped from the oldest Euro standards available. The AQ benefits are only accounted for over the period where the baseline vehicle which is scrapped continues to operate – based on fleet composition input data. It should be noted that as these vehicles are old it is assumed that they drop out of the fleet relatively quickly in the baseline, meaning that the benefits of scrappage occur only over a short time period.
4.1.6. Monetising impacts of emissions reductions
107. Much of the evidence linking health impacts with long-term average NO2 concentrations has been gathered using observational epidemiological studies. These studies use statistical methods to identify associations between outcomes, such as mortality or ill health, with external factors, such as modelled or measured pollutants levels, whilst taking into account other variables such as gender and age. Observational epidemiological studies have inherent strengths and weaknesses and are only able to provide evidence on the statistical relationship between risk factors and health outcomes. Therefore, COMEAP also noted that
"…it is possible that, to some extent, NO2 acts as a marker of the effects of other traffic-related pollutants…"
41
108. COMEAP considered the evidence linking long-term average NO2 concentrations with effects on mortality, with a view to recommending methods for quantifying this association and estimating the mortality effect in the UK. In their interim statement of July 2015 they recommended that a coefficient of 1.025 (95% confidence interval 1.01–1.04) per 10 µg/m3 NO2 could be used to reflect associations between long-term average concentrations of NO2 and all-cause mortality.
109. For the central analysis in this Impact Assessment, the central 2.5% coefficient has therefore been applied. However, the 1% and 4% sensitivities have been tested in section 6.
110. As an interim recommendation there are considerable uncertainties around this. In December 2015 COMEAP released an additional statement highlighting there is a notable potential overlap between NO2 and PM2.5 mortality26. To update this recommendation and set out the uncertainties COMEAP intend on publishing a report in 2016.
111. Using COMEAP’s recommendation, Defra have calculated new interim NOx damage costs. Health outcomes have been valued using these in accordance with Defra guidance27.
112. For emissions within zones, the emissions are valued based upon proportion of emissions falling within each type of urban location: transport central London, transport inner London, transport outer London, inner conurbation, urban big and urban large; for those outside the zones, the transport average damage cost is used.
4.2. Greenhouse Gas Reductions 113. CO2 emission reductions are valued for vehicle scrappage and trips not taken only.
As noted previously, vehicles which trade up are assumed to be traded outside the zone, and therefore emission reductions inside the zone are offset by emission increases outside the zone. It is assumed that the Clean Air Zone will encourage some vehicle owners to switch from diesel to petrol vehicles, which have higher emissions; however, this trade will also result in additional diesel vehicle use outside the zone meaning that these impacts are also assumed to net off.
26
https://www.gov.uk/government/uploads/system/uploads/attachment_data/file/485373/COMEAP_NO2_Mortality_Interim_Statement.pdf
27 https://www.gov.uk/guidance/air-quality-economic-analysis#damage-costs-approach
42
114. Increasing turnover in the fleet will reduce the average age of the vehicles and hence increase fuel efficiency, as newer vehicles are more fuel efficient. The benefits to consumers of improved fuel efficiency are assumed to be considered within the welfare loss calculations so are not included as a separate benefit here. However there will be Greenhouse Gas (GHG) emissions savings, which need to be accounted for as these are not accounted for in vehicle purchase decisions.
115. To assess this impact, average UK test cycle CO2 emissions estimates of vehicles by age were provided by DfT for cars and vans. The emissions have been uprated to reflect estimates of the difference in real world versus test cycle CO2 emissions using data from the ICCT. The savings are estimated by assuming that scrapped vehicles and associated emissions are replaced by vehicles with emissions equivalent to a Euro 6 vehicle in a way consistent with AQ modelling.
116. As scrapped vehicles are older, have a limited life in the baseline, and have relatively low mileage the magnitude of savings is not significant.
117. The modelling also accounted for a reduction in CO2 emissions due to some journeys being cancelled. The modelling only assumes that consumer car trips (in London) are ultimately not taken so only this CO2 benefit from trips not taken is valued in the modelling. This is modelled by multiplying the length of trips not taken by the CO2 emission factor of these vehicles.
118. The total change in CO2 emissions in tonnes per year is then calculated for the ten year appraisal period to obtain the lifetime emissions. This figure is valued at the cost per tonne according to the latest DECC guidance28 and discounted to get the net present value of the change in CO2 emissions.
119. We have not been able to quantify the impacts of other behavioural responses on carbon. It is expected that redeployment will have a positive impact as cleaner vehicles would be driving further. However this impact is assumed negligible. The impact of avoiding zone behaviour has not been valued due to the complexity of modelling this behaviour change. However, it should be noted this is likely to increase emissions as journeys will be longer.
4.3. Traffic flow improvements 120. Alongside changes in the fleet, additional impacts may be felt from changes in
vehicle behaviour. Vehicle owners who chose not to make their journey will be reducing the number of vehicles on roads within each of the Clean Air Zones. While it is assumed that business journeys will be replaced by equivalent businesses with a compliant vehicle, affected private car journeys (in London) are assumed not to be replaced.
28
https://www.gov.uk/government/uploads/system/uploads/attachment_data/file/360316/20141001_2014_DECC_HMT_Supplementary_Appraisal_Guidance.pdf
43
121. Less traffic on London roads means faster journey times for other users. A wider impacts model created by AMEC has been used to consider the overall impact29.
122. This identifies the total amount of car kms in London from DfT statistics. It then estimates the proportion of car journeys in London that will not be made due to the charges.
123. Trafficmaster data is used to estimate the proportion of car trips that occur in London and also enter the London Clean Air Zone. The model then identifies the proportion of trips that are assumed to be from consumers. It then identifies the proportion of these trips that will not happen, from behaviour change assumptions discussed earlier. These are combined to estimate the proportion of trips by cars in London that are not taken. This is multiplied by total car vkms in the zone to estimate the proportion of vkms that are no longer driven.
124. The benefits of this are valued by estimating the average benefit of congestion reduction in London. This identifies the proportion of vehicles kms by road type in London, and the average cost of congestion per car on each road – to derive a weighted average traffic flow benefit per car removed. The average traffic flow benefit is multiplied by estimated vehicle km reductions from trips not taken to reach the overall traffic flow improvement benefit.
4.4. Welfare loss 125. Owners of vehicles below the required Euro standard will have to change their
behaviour when entering a Clean Air Zone. The new action is favoured less than their baseline behaviour; hence it will incur an additional cost, termed welfare loss in economics, to vehicle owners.
126. As explored in the previous section, vehicle owners will have a range of options available to them, which have various implications for welfare:
Continue and pay charge: For those paying the charge, there will be an extra cost every time they enter the Clean Air Zone. This will depend on how frequently drivers enter the Clean Air Zone, and what level the charge is set at. This will be determined via scoping studies. The cost to vehicle owners is not included in the overall NPV, as it is a transfer from owners to government.
Avoid driving into the Clean Air Zone For those who travel around the Zone, by using a different mode of transport or by driving via a diverted route, there will be an extra cost incurred (from the extra fuel costs and lost time spent taking a diversion). The alternative route has not been directly modelled, as this would require the use of a transport model and it has not been proportionate to use one. It has been quantified using a proxy, based
29 https://uk-air.defra.gov.uk/library/reports?report_id=907
44
on the cost of the charge. For those who avoid the zone by not making their vehicle journeys, we expect a loss of welfare from individuals not travelling to their original destination, or by taking a less favoured form of transport (bus or train for example). We expect the cost of business trips not made to be offset by benefits to other businesses which replace them. However personal car journeys will not be offset. This will incur a welfare loss.
Upgrade to an exempt vehicle: If redeployment is not possible, the frequency with which the vehicle travels into the Clean Air Zone will decide whether the vehicle owner will purchase a vehicle exempt of the charge. It will mean that for the vehicle owners that travel most frequently into the Clean Air Zones it is the most ‘economically rational’ response. They will incur a cost of upgrading to a compliant vehicle (which is generally newer and more costly, or a less preferred petrol in the case of light vehicles). In the case of business owners, the extra cost they incur may be passed on to the end customer.
Redeploy vehicles in fleet: Some businesses and individuals which have a fleet of vehicles may be able to reallocate those vehicles that don’t meet Clean Air Zone requirements to trips outside the Clean Air Zones, and exempt vehicles to trips within the Clean Air Zones. It would be assumed that impact on welfare of this option is negligible; however, the evidence available did not allow us to estimate the proportion of vehicle owners that would react in this way.
4.4.1. Modelling total welfare cost of upgrading
127. The welfare cost considers the increased upfront cost of a new vehicle, the increased resale value and a wide range of benefits monetised implicitly, using the ‘rule of a half’ e.g. the benefits of improved comfort and the wider features of a newer vehicle. DfT commissioned a transport appraisal expert from ITS Leeds to advise on the most suitable approach for valuing this cost. His recommendation is briefly summarised in Box 4.1 and explained in further detail in Annex C.
128. Transaction costs are the costs associated with the inconvenience of searching for and procuring a new vehicle as well as the risk around quality when buying a second hand vehicle. The average rate of vehicle turnover is 4 years, and as the policy will not be implemented until 2020 the majority of drivers are assumed to not have to bring forward their vehicle upgrade. For those vehicles not switching within the 4 year period in the baseline, transaction costs are adjusted in order to reflect the degree the Clean Air Zones brings forward the upgrade. DfT expert advice was requested to provide a simple estimate on the average number of hours taken to find and purchase a vehicle and to reflect the cost30. As this cost is small it was not considered proportionate to further refine this cost estimate.
30 DfT expert estimation.
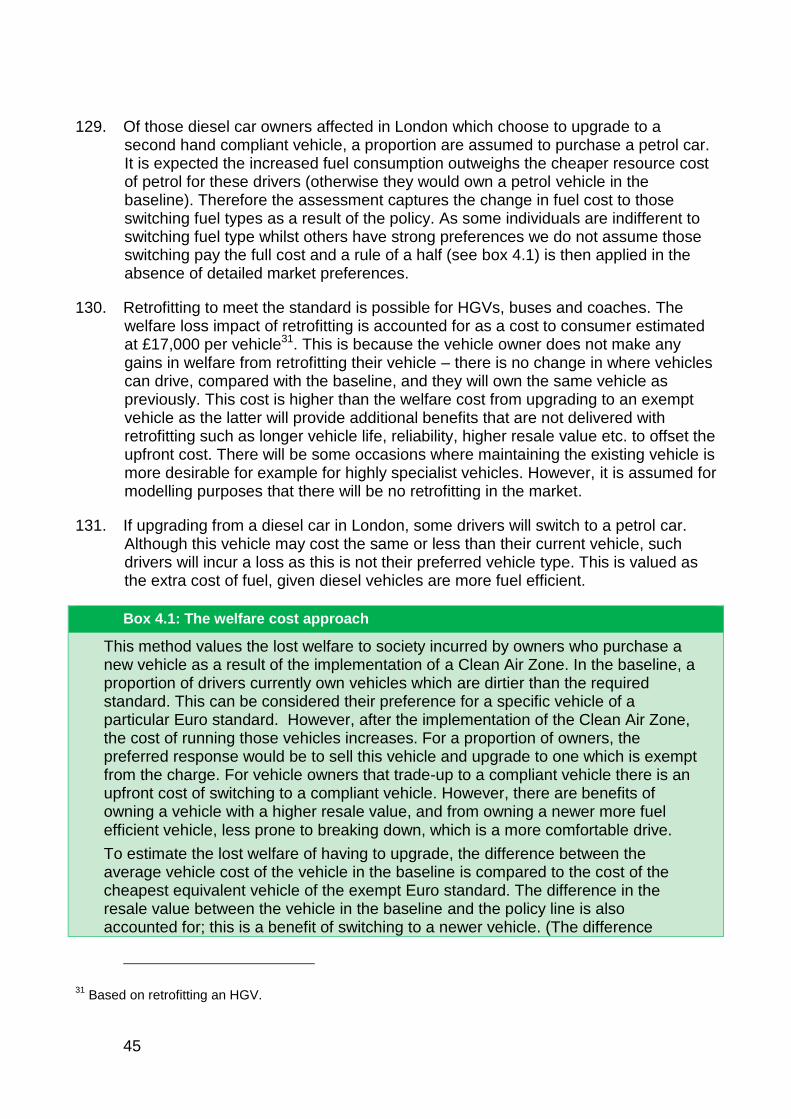
45
129. Of those diesel car owners affected in London which choose to upgrade to a second hand compliant vehicle, a proportion are assumed to purchase a petrol car. It is expected the increased fuel consumption outweighs the cheaper resource cost of petrol for these drivers (otherwise they would own a petrol vehicle in the baseline). Therefore the assessment captures the change in fuel cost to those switching fuel types as a result of the policy. As some individuals are indifferent to switching fuel type whilst others have strong preferences we do not assume those switching pay the full cost and a rule of a half (see box 4.1) is then applied in the absence of detailed market preferences.
130. Retrofitting to meet the standard is possible for HGVs, buses and coaches. The welfare loss impact of retrofitting is accounted for as a cost to consumer estimated at £17,000 per vehicle31. This is because the vehicle owner does not make any gains in welfare from retrofitting their vehicle – there is no change in where vehicles can drive, compared with the baseline, and they will own the same vehicle as previously. This cost is higher than the welfare cost from upgrading to an exempt vehicle as the latter will provide additional benefits that are not delivered with retrofitting such as longer vehicle life, reliability, higher resale value etc. to offset the upfront cost. There will be some occasions where maintaining the existing vehicle is more desirable for example for highly specialist vehicles. However, it is assumed for modelling purposes that there will be no retrofitting in the market.
131. If upgrading from a diesel car in London, some drivers will switch to a petrol car. Although this vehicle may cost the same or less than their current vehicle, such drivers will incur a loss as this is not their preferred vehicle type. This is valued as the extra cost of fuel, given diesel vehicles are more fuel efficient.
Box 4.1: The welfare cost approach
This method values the lost welfare to society incurred by owners who purchase a new vehicle as a result of the implementation of a Clean Air Zone. In the baseline, a proportion of drivers currently own vehicles which are dirtier than the required standard. This can be considered their preference for a specific vehicle of a particular Euro standard. However, after the implementation of the Clean Air Zone, the cost of running those vehicles increases. For a proportion of owners, the preferred response would be to sell this vehicle and upgrade to one which is exempt from the charge. For vehicle owners that trade-up to a compliant vehicle there is an upfront cost of switching to a compliant vehicle. However, there are benefits of owning a vehicle with a higher resale value, and from owning a newer more fuel efficient vehicle, less prone to breaking down, which is a more comfortable drive.
To estimate the lost welfare of having to upgrade, the difference between the average vehicle cost of the vehicle in the baseline is compared to the cost of the cheapest equivalent vehicle of the exempt Euro standard. The difference in the resale value between the vehicle in the baseline and the policy line is also accounted for; this is a benefit of switching to a newer vehicle. (The difference
31 Based on retrofitting an HGV.
46
between the two figures above can also be considered to be the difference in the cost of depreciation between owning a vehicle in the baseline and an exempt vehicle).
These calculations do not value a range of other benefits of switching to the newer exempt vehicles explicitly (individual fuel savings, lower maintenance costs, better driveability etc.) but these are implicitly incorporated in the estimates. It is assumed that some drivers (likely those with high mileage) are indifferent between owning their current vehicle and the newer alternative whereas other drivers (e.g. those with very low mileage) will not get any non-monetised benefits from moving to a vehicle exempt of charge– e.g. they will experience the full difference in the purchase cost less the resale value of this switch. To account for this the total difference in cost is divided by two assuming that the value affected owners place on non-monetised costs are evenly distributed between these two extremes (applying the “rule of a half”32).
The cost of switching from diesel to petrol vehicles is estimated in a similar way to the above. There is no upfront cost difference between owning an equivalent diesel or petrol vehicle. The significant cost difference between running a diesel engine versus a petrol is the difference in fuel cost. The difference in annual fuel cost between owning a petrol and equivalent diesel vehicle is estimated based on average mileage of diesel vehicles and fuel costs. It is assumed that low mileage people that switch to petrol will be almost indifferent facing close to zero cost. High mileage diesel owners will face the full cost of switching to a petrol vehicle – as a difference in their annual running costs. To represent this difference in the distribution of costs, the rule of a half is applied to the difference in average fuel cost. (It should be noted that it would be expected that high mileage diesel vehicles would not be expected to switch to petrol vehicles, as they would be expected to trade-up to a compliant diesel vehicle instead, which is why average diesel mileage is assumed.)
After this, additional costs such as transaction costs are considered to get an overall estimate of the societal costs of having to upgrade.
Finally, if the vehicle is scrapped, the residual value of this vehicle is the consumer welfare loss. The cost of retrofitting would be accounted for as financial cost for the purposes of this assessment (however, as explained above no retrofitting is assumed, given this incurs a greater cost than upgrading).
4.4.2. Modelling total welfare loss of foregone journeys
132. It is assumed that businesses which do not make trips as a result of the charge will have the impacts offset by benefits to other businesses which replace those trips (i.e. the market is sufficiently competitive that other compliant businesses can replace these). For example, if a plumber with a Euro 4 diesel van decided not to enter the Clean Air Zone for a job, another plumber with a Euro 6 diesel van will accept this job instead. Any loss incurred by the first plumber will be offset by the
32 WebTAG Unit A1.3 provides more detail on this concept
47
benefits to the second. However, these welfare losses are included as a direct cost in the Equivalent Annual Net Direct Cost to Business (EANDCB) calculation.
133. Personal car journeys in London are not assumed to be offset.. As a result there will be a loss of welfare for individuals who no longer travel to their original destination as a result of the charge.
134. This is valued by individuals at any point between the value of the charge (if higher than this the journey will be taken) and just above zero (lower than this and the journey would not be taken in the baseline). The rule of a half is then applied assuming that the value affected owners place on non-monetised costs are evenly distributed between these two extremes.
135. The cost is calculated by multiplying the number of days that trips are no longer made by half of the charge33. This is estimated by multiplying the number of cars in each Euro standard that enter the zone, by the average number days that a vehicle enter the zone, based on Trafficmaster data, to get the total number of days that cars enter the Clean Air Zone. This is then multiplied by the percentage of vehicles that are consumers, to get the total number of days spent by consumers within the Clean Air Zone network. To identify the proportion of days by non-compliant vehicles, the total days are multiplied by the relative number of vkms of each Euro standard of car to get the total days in the zone of each Euro standard (as it is assumed that days spent in the zone is more closely linked to relative vkms travelled rather than vehicles). The behaviour change assumptions are applied to estimate the days that trips are no longer made. The number of days trips are no longer made each year is multiplied by half the value of the charge (the welfare loss per day trips are no longer made) to get the total impact.
4.4.3. Modelling total welfare loss of avoided trips
136. It is assumed that businesses which avoid the zone as a result of the charge will experience a loss of welfare from the longer journey. It has not been possible to accurately model the avoided journey as this requires the use of a transport model. However, the welfare loss to drivers (likely to be the largest impact) is included by applying the rule of a half to avoided trips, this is done in the same way as above; however, the assumption on behaviour change is that of avoided trips rather than trips not made. This impact is estimated for all avoided trips, business and household. The welfare loss per day spent avoiding the zone is estimated as above - half the value of the charge.
4.4.4. Transfers from charges paid
137. Paying a charge is not included in the social cost benefit analysis, as this is a transfer from vehicle owners to Government. It is however included within the EANDCB.
33 Charges are assumed to be in line with London’s proposed ULEZ charges. However, these will be
determined via scoping studies for each of the other cities in question.
48
4.5. Loss of asset value 138. Encouraging the shift towards cleaner vehicles will reduce the value of the most
polluting vehicles. Any action that incentivises such a shift will therefore result in disposal of some older vehicles. As the total stock of vehicles is not expected to increase it has been assumed that for any new vehicle entering the fleet an older vehicle will be scrapped as outlined below.
139. The link between new and old vehicles operates through the ‘chain of substitution’. In this way the introduction of additional new vehicles puts immediate pressure on vehicles that are a year old; this then has a similar effect on vehicles that are two years old and all the way through to the oldest vehicles. This ripple effect ultimately reduces the value of the oldest vehicle up to the point that it is disposed of.
140. Following this logical approach, the asset value cost to society is the total pre-policy value of the older vehicles that are ultimately scrapped. These vehicles have been valued at their baseline residual market value before measures were put in place.
141. The model values this by identifying the total number of vehicles scrapped, which, given it is assumed that the policy has no impact on total vehicles in the fleet, is assumed to equal the number of new vehicles which enter the fleet as a result of the policy. That is estimated as a quarter of vehicles that are traded up. Those scrapped are assumed to come from the oldest available Euro standard of vehicle for each mode in 2020, the year of policy implementation. The number of vehicles scrapped is multiplied by their value at that date to estimate the cost of scrappage.
4.6. Implementation costs 142. There will be both set up and ongoing costs to deliver improvements in air quality.
Such costs could include:
Scoping studies.
Infrastructure including installation costs and IT equipment.
Ongoing running costs such as communication, enforcement and staff costs.
143. Infrastructure costs have been assessed based on similar traffic control measures. In particular it uses evidence on the implementation costs for automatic number plate recognition (ANPR). These costs are then scaled up based on population and perimeter lengths of the Clean Air Zones in question. This scaling used total population and perimeter lengths of these Clean Air Zones in question, to obtain the costs for each Clean Air Zone under assessment.
144. Finally there will be ongoing costs for the operation of the measures contained within the plan. These costs will include enforcement, running costs of equipment and staffing.
145. Local authorities will earn revenues from the charges collected, from non-compliant vehicles that continue to enter the Clean Air Zone. This revenue will offset a proportion of the running costs although there is expected to be a net cost of administering the Clean Air Zones.
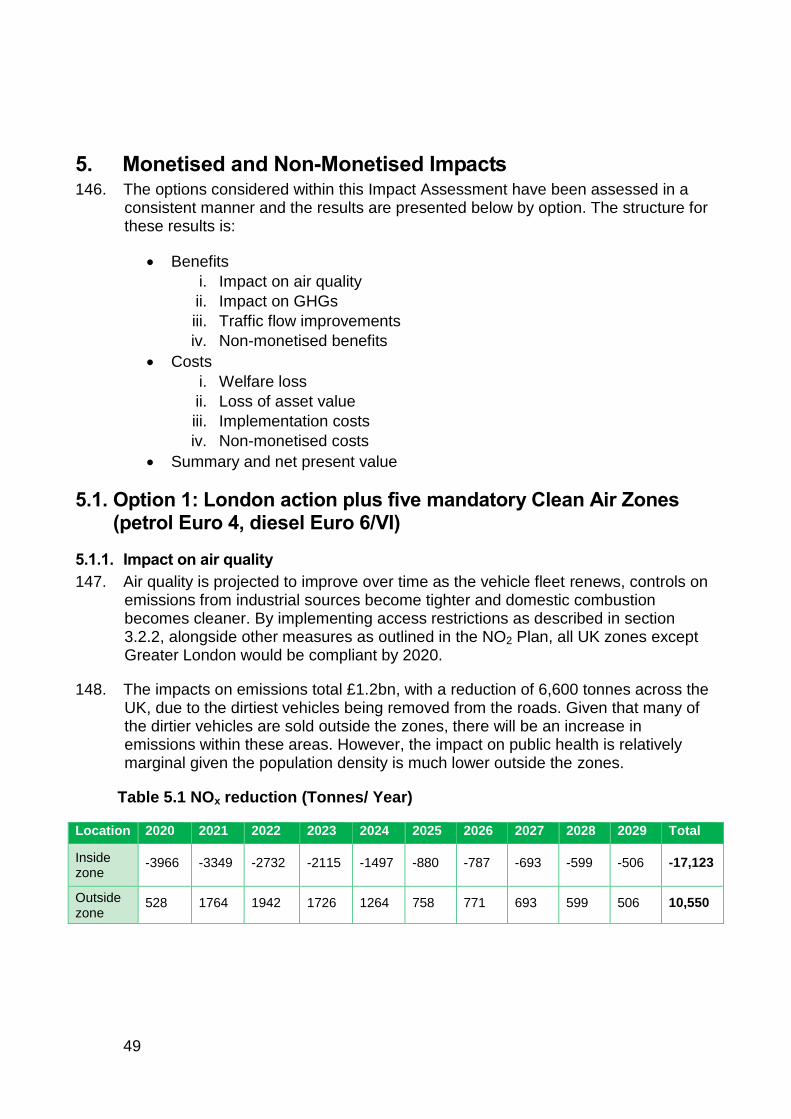
49
5. Monetised and Non-Monetised Impacts 146. The options considered within this Impact Assessment have been assessed in a
consistent manner and the results are presented below by option. The structure for these results is:
Benefits
i. Impact on air quality
ii. Impact on GHGs
iii. Traffic flow improvements
iv. Non-monetised benefits
Costs
i. Welfare loss
ii. Loss of asset value
iii. Implementation costs
iv. Non-monetised costs
Summary and net present value
5.1. Option 1: London action plus five mandatory Clean Air Zones (petrol Euro 4, diesel Euro 6/VI)
5.1.1. Impact on air quality
147. Air quality is projected to improve over time as the vehicle fleet renews, controls on emissions from industrial sources become tighter and domestic combustion becomes cleaner. By implementing access restrictions as described in section 3.2.2, alongside other measures as outlined in the NO2 Plan, all UK zones except Greater London would be compliant by 2020.
148. The impacts on emissions total £1.2bn, with a reduction of 6,600 tonnes across the UK, due to the dirtiest vehicles being removed from the roads. Given that many of the dirtier vehicles are sold outside the zones, there will be an increase in emissions within these areas. However, the impact on public health is relatively marginal given the population density is much lower outside the zones.
Table 5.1 NOx reduction (Tonnes/ Year)
Location 2020 2021 2022 2023 2024 2025 2026 2027 2028 2029 Total
Inside zone
-3966 -3349 -2732 -2115 -1497 -880 -787 -693 -599 -506 -17,123
Outside zone
528 1764 1942 1726 1264 758 771 693 599 506 10,550
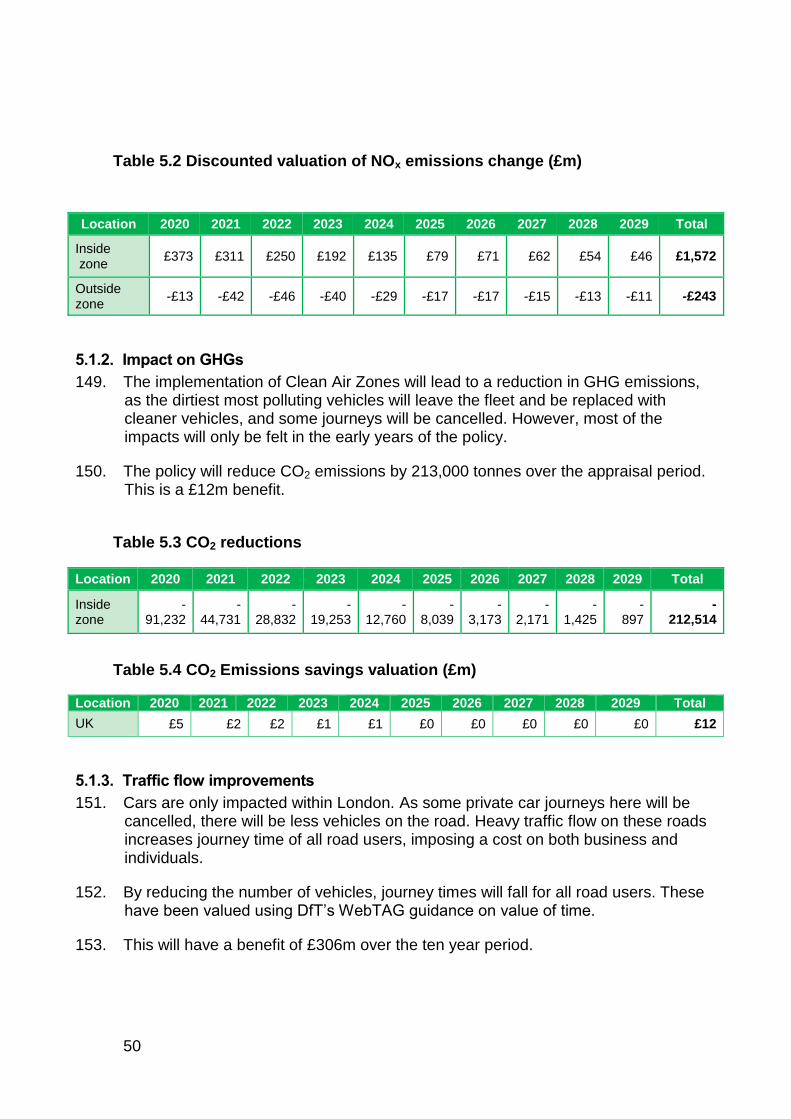
50
Table 5.2 Discounted valuation of NOx emissions change (£m)
Location 2020 2021 2022 2023 2024 2025 2026 2027 2028 2029 Total
Inside zone
£373 £311 £250 £192 £135 £79 £71 £62 £54 £46 £1,572
Outside zone
-£13 -£42 -£46 -£40 -£29 -£17 -£17 -£15 -£13 -£11 -£243
5.1.2. Impact on GHGs
149. The implementation of Clean Air Zones will lead to a reduction in GHG emissions, as the dirtiest most polluting vehicles will leave the fleet and be replaced with cleaner vehicles, and some journeys will be cancelled. However, most of the impacts will only be felt in the early years of the policy.
150. The policy will reduce CO2 emissions by 213,000 tonnes over the appraisal period. This is a £12m benefit.
Table 5.3 CO2 reductions
Location 2020 2021 2022 2023 2024 2025 2026 2027 2028 2029 Total
Inside zone
-91,232
-44,731
-28,832
-19,253
-12,760
-8,039
-3,173
-2,171
-1,425
- 897
- 212,514
Table 5.4 CO2 Emissions savings valuation (£m)
Location 2020 2021 2022 2023 2024 2025 2026 2027 2028 2029 Total
UK £5 £2 £2 £1 £1 £0 £0 £0 £0 £0 £12
5.1.3. Traffic flow improvements
151. Cars are only impacted within London. As some private car journeys here will be cancelled, there will be less vehicles on the road. Heavy traffic flow on these roads increases journey time of all road users, imposing a cost on both business and individuals.
152. By reducing the number of vehicles, journey times will fall for all road users. These have been valued using DfT’s WebTAG guidance on value of time.
153. This will have a benefit of £306m over the ten year period.
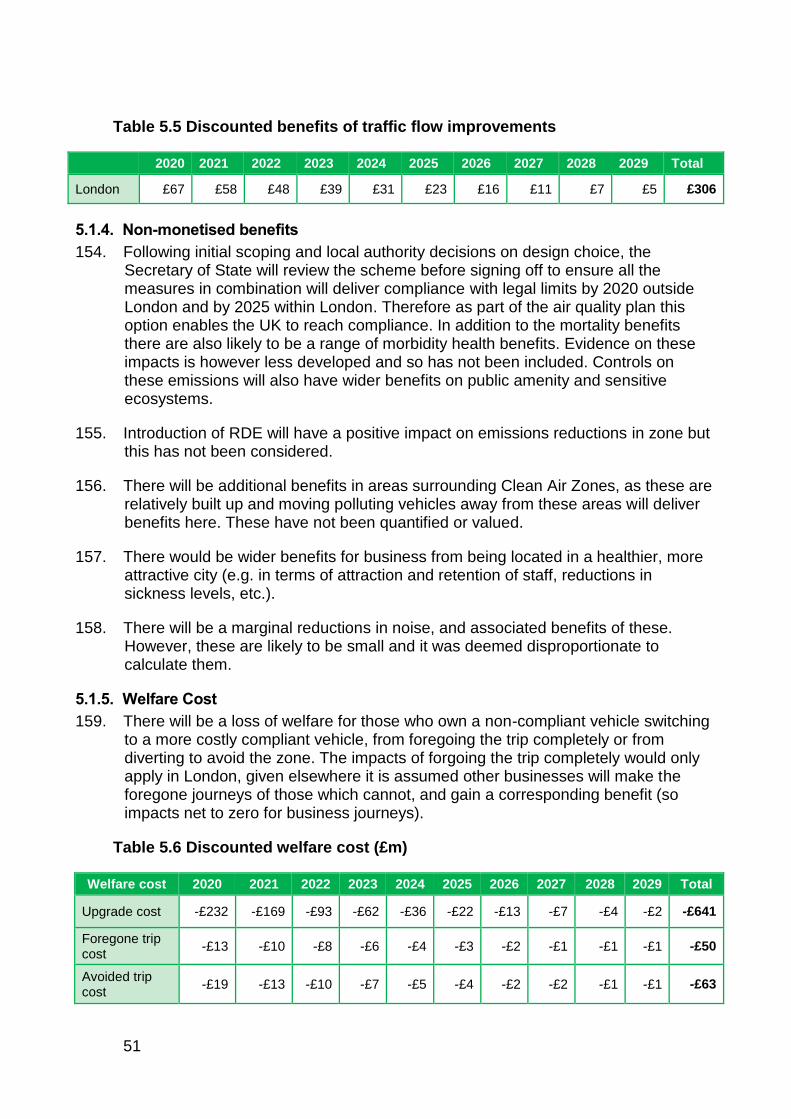
51
Table 5.5 Discounted benefits of traffic flow improvements
2020 2021 2022 2023 2024 2025 2026 2027 2028 2029 Total
London £67 £58 £48 £39 £31 £23 £16 £11 £7 £5 £306
5.1.4. Non-monetised benefits
154. Following initial scoping and local authority decisions on design choice, the Secretary of State will review the scheme before signing off to ensure all the measures in combination will deliver compliance with legal limits by 2020 outside London and by 2025 within London. Therefore as part of the air quality plan this option enables the UK to reach compliance. In addition to the mortality benefits there are also likely to be a range of morbidity health benefits. Evidence on these impacts is however less developed and so has not been included. Controls on these emissions will also have wider benefits on public amenity and sensitive ecosystems.
155. Introduction of RDE will have a positive impact on emissions reductions in zone but this has not been considered.
156. There will be additional benefits in areas surrounding Clean Air Zones, as these are relatively built up and moving polluting vehicles away from these areas will deliver benefits here. These have not been quantified or valued.
157. There would be wider benefits for business from being located in a healthier, more attractive city (e.g. in terms of attraction and retention of staff, reductions in sickness levels, etc.).
158. There will be a marginal reductions in noise, and associated benefits of these. However, these are likely to be small and it was deemed disproportionate to calculate them.
5.1.5. Welfare Cost
159. There will be a loss of welfare for those who own a non-compliant vehicle switching to a more costly compliant vehicle, from foregoing the trip completely or from diverting to avoid the zone. The impacts of forgoing the trip completely would only apply in London, given elsewhere it is assumed other businesses will make the foregone journeys of those which cannot, and gain a corresponding benefit (so impacts net to zero for business journeys).
Table 5.6 Discounted welfare cost (£m)
Welfare cost 2020 2021 2022 2023 2024 2025 2026 2027 2028 2029 Total
Upgrade cost -£232 -£169 -£93 -£62 -£36 -£22 -£13 -£7 -£4 -£2 -£641
Foregone trip cost
-£13 -£10 -£8 -£6 -£4 -£3 -£2 -£1 -£1 -£1 -£50
Avoided trip cost
-£19 -£13 -£10 -£7 -£5 -£4 -£2 -£2 -£1 -£1 -£63
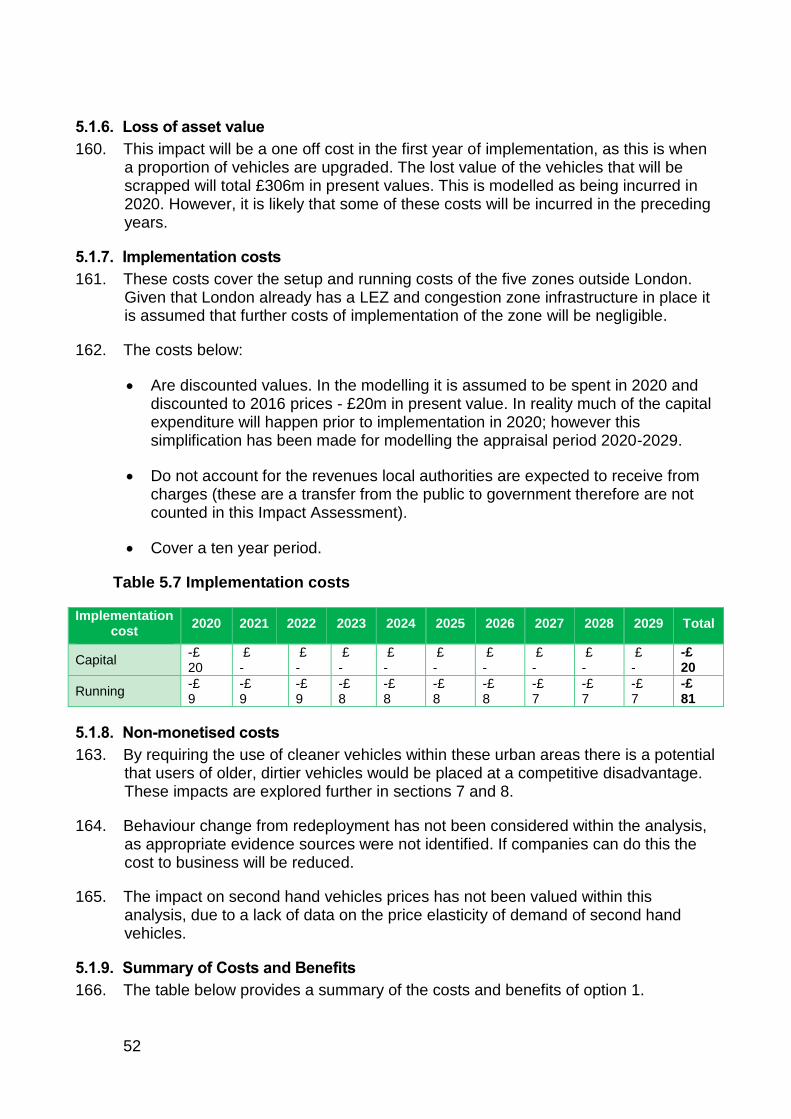
52
5.1.6. Loss of asset value
160. This impact will be a one off cost in the first year of implementation, as this is when a proportion of vehicles are upgraded. The lost value of the vehicles that will be scrapped will total £306m in present values. This is modelled as being incurred in 2020. However, it is likely that some of these costs will be incurred in the preceding years.
5.1.7. Implementation costs
161. These costs cover the setup and running costs of the five zones outside London. Given that London already has a LEZ and congestion zone infrastructure in place it is assumed that further costs of implementation of the zone will be negligible.
162. The costs below:
Are discounted values. In the modelling it is assumed to be spent in 2020 and discounted to 2016 prices - £20m in present value. In reality much of the capital expenditure will happen prior to implementation in 2020; however this simplification has been made for modelling the appraisal period 2020-2029.
Do not account for the revenues local authorities are expected to receive from charges (these are a transfer from the public to government therefore are not counted in this Impact Assessment).
Cover a ten year period.
Table 5.7 Implementation costs
Implementation cost
2020 2021 2022 2023 2024 2025 2026 2027 2028 2029 Total
Capital -£ 20
£ -
£ -
£ -
£ -
£ -
£ -
£ -
£ -
£ -
-£ 20
Running -£ 9
-£ 9
-£ 9
-£ 8
-£ 8
-£ 8
-£ 8
-£ 7
-£ 7
-£ 7
-£ 81
5.1.8. Non-monetised costs
163. By requiring the use of cleaner vehicles within these urban areas there is a potential that users of older, dirtier vehicles would be placed at a competitive disadvantage. These impacts are explored further in sections 7 and 8.
164. Behaviour change from redeployment has not been considered within the analysis, as appropriate evidence sources were not identified. If companies can do this the cost to business will be reduced.
165. The impact on second hand vehicles prices has not been valued within this analysis, due to a lack of data on the price elasticity of demand of second hand vehicles.
5.1.9. Summary of Costs and Benefits
166. The table below provides a summary of the costs and benefits of option 1.
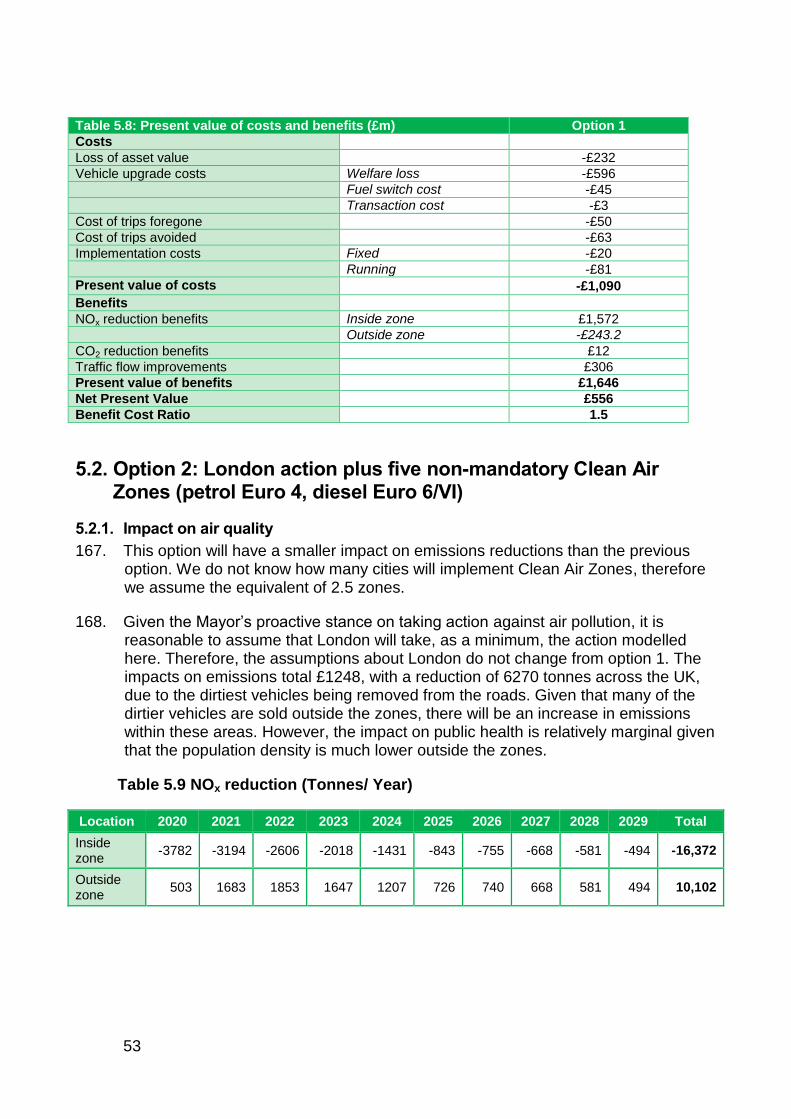
53
Table 5.8: Present value of costs and benefits (£m) Option 1
Costs
Loss of asset value -£232
Vehicle upgrade costs Welfare loss -£596
Fuel switch cost -£45
Transaction cost -£3
Cost of trips foregone -£50
Cost of trips avoided -£63
Implementation costs Fixed -£20
Running -£81
Present value of costs -£1,090
Benefits
NOx reduction benefits Inside zone £1,572
Outside zone -£243.2
CO2 reduction benefits £12
Traffic flow improvements £306
Present value of benefits £1,646
Net Present Value £556
Benefit Cost Ratio 1.5
5.2. Option 2: London action plus five non-mandatory Clean Air Zones (petrol Euro 4, diesel Euro 6/VI)
5.2.1. Impact on air quality
167. This option will have a smaller impact on emissions reductions than the previous option. We do not know how many cities will implement Clean Air Zones, therefore we assume the equivalent of 2.5 zones.
168. Given the Mayor’s proactive stance on taking action against air pollution, it is reasonable to assume that London will take, as a minimum, the action modelled here. Therefore, the assumptions about London do not change from option 1. The impacts on emissions total £1248, with a reduction of 6270 tonnes across the UK, due to the dirtiest vehicles being removed from the roads. Given that many of the dirtier vehicles are sold outside the zones, there will be an increase in emissions within these areas. However, the impact on public health is relatively marginal given that the population density is much lower outside the zones.
Table 5.9 NOx reduction (Tonnes/ Year)
Location 2020 2021 2022 2023 2024 2025 2026 2027 2028 2029 Total
Inside zone
-3782 -3194 -2606 -2018 -1431 -843 -755 -668 -581 -494 -16,372
Outside zone
503 1683 1853 1647 1207 726 740 668 581 494 10,102
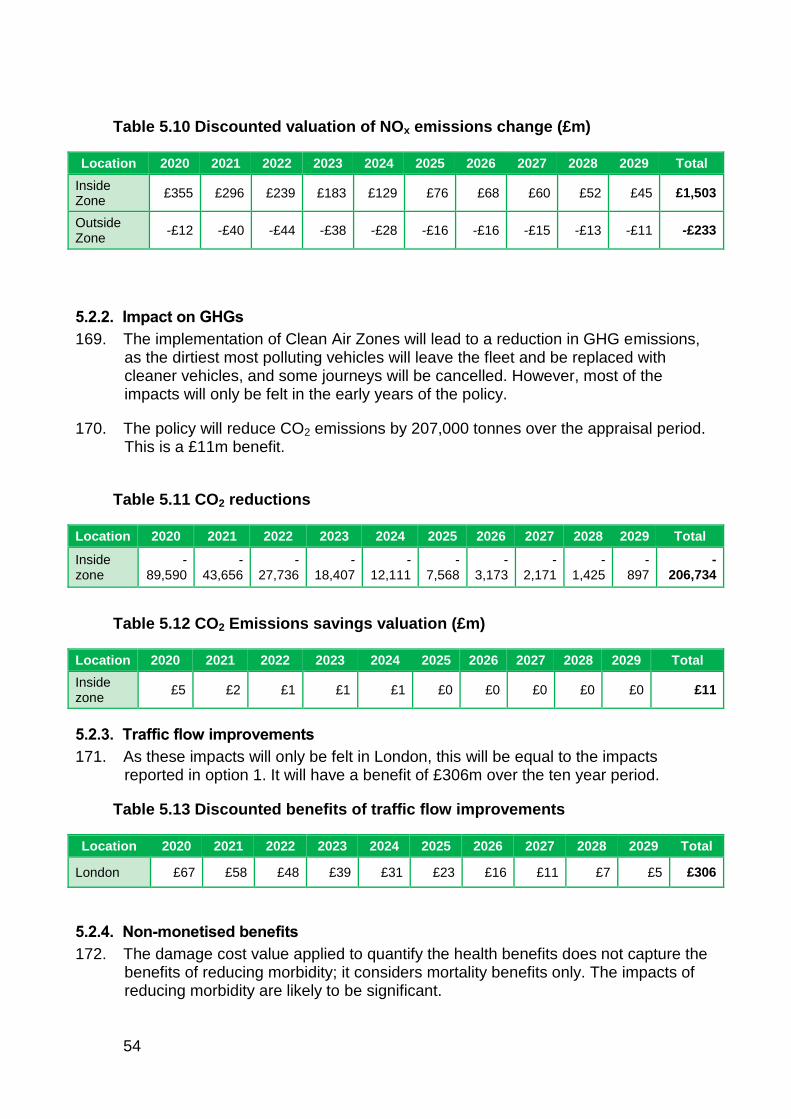
54
Table 5.10 Discounted valuation of NOx emissions change (£m)
Location 2020 2021 2022 2023 2024 2025 2026 2027 2028 2029 Total
Inside Zone
£355 £296 £239 £183 £129 £76 £68 £60 £52 £45 £1,503
Outside Zone
-£12 -£40 -£44 -£38 -£28 -£16 -£16 -£15 -£13 -£11 -£233
5.2.2. Impact on GHGs
169. The implementation of Clean Air Zones will lead to a reduction in GHG emissions, as the dirtiest most polluting vehicles will leave the fleet and be replaced with cleaner vehicles, and some journeys will be cancelled. However, most of the impacts will only be felt in the early years of the policy.
170. The policy will reduce CO2 emissions by 207,000 tonnes over the appraisal period. This is a £11m benefit.
Table 5.11 CO2 reductions
Location 2020 2021 2022 2023 2024 2025 2026 2027 2028 2029 Total
Inside zone
-89,590
-43,656
-27,736
-18,407
-12,111
-7,568
-3,173
-2,171
-1,425
- 897
- 206,734
Table 5.12 CO2 Emissions savings valuation (£m)
Location 2020 2021 2022 2023 2024 2025 2026 2027 2028 2029 Total
Inside zone
£5 £2 £1 £1 £1 £0 £0 £0 £0 £0 £11
5.2.3. Traffic flow improvements
171. As these impacts will only be felt in London, this will be equal to the impacts reported in option 1. It will have a benefit of £306m over the ten year period.
Table 5.13 Discounted benefits of traffic flow improvements
Location 2020 2021 2022 2023 2024 2025 2026 2027 2028 2029 Total
London £67 £58 £48 £39 £31 £23 £16 £11 £7 £5 £306
5.2.4. Non-monetised benefits
172. The damage cost value applied to quantify the health benefits does not capture the benefits of reducing morbidity; it considers mortality benefits only. The impacts of reducing morbidity are likely to be significant.
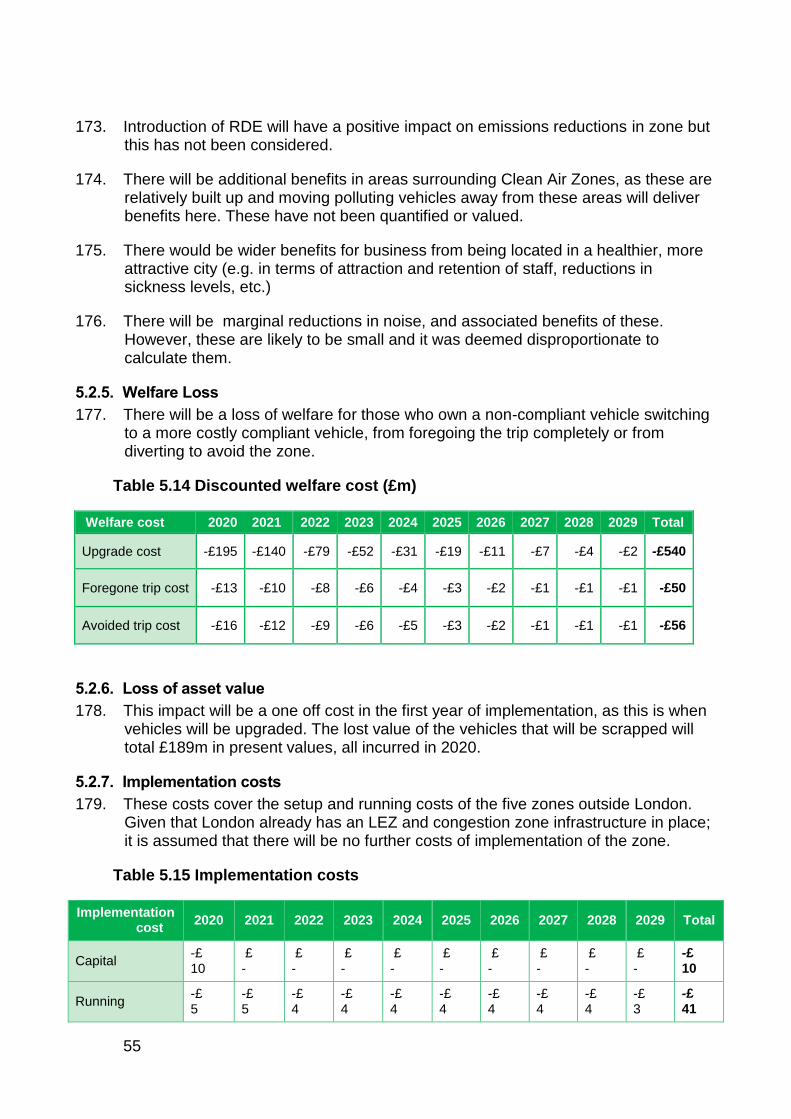
55
173. Introduction of RDE will have a positive impact on emissions reductions in zone but this has not been considered.
174. There will be additional benefits in areas surrounding Clean Air Zones, as these are relatively built up and moving polluting vehicles away from these areas will deliver benefits here. These have not been quantified or valued.
175. There would be wider benefits for business from being located in a healthier, more attractive city (e.g. in terms of attraction and retention of staff, reductions in sickness levels, etc.)
176. There will be marginal reductions in noise, and associated benefits of these. However, these are likely to be small and it was deemed disproportionate to calculate them.
5.2.5. Welfare Loss
177. There will be a loss of welfare for those who own a non-compliant vehicle switching to a more costly compliant vehicle, from foregoing the trip completely or from diverting to avoid the zone.
Table 5.14 Discounted welfare cost (£m)
Welfare cost 2020 2021 2022 2023 2024 2025 2026 2027 2028 2029 Total
Upgrade cost -£195 -£140 -£79 -£52 -£31 -£19 -£11 -£7 -£4 -£2 -£540
Foregone trip cost -£13 -£10 -£8 -£6 -£4 -£3 -£2 -£1 -£1 -£1 -£50
Avoided trip cost -£16 -£12 -£9 -£6 -£5 -£3 -£2 -£1 -£1 -£1 -£56
5.2.6. Loss of asset value
178. This impact will be a one off cost in the first year of implementation, as this is when vehicles will be upgraded. The lost value of the vehicles that will be scrapped will total £189m in present values, all incurred in 2020.
5.2.7. Implementation costs
179. These costs cover the setup and running costs of the five zones outside London. Given that London already has an LEZ and congestion zone infrastructure in place; it is assumed that there will be no further costs of implementation of the zone.
Table 5.15 Implementation costs
Implementation cost
2020 2021 2022 2023 2024 2025 2026 2027 2028 2029 Total
Capital -£ 10
£ -
£ -
£ -
£ -
£ -
£ -
£ -
£ -
£ -
-£ 10
Running -£ 5
-£ 5
-£ 4
-£ 4
-£ 4
-£ 4
-£ 4
-£ 4
-£ 4
-£ 3
-£ 41
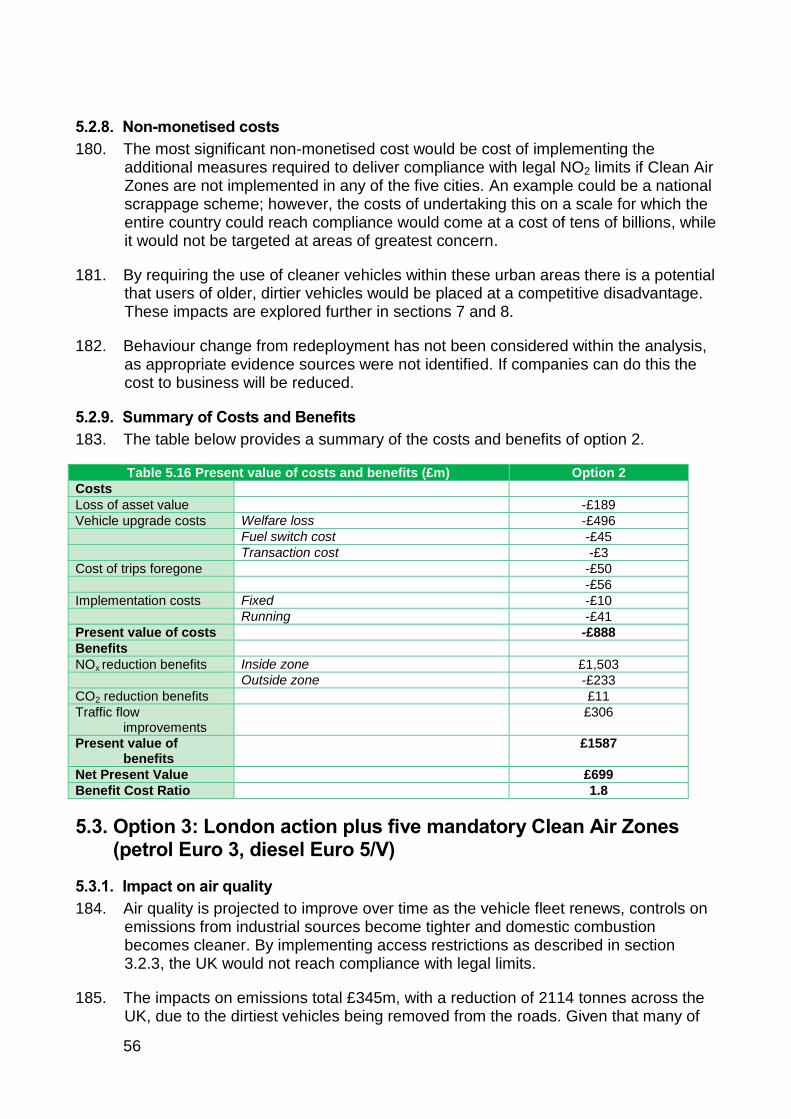
56
5.2.8. Non-monetised costs
180. The most significant non-monetised cost would be cost of implementing the additional measures required to deliver compliance with legal NO2 limits if Clean Air Zones are not implemented in any of the five cities. An example could be a national scrappage scheme; however, the costs of undertaking this on a scale for which the entire country could reach compliance would come at a cost of tens of billions, while it would not be targeted at areas of greatest concern.
181. By requiring the use of cleaner vehicles within these urban areas there is a potential that users of older, dirtier vehicles would be placed at a competitive disadvantage. These impacts are explored further in sections 7 and 8.
182. Behaviour change from redeployment has not been considered within the analysis, as appropriate evidence sources were not identified. If companies can do this the cost to business will be reduced.
5.2.9. Summary of Costs and Benefits
183. The table below provides a summary of the costs and benefits of option 2.
Table 5.16 Present value of costs and benefits (£m) Option 2
Costs
Loss of asset value -£189
Vehicle upgrade costs Welfare loss -£496
Fuel switch cost -£45
Transaction cost -£3
Cost of trips foregone -£50
-£56
Implementation costs Fixed -£10
Running -£41
Present value of costs -£888
Benefits
NOx reduction benefits Inside zone £1,503
Outside zone -£233
CO2 reduction benefits £11
Traffic flow improvements
£306
Present value of benefits
£1587
Net Present Value £699
Benefit Cost Ratio 1.8
5.3. Option 3: London action plus five mandatory Clean Air Zones (petrol Euro 3, diesel Euro 5/V)
5.3.1. Impact on air quality
184. Air quality is projected to improve over time as the vehicle fleet renews, controls on emissions from industrial sources become tighter and domestic combustion becomes cleaner. By implementing access restrictions as described in section 3.2.3, the UK would not reach compliance with legal limits.
185. The impacts on emissions total £345m, with a reduction of 2114 tonnes across the UK, due to the dirtiest vehicles being removed from the roads. Given that many of
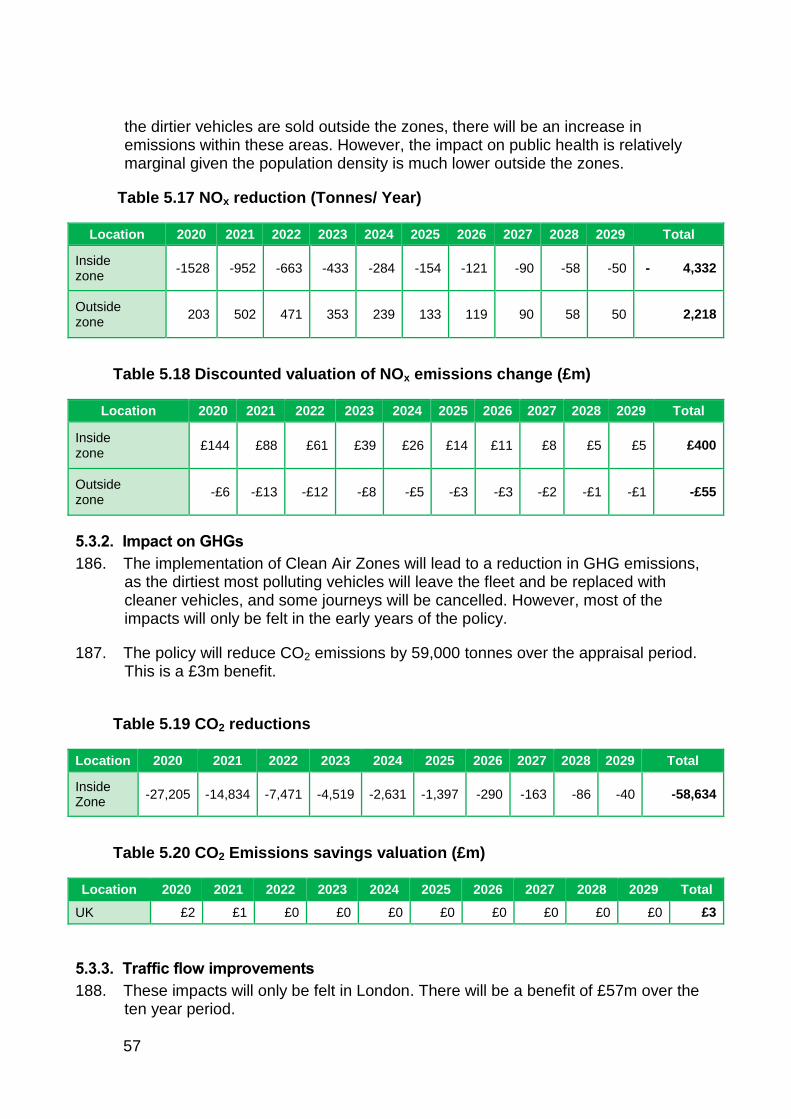
57
the dirtier vehicles are sold outside the zones, there will be an increase in emissions within these areas. However, the impact on public health is relatively marginal given the population density is much lower outside the zones.
Table 5.17 NOx reduction (Tonnes/ Year)
Location 2020 2021 2022 2023 2024 2025 2026 2027 2028 2029 Total
Inside zone
-1528 -952 -663 -433 -284 -154 -121 -90 -58 -50 - 4,332
Outside zone
203 502 471 353 239 133 119 90 58 50 2,218
Table 5.18 Discounted valuation of NOx emissions change (£m)
Location 2020 2021 2022 2023 2024 2025 2026 2027 2028 2029 Total
Inside zone
£144 £88 £61 £39 £26 £14 £11 £8 £5 £5 £400
Outside zone
-£6 -£13 -£12 -£8 -£5 -£3 -£3 -£2 -£1 -£1 -£55
5.3.2. Impact on GHGs
186. The implementation of Clean Air Zones will lead to a reduction in GHG emissions, as the dirtiest most polluting vehicles will leave the fleet and be replaced with cleaner vehicles, and some journeys will be cancelled. However, most of the impacts will only be felt in the early years of the policy.
187. The policy will reduce CO2 emissions by 59,000 tonnes over the appraisal period. This is a £3m benefit.
Table 5.19 CO2 reductions
Location 2020 2021 2022 2023 2024 2025 2026 2027 2028 2029 Total
Inside Zone
-27,205 -14,834 -7,471 -4,519 -2,631 -1,397 -290 -163 -86 -40 -58,634
Table 5.20 CO2 Emissions savings valuation (£m)
Location 2020 2021 2022 2023 2024 2025 2026 2027 2028 2029 Total
UK £2 £1 £0 £0 £0 £0 £0 £0 £0 £0 £3
5.3.3. Traffic flow improvements
188. These impacts will only be felt in London. There will be a benefit of £57m over the ten year period.
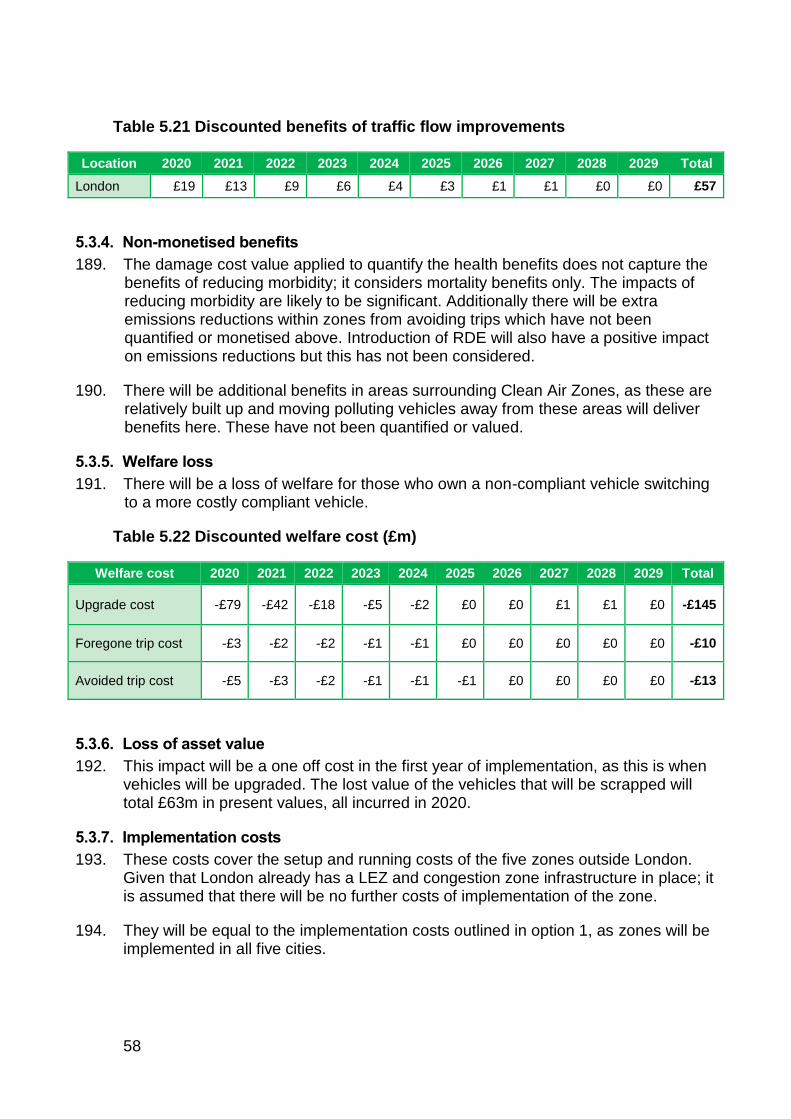
58
Table 5.21 Discounted benefits of traffic flow improvements
Location 2020 2021 2022 2023 2024 2025 2026 2027 2028 2029 Total
London £19 £13 £9 £6 £4 £3 £1 £1 £0 £0 £57
5.3.4. Non-monetised benefits
189. The damage cost value applied to quantify the health benefits does not capture the benefits of reducing morbidity; it considers mortality benefits only. The impacts of reducing morbidity are likely to be significant. Additionally there will be extra emissions reductions within zones from avoiding trips which have not been quantified or monetised above. Introduction of RDE will also have a positive impact on emissions reductions but this has not been considered.
190. There will be additional benefits in areas surrounding Clean Air Zones, as these are relatively built up and moving polluting vehicles away from these areas will deliver benefits here. These have not been quantified or valued.
5.3.5. Welfare loss
191. There will be a loss of welfare for those who own a non-compliant vehicle switching to a more costly compliant vehicle.
Table 5.22 Discounted welfare cost (£m)
Welfare cost 2020 2021 2022 2023 2024 2025 2026 2027 2028 2029 Total
Upgrade cost -£79 -£42 -£18 -£5 -£2 £0 £0 £1 £1 £0 -£145
Foregone trip cost -£3 -£2 -£2 -£1 -£1 £0 £0 £0 £0 £0 -£10
Avoided trip cost -£5 -£3 -£2 -£1 -£1 -£1 £0 £0 £0 £0 -£13
5.3.6. Loss of asset value
192. This impact will be a one off cost in the first year of implementation, as this is when vehicles will be upgraded. The lost value of the vehicles that will be scrapped will total £63m in present values, all incurred in 2020.
5.3.7. Implementation costs
193. These costs cover the setup and running costs of the five zones outside London. Given that London already has a LEZ and congestion zone infrastructure in place; it is assumed that there will be no further costs of implementation of the zone.
194. They will be equal to the implementation costs outlined in option 1, as zones will be implemented in all five cities.
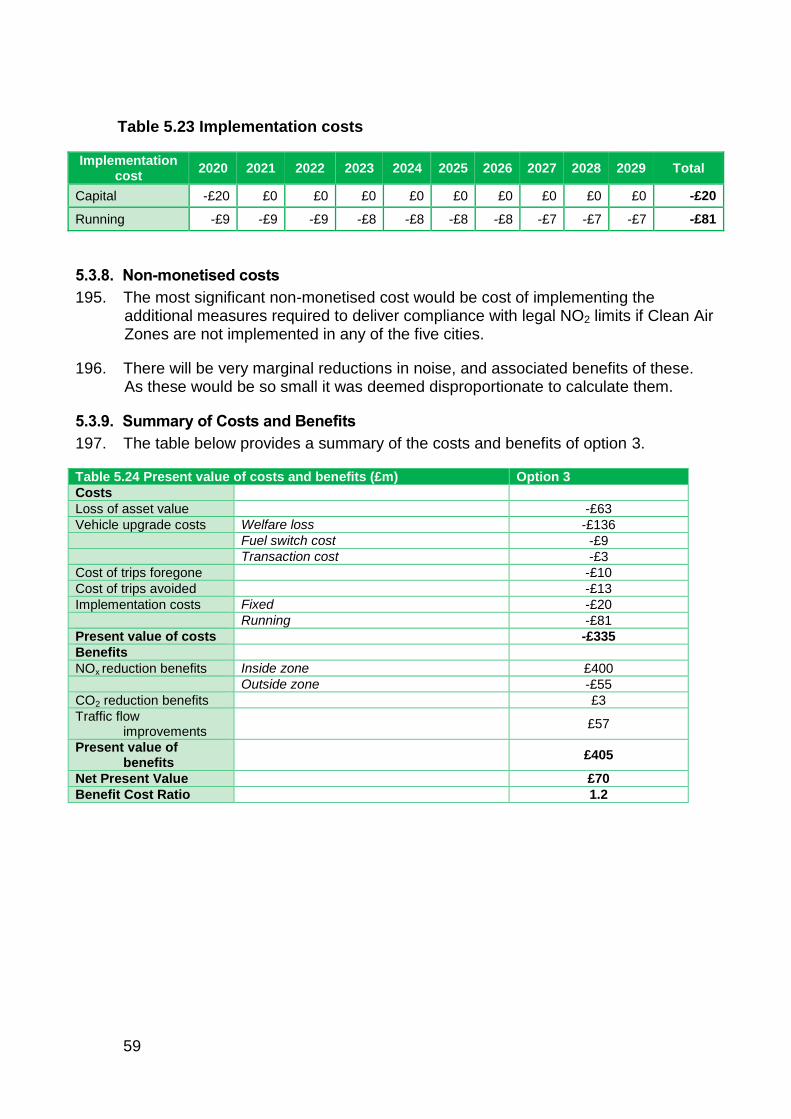
59
Table 5.23 Implementation costs
Implementation cost
2020 2021 2022 2023 2024 2025 2026 2027 2028 2029 Total
Capital -£20 £0 £0 £0 £0 £0 £0 £0 £0 £0 -£20
Running -£9 -£9 -£9 -£8 -£8 -£8 -£8 -£7 -£7 -£7 -£81
5.3.8. Non-monetised costs
195. The most significant non-monetised cost would be cost of implementing the additional measures required to deliver compliance with legal NO2 limits if Clean Air Zones are not implemented in any of the five cities.
196. There will be very marginal reductions in noise, and associated benefits of these. As these would be so small it was deemed disproportionate to calculate them.
5.3.9. Summary of Costs and Benefits
197. The table below provides a summary of the costs and benefits of option 3.
Table 5.24 Present value of costs and benefits (£m) Option 3
Costs
Loss of asset value -£63
Vehicle upgrade costs Welfare loss -£136
Fuel switch cost -£9
Transaction cost -£3
Cost of trips foregone -£10
Cost of trips avoided -£13
Implementation costs Fixed -£20
Running -£81
Present value of costs -£335
Benefits
NOx reduction benefits Inside zone £400
Outside zone -£55
CO2 reduction benefits £3
Traffic flow improvements
£57
Present value of benefits
£405
Net Present Value £70
Benefit Cost Ratio 1.2
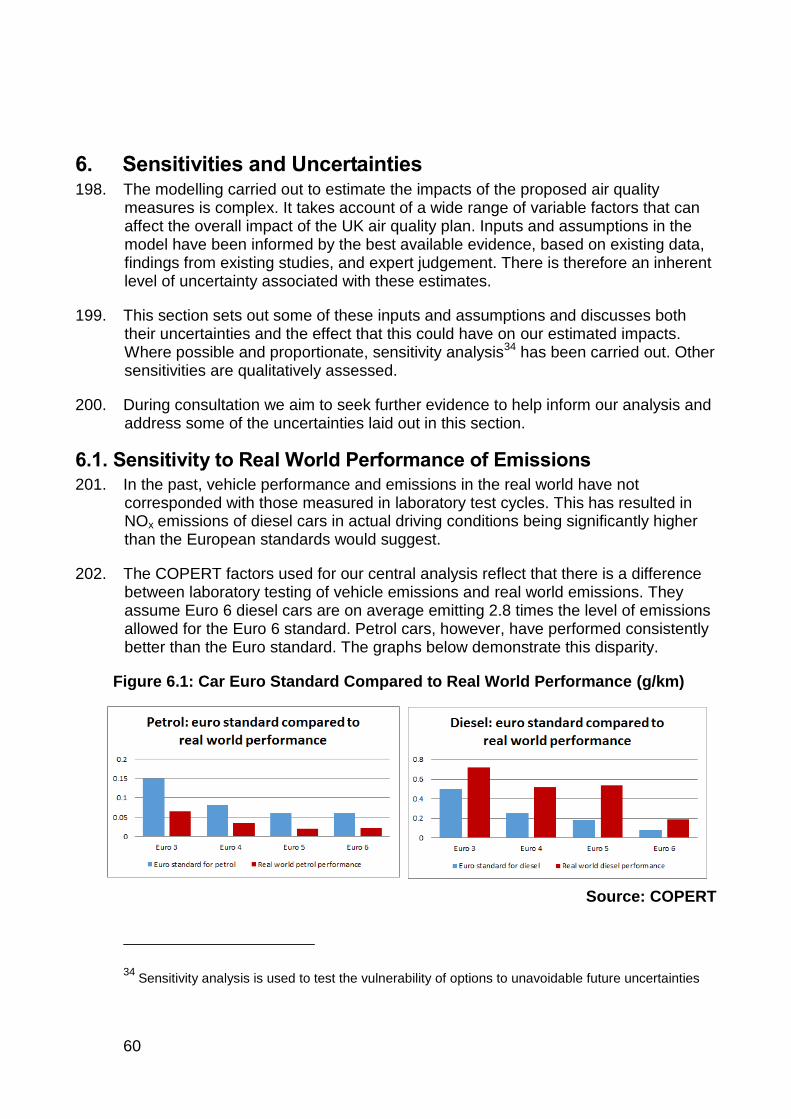
60
6. Sensitivities and Uncertainties 198. The modelling carried out to estimate the impacts of the proposed air quality
measures is complex. It takes account of a wide range of variable factors that can affect the overall impact of the UK air quality plan. Inputs and assumptions in the model have been informed by the best available evidence, based on existing data, findings from existing studies, and expert judgement. There is therefore an inherent level of uncertainty associated with these estimates.
199. This section sets out some of these inputs and assumptions and discusses both their uncertainties and the effect that this could have on our estimated impacts. Where possible and proportionate, sensitivity analysis34 has been carried out. Other sensitivities are qualitatively assessed.
200. During consultation we aim to seek further evidence to help inform our analysis and address some of the uncertainties laid out in this section.
6.1. Sensitivity to Real World Performance of Emissions 201. In the past, vehicle performance and emissions in the real world have not
corresponded with those measured in laboratory test cycles. This has resulted in NOx emissions of diesel cars in actual driving conditions being significantly higher than the European standards would suggest.
202. The COPERT factors used for our central analysis reflect that there is a difference between laboratory testing of vehicle emissions and real world emissions. They assume Euro 6 diesel cars are on average emitting 2.8 times the level of emissions allowed for the Euro 6 standard. Petrol cars, however, have performed consistently better than the Euro standard. The graphs below demonstrate this disparity.
Figure 6.1: Car Euro Standard Compared to Real World Performance (g/km)
Source: COPERT
34 Sensitivity analysis is used to test the vulnerability of options to unavoidable future uncertainties
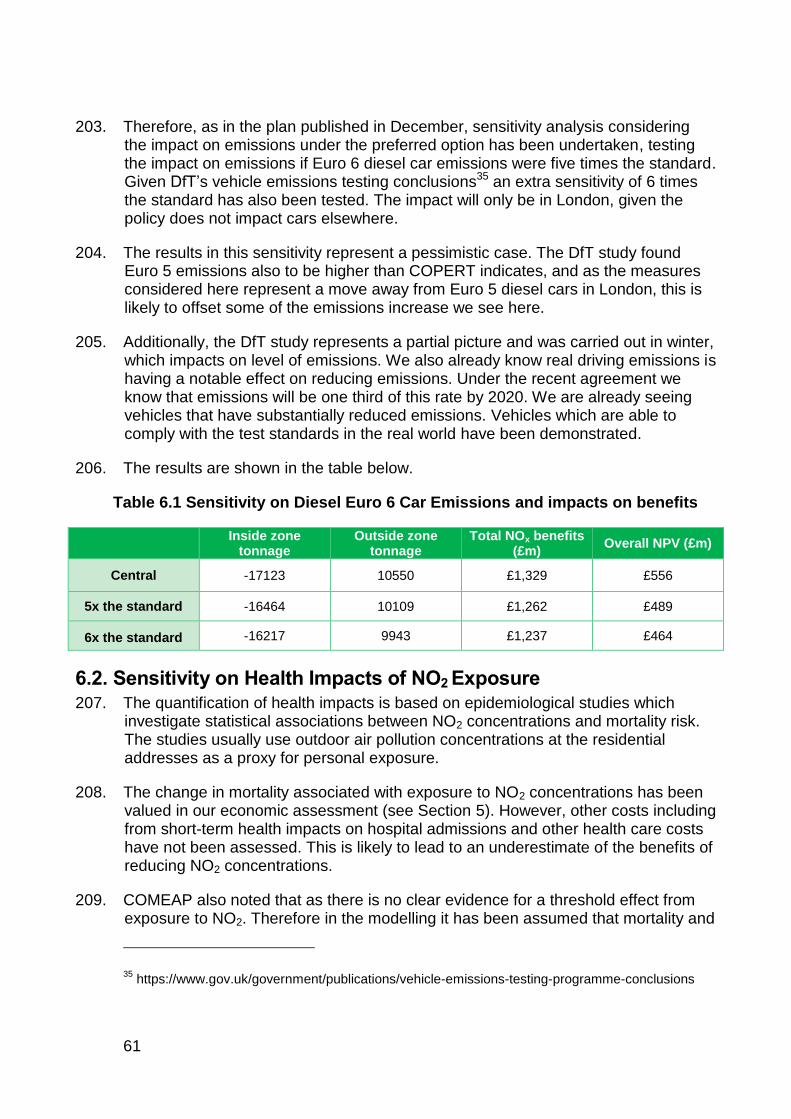
61
203. Therefore, as in the plan published in December, sensitivity analysis considering the impact on emissions under the preferred option has been undertaken, testing the impact on emissions if Euro 6 diesel car emissions were five times the standard. Given DfT’s vehicle emissions testing conclusions35 an extra sensitivity of 6 times the standard has also been tested. The impact will only be in London, given the policy does not impact cars elsewhere.
204. The results in this sensitivity represent a pessimistic case. The DfT study found Euro 5 emissions also to be higher than COPERT indicates, and as the measures considered here represent a move away from Euro 5 diesel cars in London, this is likely to offset some of the emissions increase we see here.
205. Additionally, the DfT study represents a partial picture and was carried out in winter, which impacts on level of emissions. We also already know real driving emissions is having a notable effect on reducing emissions. Under the recent agreement we know that emissions will be one third of this rate by 2020. We are already seeing vehicles that have substantially reduced emissions. Vehicles which are able to comply with the test standards in the real world have been demonstrated.
206. The results are shown in the table below.
Table 6.1 Sensitivity on Diesel Euro 6 Car Emissions and impacts on benefits
Inside zone tonnage
Outside zone tonnage
Total NOx benefits (£m)
Overall NPV (£m)
Central -17123 10550 £1,329 £556
5x the standard -16464 10109 £1,262 £489
6x the standard -16217 9943 £1,237 £464
6.2. Sensitivity on Health Impacts of NO2 Exposure 207. The quantification of health impacts is based on epidemiological studies which
investigate statistical associations between NO2 concentrations and mortality risk. The studies usually use outdoor air pollution concentrations at the residential addresses as a proxy for personal exposure.
208. The change in mortality associated with exposure to NO2 concentrations has been valued in our economic assessment (see Section 5). However, other costs including from short-term health impacts on hospital admissions and other health care costs have not been assessed. This is likely to lead to an underestimate of the benefits of reducing NO2 concentrations.
209. COMEAP also noted that as there is no clear evidence for a threshold effect from exposure to NO2. Therefore in the modelling it has been assumed that mortality and
35 https://www.gov.uk/government/publications/vehicle-emissions-testing-programme-conclusions
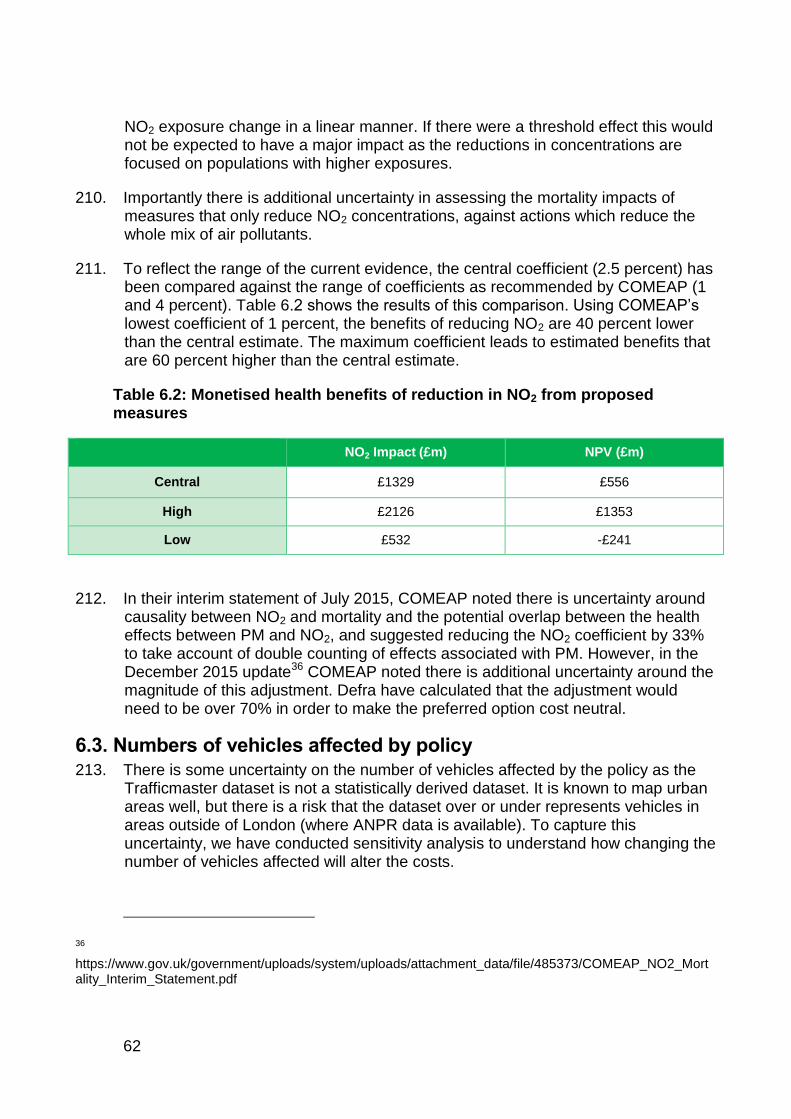
62
NO2 exposure change in a linear manner. If there were a threshold effect this would not be expected to have a major impact as the reductions in concentrations are focused on populations with higher exposures.
210. Importantly there is additional uncertainty in assessing the mortality impacts of measures that only reduce NO2 concentrations, against actions which reduce the whole mix of air pollutants.
211. To reflect the range of the current evidence, the central coefficient (2.5 percent) has been compared against the range of coefficients as recommended by COMEAP (1 and 4 percent). Table 6.2 shows the results of this comparison. Using COMEAP’s lowest coefficient of 1 percent, the benefits of reducing NO2 are 40 percent lower than the central estimate. The maximum coefficient leads to estimated benefits that are 60 percent higher than the central estimate.
Table 6.2: Monetised health benefits of reduction in NO2 from proposed measures
NO2 Impact (£m) NPV (£m)
Central £1329 £556
High £2126 £1353
Low £532 -£241
212. In their interim statement of July 2015, COMEAP noted there is uncertainty around causality between NO2 and mortality and the potential overlap between the health effects between PM and NO2, and suggested reducing the NO2 coefficient by 33% to take account of double counting of effects associated with PM. However, in the December 2015 update36 COMEAP noted there is additional uncertainty around the magnitude of this adjustment. Defra have calculated that the adjustment would need to be over 70% in order to make the preferred option cost neutral.
6.3. Numbers of vehicles affected by policy 213. There is some uncertainty on the number of vehicles affected by the policy as the
Trafficmaster dataset is not a statistically derived dataset. It is known to map urban areas well, but there is a risk that the dataset over or under represents vehicles in areas outside of London (where ANPR data is available). To capture this uncertainty, we have conducted sensitivity analysis to understand how changing the number of vehicles affected will alter the costs.
36
https://www.gov.uk/government/uploads/system/uploads/attachment_data/file/485373/COMEAP_NO2_Mortality_Interim_Statement.pdf
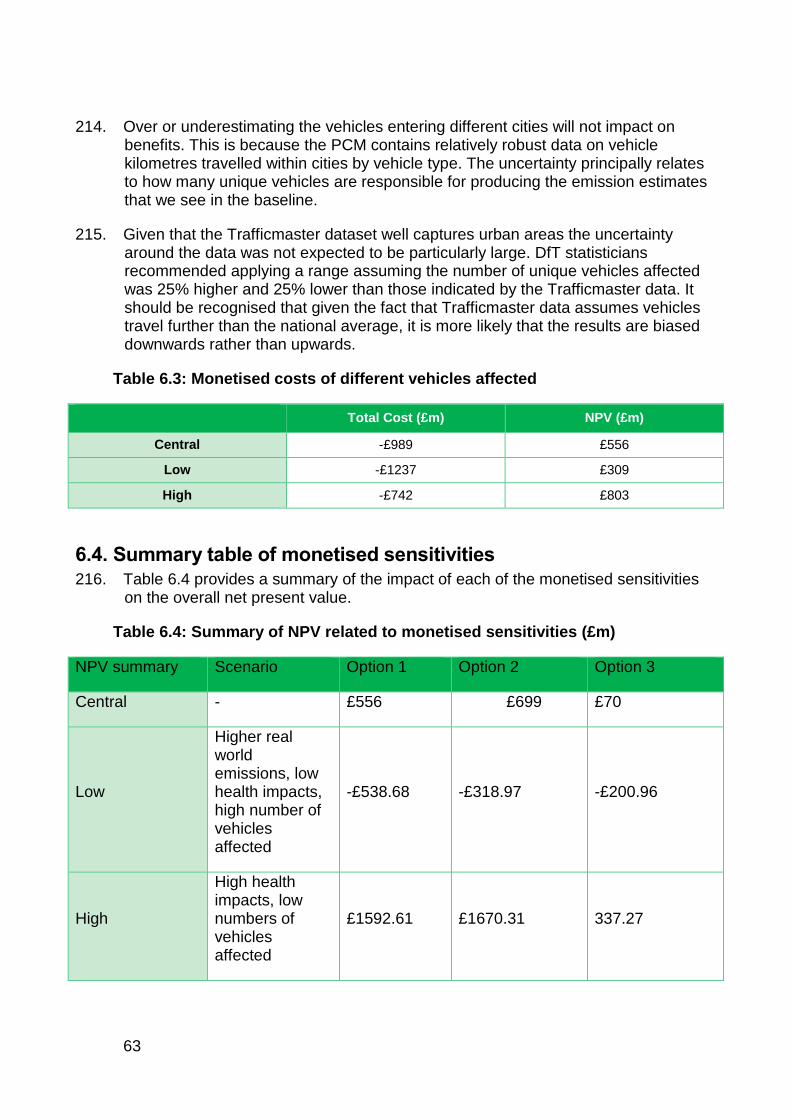
63
214. Over or underestimating the vehicles entering different cities will not impact on benefits. This is because the PCM contains relatively robust data on vehicle kilometres travelled within cities by vehicle type. The uncertainty principally relates to how many unique vehicles are responsible for producing the emission estimates that we see in the baseline.
215. Given that the Trafficmaster dataset well captures urban areas the uncertainty around the data was not expected to be particularly large. DfT statisticians recommended applying a range assuming the number of unique vehicles affected was 25% higher and 25% lower than those indicated by the Trafficmaster data. It should be recognised that given the fact that Trafficmaster data assumes vehicles travel further than the national average, it is more likely that the results are biased downwards rather than upwards.
Table 6.3: Monetised costs of different vehicles affected
Total Cost (£m) NPV (£m)
Central -£989 £556
Low -£1237 £309
High -£742 £803
6.4. Summary table of monetised sensitivities 216. Table 6.4 provides a summary of the impact of each of the monetised sensitivities
on the overall net present value.
Table 6.4: Summary of NPV related to monetised sensitivities (£m)
NPV summary Scenario Option 1 Option 2 Option 3
Central - £556 £699 £70
Low
Higher real world emissions, low health impacts, high number of vehicles affected
-£538.68 -£318.97 -£200.96
High
High health impacts, low numbers of vehicles affected
£1592.61 £1670.31 337.27
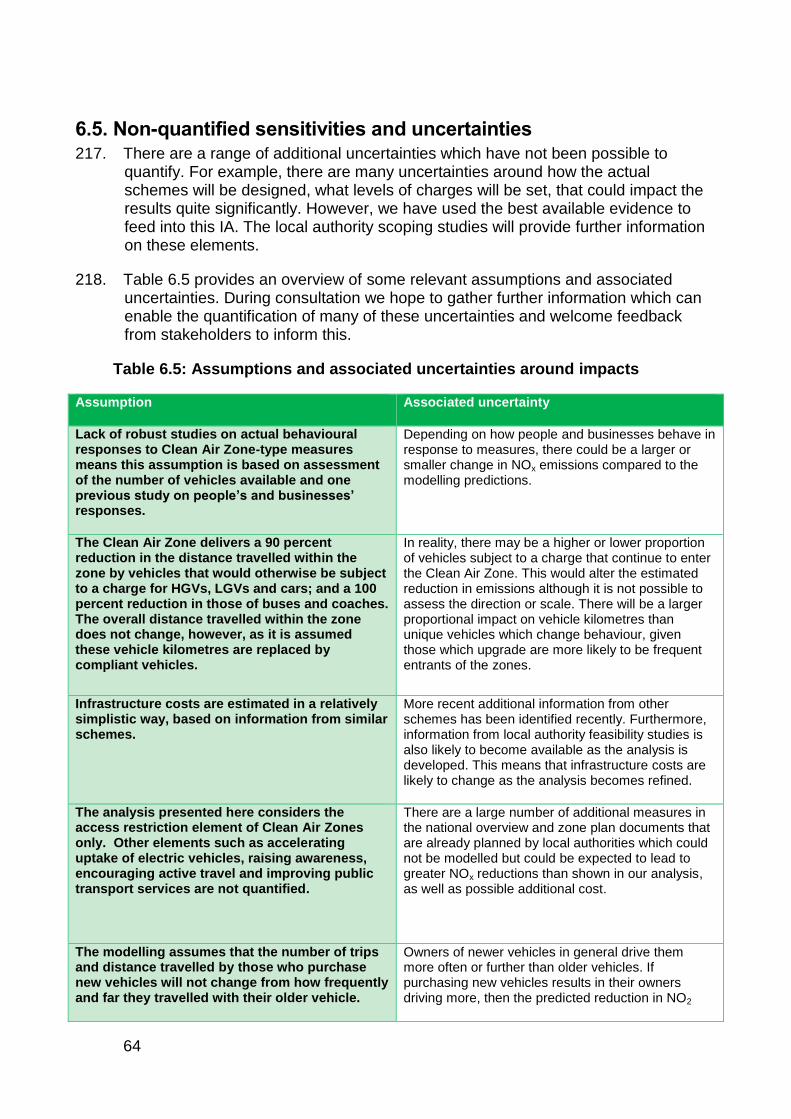
64
6.5. Non-quantified sensitivities and uncertainties 217. There are a range of additional uncertainties which have not been possible to
quantify. For example, there are many uncertainties around how the actual schemes will be designed, what levels of charges will be set, that could impact the results quite significantly. However, we have used the best available evidence to feed into this IA. The local authority scoping studies will provide further information on these elements.
218. Table 6.5 provides an overview of some relevant assumptions and associated uncertainties. During consultation we hope to gather further information which can enable the quantification of many of these uncertainties and welcome feedback from stakeholders to inform this.
Table 6.5: Assumptions and associated uncertainties around impacts
Assumption Associated uncertainty
Lack of robust studies on actual behavioural responses to Clean Air Zone-type measures means this assumption is based on assessment of the number of vehicles available and one previous study on people’s and businesses’ responses.
Depending on how people and businesses behave in response to measures, there could be a larger or smaller change in NOx emissions compared to the modelling predictions.
The Clean Air Zone delivers a 90 percent reduction in the distance travelled within the zone by vehicles that would otherwise be subject to a charge for HGVs, LGVs and cars; and a 100 percent reduction in those of buses and coaches. The overall distance travelled within the zone does not change, however, as it is assumed these vehicle kilometres are replaced by compliant vehicles.
In reality, there may be a higher or lower proportion of vehicles subject to a charge that continue to enter the Clean Air Zone. This would alter the estimated reduction in emissions although it is not possible to assess the direction or scale. There will be a larger proportional impact on vehicle kilometres than unique vehicles which change behaviour, given those which upgrade are more likely to be frequent entrants of the zones.
Infrastructure costs are estimated in a relatively simplistic way, based on information from similar schemes.
More recent additional information from other schemes has been identified recently. Furthermore, information from local authority feasibility studies is also likely to become available as the analysis is developed. This means that infrastructure costs are likely to change as the analysis becomes refined.
The analysis presented here considers the access restriction element of Clean Air Zones only. Other elements such as accelerating uptake of electric vehicles, raising awareness, encouraging active travel and improving public transport services are not quantified.
There are a large number of additional measures in the national overview and zone plan documents that are already planned by local authorities which could not be modelled but could be expected to lead to greater NOx reductions than shown in our analysis, as well as possible additional cost.
The modelling assumes that the number of trips and distance travelled by those who purchase new vehicles will not change from how frequently and far they travelled with their older vehicle.
Owners of newer vehicles in general drive them more often or further than older vehicles. If purchasing new vehicles results in their owners driving more, then the predicted reduction in NO2
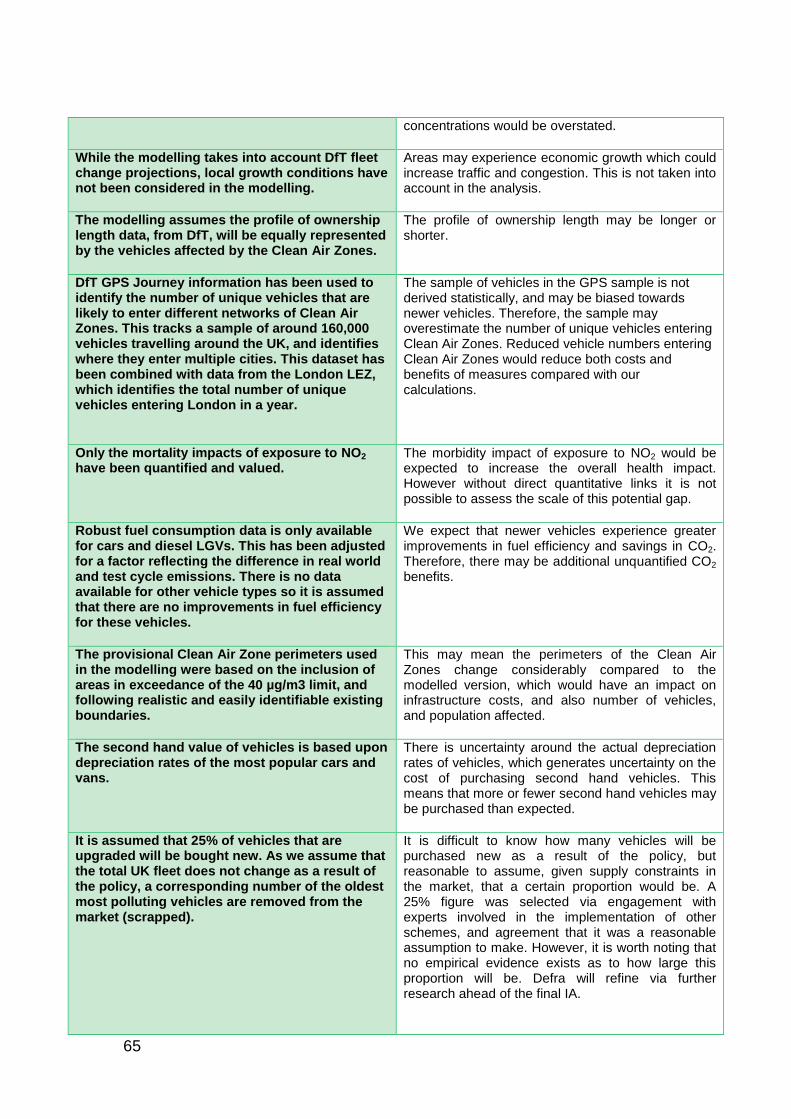
65
concentrations would be overstated.
While the modelling takes into account DfT fleet change projections, local growth conditions have not been considered in the modelling.
Areas may experience economic growth which could increase traffic and congestion. This is not taken into account in the analysis.
The modelling assumes the profile of ownership length data, from DfT, will be equally represented by the vehicles affected by the Clean Air Zones.
The profile of ownership length may be longer or shorter.
DfT GPS Journey information has been used to identify the number of unique vehicles that are likely to enter different networks of Clean Air Zones. This tracks a sample of around 160,000 vehicles travelling around the UK, and identifies where they enter multiple cities. This dataset has been combined with data from the London LEZ, which identifies the total number of unique vehicles entering London in a year.
The sample of vehicles in the GPS sample is not derived statistically, and may be biased towards newer vehicles. Therefore, the sample may overestimate the number of unique vehicles entering Clean Air Zones. Reduced vehicle numbers entering Clean Air Zones would reduce both costs and benefits of measures compared with our calculations.
Only the mortality impacts of exposure to NO2 have been quantified and valued.
The morbidity impact of exposure to NO2 would be expected to increase the overall health impact. However without direct quantitative links it is not possible to assess the scale of this potential gap.
Robust fuel consumption data is only available for cars and diesel LGVs. This has been adjusted for a factor reflecting the difference in real world and test cycle emissions. There is no data available for other vehicle types so it is assumed that there are no improvements in fuel efficiency for these vehicles.
We expect that newer vehicles experience greater improvements in fuel efficiency and savings in CO2. Therefore, there may be additional unquantified CO2 benefits.
The provisional Clean Air Zone perimeters used in the modelling were based on the inclusion of areas in exceedance of the 40 µg/m3 limit, and following realistic and easily identifiable existing boundaries.
This may mean the perimeters of the Clean Air Zones change considerably compared to the modelled version, which would have an impact on infrastructure costs, and also number of vehicles, and population affected.
The second hand value of vehicles is based upon depreciation rates of the most popular cars and vans.
There is uncertainty around the actual depreciation rates of vehicles, which generates uncertainty on the cost of purchasing second hand vehicles. This means that more or fewer second hand vehicles may be purchased than expected.
It is assumed that 25% of vehicles that are upgraded will be bought new. As we assume that the total UK fleet does not change as a result of the policy, a corresponding number of the oldest most polluting vehicles are removed from the market (scrapped).
It is difficult to know how many vehicles will be purchased new as a result of the policy, but reasonable to assume, given supply constraints in the market, that a certain proportion would be. A 25% figure was selected via engagement with experts involved in the implementation of other schemes, and agreement that it was a reasonable assumption to make. However, it is worth noting that no empirical evidence exists as to how large this proportion will be. Defra will refine via further research ahead of the final IA.

66
It is assumed that the implementation of Clean Air Zones will have no impact on the activities of businesses within these zones.
The increased costs for example incurred by haulage companies may be passed onto businesses, raising prices of goods sold by shops in the city centre. Cancelled journeys by customers may also have a negative impact on businesses. Likewise, the increased costs incurred by service industries which drive into the area could also be passed onto consumers and businesses located in zones. At the same time, the wider benefits for business from being located in a healthier, more attractive city (e.g. in terms of attraction and retention of staff, reductions in sickness levels, etc.) have not been quantified.
67
7. Business Impacts 219. The implementation of Clean Air Zones will principally affect businesses, as they
target buses, coaches, HGVs, and taxis/private hire vehicles in six cities, and LGVs in three. These vehicles are principally owned by businesses (for more detail on ownership profile see Annex D). Personal cars are only affected in central London.
220. More specifically, the Clean Air Zone charge will affect businesses who own older vehicles that would be subject to the charge, and who enter the proposed Clean Air Zones on a relatively frequent basis.
221. Businesses’ ability to respond will depend on availability of funds to upgrade their non-compliant vehicle or pay the charge, or flexibility to change behaviour in another way e.g. switch to an alternative mode of transport (e.g. train), reroute to travel outside the Clean Air Zone, or redeploy their older vehicles to other areas of the country. In general, larger businesses are expected to have more capacity to manage the impacts both financially and operationally. In contrast, smaller businesses, particularly sole traders who are dependent on using their vehicle within a Clean Air Zone, may be less able to adjust behaviour and continue into the zone.
222. There is a paucity of available evidence on the proportion and characteristics of businesses that would absorb costs, those that would pass these on to customers, and those that may go out of business as a result. The TfL feasibility study for the London Low Emission Zone (2006) provides an overview of the impacts on different sectors of the economy that are most likely be affected financially by the implementation of the LEZ.37 Whilst much of this information is relevant to the assessment of the five UK cities where Clean Air Zones will be mandated, London is unique in size, fleet composition and business demographics. This is important to bear in mind when considering TfL findings.
223. TfL found that the transport and storage, construction sectors and commuter services were those likely to be most impacted. It was anticipated that the necessary costs of compliance (which would vary for different operators depending on their fleets) will be largely absorbed by vehicle owners within these sectors because of the very competitive markets in which they operate.
7.1. One in 3 out and Equivalent Annualised Net Direct Cost to Business
224. On 23 June 2016, the EU referendum took place and the people of the United Kingdom voted to leave the European Union. Until exit negotiations are concluded,
37 http://content.tfl.gov.uk/economic-impact-assessment-non-technical-summary.pdf
68
the UK remains a full member of the European Union and all the rights and obligations of EU membership remain in force.
225. The measure is a Non Qualifying Regulatory Provision which does not score against the Business Impact Target. This is because it implements obligations arising from Ambient Air Quality Directive 2008 and does not exceed the minimum requirements. This also means that it is out of scope of the One-in, Three-out rule. Local authorities already have the power to implement the measures needed to deliver Clean Air Zones in their areas although they have not used this power to date. The consultation is specifically around creating a consistent framework for Clean Air Zones and the power to mandate their introduction where that is required, the draft SI specifically names 5 cities, to ensure the UK reaches compliance in the shortest possible time. The Secretary of State will provide sign-off on schemes that deliver compliance. Any proposals to go beyond minimum requirements would be decided by the local authority with local consultation and would not be affected by these new powers. Therefore any such potential additional action is not captured within the analysis of this consultation, which only drives the minimum required level of action.
226. The national air quality plan for nitrogen dioxide sets out how the UK will deliver compliance with NO2 limits and was published and submitted to the Commission on 17 December 2015. Article 23 of the Air Quality Directive requires Member States to ensure that air quality plans are established for zones where level of pollutants are exceeded and attainment deadline is already expired. The plan sets out the measures required to ensure compliance in the shortest possible time. We consider that the measures in the UK plan will improve air quality to deliver compliance in all zones in the shortest possible time, projected outside London to be by 2020. Many individual zones may do so before 2020. For London, we consider that the measures in the plan, together with measures already in place, will improve air quality sufficiently in London to meet the requirements of the Directive by 2025. As the modelling provides five year snapshots of the air quality situation we have not been able to identify more precise zone by zone compliance dates. These measures ensure compliance in the minimum possible time to be consistent with the directive.
227. London is included in the policy line for this analysis. The analysis identifies the least cost package of measures that deliver compliance in London. Modelled action undertaken by London also does not go beyond the minimum requirements.
228. Table 7.1 summarises the Net Direct Cost to Business over the 10 year period of the different options.
7.2. Estimating Equivalent Annualised Net Direct Cost to Business 229. This measure will impose additional direct costs on business. The costs arise from
the impact of the Clean Air Zones. The following direct costs are monetised in this Impact Assessment:-
Trading up to a compliant vehicle
Transaction cost
69
Scrappage cost
Paying charge
Not making trips
Avoiding zone
230. This measure will also deliver benefits to business. These will result from improved air quality which will reduce the number of absences from work, distracted performance or employee deaths, which will impact on business productivity. Furthermore, there are vehicle flow benefits from consumer trips not taken which will result in reduced congestion, which will benefit consumers and businesses. However, these benefits are considered to result from secondary behaviour change, and are therefore not included within the EANCB calculations.
231. The behaviour change of redeploying vehicles has not been captured. Incorporating this for some businesses would reduce the total cost to business as switching fleets would ensure compliance at negligible cost.
232. Trading up to a compliant vehicle is valued as previously reported in the evidence section. This captures the difference in the upfront cost of trading up to a complaint vehicle, less the difference in resale value of that vehicle, less the benefits of owning a newer vehicle (captured using the rule of a half).
233. Transaction costs to business are estimated using the approach detailed previously.
234. Scrappage costs to business are estimating using the approach detailed previously.
235. The cost to business of paying the charge is not a social cost, as this delivers an equivalent benefit to Government in terms of revenue (the costs of infrastructure are captured elsewhere). This cost is, however, a direct cost to business. Charges are paid on a daily basis. Therefore, the charges are captured based on the estimated number of days non-compliant vehicles will enter the zone and pay the charge, multiplied by the value of the charge (based on London ULEZ proposed charges).
236. The cost of business trips not taken are not captured in the social cost benefit analysis in this IA, as the modelling assumes these trips are replaced by those of a compliant vehicle. However, there is a direct cost to those businesses that do not make their trips. The cost to these businesses is valued as per the approach set out for consumers. This identifies that the maximum loss of utility from a trip not taken must be less than the cost of the charge – otherwise the individual would pay the charge. The minimum loss of welfare for business will be close to zero – these will be for marginal trips which the business was almost indifferent to. We do not know the distribution of welfare between these two extremes so we assume that the benefits of these trips not taken are equally distributed between these points – consistent with DfT welfare approach. This means that the average loss of welfare for trips not taken can be assumed to be half the charge. As the charge is made on a daily basis. The total loss of welfare is estimated by multiplying the total number
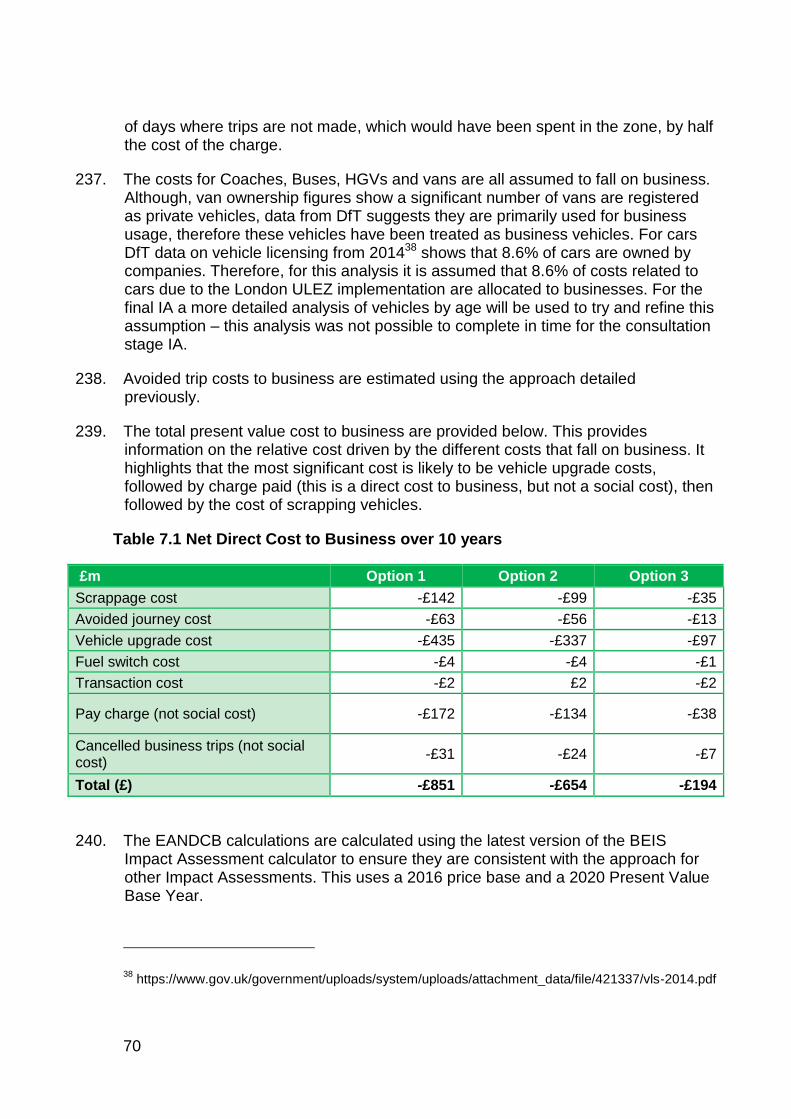
70
of days where trips are not made, which would have been spent in the zone, by half the cost of the charge.
237. The costs for Coaches, Buses, HGVs and vans are all assumed to fall on business. Although, van ownership figures show a significant number of vans are registered as private vehicles, data from DfT suggests they are primarily used for business usage, therefore these vehicles have been treated as business vehicles. For cars DfT data on vehicle licensing from 201438 shows that 8.6% of cars are owned by companies. Therefore, for this analysis it is assumed that 8.6% of costs related to cars due to the London ULEZ implementation are allocated to businesses. For the final IA a more detailed analysis of vehicles by age will be used to try and refine this assumption – this analysis was not possible to complete in time for the consultation stage IA.
238. Avoided trip costs to business are estimated using the approach detailed previously.
239. The total present value cost to business are provided below. This provides information on the relative cost driven by the different costs that fall on business. It highlights that the most significant cost is likely to be vehicle upgrade costs, followed by charge paid (this is a direct cost to business, but not a social cost), then followed by the cost of scrapping vehicles.
Table 7.1 Net Direct Cost to Business over 10 years
£m Option 1 Option 2 Option 3
Scrappage cost -£142 -£99 -£35
Avoided journey cost -£63 -£56 -£13
Vehicle upgrade cost -£435 -£337 -£97
Fuel switch cost -£4 -£4 -£1
Transaction cost -£2 £2 -£2
Pay charge (not social cost) -£172 -£134 -£38
Cancelled business trips (not social cost)
-£31 -£24 -£7
Total (£) -£851 -£654 -£194
240. The EANDCB calculations are calculated using the latest version of the BEIS Impact Assessment calculator to ensure they are consistent with the approach for other Impact Assessments. This uses a 2016 price base and a 2020 Present Value Base Year.
38 https://www.gov.uk/government/uploads/system/uploads/attachment_data/file/421337/vls-2014.pdf
71
7.3. Quantitative assessment of distributional impacts on business 241. The analysis undertaken to assess the impacts on small and micro business
identified that there would be a risk that there would be a disproportionate impact on small firms. Therefore, a high level analysis has been undertaken to assess the scale of this impact compared against the revenue. This analysis identified this impact is unlikely to be significant. Therefore, at this stage it is disproportionate to do additional analysis. Ahead of the final stage IA the aim is to explore proportionate routes to undertake a more detailed analysis of impacts on small and micro businesses. Further, as part of the consultation we will seek further information on the relative impact of these measures on small and micro businesses to supplement the information we have available from further analysis.
242. The enforcement of higher vehicle emission standards will lead to additional costs to businesses. Some businesses may be able to redeploy their existing fleet in order to comply with emission limits; however a significant proportion of businesses will need to replace their fleet or upgrade their non-compliant vehicles.
243. The exact impact on individual businesses will depend on the composition of their vehicle fleet, both in terms of the age as well as the type of vehicles. The overall business costs for each option has been assessed, based on the costs associated with upgrading or replacing each vehicle type:
Cars: Businesses own around 8.6 per cent of the total car fleet. It is therefore
assumed that an equal proportion of the total replacement cost of non-
compliant cars will fall on businesses. This is likely to be an overestimate, as
businesses tend to own newer vehicles on average and are therefore less
likely to incur costs of upgrading or replacing non-compliant vehicles39.
LGVs: DfT’s data shows ownership of LGVs is closely split between privately
owned (52 per cent) and company-registered vans (47 per cent). However,
the data also shows that the majority of privately owned vans are chiefly used
for business purposes (RAC Foundation, 2014). Given this, it is assumed that
the replacement cost of non-compliant LGVs falls on businesses. This
approach also leads to an overestimation of the costs to businesses.
HGVs: It is assumed all HGVs are owned by businesses. It is assumed that
most HGVs are upgraded to reach compliance, as the welfare loss of doing
so is less than alternative behaviour.
244. To understand the impacts on business as a proportion of GVA, the following methodology has been applied.
39 Although businesses own 8.6% of the fleet, they make up for 54 per cent of new car registrations.
Source: Vehicle Licensing Statistics Quarter 4 (Oct - Dec) (Department for Transport, 2015d:8)
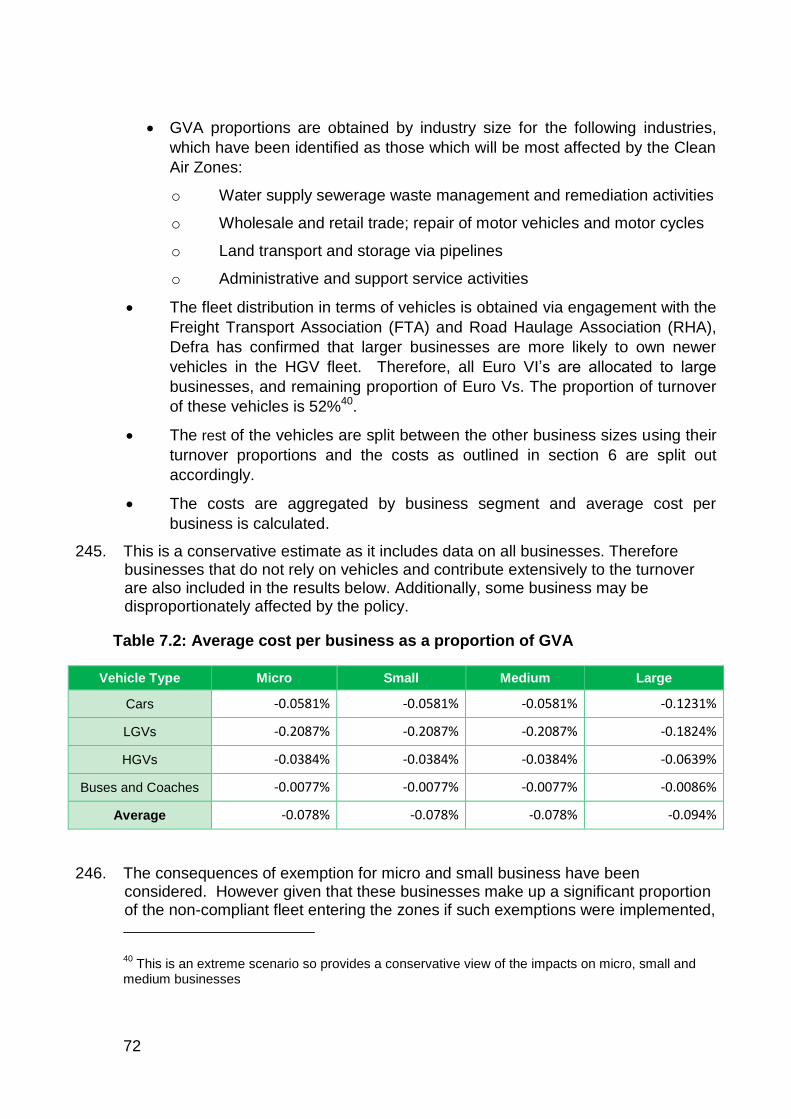
72
GVA proportions are obtained by industry size for the following industries,
which have been identified as those which will be most affected by the Clean
Air Zones:
o Water supply sewerage waste management and remediation activities
o Wholesale and retail trade; repair of motor vehicles and motor cycles
o Land transport and storage via pipelines
o Administrative and support service activities
The fleet distribution in terms of vehicles is obtained via engagement with the
Freight Transport Association (FTA) and Road Haulage Association (RHA),
Defra has confirmed that larger businesses are more likely to own newer
vehicles in the HGV fleet. Therefore, all Euro VI’s are allocated to large
businesses, and remaining proportion of Euro Vs. The proportion of turnover
of these vehicles is 52%40.
The rest of the vehicles are split between the other business sizes using their
turnover proportions and the costs as outlined in section 6 are split out
accordingly.
The costs are aggregated by business segment and average cost per
business is calculated.
245. This is a conservative estimate as it includes data on all businesses. Therefore businesses that do not rely on vehicles and contribute extensively to the turnover are also included in the results below. Additionally, some business may be disproportionately affected by the policy.
Table 7.2: Average cost per business as a proportion of GVA
Vehicle Type Micro Small Medium Large
Cars -0.0581% -0.0581% -0.0581% -0.1231%
LGVs -0.2087% -0.2087% -0.2087% -0.1824%
HGVs -0.0384% -0.0384% -0.0384% -0.0639%
Buses and Coaches -0.0077% -0.0077% -0.0077% -0.0086%
Average -0.078% -0.078% -0.078% -0.094%
246. The consequences of exemption for micro and small business have been considered. However given that these businesses make up a significant proportion of the non-compliant fleet entering the zones if such exemptions were implemented,
40 This is an extreme scenario so provides a conservative view of the impacts on micro, small and
medium businesses
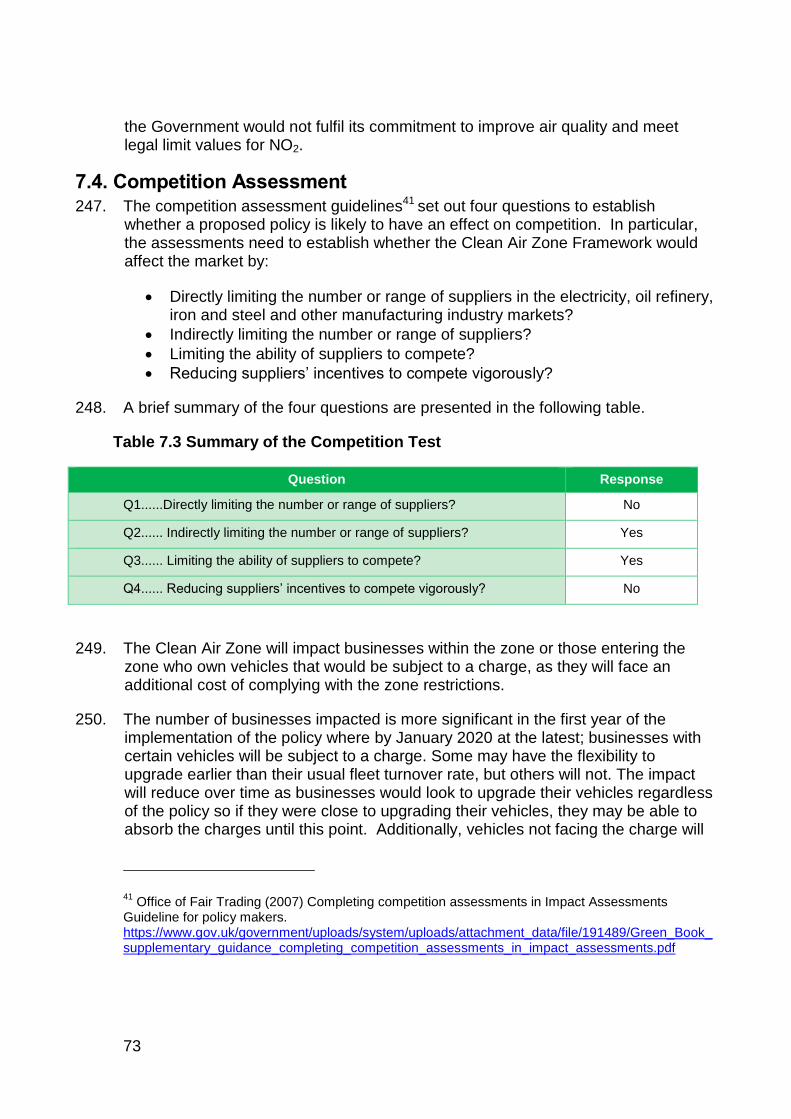
73
the Government would not fulfil its commitment to improve air quality and meet legal limit values for NO2.
7.4. Competition Assessment 247. The competition assessment guidelines41 set out four questions to establish
whether a proposed policy is likely to have an effect on competition. In particular, the assessments need to establish whether the Clean Air Zone Framework would affect the market by:
Directly limiting the number or range of suppliers in the electricity, oil refinery, iron and steel and other manufacturing industry markets?
Indirectly limiting the number or range of suppliers?
Limiting the ability of suppliers to compete?
Reducing suppliers’ incentives to compete vigorously?
248. A brief summary of the four questions are presented in the following table.
Table 7.3 Summary of the Competition Test
Question Response
Q1......Directly limiting the number or range of suppliers? No
Q2...... Indirectly limiting the number or range of suppliers? Yes
Q3...... Limiting the ability of suppliers to compete? Yes
Q4...... Reducing suppliers’ incentives to compete vigorously? No
249. The Clean Air Zone will impact businesses within the zone or those entering the zone who own vehicles that would be subject to a charge, as they will face an additional cost of complying with the zone restrictions.
250. The number of businesses impacted is more significant in the first year of the implementation of the policy where by January 2020 at the latest; businesses with certain vehicles will be subject to a charge. Some may have the flexibility to upgrade earlier than their usual fleet turnover rate, but others will not. The impact will reduce over time as businesses would look to upgrade their vehicles regardless of the policy so if they were close to upgrading their vehicles, they may be able to absorb the charges until this point. Additionally, vehicles not facing the charge will
41 Office of Fair Trading (2007) Completing competition assessments in Impact Assessments
Guideline for policy makers. https://www.gov.uk/government/uploads/system/uploads/attachment_data/file/191489/Green_Book_supplementary_guidance_completing_competition_assessments_in_impact_assessments.pdf
74
continue to represent an increasing proportion of overall available vehicles so it may become easier and cheaper to upgrade.
251. Businesses faced with the cost of changing their vehicles or paying the charge have several potential routes for absorbing the costs. Some may be able to absorb the cost as part of their revenue, while others may need to restructure. There will be some businesses that are unable to absorb these costs and may have to not make these journeys. Depending on the proportion of suppliers whose business is reliant on entering the zones, there may be a reduction in the number of suppliers by those who cannot absorb the change and face closure.
252. Those business owners, who have vehicles not faced with a charge, would also now have a competitive advantage where they are able to operate freely within the zone. These businesses may also have the potential to expand their businesses if routes become available from businesses unable to change their vehicle behaviour.
253. Restrictions on vehicles could also act as a market barrier for new entrants who now need to purchase a more expensive vehicle than they may previously have purchased. New entrants may already own these vehicles however, and will benefit from fewer competitors in the market, where firms exit if they are unable to change their vehicle behaviour.
75
8. Distributional Impacts on households and individuals 254. Any transport measure may impact positively or negatively on the owners and users
of the vehicles affected, and those living or operating in the area. This includes both people and businesses. Clean Air Zones could, for example, result in an increase in costs of services, changes to operating hours, or reduction in service; but as a result it could also lead to improved air quality, reduction in noise pollution and increased road safety in areas with reduced amount or speed of traffic.
8.1. Costs 255. As described in section 7, businesses may face increased costs as a result of Clean
Air Zones to their customers, and this may in turn affect households and individuals for example where products or services are increased in price or changed in another way as a result. These indirect impacts cannot be fully mapped, but the remainder of the section looks at how households and individuals could be affected by different vehicle types being targeted.
256. In the case of buses, companies may raise prices (although there is no evidence to suggest that those UK cities which have implemented LEZs have done so). They may also choose to offer a less frequent service as a result of increased costs. Data from DfT’s National Travel Survey (2014) indicates that those in lower income groups tend to make more bus trips than higher earners, with an average of 116 bus trips per person in 2013 in the lowest income group and 33 for the highest (data table NTS0705). Low income groups are also less likely to own a car; suggesting that these households would have fewer alternative modes of transport available were a bus service no longer available or too costly (data table NTS0703).
257. Road haulage companies delivering goods to businesses located within Clean Air Zones may pass on these costs to such businesses which in turn may pass these on to their customers. Businesses offering services using LGVs may also put up prices, depending on how competitive the market is and how much their competitors also face the same financial impact.
258. Were local authorities to introduce a Clean Air Zone charge for cars, this would mainly affect private owners as outlined above. Private ownership of cars is not distributed evenly by income (see annex D for definition of the income quintile groups):
Lower income groups tend to have marginally older vehicles. 71 percent of household cars in the lowest income quintile are over 6 years old, compared to 50 percent in the highest income quintile.
Number of trips by car increases with income with the highest income quintile undertaking almost twice the number of journeys of the lowest quintile.
Proportions of diesel cars are fairly close for all income groups. The middle income group is least likely to own diesel. Overall, around 3 in 10 households own a diesel car.
76
8.2. Benefits 259. More generally, improvements in air quality as a result of Clean Air Zones would
benefit those who are more vulnerable to air pollution or who live in areas where there is particular high air pollution: Poor air quality has a disproportionate effect on specific groups: in particular age, income and ethnicity. In children, it can affect lung development and increase likelihood of developing asthma.42 Adverse health impacts are experienced more commonly by people with pre-existing health conditions such as heart disease and asthma; thus older people, being more likely to have an existing medical condition than those in other age groups, are disproportionately impacted.43
260. Air pollution is also distributed unevenly, with urban areas tending to have higher concentrations of most pollutants. Such areas also contain a disproportionately high proportion of a number of equalities and distributional groups - including people with low incomes and from BME groups.44
42 Gehring et al (2013) ‘Air Pollution Exposure and Lung Function in Children: The ESCAPE Project’
http://ehp.niehs.nih.gov/1306770/
43 WHO (2013) ‘Review of evidence on health aspects of air pollution – REVIHAAP Project’
http://www.Euro.who.int/en/health-topics/environment-and-health/air-quality/publications/2013/review-of-evidence-on-health-aspects-of-air-pollution-revihaap-project-final-technical-report
44 Air Quality and Social Deprivation in the UK: an environmental inequalities analysis, 2006
http://uk-air.defra.gov.uk/reports/cat09/0701110944_AQinequalitiesFNL_AEAT_0506.pdf; and
Fecht et al (2014) ‘Associations between air pollution and socioeconomic characteristics, ethnicity and age profile of neighbourhoods in England and the Netherland’ http://dx.doi.org/10.1016/j.envpol.2014.12.014
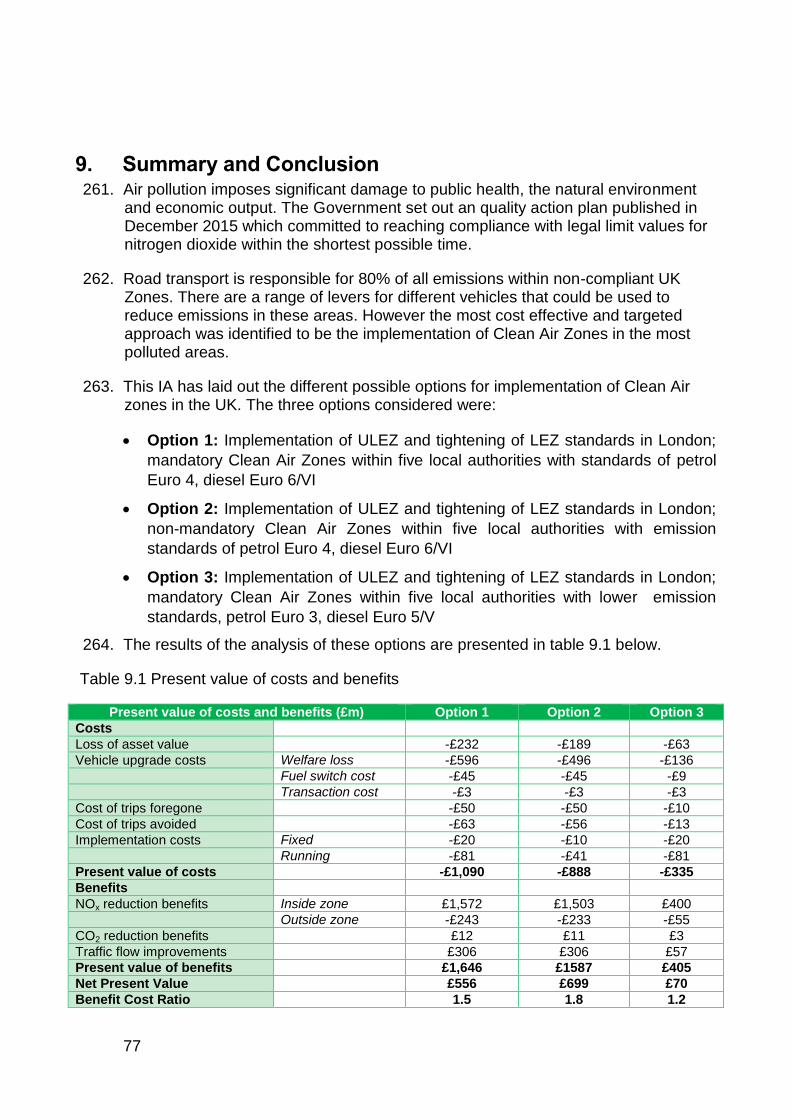
77
9. Summary and Conclusion 261. Air pollution imposes significant damage to public health, the natural environment
and economic output. The Government set out an quality action plan published in December 2015 which committed to reaching compliance with legal limit values for nitrogen dioxide within the shortest possible time.
262. Road transport is responsible for 80% of all emissions within non-compliant UK Zones. There are a range of levers for different vehicles that could be used to reduce emissions in these areas. However the most cost effective and targeted approach was identified to be the implementation of Clean Air Zones in the most polluted areas.
263. This IA has laid out the different possible options for implementation of Clean Air zones in the UK. The three options considered were:
Option 1: Implementation of ULEZ and tightening of LEZ standards in London;
mandatory Clean Air Zones within five local authorities with standards of petrol
Euro 4, diesel Euro 6/VI
Option 2: Implementation of ULEZ and tightening of LEZ standards in London;
non-mandatory Clean Air Zones within five local authorities with emission
standards of petrol Euro 4, diesel Euro 6/VI
Option 3: Implementation of ULEZ and tightening of LEZ standards in London;
mandatory Clean Air Zones within five local authorities with lower emission
standards, petrol Euro 3, diesel Euro 5/V
264. The results of the analysis of these options are presented in table 9.1 below.
Table 9.1 Present value of costs and benefits
Present value of costs and benefits (£m) Option 1 Option 2 Option 3
Costs
Loss of asset value -£232 -£189 -£63
Vehicle upgrade costs Welfare loss -£596 -£496 -£136
Fuel switch cost -£45 -£45 -£9
Transaction cost -£3 -£3 -£3
Cost of trips foregone -£50 -£50 -£10
Cost of trips avoided -£63 -£56 -£13
Implementation costs Fixed -£20 -£10 -£20
Running -£81 -£41 -£81
Present value of costs -£1,090 -£888 -£335
Benefits
NOx reduction benefits Inside zone £1,572 £1,503 £400
Outside zone -£243 -£233 -£55
CO2 reduction benefits £12 £11 £3
Traffic flow improvements £306 £306 £57
Present value of benefits £1,646 £1587 £405
Net Present Value £556 £699 £70
Benefit Cost Ratio 1.5 1.8 1.2
78
265. Option 1 is the preferred option for three key reasons. Firstly it provides the greatest protection of public health, delivering air quality improvements valued at over £1.3 billion with additional benefits in reducing carbon emissions and improving traffic flow in key urban areas. It also clearly demonstrates the commitment to protecting and improving this essential national natural asset. Finally it also provides the greatest certainty of delivering our legal obligations around NO2.
266. The impacts assessed here have been based on Defra’s best estimate of how the Clean Air Zones will be implemented. However, it is recognised that there are a range of uncertainties around the modelling, implementation and delivery of the preferred option. Therefore this is not the end of the development process. Scoping studies will be essential for local authorities to determine the detailed placement of a Clean Air Zone, assess and mitigate the risk of displaced traffic, and determine the package of measures that are most cost effective and suitable to local conditions to deliver compliance in all cities. Scoping studies will need to address issues such as the optimal charge level that will prompt the appropriate location-specific behavioural response. They will also need to consider plans for collecting appropriate data to monitor and evaluate the effectiveness of the measures and any unintended consequences.
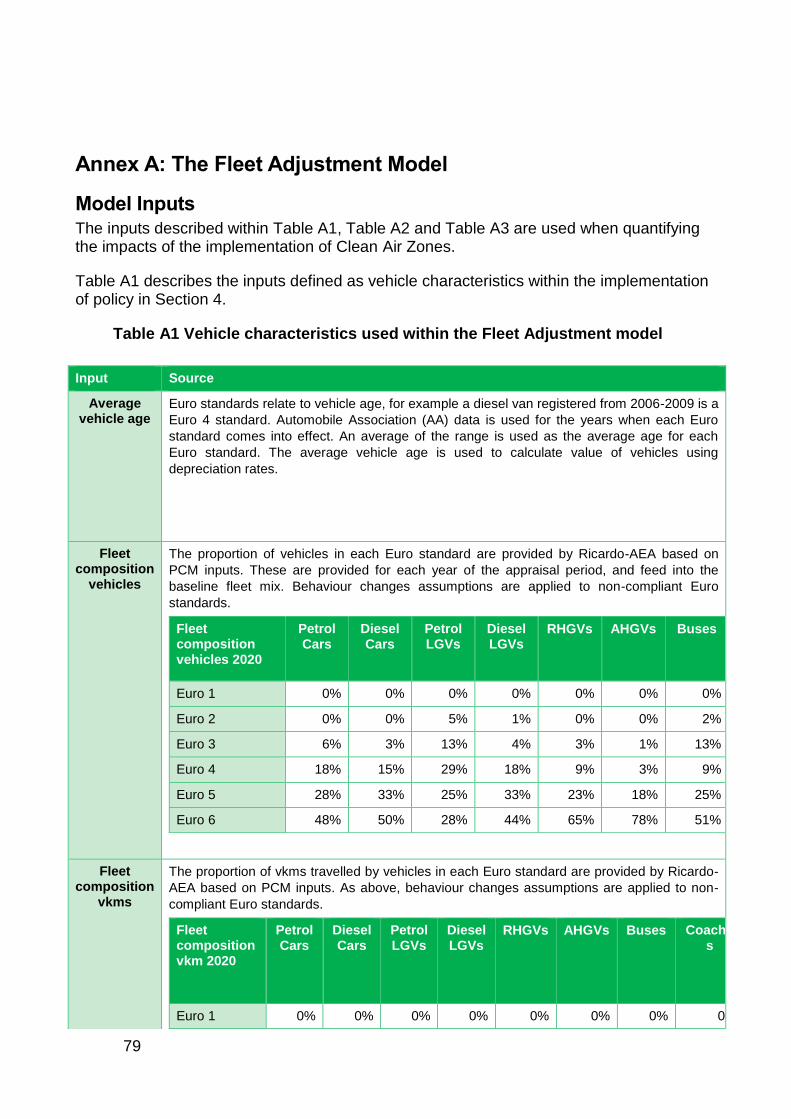
79
Annex A: The Fleet Adjustment Model
Model Inputs The inputs described within Table A1, Table A2 and Table A3 are used when quantifying the impacts of the implementation of Clean Air Zones.
Table A1 describes the inputs defined as vehicle characteristics within the implementation of policy in Section 4.
Table A1 Vehicle characteristics used within the Fleet Adjustment model
Input Source
Average vehicle age
Euro standards relate to vehicle age, for example a diesel van registered from 2006-2009 is a
Euro 4 standard. Automobile Association (AA) data is used for the years when each Euro
standard comes into effect. An average of the range is used as the average age for each
Euro standard. The average vehicle age is used to calculate value of vehicles using
depreciation rates.
Fleet composition
vehicles
The proportion of vehicles in each Euro standard are provided by Ricardo-AEA based on
PCM inputs. These are provided for each year of the appraisal period, and feed into the
baseline fleet mix. Behaviour changes assumptions are applied to non-compliant Euro
standards.
Fleet composition vehicles 2020
Petrol Cars
Diesel Cars
Petrol LGVs
Diesel LGVs
RHGVs AHGVs Buses Coaches
Euro 1 0% 0% 0% 0% 0% 0% 0% 0%
Euro 2 0% 0% 5% 1% 0% 0% 2% 2%
Euro 3 6% 3% 13% 4% 3% 1% 13% 13%
Euro 4 18% 15% 29% 18% 9% 3% 9% 9%
Euro 5 28% 33% 25% 33% 23% 18% 25% 25%
Euro 6 48% 50% 28% 44% 65% 78% 51% 51%
Fleet composition
vkms
The proportion of vkms travelled by vehicles in each Euro standard are provided by Ricardo-
AEA based on PCM inputs. As above, behaviour changes assumptions are applied to non-
compliant Euro standards.
Fleet composition vkm 2020
Petrol Cars
Diesel Cars
Petrol LGVs
Diesel LGVs
RHGVs AHGVs Buses Coaches
Euro 1 0% 0% 0% 0% 0% 0% 0% 0%
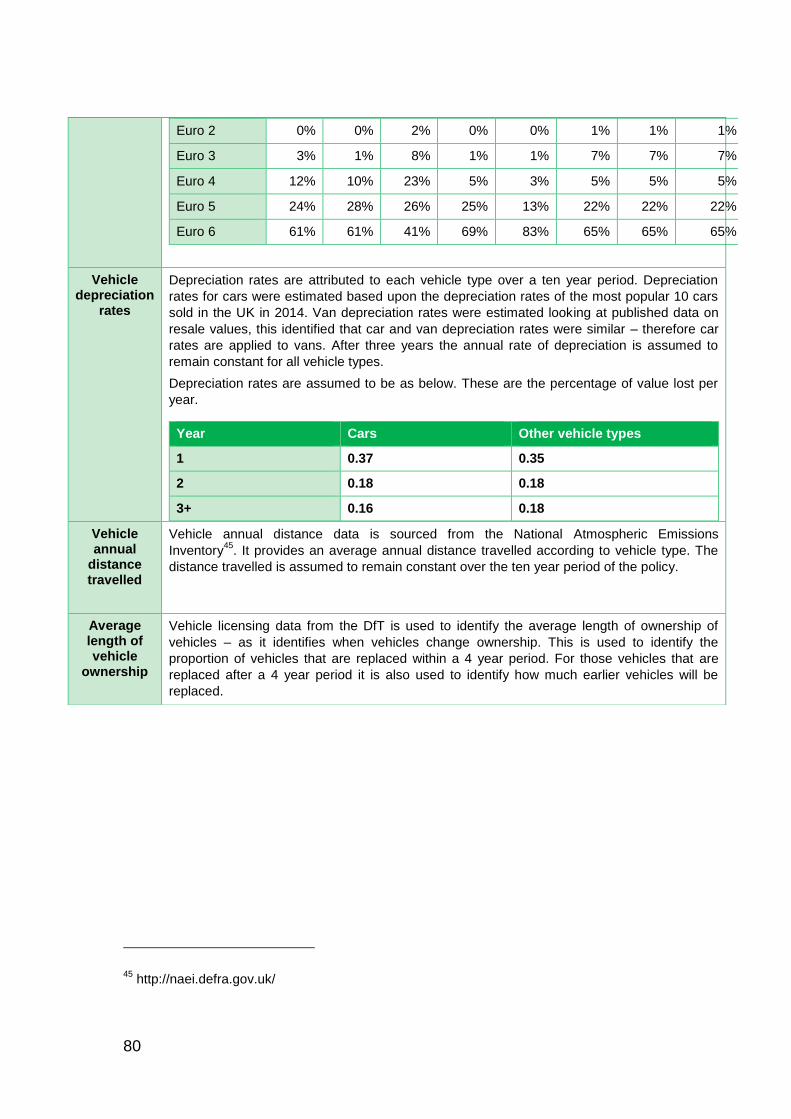
80
45 http://naei.defra.gov.uk/
Euro 2 0% 0% 2% 0% 0% 1% 1% 1%
Euro 3 3% 1% 8% 1% 1% 7% 7% 7%
Euro 4 12% 10% 23% 5% 3% 5% 5% 5%
Euro 5 24% 28% 26% 25% 13% 22% 22% 22%
Euro 6 61% 61% 41% 69% 83% 65% 65% 65%
Vehicle depreciation
rates
Depreciation rates are attributed to each vehicle type over a ten year period. Depreciation
rates for cars were estimated based upon the depreciation rates of the most popular 10 cars
sold in the UK in 2014. Van depreciation rates were estimated looking at published data on
resale values, this identified that car and van depreciation rates were similar – therefore car
rates are applied to vans. After three years the annual rate of depreciation is assumed to
remain constant for all vehicle types.
Depreciation rates are assumed to be as below. These are the percentage of value lost per
year.
Year Cars Other vehicle types
1 0.37 0.35
2 0.18 0.18
3+ 0.16 0.18
Vehicle annual
distance travelled
Vehicle annual distance data is sourced from the National Atmospheric Emissions
Inventory45
. It provides an average annual distance travelled according to vehicle type. The
distance travelled is assumed to remain constant over the ten year period of the policy.
Average length of vehicle
ownership
Vehicle licensing data from the DfT is used to identify the average length of ownership of
vehicles – as it identifies when vehicles change ownership. This is used to identify the
proportion of vehicles that are replaced within a 4 year period. For those vehicles that are
replaced after a 4 year period it is also used to identify how much earlier vehicles will be
replaced.
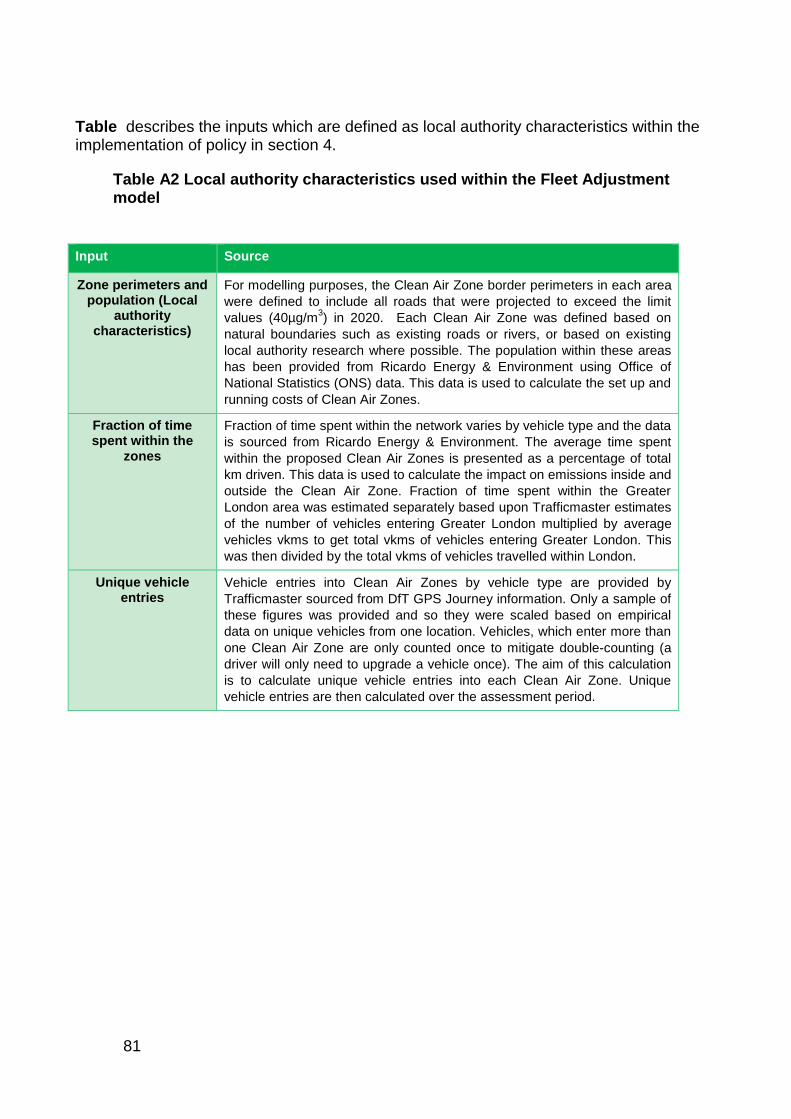
81
Table describes the inputs which are defined as local authority characteristics within the implementation of policy in section 4.
Table A2 Local authority characteristics used within the Fleet Adjustment model
Input Source
Zone perimeters and population (Local
authority characteristics)
For modelling purposes, the Clean Air Zone border perimeters in each area
were defined to include all roads that were projected to exceed the limit
values (40µg/m3) in 2020. Each Clean Air Zone was defined based on
natural boundaries such as existing roads or rivers, or based on existing
local authority research where possible. The population within these areas
has been provided from Ricardo Energy & Environment using Office of
National Statistics (ONS) data. This data is used to calculate the set up and
running costs of Clean Air Zones.
Fraction of time spent within the
zones
Fraction of time spent within the network varies by vehicle type and the data
is sourced from Ricardo Energy & Environment. The average time spent
within the proposed Clean Air Zones is presented as a percentage of total
km driven. This data is used to calculate the impact on emissions inside and
outside the Clean Air Zone. Fraction of time spent within the Greater
London area was estimated separately based upon Trafficmaster estimates
of the number of vehicles entering Greater London multiplied by average
vehicles vkms to get total vkms of vehicles entering Greater London. This
was then divided by the total vkms of vehicles travelled within London.
Unique vehicle entries
Vehicle entries into Clean Air Zones by vehicle type are provided by
Trafficmaster sourced from DfT GPS Journey information. Only a sample of
these figures was provided and so they were scaled based on empirical
data on unique vehicles from one location. Vehicles, which enter more than
one Clean Air Zone are only counted once to mitigate double-counting (a
driver will only need to upgrade a vehicle once). The aim of this calculation
is to calculate unique vehicle entries into each Clean Air Zone. Unique
vehicle entries are then calculated over the assessment period.
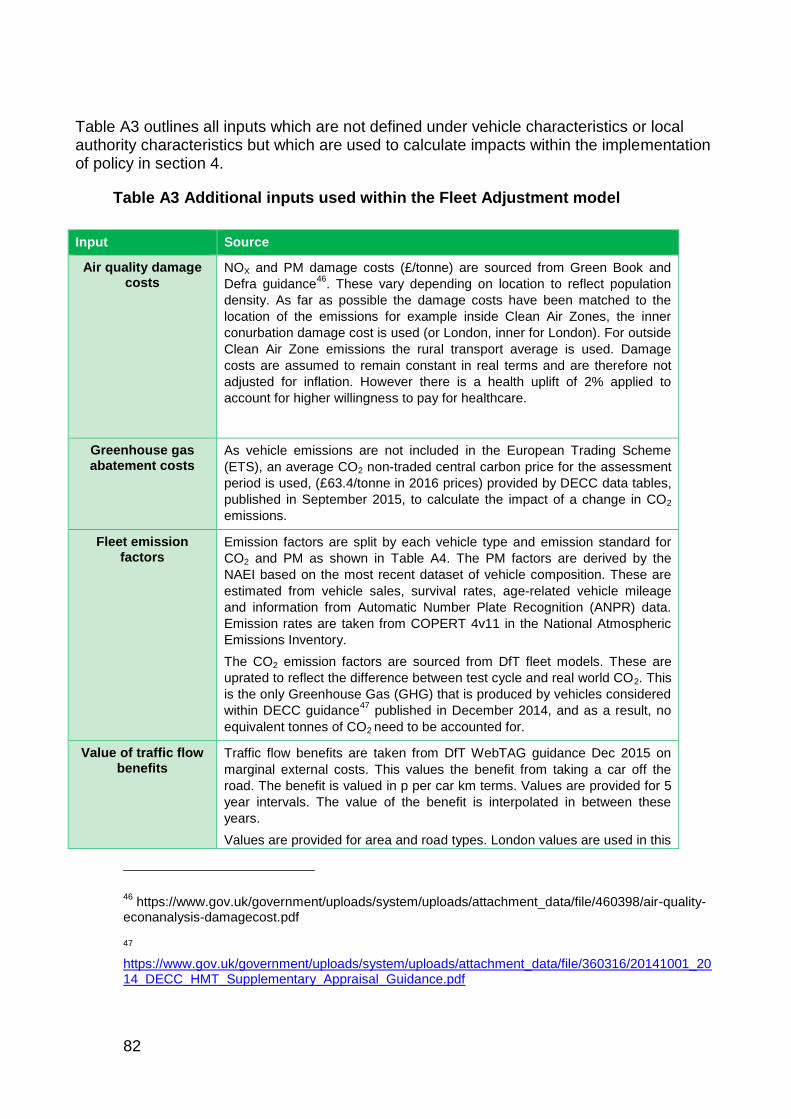
82
Table A3 outlines all inputs which are not defined under vehicle characteristics or local authority characteristics but which are used to calculate impacts within the implementation of policy in section 4.
Table A3 Additional inputs used within the Fleet Adjustment model
46 https://www.gov.uk/government/uploads/system/uploads/attachment_data/file/460398/air-quality-
econanalysis-damagecost.pdf
47
https://www.gov.uk/government/uploads/system/uploads/attachment_data/file/360316/20141001_2014_DECC_HMT_Supplementary_Appraisal_Guidance.pdf
Input Source
Air quality damage costs
NOX and PM damage costs (£/tonne) are sourced from Green Book and
Defra guidance46
. These vary depending on location to reflect population
density. As far as possible the damage costs have been matched to the
location of the emissions for example inside Clean Air Zones, the inner
conurbation damage cost is used (or London, inner for London). For outside
Clean Air Zone emissions the rural transport average is used. Damage
costs are assumed to remain constant in real terms and are therefore not
adjusted for inflation. However there is a health uplift of 2% applied to
account for higher willingness to pay for healthcare.
Greenhouse gas abatement costs
As vehicle emissions are not included in the European Trading Scheme
(ETS), an average CO2 non-traded central carbon price for the assessment
period is used, (£63.4/tonne in 2016 prices) provided by DECC data tables,
published in September 2015, to calculate the impact of a change in CO2
emissions.
Fleet emission factors
Emission factors are split by each vehicle type and emission standard for
CO2 and PM as shown in Table A4. The PM factors are derived by the
NAEI based on the most recent dataset of vehicle composition. These are
estimated from vehicle sales, survival rates, age-related vehicle mileage
and information from Automatic Number Plate Recognition (ANPR) data.
Emission rates are taken from COPERT 4v11 in the National Atmospheric
Emissions Inventory.
The CO2 emission factors are sourced from DfT fleet models. These are
uprated to reflect the difference between test cycle and real world CO2. This
is the only Greenhouse Gas (GHG) that is produced by vehicles considered
within DECC guidance47
published in December 2014, and as a result, no
equivalent tonnes of CO2 need to be accounted for.
Value of traffic flow benefits
Traffic flow benefits are taken from DfT WebTAG guidance Dec 2015 on
marginal external costs. This values the benefit from taking a car off the
road. The benefit is valued in p per car km terms. Values are provided for 5
year intervals. The value of the benefit is interpolated in between these
years.
Values are provided for area and road types. London values are used in this
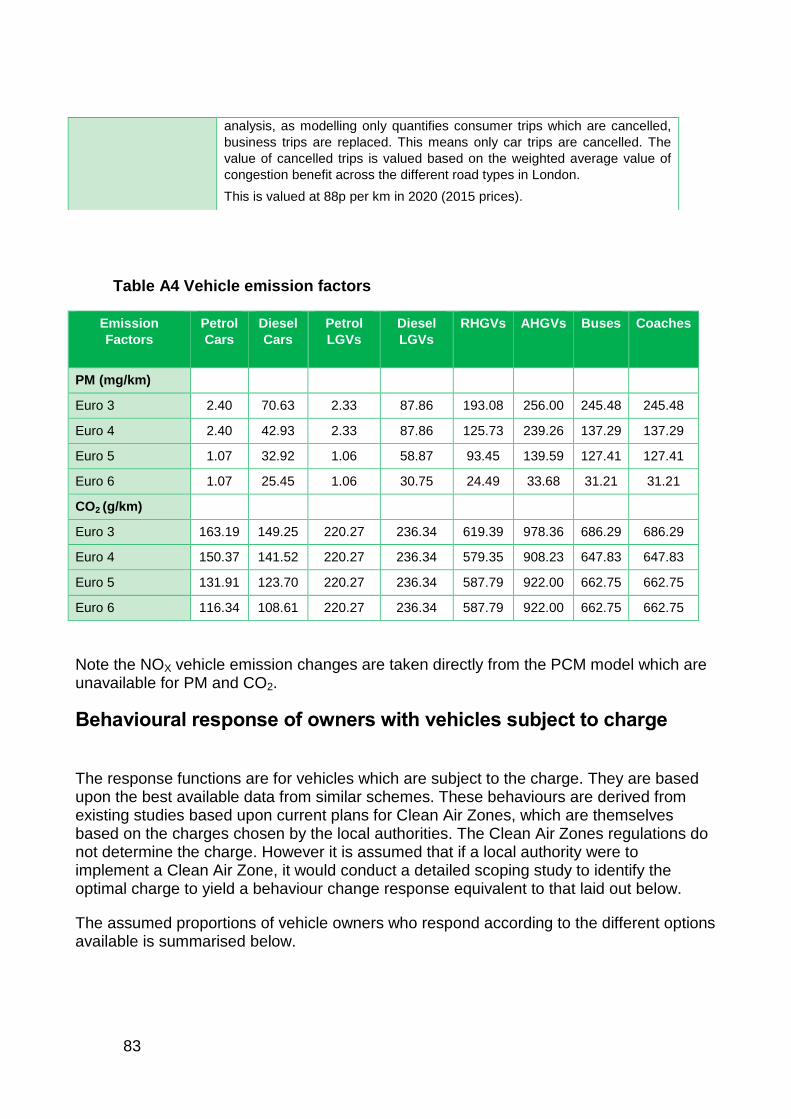
83
Table A4 Vehicle emission factors
Emission
Factors
Petrol
Cars
Diesel
Cars
Petrol
LGVs
Diesel
LGVs
RHGVs AHGVs Buses Coaches
PM (mg/km)
Euro 3 2.40 70.63 2.33 87.86 193.08 256.00 245.48 245.48
Euro 4 2.40 42.93 2.33 87.86 125.73 239.26 137.29 137.29
Euro 5 1.07 32.92 1.06 58.87 93.45 139.59 127.41 127.41
Euro 6 1.07 25.45 1.06 30.75 24.49 33.68 31.21 31.21
CO2 (g/km)
Euro 3 163.19 149.25 220.27 236.34 619.39 978.36 686.29 686.29
Euro 4 150.37 141.52 220.27 236.34 579.35 908.23 647.83 647.83
Euro 5 131.91 123.70 220.27 236.34 587.79 922.00 662.75 662.75
Euro 6 116.34 108.61 220.27 236.34 587.79 922.00 662.75 662.75
Note the NOX vehicle emission changes are taken directly from the PCM model which are unavailable for PM and CO2.
Behavioural response of owners with vehicles subject to charge
The response functions are for vehicles which are subject to the charge. They are based upon the best available data from similar schemes. These behaviours are derived from existing studies based upon current plans for Clean Air Zones, which are themselves based on the charges chosen by the local authorities. The Clean Air Zones regulations do not determine the charge. However it is assumed that if a local authority were to implement a Clean Air Zone, it would conduct a detailed scoping study to identify the optimal charge to yield a behaviour change response equivalent to that laid out below.
The assumed proportions of vehicle owners who respond according to the different options available is summarised below.
analysis, as modelling only quantifies consumer trips which are cancelled,
business trips are replaced. This means only car trips are cancelled. The
value of cancelled trips is valued based on the weighted average value of
congestion benefit across the different road types in London.
This is valued at 88p per km in 2020 (2015 prices).
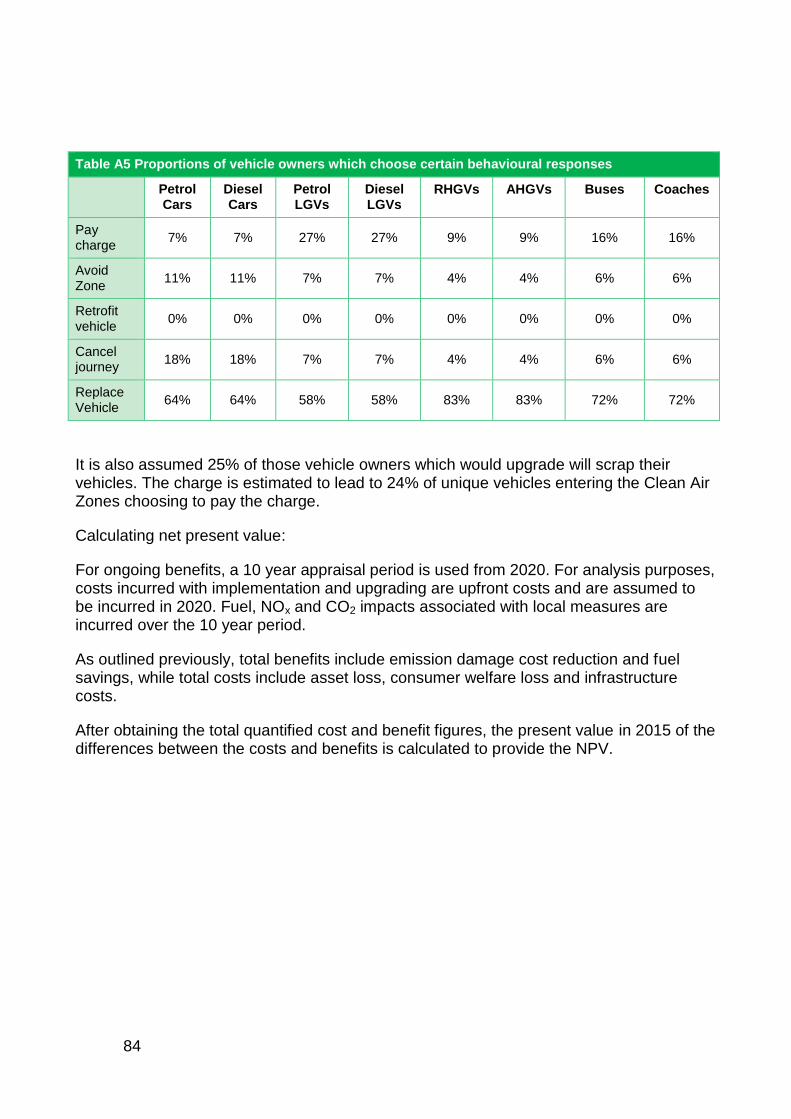
84
Table A5 Proportions of vehicle owners which choose certain behavioural responses
Petrol Cars
Diesel Cars
Petrol LGVs
Diesel LGVs
RHGVs AHGVs Buses Coaches
Pay charge
7% 7% 27% 27% 9% 9% 16% 16%
Avoid Zone
11% 11% 7% 7% 4% 4% 6% 6%
Retrofit vehicle
0% 0% 0% 0% 0% 0% 0% 0%
Cancel journey
18% 18% 7% 7% 4% 4% 6% 6%
Replace Vehicle
64% 64% 58% 58% 83% 83% 72% 72%
It is also assumed 25% of those vehicle owners which would upgrade will scrap their vehicles. The charge is estimated to lead to 24% of unique vehicles entering the Clean Air Zones choosing to pay the charge.
Calculating net present value:
For ongoing benefits, a 10 year appraisal period is used from 2020. For analysis purposes, costs incurred with implementation and upgrading are upfront costs and are assumed to be incurred in 2020. Fuel, NOx and CO2 impacts associated with local measures are incurred over the 10 year period.
As outlined previously, total benefits include emission damage cost reduction and fuel savings, while total costs include asset loss, consumer welfare loss and infrastructure costs.
After obtaining the total quantified cost and benefit figures, the present value in 2015 of the differences between the costs and benefits is calculated to provide the NPV.
85
Annex B: Summary of PCM Model The PCM model is a group of models used to calculate pollutant emissions and concentrations on a range of geographical scales; for simplicity we will refer to this group of models as ‘the PCM model’.
It is not a full chemistry transport model; it is a collection of various model layers including interpolated measurements, dispersion models and emissions scenarios combined within GIS.
Emissions to air are regulated in terms of nitrogen oxides (NOx), which is the term used to describe the sum of nitric oxide (NO) and nitrogen dioxide (NO2).
The PCM modelling for NOx is underpinned by NOx emission estimates from the National Atmospheric Emissions Inventory (NAEI). The NAEI provides emissions data from a wide range of sources48 which are categorised according to whether they are point sources, area sources or local sources.
Emissions estimates are calculated based on road traffic emission factors from COPERT 4v1149. This is the recommended method for calculating vehicle emissions by the European Monitoring and Evaluation Programme and the European Environment Agency Emissions Inventory Guidebook. However, there are still uncertainties in emissions estimates for some current vehicle types and Euro standards.
The modelling assessment to support this Impact Assessment uses a base (reference) year of 2013 – this is the most recent modelled annual compliance assessment available when the modelling assessment was conducted, and the year for which the model is calibrated using measurement data.
The model works in five year increments, with emissions and concentrations projected forward from the base year for 2020, 2025 and 2030. These projections constitute an estimated counterfactual where no further action has been taken.
The baseline projections incorporate estimates of emissions from all sources within the emissions inventory, including:
Transport sources including upcoming Euro standards
Business emissions including those covered by the Industrial Emissions Directive
Domestic combustion such as in boilers
48 http://naei.defra.gov.uk/
49 COPERT 4 v11.0 released in September 2014 and the accompany report “Update of the Air Emissions
Inventory Guidebook – Road Transport 2014 Update” can be downloaded at http://www.emisia.com/sites/default/files/files/COPERT4_v11_0.pdf and emission factors are provided directly via personal communication.

86
The PCM model is robust and detailed but this complexity requires significant computation, taking around three months to run scenarios. Therefore, to enable more flexible assessments, supplementary analysis has been undertaken using a simplified version of the full PCM model, known as the Streamlined PCM model.
87
Annex C: ITS Leeds Paper on Valuation of Welfare Loss 267. Following the publication of the plan, a peer review was funded by DfT, as part of
the work for the Joint Air Quality Unit (DfT and DEFRA), to review the different potential methods for measuring the welfare impacts of one of these responses – the switch to a compliant vehicle.
268. The consultant developing the methodology was Tom Worsley of ITS Leeds. He was selected because of his significant expertise in modelling and valuation of impacts from Transport schemes. Tom Worsley joined ITS as Visiting Fellow in June 2011, following his retirement from the Department for Transport (DfT). He has held a number of senior economist posts during his career. He was responsible for setting up NATA (the New Approach to Appraisal) in 1997 and for the development of the Department’s National Transport Model in 2000/1. When the Rail Group was established by the Department in 2005, he led the team responsible for Network Modelling Framework, a forecasting model used to provide the evidence to inform the 2007 Rail White Paper and High Level Output Specification (HLOS).
269. The paper produced by Tom Worsley is published in full below.
Introduction 270. In December 2015, DEFRA published a detailed plan50 for improving air quality and
a supporting technical report to demonstrate how this plan would safeguard human health and meet the legal obligations.
271. The technical report51 intended to encapsulate the welfare costs faced by those whose vehicle choices are affected by the implementation of a Clean Air Zone. This was captured through simulating vehicle driver’s behaviour when faced with Clean Air Zone restrictions. Using best available data (TfL ULEZ report), these responses were as follows:
Switch to a compliant vehicle
Pay a charge and continue to enter zone with a non-compliant vehicle
Cease driving within Clean Air Zone
Redeploy vehicles if part of a fleet
Retrofit
50 https://www.gov.uk/government/publications/air-quality-in-the-uk-plan-to-reduce-nitrogen-dioxide-
emissions
51 https://www.gov.uk/government/uploads/system/uploads/attachment_data/file/492901/aq-plan-
2015-technical-report.pdf
88
Overview of approaches 272. Initial thinking considered a macro approach. This estimated the aggregate loss of
value of the oldest vehicles which exited the fleet, and aggregate increase in value of new vehicles entering the fleet as a result of the policy. However, an estimate of this aggregate effect fails to distinguish how the impact of the policy varies between different segments of the vehicle owning population and the distributional impacts, which are of relevance to policy makers. As a result, this approach wasn’t considered further.
273. Following this, two main approaches were identified. The first is the financial cost approach, focusing on the additional costs incurred directly by vehicle owners as a consequence of the policy. This accounts for differences in costs between non-compliant vehicles and newly purchased compliant vehicles, such as difference in market price/resale value, maintenance and operation costs. The extent to which these factors can be accounted for depends on the availability of data and on the discount value that vehicle owners place on future costs and benefits when compared with present. It is data intensive requiring a large amount of data on vehicle characteristics and costs by age. It also does not value the non-financial benefits of owning a newer vehicle, which for individuals may include prestige and for companies may be associated with better branding.
274. The second method, the welfare approach, focuses on the loss of benefit or consumer surplus experienced by the vehicle owner when selling a non-compliant vehicle and replace it with, in most cases, a more expensive compliant vehicle. The welfare approach uses a simplification to capture the benefits of owning a newer vehicle – the rule of a half. However, it has a number of benefits, it requires less data as elements such as maintenance and operating costs are inherently valued within consumer surplus. It also captures all the benefits of upgrading to a newer vehicle, including improved fuel economy, lower maintenance costs and better driveability when compared to their existing vehicle.
275. There are strong reasons for preferring a welfare based approach to valuing the impacts of the implementation of a Clean Air Zone on those vehicle owners who switch to a compliant vehicle. It is more consistent with air quality policy benefits valuation, which is based on quality of life rather than on purely financial considerations, and is likely to yield more accurate results given lack of robust data for the financial cost approach. However, there may be a case for using the financial cost approach in the case of vehicles owned and used by businesses: this is discussed in detail in sections below.
89
Background to Transport Appraisal 276. In accordance with HM Treasury Green Book guidance52 it is important that new
policy is assessed for the impact it has on social welfare and the impact on society as a whole. This is usually undertaken with one of two approaches, top down or bottom-up. A macro approach considers the impact of the scheme from a top down approach, which for this scheme would look at the asset cost of the total UK fleet and how the policy would change this by altering the composition of the fleet. However this approach does not consider the distributional impacts of the policy. Government appraisal endeavours to fully comprehend how the policy would impact each member of society which, for this policy, would be the impact to each vehicle owner rather than the fleet as a whole. As a result of this, a micro approach was preferred and is demonstrated in all further options.
277. In a typical DfT approach to appraising a transport scheme, the benefits to users of the scheme are captured through gaining savings in travel time, reductions in the level of crowding in the case of rail projects and changes in vehicle operating costs. These impacts are valued against a yardstick of willingness to pay for these improvements, since for a number of reasons transport infrastructure rarely earns a financial return sufficient to reflect all of the benefits of the scheme. As detailed in DfT’s WebTAG53, the consumer surplus in standard welfare-based transport appraisal is estimated considering the difference between what transport users are willing to pay and what they actually pay, in time, convenience and other expenses for the change in travel costs. Projects where the benefits exceed the costs by a sufficient margin are judged to provide good value for money.
Consumer Surplus approach 278. Similar to the DfT WebTAG approach, a consumer surplus-based measure of the
change in economic welfare can equally be applied to estimating the impact of policies aimed at inducing vehicle owners to upgrade to a compliant vehicle. Those vehicle owners, who decide to change their vehicle, experience a loss of welfare as they are being obliged to spend money on the purchase of a compliant newer vehicle, rather than on other goods and services which rates higher in their preferences. If they expect to gain more benefit from the use of a compliant vehicle than they obtain from other goods and services of equal cost, then they would have made the change of vehicle before being obliged to do so by the regulation.
52 HMT Green Book
https://www.gov.uk/government/uploads/system/uploads/attachment_data/file/220541/green_book_complete.pdf
53 DfT Web-based Transport Analysis Guidance https://www.gov.uk/guidance/transport-analysis-
guidance-webtag
90
279. Some vehicle owners experience only minimal welfare loss when upgrading to a more modern compliant vehicle. These vehicle owners were on the verge of upgrading before the policy was implemented and therefore would not be significantly disadvantaged by doing so under the policy scenario. But others experience a loss in welfare equivalent to the full difference between the price of an equivalent compliant vehicle and the one owned previously. This may be because they drove relatively little and care less about the difference in attributes between their current vehicle and a modern compliant vehicle, or they may have constrained household budgets. In the absence of detailed knowledge about the shape of the demand curve, it has been common practice in transport appraisal to assume a linear function and so the average loss to the vehicle owner, who changes their vehicle, is half of the difference in the market price between the old and the replacement vehicle (“the rule of a half”).
280. The assumption here is that the newer vehicle typically provides some additional benefits to its owner. Clearly if the only difference in the compliant vehicle was its compliance with the policy, then the loss of consumer surplus would be the full difference in price as the purchaser gets no benefit from the vehicle only having a higher Euro standard. However, in the majority of cases, a newer compliant vehicle will provide both qualitative benefits and financial benefits to the owner. These financial benefits come in terms of lower maintenance costs, fuel savings and, a higher resale value when eventually sold on.
281. In principle, these are no different from the qualitative advantages of acquiring a newer compliant vehicle. As long as it is assumed that vehicle owners have good enough information about the attributes of the vehicle and its performance and that they have access to finance to make the purchase, they will factor these benefits into their decision about whether and when to replace their vehicle which may give argument to using the alternative financial cost approach. However, there are several reasons for this potential difference between the two approaches – the rate at which the upgrading vehicle owners discount future savings may be very much higher than the rate used to inform public sector decisions, the mileages that they drive may be low and thus deliver comparably lower savings than the average owner, or the costs of making the change, in terms of overcoming inertia and the costs of the transaction may be significant.
282. The regulation also imposes a second round impact on those who decide to switch to a compliant vehicle. Use of non-compliant vehicles has been restricted by the policy so their market price will fall. This reduction in the market price is a loss of welfare to all vehicle owners who upgrade. Each seller of a non-compliant vehicle receives less for that vehicle than would have been the case in absence of the new regulation.
91
283. While each vendor of a non-compliant vehicle experiences a loss of welfare equivalent to the full reduction in the market price, the purchasers of these vehicles gain a benefit because they can now buy a vehicle that suits their requirements at a lower price than prior to the policy. Prior to the policy being implemented, some purchasers would have been almost indifferent between upgrading their vehicle and not, and therefore would gain an amount of utility close to the entire difference between the new and the pre-regulation price when purchasing a non-compliant vehicle at the reduced price, while others gain less, with purchasers at the margin being indifferent as to whether to change the vehicle owned or not.
284. The size of the benefits to the purchasers of non-compliant vehicles depends on the number of vehicles traded and the extent of the reduction in price. If demand in this segment of the market is very elastic, then the price reduction will be small since the vendors of non-compliant vehicles will find many potential purchasers who are willing to trade. But if demand is less elastic, the reduction in price will be greater, as will be the loss to sellers of non-compliant vehicles and the benefit of price reduction to those who buy these vehicles.
285. The loss of consumer surplus for those who are obliged to switch to a compliant vehicle therefore includes the entire reduction in the market value of their original vehicle. Offsetting this is the benefit of the reduction in market prices to those who, because of this fall in prices, decide to purchase such a vehicle.
286. Thus there is a triangle of benefit representing the range of losses of consumer surplus on account of the obligation to buy a compliant vehicle, a rectangle representing the loss to all owners of non-compliant vehicles when their market price is reduced by the regulation, and partially offsetting this market price based loss is a triangle which measures the welfare gains to the purchasers of these vehicles.
9.1.1. Societal welfare cost vs individual welfare cost
287. The application of the welfare based approach raises the question of whether the impacts to be valued are taken from the standpoint of the individuals who are making the changes in vehicle ownership, or from the perspective of society of how those impacts should be valued. This issue is relevant to the discount rate used when comparing present day costs or benefits with those that occur in the future. For example, some of those who decide to purchase a compliant vehicle might take little account of the higher resale value of that vehicle at some future date because short term financial considerations outweigh any longer term benefits when they make the decision. But from the perspective of society as a whole, the longer term carries a greater weight and the rates used to discount future costs and benefits to
92
society are significantly lower than those which might apply to the owners of non-compliant vehicles who decide to purchase a compliant one.
288. There is a strong case for considering the societal welfare cost rather than attempting to take account of the financial and other circumstances of the individuals who are induced to change the vehicle they own. Such an approach is consistent with HMT’s Green Book, which sets out the appropriate social discount rate to use for policy and project appraisal. It also ensures that a common method is used for valuing both the costs and the benefits of the policy as they occur over time. Moreover, there is no obvious source of information about the discount rate that would be appropriate for that segment of the population that is obliged by the policy to buy a compliant vehicle. For the purposes of establishing an appropriate methodology for estimating the social cost of a Clean Air Zone to vehicle owners, we recommend the welfare based approach which makes use of a Green Book consistent discount rate.
9.1.2. Transaction costs
289. All those who change their vehicle also experience a one-off transaction cost. This may consist of the margin earned by the dealer in the case of those vehicles that are traded through an intermediary. Where owners opt for a direct sale, even if the financial cost of the transaction is small, both buyer and seller incur search costs since finding a suitable vehicle and establishing its quality takes time and often requires expert advice. It also captures administrative costs, such as changing the ownership document, parking permit and insurance details are part of this transaction cost. For those who were in any case close to changing vehicle in the baseline, the welfare loss is small since they were already prepared for such costs, whereas for others the cost weighs more in their decision. Thus the welfare loss experienced by the average purchaser can be considered to constitute half of the cost of the typical transaction.
290. The transaction costs incurred by those who are induced to buy a non-compliant vehicle, because of the reduction in its price, will be lower than are the costs to those who buy a compliant vehicle. The former are all willing traders and can be assumed to have the information and finance they need for a purchasing decision. Indeed, many of those who benefit from the reduction in price of non-compliant vehicles would have been in the process of buying a vehicle anyway and the effect of the policy is simply to change their choice of vehicle. Others who change their vehicle only because of the reduction in price will experience a transaction cost which goes some way to offsetting the benefit of this reduction in the price. Given that these buyers are also willing traders, and hence are already willing to invest in the search costs, the only part of the transaction costs relevant to their decision are the administrative costs of changing vehicle ownership. We recommend that these are omitted as they represent a minimal cost.
93
291. In mathematical terms the social welfare costs for trading up can be defined as follows:
1) { ) - ( ) } q = the loss of
welfare for all who are obliged to purchase a compliant vehicle
and
2) { ( ) } 0.5 q = the welfare gain to those who benefit from the
opportunity to purchase a non-compliant vehicle at a reduced price.
Thus the overall impact on the policy is
3) q
Where
= price of an equivalent compliant vehicle
= resale price of a compliant vehicle
= price of a non-compliant vehicle prior to the policy being implemented
= resale price of a non-compliant vehicle prior to the policy being implemented
= price of a non-compliant vehicle after the policy has been implemented
= price of a non-compliant vehicle after the policy has been implemented
t = the cost of a transaction for those obliged to change their vehicle
q = the number of non-compliant vehicles which are sold
Values should be measured over the lifetime of the vehicle and appropriately discounted.
292. Defining an equivalent compliant vehicle is likely to present few challenges as attributes such as vehicle size, engine capacity, and vehicle model and make tend to vary relatively little over time, thus facilitating the specification of an equivalent compliant vehicle. One possible complication arises in the case of a compliant petrol vehicle which is deemed to be comparable to a non-compliant diesel vehicle in all attributes other than having higher operating costs. Factoring into the welfare cost of the purchase price the higher operating costs would require estimates of mileage driven and of the appropriate discount rate to apply to cost differences in future years. In such cases it might be better to take as the equivalent compliant vehicle a higher Euro standard diesel with comparable fuel economy.
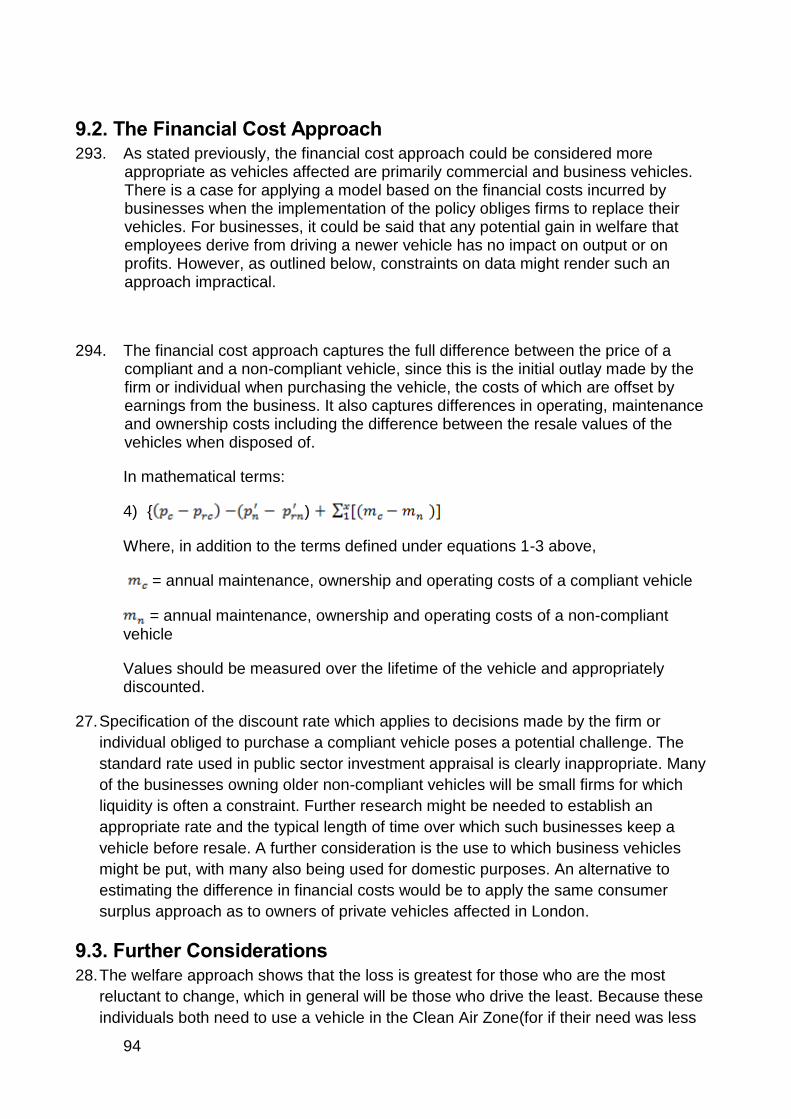
94
9.2. The Financial Cost Approach 293. As stated previously, the financial cost approach could be considered more
appropriate as vehicles affected are primarily commercial and business vehicles. There is a case for applying a model based on the financial costs incurred by businesses when the implementation of the policy obliges firms to replace their vehicles. For businesses, it could be said that any potential gain in welfare that employees derive from driving a newer vehicle has no impact on output or on profits. However, as outlined below, constraints on data might render such an approach impractical.
294. The financial cost approach captures the full difference between the price of a compliant and a non-compliant vehicle, since this is the initial outlay made by the firm or individual when purchasing the vehicle, the costs of which are offset by earnings from the business. It also captures differences in operating, maintenance and ownership costs including the difference between the resale values of the vehicles when disposed of.
In mathematical terms:
4) { )
Where, in addition to the terms defined under equations 1-3 above,
= annual maintenance, ownership and operating costs of a compliant vehicle
= annual maintenance, ownership and operating costs of a non-compliant vehicle
Values should be measured over the lifetime of the vehicle and appropriately discounted.
27. Specification of the discount rate which applies to decisions made by the firm or
individual obliged to purchase a compliant vehicle poses a potential challenge. The
standard rate used in public sector investment appraisal is clearly inappropriate. Many
of the businesses owning older non-compliant vehicles will be small firms for which
liquidity is often a constraint. Further research might be needed to establish an
appropriate rate and the typical length of time over which such businesses keep a
vehicle before resale. A further consideration is the use to which business vehicles
might be put, with many also being used for domestic purposes. An alternative to
estimating the difference in financial costs would be to apply the same consumer
surplus approach as to owners of private vehicles affected in London.
9.3. Further Considerations 28. The welfare approach shows that the loss is greatest for those who are the most
reluctant to change, which in general will be those who drive the least. Because these
individuals both need to use a vehicle in the Clean Air Zone(for if their need was less
95
they would no longer enter the zone) but make relatively few trips, the benefit they get
from trading to the more modern compliant vehicle is less than is gained by those who
travel more often.
29. Some businesses with a fleet of vehicles will redeploy their fleet so as to avoid sending
non-compliant vehicles into a Clean Air Zone. Whether such a response imposes
significant costs on the owner of the fleet will depend upon the size of the fleet and the
mix of compliant and non-compliant vehicles. Operators of larger fleets tend to own
more modern vehicles and it seems likely that, by the time the measure is
implemented, most such fleets will be made up of compliant vehicles. Operators of
smaller fleets may be more constrained in their behaviour, but they always have the
option of paying the charge if the cost of the charge is exceeded by the net revenue
earned from operating a non-compliant vehicle within the Clean Air Zone. Thus the cost
of redeployment might be considered as part of the costs incurred by those who
continue to drive and pay the charge. In this case the cost to society is the value of the
trips which are foregone because of the charge, with the charge itself counting as a
transfer between the charge payer and society which gains from the revenue, while
experiencing worse air quality on account of these additional trips.
96
Annex D: Evidence review – profile of transport users This note briefly summarises the readily available evidence at August 2015 on the profile of users of different modes of transport in the UK in order to consider which, if any, groups may be disproportionately impacted by measures affecting particular vehicle types. It also briefly compares the profile of those living in urban centres, those just outside, and those living in other areas.
The note is structured on the basis of the four main vehicle types most likely to be the focus of any proposed measures: Buses, HGVs, LGVs and Cars.
The data presented in the figures and tables is weighted, whilst the sample size stated is unweighted.
Buses and coaches Any costs incurred by a bus company as a result of Clean Air Zones could be passed on to its customers, offset through a less frequent or lower quality service or absorbed.
There are over 220,000 people working in the bus and coach industry in the UK and over 1000 enterprises operating buses and coaches54. The local bus service market is relatively concentrated, with the five largest operators (FirstGroup, Stagecoach, Arriva, Go-Ahead and National Express) having a market share of 71% in 2008/0955.
The UK scheduled coach market was worth around £300m in 2012, of which National Express was the market leader with around 70% of the market. The competitive nature of the coach market (and the requirement to keep prices down to compete with car and rail) would mean that it is unlikely that the full effect of the cost increases would be reflected within long distance scheduled coach fares, though they are likely to be passed on to some degree.
Larger operators with a bigger fleet of vehicles are more likely to be able to redeploy at minimal cost, or may have been planning to upgrade to newer vehicles that would not be subject to a charge prior to 2020. Smaller operators may find it more difficult to cover the costs and exit the market.
In London, it was found that overall the proposed LEZ would have a marginal detrimental effect on the short term profitability of businesses and as a result could marginally reduce the attractiveness of these transport businesses for investment. This may have a detrimental impact on smaller operators with less flexibility in the fleet or finance for upgrade.
54 http://applebyassociates.com/downloads/Transport%20Sector%20Report-April15.pdf
55 http://webarchive.nationalarchives.gov.uk/+/http:/www.competition-
commission.org.uk/inquiries/ref2010/localbus/pdf/00_sections_1_15.pdf
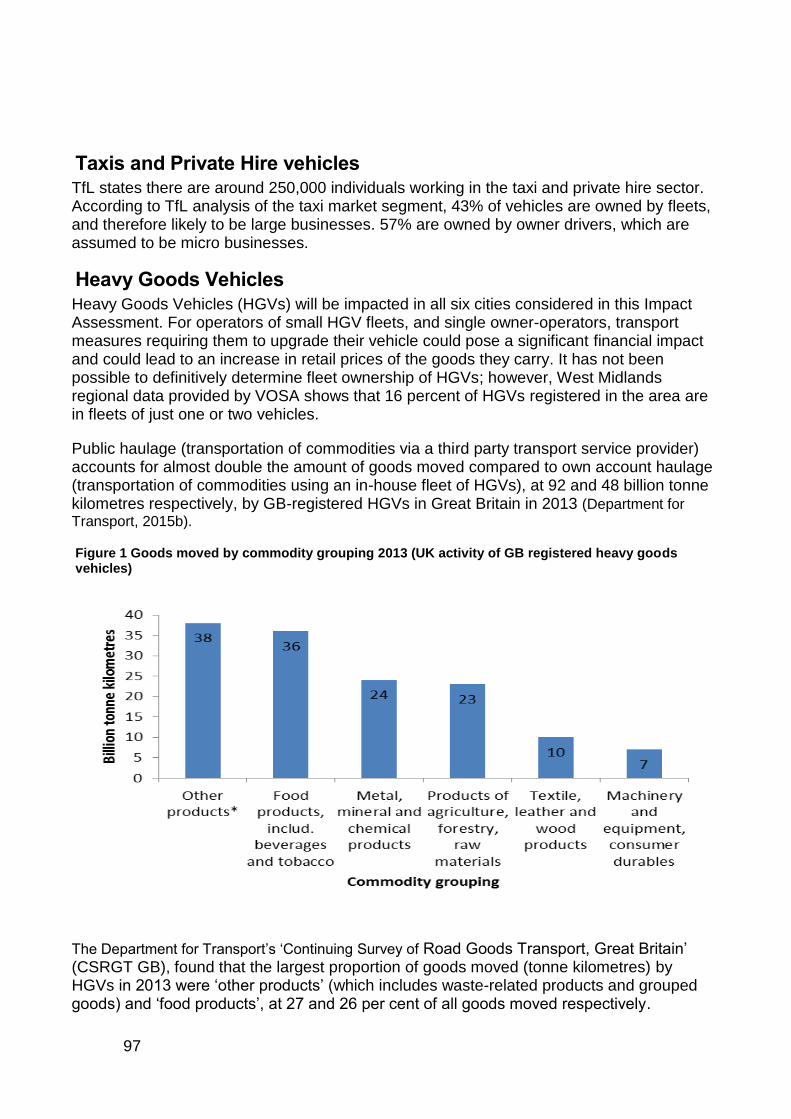
97
Taxis and Private Hire vehicles TfL states there are around 250,000 individuals working in the taxi and private hire sector. According to TfL analysis of the taxi market segment, 43% of vehicles are owned by fleets, and therefore likely to be large businesses. 57% are owned by owner drivers, which are assumed to be micro businesses.
Heavy Goods Vehicles Heavy Goods Vehicles (HGVs) will be impacted in all six cities considered in this Impact Assessment. For operators of small HGV fleets, and single owner-operators, transport measures requiring them to upgrade their vehicle could pose a significant financial impact and could lead to an increase in retail prices of the goods they carry. It has not been possible to definitively determine fleet ownership of HGVs; however, West Midlands regional data provided by VOSA shows that 16 percent of HGVs registered in the area are in fleets of just one or two vehicles.
Public haulage (transportation of commodities via a third party transport service provider) accounts for almost double the amount of goods moved compared to own account haulage (transportation of commodities using an in-house fleet of HGVs), at 92 and 48 billion tonne kilometres respectively, by GB-registered HGVs in Great Britain in 2013 (Department for
Transport, 2015b).
Figure 1 Goods moved by commodity grouping 2013 (UK activity of GB registered heavy goods vehicles)
The Department for Transport’s ‘Continuing Survey of Road Goods Transport, Great Britain’ (CSRGT GB), found that the largest proportion of goods moved (tonne kilometres) by HGVs in 2013 were ‘other products’ (which includes waste-related products and grouped goods) and ‘food products’, at 27 and 26 per cent of all goods moved respectively.
98
TfL estimated that for HGV operators within the construction sector, around half of costs would be absorbed by businesses. As this industry market is competitive, passing on costs may be infeasible for some of the many small businesses operating in the area, and may lead to some firms exiting the market.
Light Goods Vehicles Light Goods Vehicles (LGVs) will be affected in three cities considered in this Impact Assessment: London, Birmingham and Leeds.
Whilst van keepership in Great Britain is split almost evenly between privately owned and company-registered vans56, older vans tend to be owned by the smallest enterprises – including self-employed and sole traders. We would therefore expect the Clean Air Zone van charge to impact most on smaller businesses.
LGVs have a wide range of uses. The DfT van activity survey in England (2009) found that half the van fleet carried equipment as a primary use (50 per cent); the other most common usages were for delivering or collecting goods (21 per cent) and private and domestic use (18 per cent). The most common business activity that vans were used for was service provider (40 per cent); 13 per cent collected and delivered goods and seven percent were used in infrastructure maintenance.
By way of an example, TfL estimated that LGVs operating in the construction sector are even less likely than HGVs to pass on costs to consumers (only around 40% of costs are likely to be passed on according to TfL). In this scenario, smaller businesses may struggle to absorb such costs and may exit the market.
Cars Government is not mandating local authorities to impose a Clean Air Zone on cars; however local authorities may choose to target cars in the design of their Clean Air Zones. London is implementing the ULEZ which is equivalent to a Clean Air Zone Class D, covering cars.
The impact of any action that targets the existing fleet of cars is likely to fall mainly on private owners. Just over half of new car registrations (54 percent) were made by companies but fewer than ten percent of the whole licensed car stock were company cars (8.6 percent) in 201456. This suggests that cars tend to transition quickly from the company to private market, with companies tending to operate the newest vehicles.
Among private car owners, the highest two income groups made the highest average number of car trips in 2013. However, car was the most common way for people to travel across all income groups, accounting for nearly half the trips made by the lowest income quintile (47 per cent) up to 68 per cent for the highest income group57.
56 https://www.gov.uk/government/uploads/system/uploads/attachment_data/file/420411/veh0402.xls
57 www.gov.uk/government/uploads/system/uploads/attachment_data/file/342160/nts2013-01.pdf
99
There was not a large difference in ownership of diesel cars across income groups; the highest income group was the most likely to own a diesel, with 36 per cent of cars owned by the highest income group being diesel, compared to 29 per cent in the lowest income group.
Low income groups are more likely to own older cars than high income groups: 71 per cent of household cars among lower income groups are over 6 years old, compared to 50 per cent in the highest income group.
Bus users Any cost incurred by bus companies as a result of a transport measure may be passed on to its customers, or they may be affected by a less frequent service.
Data from DfT’s National Travel Survey58 indicates that those in lower income groups tend to
make more bus trips59
than higher earners. The average number of trips increased in each quintile
from the highest to the lower income quintile groups60
, with an average of 116 bus trips per person
in 2013 in the lowest income group and 33 for the highest. Low income groups are also less likely to own a car, suggesting that these households would have fewer alternative modes of transport available were a bus service no longer available or too costly.
People who had never worked or were long-term unemployed made an average of 96 trips by bus in 2013, more than twice the bus use of those in managerial or professional occupations. The highest average number of bus trips (133) was made by people who were not classified in the other socioeconomic categories; most of these were full-time students.
Other socio-demographics
According to the National Travel Survey61, the household types who used the bus most in 2013 were single parent families (average of 108 trips) and single adults (105).
Looking at a breakdown by age groups, the NTS shows that bus use was highest among 17-20 year-olds, with an average of 142 trips per year. Nearly one fifth of the trips by this age group were by bus at 18%. The next highest proportion was for those aged over 70, at an average of 85 bus trips per year.
58 www.gov.uk/government/uploads/system/uploads/attachment_data/file/342160/nts2013-01.pdf
59 Definition of a trip in the National Travel Survey: The basic unit of travel, a trip, is defined as a one-way
course of travel with a single main purpose. Outward and return halves of a return trip are treated as two separate trips. A trip cannot have two separate purposes, and if a single course of travel involves a mid-way change of purpose then it, too, is split into two trips. However, trivial subsidiary purposes (e.g. a stop to buy a newspaper) are disregarded.
60 Income quintiles are constructed so that for the weighted sample, 20% of households are in each quintile
banding. See link for notes and definitions used in the National Transport Survey: https://www.gov.uk/government/uploads/system/uploads/attachment_data/file/337241/nts2013-notes.pdf for
61 www.gov.uk/government/collections/national-travel-survey-statistics
100
Passenger Focus’ annual report 2014-15 stated that over 20 per cent of total bus journeys were made by people with a disability or long-term illness62.
62 www.transportfocus.org.uk/research/publications/passenger-focus-annual-report-and-accounts-201415