Embed Size (px)
Citation preview
IMP ACT OF COMMUNICATION ON THE PERFORMANCE OF EMPLOYEES' IN YUMBE DISTRICT HEADQUARTERS
BY:
KANABABITA NICHOLAS BHR/4368/31/DU
A RESEARCH REPORT SUBMITTED TO THE SCHOOL OF BUSINESS AND MANAGEMENT IN THE PARTIAL
FULFILLMENT FOR THE AWARD OF A BACHELORS DEGREE OF HUMAN
RESOURCE MANAGEMENT OF KAMPALA INTERNATIONAL
UNIVERSITY
2008

DECLARATION
I, Kanabahita Nicholas do declare that this work is my own innovation and has not been
presented by any other person here in Kampala International University or any other
institution of higher learning for the award of a certificate, diploma or degree.
. 0,-:::ss:: -_ ' Signature: ------ ~·=---- Date: f O (Jr,) ;:)..ere:{$ _______ _ __ ..... I
KANABAHITA NICHOLAS
i

APPROVAL
This research report is hereby approved and forwarded for examination with my consent
and under my supervision.
Signature --------- Date -- / 0 / J 6f }LO ~ ---------------Mr. Omacar Samuel (supervisor)
ii

~-~ -· -----~--~~~
DEDICATION
This work is dedicated to my parents; Rev. Edward Kanabahita and Mrs. Catherine
Kanabahita whom through their tender care, love and moral support is this book. For this
reason therefore they deserve lofty appreciation. Thank you for the choice you made to
place aside other needs in life and looking forward to education first as a pertinent
strategy of enriching my future. Without you, this would not have been possible.
I would like also to dedicate this work to my most high God creator for his wisdom and
knowledge provided to me throughout my studies. I thank you Lord for the gift of life
and your favor, that I have achieved this degree. I will also always glorify your name.
I also dedicate this same work to my lovely brothers; Michael, Edgar and Stanley; and
my sisters: Florence, Flavia, Fridah, Stella, and Elizabeth who at the times of financial
shortage offered the little they had. This helped me to complete the study in time.
I thank you all my parents, sisters and all my brothers for your sincere help and tolerance.
May the almighty God bless you richly.
lll
I I I I I l l
I !
I
I
ACKNOWLEDGEMENTS
In any project that has taken four months from its inception, there are bound to be a good
number of people who have given a hand either directly or otherwise in its successful
completion. Therefore, the researcher finds it very pertinent to acknowledge their efforts.
On that note, I wish to express my sincere gratitude and thanks to Mr. Omacar Samuel
(my supervisor) for his tireless help and patience in reading several of my drafts that
seemed to be incomplete and required his guidance and direction.
I equally acknowledge my colleagues and the staff school of Business and Management
of Kampala International University who earlier on commented on this book. They also
volunteered worthy ideas and suggestions that have helped this book to get to its present
state and form.
My sincere gratitude also goes to the administrators of Y umbe district headquarters for
their cooperation and for allowing me access to penetrate into different areas of their
control and jurisdiction to get information that has made this study come successfully to
completion.
There are indeed many scholars that are acknowledged through reference in the text. I am
grateful for their unavoidable resourceful ideas which have been integrated in this book.
There are may be other scholars' ideas I might have used without reference. This was not
intentional.
Finally, my relatives in Kampala who have helped enormously in the production of this
book by the way they compromised their comfo1i I used to give them to allow me stay in
other areas at the time of data collection.
lV

DECLARATION .......................................................................... o••·····i
APPROVAL ···············································································•oooo••·ii DECLARATION .......................................................................... o ••••• iii ACKNOWLEDGMENT ....•••••..•....••.•.••.. ~ •.•.....•.••......•.•••...•.••••.....•••••••• iv TABLE OF CONTENTS ...•..•...••...••.••••....•••.....•••••......•.••.•....•.••••.......•. v
ABSTRACT ••••...•.••••.•..••••••..•.•..••..•••.•..•••...•.•••.•.•••••••.....•.•••.•...•••••.••• vii CHAPTER ONE .................................................................................. 1 INTRODUCTION ...•.••••••.••••••••••..••••.•••...••.•.•...••.••••...••.•...•••.•.•....••.•••••. 1 1.1 Background of the study ................................................................ 1 1.2 Statement of the problem .............................................................. 2 1.3 Purpose of the study ...................................................................... 3 1.4 Specific objectives of the study ...................................................... 3 1.5 Research questions ........................................................................ 3 1.6 Scope of the study ........................................................................ 3 1. 7 Significance of the study ............................................................... 4 1.8 Conceptual framework ................................................................... 5 CHAPTER TW0 .................................................................................. 6 2.0 INTRODUCTION •••••..••••••••••.•••••..•••.•...••••..•••••••.•.•••••.••••..••••.•.•••••• 6 2.1 Definition of concepts ·••.•················ .. ··················· ......................... 6 2.2 Relationship between communication and performance .................. 6 2.3 Review of related literature ............................................................ 7 2.3.1 The effects of communication ..................................................... 7 2.3.2 Forms of communication ............................................................ 8 CHAPTER THREE ............................................................................. 4 3.0 INTRODUCTION •••••.•••••.•••••.•••••..••••.•.•••••...••••••..•••••. ·····••ooo•• •••••• 14 3.2 Area of the study ......................................................................... 15 3.3 Study population ........................................................................ 15 3.4 Sample design ............................................................................ 15 3.5 Data collection ............................................................................ 15 3. 5. 1 Questionnaire .......................................................................... 15 3.5.2 Interviews ................................................................................ 16 3.5.2 Observation .............................................................................. 16 3.6 Research procedure .................................................................... 17 3.7 Data analysis and presentation ................................................... 17
CHAPTER FOUR ............................................................................. 18 4.0 INTRODUCTION •••••...•••••..•••..••••.••.•••••...••••••••.•••.•••....•••••• o•o••·····l8 4. 1 General findings ........................................................................ 18 4.2 Age distribution .......................................................................... 19 4.3 Demographic analysis ................................................................. 20 4.4 Educational level ....................................................................... 21 4.5 Departmental distribution of respondents .................................... 22 4.6 Employee response on how information system is used in the district headquarters ..................................................................................... 24 4. 7 The response of receiver's duration to the action ........................... 25 4.8 Mode of communication .............................................................. 27 4.8.1 Verbal communication ............................................................. 27 4.8.2 Written communication ........................................................ : ... 27 4.8.3 Employee response to mode of communication .......................... 27 4.9 Duration of feedback ................................................................... 29 4.10 showing how employees understand what is communicated ........ 31 4.11 According to respondent's view of communication and
V
Performance ..................................................................................... 32 4.12 Forms of communication ........................................................... 33
CHAPTER FIVE .............................................................................. 36 3.1 in this chapter the findings are summarized, concluded and Possible recommendations ................................................................. 36 5.1 Summary ................................................................................... 36 5.2 Conclusion ................................................................................. 37 5.3 Recommendations ...................................................................... 38 5.4 Area for further study ................................................................. 39 References ....................................................................................... 40 Questionnaires ................................................................................. 4 2
VI
I I ; f I

ABSTRACT
This research was based on investigating the impact of communication on
performance of employees. It was conducted 1n Yumbe District
Headquarters. It covers top administrators and employees as its
respondents.
The objective of the study was to establish the relationship between
communication and performance, effects on communication and
performance and form of communication used in Yumbe district
headquarters.
The researcher used questionnaires, interviews, and observation as the
research instruments. The data collection compromised both primary and
secondary data.
The findings indicated that, communication go hand in hand with
performance. And this is evidenced with a massive performance got from the
findings. It was also realized that poor relationship among staff, domestic
problem, language problem, heavily hinders communication flow in Yumbe
district headquarters.
Some of the recommendations made by the researcher in this report
included encouragement of open-door communication philosophy where an
employee is free to report to superior in case of misfortune. More emphasis
should be put on formal communication than informal communication
Vll
I i I f
I I t t
I

CHAPTER ONE
INTRODUCTION
1.1 BACKGROUND OF THE STUDY
Communication comes from the Latin word "comunis", which means common.
Communication is the process of giving information, making emotions or ideas
known to someone.
Large ambitious goals usually require employees to engage into exchange of
ideas, information amongst themselves. So communication has become
important concept in an organization. Effective communications are
intermediary goal towards good, sustainable results. Organizations have been
increasing effort through encouraging feedback, sharing, follow up, planning to
help people to communicate more effectively and to accomplish shared goals
whether colleagues are present or absent.
Through communication team members are able to share knowledge and
experience in the best interest of the team. Also the leaders are able to
articulate potential problems for the success of the organization and take steps
to avoid and overcome difficulties. Communication enables coordination of
activities, sharing of information and respect of values, beliefs and norms of
different groups. Communication gives team members decision-making skills
they need to build and maintain a positive social environment. Only in a
positive social atmosphere can people work at their full capability and achieve
synergy with others.
1

1.3 PURPOSE OF THE STUDY
The purpose of the study was to establish the impact of communication on
employee performance in Yumbe District Head Quarters.
1.4 SPECIFIC OBJECTIVES OF THE STUDY
The following were the objectives under which the research was carried out.
• To establish the relationship between communication and performance of
employees in Yumbe district head quarters.
• To examine the effect of communication on performance in Yumbe district
headquarters.
• To establish the various forms of communication are used in Yumbe district
headquarters.
1.5 RESEARCH QUESTIONS
• What is the relationship between effective communication and performance
of employees in Yumbe district head quarters?
• How does communication affect performance in Yum be district
headquarters?
• What forms of communication are used in Yumbe district headquarters?
1.6 SCOPE OF THE STUDY
The study was carried in Northern Uganda in the district of Yumbe in west
Nile. The main focus of the study was to establish the impact of
communication on the performance of employees' in Yumbe district
headquarters, examining the impact of communication on employee
performance.
3

1.7 SIGNIFICANCE OF THE STUDY
• This study will be useful in finding out how best the management of Yum be
district can communicate effectively for better performance of their employees
at the district headquarters.
• To provide up to date literatures for academicians and managers in the
department of Human resource Management and finings may be used for
future literature review.
• The study will also be useful to the policy makers of Yumbe district in
providing effective communication system for better performance of employees.
• It is also important because it contributes to the researcher's fulfillment of
the requirement for the award of bachelor's degree in human resource
management.
• It can be used by other researchers, students of Kampala international
university students, lecturers and administrators for further references.
4

1.8 CONCEPTUAL FRAMEWORK
Independent
Communication
Positive Impacts
Increase in performance
Sharing of ideas, concept
Coordination of activities
Improve on relationship
Increase commitment
Negative Impacts
• Conflict
• Poor performance
• Lack of trust
• Reduce morale
• Reduce on ability to innovate
5
Dependent
Performance

CHAPTER TWO
LITERATURE REVIEW
2.0 INTRODUCTION
This chapter is about the ideas and views of other persons in relation to the
topic identified by the researcher. The literature is vital and enables the
researcher to investigate further. The literature was mainly taken from other
secondary sources of data.
2.1 DEFINITION OF CONCEPTS
Vsp Rao, et al (2000) defined communication as the act of influencing and
inducing others to interpret an idea in the manner intended by the speaker or
writer.
Gareth R, et al, (2000) defined communication as the sharing of information
between two or more individuals or groups to reach a common understanding.
2.2 RELATIONSHIP BETWEEN COMMUNICATION AND PERFORMANCE
According to Kerry Thomas (1995), he defined performance as the way in which
an activity is accomplished in a particular level of standards, to which a task is
to be accomplished. It is adapted, carried out, or achieved within the working
environment. The purpose of effective communication is to ensure that
employee grievances, unethical behavior of managers, employee performance
are communicated to the superior if performance is to be maintained and
improved.
Communication ought to be demonstrated in most situations by achieving
certain particular results, or certain levels of performance. Vroom, Porter and
Lawler (1997), the philosophers of expectancy theory argue that the degree of
6
effort an individual exerts depend on his or her own perception of the effort
performance. If individuals are not given the data necessary to make the
perceived probability of this linkages communication will suffer. If rewards are
not made clear, if the criteria for determining and measuring performance are
ambiguous, if individuals are not relatively certain with their information it will
lead to unsatisfactory performance, then effort will be reduced, so
communication plays a significant role in determining the level of employee
performance.
2.3 REVIEW OF RELATED LITERATURE
The review of related literature will be done according to the themes of the
objectives set
2.3.1 THE EFFECTS OF COMMUNICATION
Effective communication is necessary for managers to perform his functions.
It's a process by which management functions like planning; organizing,
directing and controlling are accomplished. Management is concerned with
getting things done through others, a task that invariably requires that
managers must communicate with other people. Everything a manager does
involves communication.
Gareth R, et al, (2000) in order for an organization to gain competitive
advantage, managers must strive to increase efficiency, quality, and
responsiveness to customers and innovation. Good communication is an
essential for reaching each of these four goals and this is a necessity for
gaining a competitive advantage.
Gareth R, et al, (2000) Efficiency is increased by updating the production
process to take advantage of new and more different technologies and by
training workers to operate the new technologies and expand their skills.
7
f

Effective communication is necessary for managers to learn about new
technologies, implement them in their organizations and train workers in how
to use them. Similarly improving quality hinges on effective communication.
Gomez Mejjia et al (2000) Good communication can also help to increase
responsiveness to customers. When the organizational members who are close
to customers such as sales in department stores, and tellers in banks, are
empowered to communicate to customers needs and desires to managers, in
turn must communicate with other organizational members to determine how
best to respond to changing customer preferences.
Gareth R, et al, (2000) Innovation, which often takes place in cross-functional
teams, also requires effective communication. Members of a cross functional
team developing a new kind of compact disc player for example must effectively
communicate with each other to develop a disc player that customers will
want, there will be high quality and that can be produced efficiently.
Coordination Gareth R. Jones et al (2000) Communication enables the
organization to coordinate their various departments and that is through giving
direction, instructions on how activities are supposed to be done and when
different organization departments are coordinated performance will be
maintained and improved and wastage will be minimal.
2.3.2 FORMS OF COMMUNICATION
There are different forms of communication used by organizations and they
include downward communication, upward communication, and horizontal
communication, and diagonal communication, verbal and non-verbal
communication.
8
I I
I

Downward Communication;
Gerald Greenberg et al (1997) In downward communication, the message is
sent from high position in the organization to an individual or group lower in
the hierarchy, downward communication frequently occurs between managers
and subordinates and help managers to provide directions, feedback and
critical information which help the subordinates to perform to the expected
level. Through downward communication, managers can carry out employee
performance evaluation, job description, orientation of new employees,
communicate policies, orders, instructions, raise and recognize employees and
all these above in the long run help to improve and maintain performance.
Upward Communication
Gerald Greenberg et al, (1997) in upward communication, a message is sent
from positions lower in the hierarchy to a receiver higher in the hierarchy. It
makes managers know how individuals, team and units of the organization are
performing. When performance deviates from expected standards, managers
can make corrective adjustments. One of the most important components of
upward communication is feedback to managers about employees' feelings
about the organization's policies; organizations are likely to have barriers that
filter information from subordinates before it is received by managers.
Employees should however be made aware of the tendency to punish the
bearer of bad news. It is also considered disloyal for employees to take a
problem "over the head" of the boss to a higher echelon manager. Therefore it
is necessary to design special communication channel that encourage
employees to express their true feeling, unfiltered information.
However in this case, organizations can introduce open communication policy
where every employee is free to enter and present his/her own un-wanting
feeling to the superior so this in a long run helps to improve and maintain
performance. Upward communication include employee grievance, information
9
I I ' I I t
i t f r i I I
I I

about unethical behavior of managers, seeking clarifications and response to
policies.
Horizontal communication
Ivancivich Matteson et al) (1996) Occurs between sender and receiver at similar
level in the organization. It is likely to take place between team members,
between different teams, between employees in different units, such as when a
safety specialist and quality control inspector discusses proposed changes in
the manufacturing process; horizontal communication is becoming
increasingly important in the organization because it involves collaboration
between employees with different skills and competencies.
Managers and team members need to have ability to give feedback to
subordinates or peers. Feedback may be communicated either horizontally,
(from peer to peer), or vertically (from superior to subordinate). All employees
need feedback to improve on their skills, post feedback lets them know how
they are progressing towards their goals and is used to strengthen behavior
that is already learnt. Negative feedback tells employees which behavior needs
to be modified so that performance is maintained and improved.
Diagonal communication
Balkin et al) (2002) While it is probably the least used channel of
communication in the organization, diagonal communication is important in
situations where members are not communicating effectively through other
means for example, the comptroller of a large organization may wish to conduct
a distribution cost analysis. One part of the task may involve having sales
forces send special report directly to the comptroller rather than going through
traditional channels in the marketing departments. Thus, the flow of
communication would be diagonal as opposed to vertical and horizontal.
Diagonal would be the most efficient in terms of time, and effort for the
organization.
10

Verbal communication
This is the transmitting and receiving ideas using words. Verbal
communication can be either using spoken language, in form such as face-to
face talks, or written in forms such as memos, letters, employee handbook, and
electronic mail because both oral and written communication involves the use
of words, they fall under the heading verbal communication.
Face to face communication
Ivancivich Matteson et al, (1996) this provides, opportunities for sending rich
information (potential information carrying capacity data) content and can offer
high levels of interactivity between sender and receiver. Job interviews are
likely to be done face to face. One of the most important types of face to face is
meeting. Meetings are a purposeful gathering of organizational members, they
are held to inform and train participants, solve problems, monitor and
coordinate activities, delegate tasks and create social bonds between diverse
organizational members, and all this is tailed towards maintaining and
improving performance of the organization.
Written communication
Gareth R. Jones, et al, (2000) Written communication includes memos, policy
manuals, employee handbook, bulletin boards, letters and fliers. The
advantage of written communication is that they can be revised, stored, and
made available when needed and disseminate in identical copies so that they
send message is received by all. Written communication can be personalized
for small audience. The popular form of written communication includes;
i) Memos
Memos are business communications that provide information to employees.
They can inform employees about the agenda, time and places of meeting, the
11

work schedule or a change in an employment policy. A memo should be brief
and to the point so that it will be read and understood.
ii) Newsletters
Newsletter is a short monthly or quarterly publication designed to keep
employees informed of the important events, meetings and transactions and
provide inspirational stories about employee and team contribution to the
organization. Newsletters help to foster community spirit of keeping everybody
informed about what others are doing.
iii) Employee handbook
Another internal publication used is the employee handbook. A document
describing to employees the basic information about the organization. It
provides general reference regarding the organizational background, the nature
of its activities, and its rules specifically the major purposes of employee
handbooks are;
1111 To explain key aspects of organization policy
1111 To clarify the expectations of the organization and employees towards
each other.
1111 To express the organizational philosophy
Employee handbooks help in the process of socializing new employees and
promoting organizational values thus keeping performance stable.
Electronic communication
Richard L. et al, (2000) Advance in electronic communication makes interactive
communication possible between sender and receiver who are separated by
physical distance and busy schedule. Electronic communication channel vary
in the richness of the information that is transmitted and can include text,
12

voice, graphics or videos. The two commonly used form of electronic
communication include voicemail, and email.
i) Voice mail
Voice mail lets a sender transmit a detailed audio message that is recorded
electronically and can be played back when convenient. Managers play back all
messages at once and answer them in concentrated block of time so that
redundant telephone tag calls can be avoided. Voicemail also allows the sender
to set up menu of responses to commonly asked questions, which saves
additional time.
H) Electronic mail
Emails allow employees to communicate via written messages through
personal computer terminals linked to networks. Emails is the fast way to
distribute important information to a large number of employees, it permits
virtual team of employees to work simultaneously in documents even though
they are separated geographically or by busy schedule. Email is often used to
exchange information (such as coordinating project activities and scheduling
meetings) for social reasons (keeping in-touch with colleagues).
Non-verbal communication
Gerald Greenberg et al (1997) Non verbal communication is the transmission of
messages without use of words that is to say, gestures, the use of space, the
non-verbal cues such as smiles, and glances are important sources of
information influencing our impressions of people. Some of the most relevant
non-verbal communication cues in the organization have to do with people's
manner of dress and use of time space.
13

CHAPTER THREE
METHODOLOGY
3.0 INTRODUCTION
This chapter presents and describes the methods and techniques that were
used to collect and analyze data. It included the study, population, data
collection instruments, processing and analysis and limitations of data.
3.1 RESEARCH DESIGN
The study was essentially designed as a case study with specific focus on Yumbe district
headquarters in Northern Uganda as a case study area. According to P.V Young, a case study is a
method of explaining and analyzing the life of a social unit be it a person, a family, an
institution, cultural group or even entire community. It is a study through which one can
precisely know the factors and causes of a particular phenomenon.
The researcher preferred using a case study design because of its flexibility and compatibility
with all the data collection methods. Secondly, a case study design was also used because it
makes it easier for the researcher to analyze the subject under investigation in detail; and lastly, a
case study design gives a clear picture of the subject investigated.
In view of the above, the researcher adopted mainly qualitative methods of data collection and
analysis. In order to validate the findings from qualitative methods and for clarity purposes, the
researcher used quantitative methods.
14

3.2 AREA OF STUDY
The study carried out in Yumbe district headquarters. Yumbe District was
created out of Arua district, and started operating formerly in the financial year
2001/2002 after approval by Parliament in November 2000. It is bordered by
the Sudan in the North, Moyo District in the east, in the South by Arua and
Nile and in the west by Koboko District.
3.3 STUDY POPULATION
The population under study comprised 60 respondents and this sample was to
be selected from different departments of the district headquarters.
3.4 SAMPLING DESIGN
The researcher used simple random sampling techniques in a sense that
whether one is on probation or confirmed put into consideration. Respondents
were identified depending on their willingness and availability to take part in
the exercise or study. The various departments formed samples where
respondents selected at random.
3.5 DATA COLLECTION INSTRUMENTS
The study adopted mainly qualitative methods of data collection supplemented
by quantitative methods to support data from qualitative methods. The
methods used for data collection were interviews, observation, questionnaires
and documentary data analysis. All these methods were used to minimize
weaknesses of each of these tools so that a true picture of the environment was
obtained.
3. 5.1 Questionnaires
These were pre-formulated written set of questions to which the respondents
were asked to record their answers. It is an efficient data collection mechanism
when the researcher knows exactly what is required and how to measure the
variables of interest. Questionnaires can be administered personally or mailed
15

to respondents. For this case study, the questionnaires were self-administered
to the targeted respondents. The questionnaire preferred because they saved
time especially when the grouped was big and geographically scattered, they
could also be stored for future reference, they gave straightforward answers,
and therefore were easy to evaluate.
3.5.2 Interviews
An interview guide was used especially with the secretariat coordinator,
administrative officer and the employees. The researcher carried face-to-face
interview with the respondent. The researcher also explained to the respondent
why the study was carried out. The interview method was preferred because it
enabled the researcher to have face-to-face interaction with the respondent and
also to ask probing questions relevant to the study.
3.5.3 Observation
Well as interviews and questionnaire elicit respondent from the respondent; it
is possible to gather information without asking question by observing people
in their natural work environment and recording their behaviors. The
researcher played one or two roles: None participant observer, or participant
observer. As a non-participant observer, the researcher collected data in the
role of a pure researcher without trying to become an integral part of an
organization. The researcher also played a role of a participant observer. Here,
the researcher became part of work team and in the process observed
employees behaviors and performance.
16
I I I
l I I
I I ' I I

3.6 RESEARCH PROCEDURE
The researcher obtained an introduction letter from Kampala International
University, School of Business and Management to Yumbe district; Permission
was sought from the district authorities to allow the researcher conduct this
study; Participants willing to provide information were guided in the
questionnaire filling process, and questions were asked by the researcher for
clarification.
3. 7 DATA ANALYSIS AND PRESENTATION
After collection of data:., only correctly filled questionnaires were coded, edited
and analyzed. Analysis was carried out by use of frequencies; percentages and
true findings were represented using tables and graphs
17

CHAPTER FOUR
PRESENTATION, ANALYSIS AND DISCUSSION OF FINDINGS
4.0 INTRODUCTION
Under this chapter, the findings of the study are presented, interpreted and
discussed under major themes related to the research questions. The
presentation of the data as is laid out in this chapter is by quantitative
findings, and they have been reinf 6rced by qualitative analysis that provides a
stronger basis for interpretation and discussions.
4.1 GENERAL FINDINGS
In general, there were 60 respondents targeted by the researcher. Of this 60
respondents, 40 responded positively by answering the questionnaires and
accepting to be interviewed by the researcher. The number that responded
represented 66.7% and those who did not respond represented 33.3% as
represented in the table 4.1 and figure 4.1:
Table 4.1 Showing the General Response Of Respond.en ts
Response Frequency Percentage
Responded 40 66.7
Non responded 20 33.3
Total 60 100 . Source: Primary data (2008)
18

■ Responded
■ Non responded
Source: Primary data
Figure 4.1: A pie chart showing general response of respondents
4.2 AGE DISTRIBUTION
Of the 40 respondents, 8 were in the age bracket of 20-25, 10 respondents
were between 26-30, 12 respondents were between 31-35, 6 were between the
age brackets of 36-40 and 4 were between 41-45 years old.
Table 4.2: Showing age distribution of respondents
Age bracket Frequency Percentage
20-25 8 20
26-30 10 25
31-35 12 30
36-40 6 15
41-45 4 10
Total 40 100
Source: Primary data
19

12
10
8
6
4
2
0
Source: Primary data
■ 20-25
■ 26-30
031-35 036-40 ■ 41-45
Figure 4.2: A bar graph showing age distribution of respondents
The figure above, shows that majority of the respondents 75% fall in the age
bracket of 20-35 years because this is the most active age of working, and no
respondent below the age of 19 was realized in the district headquarters.
4.3 DEMOGRAPHIC ANALYSIS
During the course of this research, in the 66.7°/o of those who responded, 32
respondents were men representing 80% and 8 of the respondents were female
representing 20% of the respondents.
There were two female employees among the contract workers and 6 among the
permanent employees employed by the headquarters.
Despite the affirmative action by many organizations in the district towards
gender balance, male still outnumber females in the district employment ranks
as represented in the table 4.3 and figure 4.3.1.
20

Table 4.3: Showing the Gender Response
Gender Frequency Percentage
Male 32 80
Female 8 20
Total 40 100
Source: Primary data
■ Male
■ Female
Source: Primary data
Figure 4.3: A pie chart showing gender response
4.4 EDUCATIONAL LEVEL
Of the 40 respondents, 10 had degrees, 20 were diploma holders, 7 had
professional certificates from different qualification, and 3 were holders of
secondary certificates.
21

Table 4.4 Showing Educational Level of Respondents
Gender Frequency Percentage
Degree
Diploma
Professional certificate
Secondary certificate
Total
Source: Primary data
• I ' , .......,
,. ,
~~ Source: Primary data
10
20 ·
7
3
40
■ Degree
■ Diploma
□ Proffessional certificate
□ Secondary Certificate
25
50
17.5
7.5
100
Figure 4.4: A Pie chart showing educational level of respondents
As shown above, it is indicated hat majority of the respondents were diploma
holders with few degree and certificate holders.
4.5. DEPARTMENTAL DISTRIBUTION OF RESPONDENTS
Of the 40 respondents, 12 respondents were from administrative department, 8
respondents were from finance department, 15 respondents from health
department and 5 from the educational department.
22

Table 4.5. Showing Departmental Distribution
Department Frequency Percentage
Administration 12
Finance 8
Health 15
Education 5
Total 40
Source: Primary data
Figure 4.5 A pie chart showing Departmental distribution
Source: Primary data.
23
■ Administration ■ Finance
□ Health
□ Education
30
20
37.5
12.5
100
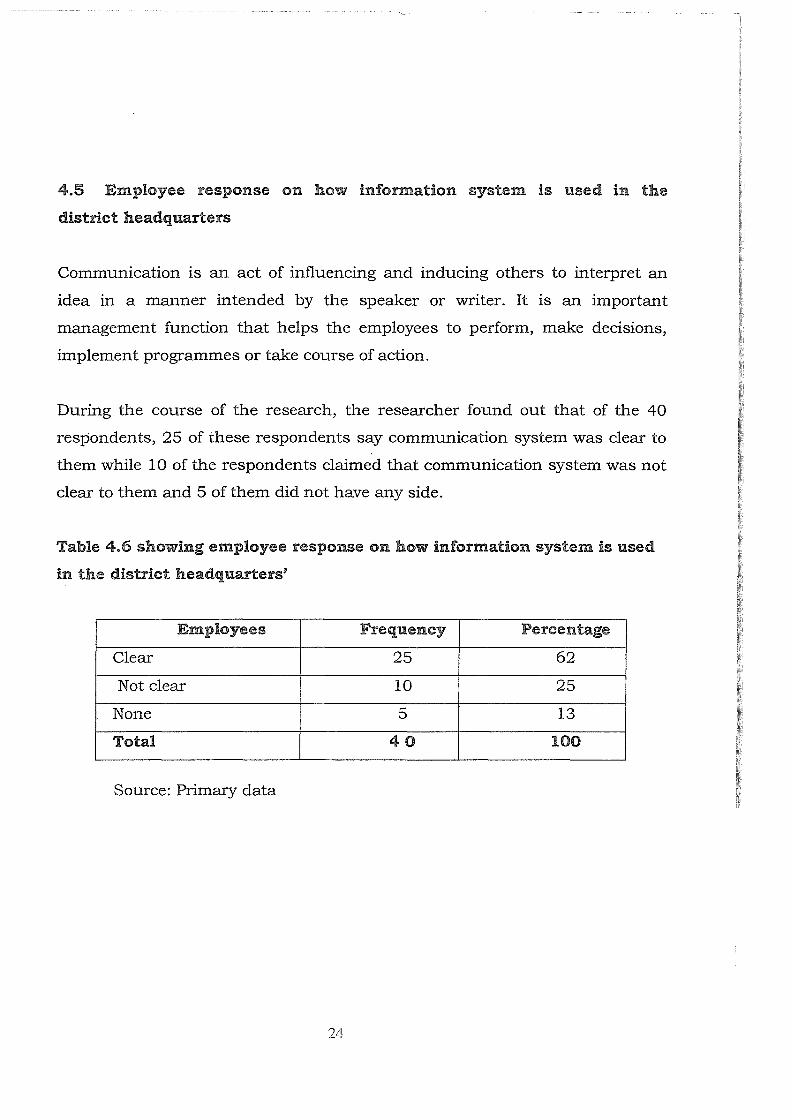
4.5 Employee response on how information system is used in the
district headquarters
Communication is an act of influencing and inducing others to interpret an
idea in a manner intended by the speaker or writer. It is an important
management function that helps the employees to perform, make decisions,
implement programmes or take course of action.
During the course of the research, the researcher found out that of the 40
respondents, 25 of these respondents say communication system was clear to
them while 10 of the respondents claimed that communication system was not
clear to them and 5 of them did not have any side.
Table 4.6 showing employee response on how information system is used
in the district headquarters'
Employees Frequency Percentage
Clear 25 62
Not clear 10 25
None 5 13
Total 40 100
Source: Primary data
24
..
I I i i ; , t ,. I
I I

Source: Primary data
■ Clear
■ Not clear
□ None
Figure 4.6 A pie chart showing employee response on how information system is used in
the district headquarters
Even though the figure above indicates that 62.5% of the information system
used is clear, but 25% also show that there is massive need to improve on
communication system and this is possible through improving on the mode of
delivery and being brief and precise in the communication process.
4. 7 The response according to receivers' duration to take action
Communication process generally requires at least an immediate action from
receivers' side so that communication process becomes complete. The
researcher in the course of this research found out that out of the 40
respondents, 10 of the respondents say that most of the communication they
receive makes them to act instantly. 20 of the respondents say it requires them
to take an action mostly after a day, 8 of the respondents claim that it requires
them to take an action after a week, and 2 of the respondents say a month.
25

Table 4. 7 showing duration of response of receivers' to take action
Receivers to
take action
Instant
Aday
A week
A month
Total
Source: Primary data
Source: Primary data
Frequency
10
20
8
2
40
Percentage
■ Instant
■Aday
□Aweek
□A month
■Sllce5
25
50
20
8
100
Figure 4. 7 A pie chart showing duration of response of receivers to take
action
From the figure above 50% of the respondents say that they take action to
information they receive mostly after a day. That is so because it helps them to
properly analyze the message and at the end they can at least come up with a
profound answer to the sender. The researcher also realized that employee's
action to response to messages depend on his or her position in the
26

organization. Note; those holding higher positions like Chief Administrative
Officer, take their own time to respond to request thus affecting the
performance in the district headquarters.
4.8 Mode of communication
The term mode of communication refers to the channel or means used during
communication. The communication mode that was realized during the
research was verbal and written communication.
4.8~1 Verbal communication
This mode of communication is mostly informal; it involves things like rumors,
manners of dress. It can also be called oral communication.
4.8.2 Written communication
This is the process where by messages sent to the receiver is written down in
form of memos or loose minutes.
4.8.3 Employee response to mode of communication
During the course of the research, two modes of communication were
commonly realized to be used in the district headquarters; oral and written. It
was realized that 25 of the respondents say written communication is
commonly used, 15 of the respondents say verbal communication is commonly
used.
27
I l I
' I I I
I

Table 4.8 showing employee response to mode of communication used
Mode of communicatic
Written
Verbal
Total
Source: Primary data
Source: Primary data
Frequency
25
15
40
Percentage
■Written
■ Verbal
63
37
100
Figure 4.8 A pie chart showing employee response to mode of
communication used
The figure above indicates that written communication is mostly used
representing 62.5% of the respondents. They say, it is vital because it can be
filed and referred to in future while 37.5% indicates verbal communication.
During the course of the research, verbal communication was realized to be
used mostly amongst lower level administration and it includes things like
passing of instructions to subordinates, giving orders and feedback to
supenors.
28

4.9 Dm:aticm of feedback
For communication to be effective and complete there must be a feedback.
order to affect complete communication process and to take further course of
action, feedback must be made a priority. Feedback helps superiors in
analyzing or evaluating performance, make clarification and recommendation.
In the district headquarters, out of the 40 respondents, 15 of them say
feedback is provided instantly; 20 of the respondents say they receive feedback
after a week and 5 of the respondents say a month.
Table 4.9 showing employee response to duration of feedback
Duration of feedbac Frequency Percentage
Instant 15 27.5
A week 20 50
A month 5 12.5
Total 40 100
Source: Primary
29

20
15
■ Instant
10 ■A week
□A month
5
0
Source: Primary data
Figure 4. 9 A bar graph showing employee response to duration of feedback
Borrowing from the above graph and table the researcher realized that 50% of
the respondents receive feedback after a week and say that this helps in quick
preparation. 37.7% say feedback is received instantly and minority (12.5%)
says after a month. Taking into account general analysis of the research,
performance has been realized highly when feedback at least takes a week and
that is so because it helps the receiver to access the message and later at least
feed profound answer thus leading to high performance.
4.10 No of respondents that understands what is communicated to them
Communication is mostly concerned with influencing the behaviors of the
receiver and to cause an understanding in order to take an action. The receiver
must understand what is communicated. When the receiver understands what
is intended by the sender, it can lead to action being taken in accordance to
the task being communicated or action being taken correctly, thus reducing
the rate of mistakes made hence improving performance.
30
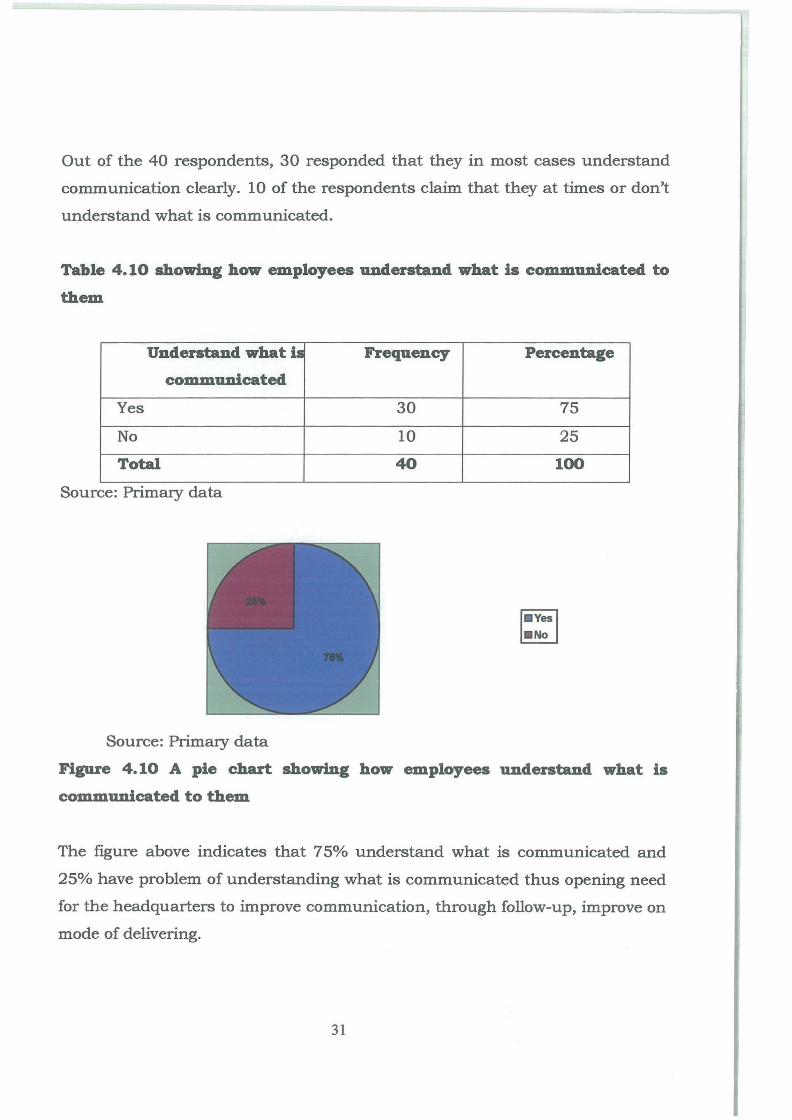
Out of the 40 respondents, 30 responded that they in most cases understand
communication clearly. 10 of the respondents claim that they at times or don't
understand what is communicated.
Table 4.10 showing how employees umterstand what is communicated to
them
Understand what ii
communicated
Yes
No
Total
Source: Primary data
Source: Primary data
Frequency
30
10
40
Percentage
75
25
100
~ ~
Figure 4.10 A pie chart showing how employees understand what is
communicated to them
The figure above indicates that 75% understand what is communicated and
25% have problem of understanding what is communicated thus opening need
for the headquarters to improve communication, through follow-up, improve on
mode of delivering.
31

If the above guidelines are not affected the amount of mistakes made in the
course of duty execution will be high thus in long run will affect performance.
4.11 Response according to respondents' view of communication and
performance
Communication and performance go hand in hand. When communication is
clear, performance will be affected. During the course of conducting this
research the researcher realized that 30 respondents say communication
affects performance. 10 say communication does not affect performance.
Table 4.11 showing respondents view of communication and performance
Respondents' view c: Frequency Percentage
communication anc
performance
Yes 30 75
No 10 25
Total 40 100
Source: Primary data
32

Source: Primary data
Figure 4.11 A pie chart showing respondents' view of communication and
performance
It is therefore clear as indicated in the table and figure that communication is
important if performance is to be effected or in order to achieve organizational
performance.
4.12 Forms of communication
During the course of this research, the researcher realized that majorly two
forms of communication are used; oral communication refers to words that are
spoken or used to the receiver by word of mouth. It takes place sometimes
through telephone.
Written communication; this is a formal type of communication which takes
place in an organization through meetings, in form of lose minutes and letters
in form of handbook.
4.12.1 Employee response to form of communication
The two forms of communication used commonly depend on the level and
content of message communicated. During the course of conducting this
33

research, 5 respondents say telephone; 20 respondents say letters and 15
respondents say meetings.
Table 4.12.1 showing employee's response towards forms of
communications used
Employee response Frequency Percentage
Telephone 5 12.5
Letters 20 50
Meetings 15 37.5
Total 40 100
Source: Primary data
Figure 4.12.1: A bar graph showing employee's response towards forms of
communication used
20
15
10
5
0
Primary data
■ Telephone
■ Letters
□ Meetings
Source:
From the above figure it was realized that over 50% of the employees confirmed
that written communication in form of meetings and letters are most common
34
forms of communication used. Generally, administrative communication
should be conducted using meetings where minutes are taken and letters like
memos and lose minutes which can easily be filed and referred to be used in
case of unrest.
35
CHAPTER FIVE
SUMMARY, CONCLUSIONS AND RECOMMENDATIONS
In this chapter, the findings are summarized; concluded and possible
recommendations about the study are made.
As competitive advantage takes lead, it is important that organization become
aware of the need to communicate so that ideas and concepts can be shared
which in long run raise the skill and knowledge level of employees and equip
them with capacity to meet organizational objectives in terms of raising
demand.
The aim of the study was to examine the relationship between communication
and performance, effects of communication on performance and forms
communication used in Yumbe district headquarters.
The study also revealed that findings from different respondents who
different views about the various aspects of the study. Few recommendations
were made that the researcher urges different organizations to observe so as to
realize drastic improvement.
form of telephone admitting was the most common form of communication
used in Yumbe district headquarters. It also revealed that communication is
in11Jrove on en1rJloyee IJerforma~nce a11d_ rna_kes era.ployees to vi. .... ,._,_,~,.
36

The study also revealed that language problem, noise and domestic problem
that kept the minds of employees away from work hindered communication
process and this leads to mistakes which affect performance.
5.2 CONCLUSION
In conclusion, communication and performance go hand m hand;
communication reinforces performance as it leads to increased commitment,
coordination of activities, improve on organizational image (relationship)
sharing of concepts, ideas among others.
According to research findings from Yumbe district headquarters (2008) not
only a single factor was realized to be responsible for influencing performance
of employees but there are many other factors that hinder performance. Among
them include motivating employees, training of employees, so that they attain
skill, knowledge and competence. Research found out that poor leadership
hinders employee commitment towards organizational goals.
The research findings (2008) on the forms of communication used in Yumbe
district headquarters were not effective because of poor relationship among
staff members and this heavily affected communication progress.
Communication flow was based on technical know-who at the expense of
performance. Employees only interact with staff members with whom they have
good relationship.
The research has shown it with a lot of concern that the positive effects of
communication on performance of employees in Yumbe district headquarters
has led to sharing of ideas and concepts, good relationship, coordination of
activities, increase in commitment. This means that communication is still a
strong tool for any organization to realize both qualitative and qualitative
progress.
37
5.3 RECOMMEimATIONS
In the process of carrying out this research, the researcher came out with the
following recommendations.
The research has shown that performance in Yumbe district headquarters has
been hindered by factors like noise, language problem, poor feedback, poor
relationship, and failure to provide guidelines among others. Therefore in order
to enhance the effectiveness of employees, the management of Yumbe district
headquarters should create free and open environment for communication
possibly open-door philosophy. This philosophy encourages employees to
channel their complaints direct to the management as feedback. This in long
run will gradually improve performance.
The management of Yumbe district headquarters should establish open-door
communication philosophy where employees are free to direct their grievances
in case of misfortune.
Yumbe district headquarters should educate and train all the staff ranging
from the top management level to lower level administrators about the
importance of communication to the organization if performance is to be
achieved.
The management should organize workshops, seminars and provide reading
materials that hold knowledge about communication skills, mode few to
, · =1 · · • ·• ·1 • • • • ' • "" b · ·h li k menc1on .. rn1s 111 lor1g r1-1-11. 11e_ps 111. ser1s1t1z111g tr1e e11.t1:re stw.1 a -out t_ e n
b . . 1 ,.. et-ween commurncatlon ana perrorrnance.
The management should also e:rnphas1ze more on the formal communication
netvvork which include letters, meetings, here minutes can be filed and saved
for future I\~fere11ces a1!.d rna11agernent sl1.ol1lcl crvoid i11for11:1al communication
38

because it encourages rumors and this can easily open fertile ground for
disputes amongst staff members.
5.4 AREA FOR FURTHER STUDY
The future interested researchers who would like to carry a study in this field
are therefore advised to prepare enough resources, the need to move personally
to the offices of these departments and should therefore expand their pie to
include county, sub county, parish local administrators.
39

REFERENCES
A Participants Handbook of Local Government Revised edition ( 1999)
Aswathapa K. Human Resource and Personnel Management 3rd edition, Tata
McGraw Hill, 2003
Edwin B. Flippo (1984), Personnel Management, 6 th Edition McGraw Hill Inc.
Gareth R. Jones, Jennifer George and Charles W. L. Hill (2000), Contemporary
Management, 2nd Edition McGraw Hill Inc.
Gerald Greenberg, Robert Baron, (1997) Behavior in Organization, 6 th edition
Gomez Mejia, Luise R. and David B. Balkin (2002), Management, McGraw Hill
Inc.
Harold Koontz and Heinz Weihrich, (1998), Management, 9 th Edition McGraw
Hill Inc.
Ivancevich Matteson (1996), Organizational Behavior in Management
John Adair, (1929), The Effective Communicator, Biddies Ltd. Guildford and
Kings Lynn
J. S. Chandani (2001), Management, Theory and Practice, Vikas Publishing
House Pvt. Ltd.
Ron Ludlow and Fergus Panton (1999), The Essence of Effective
Communication, Prentice Hall
40
Ronald B. Adler and Jeanne Marguardt Elmhorst (2002), Communicating at
Work, Principles and Practice for Business and the Professions, 7 th edition
McGraw Hill Inc.
Satteiwhite and Olson Sutton (2000), Business Communication at Work,
McGraw Hill Companies Inc.
Scott, W R (1992), Organizations: Rational, Natural and Open Systems, NJ
Prentice Hall, International Inc.
Stoner, James A F, Freeman, R. Edward, (1995) Management 6 th Edition,
Prentice Hall International Inc
Subba Rao Essentials of Human Resource Management and Industrial
Relations.
Richard L. Daft (2000), Management 5 th edition.
Torrington, Derek and Hall, Laura, Personnel Management: HRM m Action:
Prentice Hall International, (1987), UK
Van Fleet, D. and Peterson, T. (1994) Contemporary Management, 3 rd Edition;
Houghton Mifllin Company, Boston
Walker W. James, (1980) Human Resource Planning, McGraw Hill Book
Company, New York
V.S. P. Rao and P.S Narayana (2000), Principles and Practice of Management, 8th
Edition Konark Publishers Pvt. Ltd
41

QUESTIONNAIRES
Dear respondent, I am Omacar Samuel; a student of Kampala International University pursuing a
master's degree of arts in Development Administration and Management
I am carrying a study on the coping mechanisms to challenges of poverty among the poor in
Ngora County. I therefore kindly request for your cooperation and sincere assistance by filling
this questionnaire so as to enable me complete the study successfully.
N.B:
❖ The exercise is purely for academic purposes. Therefore, any information given shall be
treated with due confidence.
❖ The researcher will maintain anonymity in quoting specific statements unless permitted
otherwise by the person( s) concerned.
BIO DATA
Age (years):
20-35 □ 36-49 □ 50-65 D Above65 □ Marital status:
Married □ Single D Widowed D Divorced □ Employment status:
Employed D Unemployed Qelf- employed D Retired □
42

OTHER QUESTIONS
1. How do you find the communication system used in the district
headquarters?
a) b) c)
d)
2.
None
Clear
Not clear D D D
Others (specify) ............ .................................................. .
After how long does the communication require the receiver to act after
receiving the message?
a) b)
c)
d)
e)
Instant
Aday
A week
A month
None
D D D D
f) Others (specify) ... ............................................................... .
3. How is communication delivered in the district headquarters?
a) Verbal D b) Written D c) Others (specify) .................................................................. .
43
I I I:
l I I
I t
I

4.
a) b) c)
d)
5.
a) b)
c)
1.
a)
b) c)
2.
How long does the feedback take?
Instant
A week
A month
D D D
Others ( specify) ................................................................... .
Does the respondent always understand what is communicated?
Yes
No D D
Others (Specify) .......................................................... ..
Does Communication affect performance?
Yes
No D D
Others (Specify) ........................................................... .
What form of communication 1s commonly used in the district
headquarters?
a) b)
c)
d)
3.
Telephone
Letters
Meetings D D
Others ( specify) ................................................................. .
Indicate the most common form of communication used m the
following departments?
a) b) c) d)
Education .................................................................................. .
Health ............................................................................. .
Finance .......................................................................... .
Administration ................................................................ .
44
4. What are some of the obstacles to communication in the district
headquarters?
5. What are some of the solutions to the problem in question (9) above?
THANKS
45


![IMP - MML IMP - MML IMP - MML IMP - MMLIMP - MML IMP - …imp.gob.pe/images/Planos de Zonif Abril 2019/2_San Juan de Lurigancho.pdf · zte-2 cv [2] cv av. leocio prado av. ferrocarril](https://img.pdfslide.us/doc/110x75/5e1a193af2030578f7455c4b/imp-mml-imp-mml-imp-mml-imp-mmlimp-mml-imp-impgobpeimagesplanos.jpg)